
Fuzzy Logic Decision Support System to Predict Peaches Marketable Period at Highest Quality


1
Department of Electromechanical Engineering, University of Beira Interior, Rua Marquês de D’Ávila e Bolama, 6201-001 Covilhã, Portugal
2
C-MAST—Center for Mechanical and Aerospace Science and Technologies, Rua Marquês de D’Ávila e Bolama, 6201-001 Covilhã, Portugal
*
Author to whom correspondence should be addressed.
Climate 2022, 10(3), 29; https://0-doi-org.brum.beds.ac.uk/10.3390/cli10030029
Submission received: 3 February 2022
/
Revised: 14 February 2022
/
Accepted: 17 February 2022
/
Published: 22 February 2022
(This article belongs to the Special Issue Novel Advances in Refrigeration Systems and Packaging Solutions: Impact in Climate Change and Food Products)
Abstract
:Food waste occurs from harvesting to consumption. Applying procedures and technologies, changing attitudes, and promoting awareness have positive social, economic, and environmental impacts that can contribute to reducing food waste. The paper presents a decision support system (DSS) to predict the quality evolution of fruits and vegetables, particularly of peaches, and estimate its commercialization period at the highest overall perceived quality by consumers, thus contributing to reducing food waste. The Fuzzy Logic DSS predicts the evolution of the physical-chemical parameters of peaches (hardness, soluble solids content, and acidity) depending on the cultivar (Royal Summer and Royal Time), storage time, and temperature. As the range of the values of these physical-chemical parameters of peaches that consumers perceive to be at their highest quality are known, the DSS predicts the marketable period in days. Case studies were developed to analyze the influence of each physical-chemical parameter on the commercialization days (number and time to start). It is concluded that temperature is the most important parameter for fruit conservation. A low value of conservation temperature allows for the significant extension of the time that peaches can be sold at the highest quality. Hardness is used to determine the harvest date since it is an index of fruit ripeness. The same conclusion is obtained for the influence of the soluble solids content. The influence of acidity on marketable days is less than the other physical-chemical parameters. This DSS helps retailers to sell their peaches at the highest quality with benefits for all parties. It also helps in the decision-making concerning the actions to take when fruits are reaching the end of their highest quality by predicting the range of the commercialization days. This formulation can be extended to other fruits and vegetables and in the last instance contribute to the reduction of food loss and waste, consequently promoting social, economic, and environmental aspects of our daily life.
1. Introduction
The concept of food loss or waste consists of food that is still in perfect condition for human consumption, within the expiration date, but which is not directed to commercialization or consumed in households, and thus considered as an unusable surplus. This loss/waste occurs at all stages of the food life cycle, from harvesting to consumption. Fruit and vegetable foods are the products that most require energy and natural resources due to refrigeration requirements to extend their shelf life. Thus, this practice not only has ethical consequences, but also economic and environmental ones [1,2].
World hunger is increasing, but still, according to the FAO (Food and Agriculture Organization of the United Nations), it is estimated that about one-third of all food produced globally is wasted, reaching 1.3 billion tonnes per year. For many people globally, food is taken for granted. On the other hand, more than 820 million people are hungry [3,4]. In 2017, 3.9 million deaths worldwide were attributed to not eating enough fruit and vegetables. In a world where 690 million people go to bed hungry every night and three billion cannot afford a healthy diet, wasting food based on aesthetics is unacceptable [5].
Worldwide production of both fruits and vegetables rose by about half between 2000 and 2018. Consequently, the commercialization of fresh fruits and vegetables has been increasing. In 2018, the world produced a total of 868 million tonnes of fruits and 1089 million tonnes of vegetables [5]. The numbers pointed to 89 million tonnes of wasted food per year solely in Europe. An important fact is that 35% of the total food waste occurring at consumption levels occurs in developed countries. This waste is not caused by the lack of innovative solutions in terms of technology. The problem lies in the intentional behavior of individuals [6,7].
The preservation and storage of food before consumption is a very important factor. Mainly it is accomplished by refrigeration and freezing. The main problems are related to the high storage temperature and the inadequate display of these products [8]. After harvesting, fruit and vegetable products are susceptible to degradation, with consequences in terms of food safety and quality. The objective is to minimize the rate of quality depreciation and, in turn, increase quality and safety. Food quality describes the attributes of food that influence its value and that make it acceptable or desirable for the consumer. This quality depends on agricultural practices, as well as product handling, facilities, and commercial circuits [8,9,10]. Food safety is the assurance that food will not cause harm to the consumer when it is prepared and/or eaten according to its intended use. Unlike food quality, food safety is non-negotiable [5]. Thus, food quality and safety are a concern not only for consumers but also for authorities. Producers must know the food legislation applicable to the conservation and distribution of food.
Consumers evaluate food through various factors: appearance, freshness, color or defects, flavor, aroma, and texture. There may be quality factors that are relatively more important for one group of consumers than for another, depending, for example, on origin, age, and eating habits. However, every consumer hopes to find fruits and vegetable products that satisfy he/she demands [8]. When the consumer purchases a foodstuff, he/she must be aware that is part of the chain and, as such, must be conscious to comply with certain procedures that guarantee the consumption of a safe product. Thus, the product must be stored properly (adequate temperature) and the consumer must respect the expiration dates [8].
Technology and innovation are required at all stages in the fruit and vegetable supply chain, from production to consumption, to improve both quality and output [5]. These are considered essential for maintaining the health and well-being of the population, as well as for the prevention and treatment of some chronic non-communicable diseases. Furthermore, it helps to prevent all forms of malnutrition [11].
Together with malnutrition, unhealthy diets are among the top-ten risk factors for disease globally [5]. In addition, programs that promote healthy eating have been created and embedded in schools in order to provide healthy meals and information [12]. The World Health Organization (WHO) recommends consuming at least 400 g of fruits and vegetables each day to reap their health and nutrition benefits. The optimum amount depends on various factors, including age, sex, and level of physical activity. Distribution and access problems mean that many people cannot get the types or amounts of food they need [5]. The implementation of these programs and the creation of a favorable environment for the promotion of healthy eating practices and lifestyles are important strategies to combat diseases [12]. According to the report of the national program for the promotion of healthy eating in 2017, children and adolescents are the age groups of the population that eat the least number of fruits and vegetables. However, in the 2020 report, an increase in the consumption of fruits and vegetables was noted. During the pandemic in 2020, a survey carried out reports that almost half of the population surveyed (45.1%) has changed their eating habits during this period. Taking these results into account, around 41.7% of the population aged 15 and over reported consuming fruits and vegetables daily [9,10,13,14].
The 74th Session of the United Nations (UN) General Assembly tried to address all of the aforementioned difficulties. Therefore, it declared 2021 as the International Year of Fruits and Vegetables (IYFV) [5]. The initiative aimed at raising awareness of the nutritional and health benefits of fruit and vegetable consumption. The existing links between agriculture and the food system are complex, and the contribution of fruits and vegetables to food security, generation of income, and employment of smallholders and family farmers must be highlighted. This International Year aimed to be a starting point for the development of actions that promote sustainable farming and production. These actions were expected to promote the reduction of hunger and poverty, enhance food and nutrition security, improve livelihoods, and contribute to better management of natural resources. In this sense, the IYFV also aimed to foster awareness of the high levels of food loss and waste in the supply and value chains. In this regard, it was directly linked to the 2030 Agenda, and the Sustainable Development Goals SDG2 (ending hunger, improving nutrition, and promoting sustainable agriculture), SDG3 (ensuring healthy lives and promoting well-being), and SDG12 (ensuring sustainable consumption and production patterns). Of all important concepts around this thematic year, the most relevant and that are related to the decision support system developed in this study were: (1) fostering economic, social, and environmental sustainability enhanced by the availability, safety, affordability, and equitable access to fruits and vegetables along with storage, transport, trade, processing, transformation, retail, waste reduction and recycling accomplished through sustainable, resilient and inclusive local, regional and global product chains, also composed by smallholders including family farmers; (2) the maintenance of product quality and safety minimizing loss and waste through appropriate treatment and handling across the entire supply chain; and most in line with the present study, (3) innovative and improved technologies to increase the efficiency, productivity and commercialization within fruits and vegetables supply chains and simultaneously reduce loss and waste.
On the other hand, the world population is growing, and it is estimated that it will reach about 9.3 billion people by 2050, triggering in the European Union the importance of sustainable development given the changes that the food systems face. If the current trend continues, the world will need to increase food production by 70% by 2050. However, growing this amount of food will put significant pressure on the planet [7]. Other issues include increasing urbanization, higher rates of non-communicable disease, decreasing arable land and water resources for agriculture, the effects of climate change, and possible food shortages [5].
The FAO’s and UN’s goals are to achieve food security for all and to ensure that the entire world population has access to high-quality food in sufficient quantities to enable them to live a healthy life.
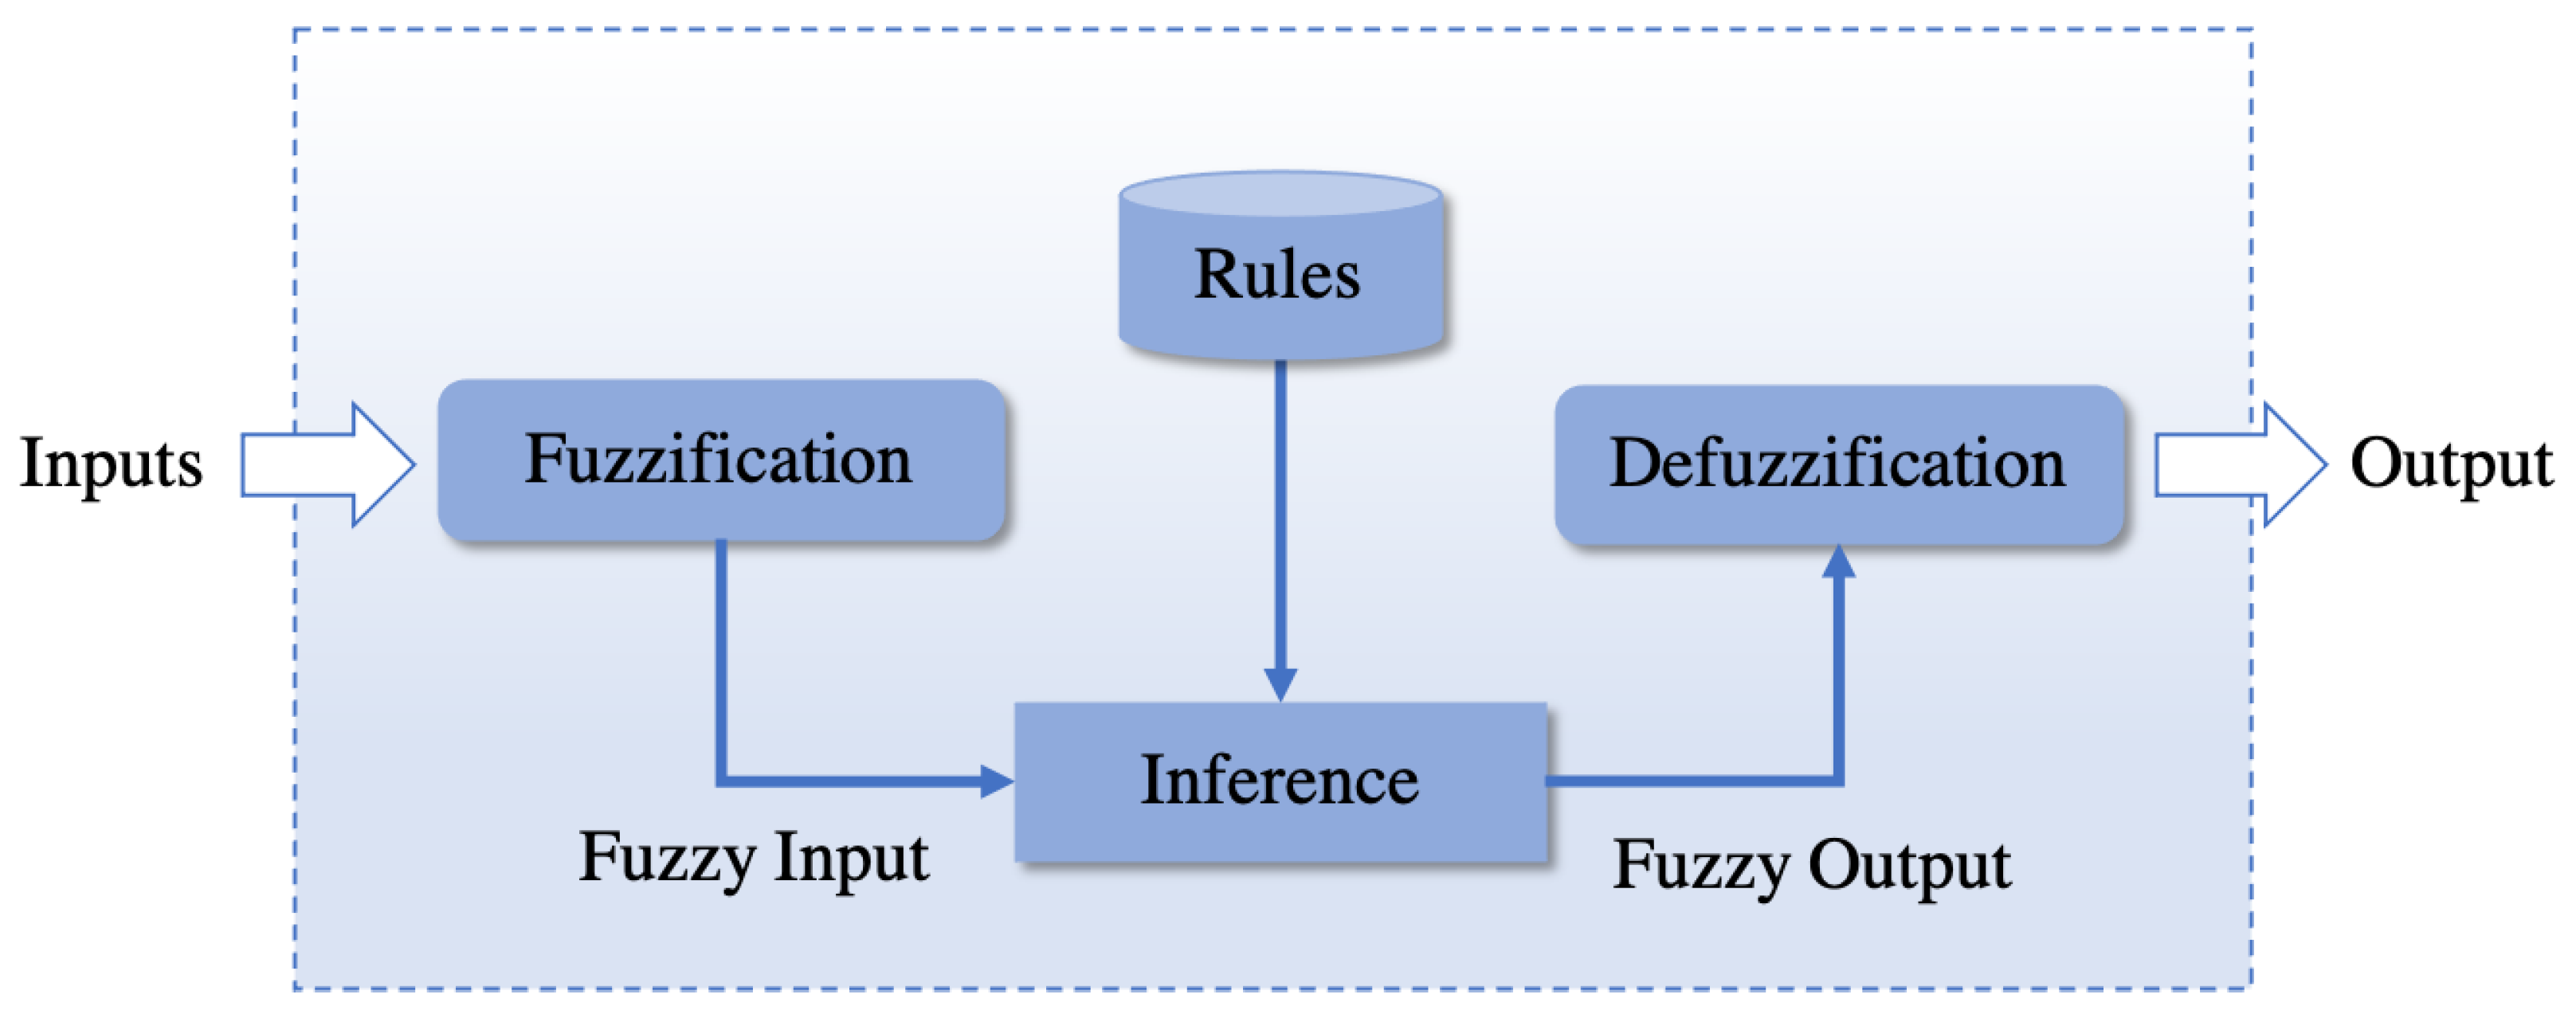
This study considers a decision support system (DSS) that aims to contribute to the abovementioned general objectives, aiming to predict the evolution of the physical-chemical parameters (hardness, soluble solids content, and acidity), particularly of peaches, that are directly related to their quality evolution, and estimating its commercialization period at the highest overall quality perceived by consumers, thus avoiding waste [7]. This formulation can be extended to other fruits and vegetables. As the quality perceived by consumers is a relative parameter, a DSS based on artificial intelligence (AI) through a Fuzzy Logic model is proposed. The fuzzy logic system (FLS) was first described in 1965 by Zadeh [15] and has been used in counting applications for its numerous advantages. In addition to being a powerful intelligent technique that is easy to implement and has low computational cost, a FLS can provide a very efficient taking mechanism based on imprecise input data, as it has a performance equivalent to how a human being makes decisions, except that it does so more quickly. A schematic view of a simple FLS is shown in Figure 1. All the processes involved are described in detail in [16,17,18].
Technologies for Monitoring the Safety of Food Products
To overcome the above-described difficulties related to food loss and waste as well as food quality and safety, several studies have been carried out to predict the evolution of some parameters which are mainly influenced by duration (time), temperature, and the relative humidity of the conservation environment. Some examples have used artificial intelligence techniques to study and classify fruit varieties using image analysis and deep learning techniques. Ananias et al. [19] describe an AI DSS designed to predict the evolution of the quality of peaches, namely the storage time required before commercialization as well as the late commercialization time. An Artificial Neuronal Network (ANN) is designed to accomplish this prediction based on experimental data. The experimental study determined the influence of conservation environment conditions (air temperature and relative humidity) on the quality of peaches of the cultivar Royal Time through the evolution of physical-chemical parameters such as hardness, soluble solids content, and acidity. The experimental tests considered three refrigeration conditions. The ANN showed excellent results, both in training and in data validation [19]. The current study is an improvement of that research, dealing with the subjectivity of a parameter such as quality that depends on individual perception like flavor, odor, and texture, among others.
Pina et al. [20] developed a DSS to help with food waste reduction for traditional food retailers while selling fresh horticultural products, but also to promote food safety and quality. The computational tool predicts the remaining shelf life of fresh horticultural products by determining when the doses of bacteria that affect these products reach the infectious threshold. The time to reach the infectious dose threshold is used to dynamically calculate the daily price. That DSS allows predicting the remaining shelf life of fresh horticultural products, namely lettuce, onion, carrot, and cabbage, based on its microbial growth status, governed by extrinsic (temperature and water activity) and intrinsic parameters (pH). The online predictive food microbiology tool Combined Database for Predictive Microbiology (Combase) was used to predict the time to reach the infectious doses of bacteria considered in that study. Additionally, the DSS encompasses the dynamic price of the products that should be set each day, depending on the predicted end of the marketing period. The shelf life determined by the DSS for optimal storage conditions is, in general, conservative, ensuring food safety [20]. Thus, the DSS contributes to sustainable development by promoting information to retailers and encouraging sustainable consumption based on perishable horticultural safety and quality across time and fair pricing depending on that quality. The effects of vegetables’ regular distribution chain on bacterial growth should be quantified more effectively than by simply disregarding the lag phase, since this parameter may affect, both positively and negatively, the estimated remaining shelf life of a food product [20].
Matos et al. [21] introduce a DSS to assign price rebates for fresh horticultural products based on quality decay. The study was divided into two phases. In the first phase, primary data acquisition was carried out by supplying questionnaires to the target audience. The second phase consisted in performing mathematical modeling aiming at profit maximization by minimizing waste. The study evaluates the behavior of the retailers and distributors (supermarkets, mini-markets, and groceries) and consumers considering the binomial quality and price, as well as the time since the harvest (quantitative) and visual aspect (qualitative). From the analysis of results, a stock and sales management model for each group of perishable products was evaluated, which through a pricing strategy allows increasing the demand for products that are near the end of validity. This model aims to maximize profit by minimizing food waste. However, despite good results with modeling, the restrictions must be respected to ensure a good performance. These include non-instant perishability, the infinite replacement rate, zero lead-time, scarce stock allowed, product deterioration at a constant rate, unconsidered purchases between orders, as well as the infinite time horizon [21].
Gaspar et al. [22] describe a simplified approach to predict food safety through the maximum specific bacterial growth rate as a function of extrinsic and intrinsic parameters, using the Baranyi and Roberts model.
Additionally, the current world’s digitalization brings several benefits to food supply chains and consumers. New technologies based on biochemical sensors and low-cost information and communication technologies (ICT), mostly focusing on the Internet of Things (IoT), can be applied to solve old paradigms and mitigate inefficiencies [22]. These technologies have been integrated into packaging, developing the concept of intelligent or smart packaging [4]. This package can provide additional real-time data besides the current regular information available such as origin, validity date, organization, and nutritional composition, among others. It may inform and/or advise producers, retailers, or consumers about the product traceability considering routes, extrinsic parameters e.g., temperature, relative humidity, and atmosphere and intrinsic parameters, e.g., water activity, hydrogen potential (pH), oxidation-reduction potential, chemical composition, and biological structure of the food as well as its anti-microbial substances and microbial development [22].
In this sense, the development and implementation of predictive mathematical modeling tools is an effective way to predict changes in food quality and enable decision-making regarding shelf life. Fernandez et al. [23] present the status and future trends review of innovative and sustainable technological solutions for the agro-industrial sector in terms of the circular economy, ecological packaging, active and/or smart packaging and associated logistics, and industry digitalization (cybersecurity and products information and communication). The emergence of sensors and low-cost information technologies, as well as business analysis tools, have changed most agro-food supply chains and the agro-industrial sector. Logistics also can benefit from digitalization, Industry 4.0, IoT, and smart and/or active packaging. This would allow the traceability of the product, location services, shelf-life conservation, inventory management, market intelligence, dynamic logistics, monitoring and control, improvement in the cold chain, as well as better planning and coordination among the different stages of the supply chain [24]. Gaspar et al. [25] address food safety issues, namely factors related to microbial growth responsible for food deterioration. There are multiple technologies for monitoring food safety at different chain stages, and among them are time-temperature integrators (TTI). Temperature is a major factor affecting food quality and safety during its life cycle. This parameter can be monitored using TTI devices on food packages, allowing users to know the thermal exposure. Morais et al. [26] proposed a monitoring system to record the conservation conditions inside refrigeration plants and vehicles, transmitting them via the IoT in real-time. During food transport, products are often subject to conditions that do not benefit the conservation of their biological properties. This condition can lead to food quality and safety issues and ultimately to food waste [26]. The device developed allows optimization to be applied to the transport routes and offsets of the vehicle’s refrigeration equipment [26]. Likewise, Varandas et al. [27] present the design and construction of a low-cost IoT sensor mesh that enables the remote measurement of parameters of large-scale orchards.
Some DSS systems for predicting the safety and quality of food products, as well as the parameters acquisition and measurement and transmitting the values using new ICT technologies were described. This study aims to contribute to this sense by proposing a DSS based in AI through a Fuzzy Logic model developed to predict the commercialization days of peaches at their highest quality perceived by consumers. The DSS requires as input some physical-chemical parameters: hardness, soluble solids content, and acidity, which variation is dependent on the conservation temperature. As quality is a subjective concept, Fuzzy Logic is a suitable technique to provide a decision-making tool for the marketable days of peaches.
2. Materials and Methods
2.1. Physical-Chemical Parameters of Peaches
Peaches, being climacteric fruits, deteriorate quickly at ambient temperature and have a short storage period that causes substantial losses in quality during the maturation period, including strong loss of firmness to extend their commercial life [28,29]. The time and success of the conservation process depend on biological factors such as fruit respiration, transpiration, and the action of ethylene. To increase the storage period and maintain the quality of the fruits, these biological factors should be reduced, which is usually achieved by low temperatures, increased concentration, decreased concentration of , and use of ethylene inhibitors [28].
The peach tree’s biological cycle is divided into vegetative growth, corresponding to the development of meristematic structures, and fruiting, which consists of fruit formation. At the end of this cycle, fruit maturation depends on the cultivar and involves some physiological changes that determine fruit quality [28,29]. Fruit quality results from a combination of sensory parameters such as appearance, texture, aroma, flavor, nutritional value, and food safety. The parameters commonly used to characterize fruit quality are color, size, hardness, soluble solids content (SSC), and acidity [28]. The analysis of these parameters requires laboratory tests.
Temperature is a relevant factor in the process of preserving peaches to extend their shelf life and preserve their organoleptic characteristics. It must be taken into account that peach deteriorates and ripens quickly at room temperature, being the ideal storage temperature between 0 °C and 2.2 °C with humidity between 85% and 95% [29]. Acidity is one of the parameters that characterize the quality of the fruit as a high acidity content supersedes the sugar content in the fruit. It is a great influence on the quality of the fruit for the consumer. Acidity is given in meq malic acid/Ljuice or gmalic acid/Ljuice. Henceforth the unit of Ac will only be indicated by g/L for reading easiness. In the case of peaches, the classification of this parameter is distinguished in cultivars of high acidity for values ranging from 7 to 9 g/L, and in low acidity cultivars for values ranging from 3 to 5 g/L [28].
The marketing of peaches starts in June and ends in September, and this offer is based on a wide range of cultivars that, in addition to the maturation date, present fruits with different characteristics [29].
In Portugal, the Beira Interior region is the main peach productive region in the country. In addition to favorable climatic conditions, the region has a tradition of growing fruit species, thus having a good technical knowledge [28].
The development of the Fuzzy Logic DSS first requires data related to the evolution of physical-chemical parameters of peach cultivars depending on initial values and storage temperature. The experimental study described in Veloso et al. [30] determined the influence of conservation environment conditions (air temperature and relative humidity) in the quality of peaches of the Royal Summer (RS) and Royal Time (RT) cultivars, which have similar harvest dates but very different acidity. That experimental study evaluated the physical-chemical parameters such as hardness (H), soluble solids content (SSC), and acidity (Ac). The experimental tests were developed in three refrigeration conditions using farmer’s cold chambers (farmer C, farmer G, farmer L). The experimental procedure implemented by Veloso et al. [30] is as follows:
- (1)
- Fruits harvested during the morning were selected based on size and color to obtain a homogeneous sample. Each fruit was marked individually, and weight and color were evaluated. Six sampling times (t0, t7, t14. t21, t28, t35, and t42) were performed during the 35 days of the study.
- (2)
- Fruits were placed in 15 boxes with alveoli for 24 fruits. Each box corresponds to a sampling time.
- (3)
- Fruits were transported to farmers’ cold chambers with a data logger inside the lowest box to monitor air temperature and humidity.
- (4)
- One sample with 24 fruits was removed from each farmer’s cold chamber weekly. Half of the fruits were analyzed on that day and the remainder was analyzed after two days in a domestic environment (without refrigeration). Thus, the number of repetitions was 12 by time sample [30].
- (5)
- Fruits were analyzed for (a) weight; (b) color in two points/fruit; (c) hardness; (d) Soluble solids content; (e) titratable acidity. A linear interpolation was used to determine the daily values between the weekly measured ones.
That study allowed identifying the influence of conservation environment on each physical-chemical parameter. Thus, the Fuzzy Logic system to predict the best days to market peaches uses as an input the physical-chemical parameters of the peaches determined at the beginning of the harvest (H, SCC, and Ac) and their evolution for different conservation conditions (refrigeration temperature) over 35 days. The output variable was defined as the degree of commercialization, depending on the optimum quality perceived by consumers reflected in terms of H, SSC, and Ac value ranges.
2.2. Fuzzy Logic System
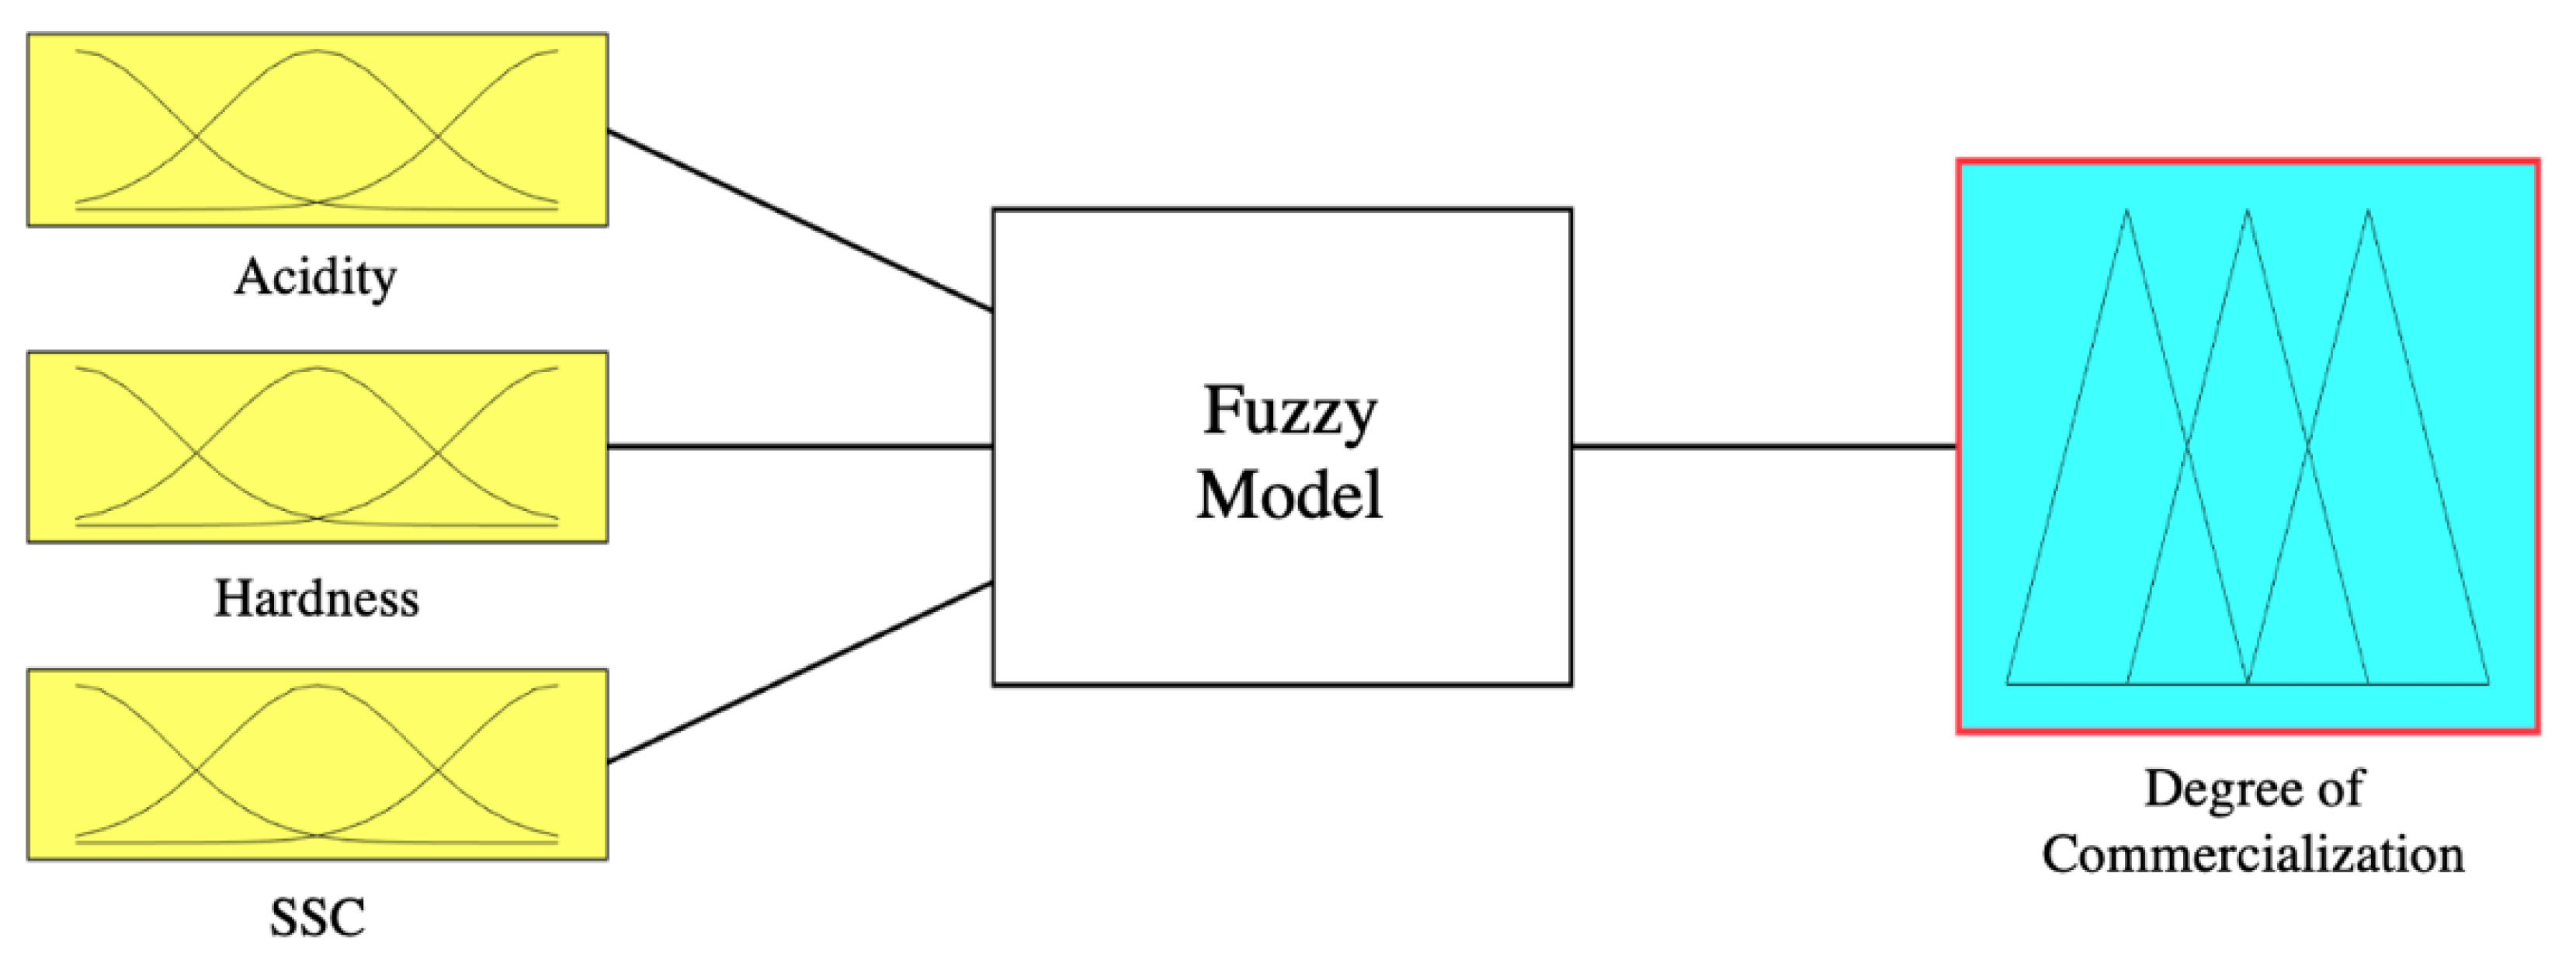
The fuzzy logic system (FLS) uses the physical-chemical parameters of peaches to estimate the marketing period and their evolution. The fuzzy model implemented in this article has three input variables: acidity, hardness, and SSC. The output variable was defined as the degree of commercialization of the fruit.
The schematic representations of the proposed fuzzy models are shown in Figure 2. All of the processes involved are described in detail.
When highly qualified for consumption, RS peaches have an Ac ≤ 4 g/L, while RT peaches, with higher acidity, have an Ac ≤ 8 g/L [30]. A FLS was created for each cultivar with a difference only in this input variable. The other variables follow the same model.
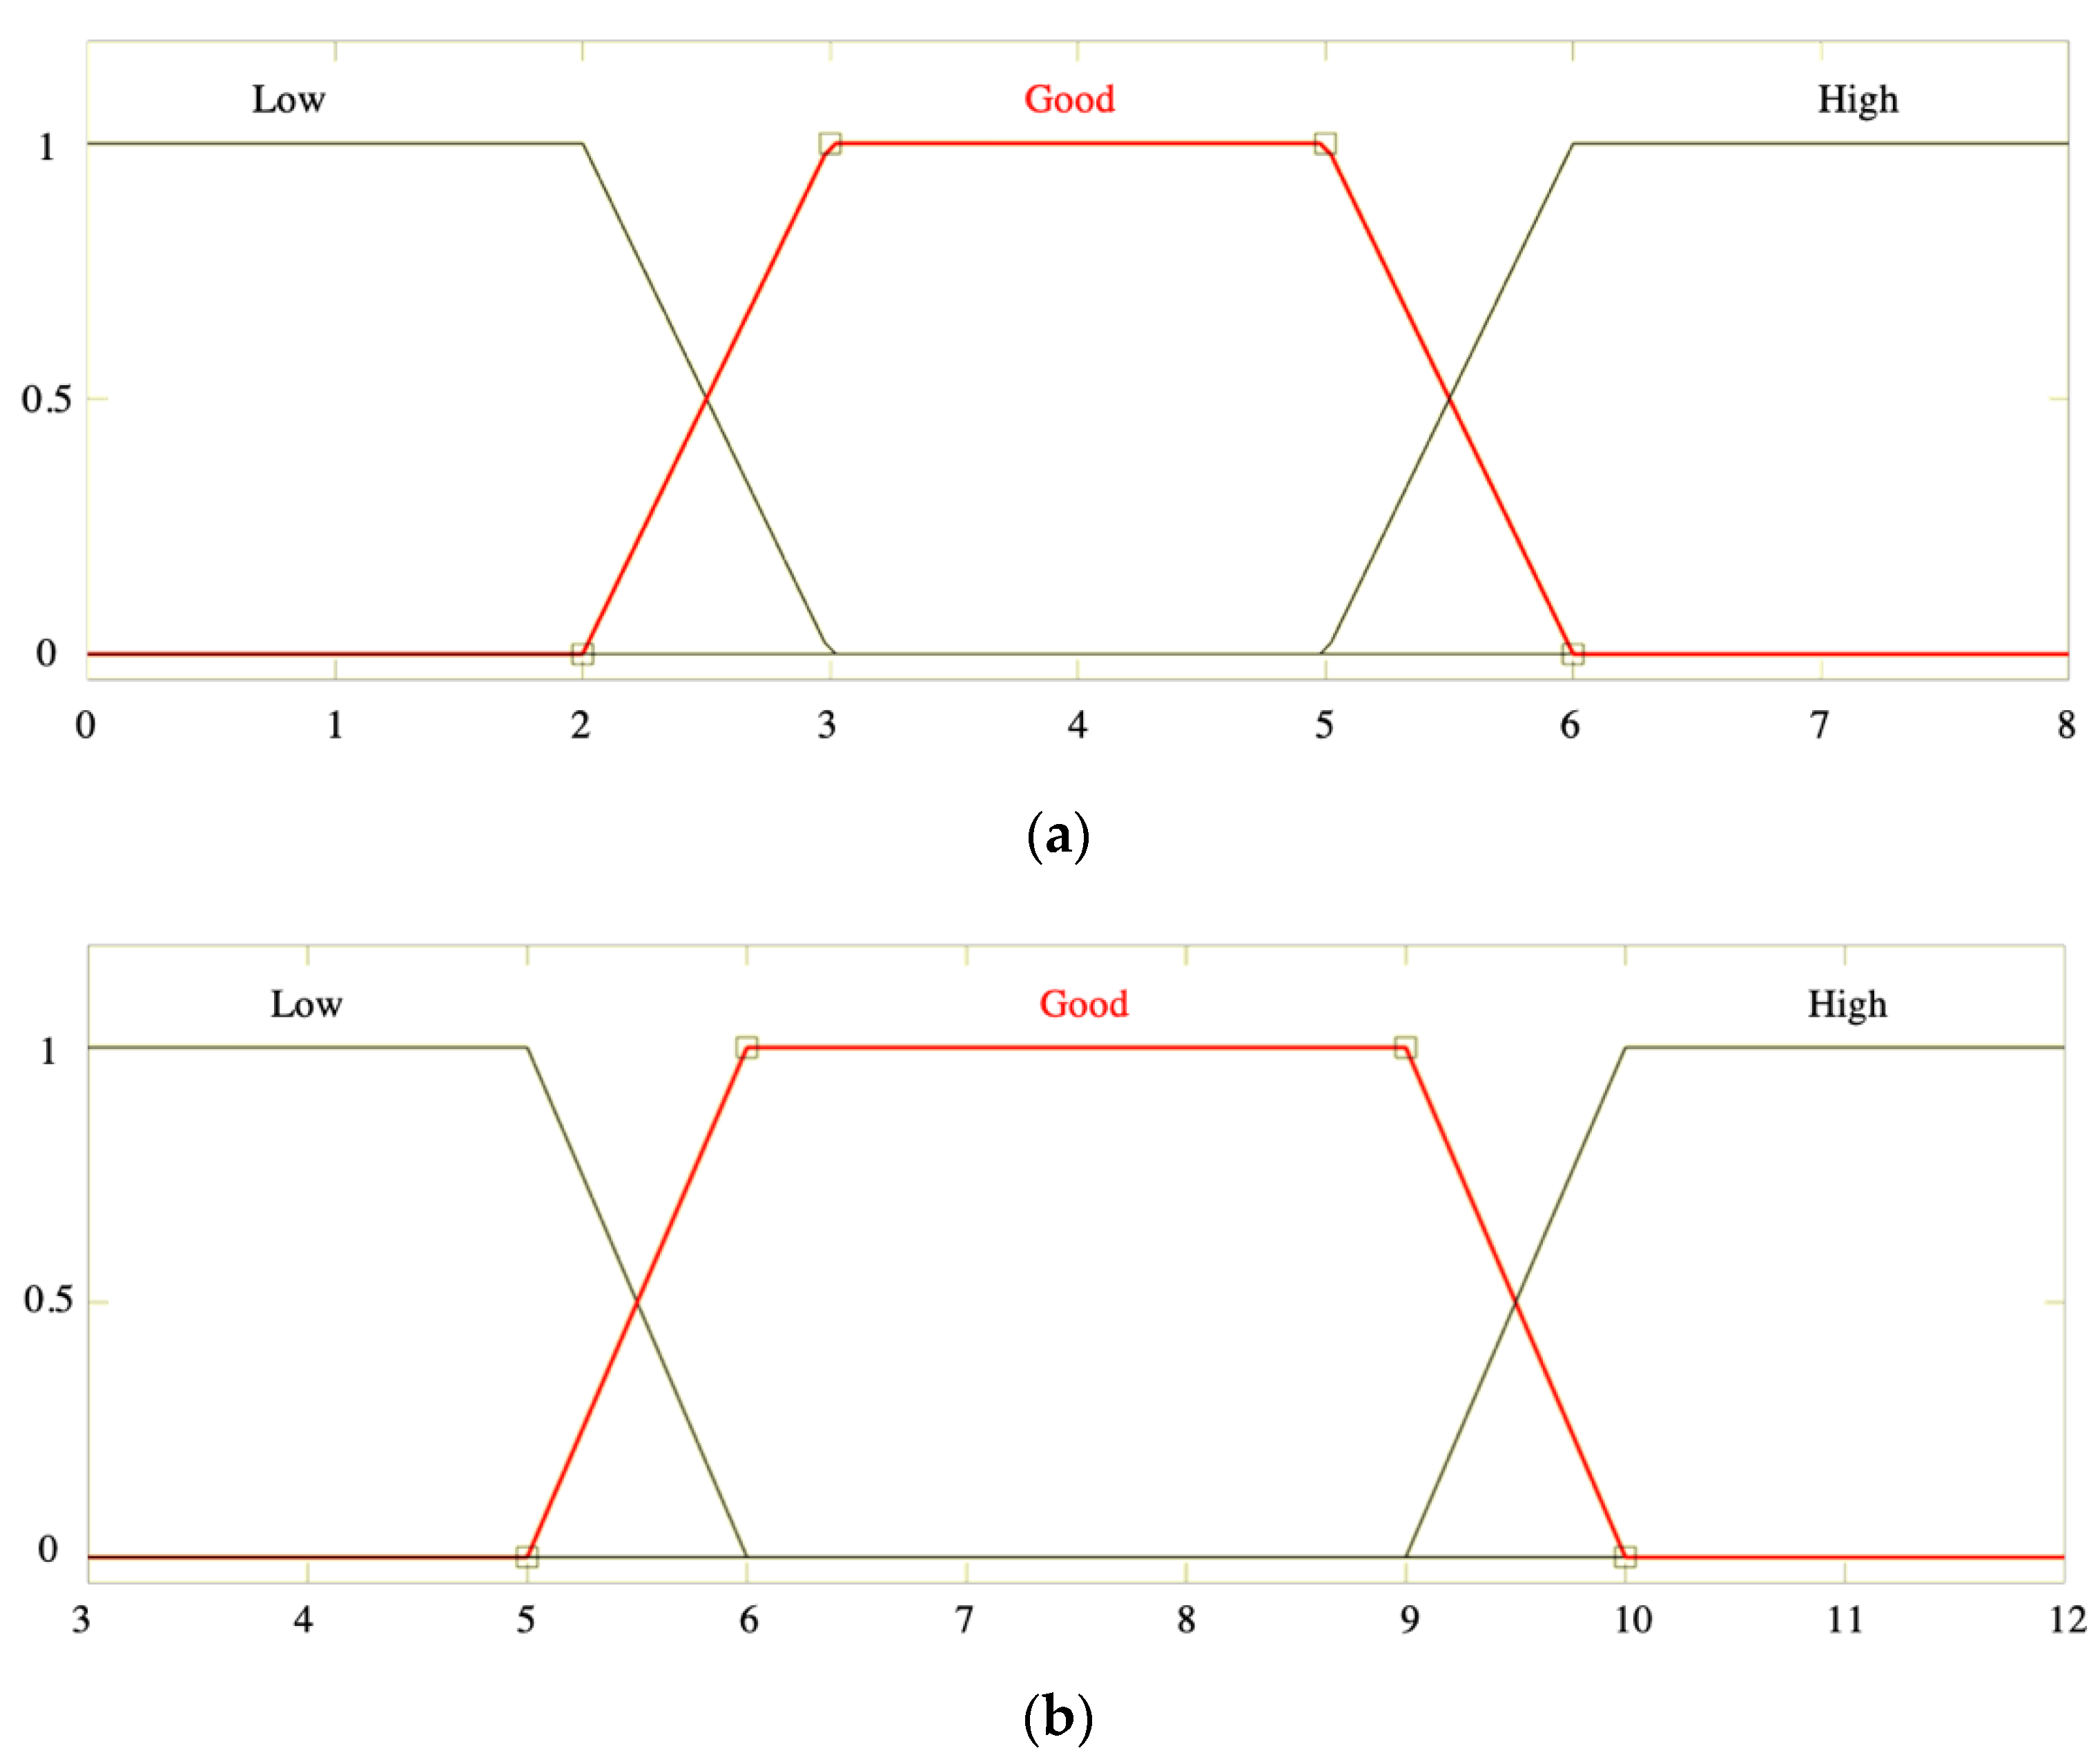
The membership function chosen for the inputs and output was trapezoidal, as it better suited the characteristics of the variables. For the input, acidity, Ac, of RS was defined in the interval between 0 g/L ≤ Ac ≤ 8 g/L, where the interval of 3 g/L ≤ Ac ≤ 5 g/L was set for a good value for acidity, as shown in Figure 3a. For the RT cultivar, the modeling considers an interval of 3 g/L ≤ Ac ≤ 12 g/L. A good acidity was set between 6 g/L ≤ Ac ≤ 9 g/L, as shown in Figure 3b.
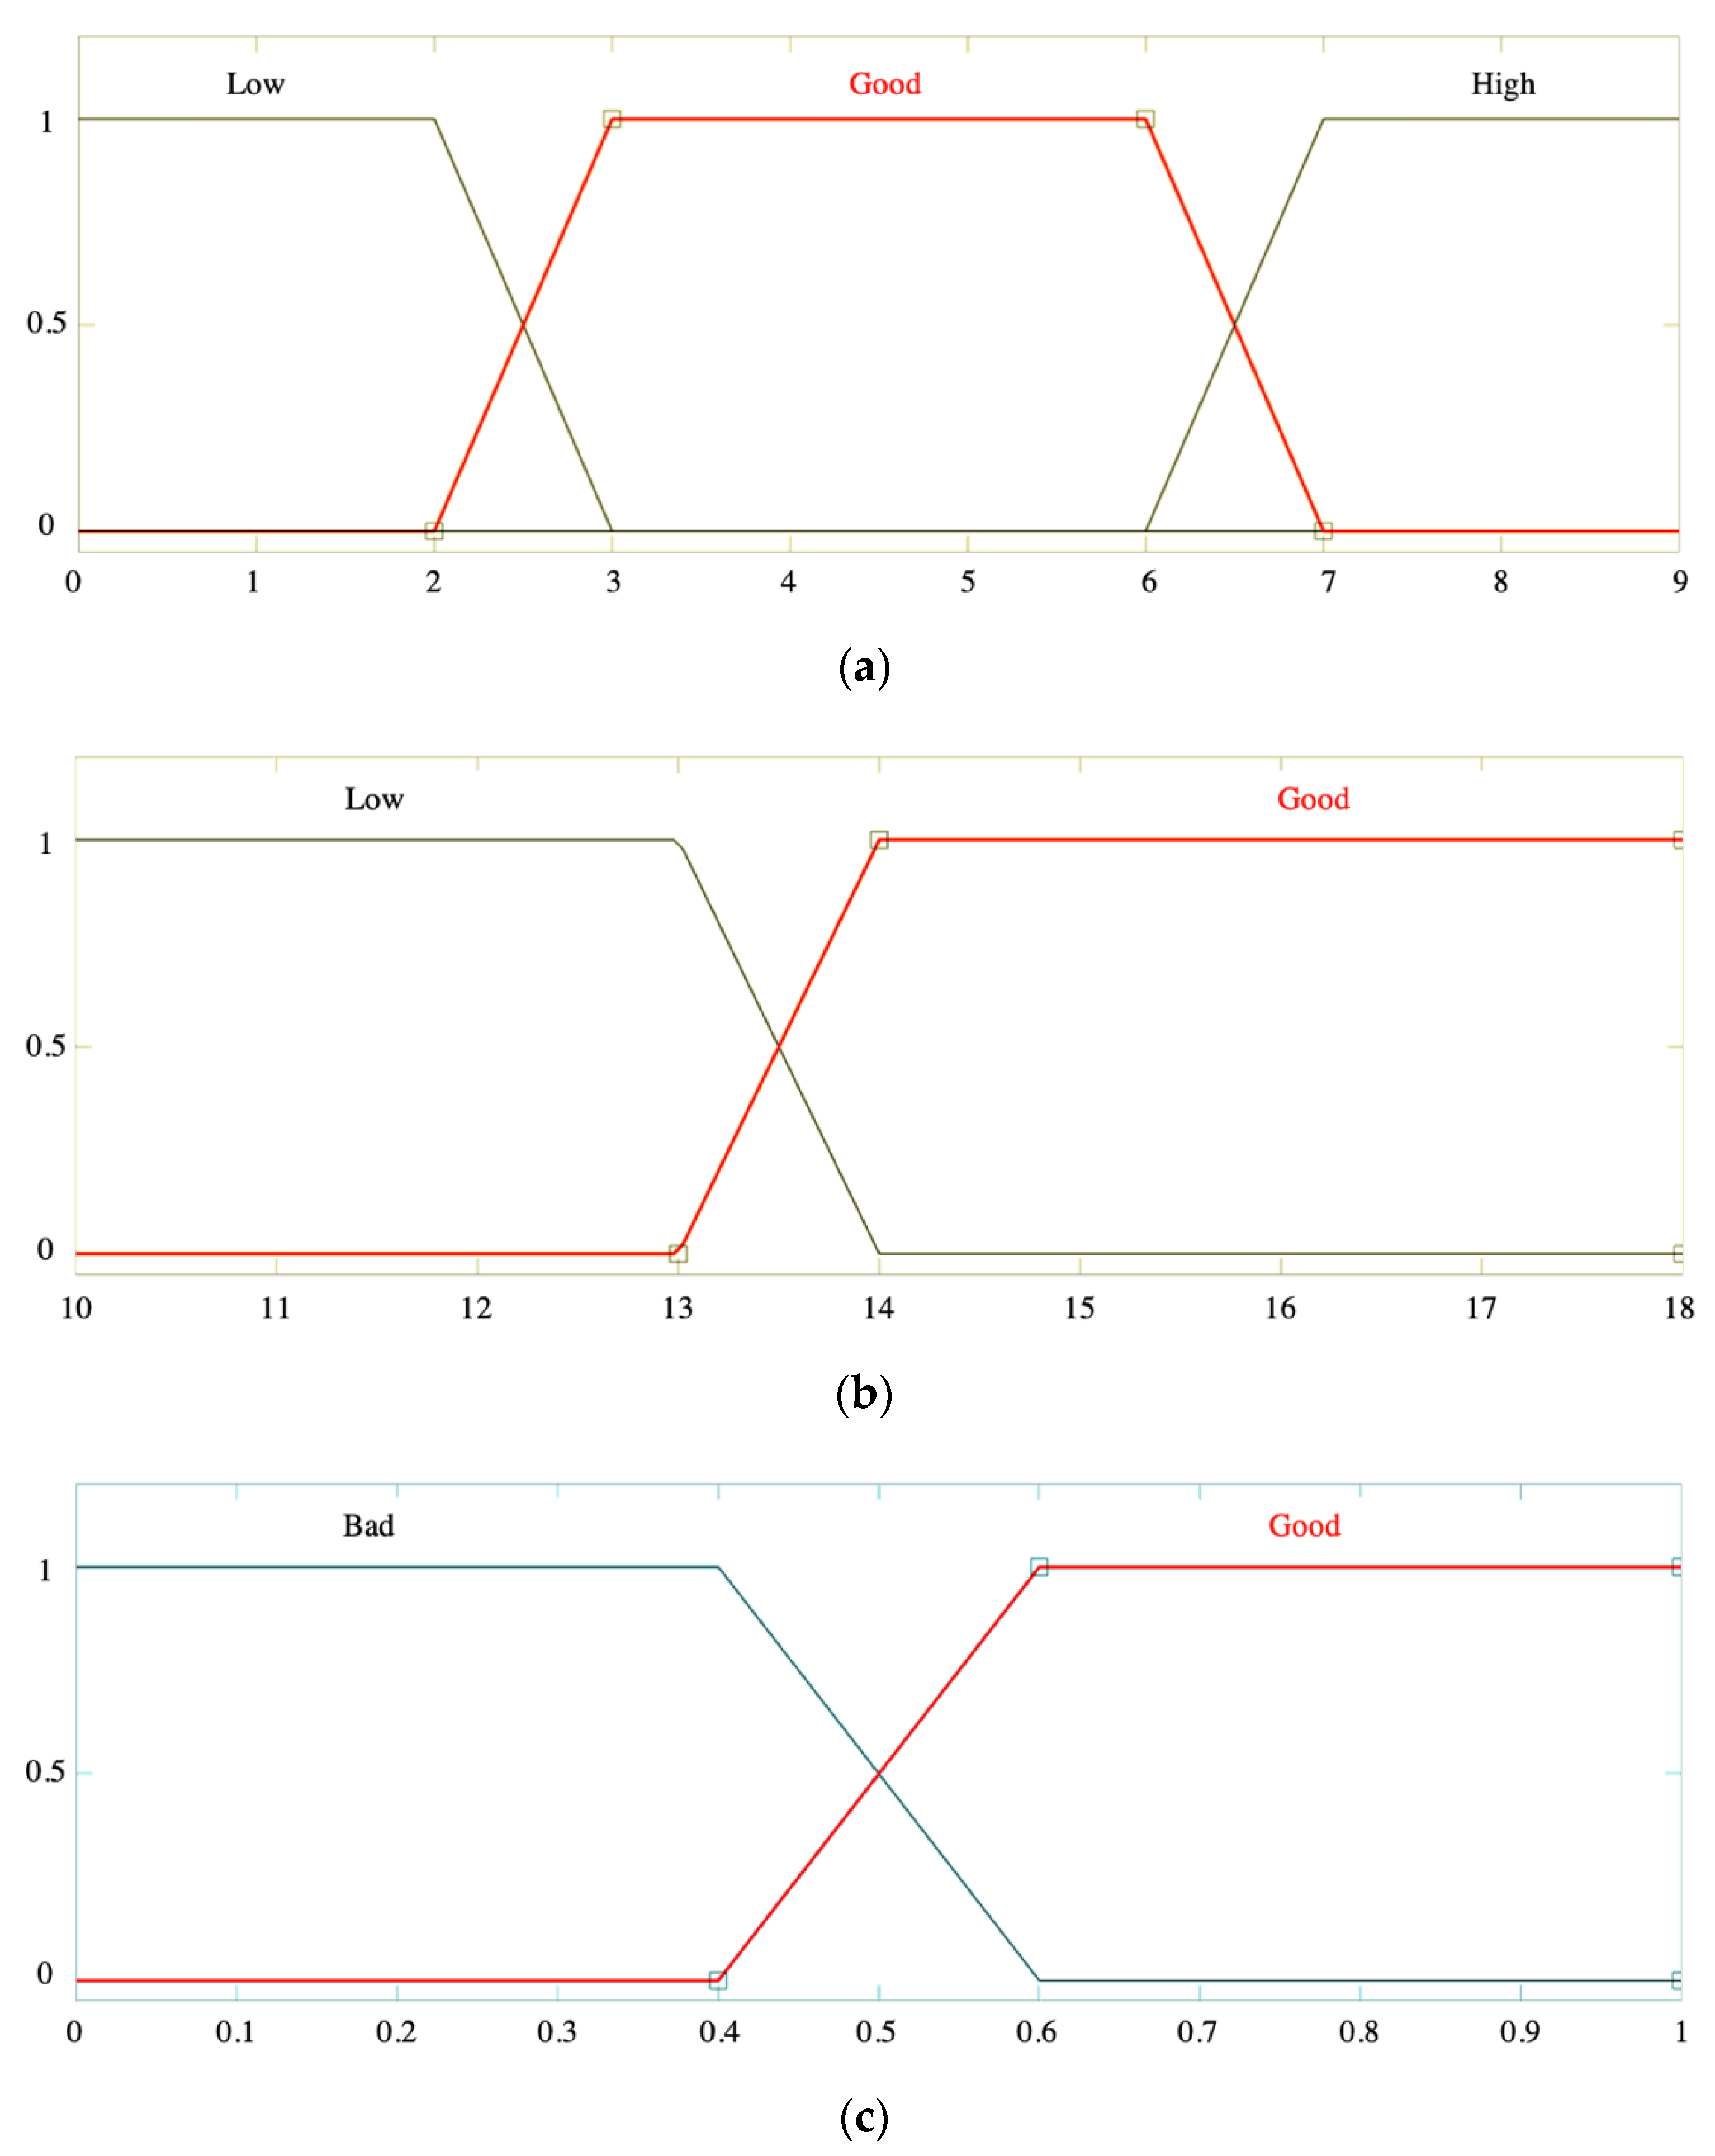
Figure 4a shows the membership function for hardness, H. The value considered good for commercialization was 3 ≤ H ≤ 6. The sugar content was considered good for commercialization when SSC ≥ 14, as shown in Figure 4b. In Figure 4c, the membership function for the output degree of commercialization was defined between 0 and 1, where above 0.6 meant that the fruit is good for commercialization.
The architecture of the proposed FLS used the Mamdani method for the fuzzy inference system and the Centroid method for defuzzification, these and other parameters used in the proposed fuzzy model are presented in Table 1.
For the model inference, 18 rules were created. These rules are described in Table 2. In rule 10, it was defined that the degree of commercialization will be good only when all inputs are considered to be good.
According to Veloso et al. [30], each of the three refrigeration chambers where peach samples were stored has different average air conservation temperatures, namely 8.20 °C (chamber C), 5.50 °C (chamber G), and 0.80 °C (chamber L). After defuzzification of the model, the degree of commercialization is analyzed for the next 35 days for each refrigeration chamber, that is, for different ranges of preservation temperature. It is considered an ideal trading day if these degree results are above 0.5. Subsequently, the range of trading days is determined. The initial and final days of commercialization of each cultivar are determined by linear interpolation between the initial (minimum) and final (maximum) days of each chamber concerning the average temperature of each one of them, according to a certain storage temperature.
Equation (1) is an example of an interpolation made for an initial day if the defined storage temperature is between the average temperatures of the local C and local G chambers and Equation (2) is an example for the final day.
where:
is the initial day of commercialization for the RS cultivar;
is the final day of commercialization for the RS cultivar;
is the initial day of commercialization of chamber C;
is the final day of commercialization of chamber C;
, it is the initial day of commercialization of the chamber G;
, it is the final day of commercialization of the chamber G;
is the defined storage temperature [°C];
is the average temperature of chamber C [°C];
is the average temperature of chamber G [°C].
Finally, the number of days that the RS peaches, for example, will be marketable is defined by the difference between final day and initial day .
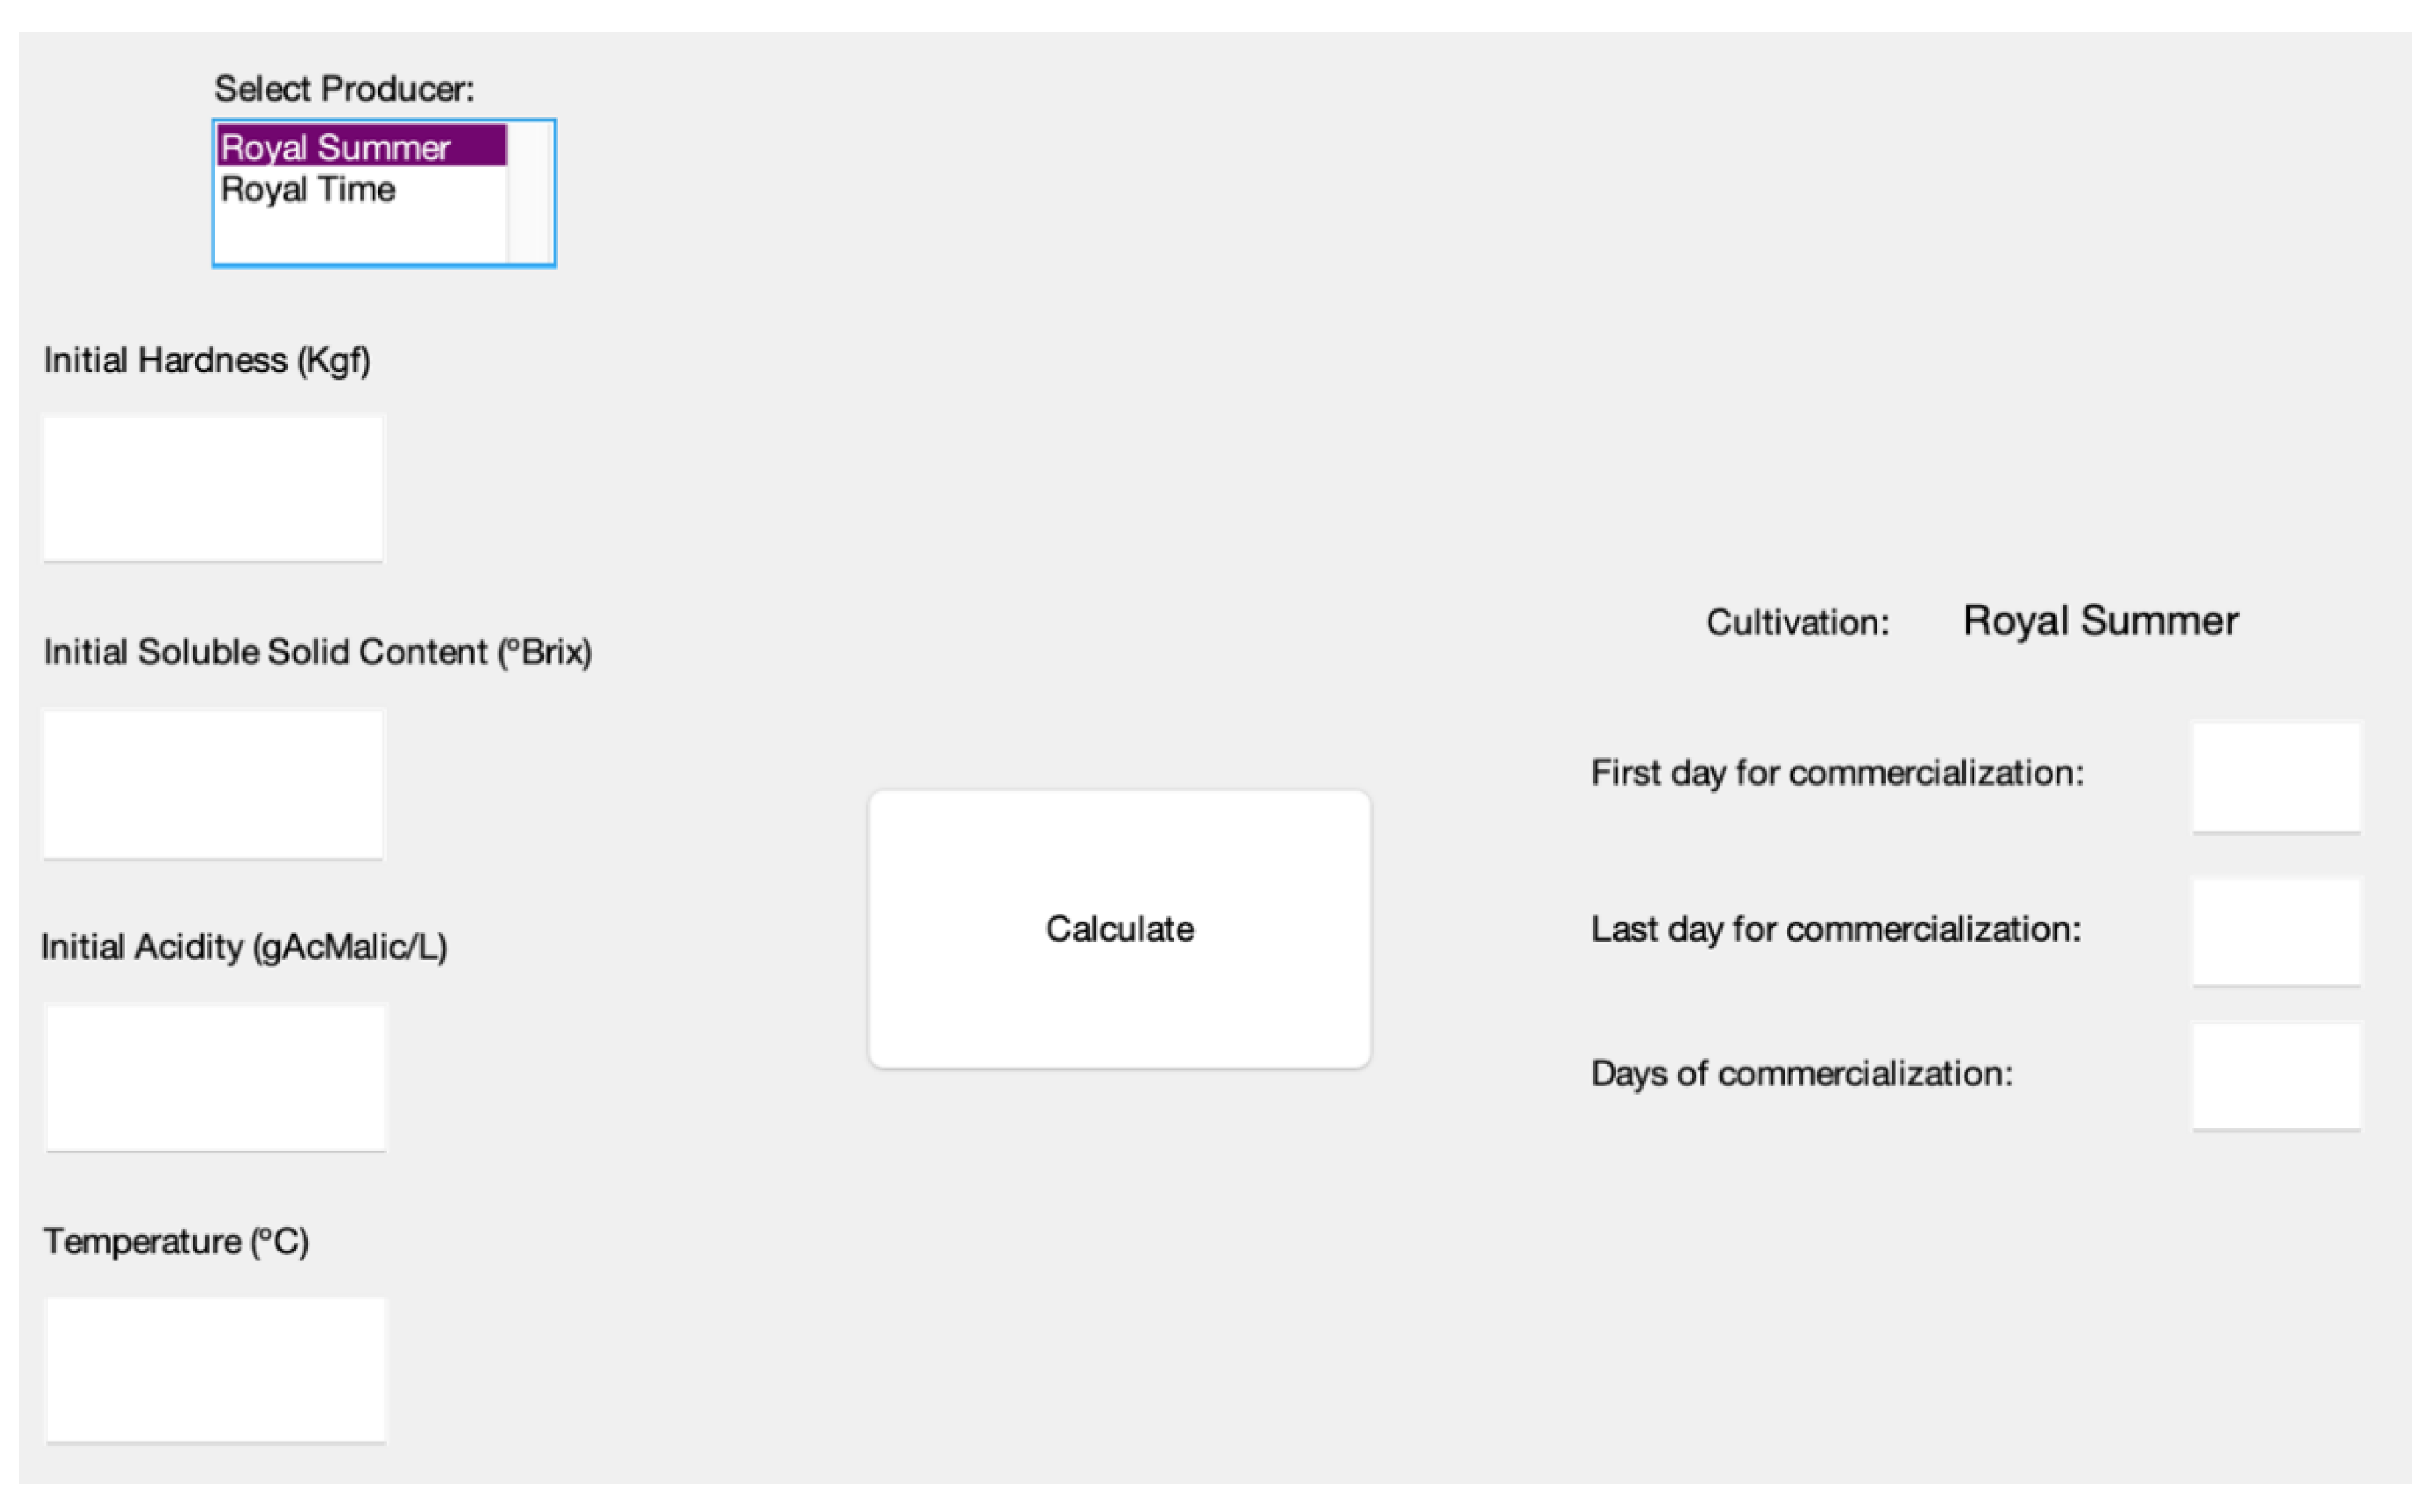
To simplify the search for the best period of marketing days, a computational graphical user interface was developed in Matlab, where the user defines the input variables: the cultivar (RS or RT), initial Hardness, initial Soluble Solids Content, initial Acidity, and the storage temperature. When the “calculate” button is clicked, the DSS returns as output the first day for commercialization, the last day for commercialization, and days of commercialization, which is the difference between the last and the first day for commercialization. This interface is shown in Figure 5.
3. Analysis and Discussion of Results
Several case studies have been developed to analyze the influence of each physical-chemical parameter on the starting and ending commercialization days as well as the number of days. They have evaluated the influence of temperature, hardness, soluble solids content, and acidity. The predictive tool based on fuzzy logic allowed for the predicting of the number of commercialization days for the minimum and maximum values of T, Ac, H, and SSC within the value range considered by consumers as of the highest quality.
3.1. Case Study #1—Variation of Temperature
Temperature is the most important parameter for fruits conservation. The influence of temperature on the quality of peaches, and consequently on its commercialization period, is studied in case study #1. Two studies were carried out using the predictive tool based on fuzzy logic. The first study analyzed the marketable period depending on conservation temperature for the maximum values of Ac, H, and SSC that are considered proper for the two cultivars’ commercialization. The second case study analyses the prediction of how the conservation temperature influences the marketable period for the minimum values of the physical-chemical parameters considered proper for the two cultivars commercialization.
The minimum and maximum temperature values considered in this prediction were T = 0 °C and T = 15 °C, respectively.
As stated above, peaches are perceived to be at their highest quality by consumers when the physical-chemical parameters are in the value range of 3 kgf ≤ H ≤ 6 kgf and SSC ≥ 14 °Brix. The acidity range of values varies depending on the cultivar. For RS cultivar the value range is 3 g/L ≤ Ac ≤ 5 g/L and for the RT cultivar, the value range is 6 g/L ≤ Ac ≤ 9 g/L.
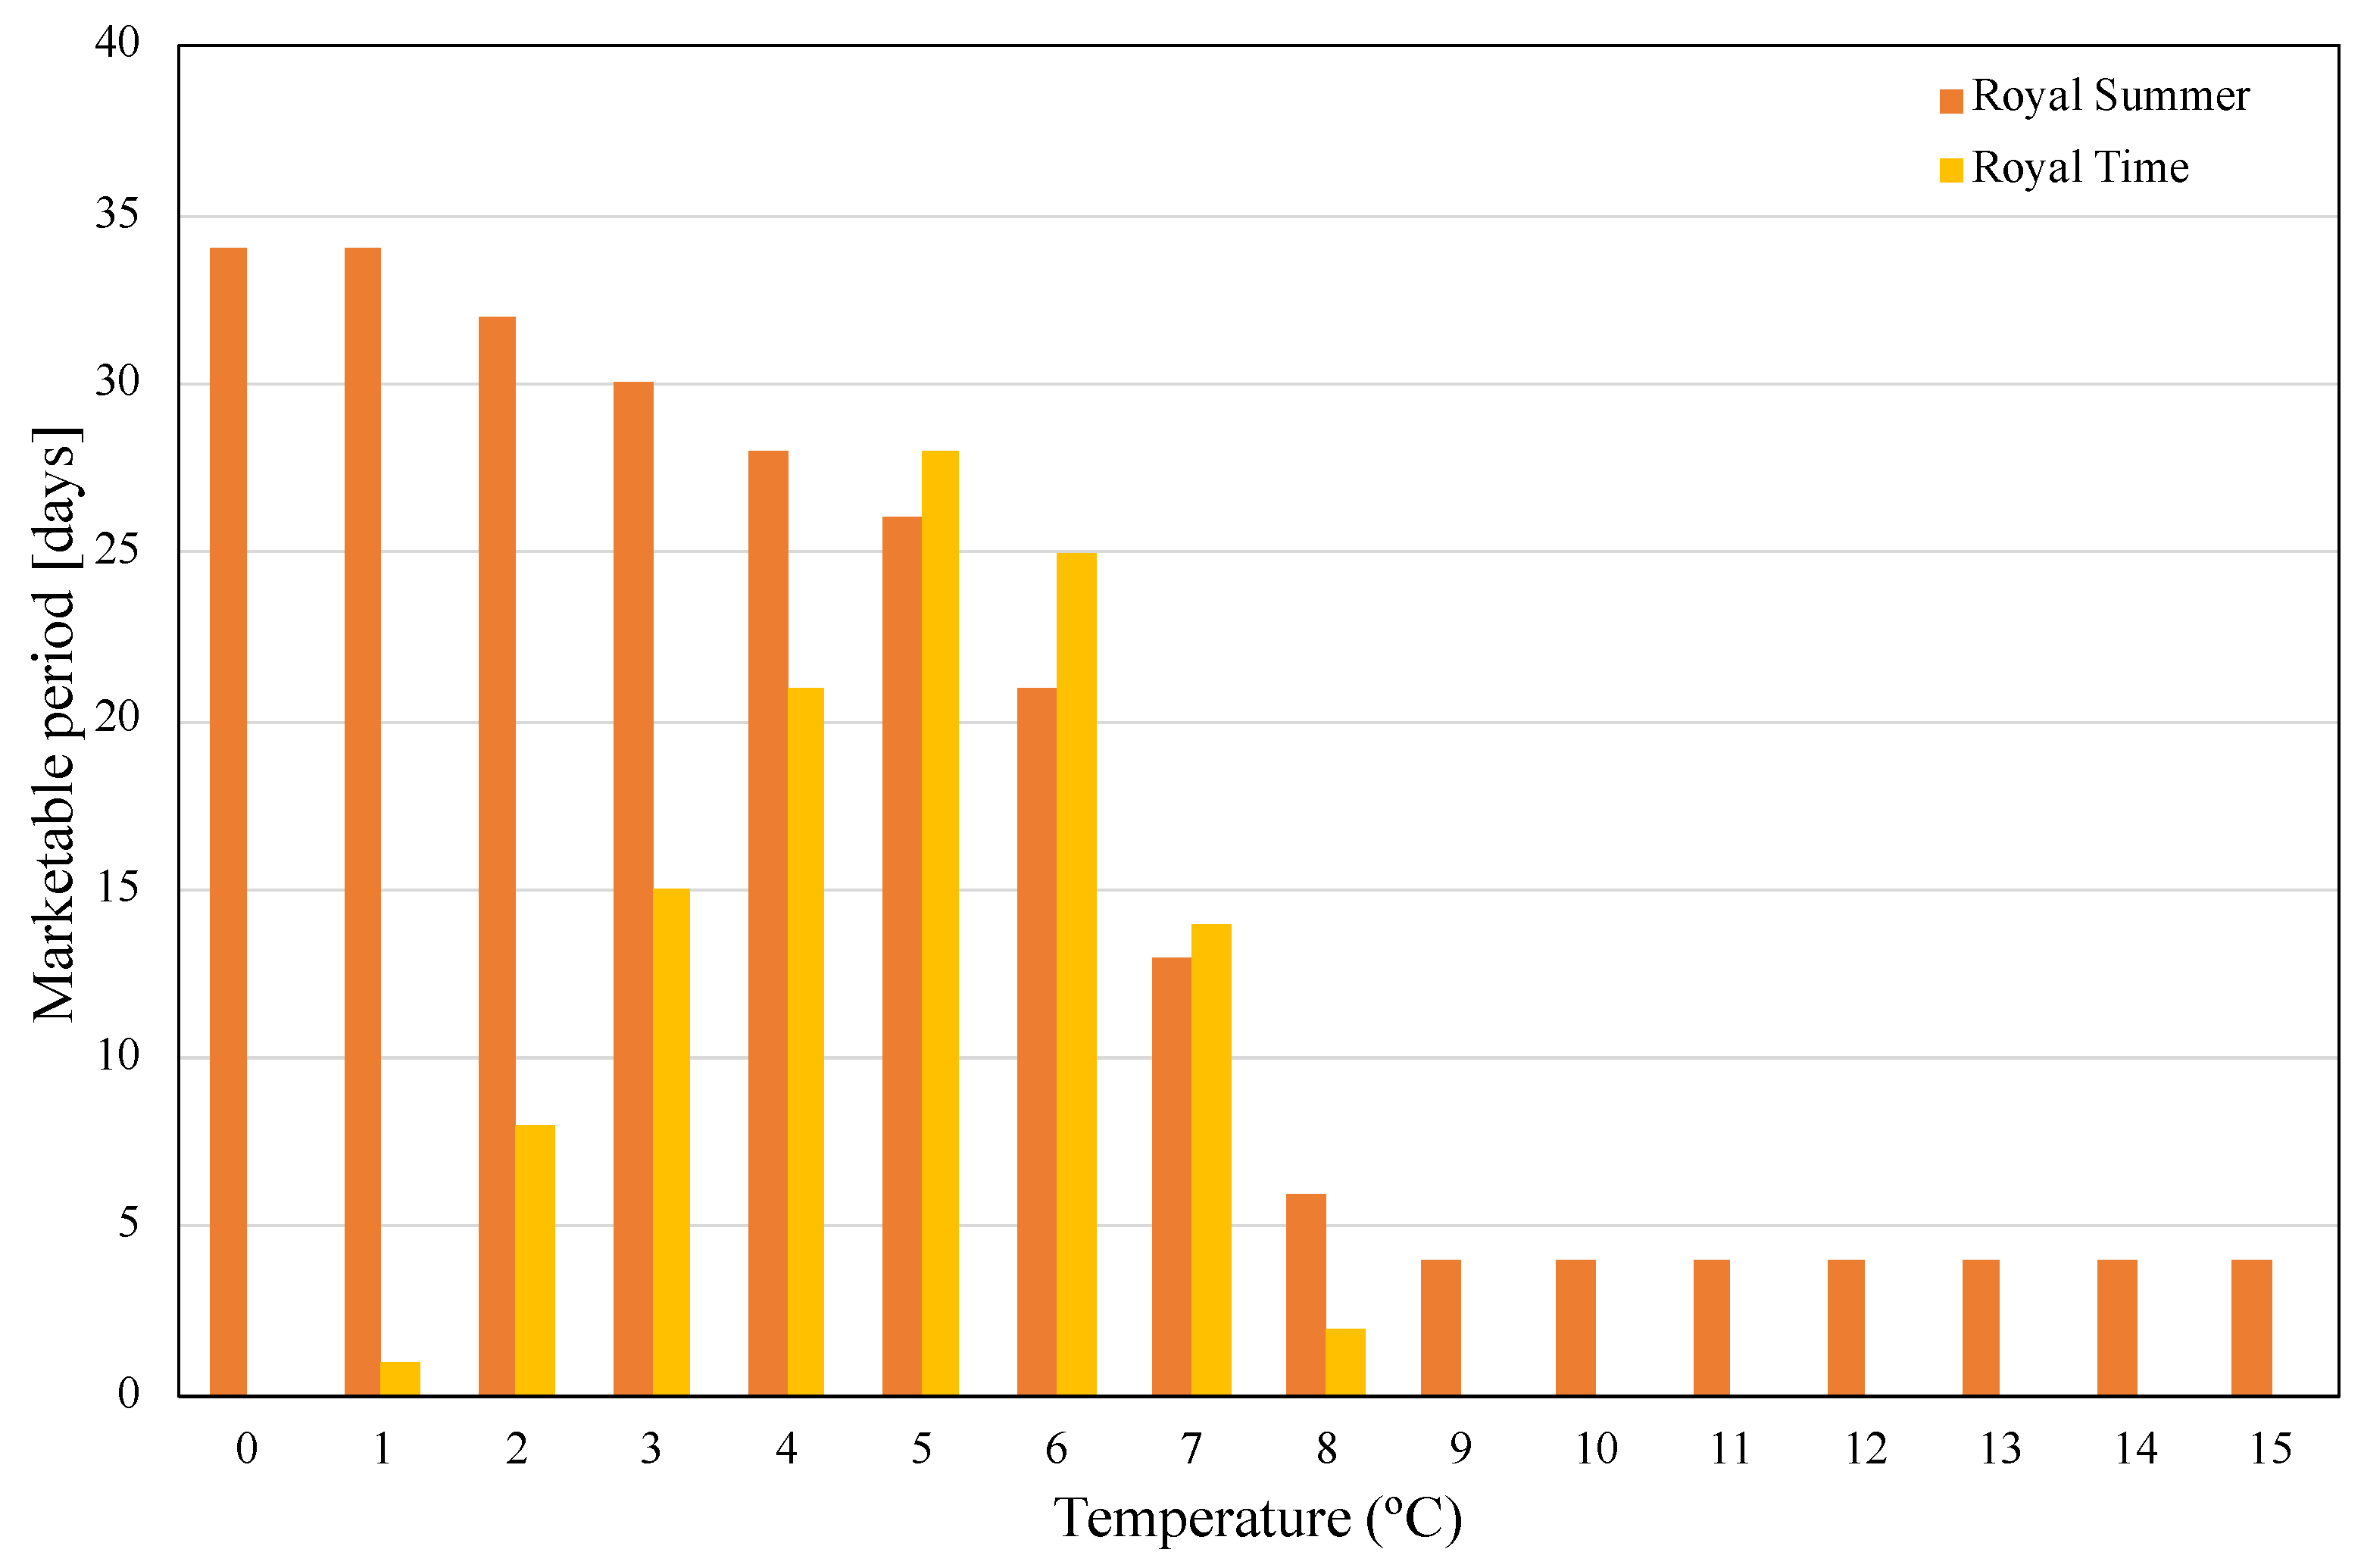
Figure 6 shows the prediction of the marketable days depending on conservation temperature for the maximum values of acidity (Ac = 5), hardness (H = 6 kgf), and soluble solids content (SSC = 14 °Brix), which is considered by consumers to be the highest quality. The prediction of the marketable period of RS cultivar decreases with the increase of conservation temperature. As the conservation temperature increases, the fruits ripen more quickly and, consequently, the hardness will decrease to a value that restrains the commercialization of peaches due to their physical damage. The marketing period begins to decrease at T = 2 °C and stabilizes at T = 9 °C with only four days for sale. Thus, for a conservation temperature above 9 °C, and considering the maximum values of physical-chemical parameters, a marketable period for peaches at their highest quality of four days is predicted. If the conservation temperature is kept between 0 °C and 1 °C, the predicted marketable period reaches a maximum of 34 days, starting from the current day. It must be highlighted that this prediction is for a set of values that suggest the immediate commercialization of this cultivar.
The RT cultivar, which is more an acid cultivar, if stored at a conservation temperature of T = 0 °C will not yet be ready for commercialization since it is not at the highest quality (too acidic) as perceived by consumers. As conservation temperature increases between 1 °C and 5 °C, the days of sale also increase. The predicted maximum number of marketable days at the highest quality is 38 when the peaches are kept at a conservation temperature of 5 °C. As conservation temperature increases beyond 6 °C, the marketable period decreases. For a conservation temperature higher than 8 °C, this cultivar is no longer marketable, because the acidity will have a small increase and, in that sense, the values lay outside the verified conditions of the Fuzzy Logic algorithm [31]. This condition can be overcome if additional data of physical-chemical parameters for temperature above 15 °C are measured and included in the FLS.
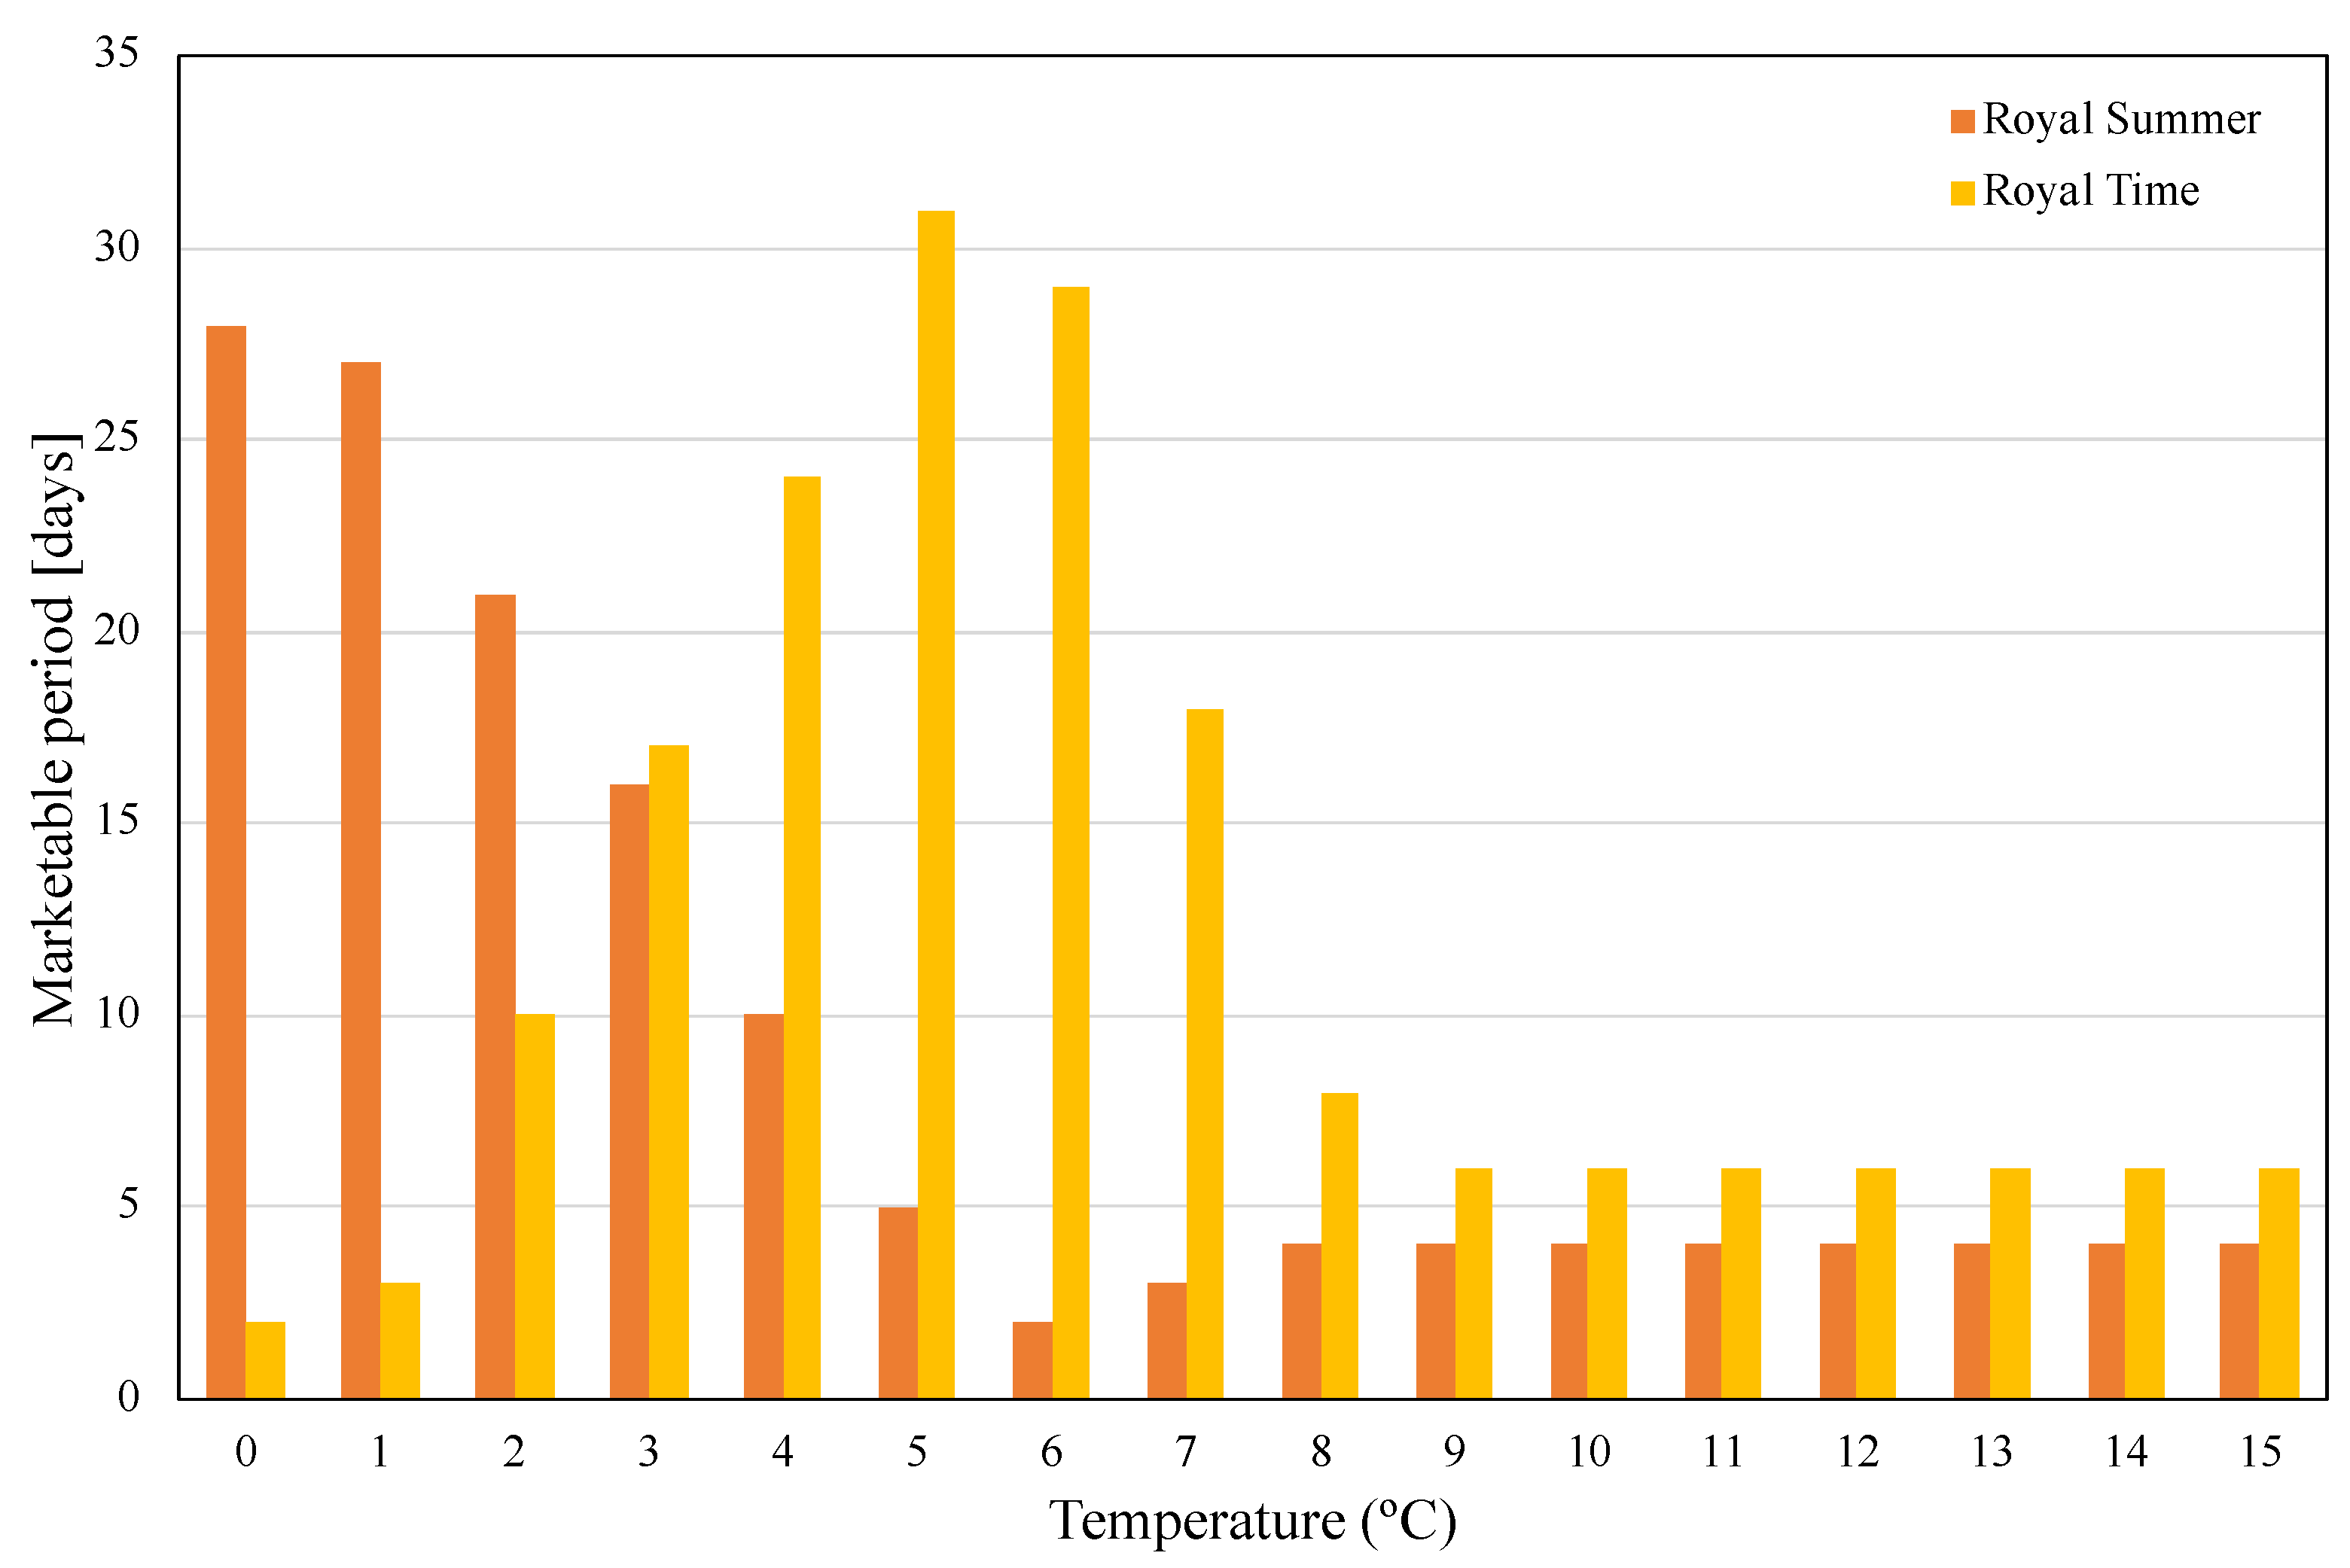
Figure 7 shows the prediction of the marketable days depending on conservation temperature for the minimum values of Ac, H, and SSC. The prediction of marketable days follows the same trend as shown for maximum values of physical-chemical parameters. However, the prediction of the marketable number of days is lower than in the previous prediction. This result arises from the low values of Ac, SSC, and Ac that are considered by consumers as high-quality peaches. For the RS cultivar, the marketing period begins to decrease at T = 2 °C and stabilizes at T = 8 °C, with only four days of sale. The maximum number of days at the highest quality is 38 when peaches are stored at a conservation temperature of T = 0 °C. On the other hand, the prediction of the marketable days of RT cultivar increases as the conservation temperature increases to T = 5 °C, reaching a maximum of 31 days. Afterward, as conservation temperature is higher, the predicted marketable days decrease and stabilize at eight days for conservation temperatures higher than 9 °C.
3.2. Case Study #2—Variation of Hardness
Case study #2 evaluates the influence of hardness variation on peach quality. Hardness is the most important quality parameter, and it determines the date of harvest and is the indicator of fruit ripeness [32]. It is the parameter that most affects marketing and is responsible for high breakdowns and the consequent increase in food waste when it is not high enough to resist manipulation [33]. Three studies were carried out using the predictive tool based on fuzzy logic. The first study analyzes the marketable period depending on the H for the maximum values of Ac, T, and SSC that are suitable for the commercialization of the two cultivars. The second study analyzes the prediction of how the H influences the marketable period for minimum values of the physical-chemical parameters considered adequate for the commercialization of the two cultivars. The last study analyzes the influence of H on the conservation of peaches and, consequently, on their marketing period, with maximum and minimum values of Ac and SSC and an average T = 7.7 °C.
The values of the physical-chemical parameters used are 0 °C ≤ T ≤ 15 °C, SSC ≥ 14 °Brix, and 3 g/L ≤ Ac ≤ 5 g/L, for RS cultivar and 6 g/L ≤ Ac ≤ 9 g/L, for RT cultivar.
The minimum and maximum hardness values considered were H = 3 kgf and H = 6 kgf, respectively.
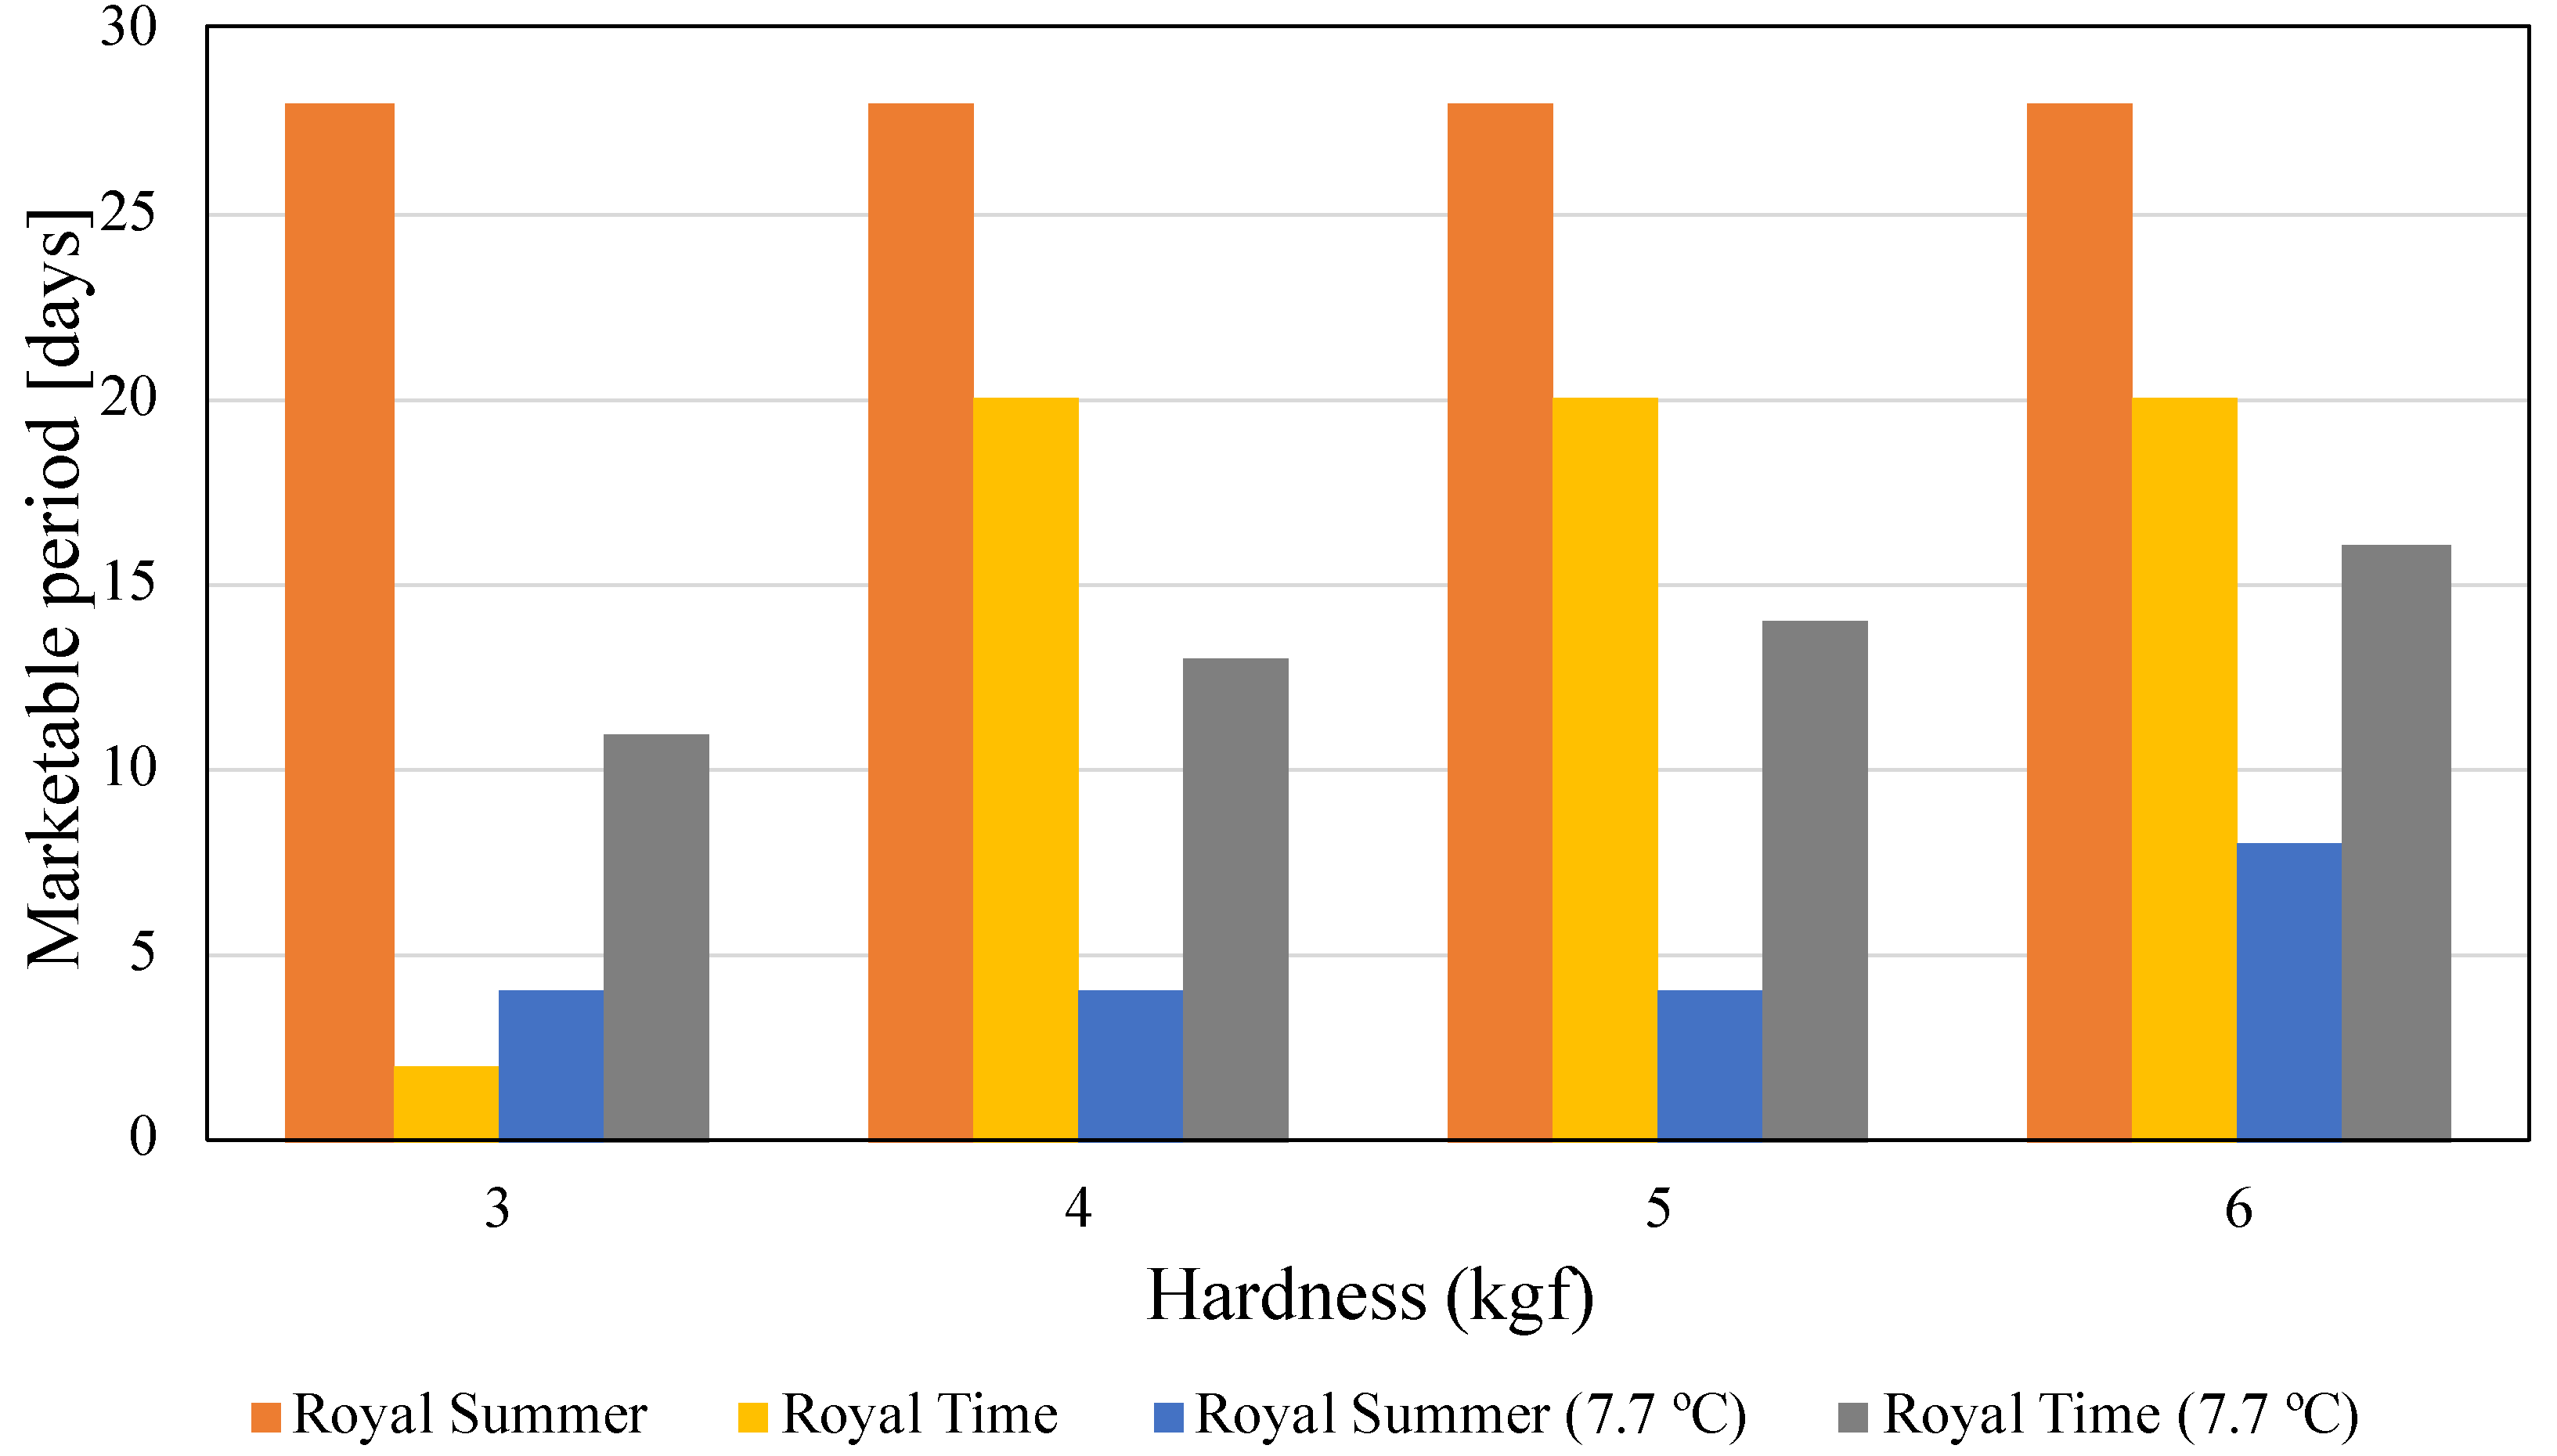
Figure 8 shows the prediction of marketable days depending on the hardness for the maximum values of acidity (Ac = 5 g/L), soluble solid content (SSC = 14 °Brix), Temperature (T = 15 °C), and for another for an average temperature value (T = 7.7 °C). There was little variation from the trading period using the maximum values. With a temperature of T = 15 °C, the prediction for the marketable period of RT cultivar is null, thus it is not marketable. An average temperature T = 7.7 °C was selected to obtain results. For H < 4 kgf, the marketing period remains null, that is, the peaches are not marketable. The commercialization period starts when the hardness values are within 4 kgf ≤ H ≤ 6 kgf, reaching six days of sale during this period. With the RS cultivar, the marketing period starts when the H = 3 kgf, which is different from the RT cultivar. The trading period is 4 days. The days of sale do not vary in the range of hardness values considered for this case. When using T = 7.7 °C, different and better results were obtained for the two cultivars. Based on this, it can be confirmed that temperature has a fundamental role in the preservation of peaches. With an adequate temperature, there will be more days of commercialization. In the study carried out, storing the peaches with an average temperature of approximately 7.7 °C resulted in the extension of the commercialization days, reaching eight days with the RS cultivar and four days with the RT cultivar.
Figure 9 shows the prediction of marketable days with 3 kgf ≤ H ≤ 6 kgf. The analysis is done with the minimum values of Ac, SSC, and T. The prediction of marketable days follows the same trend shown for maximum values of the physical-chemical parameters. However, the prediction for the number of tradable days is higher than in the previous prediction. The RS cultivar has the longest commercialization period, with 28 days. For the prediction of marketable days of the RT cultivar, there is little commercialization period with the H = 3 kgf, and it increases and then remains constant with 4 kgf ≤ H ≤ 6 kgf, reaching 20 days. Performing the same analyses, with the same values, changing only the temperature to T = 7.7 °C resulted in a reduction in the commercialization days for both cultivars, reaching eight days for the RS cultivar and 16 days for the RT cultivar. As concluded in the previous case study, there is a significant influence of temperature on the conservation and marketing of peaches. With minimum values of physical-chemical parameters, it is noticeable that there are more days of commercialization.
3.3. Case Study #3—Variation of Soluble Solids Content
The soluble solids content is related to the sugar content of peach and is one of the parameters most appreciated by consumers [32]. The sugar content increases along with fruit maturation, with differences between cultivars [34]. In addition to the cultivar factor, this parameter is strongly influenced by edaphic and climatic conditions associated with the place of production and by cultural techniques carried out by producers, with a special focus on irrigation and fertilization. For this work, three studies were carried out as in the previous case using the predictive tool based on fuzzy logic. The marketable period is analyzed depending on the variation of the SSC in the conservation of peaches for the maximum and minimum values of Ac, T, and H that are suitable for the commercialization of the two cultivars. A third analysis is performed for an average conservation temperature of T = 7.7 °C.
For these case studies, the values of soluble solids content considered were from 14 °Brix ≤ SSC ≤ 16 °Brix. For the physical-chemical parameters, the following values were used: 0 °C ≤ T ≤ 15 °C; 3 kgf ≤ H ≤ 6 kgf and 3 g/L ≤ Ac ≤ 5 g/L for the RS cultivar and 6 g/L ≤ Ac ≤ 9 g/L for the RT cultivar. These values show that peaches are of their highest quality, according to consumers.
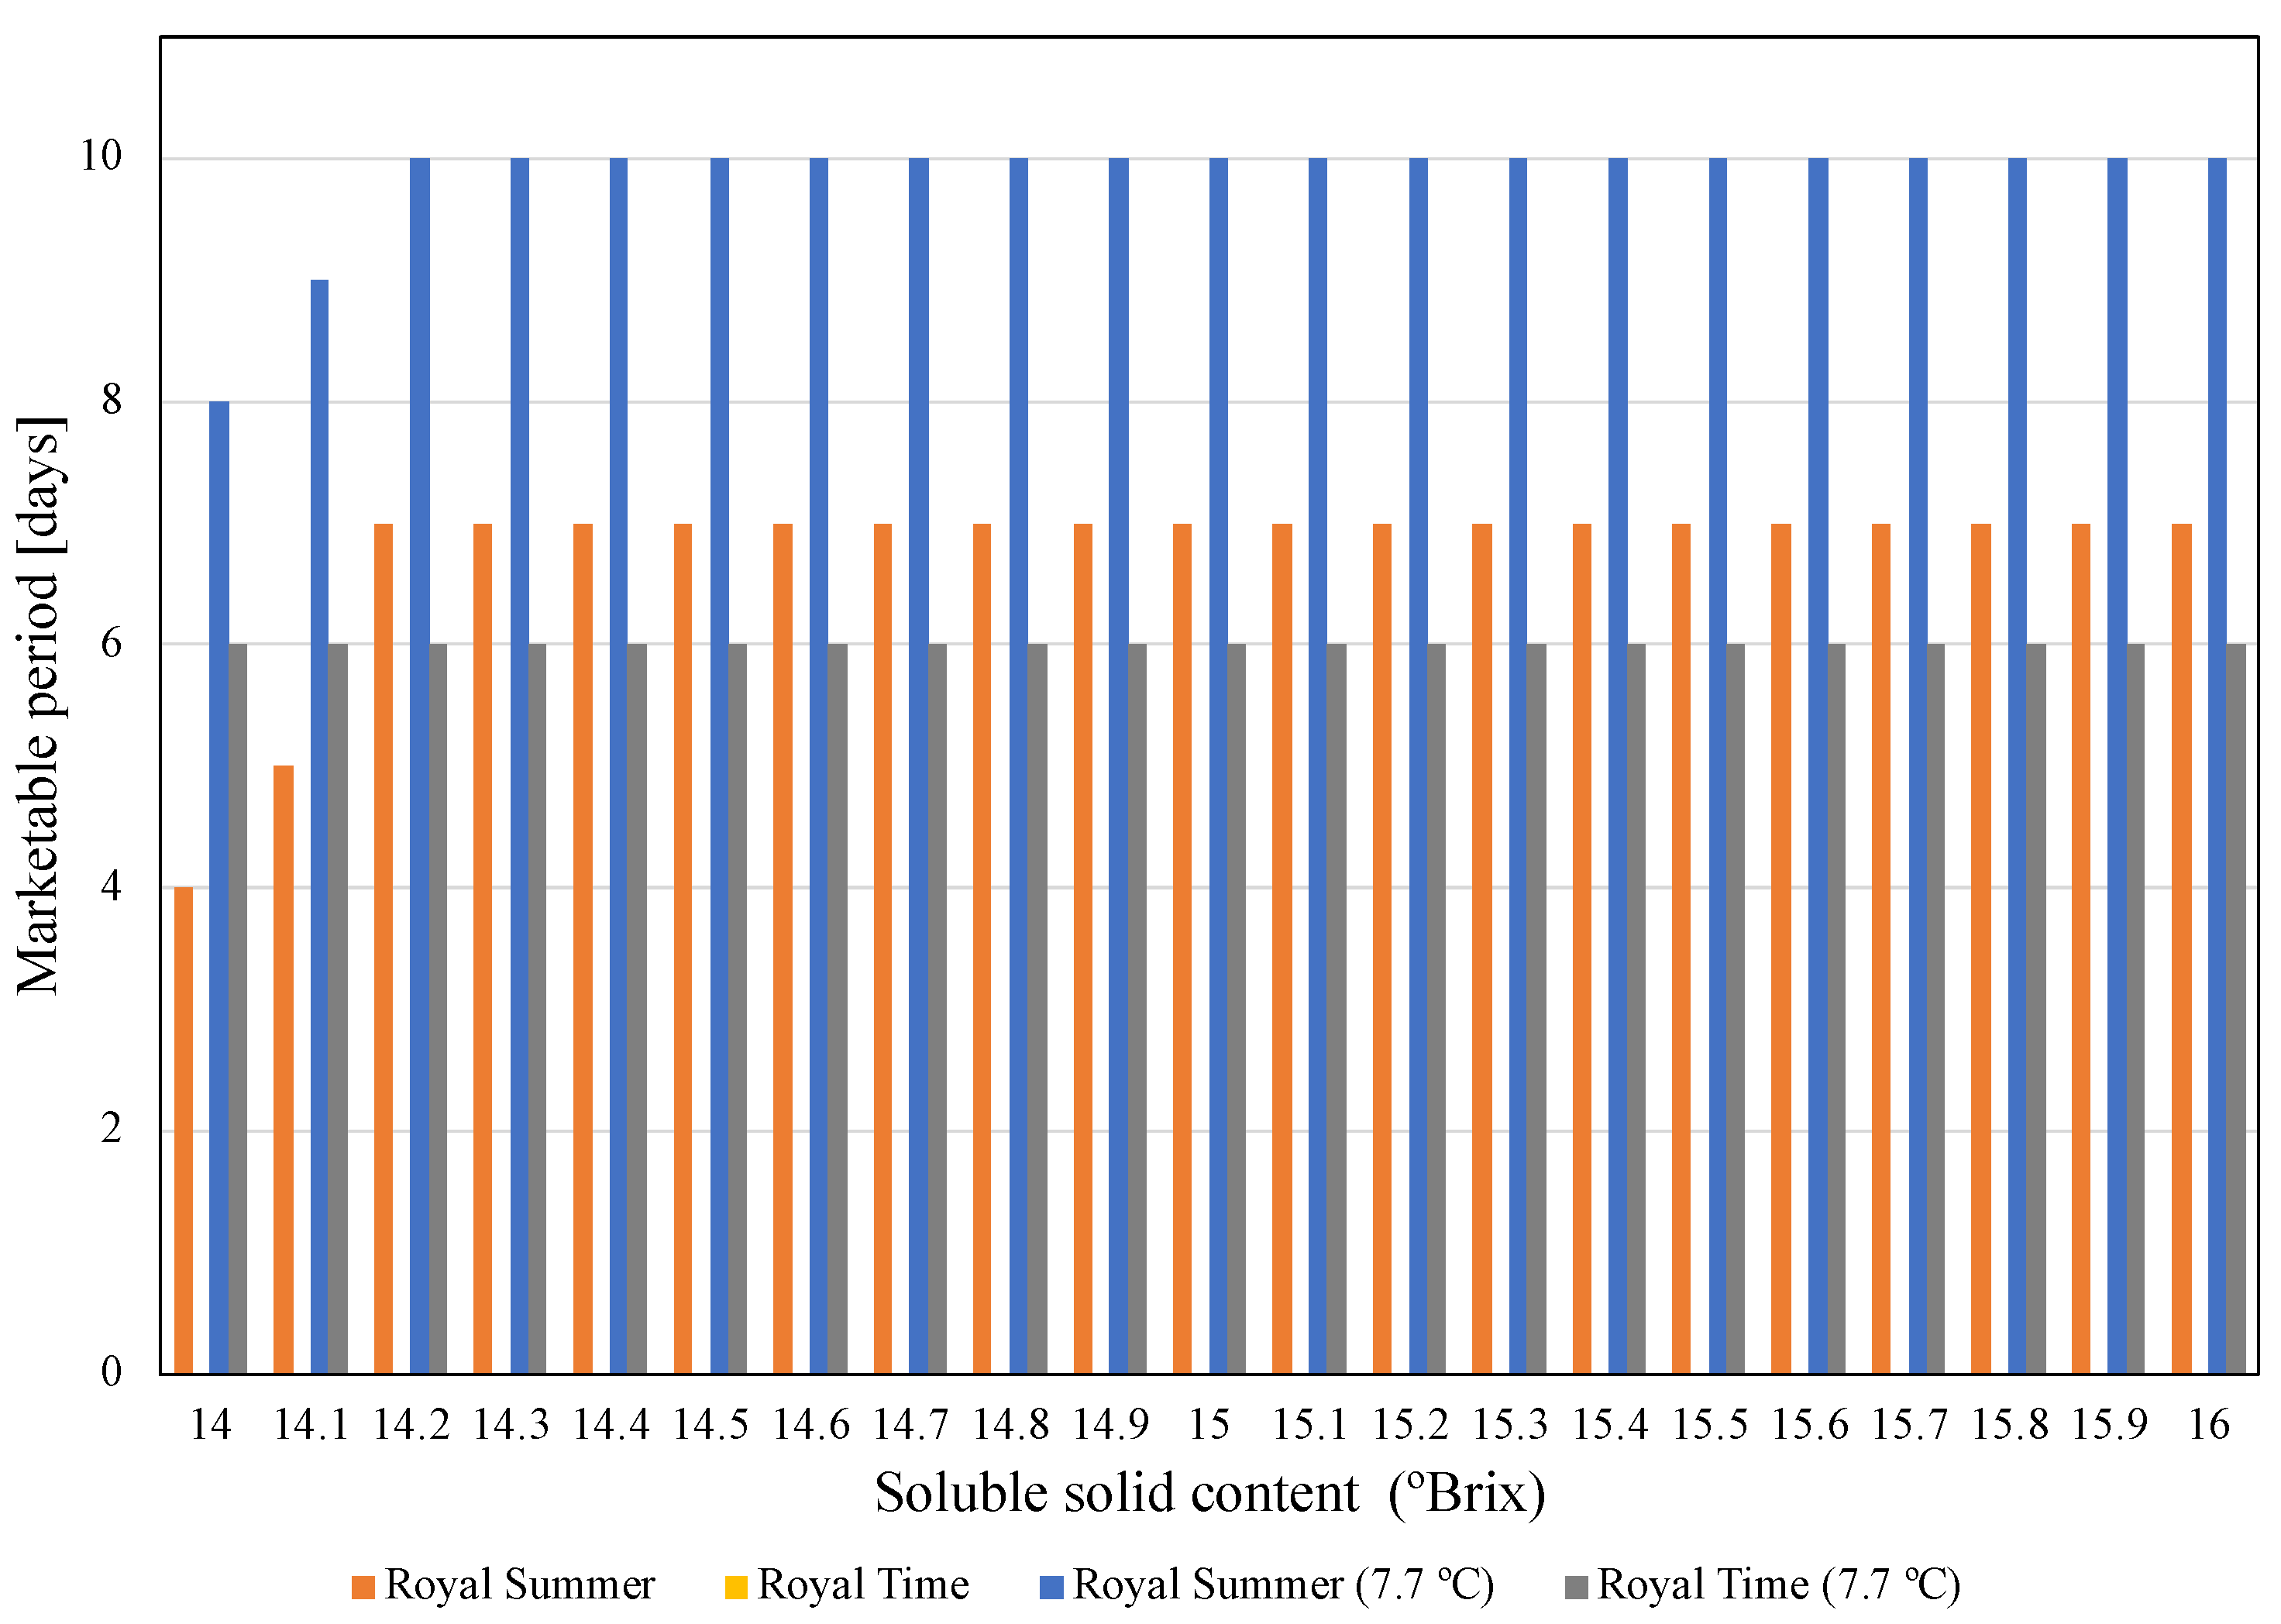
Figure 10 shows the variation in the prediction of marketable days depending on the SSC for the maximum values of acidity (Ac = 5 g/L), hardness (H = 6 kgf), and temperature (T = 14 °C) considered by consumers as the highest quality. For the RS cultivar, the marketable period forecast is lower when SSC = 14 °Brix (4 commercialization days). There is an increase of one more day of marketing with SSC = 14.1 °Brix. There is a further increase in the number of trading days with SSC = 14.2 °Brix, reaching seven trading days. For some fruit with high values of acidity and hardness, small increases of SCC lead to an increase of the commercialization days, as the quality perceived by the consumer increases. These days are held constant until the SSC = 16 °Brix. With the RT cultivar there are no sales days, that is, they are null. This condition is due to the high values of acidity and hardness that in this specific cultivar do not allow it to reach the highest quality state of the peach perceived by consumers. This °Brix variation, while small, is within the scope of values where the quality is considered high for these cultivars. Making the same analogy, with a temperature of T = 7.7 °C, the increase in the marketing period for the two cultivars is obvious.
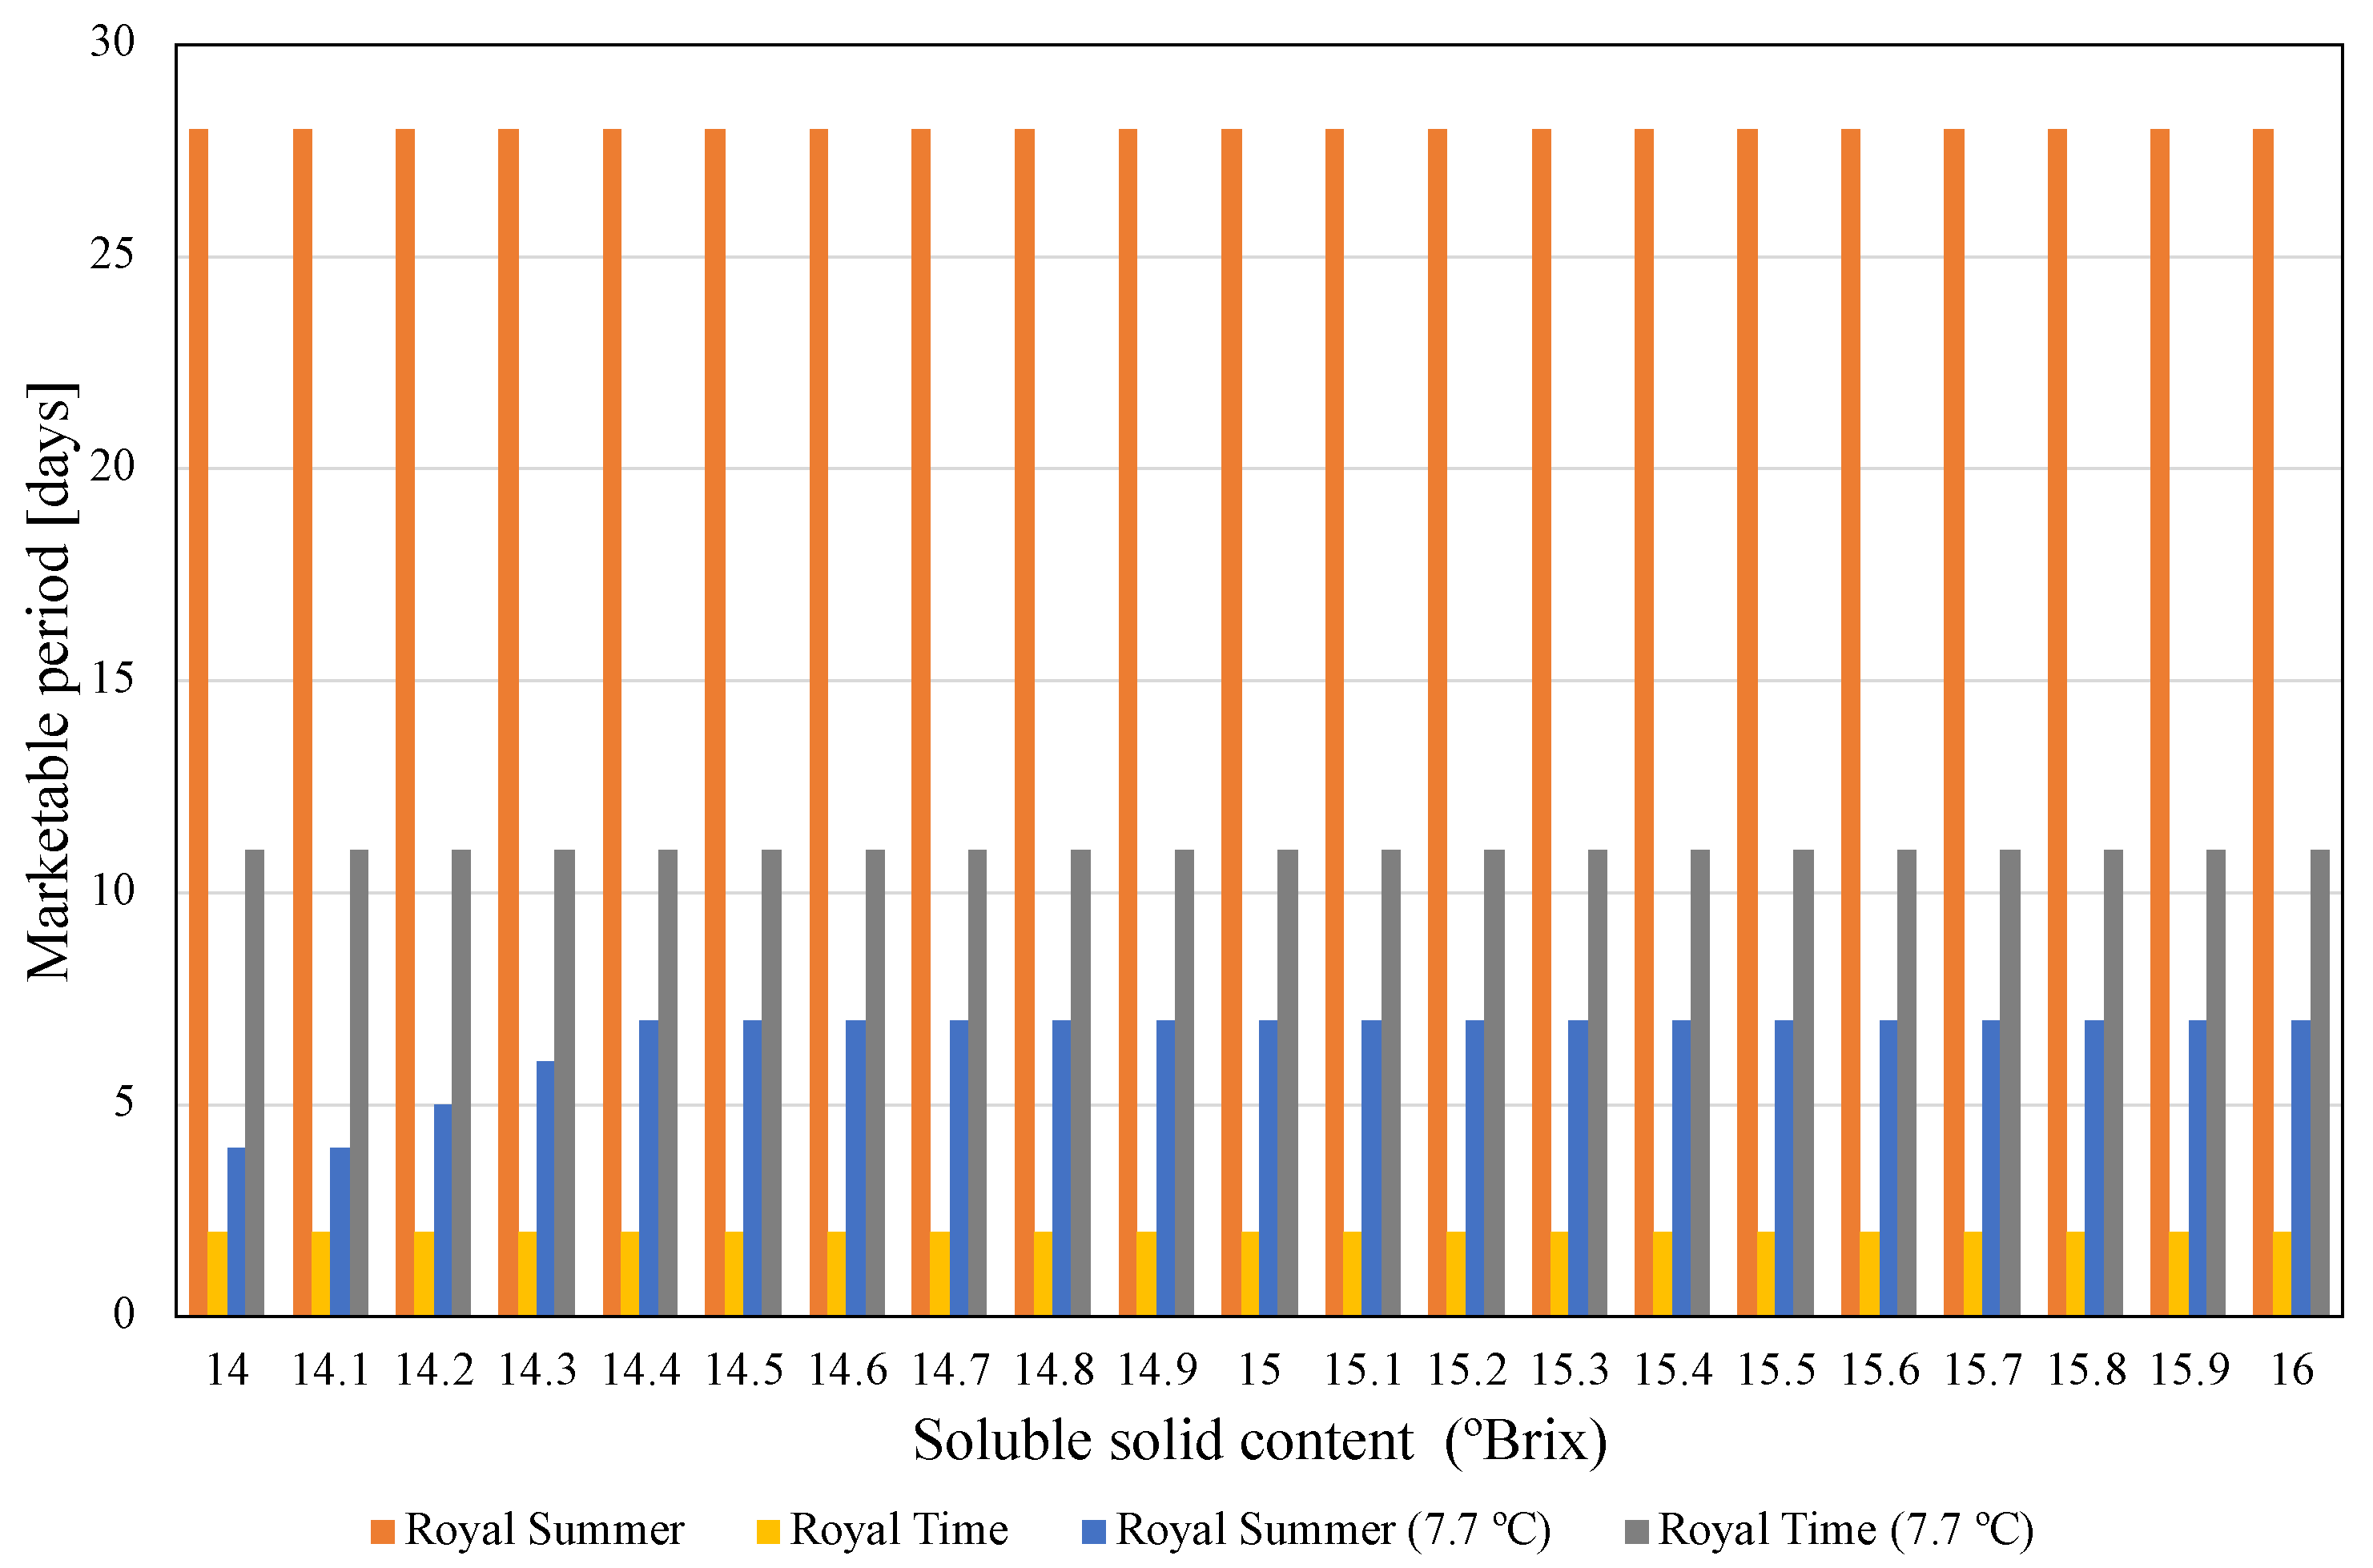
Figure 11 shows the prediction of marketable days depending on SSC for minimum values of Ac, H, and T. It was verified, once again, that the prediction of the number of marketable days is greater than in the previous prediction with maximum values of the physical-chemical parameters. In this case, a large marketable period is accomplished for the Royal Summer cultivar considering the low values of Ac, H, and T, leading to peach with high quality perceived by consumers. The low value of conservation temperature allows for the extending of the conservation period. The marketable period of Royal Time is also constant for the SSC interval for the same reasons described above.
The RS cultivar has the longest commercialization period, with 28 days, this being the period of days constant during the variation of the values of SSC. For the prediction of the commercialization days of the RS cultivar peaches, the commercial period is 2 days, and these days are kept constant by varying the SSC value. The conclusions reached for the analysis of the marketable period depending on conservation soluble solid content for the highest values of hardness and acidity also apply in this case. With a temperature of 7.7 °C and keeping the maximum and minimum values of the physical-chemical parameters, the results show some variation.
3.4. Case Study #4—Variation of Acidity
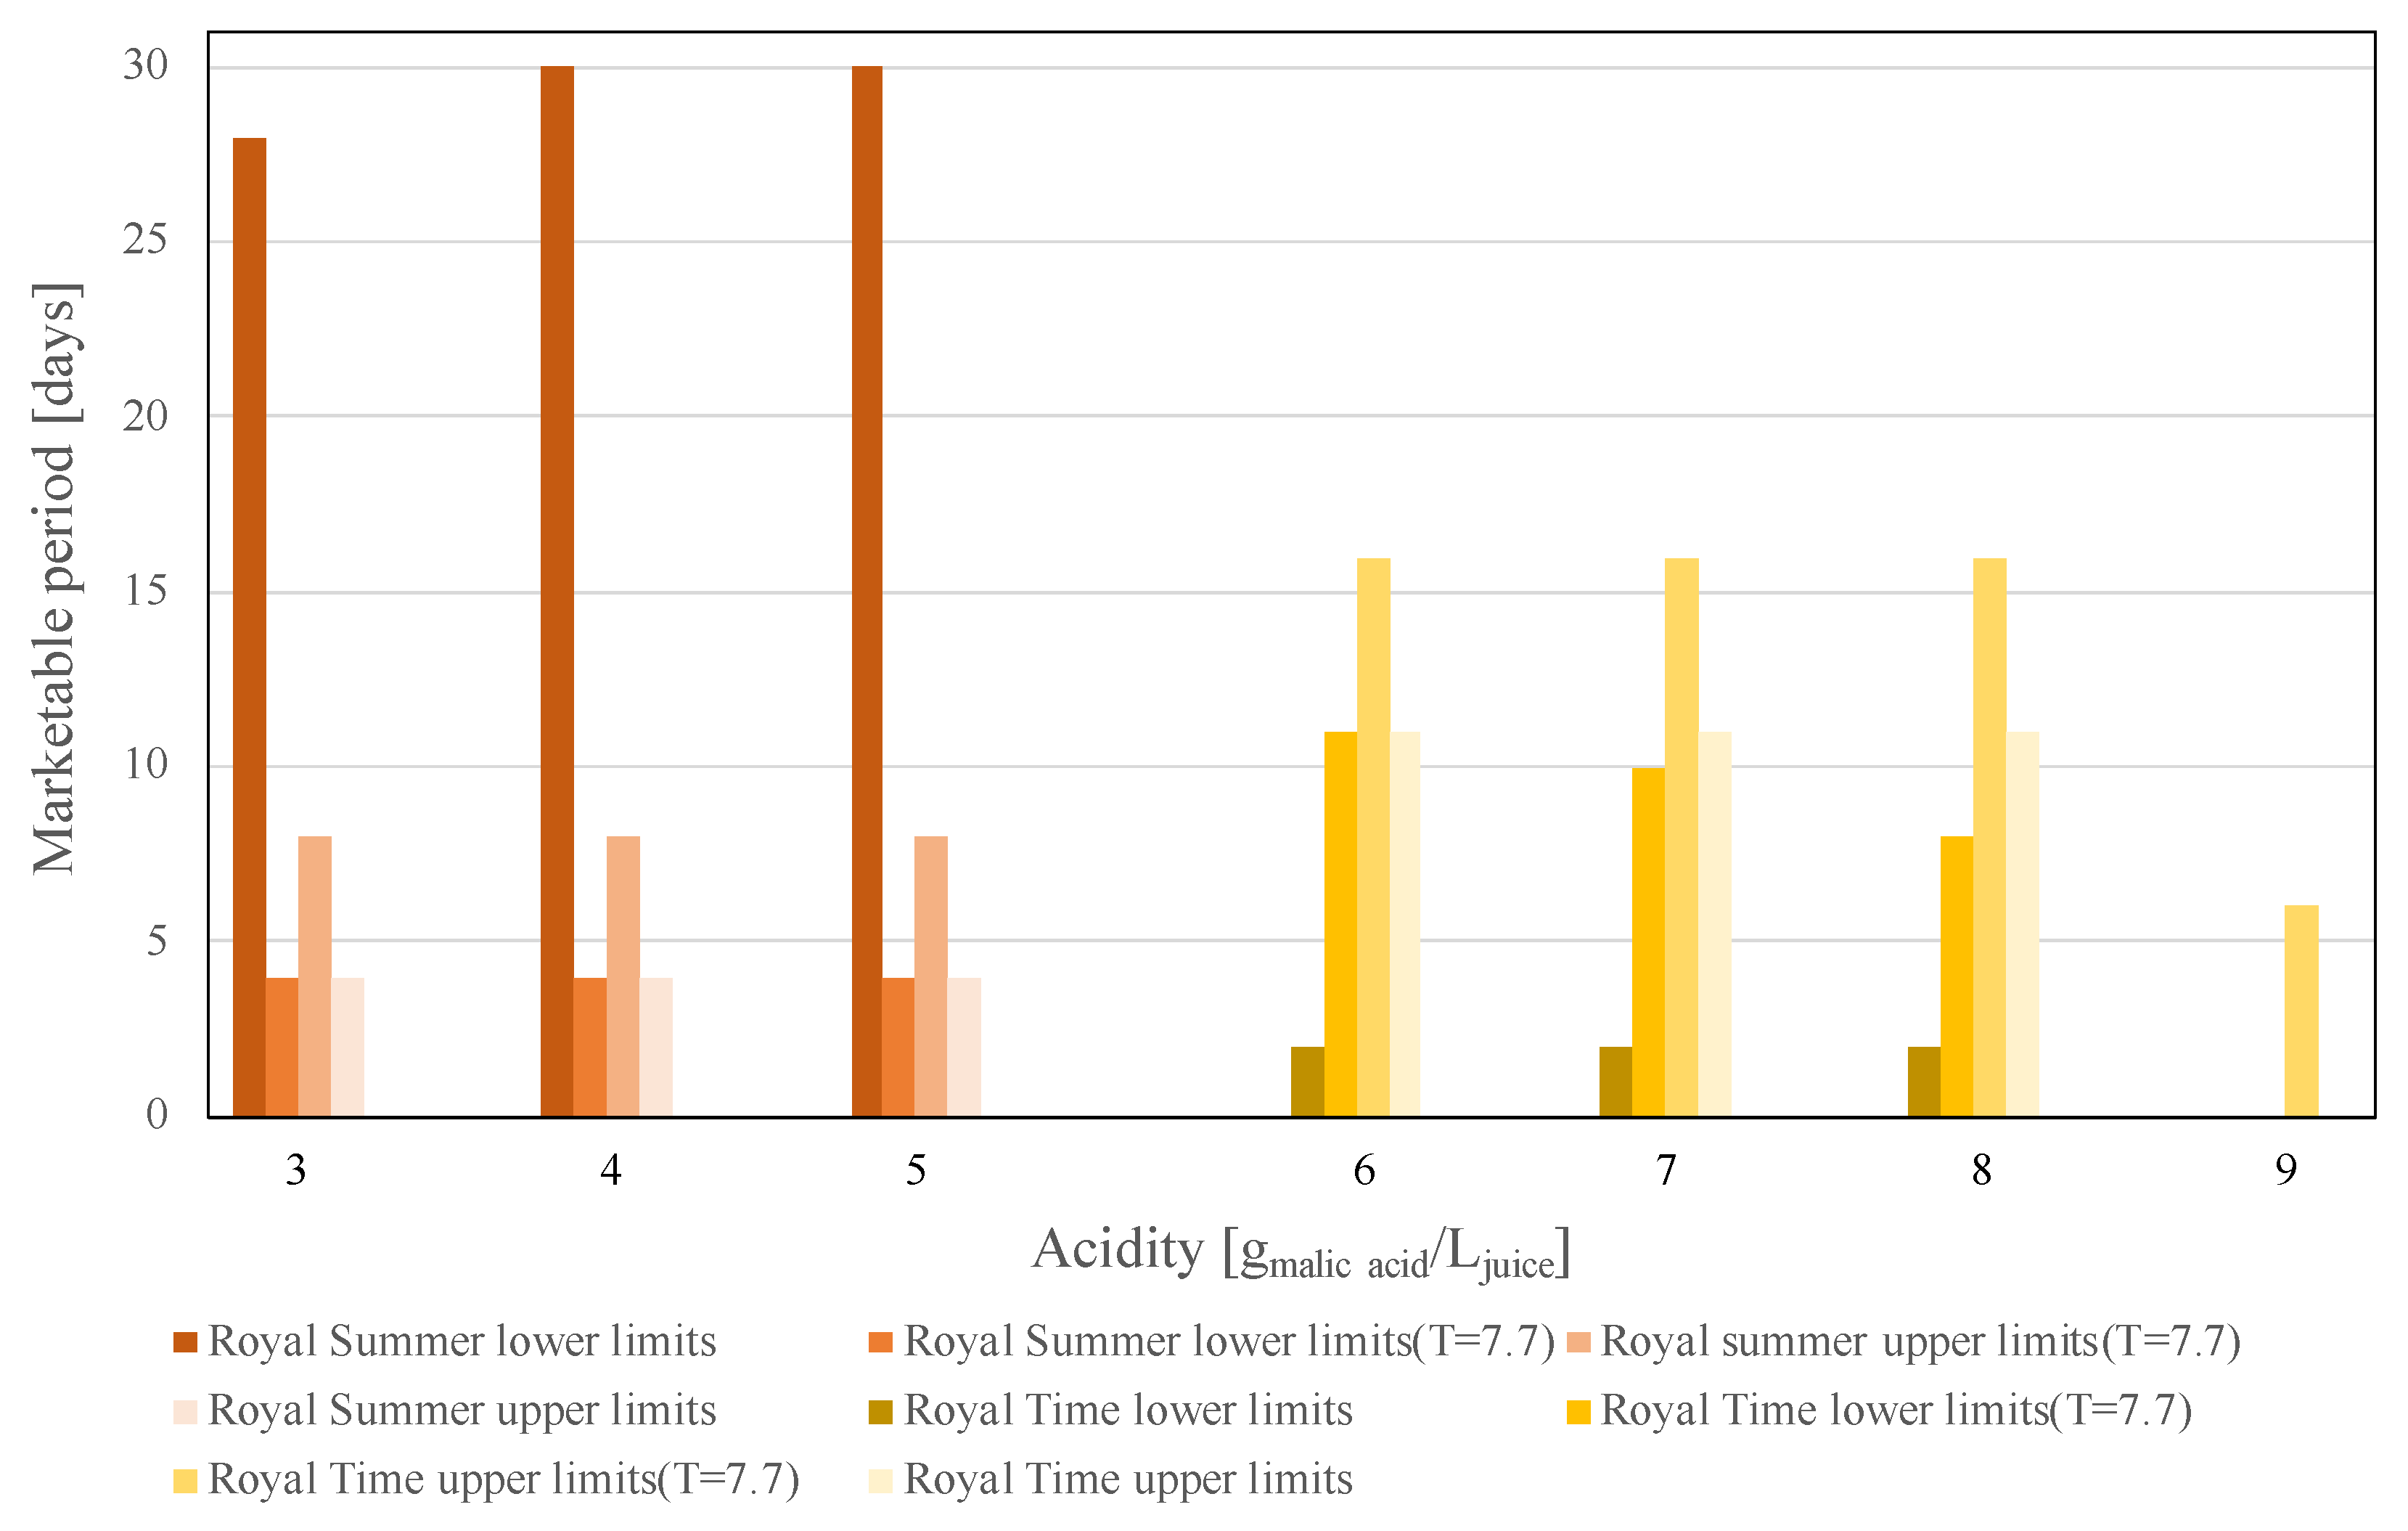
This case study analyzes the influence of Ac in the marketing period. This time, considering that peaches are at their highest quality perceived by consumers when the physical-chemical parameters are in the range of values 3 kgf ≤ H ≤ 6 kgf; SSC ≥ 14 °Brix; and 0 °C ≤ T ≤ 15 °C. The acidity range of values varies depending on the cultivar. For the RS cultivar, the value ranges are 3 g/L ≤ Ac ≤ 5 g/L and for the RT cultivar, the values range is 6 g/L ≤ Ac ≤ 9 g/L. Therefore, four studies were performed: (a) minimum limit values with fixed parameters: H = 3 kgf; SSC = 14 °Brix; T = 0 °C; (b) minimum limit values as (a) for the physical-chemical parameters but considering an average temperature T = 7.7 °C; (c) maximum limit values of H = 6 kgf; SSC = 14°Brix, with an average temperature T = 7.7 °C; (d) maximum limits with the maximum values parameters of H = 6 kg; SSC = 14 °Brix and T = 15 °C.
As shown in Figure 12, if the acidity parameter is within the acceptable limits for consumption, the marketing days for the RS cultivar remain relatively constant, with only a slight difference for the minimum limit Ac = 3 g/L, corresponding to 28 days for commercialization. For Ac = 4 g/L and Ac = 5 g/L, there is a slight difference, corresponding to 30 days for commercialization. Under minimum limits conditions with average temperature, T = 7.7 °C, for Ac from 3 g/L to 5 g/L, the marketable days remain constant and equal to four days. Under maximum limit values with average temperature (T = 7.7 °C) with Ac from 3 g/L to 5 g/L, the marketable days remain constant and equal to 12 days.
In the maximum limit conditions with Ac from 3 g/L to 5 g/L, the marketable days remain constant and equal to four days. However, when analyzing only the patterns of commercialization, the days for minimum and maximum limit values seems to decrease. The patterns of commercialization days for minimum and maximum limit values with average temperature are increasing. The marketable time depending on the acidity parameter for RS cultivar peaches follows a sinusoidal distribution.
For RT cultivar peaches, the marketable days also remain relatively constant, with a slight difference to minimum limit values with average temperature, which presents a decreasing distribution, where for Ac = 6 g/L equals 11 marketable days; for Ac = 7 g/L equals 10 marketable days; for Ac = 8 g/L is equivalent to eight marketable days and for Ac = 9 g/L the product is non-marketable. For Ac = 9 g/L in all analyzed cases, the peaches are not marketable excluding the maximum limit values with an average temperature that allowed six commercialization days. For all other cases, the distribution is constant depending on the acidity, for the minimum limit values of physical-chemical parameters for Ac from 6 g/L to 8 g/L equals two trading days. For the minimum limit values of physical-chemical parameters with average temperature value and Ac from 6 g/L to 8 g/L equals 16 marketing days. For the maximum limit values with average temperature value and Ac from 6 g/L to 8 g/L equals 12 marketing days. However, the patterns of commercialization days for the minimum and maximum limit values of physical-chemical parameters seem to be increasing. The patterns of commercialization days for the minimum and maximum limit values of physical-chemical parameters with average temperature show an increasing trend with the commercialization days for the minimum limit values of physical-chemical parameters with an average temperature higher than the maximum limits. The time for selling the RT cultivar peaches depending on the acidity follows a parabolic distribution.
3.5. Statistical Analysis
A statistical analysis of the data of both cultivars was performed to determine at what average temperature the peaches should be conserved that increases the number of commercialization days. For data processing, analysis, visualization, and display, the software package Matlab® and Microsoft Excel® were used. For this analysis, the Fuzzy model was used for both cultivars. A combination of all initial physical-chemical parameters considered suitable for commercialization was analyzed. Due to the Fuzzy model increments, which were generated from the observed experimental data, the different measurements were repeated only once, since the output is the same for each initial parameter setting. The initial hardness ranged from 3 kgf to 6 kgf, the initial SSC was set between 14 °Brix and 16 °Brix, and the average temperature ranged between 0 °C and 9 °C. The values defined for the initial acidity differed between cultivars. For the RS cultivar, the acidity varied between 3 g/L and 5 g/L, and for the RT cultivar, it varied in the interval from 6 g/L to 9 g/L.
Figure 13 shows the boxplot plot of the commercialization period (in days) according to the average storage temperature for both cultivars. RS cultivar had the highest average number of 31 days of commercialization with temperatures around 0 °C. This number reduces with increasing temperature. Furthermore, it was possible to observe a small variability at low temperatures and greater variability at temperatures between 4 °C and 7 °C. RT cultivar showed great variability in the number of days for commercialization when the average temperature of conservation is between 0 °C and 4 °C and also above 8 °C. In the case of this cultivar, the ideal temperature to conserve the fruit should be around 5 °C, where the variability was low and the average number of days for commercialization was the highest among all the configurations tested with 30 days. Some outliers were found because when setting the initial acidity equal to 9 g/L, the model returned null commercialization days.
Table 3 and Table 4 show for the RS and RT cultivars, respectively, the number of days for the commercialization of all combinations of initial physical-chemical parameters considered suitable for commercialization for each average temperature of conservation between 0 °C and 9 °C. In addition, the average, standard deviation, the first and third quartiles, and the interquartile range, measured by the difference between the third and first quartiles are shown. These values contribute to the analysis, not only to obtain the average value of the number of days to commercialization but also the variability of this value for each average temperature of storage according to the initial physical-chemical parameters.
4. Conclusions
A decision support system based on artificial intelligence through a Fuzzy Logic model was developed to predict the commercialization days of peaches of two cultivars (Royal Summer and Royal Time) at their highest quality perceived by consumers in terms of the range values of some physical-chemical parameters: hardness, soluble solids content, and acidity, of which the variation is dependent on the conservation temperature. As quality is a subjective concept, Fuzzy Logic is the most suitable technique to develop a decision-making tool for the marketable days of peaches.
Case studies were developed to analyze the influence of each physical-chemical parameter on the commercialization days (number and time to start). The influence of temperature, hardness, soluble solids content, and acidity were evaluated. The predictive tool based on fuzzy logic allowed for the predicting of the number of commercialization days for the minimum and maximum values of T, Ac, H, and SSC within the values range considered by consumers as of highest quality. The decision support system helps retailers with their decision-making concerning the selling period and consequent price when fruits are reaching the highest quality time window. No such tool has been developed until now to help retailers to sell their perishable products at the maximum level of quality, so this study can be considered to be innovative in terms of the frameworks of food quality, logistics, and waste. The main limitation of this study is the qualitative analysis output when the input values are off the range of the experimental measurements. In that case, the results may be unreliable, so the user must be informed about the limitation of the DSS. In that sense, future work considers developing additional experimental tests in other environmental conditions to improve the DSS, Additionally, this formulation can be extended to other fruits and vegetables. Although it requires detailed experimental testing to create a database to correlate input and output parameters, future work will consider extending this DSS for the cherries market, as it is also a very perishable fruit with a lower marketable period at its highest quality level. In the last instance, this decision support system may contribute to the reduction of food loss and waste, thus having positive social, economic, and environmental impacts.
Author Contributions
Conceptualization, P.D.G.; methodology, P.D.G. and B.M.; validation, P.D.G. and B.M.; formal analysis, P.D.G. and B.M.; investigation, P.D.G., B.M., A.C., L.J. and C.B.; resources, P.D.G. and B.M.; data curation, P.D.G. and B.M.; writing—original draft preparation, P.D.G., B.M., A.C., L.J. and C.B.; writing—review and editing, P.D.G. and B.M.; supervision, P.D.G.; project administration, P.D.G.; funding acquisition, P.D.G. All authors have read and agreed to the published version of the manuscript.
Funding
This study is within the activities of project “PrunusPós—Optimization of processes for the storage, cold conservation, active and/or intelligent packaging and food quality traceability in post-harvested fruit products”, project no. PDR2020-101-031695, Partnership no. 87, initiative no. 175, promoted by PDR 2020 and co-funded by EAFRD within Portugal 2020.
Institutional Review Board Statement
Not applicable.
Informed Consent Statement
Not applicable.
Acknowledgments
P.D.G. acknowledges Fundação para a Ciência e a Tecnologia (FCT—MCTES) for its financial support via the project UIDB/00151/2020 (C-MAST).
Conflicts of Interest
The authors declare that they have no conflict of interest.
References
- Abdulganio, M. Avaliação do Desperdício Alimentar em Famílias Residentes em Portugal. J. Petrol. 2013, 369, 1689–1699. (In Portuguese) [Google Scholar]
- Silva, M.C.; Marinho, R. Desperdício de Produtos Hortofrutícolas Percebido por Famílias de uma Freguesia Citadina nos Açores. 2014. Available online: https://repositorio.uac.pt/handle/10400.3/4324 (accessed on 5 June 2021). (In Portuguese).
- Food Loss and Food Waste. Available online: http://www.fao.org/food-loss-and-food-waste/flw-data (accessed on 5 June 2021).
- Sustainable Development Goals. Available online: http://www.fao.org/sustainable-development-goals/indicators/12.3.1/en/ (accessed on 5 June 2021).
- Fruit and Vegetables-Your Dietary Essentials. 2020. Available online: https://0-doi-org.brum.beds.ac.uk/10.4060/cb2395en (accessed on 5 June 2021).
- Brito, N.V.; Bico, P.; Brandão, C. Food Waste in Portugal—A Public Policy with the Commitment of All Society; Advances in Nutrition and Food Science: ANAFS-157; Kosmos Publishers: Harrison, NJ, USA, 2018. [Google Scholar]
- Papaj, K. Food Waste-Policies, Initiatives and Consumer Behaviour. Case Study: Poland and Portugal. Master’s Thesis, Faculty of Science and Technology, New University of Lisbon, Lisbon, Portugal, September 2016. [Google Scholar]
- Costa, S. A importância da Refrigeração na manutenção da Qualidade de Produtos Horticulas. 2017. Available online: https://comum.rcaap.pt/bitstream/10400.26/20942/1/Stephanie_Costa_21523014_MEAL_Relatório_2017.pdf (accessed on 5 June 2021). (In Portuguese).
- Programa Nacional Para a Promoção da Alimentação Saudável. 2017. Available online: https://www.sns.gov.pt/wp-content/uploads/2017/07/DGS_PNPAS2017_V7.pdf (accessed on 5 June 2021). (In Portuguese)
- Programa Nacional Para a Promoção da Alimentação Saudável. 2020. Available online: https://alimentacaosaudavel.dgs.pt/activeapp2020/wp-content/uploads/2020/11/Relatório-PNPAS-2020.pdf (accessed on 5 June 2021). (In Portuguese).
- Godinho, C.A.; Lima, M.L.; Alvarez, M.J. Psicologia da alimentação saudável: Recomendações, preditores e promoção do consumo de frutas e vegetais. Psicol. Soc. Saúde Investig. E Interv. Em Port. 2014, 1, 43–67. (In Portuguese) [Google Scholar]
- Botelho, G.; Lameira, J. Educação Alimentar Adolescent and Obesity: Considerations About. Assoc. Port. Nutr. 2018, 15, 30–35. (In Portuguese) [Google Scholar] [CrossRef] [Green Version]
- World Population Policies United Nations. 2015. Available online: https://www.un.org/development/desa/pd/sites/www.un.org.development.desa.pd/files/wpp2015_highlights.pdf (accessed on 6 June 2021).
- World Urbanization Prospects—Population Division—United Nations. 2018. Available online: https://population.un.org/wup/Country-Profiles (accessed on 6 June 2021).
- Zadeh, L.A. Fuzzy Sets. Inf. Control 1965, 8, 338–353. [Google Scholar] [CrossRef] [Green Version]
- Mathworks. Fuzzy Logic Toolbox TM User’s Guide; Mathworks: Natick, MA, USA, 2020; Available online: https://www.mathworks.com/help/fuzzy/ (accessed on 6 June 2021).
- Belarbi, K.; Titel, F.; Bourebia, W.; Benmahammed, K. Design of Mamdani fuzzy logic controllers with rule base minimisation using genetic algorithm. Eng. Appl. Artif. Intell. 2005, 18, 875–880. [Google Scholar] [CrossRef]
- Zadeh, L.A. Communication Fuzzy Algorithms. Inf. Control 1968, 12, 94–102. [Google Scholar] [CrossRef] [Green Version]
- Ananias, E.; Gaspar, P.D.; Soares, V.N.G.J.; Caldeira, J.M.L.P. Artificial intelligence decision support system based on artificial neural networks to predict the commercialization time by the evolution of peach quality. Electronics 2021, 10, 2394. [Google Scholar] [CrossRef]
- Pina, M.; Gaspar, P.D.; Lima, T.M. Decision support system in dynamic pricing of horticultural products based on the quality decline due to bacterial growth. Appl. Syst. Innov. 2021, 4, 80. [Google Scholar] [CrossRef]
- Matos, C.; Maciel, V.; Fernandez, C.M.; Lima, T.M.; Gaspar, P.D. Decision support system to assign price rebates of fresh horticultural products based on quality decay. Comput. Manag. 2021, 18, 487–497. [Google Scholar] [CrossRef]
- Gaspar, P.D.; Alves, J.; Pinto, P. Simplified approach to predict food safety through the maximum specific bacterial growth rate as function of extrinsic and intrinsic parameters. ChemEngineering 2021, 5, 22. [Google Scholar] [CrossRef]
- Fernandez, C.M.; Alves, J.; Gaspar, P.D.; Lima, T.M. Fostering awareness on environmentally sustainable technological solutions for the post-harvest food supply chain. Processes 2021, 9, 1611. [Google Scholar] [CrossRef]
- Gaspar, P.D.; Silva, P.D.; Andrade, L.P.; Nunes, J.; Santo, C.E. Technologies for monitoring the safety of perishable food products. In Research Anthology on Food Waste Reduction and Alternative Diets for Food and Nutrition Security; Management Association, I., Ed.; IGI Global: Hershey, PA, USA, 2019; pp. 63–98. ISBN 13 9781799853541. [Google Scholar] [CrossRef]
- Gaspar, P.D.; Soares, V.N.G.J.; Caldeira, J.M.L.P.; Andrade, L.P.; Soares, C.D. Technological modernization and innovation of traditional agri-food companies based on ICT solutions—The Portuguese case study. J. Food Processing Preserv. 2019, e14271. [Google Scholar] [CrossRef] [Green Version]
- Morais, D.; Aguiar, M.L.; Gaspar, P.D.; Silva, P.D.; Alves, N. Development of a monitoring device of fruit products along the cold chain. Procedia Environ. Sci. Eng. Manag. 2021, 8, 195–204. [Google Scholar]
- Varandas, L.; Faria, J.; Gaspar, P.D.; Aguiar, M.L. Low cost IoT remote sensor mesh for large-scale orchards monitorization. J. Sens. Actuator Netw. 2020, 9, 44. [Google Scholar] [CrossRef]
- Simões, M.P. Guia Prático da Produção; COTHN: Alcobaça, Portugal, 2016; Volume I. (In Portuguese) [Google Scholar]
- Ferreira, D.; Santos, C.; Gouveia, C.; Gavinhos, C.; Simões, M.P. Qualidade dos pêssegos da região da Beira Interior no ciclo 2015. Rev. Ciências Agrárias 2017, 40, S088–S094. (In Portuguese) [Google Scholar] [CrossRef]
- Veloso, A.; Ferreira, D.; Gaspar, P.D. Influence of Storage Conditions on Fruit Quality of ‘Royal Time’ and ‘Royal Summer’ Peach Cultivars. J. Agric. Sci. 2021, 44, 82–90. [Google Scholar] [CrossRef]
- Rodrigues, C. Análise Experimental do dano por frio no Pêssego Para Diferentes Condições de Conservação. Master’s Thesis, University of Beira Interior, Covilhã, Portugal, September 2018. (In Portuguese). [Google Scholar]
- Rodrigues, C.; Gaspar, P.D.; Simões, M.P.; Silva, P.D.; Andrade, L.P. Review on techniques and treatments toward the mitigation of the chilling injury of peaches. J. Food Process. Preserv. 2020, e14358. [Google Scholar] [CrossRef]
- Rodrigues, C.; Gaspar, P.D.; Simões, M.P. Influência das Condições de conservação na Qualidade dos Pêssegos. In Proceedings of the Conference: 4° Simpósio Nacional de Fruticultura, Faro, Portugal, 29–30 November 2020. (In Portuguese). [Google Scholar]
- Pereira, T.M.; Gaspar, P.D.; Simões, M.P. Fruit recognition and classification based on SVM method for production prediction of peaches—Preliminary study. Acta Hortic. 2020, 1289, 141–150. [Google Scholar] [CrossRef]
Figure 1.
A schematic representation of a simple fuzzy logic system (FLS).

Figure 2.
A simplified overview of the proposed fuzzy model to predict the degree of commercialization.
Figure 2.
A simplified overview of the proposed fuzzy model to predict the degree of commercialization.

Figure 3.
(a) Membership function of acidity for RS and (b) Membership function of acidity for RT.

Figure 4.
(a) Membership function of hardness for both cultivars, (b) Membership function of SSC for both cultivars, and (c) Membership function of output (commercialization period).
Figure 4.
(a) Membership function of hardness for both cultivars, (b) Membership function of SSC for both cultivars, and (c) Membership function of output (commercialization period).

Figure 5.
DSS interface to return the best period of marketing days.

Figure 6.
Marketable period depending on conservation temperature for maximum values of hardness and acidity considered suitable for commercialization.
Figure 6.
Marketable period depending on conservation temperature for maximum values of hardness and acidity considered suitable for commercialization.

Figure 7.
Marketable period depending on conservation temperature for lowest values of hardness and acidity considered suitable for commercialization.
Figure 7.
Marketable period depending on conservation temperature for lowest values of hardness and acidity considered suitable for commercialization.

Figure 8.
Marketable period depending on conservation hardness for maximum values of temperature and acidity considered suitable for commercialization.
Figure 8.
Marketable period depending on conservation hardness for maximum values of temperature and acidity considered suitable for commercialization.

Figure 9.
Marketable period depending on conservation hardness for lowest values of temperature and acidity considered suitable for commercialization.
Figure 9.
Marketable period depending on conservation hardness for lowest values of temperature and acidity considered suitable for commercialization.

Figure 10.
Marketable period depending on conservation soluble solid content for maximum values of hardness, acidity, and temperature for commercialization.
Figure 10.
Marketable period depending on conservation soluble solid content for maximum values of hardness, acidity, and temperature for commercialization.

Figure 11.
Marketable period depending on conservation soluble solid content for lowest values of hardness, acidity, and temperature for commercialization.
Figure 11.
Marketable period depending on conservation soluble solid content for lowest values of hardness, acidity, and temperature for commercialization.

Figure 12.
Commercial period as a function of acidity for minimum and maximum hardness values, soluble solids content, and storage temperature considered suitable for commercialization including minimum and maximum hardness, soluble solids content, and a temperature of 7.7 °C.
Figure 12.
Commercial period as a function of acidity for minimum and maximum hardness values, soluble solids content, and storage temperature considered suitable for commercialization including minimum and maximum hardness, soluble solids content, and a temperature of 7.7 °C.

Figure 13.
Marketable period depending on conservation temperature for all initial values of hardness, SSC, and acidity considered suitable for commercialization for both cultivars.
Figure 13.
Marketable period depending on conservation temperature for all initial values of hardness, SSC, and acidity considered suitable for commercialization for both cultivars.


Table 1.
Architecture and specifications of the proposed fuzzy model.
| Specifications | Corresponding Value (Type) |
|---|---|
| Type of fuzzy inference system (FIS) | Mamdani |
| Inputs/output | 3/1 |
| Input membership function types | Trapezoidal |
| Output membership function types | Trapezoidal |
| Number of input membership functions | 36 for each input |
| Number of output membership functions | 36 |
| Rules weights | 1 |
| Number of fuzzy rules | 18 |
| And method | Min |
| Or method | Max |
| Implication method | Min |
| Aggregation method | Max |
| Defuzzification method | Centroid |
Table 2.
Rules for a Fuzzy model.
| No | Rules |
|---|---|
| 1 | If (Ac is Low) and (H is Low) and (SSC is Low) then (Degree is Bad) |
| 2 | If (Ac is Low) and (H is Low) and (SSC is Good) then (Degree is Bad) |
| 3 | If (Ac is Low) and (H is Good) and (SSC is Low) then (Degree is Bad) |
| 4 | If (Ac is Low) and (H is Good) and (SSC is Good) then (Degree is Bad) |
| 5 | If (Ac is Low) and (H is High) and (SSC is Low) then (Degree is Bad) |
| 6 | If (Ac is Low) and (H is High) and (SSC is Good) then (Degree is Bad) |
| 7 | If (Ac is Good) and (H is Low) and (SSC is Low) then (Degree is Bad) |
| 8 | If (Ac is Good) and (H is Low) and (SSC is Good) then (Degree is Bad) |
| 9 | If (Ac is Good) and (H is Good) and (SSC is Low) then (Degree is Bad) |
| 10 | If (Ac is Good) and (H is Good) and (SSC is Good) then (Degree is Good) |
| 11 | If (Ac is Good) and (H is High) and (SSC is Low) then (Degree is Bad) |
| 12 | If (Ac is Good) and (H is High) and (SSC is Good) then (Degree is Bad) |
| 13 | If (Ac is High) and (H is Low) and (SSC is Low) then (Degree is Bad) |
| 14 | If (Ac is High) and (H is Low) and (SSC is Good) then (Degree is Bad) |
| 15 | If (Ac is High) and (H is Good) and (SSC is Low) then (Degree is Bad) |
| 16 | If (Ac is High) and (H is Good) and (SSC is Good) then (Degree is Bad) |
| 17 | If (Ac is Good) and (H is High) and (SSC is Good) then (Degree is Bad) |
| 18 | If (Ac is High) and (H is Low) and (SSC is Low) then (Degree is Bad) |
Table 3.
Commercialization days of all the combination of initial physical-chemical parameters considered suitable for commercialization for each average temperature of conservation—Royal Summer.
Table 3.
Commercialization days of all the combination of initial physical-chemical parameters considered suitable for commercialization for each average temperature of conservation—Royal Summer.
| Royal Summer | Temperature (°C) | |||||||||||
|---|---|---|---|---|---|---|---|---|---|---|---|---|
| Hardness (kgf) | Soluble Solids Content (°Brix) | Acidity (g /L) | 0 | 1 | 2 | 3 | 4 | 5 | 6 | 7 | 8 | 9 |
| 3 | 14 | 3 | 28 | 27 | 21 | 16 | 10 | 5 | 2 | 3 | 4 | 4 |
| 3 | 14 | 4 | 30 | 29 | 23 | 17 | 11 | 5 | 2 | 3 | 4 | 4 |
| 3 | 14 | 5 | 30 | 29 | 23 | 17 | 11 | 5 | 2 | 3 | 4 | 4 |
| 3 | 15 | 3 | 28 | 27 | 23 | 20 | 16 | 12 | 9 | 8 | 6 | 6 |
| 3 | 15 | 4 | 30 | 29 | 25 | 21 | 16 | 12 | 9 | 8 | 6 | 6 |
| 3 | 15 | 5 | 30 | 29 | 23 | 17 | 12 | 6 | 4 | 5 | 6 | 6 |
| 3 | 16 | 3 | 28 | 27 | 23 | 20 | 16 | 12 | 9 | 8 | 6 | 6 |
| 3 | 16 | 4 | 30 | 29 | 25 | 21 | 16 | 12 | 9 | 8 | 6 | 6 |
| 3 | 16 | 5 | 30 | 29 | 23 | 17 | 12 | 6 | 4 | 5 | 6 | 6 |
| 4 | 14 | 3 | 28 | 27 | 21 | 16 | 10 | 5 | 2 | 3 | 4 | 4 |
| 4 | 14 | 4 | 34 | 33 | 26 | 19 | 12 | 5 | 2 | 3 | 4 | 4 |
| 4 | 14 | 5 | 34 | 33 | 26 | 19 | 12 | 5 | 2 | 3 | 4 | 4 |
| 4 | 15 | 3 | 28 | 27 | 25 | 22 | 20 | 17 | 14 | 12 | 9 | 8 |
| 4 | 15 | 4 | 34 | 33 | 29 | 26 | 22 | 18 | 14 | 12 | 9 | 8 |
| 4 | 15 | 5 | 34 | 33 | 29 | 26 | 22 | 18 | 14 | 11 | 8 | 7 |
| 4 | 16 | 3 | 28 | 27 | 25 | 22 | 20 | 17 | 14 | 12 | 9 | 8 |
| 4 | 16 | 4 | 34 | 33 | 29 | 26 | 22 | 18 | 14 | 12 | 9 | 8 |
| 4 | 16 | 5 | 34 | 33 | 29 | 26 | 22 | 18 | 14 | 11 | 8 | 7 |
| 5 | 14 | 3 | 28 | 27 | 21 | 16 | 10 | 5 | 2 | 3 | 4 | 4 |
| 5 | 14 | 4 | 34 | 33 | 26 | 19 | 12 | 5 | 2 | 3 | 4 | 4 |
| 5 | 14 | 5 | 34 | 33 | 26 | 19 | 12 | 5 | 2 | 3 | 4 | 4 |
| 5 | 15 | 3 | 28 | 28 | 26 | 24 | 23 | 21 | 18 | 14 | 11 | 10 |
| 5 | 15 | 4 | 34 | 33 | 30 | 27 | 24 | 21 | 18 | 14 | 11 | 10 |
| 5 | 15 | 5 | 34 | 33 | 30 | 27 | 24 | 21 | 18 | 13 | 8 | 7 |
| 5 | 16 | 3 | 28 | 28 | 26 | 24 | 23 | 21 | 18 | 14 | 11 | 10 |
| 5 | 16 | 4 | 34 | 33 | 30 | 27 | 24 | 21 | 18 | 14 | 11 | 10 |
| 5 | 16 | 5 | 34 | 33 | 30 | 27 | 24 | 21 | 18 | 13 | 8 | 7 |
| 6 | 14 | 3 | 28 | 28 | 27 | 27 | 26 | 25 | 21 | 13 | 6 | 4 |
| 6 | 14 | 4 | 34 | 34 | 32 | 30 | 28 | 26 | 21 | 13 | 6 | 4 |
| 6 | 14 | 5 | 34 | 34 | 32 | 30 | 28 | 26 | 21 | 13 | 6 | 4 |
| 6 | 15 | 3 | 28 | 28 | 27 | 27 | 26 | 25 | 23 | 18 | 13 | 12 |
| 6 | 15 | 4 | 34 | 34 | 32 | 30 | 28 | 26 | 23 | 18 | 13 | 12 |
| 6 | 15 | 5 | 34 | 34 | 32 | 30 | 28 | 26 | 22 | 15 | 8 | 7 |
| 6 | 16 | 3 | 28 | 28 | 27 | 27 | 26 | 25 | 23 | 18 | 13 | 12 |
| 6 | 16 | 4 | 34 | 34 | 32 | 30 | 28 | 26 | 23 | 18 | 13 | 12 |
| 6 | 16 | 5 | 34 | 34 | 32 | 30 | 28 | 26 | 22 | 15 | 8 | 7 |
| Average | 31 | 31 | 27 | 23 | 20 | 16 | 13 | 10 | 8 | 7 | ||
| Standard deviation | 3 | 3 | 3 | 5 | 7 | 8 | 8 | 5 | 3 | 3 | ||
| First quartile | 28 | 28 | 25 | 19 | 12 | 6 | 4 | 5 | 6 | 4 | ||
| Third quartile | 34 | 33 | 30 | 27 | 25 | 22 | 19 | 14 | 9 | 8 | ||
| Interquartile Range | 6 | 5 | 6 | 8 | 13 | 16 | 15 | 10 | 4 | 4 | ||
Table 4.
Commercialization days of all the combinations of initial physical-chemical parameters considered suitable for commercialization for each average temperature of conservation—Royal Time.
Table 4.
Commercialization days of all the combinations of initial physical-chemical parameters considered suitable for commercialization for each average temperature of conservation—Royal Time.
| Royal Time | Temperature (°C) | |||||||||||
|---|---|---|---|---|---|---|---|---|---|---|---|---|
| Hardness (kgf) | Soluble Solids Content (°Brix) | Acidity (g /L) | 0 | 1 | 2 | 3 | 4 | 5 | 6 | 7 | 8 | 9 |
| 3 | 14 | 6 | 2 | 3 | 10 | 17 | 24 | 31 | 29 | 18 | 8 | 6 |
| 3 | 14 | 7 | 2 | 3 | 10 | 17 | 24 | 31 | 28 | 17 | 6 | 4 |
| 3 | 14 | 8 | 2 | 3 | 10 | 17 | 24 | 31 | 28 | 16 | 4 | 2 |
| 3 | 14 | 9 | 0 | 0 | 0 | 0 | 0 | 0 | 0 | 0 | 0 | 0 |
| 3 | 15 | 6 | 2 | 3 | 10 | 17 | 24 | 31 | 29 | 18 | 8 | 6 |
| 3 | 15 | 7 | 2 | 3 | 10 | 17 | 24 | 31 | 28 | 17 | 6 | 4 |
| 3 | 15 | 8 | 2 | 3 | 10 | 17 | 24 | 31 | 28 | 16 | 4 | 2 |
| 3 | 15 | 9 | 0 | 0 | 0 | 0 | 0 | 0 | 0 | 0 | 0 | 0 |
| 3 | 16 | 6 | 2 | 3 | 10 | 17 | 24 | 31 | 29 | 18 | 8 | 6 |
| 3 | 16 | 7 | 2 | 3 | 10 | 17 | 24 | 31 | 28 | 17 | 6 | 4 |
| 3 | 16 | 8 | 2 | 3 | 10 | 17 | 24 | 31 | 28 | 16 | 4 | 2 |
| 3 | 16 | 9 | 0 | 0 | 0 | 0 | 0 | 0 | 0 | 0 | 0 | 0 |
| 4 | 14 | 6 | 20 | 21 | 24 | 27 | 30 | 33 | 29 | 20 | 10 | 8 |
| 4 | 14 | 7 | 20 | 21 | 24 | 27 | 30 | 33 | 29 | 20 | 10 | 8 |
| 4 | 14 | 8 | 3 | 4 | 11 | 18 | 24 | 31 | 28 | 16 | 4 | 2 |
| 4 | 14 | 9 | 0 | 1 | 8 | 15 | 21 | 28 | 25 | 14 | 2 | 0 |
| 4 | 15 | 6 | 25 | 25 | 27 | 29 | 31 | 33 | 29 | 20 | 10 | 8 |
| 4 | 15 | 7 | 25 | 25 | 27 | 29 | 31 | 33 | 29 | 20 | 10 | 8 |
| 4 | 15 | 8 | 25 | 25 | 27 | 29 | 31 | 33 | 28 | 16 | 4 | 2 |
| 4 | 15 | 9 | 0 | 1 | 8 | 15 | 21 | 28 | 25 | 14 | 2 | 0 |
| 4 | 16 | 6 | 25 | 25 | 27 | 29 | 31 | 33 | 29 | 20 | 10 | 8 |
| 4 | 16 | 7 | 25 | 25 | 27 | 29 | 31 | 33 | 29 | 20 | 10 | 8 |
| 4 | 16 | 8 | 25 | 25 | 27 | 29 | 31 | 33 | 28 | 16 | 4 | 2 |
| 4 | 16 | 9 | 0 | 1 | 8 | 15 | 21 | 28 | 25 | 14 | 2 | 0 |
| 5 | 14 | 6 | 20 | 21 | 24 | 27 | 30 | 33 | 29 | 21 | 12 | 10 |
| 5 | 14 | 7 | 20 | 21 | 24 | 27 | 30 | 33 | 29 | 21 | 12 | 10 |
| 5 | 14 | 8 | 3 | 4 | 11 | 18 | 24 | 31 | 29 | 21 | 12 | 10 |
| 5 | 14 | 9 | 0 | 1 | 8 | 15 | 21 | 28 | 25 | 14 | 2 | 0 |
| 5 | 15 | 6 | 34 | 34 | 34 | 34 | 34 | 34 | 29 | 21 | 12 | 10 |
| 5 | 15 | 7 | 34 | 34 | 34 | 34 | 34 | 34 | 29 | 21 | 12 | 10 |
| 5 | 15 | 8 | 34 | 34 | 34 | 34 | 34 | 34 | 29 | 21 | 12 | 10 |
| 5 | 15 | 9 | 34 | 34 | 33 | 33 | 32 | 31 | 25 | 14 | 2 | 0 |
| 5 | 16 | 6 | 34 | 34 | 34 | 34 | 34 | 34 | 29 | 21 | 12 | 10 |
| 5 | 16 | 7 | 34 | 34 | 34 | 34 | 34 | 34 | 29 | 21 | 12 | 10 |
| 5 | 16 | 8 | 34 | 34 | 34 | 34 | 34 | 34 | 29 | 21 | 12 | 10 |
| 5 | 16 | 9 | 34 | 34 | 33 | 33 | 32 | 31 | 25 | 14 | 2 | 0 |
| 6 | 14 | 6 | 20 | 21 | 23 | 26 | 29 | 32 | 29 | 21 | 14 | 12 |
| 6 | 14 | 7 | 20 | 21 | 23 | 26 | 29 | 32 | 29 | 21 | 14 | 12 |
| 6 | 14 | 8 | 3 | 4 | 11 | 17 | 23 | 30 | 29 | 21 | 14 | 12 |
| 6 | 14 | 9 | 0 | 1 | 8 | 15 | 21 | 28 | 25 | 14 | 2 | 0 |
| 6 | 15 | 6 | 34 | 34 | 34 | 34 | 33 | 33 | 29 | 21 | 14 | 12 |
| 6 | 15 | 7 | 34 | 34 | 34 | 34 | 33 | 33 | 29 | 21 | 14 | 12 |
| 6 | 15 | 8 | 34 | 34 | 34 | 34 | 33 | 33 | 29 | 21 | 14 | 12 |
| 6 | 15 | 9 | 34 | 34 | 33 | 33 | 32 | 31 | 25 | 14 | 2 | 0 |
| 6 | 16 | 6 | 34 | 34 | 34 | 34 | 33 | 33 | 29 | 21 | 14 | 12 |
| 6 | 16 | 7 | 34 | 34 | 34 | 34 | 33 | 33 | 29 | 21 | 14 | 12 |
| 6 | 16 | 8 | 34 | 34 | 34 | 34 | 33 | 33 | 29 | 21 | 14 | 12 |
| 6 | 16 | 9 | 34 | 34 | 33 | 33 | 32 | 31 | 25 | 14 | 2 | 0 |
| Average | 18 | 18 | 21 | 24 | 27 | 30 | 26 | 17 | 8 | 6 | ||
| Standard deviation | 15 | 14 | 12 | 10 | 8 | 8 | 7 | 5 | 5 | 5 | ||
| First quartile | 2 | 3 | 10 | 17 | 24 | 31 | 27 | 16 | 4 | 2 | ||
| Third quartile | 34 | 34 | 33 | 33 | 32 | 33 | 29 | 21 | 12 | 10 | ||
| Interquartile Range | 32 | 31 | 23 | 16 | 8 | 2 | 2 | 6 | 9 | 9 | ||
Publisher’s Note: MDPI stays neutral with regard to jurisdictional claims in published maps and institutional affiliations. |
© 2022 by the authors. Licensee MDPI, Basel, Switzerland. This article is an open access article distributed under the terms and conditions of the Creative Commons Attribution (CC BY) license (https://creativecommons.org/licenses/by/4.0/).
Share and Cite
MDPI and ACS Style
Magalhães, B.; Gaspar, P.D.; Corceiro, A.; João, L.; Bumba, C. Fuzzy Logic Decision Support System to Predict Peaches Marketable Period at Highest Quality. Climate 2022, 10, 29. https://0-doi-org.brum.beds.ac.uk/10.3390/cli10030029
AMA Style
Magalhães B, Gaspar PD, Corceiro A, João L, Bumba C. Fuzzy Logic Decision Support System to Predict Peaches Marketable Period at Highest Quality. Climate. 2022; 10(3):29. https://0-doi-org.brum.beds.ac.uk/10.3390/cli10030029
Chicago/Turabian StyleMagalhães, Bianca, Pedro Dinis Gaspar, Ana Corceiro, Luzolo João, and César Bumba. 2022. "Fuzzy Logic Decision Support System to Predict Peaches Marketable Period at Highest Quality" Climate 10, no. 3: 29. https://0-doi-org.brum.beds.ac.uk/10.3390/cli10030029
Note that from the first issue of 2016, this journal uses article numbers instead of page numbers. See further details here.