
Impact of Dietary Meat and Animal Products on GHG Footprints: The UK and the US


Sibley School of Mechanical and Aerospace Engineering, Cornell University, Ithaca, NY 14853, USA
Climate 2022, 10(3), 43; https://0-doi-org.brum.beds.ac.uk/10.3390/cli10030043
Submission received: 25 February 2022
/
Revised: 12 March 2022
/
Accepted: 14 March 2022
/
Published: 17 March 2022
(This article belongs to the Section Climate and Environment)
Abstract
:Direct and indirect greenhouse gas (GHG) emissions from the ~30+ billion animals consumed as food each year contribute ~14–16% of the global total. The aim of this research is to determine the contribution of meat and animal products to individual GHG footprints. Top-down estimates of GHG emissions from each livestock species are determined using livestock numbers, types, and region-specific emission factors. Comparing livestock emissions with those from individual countries, cattle rank as the third largest emitter after China and the United States (US). The largest uncertainty in these emissions calculations is in the range of emissions factors. Global top-down calculations indicate that the per capita GHG footprint from livestock emissions alone are approximately 1 tCO2eyr−1. For the United Kingdom (UK) and the US, the calculated GHG livestock-related footprints are 1.1 tCO2eyr−1 and 1.6 tCO2eyr−1 per person, respectively. Bottom-up calculations focused on the UK and the US from consumption figures indicated emissions related to meat consumption are approximately 1.3–1.5 tCO2eyr−1 per person. Comparing dietary changes with other ways of reducing GHG footprints indicates removing dietary meat is similar to avoiding one long-haul flight each year and a larger reduction than driving 100 miles less each week.
1. Introduction
Greenhouse gas emissions (GHGs) increased to a record high of 52.4 ± 5.2 GtCO2eyr−1 (59.1 GtCO2eyr−1 if land-use contributions are included) in 2019 [1]. Fossil fuel combustion related CO2 emissions are 38.0 ± 1.9 GtCO2yr−1. Atmospheric CO2 concentrations are expected to continue to increase, leading to a ~3.2 °C global temperature increase by the end of the century [1]. There has been considerable progress in emissions reductions from some sectors, such as introducing low-carbon electricity generation [2], but much slower progress in areas such as lower carbon transport [3]. Low-carbon diets have received even less attention despite estimates that GHG emissions from the food supply chain may be up to 13.7 GtCO2eyr−1, i.e., approximately 26% of the total [4].
The overall objective of this research is to quantify GHG emissions from livestock production/meat consumption at the personal level and to compare GHG contributions from diet with other activities over which individuals have some control. Within that context, a secondary objective is to compare the magnitude of personal GHG footprints from diet using both top-down and bottom-up approaches. Total contributions to GHG emissions from food vary widely by country and are estimated in 2009 as 14% for the UK and 8% for the US [5] on which the analyses presented are focused.
1.1. Emissions of Greenhouse Gases from Agriculture/Food Supply
GWP is the time-accumulated radiative forcing of a gas relative to carbon dioxide (CO2) [6]. For example, CH4 has a lifetime of 12.4 years and a GWP of 28 over a 100 year period, while N2O has a lifetime of 121 years and a GWP of 265 [7]. Carbon dioxide (CO2) is the main GHG (64% of radiative forcing (RF)), but methane (CH4) contributes 17% RF and nitrous oxide (N2O) (6% RF) [7]. To simplify issues arising from complications of the radiative potential of different gases or their different lifetimes, emissions are often expressed as carbon dioxide equivalents, CO2e.
Agriculture is responsible for ~22–26% of global warming potential (GWP) arising from GHG emissions [4,8] with the food supply chain accounting for up to 37% [8]. Estimates of GHG emissions attributable to the ~17–24 billion domestic animals assigned as food at any time (Table 1 and Figure 1), have a wide range from 8% to 26% of total GHG emissions [4,9,10], i.e., 4.7–13.7 GtCO2eyr−1 depending on the assumptions and the time range. A recent analysis found that food production GHG emissions are 17.3 ± 1.7 GtCO2eyr−1, 57% from animal-based food (including livestock feed) [11].
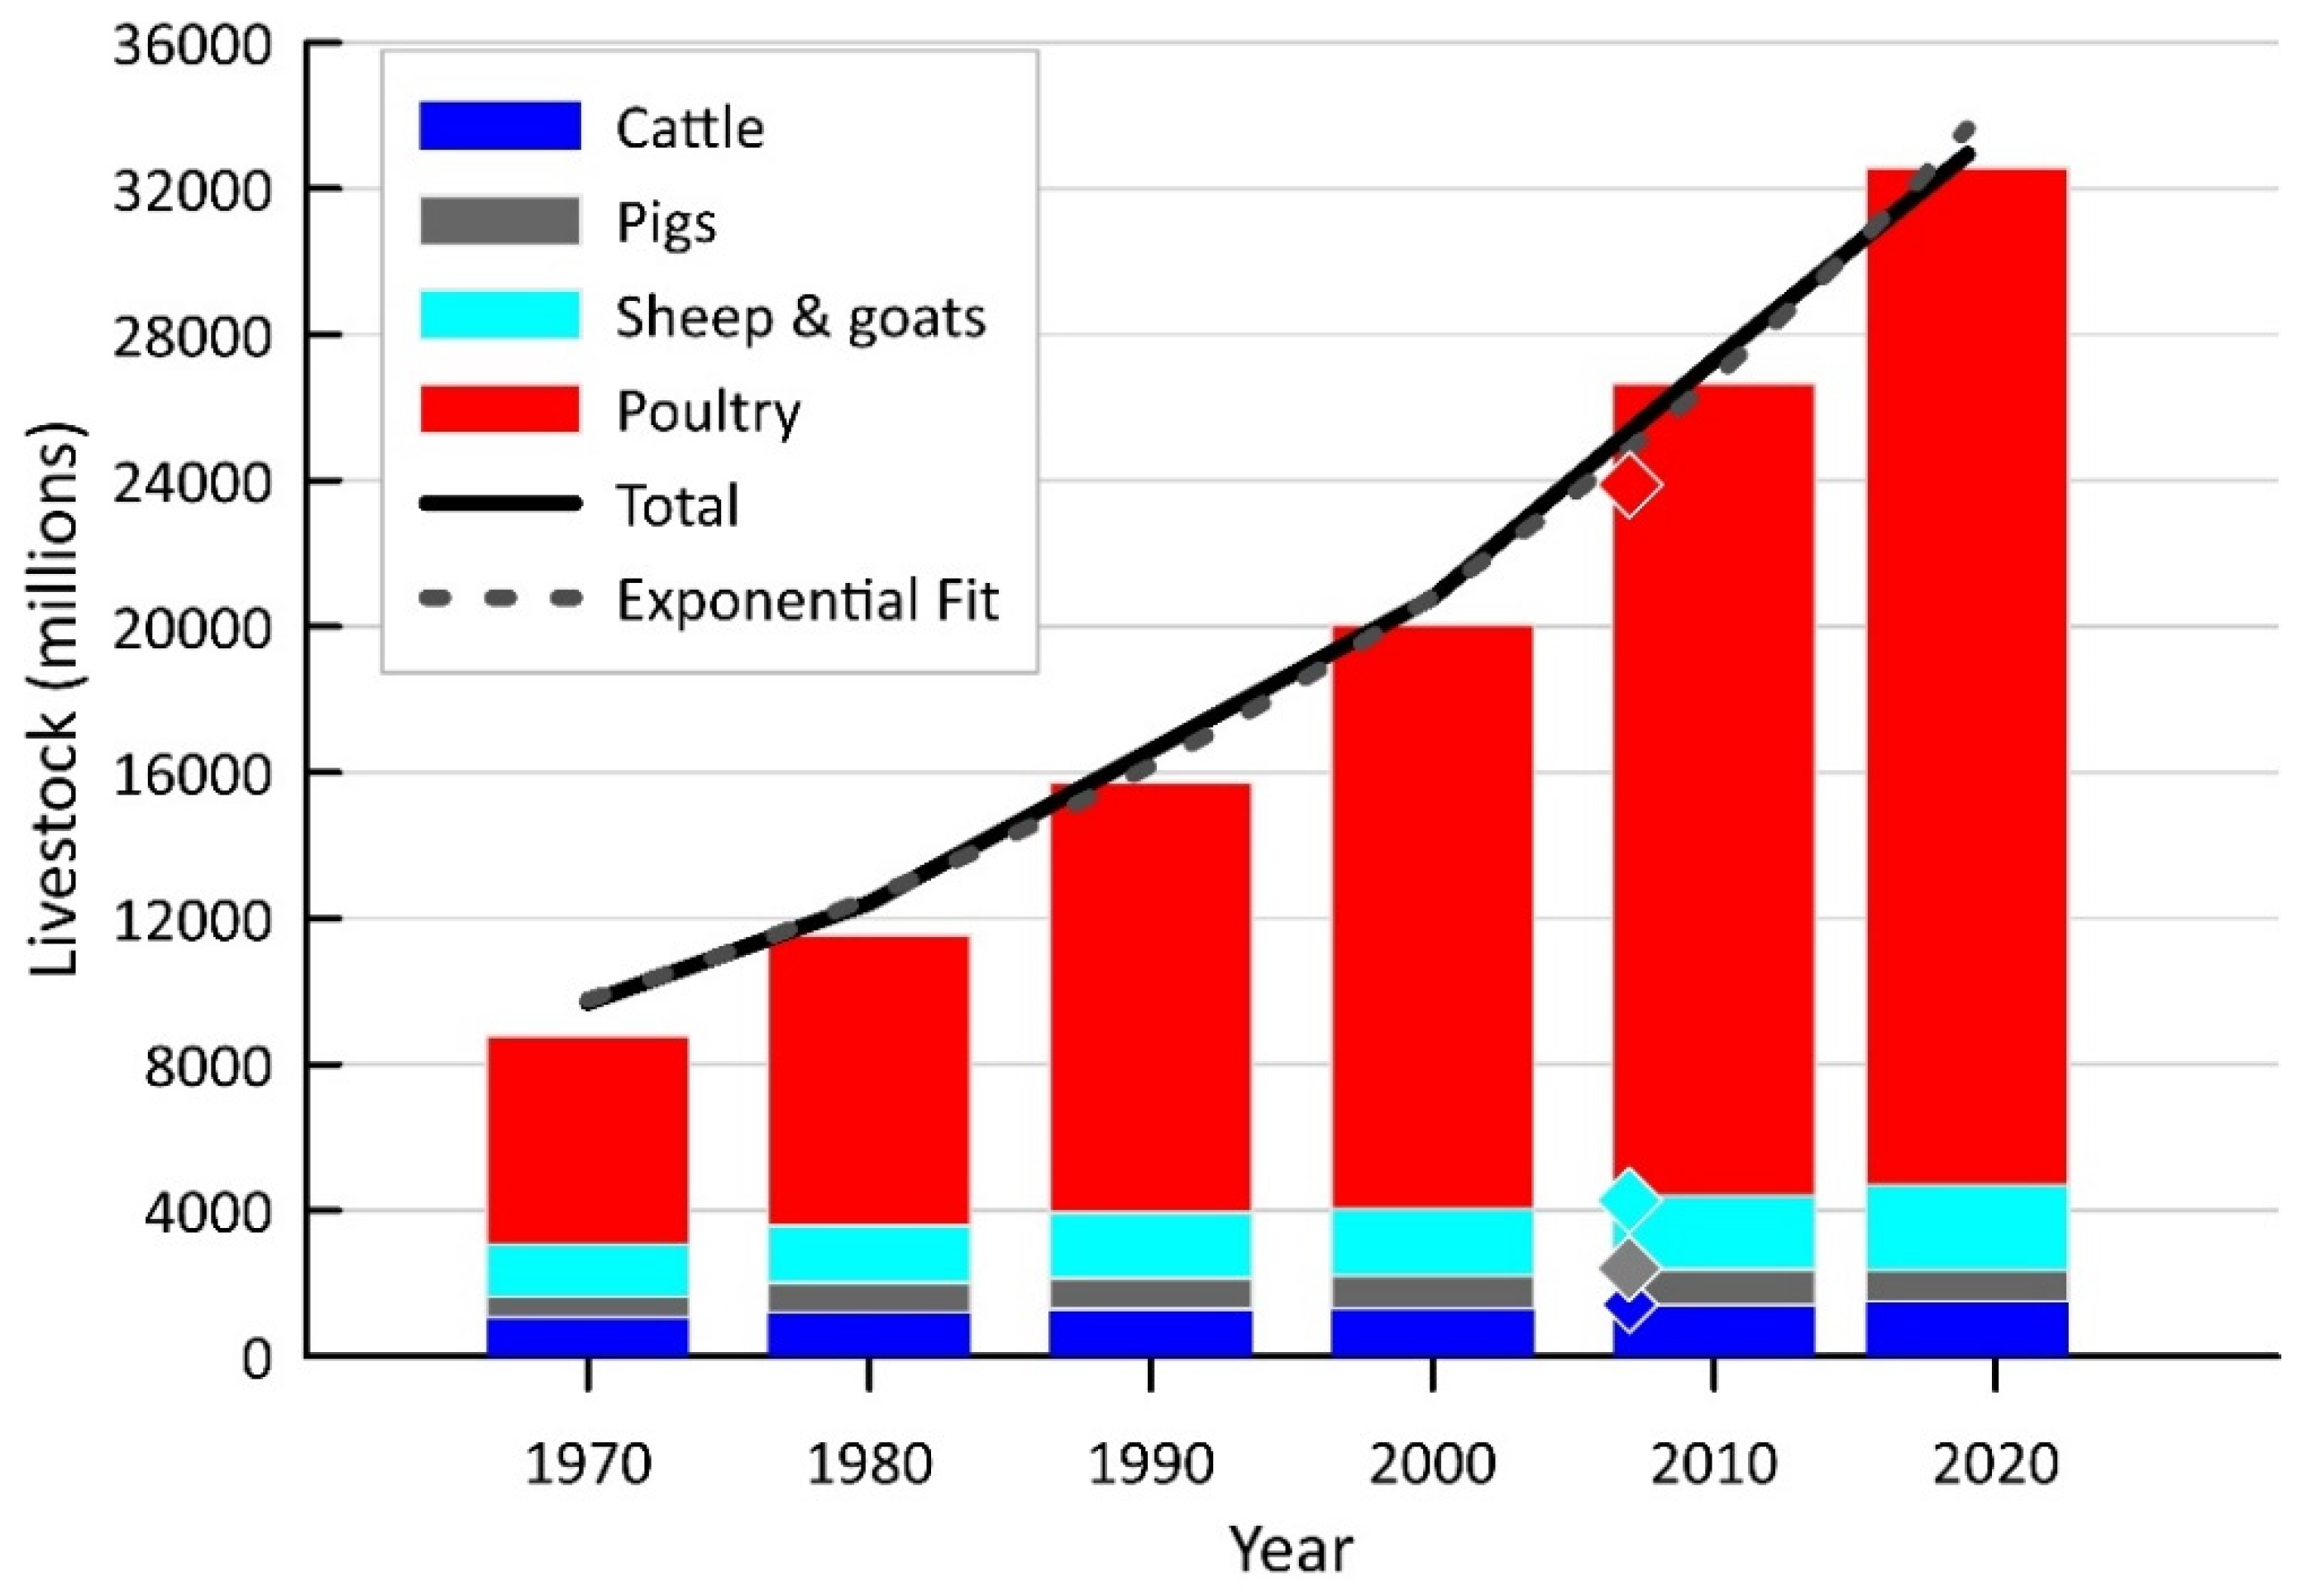
Global numbers of livestock have tripled over the last 50 years to 2019 [12] (Table 1 and Figure 1) and now represent ~60% of total mammalian biomass [13]. The growth in the number of livestock approximates an exponential fit (Figure 1) and represents an increase in the number of livestock per head of human population from 2.6 in 1970 to 4.3 in 2019 (Table 1).
Globally, agriculture and waste are the dominant source (62%) of anthropogenic (human-caused) CH4 emissions, the total of which is larger than all natural CH4 emissions [6]. The digestive system of ruminants (cows, sheep, goats, and buffalo) ferment and decompose food, producing CH4 in a process known as enteric fermentation [15]. Ruminants emit about half of the agricultural CH4 emissions [6]. Agriculture is also the largest anthropogenic source of N2O [7]. Livestock on managed pastures and range accounted for more than half of anthropogenic N2O emissions from agriculture [8]. Livestock are a major contributor to overall global warming, e.g., including not just direct emissions but also pasture conversion brings “the warming directly attributable to livestock to 23% of the total warming in 2010” [16]. Emissions include methane 1.6–2.7, N2O 1.3–2.0, and land use for animal feed and pasture 1.6 GtCO2eyr−1 [8].
1.2. Determining GHG Emissions from Livestock: Top-Down
Reports from national governments on livestock statistics are compiled into the Global Livestock Environmental Assessment Model (GLEAM) database by the Food and Agricultural Organization (FAO) [17]. From GLEAM [18], the total emissions, including feed, from livestock globally are approximately 7.5 GtCO2e, around two-thirds from meat and one-third from milk and eggs. Emissions from ruminants dominate with ~60% from cattle, while emissions from chickens are ~10% because of the sheer number involved (around 20 billion at any time) (Table 1 and Figure 1) [18].
To determine direct emissions from livestock, emissions factors for enteric fermentation and manure management are typically used [18]. Indirect emissions associated with feed consumed, transport, processing, or on farm energy use can then be added. The land-use and farm stages account for 80% of emissions from food, while transportation accounts for less than 10% and the remainder is from processing, packaging, and retail [19,20]. For meat products, the land-use, farm, and feed contributions are higher, e.g., for beef, transport-related emissions are less than 1% [19].
Emissions factors associated with different food products are shown in Table 2. Emissions from livestock are also dependent on production methods, such as the living conditions, and the approach to issues such as manure management. Thus, emission rates vary by region (Table 2). Beef production in North America uses feed that has high emission intensities and manure management in intensive dairy units and feedlots. In contrast, beef in Western Europe mainly comes from dairy herds with lower emission intensities [21].
1.3. Determining Footprints from Diet or Consumption: Bottom-Up
The most common approach to determining a carbon or GHG footprint is to work bottom-up, assigning emissions from different activities performed by individuals. Typical activities include travel, heating, and electricity use, but not all footprints include the contributions from food/diet.
According to a 2014 study of UK diets [28], the diet of heavy meat eaters are responsible for 2.6 tCO2eyr−1 per person, while vegetarians had approximately half the CO2 footprint (1.4 tCO2eyr−1 per person) and vegans a lower total of 1.1 tCO2eyr−1 per person. These are based on the amounts of food people ate according to a food diary and are a real bottom-up approach. A review of vegan diets in the UK estimated approximately 51% less GHG emissions versus a meat-based diet [29]. Reductions in GHG footprint (per person) from implementing a vegetarian diet are estimated at 0.5 or 0.9 tCO2eyr−1 per year from a vegan diet, while reducing food waste can reduce totals by a 0.3 tCO2eyr−1, and eating local, organic food by 0.5 tCO2eyr−1 per person [1].
Results from a population-based survey in the US indicated that the food-related GHG footprint in the US is 3.88–4.64 kgCO2e per person per day or 1.4–1.7 tCO2eyr−1 per person [30]. A cross-sectional analysis reported that replacing meat in the diet could reduce food-related GHG emissions by almost 50% [30]. A review of a number of carbon footprint calculators relating to diet found an average US footprint of 1.5–3.72 tCO2eyr−1 per person [31]. Furthermore, the transition from a high meat to a vegetarian diet reduces the GHG footprint by 0.28–1.56 tCO2eyr−1 per person and from vegetarian to vegan a further 0.1–0.7 tCO2eyr−1 per person [31].
The relative GHG footprints of vegetarian versus non-vegetarian diets are consistent with food-related emissions, particularly for diets that include meat from ruminants (Table 2). Of the non-animal products reviewed in Table 2, only vegetable oils, rice, sugar, and nuts have average GHG emissions greater than 2.0 kgCO2e/kg [22,27]. In all but one study in Table 2, all meat products exceeded 4.0 kgCO2e/kg (the lowest reported emission factor for poultry) with beef at an average of 48.6 and mutton/goat at 74.9 kgCO2e/kg [22,27]. Based on a “meta-analysis of life cycle assessments that includes 742 agricultural systems and over 90 unique foods”, it was stated that “ruminant meat has impacts ~100 times those of plant-based foods” [22].
In the following section, we outline the methods applied here to make new GHG footprints for top-down calculations from total emissions and bottom-up footprints from consumption figures.
2. Materials and Methods
2.1. Greenhouse Gas Footprints
A GHG footprint is a person’s or a country’s share of annual GHG emissions. There are essentially two different methods to determine GHG footprints employed in this work:
- (i)
- Using a top-down approach, a GHG footprint, F, can be calculated by dividing total emissions, E, by the total population, N:For multiple contributions from different sectors, the footprint is calculated using the sum of all emissions, where ES are the emissions from different sectors or species, and the sector population is NS:Using livestock numbers and emissions factors, total GHG emissions from livestock (by country or region or from a specific species) are calculated for the derivation of GHG footprints from meat consumption.
- (ii)
- The bottom-up approach aggregates goods or services consumed with associated emissions factors to compile GHG emissions.
There are numerous sources for the data on which these studies are based. To clarify the processes used here, the methods are shown schematically in Figure 2 and described in detail in the following sections.
2.2. Greenhouse Gas Footprints: Top-Down
Within the top-down framework, there are several approaches to determining country GHG footprints used here that are described in the following sub-sections.
2.2.1. Country GHG Emissions Statistics
GHG emissions from agricultural sectors are reported by many government agencies, but the methods used and the sectors included exhibit marked inconsistencies. Here, statistics are used from the UK from the Department for Environment, Food and Rural Affairs (DEFRA) [32,33]. However, approximately half of UK animal feed is imported, and less than half of the food consumed in the UK is produced in the UK [25,32,34]. The contribution from imports of food is considered in Section 2.3. A detailed study of GHG emissions associated with imported animal feed used in the UK (such as soya beans from the US and Brazil) suggested 64% of feed related GHG emissions for UK agricultural feed occurs abroad [34]. To account for this GHG totals (in MtCO2e) associated with UK agricultural soil emissions are increased in Section 3.2.1 from 16.1 to 25.2 MtCO2eyr−1 using the following equation:
where the amounts of each GHG associated with soil emissions (shown in brackets in Equation (3) in MtCO2eyr−1) are taken from [33].
Reported livestock GHG emissions from the US Department of Agriculture (USDA) [35] (Table 3) exclude emissions from crops grown for livestock feed that are estimated to use 75% of US cropland [36]. In Section 3.2.1, US livestock GHG emissions are corrected by adding these emissions using a simple multiplier of 0.75 of GHG emissions from crops. The US imports less than 20% of food consumed, less than 10% of meat/animal products, and the value of agricultural exports and imports is nearly equal [37]. Thus, for the US, no corrections or other methods are applied here to account for food imports.
2.2.2. Scaling Regional Estimates from the GLEAM Model
Detailed emissions data by livestock species are available by region from the GLEAM model. To determine emissions for the UK and the US, regional livestock emissions can be scaled according to the number of ruminant livestock in each country compared to the region. This simple approach can be justified on the basis that ruminant animals dominate livestock GHG emissions [38]:
where:
FGR are the regional livestock emissions from GLEAM;
FG are the scaled country livestock GHG emissions;
NSC is the approximate number of ruminant livestock in the country;
NSR is the number of ruminant livestock in the GLEAM region.
2.2.3. Using Emissions Factors Combined with Livestock Statistics
For a more detailed approach to calculate total emissions, F, globally or by country, livestock numbers (from Figure 1 and Table 1) for each species type, NS, are multiplied by the emissions factors for enteric fermentation for each species, EFS. A correction factor to convert from emissions of CH4 to CO2e is needed, CCH4, which is the GWP of 28 [7]. The current FAO breakdown of livestock emissions is 44% enteric fermentation, 41% feed, 10% manure management, and 5% energy (farm and non-farm) [18] (Figure 3). Thus, to account for not just enteric fermentation but also indirect livestock-related emissions, a factor T of 2.27 (i.e., 1/0.44) is applied in Equation (5) [18]:
where:
F is the total emissions;
Ns is the number for each livestock species;
EFs is the emissions factor for enteric fermentation for each species;
CCH4 accounts for GWP and is 28 [39];
T is the factor for manure management, feed, and energy use [18].
To apply Equation (5) for the UK and the US in Section 3.2, the following sources are used:
- EFs are IPCC Tier 1 regional emission factors of CH4 per head for enteric fermentation. For western Europe/US 126/138 kg·yr−1 for dairy cows, 52/64 kg·yr−1 for beef or heifers, respectively [15]. For lamb/sheep EFs are 8 kg·yr−1 and for poultry 0.26 kg·yr−1 [8]. For pigs total emissions factors of CH4 of 5.5 kg·yr−1 global average for pigs, 7/12 kg·yr−1 for Western Europe/US without correction for enteric fermentation.
2.3. Determining Food Carbon Footprints: Bottom-Up
The bottom-up GHG footprint for the UK is calculated here based on consumption figures (in £ or in emissions of CO2e) of goods and services in 106 categories from DEFRA [42]. The advantage of using this approach rather than top-down is that all emissions can be aggregated including those from imported goods. The data set shows that, in 2017, of the total GHG emissions associated with the consumption of goods and services in the UK, 414.4 of 772 MtCO2eyr−1 are UK based, the remaining 47% are associated with imports. To determine food emissions and separate other categories, consumption from all goods and services are aggregated to six types:
- Food—all food plus restaurants;
- Personal—drinks, alcohol, tobacco, and clothing and footwear;
- Home—DIY, furniture, textiles, and appliances;
- Utilities—water, gas, and electricity;
- Transport—vehicles, public transport;
- Services—medical, hospitals, education, recreation, and other categories not given above.
Over 300 GHG emissions factors are provided (in kgCO2e per £) by DEFRA [42]. To give some examples, the highest emitters in terms of GHG emissions are shown in Table 4. This gives meat products as the seventh largest in terms of GHG emissions per £ spent.
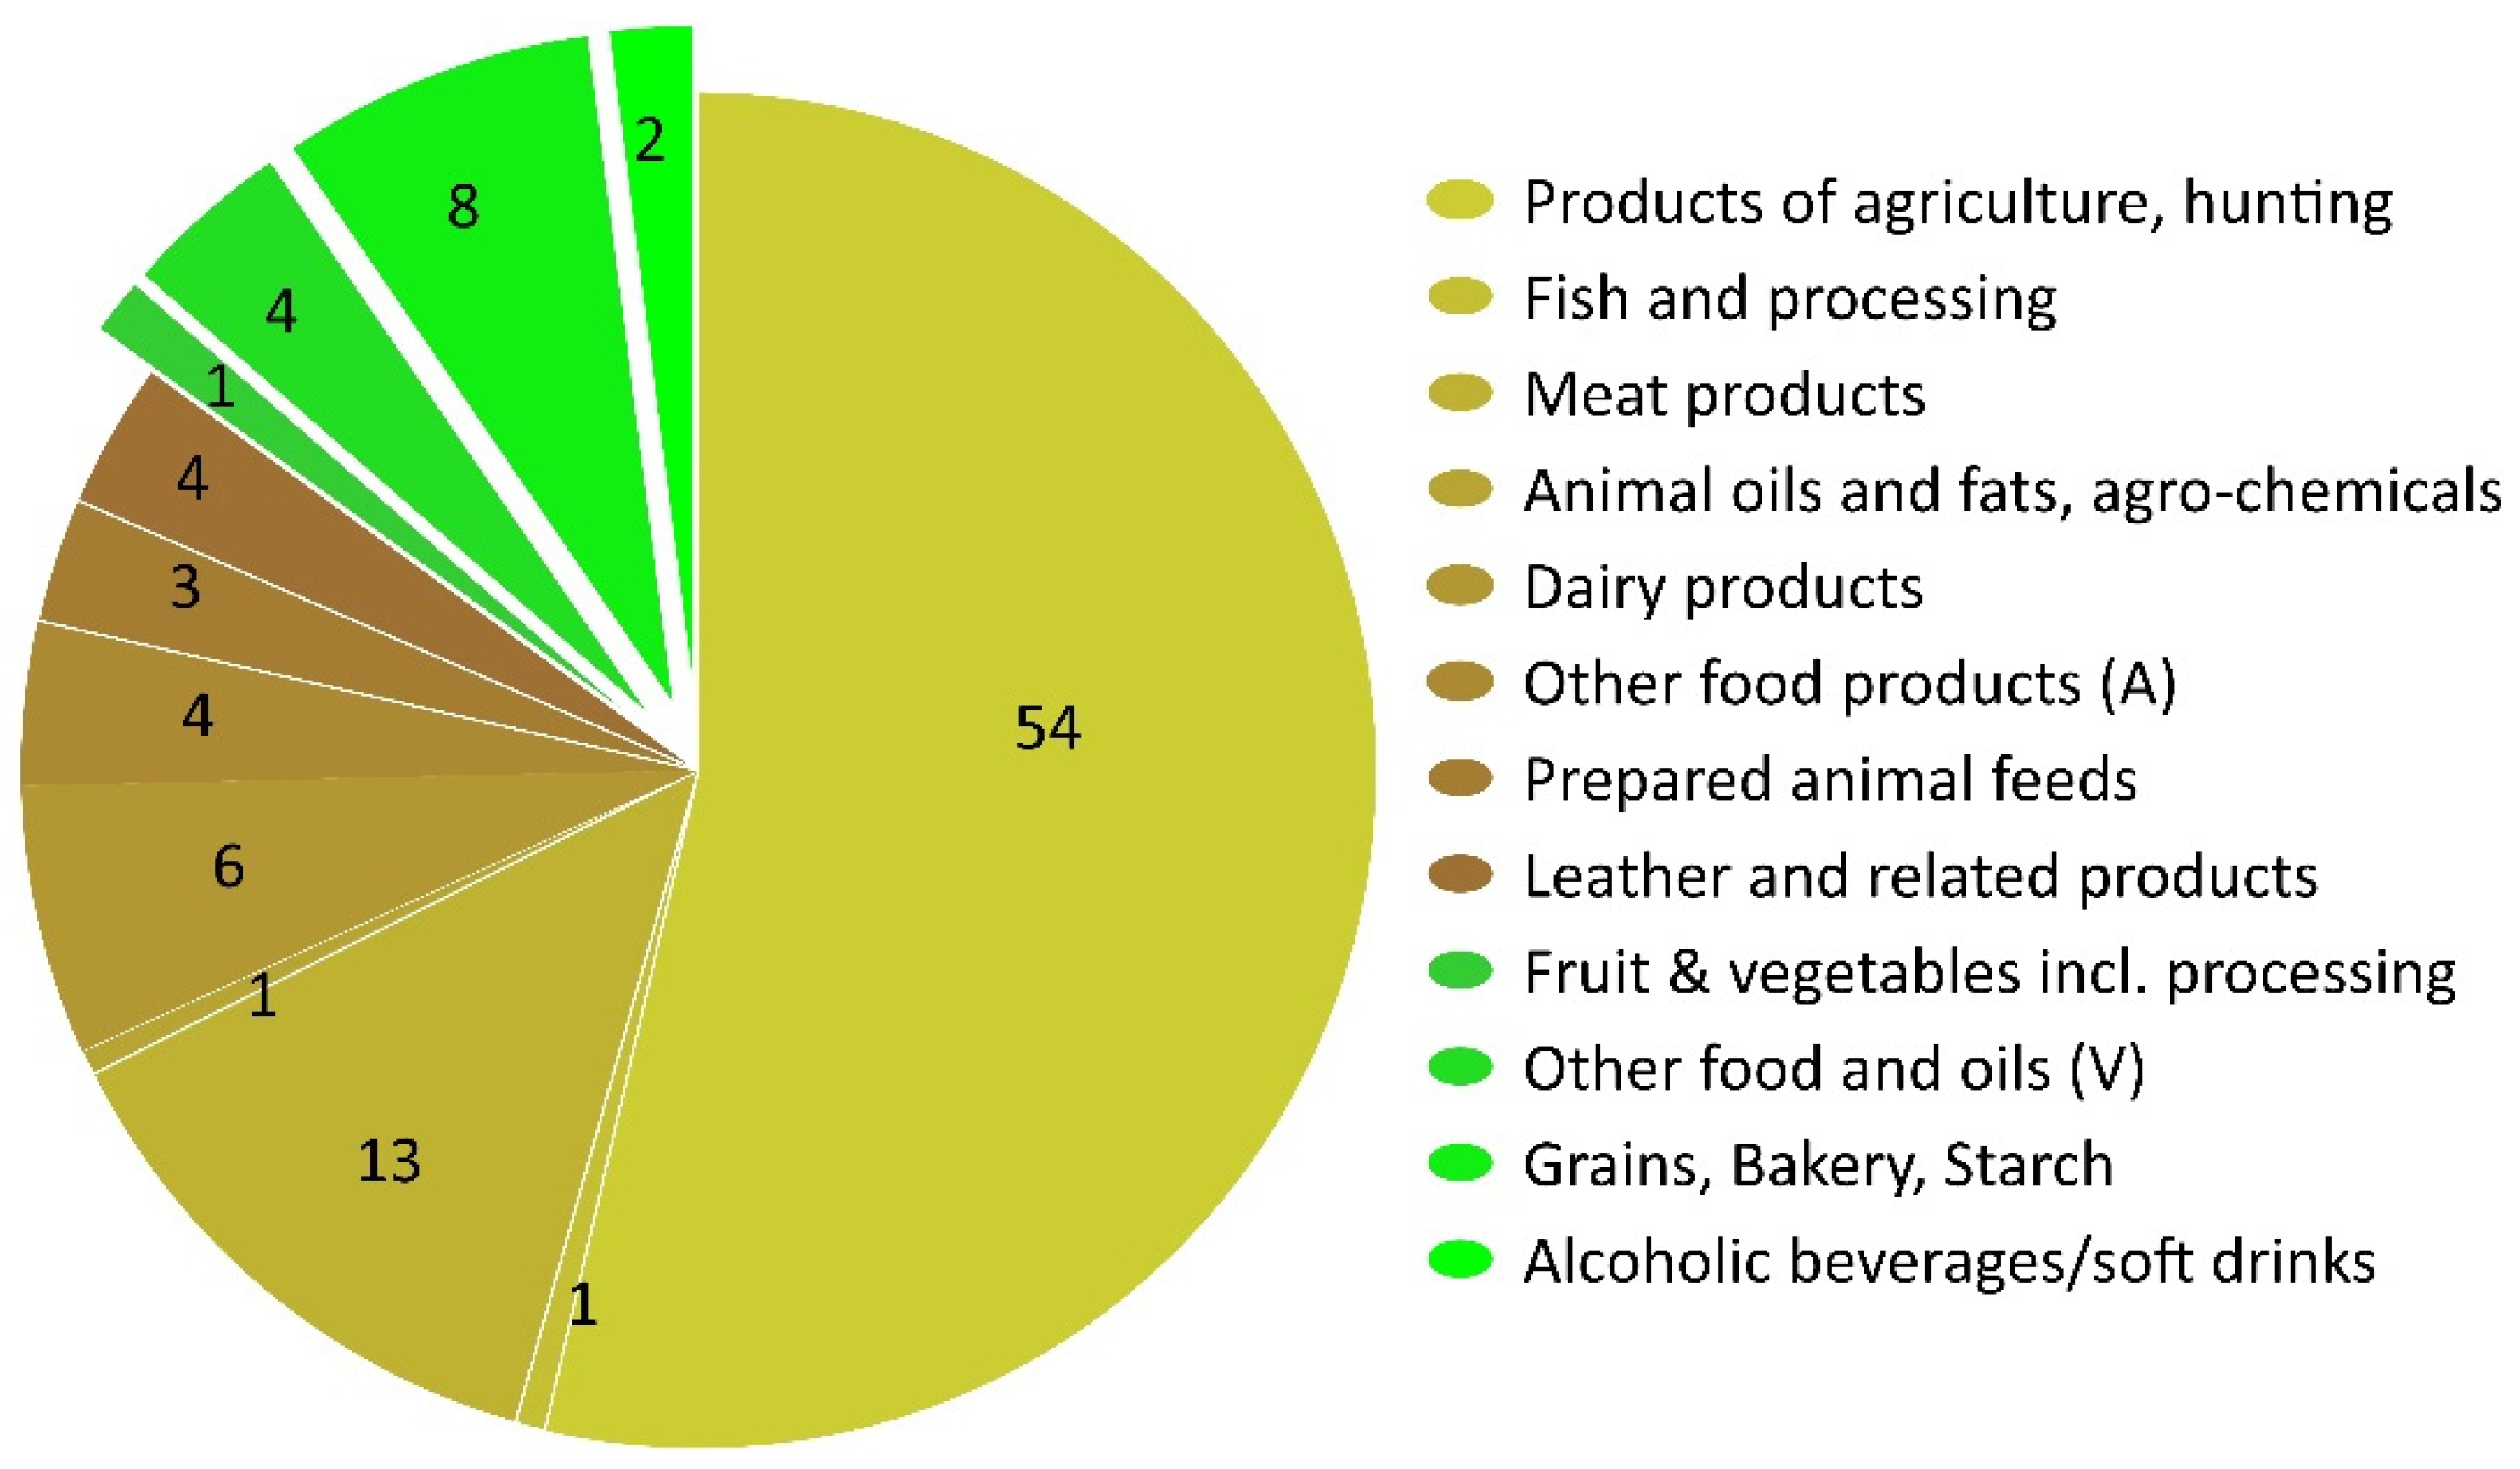
The UK food total emissions are 103.4 MtCO2eyr−1 (13.3%) including imports [42]. To assess the contribution from livestock agriculture and meat products, a more detailed breakdown of emissions from food is made by aggregating the “animal-derived product’ vs. ‘other’ categories (as shown in Figure 4). This division by categories is used to assign the food footprint as 85% animal-derived/15% other.
Equivalent data for the bottom-up consumption method could not be located for the US. Therefore, comparisons for the US rely on bottom-up figures for GHG footprints from the literature based on methods such as analyses of food diaries and dietary recommendations.
3. Results
3.1. Emissions of Greenhouse Gases from All Activities
Using total global GHG emissions (52.4 ± 5.2 GtCO2eyr−1) for 2019 [1] and a global population number of 7.8 billion [14], the average global GHG footprint per person is 6.7 ± 0.7 or 7.6 tCO2eyr−1 if land use contributions are included. Total GHG emissions (all sources) for 2018 are slightly lower at 49.3 GtCO2e, but are available on a country basis from the World Resources Institute (WRI) [43]. Using Equation (1) gives a global average footprint per person of 6.3 tCO2eyr−1.
From the WRI data, for the UK total GHG emissions are 441 MtCO2eyr−1 [43], using a population of 67.0 million people [14] gives a total GHG footprint (per person) of 6.6 tCO2eyr−1. For the US, GHG emissions are 5794 MtCO2eyr−1 [43], using a population figure of 331.0 million [14], the GHG footprint (per person) is 17.5 tCO2eyr−1.
As noted in Section 2.3 above, a country’s own reports of emissions may include those associated with imports. The UK government statistics indicated total GHG emissions as 772 MtCO2eyr−1 [42]. The US government sources reported GHG emissions of 6558 MtCO2eyr−1 in 2019 [35]. Thus, GHG footprints (per person) from their own country government emission reports are 11.5 and 19.8 tCO2eyr−1 for the UK and the US, respectively, substantially higher than the WRI global database.
3.2. Emissions of GHG by Country from Livestock Statistics: Top-Down
3.2.1. Country’s Own Emissions Estimate
Direct emissions from UK agriculture in 2019 are estimated by the UK Department of Agriculture as 46.3 MtCO2eyr−1 (10% of the UK total) [33]. Of this total, enteric fermentation CH4 is ~21.5 MtCO2eyr−1, 16.1 MtCO2eyr−1 from N2O mainly from soils, and 6.0 MtCO2eyr−1 is CO2, the majority of which is from combustion [33]. Accounting for emissions associated with imported feed (Section 2.2.1., Equation (3)) increased the agricultural total to 55.4 MtCO2eyr−1 or a personal UK GHG agricultural footprint of 0.8 tCO2eyr−1. Eighty-five percent of agricultural land is ascribed to grassland for livestock feed (63%) and livestock feed crops (22%) [44]. Hence, the UK GHG livestock footprint is estimated at 0.7 tCO2eyr−1 per person, excluding the contribution from food imports (see Section 3.3. below).
Of US agricultural GHG emissions (Table 3) [35], 39% derived directly from livestock, giving an estimated 261 MtCO2eyr−1. Adding an estimate of 276 MtCO2eyr−1 for crops for animal feed increased the contribution from US animal agriculture to 544 MtCO2eyr−1 (81% of the agricultural total) or a personal livestock GHG footprint of 1.6 tCO2eyr−1.
3.2.2. Scaling Regional Estimates from the GLEAM Model
The GLEAM livestock emissions for North America are 603 MtCO2eyr−1 and for Western Europe 578 MtCO2eyr−1 [18]. There are 80 million cattle in the Western European region of which the UK has 12.4% [40]. Using Equation (4), regional GLEAM livestock emissions for Western Europe can be scaled to ~12% of 578 MtCO2eyr−1, giving an estimate for livestock emissions from the UK of 71.7 MtCO2eyr−1. This is ~36% higher than total agricultural GHG emissions estimated in Section 2.2.1 from country reported data.
From GLEAM [18], there are 105 million cattle in the US and Canada, 89% are in the US [45]. Of the 6 million sheep in the US and Canada, 87% are in the US [45]. Using Equation (4), regional GLEAM livestock emissions for the US and Canada can be scaled to 88% of 603 MtCO2eyr−1, giving an approximate number for livestock GHG emissions from the US of 530 MtCO2e.
Using Equation (1) with these scaled estimates of livestock emissions from GLEAM gives GHG footprints from livestock agriculture of ~1 tCO2eyr−1 per person globally, 1.1 tCO2eyr−1 per person for the UK and 1.6 tCO2eyr−1 per person for the US.
3.2.3. Using Emissions Factors Combined with Livestock Statistics
GHG emissions can also be calculated for each livestock species directly. Using the livestock statistics in Table 1 and Equation (5), the emissions from enteric fermentation linked to animal agriculture can be recalculated (Table 5). Table 5 uses the reference year of 2010 [18] except for UK livestock numbers from 2019 [40] and for 2020 for the US [45,46,47,48]. For the UK, 26 MtCO2eyr−1 from enteric emissions estimated in Table 5 is similar to the UK DEFRA estimates for 2019 from enteric fermentation of 21.5 MtCO2eyr−1 [32]. DEFRA adds a further ~7 MtCO2eyr−1 for manure management [32], but this is still less than the total GHG emissions associated with UK livestock derived here of 59 MtCO2eyr−1, which attempts to include emissions associated with feed, land use, transport, and processing. The estimated total from enteric fermentation for the US ~10 MtCH4yr−1 or 295 Mt CO2eyr−1 are similar to other top-down estimates for the US in [49] but up to 50% higher than those determined for 2018 in [50] or for bottom-up estimates in [49]. Overall, the global CH4 emissions derived in Table 5 of 111 MtCH4yr−1 are similar to 118 MtCH4yr−1 emissions from livestock determined in [49].
The resulting GHG footprints from livestock farming for the UK and US from these calculations are 0.9 tCO2eyr−1 per person for the UK and 2.0 tCO2eyr−1 per person for the US.
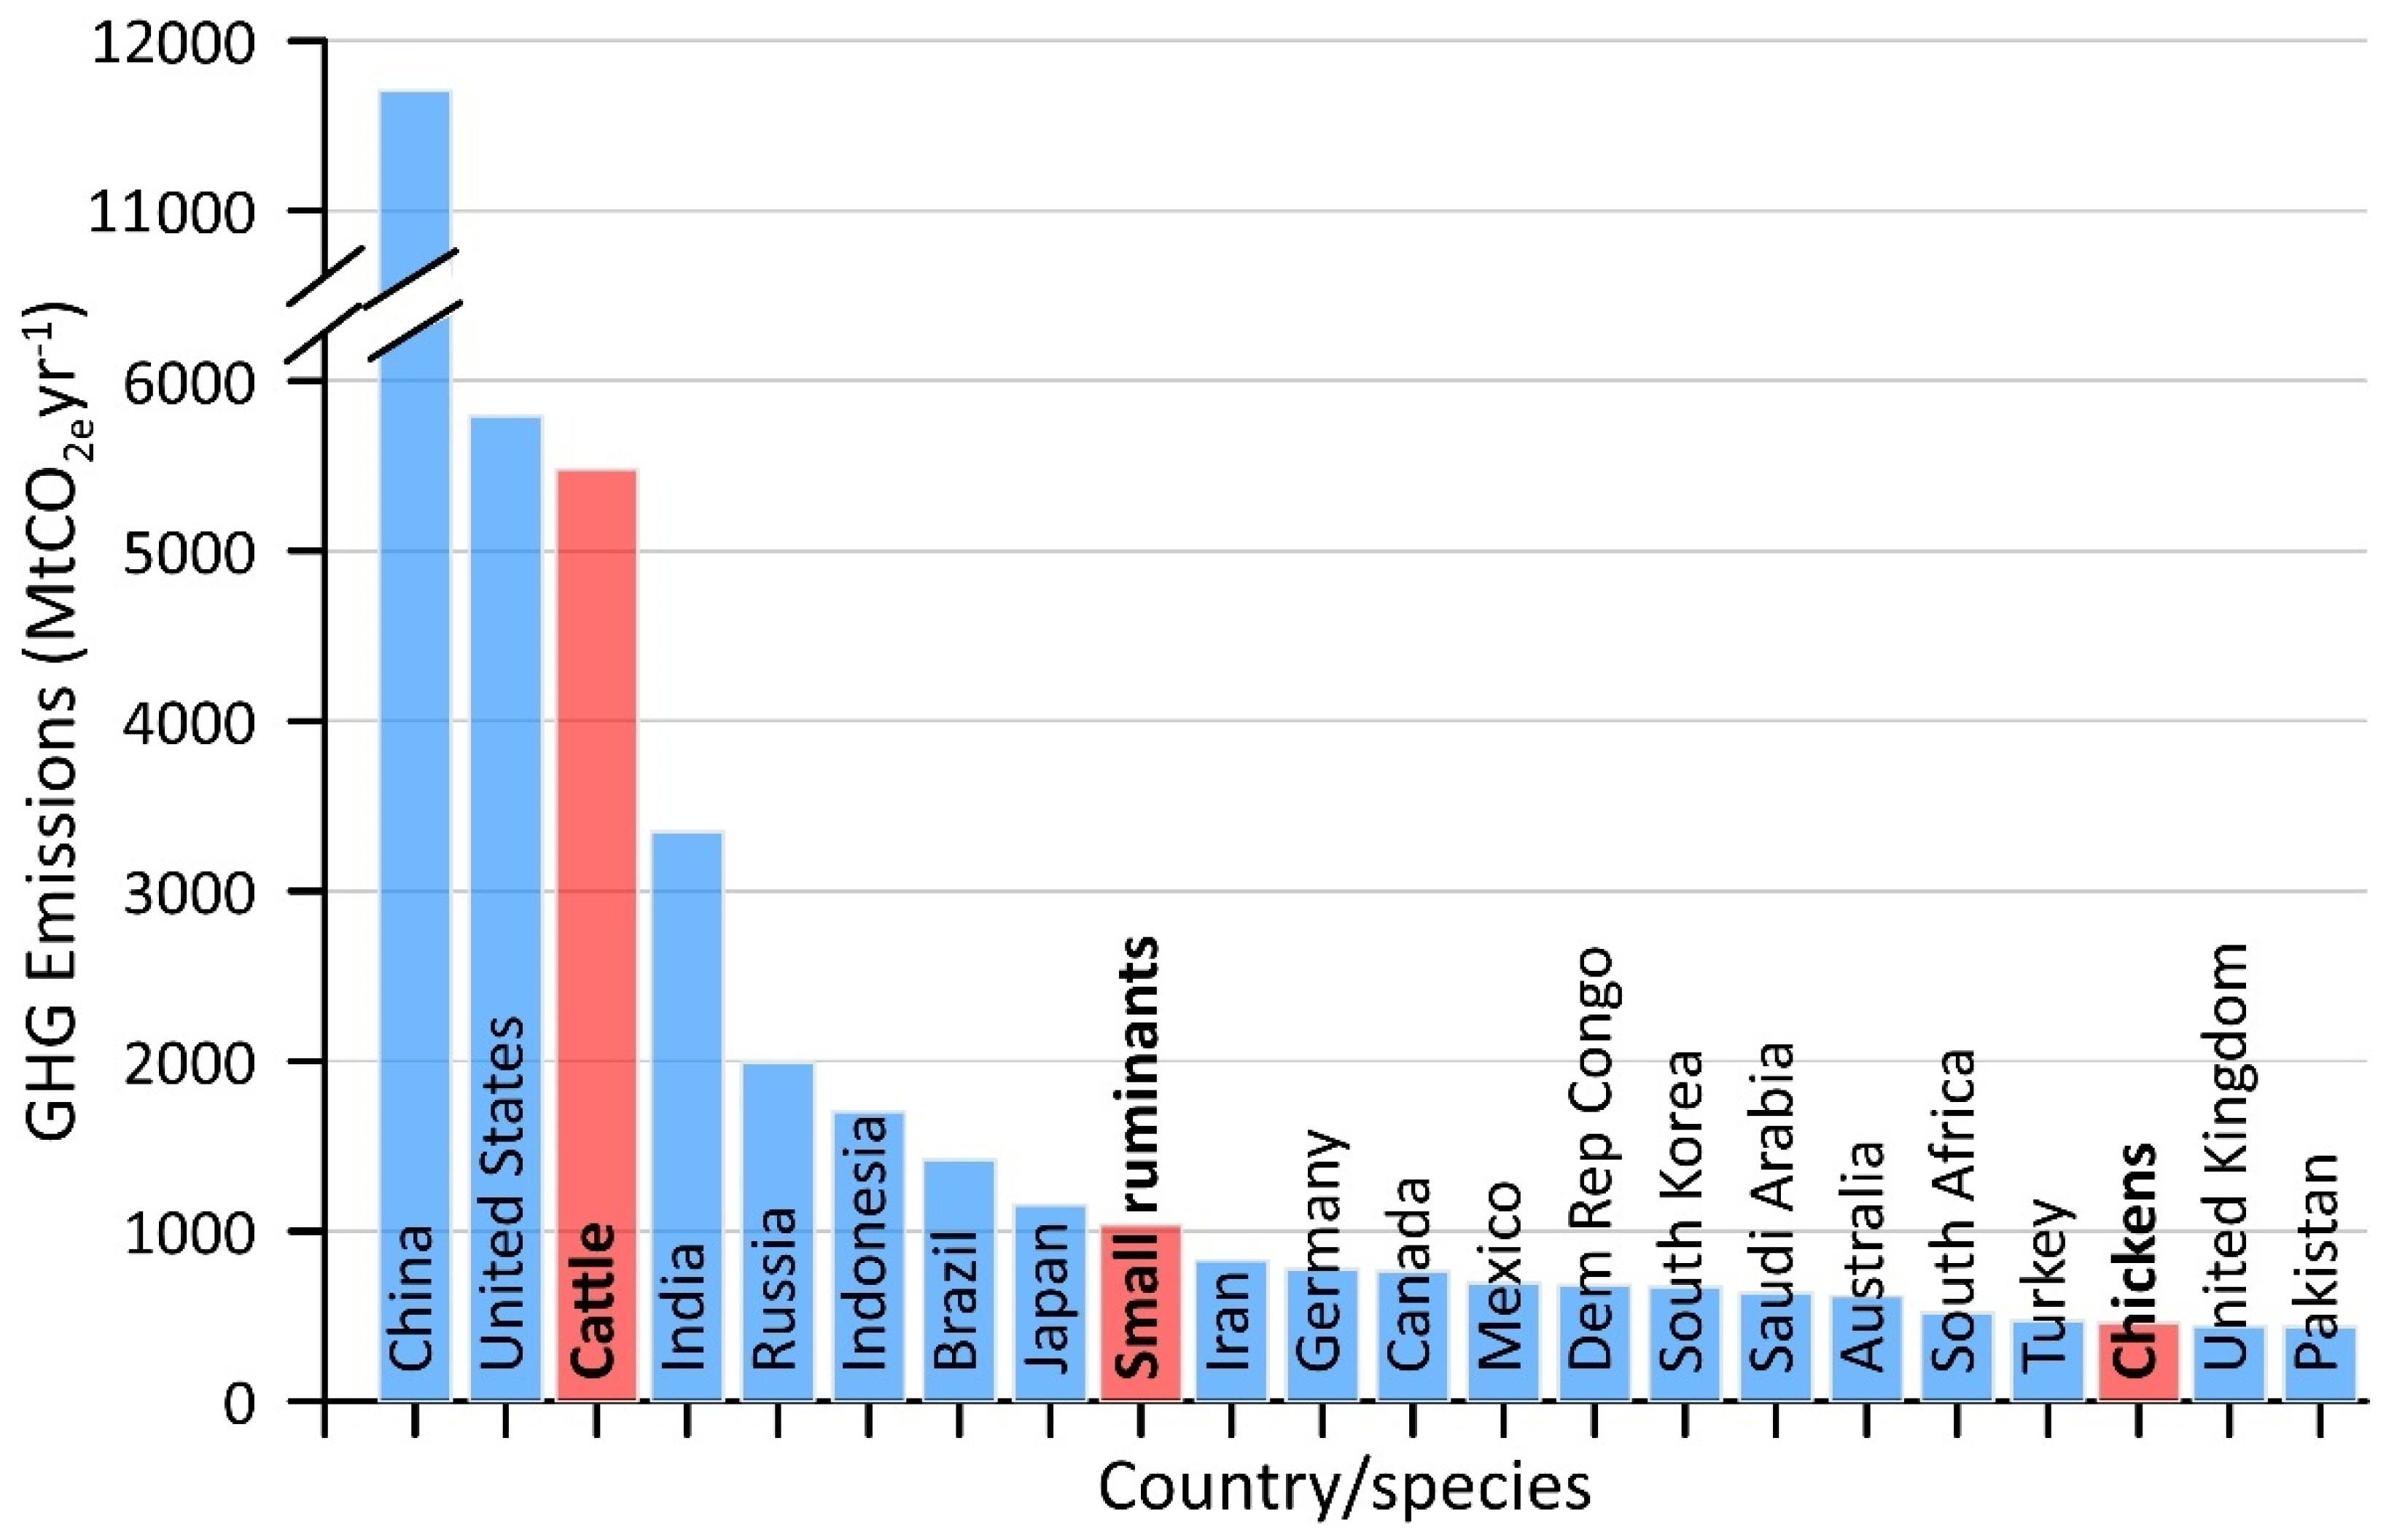
If global emissions from Table 5 from any species—cattle, small ruminants, chickens, and pigs—are summed and compared to total country emissions [43] (including agriculture) for the 19 top country emitters of GHG, cattle would be placed as the third largest emitter (Figure 5). Only China and the US are larger GHG emitters. Small ruminants would be ranked 9th with slightly lower emissions than Japan, and chickens would rank 20th between the emissions of the countries Turkey and the United Kingdom. Summed together, emissions from those species (not all livestock) are ~7.3 GtCO2eyr−1, which is ~15% of the global total GHG emissions (from all sources of 49.3 GtCO2eyr−1) [43].
Emissions from cattle are 5.4 GtCO2eyr−1 and are thus by far the biggest single contributor to livestock GHG emissions. The largest source of uncertainty is in the geographic variation of emissions factors for CH4 from enteric fermentation and nitrogen compounds associated with manure management [53,54], which are estimated by the FAO as ±30% [15]. If the number of cattle and the emissions factors from enteric fermentation are varied by ±30%, and then the conversion from CH4 using a GWP is 28 ± 3 (within the range found in the literature [7]) and the correction to total emissions is varied by ±30%, the final contribution from cattle has a maximum range from 1.7 to 13.3 GtCO2eyr−1. The major sensitivities within the GLEAM model arise less from animal numbers than the type of animal, i.e., whether it is fully grown, male or female, used for beef or dairy, and the production system. These variations can more than triple the enteric emissions factor. For dairy cattle, the range given for different types of cattle and across different production systems and geographical regions is 74–138 kg CH4 yr−1 per head and for beef 26–96 CH4 yr−1 per head [15]. In the calculations here, the results ae highly sensitive to accounting for the non-enteric fermentation contributions, mainly feed (and associated land-use changes) and manure management. On-farm energy use and processing are relatively small contributors (Figure 3).
3.3. Contributions Using Classifications of Consumption or Food Diaries/Surveys: Bottom-Up
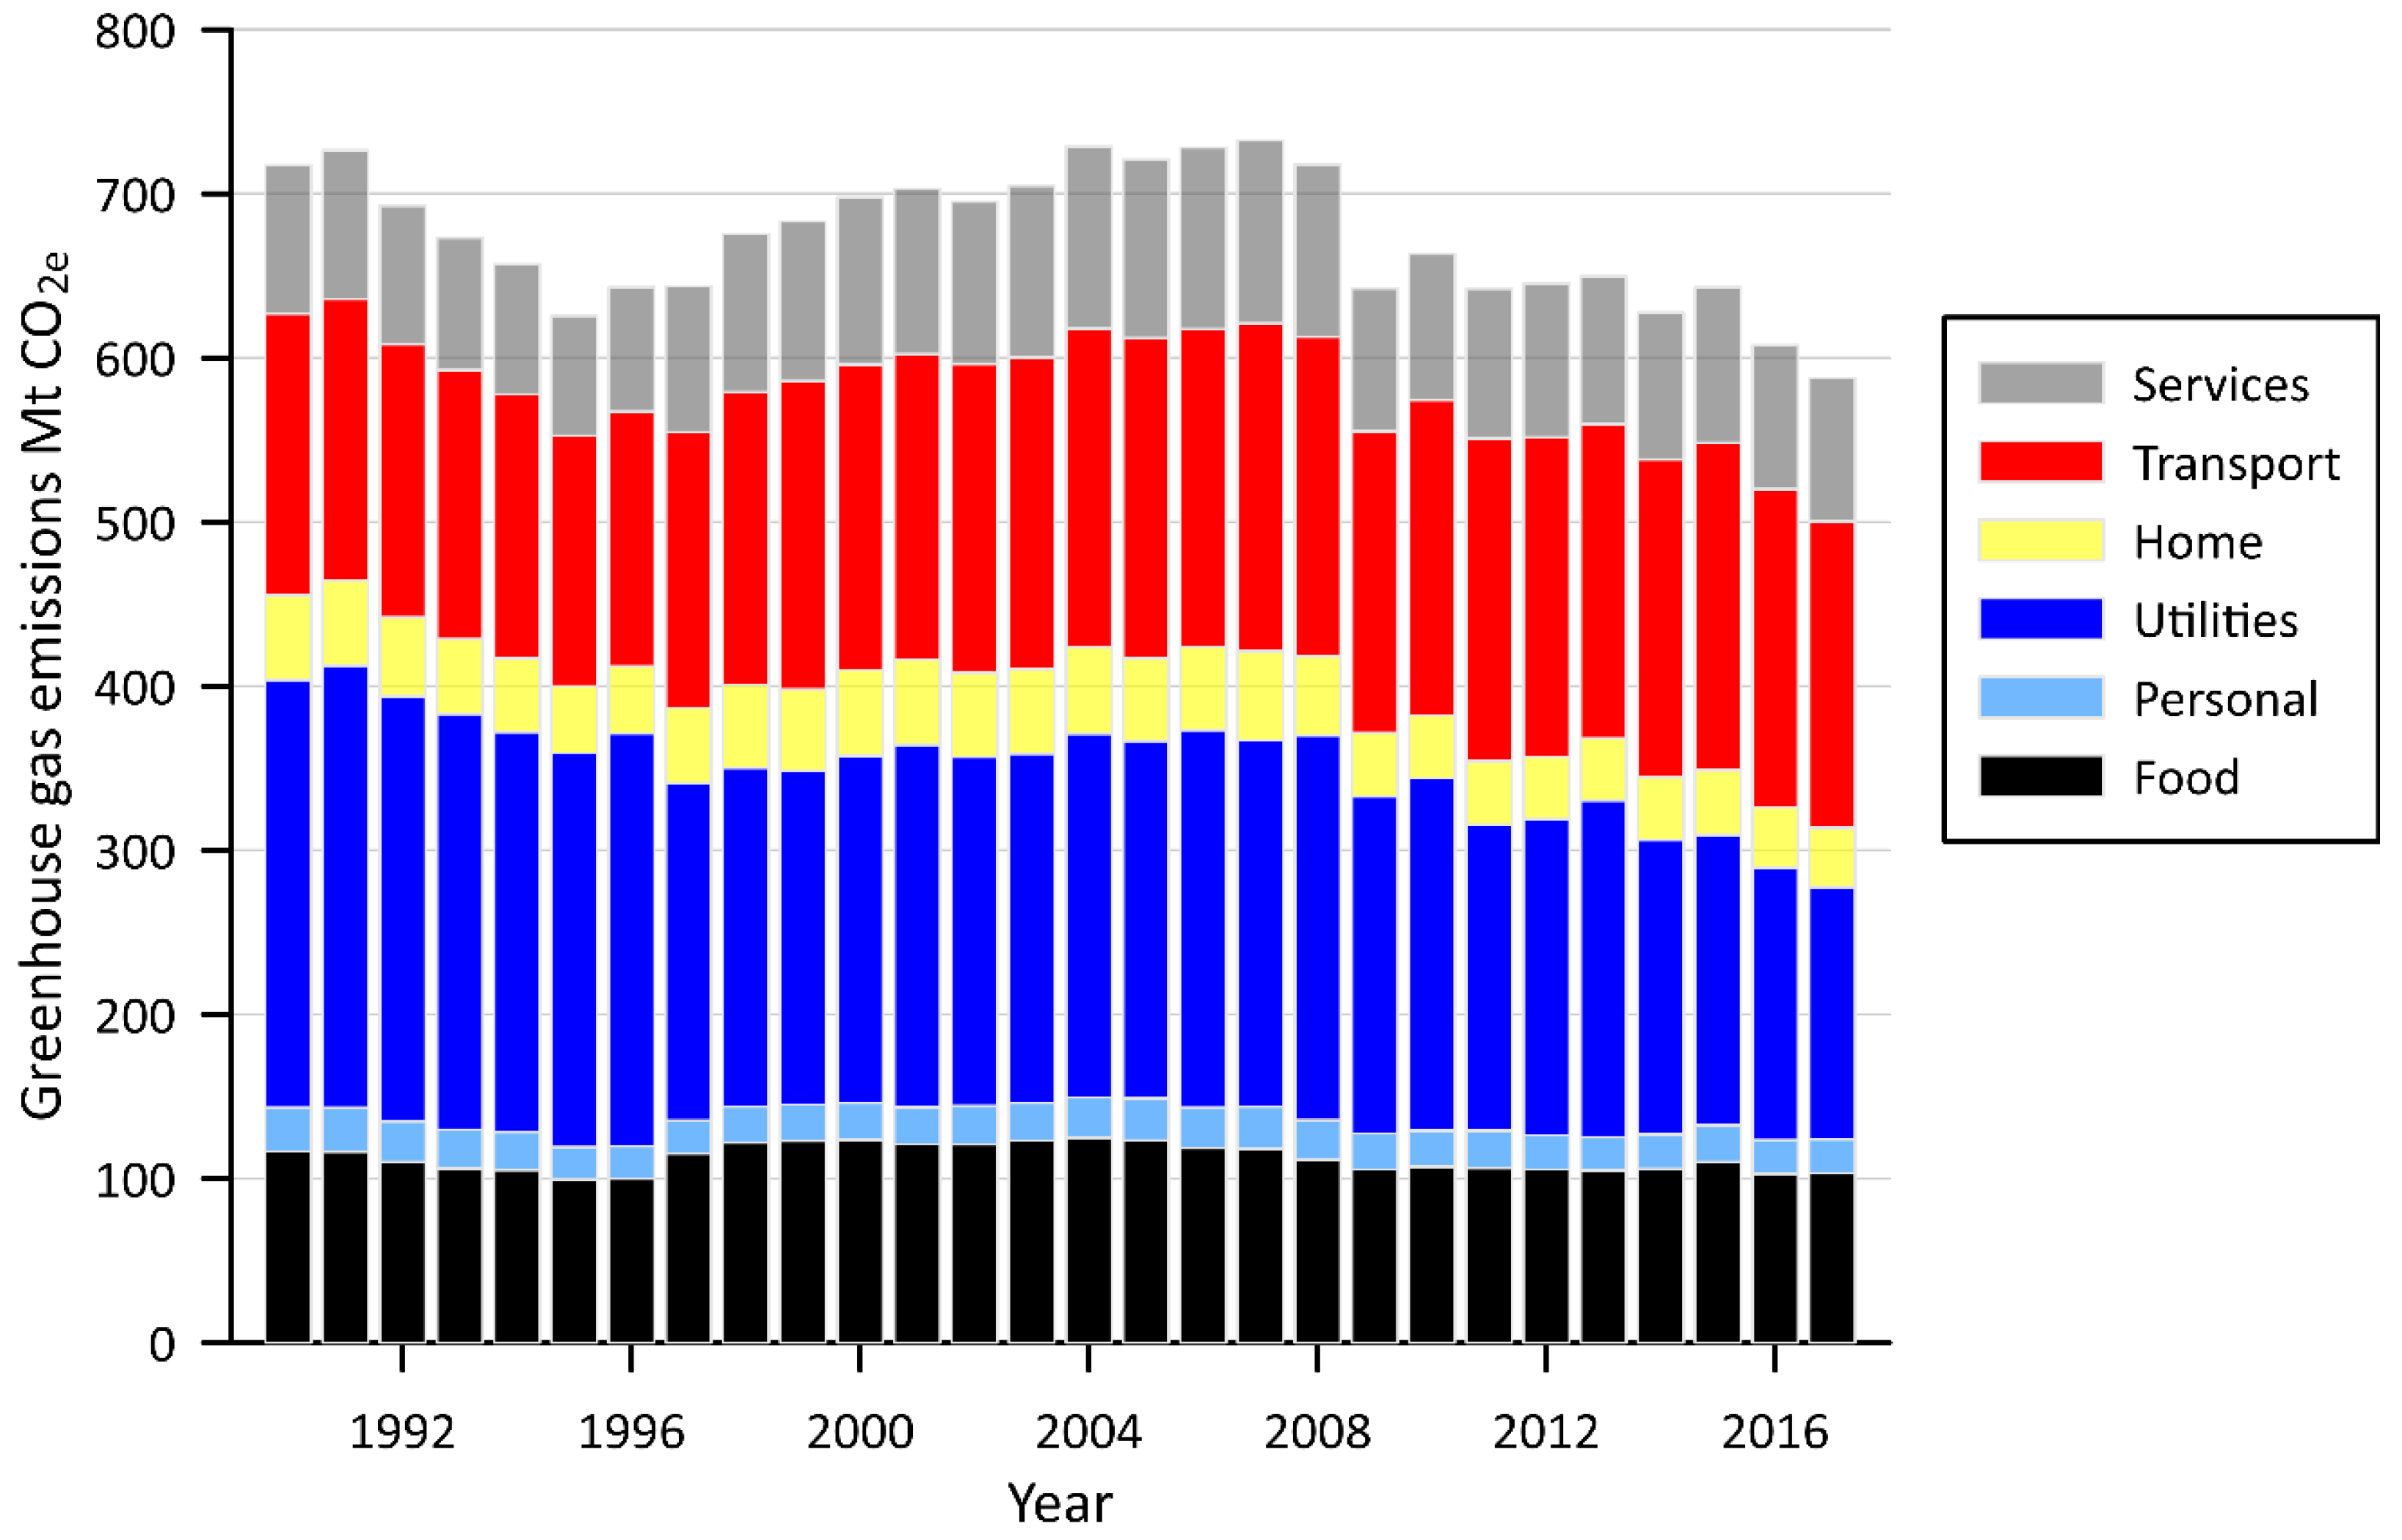
DEFRA UK GHG emissions figures from consumption in 2017 are 46.3% from imports used for UK consumption, 35.1% UK production and consumption, 9.8% household heating, and 8.8% from road transport emissions. GHG emissions from most sectors have remained steady over time, except in utilities where lower carbon electricity generation is reducing emissions (Figure 6) [42]. The calculated contribution from food-related activity in 2017 of 103 MtCO2eyr−1 is consistently between 15% and 19% of the total [42]. Direct GHG emissions from food production are 68 MtCO2eyr−1 and can be broken down into 85% from meat, fish, and dairy products vs. 15% non-animal sources such as vegetable oils and bakery (Section 2.2.1) [42]. The food footprint determined here as the total emissions from food-related activity divided by the population is 1.5 tCO2eyr−1 per person, or from animal products 1.3 tCO2eyr−1 per person (Table 6).
In the US, in 2017, the amount of red meat per capita (i.e., beef 18.6 and pork 15.1 kg) accounted for 51% the total 65.3 kg per person meat total, compared with 42% for poultry (27.8 kg). Based on emissions factors in Table 2, per person emissions from meat are dominated by beef at 1.1 tCO2eyr−1 per person from a total of approximately 1.5 tCO2eyr−1 per person from meat. This is in good agreement with results from [30] using the bottom-up approach, the food-related GHG footprint for the US is 1.4 tCO2eyr−1 per person.
4. Discussion: The Potential for Emissions Reductions
At COP26, a pact was reached that urges countries to phase down coal and fossil-fuel subsidies. One hundred countries agreed to cut methane emissions by 30% by 2030 [56]. Livestock agriculture is directly responsible for 80% of agricultural methane emissions and has contributed ~12% of global warming [57]. Both the US and the UK are signatories to methane emissions reduction. For the US, President Biden’s target is a 50–52% reduction from 2005 levels in economy-wide GHG pollution in 2030 focused on carbon-free power by 2035 and net-zero emissions economy by no later than 2050 [58]. The methane reduction plan includes “methane emissions reductions from manure, rice, and enteric sources by as much as 26 million metric tons in 2030 and a cumulative total of approximately 130 million metric tons CO2e from 2030–2035”, approximately a 10% reduction per year.
In the UK, the government’s stated role is to reach net-zero carbon emissions by 2050 and “at least 68% reduction in greenhouse gas emissions by the end of the decade, compared to 1990 level” [59]. However, very little has been done to tackle GHG emissions from food. The recently published UK Government ten-point plan does not mention food production [60]. Reductions in the agricultural sector are focused on nutrient management and better farming practices [32], while the number of UK livestock has hardly changed over the last decade remaining at close to 10 million head of cattle [51]. Similarly the numbers of 5.1 million pigs, 33.6 million sheep, and 187 million poultry have remained fairly constant over time for the UK [51]. UK agriculture is expected to contribute 30% of GHG emissions by 2050 [61], but according to one report, a shift to plant-based diets could generate up to a 73% reduction in diet-related emissions [61]. Referencing the EU Common Agricultural Policy (CAP), “Approximately three-quarters (€29–33 billion) of the CAP direct payments go to producers of livestock or livestock fodder—almost a fifth of the EU’s total annual budget” [61].
By 2023, annual global meat consumption is projected to reach a total of 313 Mt, increasing at ~ 1.4% per year to per capita meat consumption of 39 kg [62] and projected to increase further to 49 kg by 2050 [8]. IPCC reports of GHG emissions from agriculture with high confidence state that, “Without intervention, these are likely to increase by about 30–40% by 2050” [8]. In the UK and the US, livestock-related emissions are ~74% and ~80% of the agricultural totals [32,50]. Thus, it seems likely that for GHG emissions from agriculture, which are dominated by livestock, both direct and indirect emissions will increase significantly and represent an increasing share of total emissions as other sectors decarbonize.
If meat consumption reduces rather than increases, the question: “What happens to those animals?” is often raised. The overwhelming majority of animals used as food are poultry (~86%) (Table 1). These are bred for food and slaughtered at around 47 days old [63]. Pigs and beef cattle are slaughtered at around 6 months and a year old, respectively. Further, it is estimated that 99% of animals farmed in the US are kept in factory farms and over 70% of food animals in the UK [63,64]. Thus, reducing the numbers of animals raised and slaughtered for food occurring over one year or more would not result in a large number of “unwanted” farm animals or “empty fields”. Rather, reducing meat consumption would result in the reduction of the increasing number of mega factory farms [64]. If meat, particularly meat from ruminants, is replaced by any plant-based food or even cultured meat, for the same food weight, GHG emissions would be much lower [22].
In devising a strategy to limit CO2 concentrations in the atmosphere to 500 ppm, an early study (2004) suggested emissions reduction of ~3.67 GtCO2eyr−1 is required [65]. Diet modification and improvement of livestock/crop methods could contribute 15–43% of that total. The total technical mitigation potential from crop and livestock activities and agroforestry is estimated at 2.3–9.6 GtCO2eyr−1 by 2050 (medium confidence) [8]. This wide range arises because some mitigation measures have very large potential for reducing GHG emissions such as soil carbon sequestration. The IPCC estimates the total technical mitigation potential of dietary changes as 0.7–8 GtCO2eyr−1 by 2050, but note this total could be higher, depending on social factors such as consumer choice and dietary change [8]. There may be impacts from climate change on agriculture impacting the viability of some systems such as the availability of grazing. If the number of livestock are reduced, in addition to the reduction in food’s annual GHG emissions, the land no longer required for food production could remove ~8.1 GtCO2 from the atmosphere each year as natural vegetation [4].
While emissions from agriculture are projected to increase, especially in developing countries [66], the availability of meat alternatives and cultured meat as well as lifestyle changes have started to pose the question of whether some parts of the globe are at ‘peak meat’ [67]. The growth of meat alternatives such as cultured meat (emissions 2.01 kg CO2e per kg cultured meat) is also expected to contribute to immediate GHG emission reductions, although the longer term impact is less clear [68]. “By 2035, the shift to plant-based beef, pork, chicken, and egg alternatives will save more than 1 gigaton of CO2e, about as much as Japan currently emits annually” [69]. Halving meat, dairy, and egg consumption would half EU emissions from agricultural sector [61]. Replacing beef with beans in the US would free up 43% of US cropland and reduce GHG emissions by 334 MtCO2eyr−1, 75% of the reduction target [70].
The US Department of Agriculture reports that US diets are increasingly out of balance with Federal recommendations with the consumption of meat, eggs, and nut nearly 40% higher than recommended [71]. The continued viability of increased meat consumption in terms of health costs and the role of farming subsidies has also been raised in the health community [72]. “Because intake of red meat is not essential and appears to be linearly related to total mortality and risks of other health outcomes in populations that have consumed it for many years, optimal intake might be 0 g/day, especially if replaced by plant sources of protein” [73]. Other benefits to the planet would include reducing the 43% of the ice- and desert-free land that is currently devoted to agriculture and reducing other environmental impacts, such as deforestation, intensive water use, acidification, and eutrophication, all of which are high for meat production [4,73]. Although there is agreement that reducing meat and dairy consumption is important for health [74] as well as reduced carbon footprints [75], achieving that as meat consumption rises [76] is challenging [75].
An optimistic view is presented in [4]: “dietary change can deliver environmental benefits on a scale not achievable by producers”. Moving towards diets that exclude animal products has the transformative potential of reducing food’s GHG emissions by 6.6 GtCO2eyr−1 (49% reduction) [4]. In terms of the future, [73] states that a population of 10 billion humans could be sustained but “even small increases in consumption of red meat or dairy foods would make this goal difficult or impossible to achieve”. One of their key messages reads: “Transformation to healthy diets by 2050 will require substantial dietary shifts, including a greater than 50% reduction in global consumption of unhealthy foods, such as red meat and sugar, and a greater than 100% increase in consumption of healthy foods, such as nuts, fruits, vegetables, and legumes.” [73].
Some dietary change may already be underway. Reportedly, 40% of EU consumers have reduced or eliminated red meat consumption [77]. A 20% reduction in the consumption of meat in the UK from 2008 to 2019 is attributed mainly to eating less red and processed meat [78], whereas meat consumption levels in the US are unchanged overall (1999–2016) [79]. Among methods considered to encourage reduced meat consumption are the implementation of meat taxes [23], meat-free Mondays, citizen science platforms, [77] or increased pricing [80]. A discussion of other mechanisms and the role of political leadership can be found in [70]. Reducing food waste, currently estimated globally to be 931 Mt yr−1 (17% of food) and potentially responsible for 8–10% of GHG emissions, [81] can also help to reduce food-related GHG footprints.
The comparison of GHG footprints in Table 6 shows that using top-down approaches for the contribution of livestock agriculture to individual GHG footprints (per person) gives 0.9 tCO2eyr−1 for the UK and 2.0 tCO2eyr−1 for the US. Bottom-up approaches give a wider range of GHG footprints up to 1.3–5.7 tCO2eyr−1 per person for meat eaters (Table 6) with reductions in the range 0.8–3.0 tCO2eyr−1 per person for vegetarians. Consumption figures from Section 3.3 give GHG footprints from meat consumption of 1.3 tCO2eyr−1 for the UK and 1.5 tCO2eyr−1 for the US. Comparing these with other activities [28,82], indicates that removing meat from the diet has a broadly comparable or larger impact to other lifestyle adjustments to reduce personal GHG footprints (Table 7).
5. Conclusions
Actions to reduce GHG emissions have to this point been largely focused on decarbonizing the electricity supply and transport systems. This research indicates that the contribution of GHG emissions from livestock is not decreasing and is likely to become a large fraction of overall GHG emissions.
Agriculture is already an important contributor to GHG emissions being of similar magnitude to emissions from transport (~14–16% for each sector). Agricultural GHG emissions have a relatively large uncertainty of approximately ±30% [12]. The global GHG emissions from animal agriculture are ~7.5 GtCO2eyr−1 [18]. Here, it is shown that livestock numbers are increasing at an exponential rate and now number 4.3 per human (Figure 1, Table 1). If emissions from individual livestock species are ranked with emissions from countries, cattle rank as the third largest after China and the US (Figure 5, Table 5).
The calculations of GHG footprints from the top-down approach indicate that emissions of approximately 1 tCO2eyr−1 per person globally are from animal agriculture. For the UK, they are 0.9 per person and 2.0 tCO2eyr−1 per person for the US. However, there are differences between the footprints estimated using the top-down and bottom-up methods. In the top-down approach these can be ascribed to uncertainty in GHG emissions factors from livestock. In the bottom-up approach, GHG emissions are allocated to food consumed and imports. Bottom-up calculations presented here from UK consumption figures determine the animal product footprint as 1.3 tCO2eyr−1 per person, while for the US the GHG footprint from the consumption of meat is 1.5 tCO2eyr−1 per person. Reductions in GHG footprint in removing meat products are therefore assumed to be at least 1.3–1.5 tCO2eyr−1 per person. These are similar personal GHG footprint reductions to taking one less return long-haul flight per year.
Funding
This research received no external funding.
Data Availability Statement
All data used are publicly available and are cited in the text.
Acknowledgments
Many thanks to the anonymous reviewers and the editor for their time. Their comments and suggestions have improved the paper.
Conflicts of Interest
The author declares no conflict of interest.
References
- United Nations Environment Programme (UNEP). Emissions Gap Report 2020; United Nations: New York, NY, USA, 2020; 128p, ISBN 978-92-807-3812-4. [Google Scholar]
- Cossutta, M.; Foo, D.C.Y.; Tan, R.R. Carbon emission pinch analysis (CEPA) for planning the decarbonization of the UK power sector. Sustain. Prod. Consum. 2021, 25, 259–270. [Google Scholar] [CrossRef]
- Liu, J.; Santos, G. Decarbonizing the Road Transport Sector: Break-even Point and Consequent Potential Consumers’ Behavior for the U.S. Case. Int. J. Sustain. Transp. 2015, 9, 159–175. [Google Scholar] [CrossRef]
- Poore, J.; Nemecek, T. Reducing food’s environmental impact through producers and consumers. Science 2019, 360, 987–992. [Google Scholar] [CrossRef] [Green Version]
- Hertwich, E.; Peters, G.P. Carbon Footprint of Nations: A Global, Trade-Linked Analysis. Environ. Sci. Technol. 2009, 41, 6414–6420. [Google Scholar] [CrossRef] [Green Version]
- Intergovernmental Panel on Climate Change (IPCC). Climate Change 2014: Synthesis Report: Contribution of Working Groups I, II and III to the Fifth Assessment Report of the Intergovernmental Panel on Climate Change; Core Writing Team, Pachauri, R.K., Meyer, L.A., Eds.; IPCC: Geneva, Switzerland, 2014; 151p, Available online: https://www.ipcc.ch/report/ar5/syr/ (accessed on 11 November 2021).
- Intergovernmental Panel on Climate Change (IPCC). Climate Change 2013. The Physical Science Basis. Working Group I Contribution to the Fifth Assessment Report of the Intergovernmental Panel on Climate Change: Summary for Policymakers; Cambridge University Press: Cambridge, UK; New York, NY, USA, 2013; 27p, Available online: https://www.ipcc.ch/site/assets/uploads/2018/02/WG1AR5_SPM_FINAL.pdf (accessed on 5 February 2014).
- Mbow, C.; Rosenzweig, C.; Barioni, L.G.; Benton, T.G.; Herrero, M.; Krishnapillai, M.; Liwenga, E.; Pradhan, P.; Rivera-Ferre, M.G.; Sapkota, T.; et al. Chapter 5: Food Security. In Climate Change and Land: An IPCC Special Report on Climate Change, Desertification, Land Degradation, Sustainable Land Management, Food Security, and Greenhouse Gas Fluxes in Terrestrial Ecosystems; Shukla, P.R., Skea, J., Calvo Buendi, E., Masson-Delmotte, V., Pörtner, H.-O., Roberts, D.C., Zhai, P., Slade, R., Connors, S., Diemen, R.V., et al., Eds.; Intergovernmental Panel on Climate Change (IPCC): Geneva, Switzerland, 2019; 114p. Available online: https://www.ipcc.ch/site/assets/uploads/2019/11/08_Chapter-5.pdf (accessed on 4 November 2021).
- Herrero, M.; Wirsenius, S.; Henderson, B.; Rigolot, C.; Thornton, P.; Havlík, P.; de Boer, I.; Gerber, P.J. Livestock and the Environment: What Have We Learned in the Past Decade? Annu. Rev. Environ. Resour. 2015, 40, 177–202. [Google Scholar] [CrossRef]
- Robinson, T.P.; Wint, G.R.W.; Conchedda, G.; Van Boeckel, T.P.; Ercoli, V.; Palamara, E.; Cinardi, G.; D’Aietti, L.; Hay, S.I.; Gilbert, M. Mapping the Global Distribution of Livestock. PLoS ONE 2014, 9, e96084. [Google Scholar] [CrossRef] [Green Version]
- Xu, X.; Sharma, P.; Shu, S.; Lin, T.-S.; Ciais, P.; Tubiello, F.N.; Smith, P.; Campbell, N.; Jain, A.K. Global greenhouse gas emissions from animal-based foods are twice those of plant-based foods. Nat. Food 2021, 2, 724–732. [Google Scholar] [CrossRef]
- Food and Agriculture Organization of the United Nations (FAO). Data Collection. Available online: https://www.fao.org/statistics/data-collection/en/ (accessed on 26 November 2021).
- Bar-On, Y.M.; Phillips, R.; Milo, R. The biomass distribution on Earth. Proc. Natl. Acad. Sci. USA 2018, 115, 6506–6511. [Google Scholar] [CrossRef] [Green Version]
- United Nations. Population and Vital Statistics Report. Available online: https://unstats.un.org/unsd/demographic-social/products/vitstats/ (accessed on 23 February 2022).
- Intergovernmental Panel on Climate Change (IPCC). Ch. 10. Emissions From Livestock and Manure Management. In 2019 Refinement to the 2006 IPCC Guidelines for National Greenhouse Gas Inventories; Gavrilova, O., Leip, A., Dong, H., MacDonald, J.D., Gomez Bravo, C.A., Amon, B., Barahona Rosales, R., del Prado, A., Aparecida de Lima, M., Oyhantçabal, W., et al., Eds.; IPCC: Geneva, Switzerland, 2019; 209p, Available online: https://www.ipcc-nggip.iges.or.jp/public/2019rf/pdf/4_Volume4/19R_V4_Ch10_Livestock.pdf (accessed on 26 February 2021).
- Reisinger, A.; Clark, H. How much do direct livestock emissions actually contribute to global warming? Glob. Chang. Biol. 2018, 24, 1749–1761. [Google Scholar] [CrossRef]
- Tubiello, F.N.; Salvatore, M.; Rossi, S.; Ferrara, A.; Fitton, N.; Smith, P. The FAOSTAT database of greenhouse gas emissions from agriculture. Environ. Res. Lett. 2013, 8, 015009. [Google Scholar] [CrossRef]
- Food and Agriculture Organization (FAO). Global Livestock Environmental Assessment Model (GLEAM). Available online: http://www.fao.org/gleam/results/en/ (accessed on 7 May 2021).
- Ritchie, H. You Want to Reduce the Carbon Footprint of Your Food? Focus on What You Eat, Not Whether Your Food Is Local. Available online: https://ourworldindata.org/food-choice-vs-eating-local (accessed on 6 May 2021).
- Grossi, G.; Goglio, P.; Vitali, A.; Williams, A.G. Livestock and climate change: Impact of livestock on climate and mitigation strategies. Anim. Front. 2019, 9, 69–76. [Google Scholar] [CrossRef] [PubMed] [Green Version]
- Gerber, P.J.; Steinfeld, H.; Henderson, B.; Mottet, A.; Opio, C.; Dijkman, J.; Falcucci, A.; Tempio, G. Tackling Climate Change through Livestock–A Global Assessment of Emissions and Mitigation Opportunities; Food and Agriculture Organization of the United Nations (FAO): Rome, Italy, 2013; 139p. [Google Scholar]
- Clark, M.; Tilman, D. Comparative analysis of environmental impacts of agricultural production systems, agricultural input efficiency, and food choice. Environ. Res. Lett. 2017, 12, 064016. [Google Scholar] [CrossRef]
- Forero-Cantor, G.; Ribal, J.; Sanjuán, N. Levying carbon footprint taxes on animal-sourced foods. A case study in Spain. J. Clean. Prod. 2020, 243, 118668. [Google Scholar] [CrossRef]
- Nijdam, D.; Rood, T.; Westhoek, H. The price of protein: Review of land use and carbon footprints from life cycle assessments of animal food products and their substitutes. Food Policy 2012, 37, 760–770. [Google Scholar] [CrossRef]
- Ferguson Aikins, E.; Ramanathan, U. Key factors of carbon footprint in the UK food supply chains: A new perspective of life cycle assessment. Int. J. Oper. Prod. Manag. 2020, 40, 945–970. [Google Scholar] [CrossRef]
- Goyal, A.; Doomra, R.; Srivastava, S.; Rani, N.; Choudhary, A.R. Vegetarians, vegans and the carbon footprint: An increased environmental consciousness among the youths. Indian J. Health Wellbeing 2020, 11, 387–392. [Google Scholar]
- Neufeld, D. The Carbon Footprint of the Food Supply Chain. Available online: https://www.visualcapitalist.com/visualising-the-greenhouse-gas-impact-of-each-food/ (accessed on 24 April 2020).
- Scarborough, P.; Appleby, P.N.; Mizdrak, A.; Briggs, A.D.M.; Travis, R.C.; Bradbury, K.E.; Key, T.J. Dietary greenhouse gas emissions of meat-eaters, fish-eaters, vegetarians and vegans in the UK. Clim. Chang. 2014, 125, 179–192. [Google Scholar] [CrossRef] [Green Version]
- Aleksandrowicz, L.; Green, R.; Joy, E.J.M.; Smith, P.; Haines, A. The Impacts of Dietary Change on Greenhouse Gas Emissions, Land Use, Water Use, and Health: A Systematic Review. PLoS ONE 2016, 11, e0165797. [Google Scholar] [CrossRef] [PubMed] [Green Version]
- Willits-Smith, A.; Aranda, R.; Heller, M.C.; Rose, D. Addressing the carbon footprint, healthfulness, and costs of self-selected diets in the USA: A population-based cross-sectional study. Lancet Planet. Health 2020, 4, e98–e106. [Google Scholar] [CrossRef] [Green Version]
- Kim, B.; Neff, R. Measurement and communication of greenhouse gas emissions from U.S. food consumption via carbon calculators. Ecol. Econ. 2009, 69, 186–196. [Google Scholar] [CrossRef]
- Department for Environment, Food & Rural Affairs (DEFRA). Agricultural Statistics and Climate Change; DEFRA: Bristol, UK, 2019; 109p. Available online: https://assets.publishing.service.gov.uk/government/uploads/system/uploads/attachment_data/file/835762/agriclimate-9edition-02oct19.pdf (accessed on 25 January 2021).
- Department for Environment, Food & Rural Affairs (DEFRA). Agri-Climate Report; DEFRA: Bristol, UK, 2021; 19p. Available online: https://www.gov.uk/government/statistics/agri-climate-report-2021/agri-climate-report-2021 (accessed on 25 January 2021).
- De Ruiter, H.; Macdiarmid, J.I.; Matthews, R.B.; Kastner, T.; Smith, P. Global cropland and greenhouse gas impacts of UK food supply are increasingly located overseas. J. R. Soc. Interface 2016, 13, 20151001. [Google Scholar] [CrossRef] [PubMed] [Green Version]
- U.S. Environmental Protection Agency (U.S. EPA). Greenhouse Gas Inventory Data Explorer. Available online: https://cfpub.epa.gov/ghgdata/inventoryexplorer/ (accessed on 7 May 2021).
- Emery, I. Without animals, US farmers would reduce feed crop production. Proc. Natl. Acad. Sci. USA 2018, 115, E1703. [Google Scholar] [CrossRef] [PubMed] [Green Version]
- Johnson, R. U.S. Food and Agricultural Imports: Safeguards and Selected Issues 1 July 2020; Congressional Research Service: Washington, DC, USA, 2020; 54p. Available online: https://crsreports.congress.gov/product/pdf/R/R46440/2 (accessed on 24 November 2021).
- Xu, X.; Lan, Y. A comparative study on carbon footprints between plant- and animal-based foods in China. J. Clean. Prod. 2016, 112, 2581–2592. [Google Scholar] [CrossRef]
- Masson-Delmotte, V.; Zhai, P.; Portner, H.-O.; Roberts, D.; Skea, J.; Calvo Buendia, E.; Shukla, R.S.; Slade, R.; Connors, S.; van Diemen, R.; et al. Climate Change and Land: Summary for Policy Makers; Intergovernmental Panel of Climate Change: Geneva, Switzerland, 2020; 41p.
- Department for Environment, Food & Rural Affairs (DEFRA). Livestock Numbers in England and the UK: Annual Statistics on the Number of Livestock in England and the UK in June and December. 2021. Available online: https://www.gov.uk/government/statistical-data-sets/structure-of-the-livestock-industry-in-england-at-december (accessed on 5 May 2021).
- US Department of Agriculture. Chickens and Eggs. Available online: https://www.nass.usda.gov/Surveys/Guide_to_NASS_Surveys/Chickens_and_Eggs/index.php (accessed on 5 May 2021).
- Department for Environment, Food & Rural Affairs (DEFRA). UK’s Carbon Footprint 1997–2017. Available online: https://www.gov.uk/government/statistics/uks-carbon-footprint (accessed on 7 May 2021).
- World Resources Institute. CAIT Climate Data Explorer. Country Greenhouse Gas Emissions. Available online: http://cait.wri.org (accessed on 20 November 2021).
- Climate Change Committee. The Sixth Carbon Budget Agriculture and Land Use, Land Use Change and Forestry; Climate Change Committee: London, UK, 2020; 82p. Available online: https://www.theccc.org.uk/wp-content/uploads/2020/12/Sector-summary-Agriculture-land-use-land-use-change-forestry.pdf (accessed on 20 November 2021).
- US Department of Agriculture. United States and Canadian Cattle and Sheep. 2021. Available online: https://downloads.usda.library.cornell.edu/usda-esmis/files/474299142/d791t878n/3f4630186/uscc0321.pdf (accessed on 11 November 2021).
- US Department of Agriculture. Poultry-Production and Value 2020 Summary. April 2021. Available online: https://www.nass.usda.gov/Publications/Todays_Reports/reports/plva0421.pdf (accessed on 20 November 2021).
- US Department of Agriculture. Available online: https://www.ers.usda.gov/topics/animal-products/sheep-lamb-mutton/sector-at-a-glance/ (accessed on 5 May 2021).
- US Department of Agriculture. U.S. Agricultural Baseline Projections. Available online: https://www.ers.usda.gov/data-products/agricultural-baseline-database/visualization-us-agricultural-baseline-projections/ (accessed on 5 May 2021).
- Wolf, J.; Asrar, G.A.; West, T.O. Revised methane emissions factors and spatially distributed annual carbon fluxes for global livestock. Carbon Balance Manag. 2017, 12, 16. [Google Scholar] [CrossRef] [PubMed] [Green Version]
- U.S. Environmental Protection Agency (U.S. EPA). Inventory of U.S. Greenhose Gas Emissions and Sinks 1990–2019; U.S. EPA: Washington, DC, USA, 2021; p. 791. Available online: https://www.epa.gov/sites/default/files/2021-04/documents/us-ghg-inventory-2021-main-text.pdf?VersionId=yu89kg1O2qP754CdR8Qmyn4RRWc5iodZ (accessed on 25 November 2021).
- Department for Environment, Food & Rural Affairs (DEFRA). Farming Statistics Final Crop Area, Yields, Livestock Populations and Agricultural Workforce at June 2019 United Kingdom; DEFRA: Bristol, UK, 2020; 24p. Available online: https://assets.publishing.service.gov.uk/government/uploads/system/uploads/attachment_data/file/865769/structure-jun2019final-uk-22jan20-rev_v2.pdf (accessed on 26 January 2021).
- US Department of Agriculture. 2013 Turkeys Highlights. 2014. Available online: https://www.nass.usda.gov/Publications/Highlights/2014/2013_Turkey_Industry/2013%20Turkeys%20Highlights.pdf (accessed on 5 May 2021).
- Zhu, B.; Kros, J.; Lesschen, J.P.; Staritsky, I.G.; de Vries, W. Assessment of uncertainties in greenhouse gas emission profiles of livestock sectors in Africa, Latin America and Europe. Reg. Environ. Chang. 2016, 16, 1571–1582. [Google Scholar] [CrossRef] [Green Version]
- Sykes, A.J.; Topp, C.F.E.; Rees, R.M. Understanding uncertainty in the carbon footprint of beef production. J. Clean. Prod. 2019, 234, 423–435. [Google Scholar] [CrossRef]
- U.S. Environmental Protection Agency (U.S. EPA). Carbon Footprint Calculator. Available online: https://www3.epa.gov/carbon-footprint-calculator/ (accessed on 30 November 2021).
- Maizland, L. COP26: Here’s What Countries Pledged. Available online: https://www.cfr.org/in-brief/cop26-heres-what-countries-have-pledged (accessed on 16 November 2021).
- Reisinger, A.; Clark, H.; Cowie, A.L.; Emmet-Booth, J.; Gonzalez Fischer, C.; Herrero, M.; Howden, M.; Leahy, S. How necessary and feasible are reductions of methane emissions from livestock to support stringent temperature goals? Philos. Trans. R. Soc. A Math. Phys. Eng. Sci. 2021, 379, 20200452. [Google Scholar] [CrossRef]
- The White House. FACT SHEET: President Biden Sets 2030 Greenhouse Gas Pollution Reduction Target Aimed at Creating Good-Paying Union Jobs and Securing U.S. Leadership on Clean Energy Technologies. 22 April 2021. Available online: https://www.whitehouse.gov/briefing-room/statements-releases/2021/04/22/fact-sheet-president-biden-sets-2030-greenhouse-gas-pollution-reduction-target-aimed-at-creating-good-paying-union-jobs-and-securing-u-s-leadership-on-clean-energy-technologies/ (accessed on 4 December 2021).
- Press Release. UK Sets Ambitious New Climate Target ahead of UN Summit. 3 December 2020. Available online: https://www.gov.uk/government/news/uk-sets-ambitious-new-climate-target-ahead-of-un-summit (accessed on 26 January 2020).
- HM Government. The Ten Point Plan for a Green Industrial Revolution; HM Government: London, UK, 2020; 38p. Available online: https://assets.publishing.service.gov.uk/government/uploads/system/uploads/attachment_data/file/936567/10_POINT_PLAN_BOOKLET.pdf (accessed on 10 July 2021).
- Carmichael, R. Behaviour Change, Public Engagement and Net Zero: A Report for the Committee on Climate Change; Imperial College London: London, UK, 2019; 81p, Available online: https://www.theccc.org.uk/wp-content/uploads/2019/10/Behaviour-change-public-engagement-and-Net-Zero-Imperial-College-London.pdf (accessed on 22 January 2021).
- ResearchAndMarkets.com. 2020 Insights on Global Meat & Poultry Trends-Key Trends Impacting Meat Consumption. 2020. Available online: https://www.businesswire.com/news/home/20200323005558/en/2020-Insights-on-Global-Meat-Poultry-Trends---Key-Trends-Impacting-Meat-Consumption---ResearchAndMarkets.com (accessed on 5 May 2021).
- Compassion in World Farming. The Life of Broiler Chickens. Available online: https://www.ciwf.org.uk/media/5235306/The-life-of-Broiler-chickens.pdf (accessed on 5 May 2021).
- Wasley, A.; Harvey, F.; Davies, M.; Child, D. UK has nearly 800 livestock mega farms, investigation reveals. Guardian 2017, 17. Available online: https://www.theguardian.com/environment/2017/jul/17/uk-has-nearly-800-livestock-mega-farms-investigation-reveals (accessed on 5 May 2021).
- Pacala, S.W.; Socolow, R. Stabilization Wedges: Solving the Climate Problem for the Next 50 Years with Current Technologies. Science 2004, 305, 968–972. [Google Scholar] [CrossRef] [Green Version]
- Smith, P.; Martino, D.; Cai, Z.; Gwary, D.; Janzen, H.; Kumar, P.; McCarl, B.; Ogle, S.; O’Mara, F.; Rice, C.; et al. Agriculture. In Climate Change 2007: Mitigation. Contribution of Working Group III to the Fourth Assessment Report of the Intergovernmental Panel on Climate Change; Metz, B., Davidson, O.R., Bosch, P.R., Dave, R., Meyer, L.A., Eds.; Cambridge University Press: Cambridge, UK; New York, NY, USA, 2007; 44p, Available online: https://www.ipcc.ch/site/assets/uploads/2018/02/ar4-wg3-chapter8-1.pdf (accessed on 16 November 2021).
- Walsh, D. ‘Peak Meat’: How Plant-Based Alternatives Will Take over Europe by 2035. Available online: https://www.euronews.com/green/2021/03/26/peak-meat-how-plant-based-alternatives-will-take-over-europe-by-2035 (accessed on 16 November 2021).
- Lynch, J.; Pierrehumbert, R. Climate Impacts of Cultured Meat and Beef Cattle. Front. Sustain. Food Syst. 2019, 3, 5. [Google Scholar] [CrossRef] [Green Version]
- Witte, B.; Obloj, P.; Koktenturk, S.; Morach, B.; Brigl, M.; Rogg, J.; Schulze, U.; Walker, D.; Von Koeller, E.; Dehnert, N.; et al. Food for Thought: The Protein Transformation; Boston Consulting Group: Boston, MA, USA; Blue Horizon Corporation: Zurich, Switzerland, 2021; 48p, Available online: https://web-assets.bcg.com/a0/28/4295860343c6a2a5b9f4e3436114/bcg-food-for-thought-the-protein-transformation-mar-2021.pdf (accessed on 4 June 2021).
- Rust, N.A.; Ridding, L.; Ward, C.; Clark, B.; Kehoe, L.; Dora, M.; Whittingham, M.J.; McGowan, P.; Chaudhary, A.; Reynolds, C.J.; et al. How to transition to reduced-meat diets that benefit people and the planet. Sci. Total Environ. 2020, 20, 718. [Google Scholar] [CrossRef] [PubMed]
- US Department of Agriculture. Food Availability and Consumption. Available online: https://www.ers.usda.gov/data-products/ag-and-food-statistics-charting-the-essentials/food-availability-and-consumption/ (accessed on 15 November 2021).
- The Lancet Editorial. We need to talk about meat. Lancet 2018, 392, 2237. [Google Scholar] [CrossRef]
- Willett, W.; Rockström, J.; Loken, B.; Springmann, M.; Lang, T.; Vermeulen, S.; Garnett, T.; Tilman, D.; DeClerck, F.; Wood, A.; et al. Food in the Anthropocene: The EAT–Lancet Commission on healthy diets from sustainable food systems. Lancet 2019, 393, 447–492. [Google Scholar] [CrossRef]
- Clark, M.A.; Springmann, M.; Hill, J.; Tilman, D. Multiple health and environmental impacts of foods. Proc. Natl. Acad. Sci. USA 2019, 116, 23357–23362. [Google Scholar] [CrossRef] [PubMed] [Green Version]
- Hjorth, T.; Huseinovic, E.; Hallström, E.; Strid, A.; Johansson, I.; Lindahl, B.; Sonesson, U.; Winkvist, A. Changes in dietary carbon footprint over ten years relative to individual characteristics and food intake in the Västerbotten Intervention Programme. Sci. Rep. 2020, 10, 20. [Google Scholar] [CrossRef] [PubMed]
- Bonnet, C.; Bouamra-Mechemache, Z.; Réquillart, V.; Treich, N. Viewpoint: Regulating meat consumption to improve health, the environment and animal welfare. Food Policy 2020, 97, 101847. [Google Scholar] [CrossRef]
- Armstrong, B.; Bridge, G.; Oakden, L.; Reynolds, C.; Wang, C.; Panzone, L.A.; Rivera, X.S.; Kause, A.; Ffoulkes, C.; Krawczyk, C.; et al. Piloting Citizen Science Methods to Measure Perceptions of Carbon Footprint and Energy Content of Food. Front. Sustain. Food Syst. 2020, 4, 120. [Google Scholar] [CrossRef]
- Stewart, C.; Piernas, C.; Cook, B.; Jebb, S.A. Trends in UK meat consumption: Analysis of data from years 1-11 (2008-09 to 2018-19) of the National Diet and Nutrition Survey rolling programme. Lancet Planet Health 2021, 5, e699–e708. [Google Scholar] [CrossRef]
- Zeng, L.; Ruan, M.; Liu, J.; Wilde, P.; Naumova, E.N.; Mozaffarian, D.; Zhang, F.F. Trends in Processed Meat, Unprocessed Red Meat, Poultry, and Fish Consumption in the United States, 1999–2016. J. Acad. Nutr. Diet. 2019, 119, 1085–1098. [Google Scholar] [CrossRef] [PubMed]
- Garnett, E.E.; Balmford, A.; Marteau, T.M.; Pilling, M.A.; Sandbrook, C. Price of change: Does a small alteration to the price of meat and vegetarian options affect their sales? J. Environ. Psychol. 2021, 75, 101589. [Google Scholar] [CrossRef]
- United Nations Environment Programme (UNEP). Food Waste Index Report 2021; UNEP: Nairobi, Kenya, 2021; p. 100. ISBN 978-92-807-3851-3. [Google Scholar]
- Clarke, L. The Practical Ways to Reduce Your Carbon Footprint (That Actually Work). Available online: https://www.wired.co.uk/article/reduce-carbon-footprint (accessed on 26 January 2021).
Figure 1.
Global livestock numbers for selected species (in millions) for 1970–2019 (as bars) [12] and for 2007 (shown as the diamond symbol) [10]. Total is the number of animals from each species listed plus rabbits, ducks, turkey, rodents, horses, buffalo, and asses.

Figure 2.
Structure of the current study using top-down and bottom-up methods to determine the contribution of meat consumption to GHG footprints.
Figure 2.
Structure of the current study using top-down and bottom-up methods to determine the contribution of meat consumption to GHG footprints.

Figure 3.
Direct and indirect GHG emissions from livestock by source for different GHGs as a percentage (CO2e) (the numbers in each pie slice) [18]. Emissions associated with feed are shown in blue shades and include: application of manure; CO2 emissions from feed production; land use (LU) including pasture expansion and with soy and palm oil production; CH4 emissions from rice grown for feed. Emissions related to processing and transport and on-farm energy use are shown in red shades. Gray is used solely for emissions from enteric fermentation and brown shades show emissions related to manure management.

Figure 4.
GHG emissions from food categories by UK consumption [42] allocated here to products derived from animals (brown shades) and other categories (green shades) as a percentage of food-related emissions (shown on each slice).
Figure 4.
GHG emissions from food categories by UK consumption [42] allocated here to products derived from animals (brown shades) and other categories (green shades) as a percentage of food-related emissions (shown on each slice).

Figure 5.
Bar chart showing ranked annual GHG emissions (including agriculture) by the 19 highest emitting countries [43] for 2019. These are plotted with total emissions by livestock species (livestock numbers from 2010 [18] and emissions factors from Section 2.1 and Equation (5)) as shown in Table 5.

Figure 6.
UK GHG emissions by sector over time, aggregated from emissions by product as described in Section 2.2 [42]. “Food” includes restaurants and hotels; “Personal” includes clothing, footwear, tobacco, alcohol, and other drinks; “Utilities” include fuel and water; “Home” includes rentals, repair, and furnishings; “Transport” includes personal transport and transport services; all other services are grouped into “Services” including medical, education, and recreation.


Table 1.
Global livestock numbers for selected species (in millions) for 1970–2019 [12] and for 2007 [10]. Total includes rabbits, ducks, turkey, rodents, horses, buffalo, and asses. Human population taken from [14].
| 1970 | 1980 | 1990 | 2000 | 2010 | 2019 | 2007 [10] | |
|---|---|---|---|---|---|---|---|
| Cattle | 1082 | 1217 | 1297 | 1320 | 1412 | 1511 | 1430 |
| Pigs | 547 | 798 | 849 | 899 | 972 | 850 | 980 |
| Sheep and goats | 1441 | 1563 | 1794 | 1825 | 2017 | 2333 | 1870 |
| Poultry | 5712 | 7978 | 11,787 | 16,021 | 22,262 | 27,883 | 19,600 |
| Total | 9693 | 12,425 | 16,604 | 20,784 | 27,295 | 32,943 | |
| Human population (billions) | 3.7 | 4.46 | 5.33 | 6.14 | 6.96 | 7.71 | |
| Ratio livestock per human | 2.6 | 2.8 | 3.1 | 3.4 | 3.9 | 4.3 |
Table 2.
Comparison of emissions factors by weight and by protein weight for meat and food products from different studies.
Table 2.
Comparison of emissions factors by weight and by protein weight for meat and food products from different studies.
| kgCO2e/kg | kgCO2e/kg Protein | |||||||
|---|---|---|---|---|---|---|---|---|
| Source | [22] | [23] | [24] | [25] | [26] | [27] | WE [18] | NA [18] |
| Beef/cattle | 40.5 | 18.2 | 9–129 | 35.9 (Meat) | 27.0 | 60.0 | 64.3 | 94.6 |
| Chicken | 5.9 P | 4.0 | 2–6 P | 5.4 P | 6.9 | 6.0 | 27.5 | 20.2 |
| Eggs | 3.0 | 3.0 | 2–6 | 4.8 | 4.5 | |||
| Fish | 7.7 | 2.8 | 1–86 | 5.4 | 11.9 | 5.0–12.0 | ||
| Pork | 7.0 | 5.0 | 4–11 | 12.1 | 7.0 | 50.0 | 36.5 | |
| Lamb/goat | 50.4 | 23.0 | 10–150 | 39.2 | 24.0 | 95.5 | 217.2 | |
| Turkey | 5.6 | 10.9 | ||||||
| Cheese/dairy | 2.0 | 1–22 | 1.8 | 13.5 | 21.0 | |||
| Meat substitutes | 1–2 | |||||||
| Vegetable oils | 3.0 | 6.0–8.0 | ||||||
| Rice | 1.7 | 3.9 | 2.7 | 4.0 | ||||
| Sugar | 0.1 | 3.0 | ||||||
| Nuts | 2.3 | 2.5 | ||||||
| Vegetables | 0.5 | 1.6 | 1.1–2.9 | 0.3–3.0 | ||||
| Pulses | 1–2 | 0.9 | ||||||
P = number for all poultry, WE = Western Europe, NA = North America.
Table 3.
Greenhouse gas emissions by economic sector in the US for 2019 [35].
Table 3.
Greenhouse gas emissions by economic sector in the US for 2019 [35].
| Sector | % | Mt CO2eyr−1 |
|---|---|---|
| Transport | 29 | 1876 |
| Electricity | 25 | 1648 |
| Industry | 23 | 1504 |
| Agriculture | 10 | 669 |
| Crop | 368 | |
| Livestock | 261 | |
| Fuel combustion | 41 | |
| Commercial | 7 | 455 |
| Residential | 6 | 380 |
| Total | 100 | 6532 |
Table 4.
Highest GHG emissions as a function of consumption in the UK from 2007 to 2017 [42].
Table 4.
Highest GHG emissions as a function of consumption in the UK from 2007 to 2017 [42].
| Categories | GHG (kgCO2e per £) |
|---|---|
| Personal travel and season tickets | 8.55–11.11 |
| Imputed rent | 6.69 |
| Natural gas | 6.31 |
| Haberdashery, clothing materials, and clothing hire | 5.23 |
| Legal fees, professional organizations and fees, and funeral expenses | 4.47 |
| Electricity | 3.67 |
| NHS prescription charges and payments | 2.94 |
| Beef, pork, lamb, poultry, bacon, and ham sausages (fresh, chilled, or frozen) | 2.85 |
Table 5.
GHG emissions from enteric fermentation and estimated total GHG emissions (including all sources as described in Section 2.1) from selected livestock species. Note that species like buffalo are not included. Calculations are made using Equation (5) and the methodology outlined in Section 2.1.
| Enteric Fermentation Only | Total Estimated Emissions MtCO2eyr−1 | ||||||||||||||
|---|---|---|---|---|---|---|---|---|---|---|---|---|---|---|---|
| Number (Millions) | Emission Factor EFs | CH4 Emissions Mtyr−1 | CO2 Emissions MtCO2eyr−1 | ||||||||||||
| Global | UK | US | Global | UK | US | Global | UK | US | Global | UK | US | Global | UK | US | |
| Source | [18] | [40,51] | [41,47,48,52] | [15] | [8,18] | [8,18] | |||||||||
| Cattle | 1511 | 57 | 86 | 2412 | 5481 | ||||||||||
| Beef | 7.2 | 94.4 | 52 | 64 | 0.4 | 6.0 | 10 | 169 | 24 | 384 | |||||
| Dairy | 1.9 | 9.4 | 126 | 138 | 0.2 | 1.3 | 7 | 36 | 15 | 83 | |||||
| Pigs | 850 | 5.1 | 79.1 | 5.5 | 7 | 12 | 1 | 0.0 | 0.1 | 131 | 1 | 3 | 298 | 2 | 60 |
| Sheep | 2333 | 33.1 | 5 | 7 | 7 | 7 | 16 | 0.2 | 0.0 | 457 | 6 | 1 | 1039 | 15 | 2 |
| Chickens | 27,833 | 187 | 8500 | 0.26 | 0.26 | 0.26 | 7 | 0.0 | 2.2 | 203 | 1 | 62 | 461 | 3 | 141 |
| Total | 111 | 0.9 | 9.7 | 3107 | 26 | 272 | 7278 | 59 | 670 | ||||||
Table 6.
Comparison of GHG footprints (per person per year) calculated here using different methods focused on the UK and the US.
Table 6.
Comparison of GHG footprints (per person per year) calculated here using different methods focused on the UK and the US.
| Method/Source of Data | Global tCO2eyr−1 | UK tCO2eyr−1 | US tCO2eyr−1 | |
|---|---|---|---|---|
| Top-down | Total GHG (with land use) 2019 [1] | 6.7 (7.6) | ||
| Total GHG 2018 [43] (Section 3.1.) | 6.3 | 6.6 | 17.5 | |
| Country’s own data for total GHG [35,42] (Section 3.1) | 11.5 | 19.8 | ||
| Country’s own data for livestock emissions [32,35] (Section 3.2.1) | 0.7 | 1.6 | ||
| GLEAM livestock emissions (scaled from regional data for the UK and US) [10,18] (Section 3.2.2) | 1.0 | 1.1 | 1.6 | |
| Livestock emissions (Table 5) (Section 3.2.3) | 0.9 | 2.0 | ||
| Bottom-up | Carbon footprint calculator (excludes food) [55] | 8.9 | ||
| Emissions from food/animal products only (consumption analysis, Section 3.3) | 1.5/1.3 | |||
| Emissions from meat consumption (Section 3.3) | 1.5 | |||
| Food diary meat eaters (M)/vegetarian (V)/vegan (N) [28] | 2.6 M/1.4 V/0.5 N | |||
| Population-based survey [30]. Original diet/100% meat replaced with plant protein | 1.4–1.7 M/0.7 V | |||
| Review using footprint calculators [31] High red meat/average/vegetarian/vegan | 1.6–5.3 M/1.3–5.7 M/0.5–2.7 V/0.2–2.3 N |
Table 7.
Comparison of methods of reducing an individual carbon footprint (per person). The comparative data are calculated from [1,28,82].
| Activity | Reduced tCO2eyr−1 |
|---|---|
| Drive ~100 miles less each week, save one liter of petrol | 1.2 |
| Eat one 200 g steak less per week | 0.6 |
| Take one less return flight within Europe (~1000 km) | 0.4 |
| Take one less return long-haul flight (~11,000 km) | 1.8 |
| Reduce TV use by 6 h a week, save 1 kWh of electricity | 0.05 |
| Removing meat from the diet | 1.3–1.5 |
Publisher’s Note: MDPI stays neutral with regard to jurisdictional claims in published maps and institutional affiliations. |
© 2022 by the author. Licensee MDPI, Basel, Switzerland. This article is an open access article distributed under the terms and conditions of the Creative Commons Attribution (CC BY) license (https://creativecommons.org/licenses/by/4.0/).
Share and Cite
MDPI and ACS Style
Barthelmie, R.J. Impact of Dietary Meat and Animal Products on GHG Footprints: The UK and the US. Climate 2022, 10, 43. https://0-doi-org.brum.beds.ac.uk/10.3390/cli10030043
AMA Style
Barthelmie RJ. Impact of Dietary Meat and Animal Products on GHG Footprints: The UK and the US. Climate. 2022; 10(3):43. https://0-doi-org.brum.beds.ac.uk/10.3390/cli10030043
Chicago/Turabian StyleBarthelmie, Rebecca J. 2022. "Impact of Dietary Meat and Animal Products on GHG Footprints: The UK and the US" Climate 10, no. 3: 43. https://0-doi-org.brum.beds.ac.uk/10.3390/cli10030043
Note that from the first issue of 2016, this journal uses article numbers instead of page numbers. See further details here.