
Homogenization and Trends Analysis of Monthly Precipitation Series in the Fez-Meknes Region, Morocco

 ,
,  ,
,  ,
,
Abstract
:1. Introduction
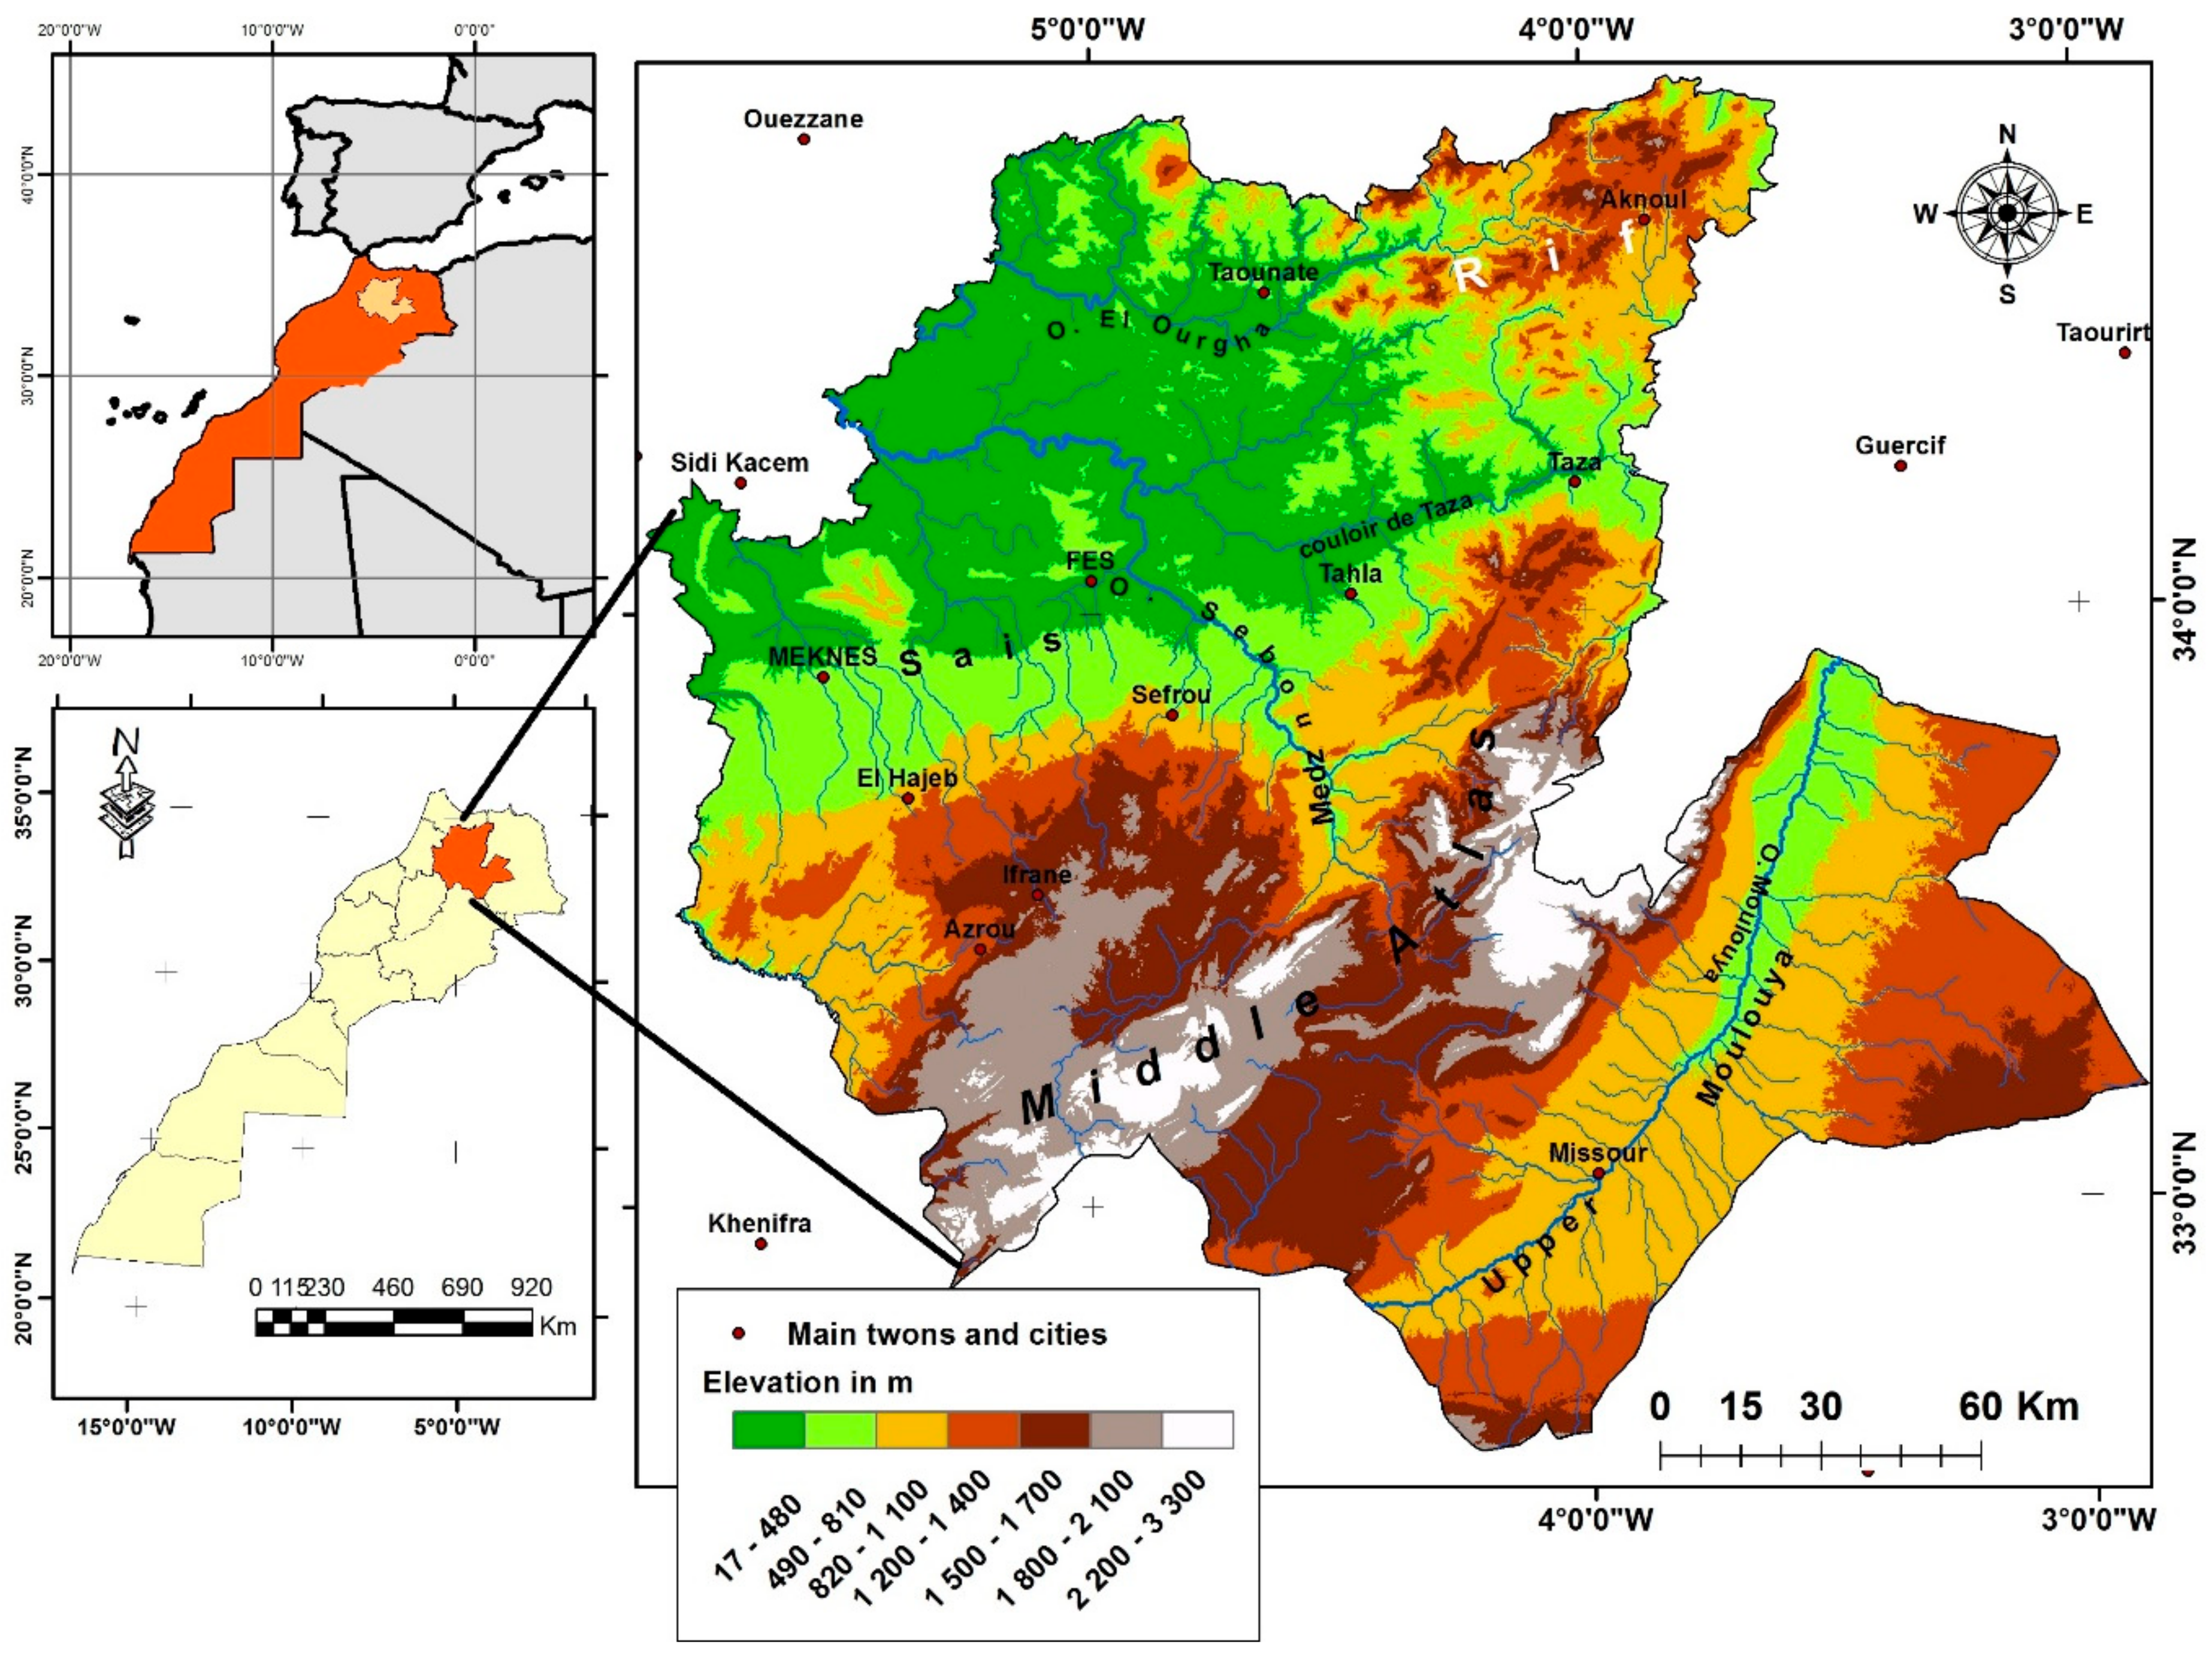
2. Study Area
3. Methods and Data
3.1. Methods
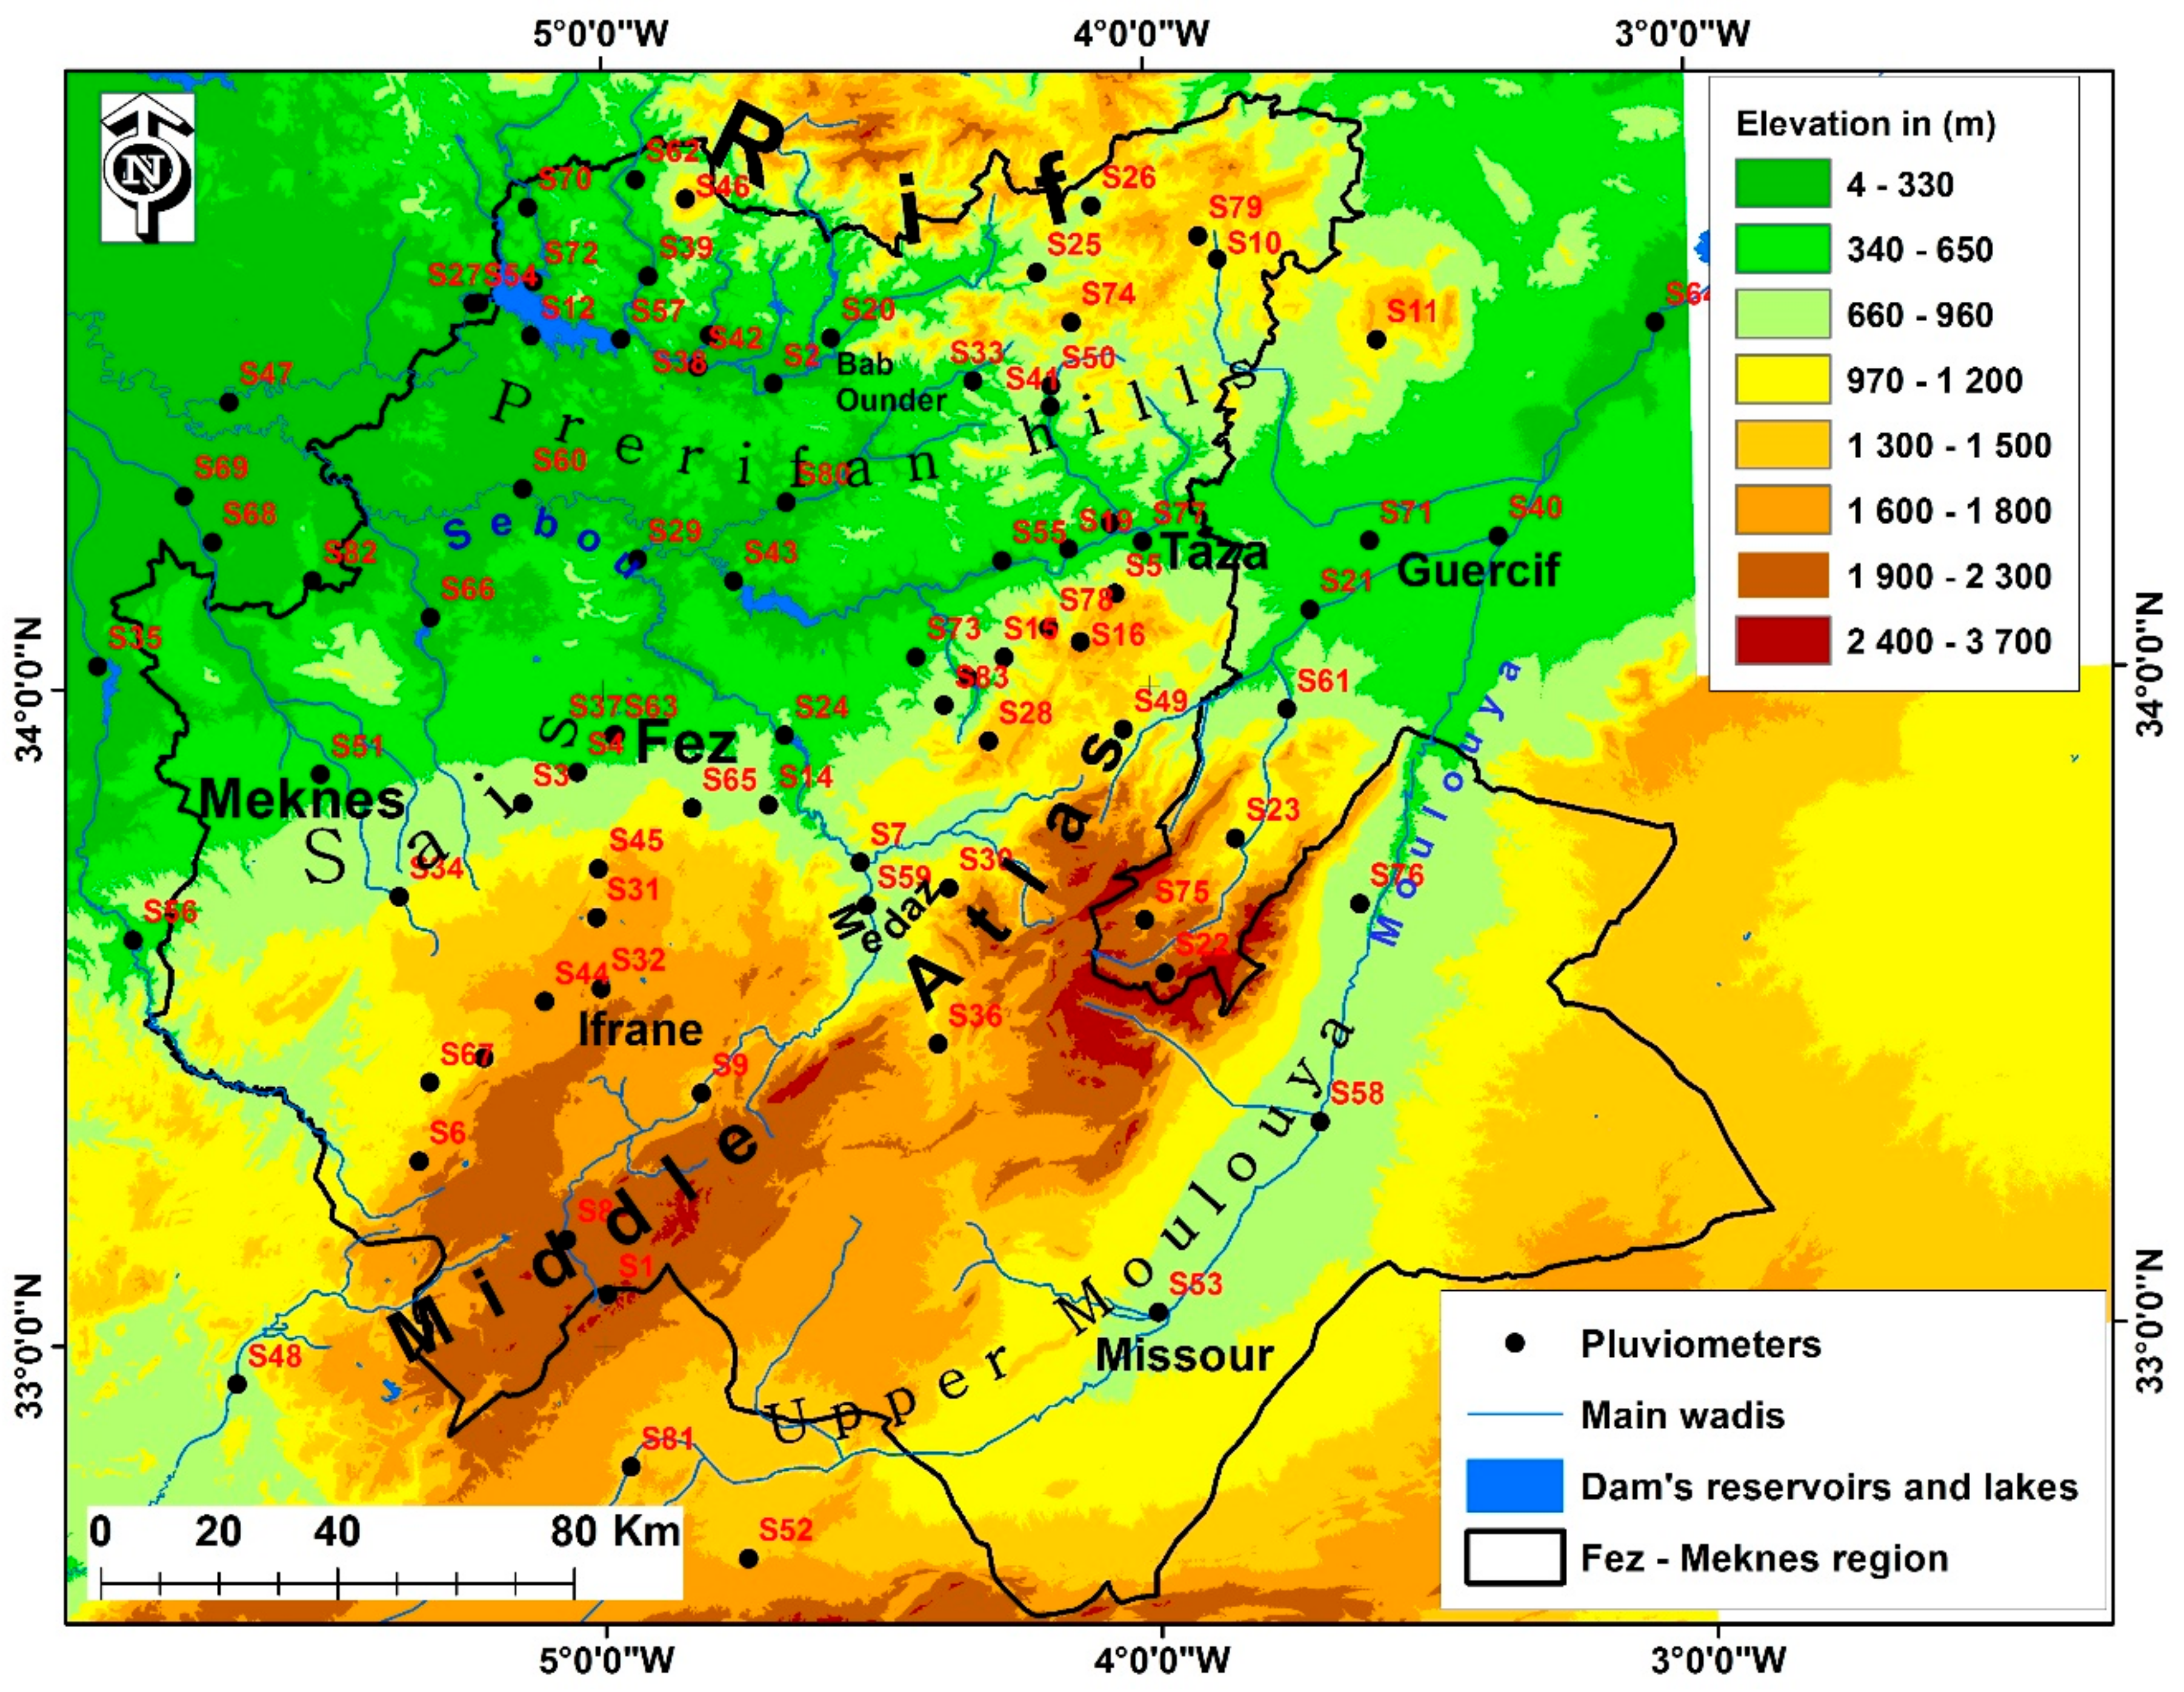
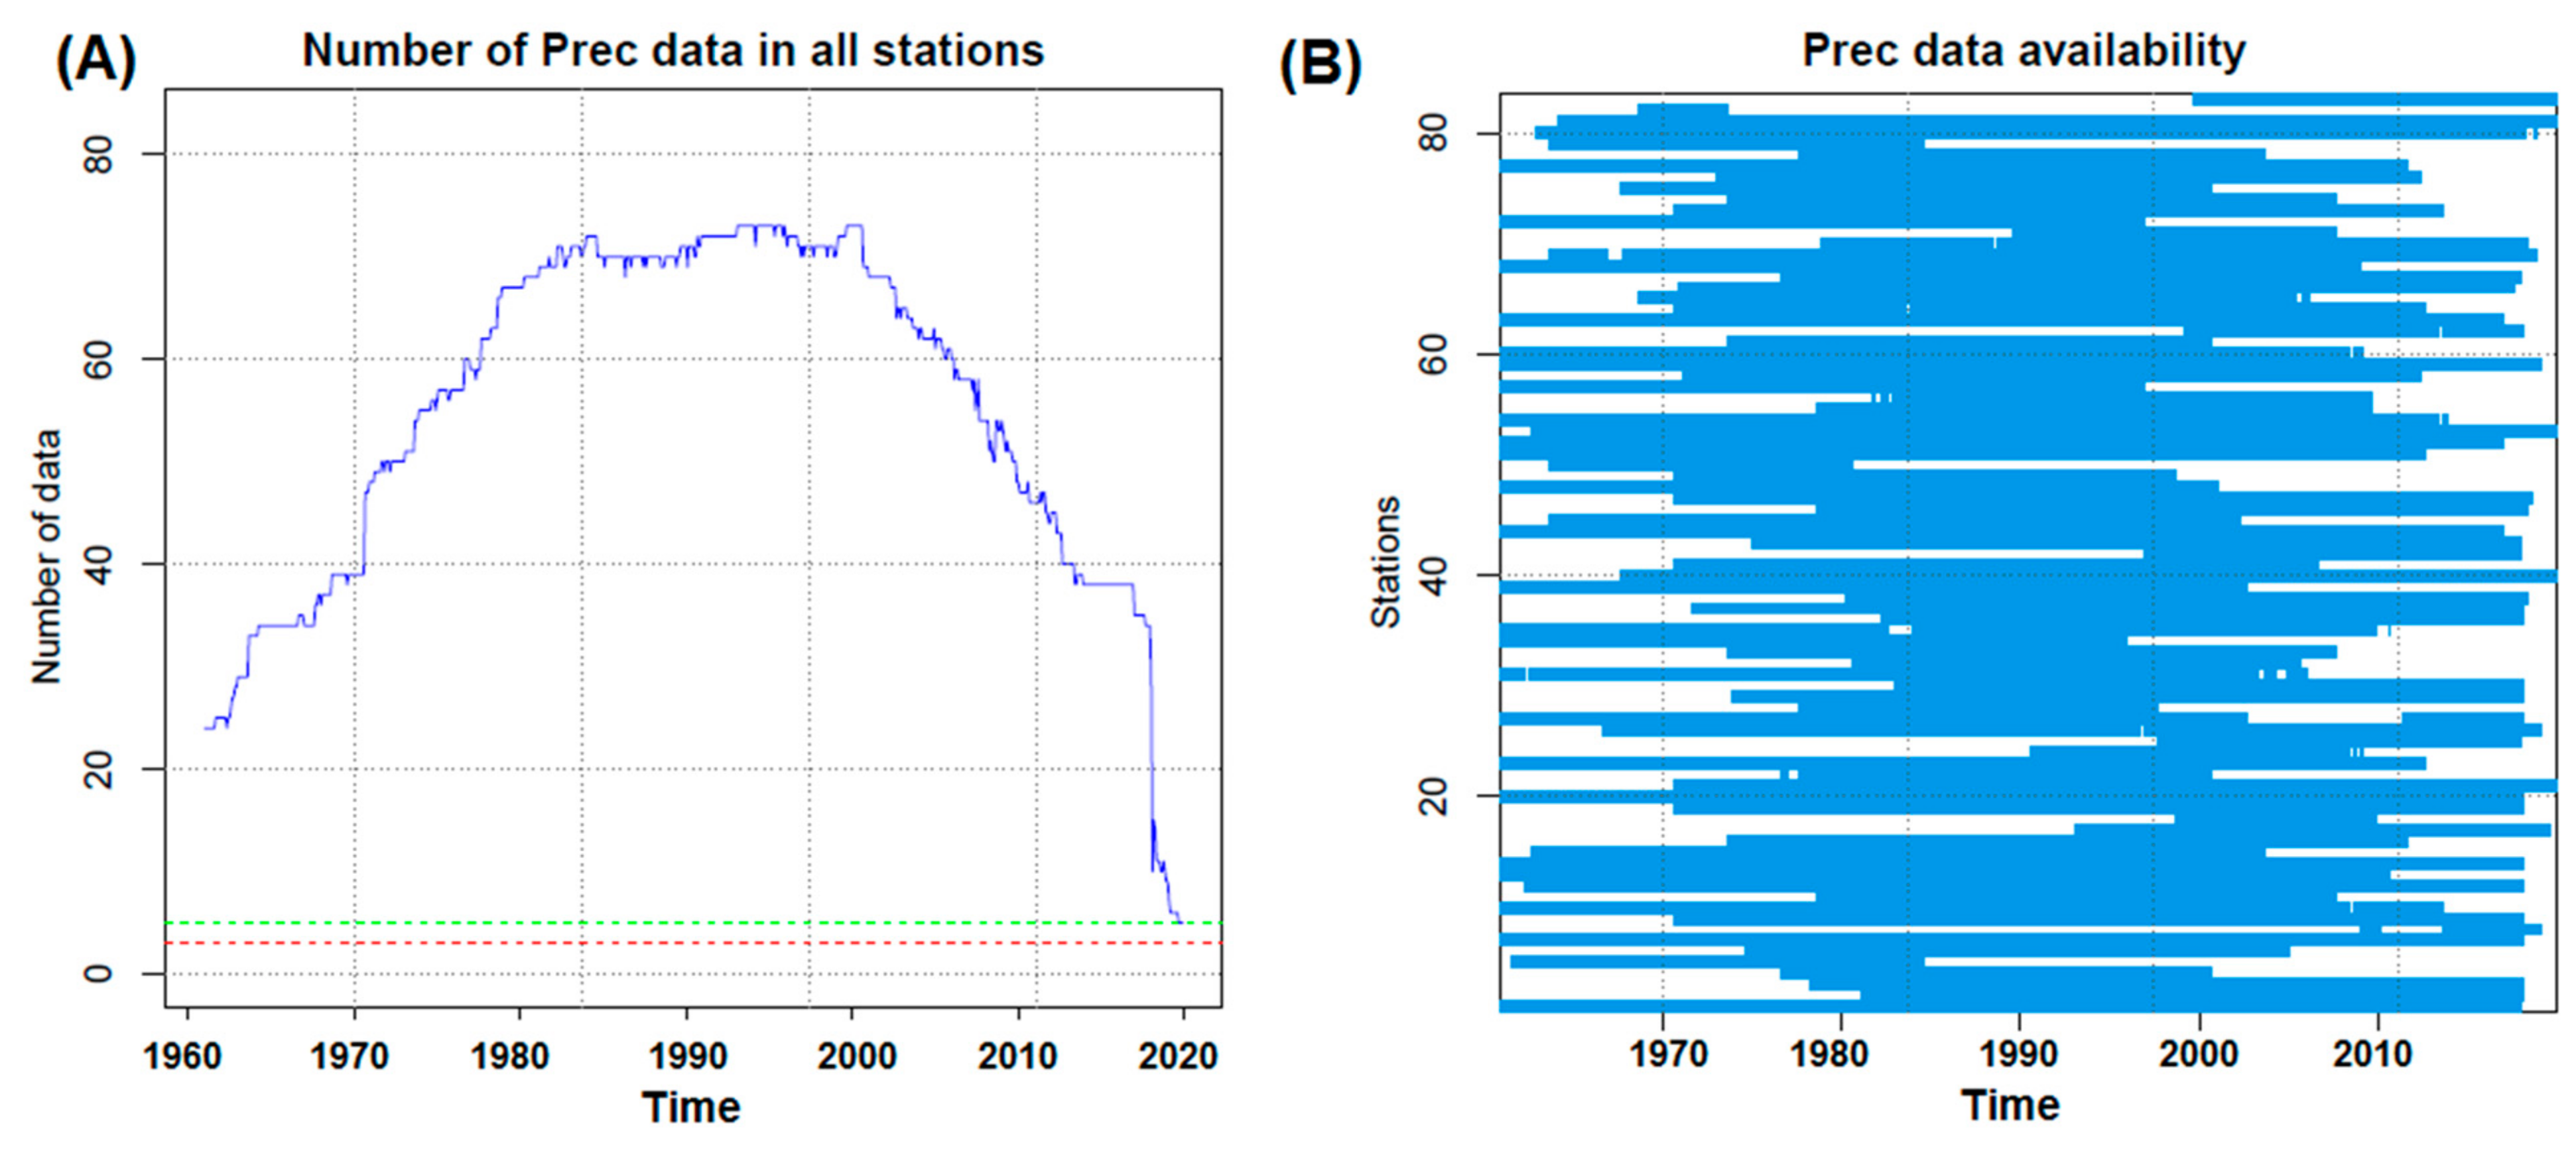
3.2. Data
4. Results
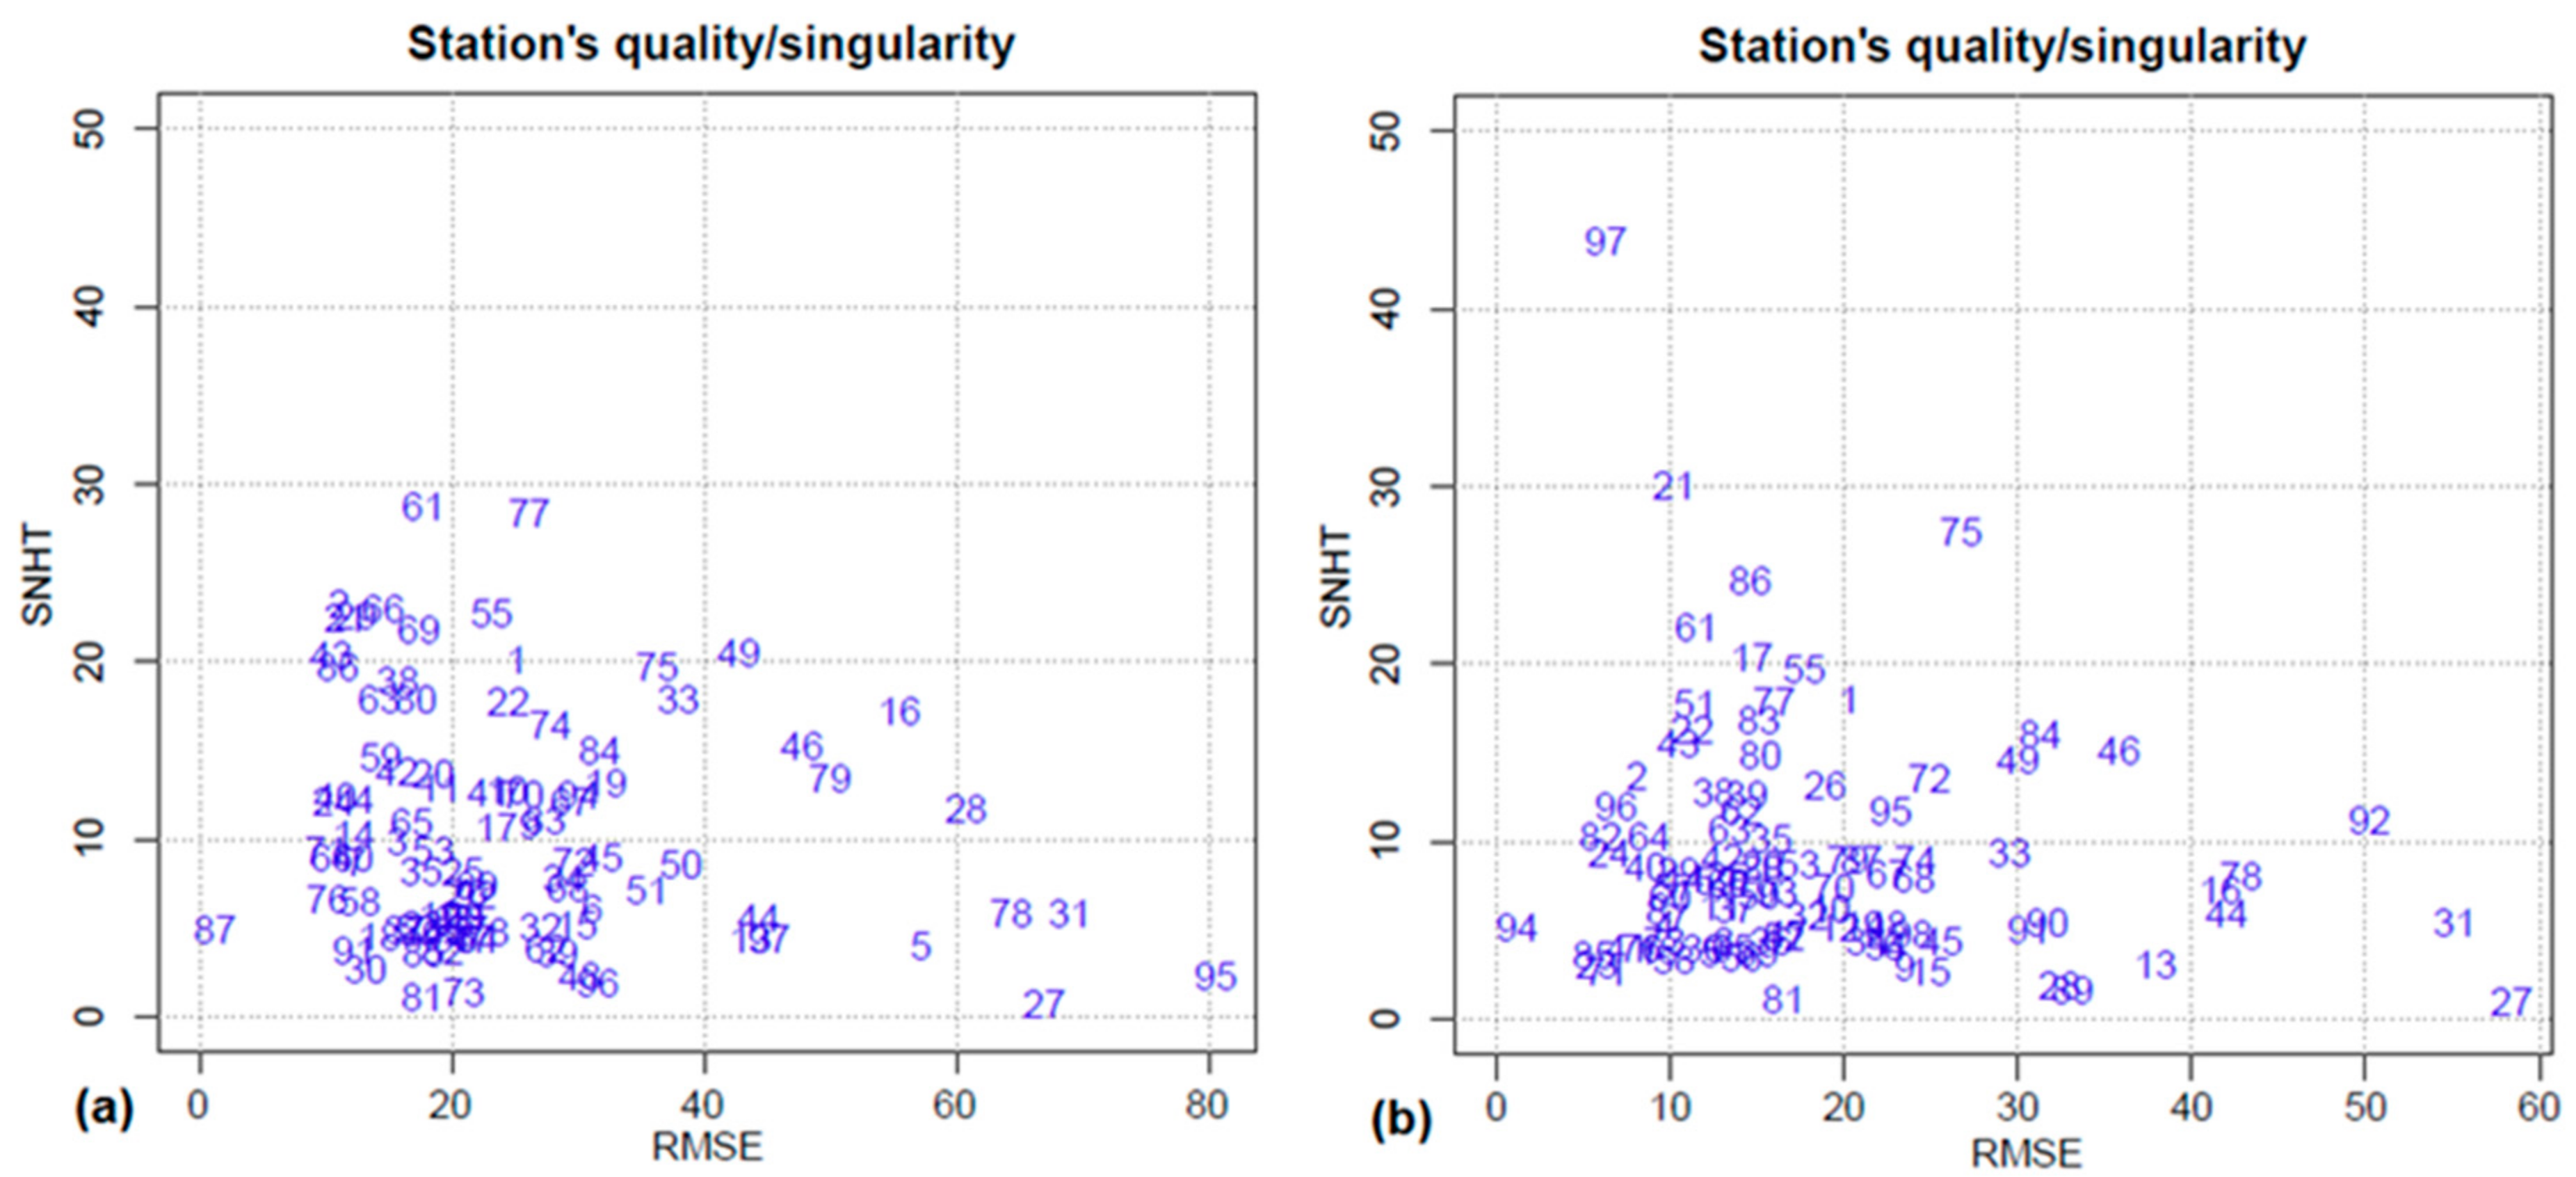
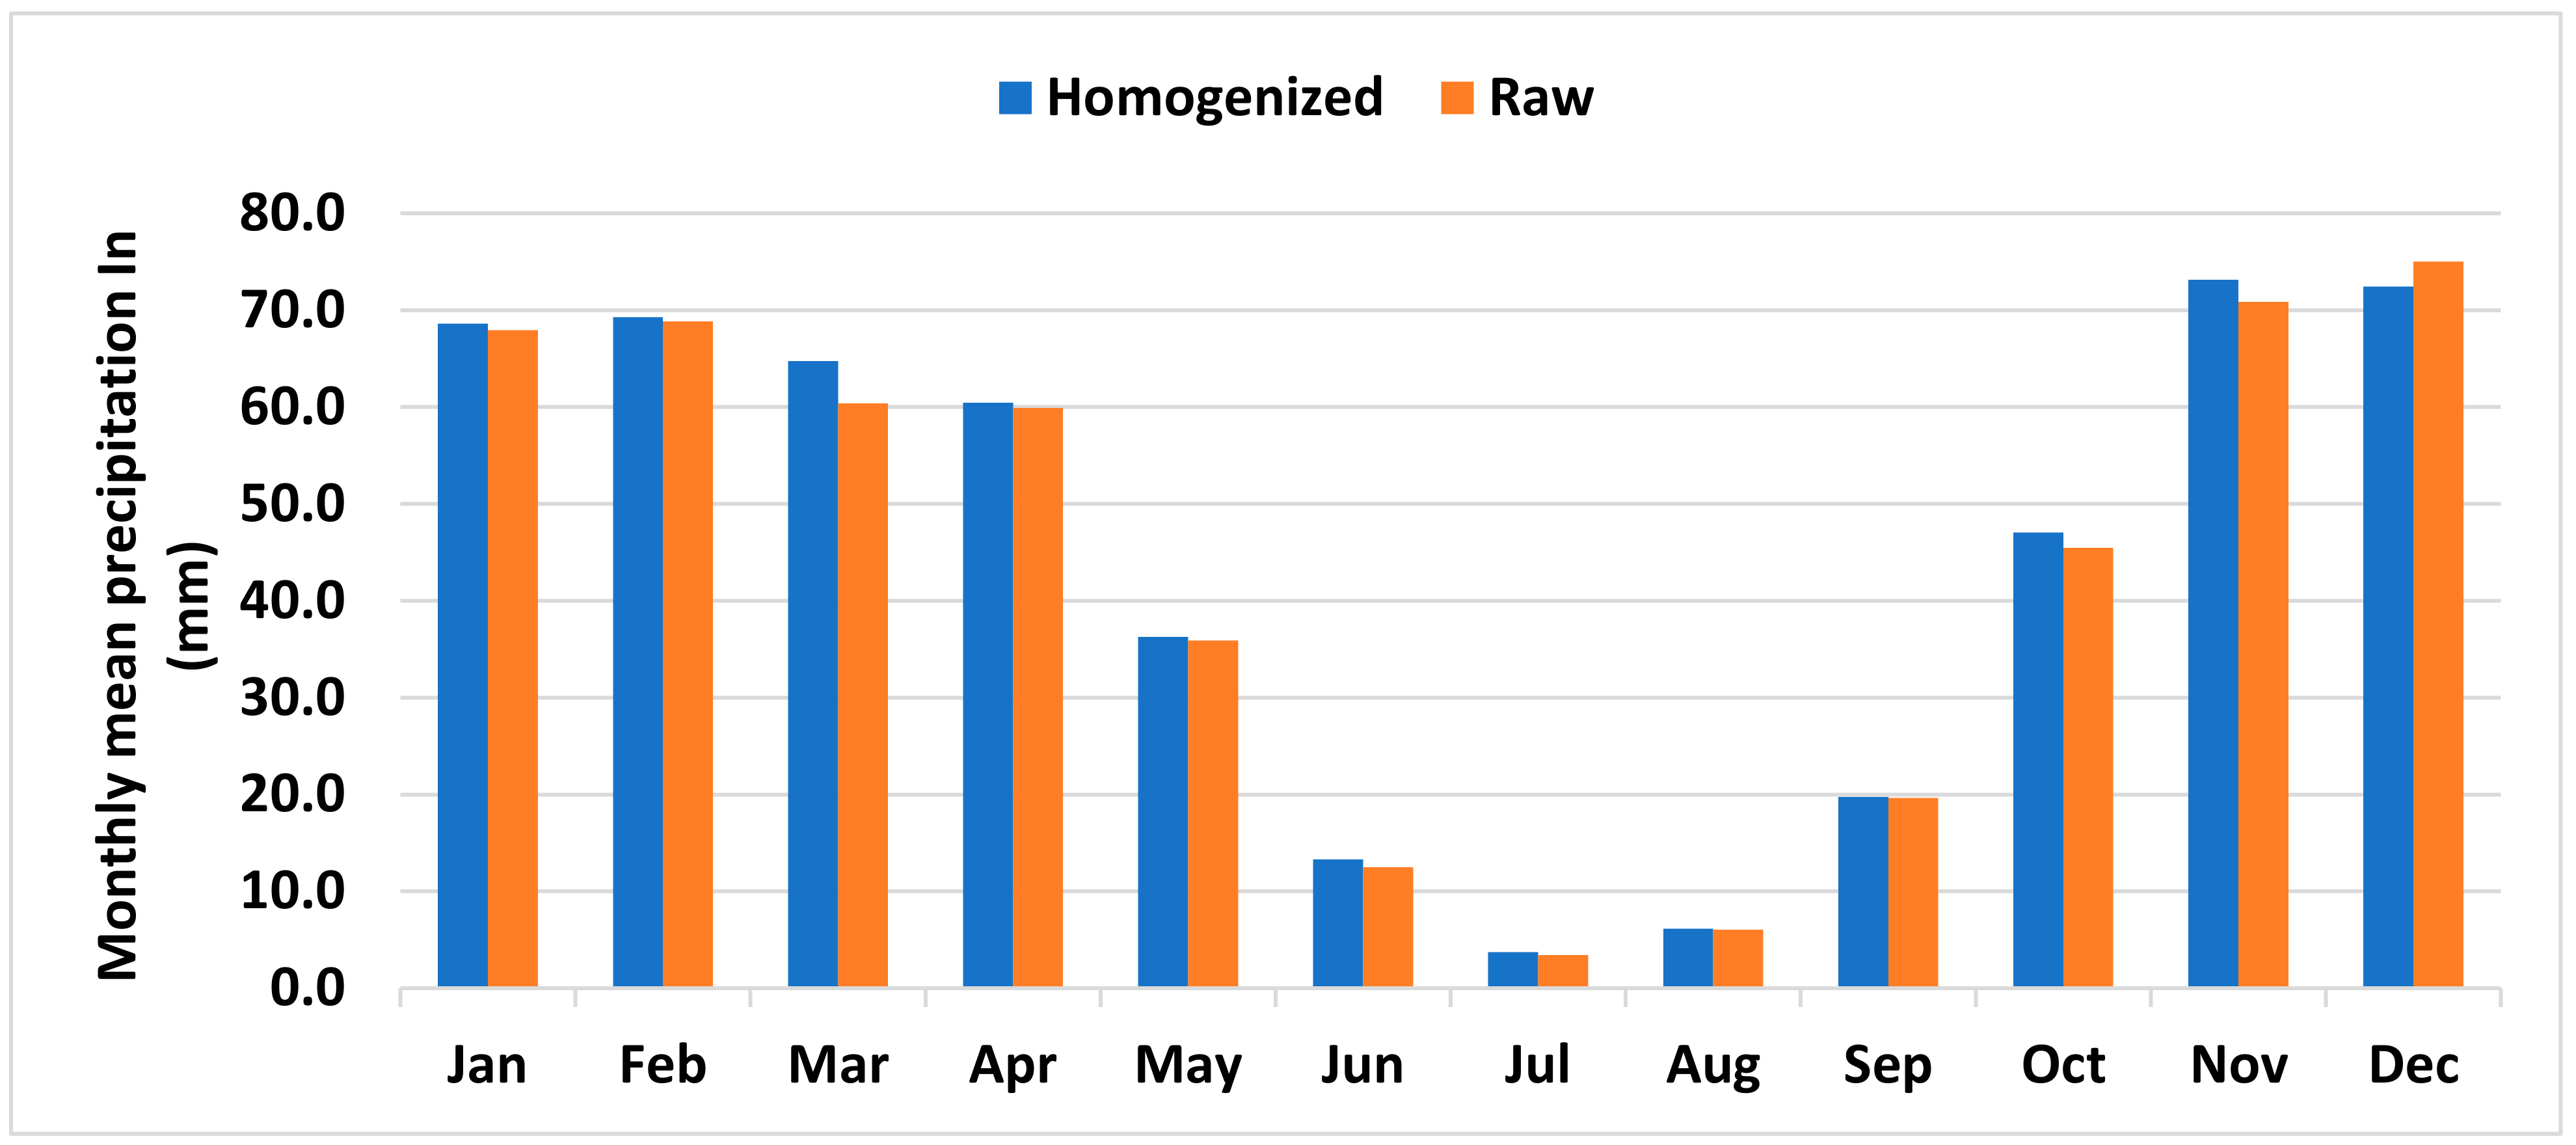
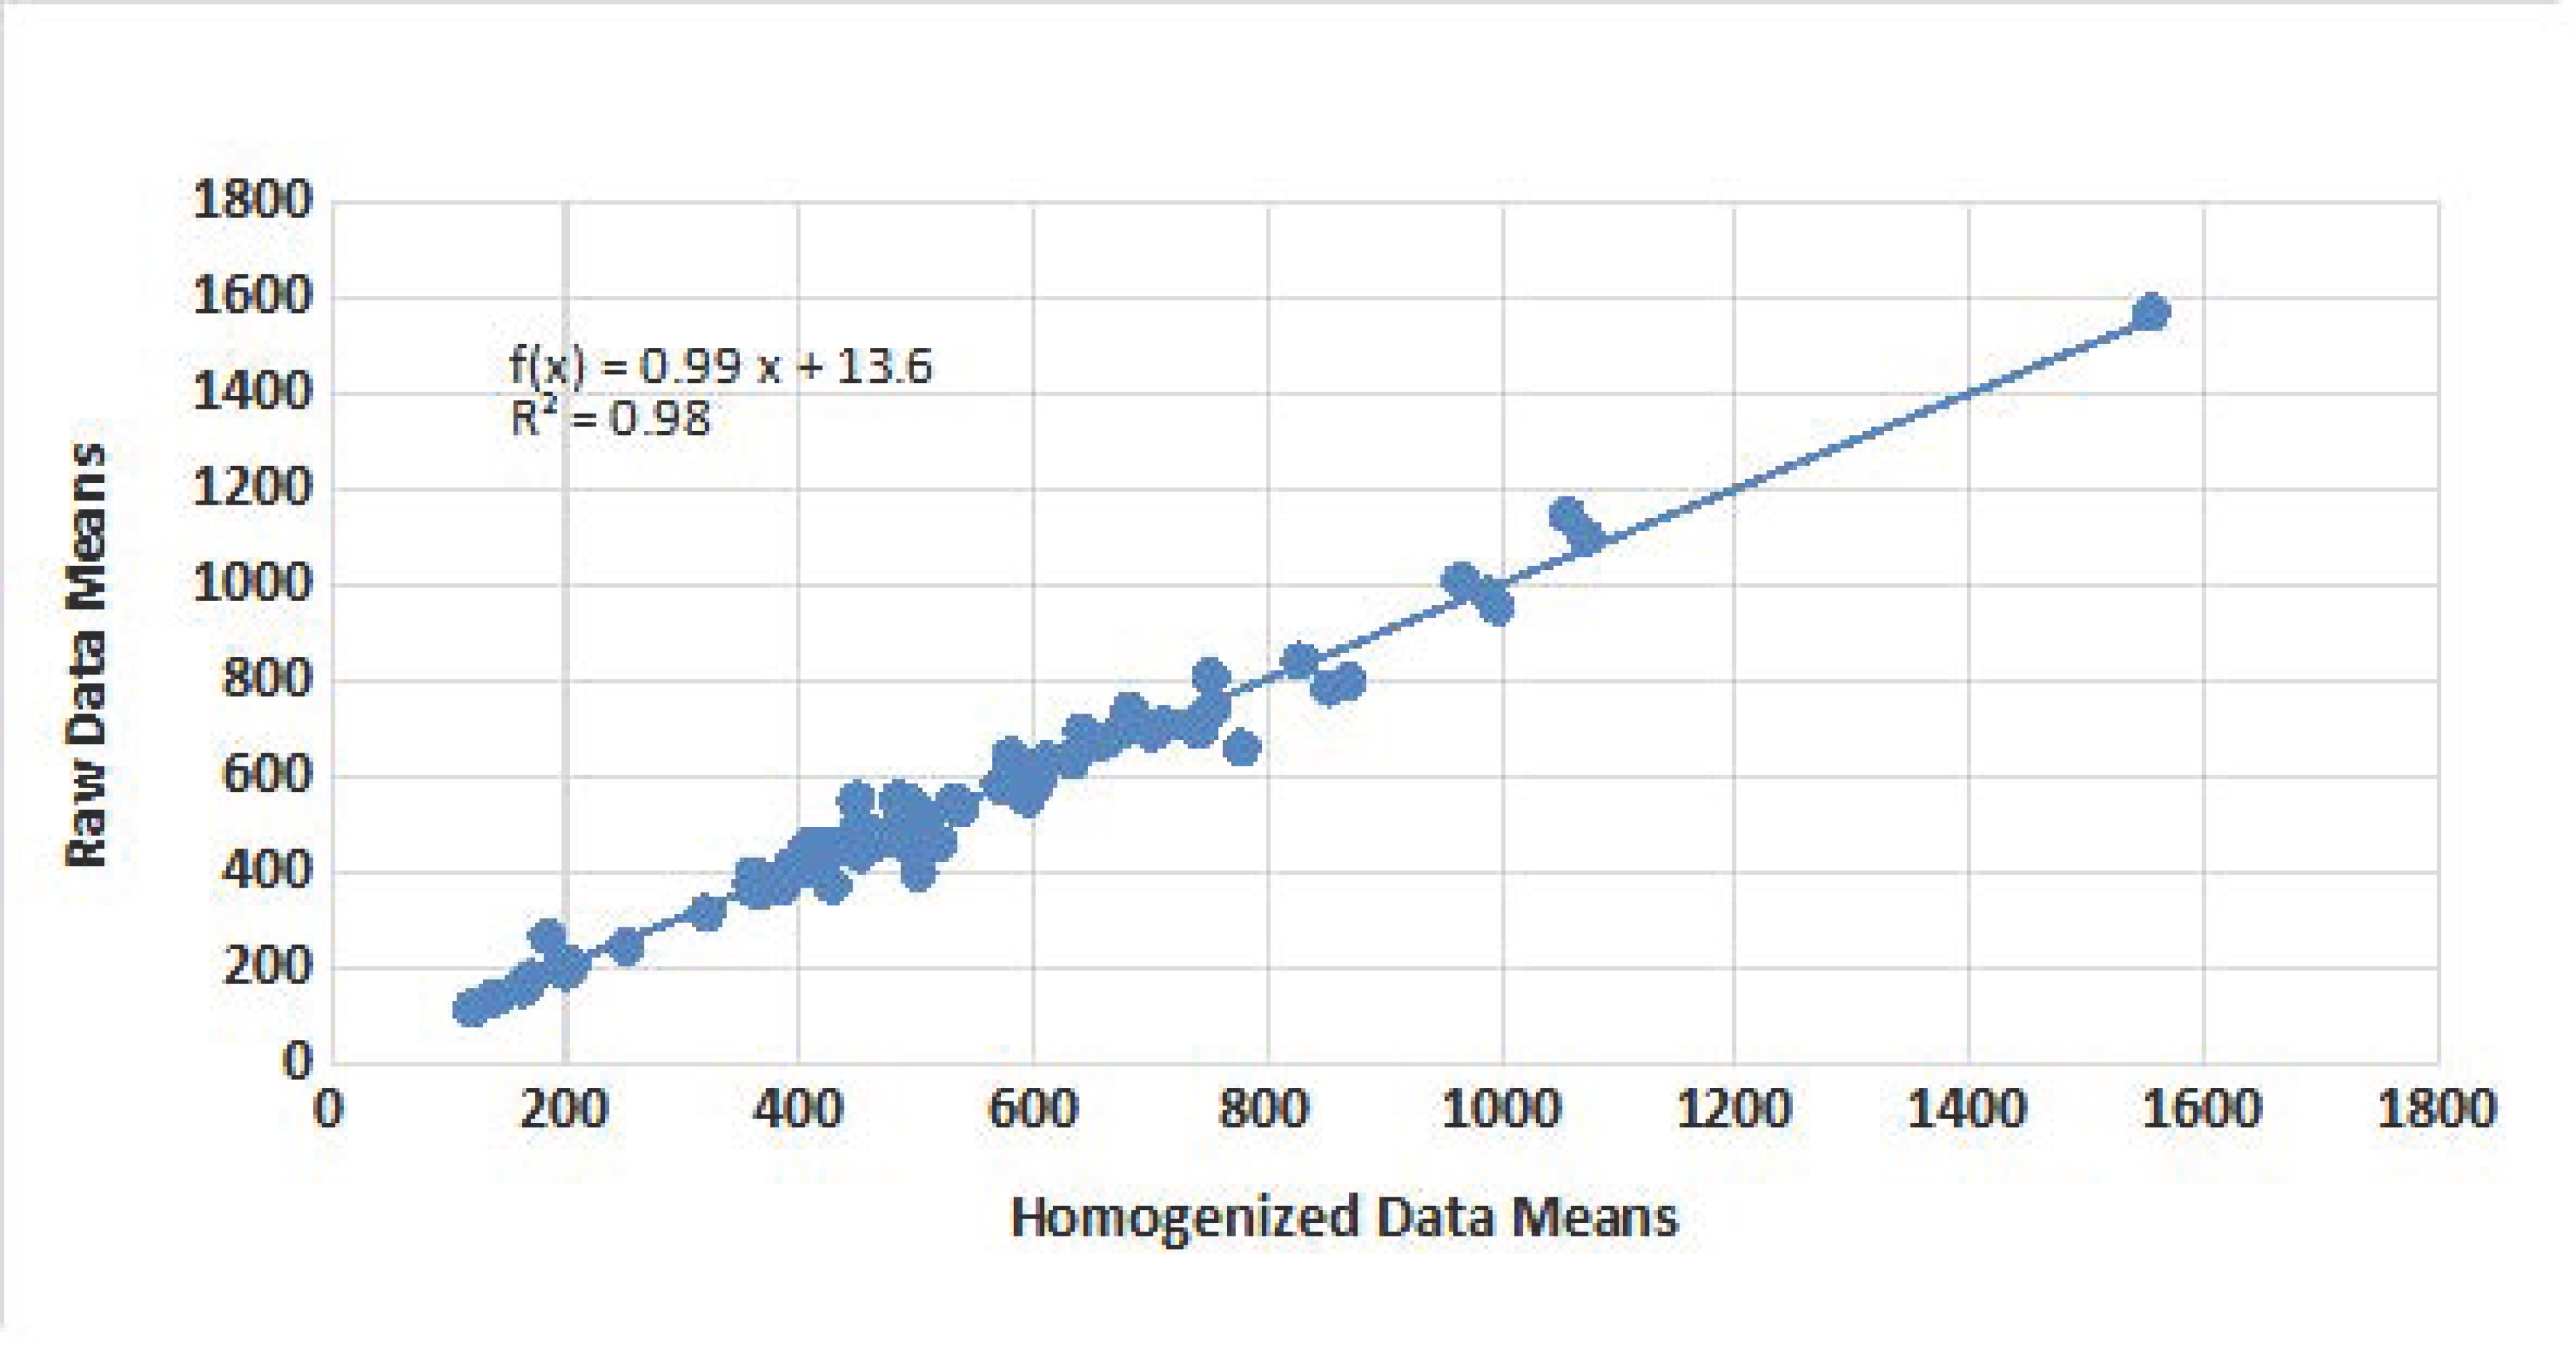
4.1. Quality Control and Homogenization
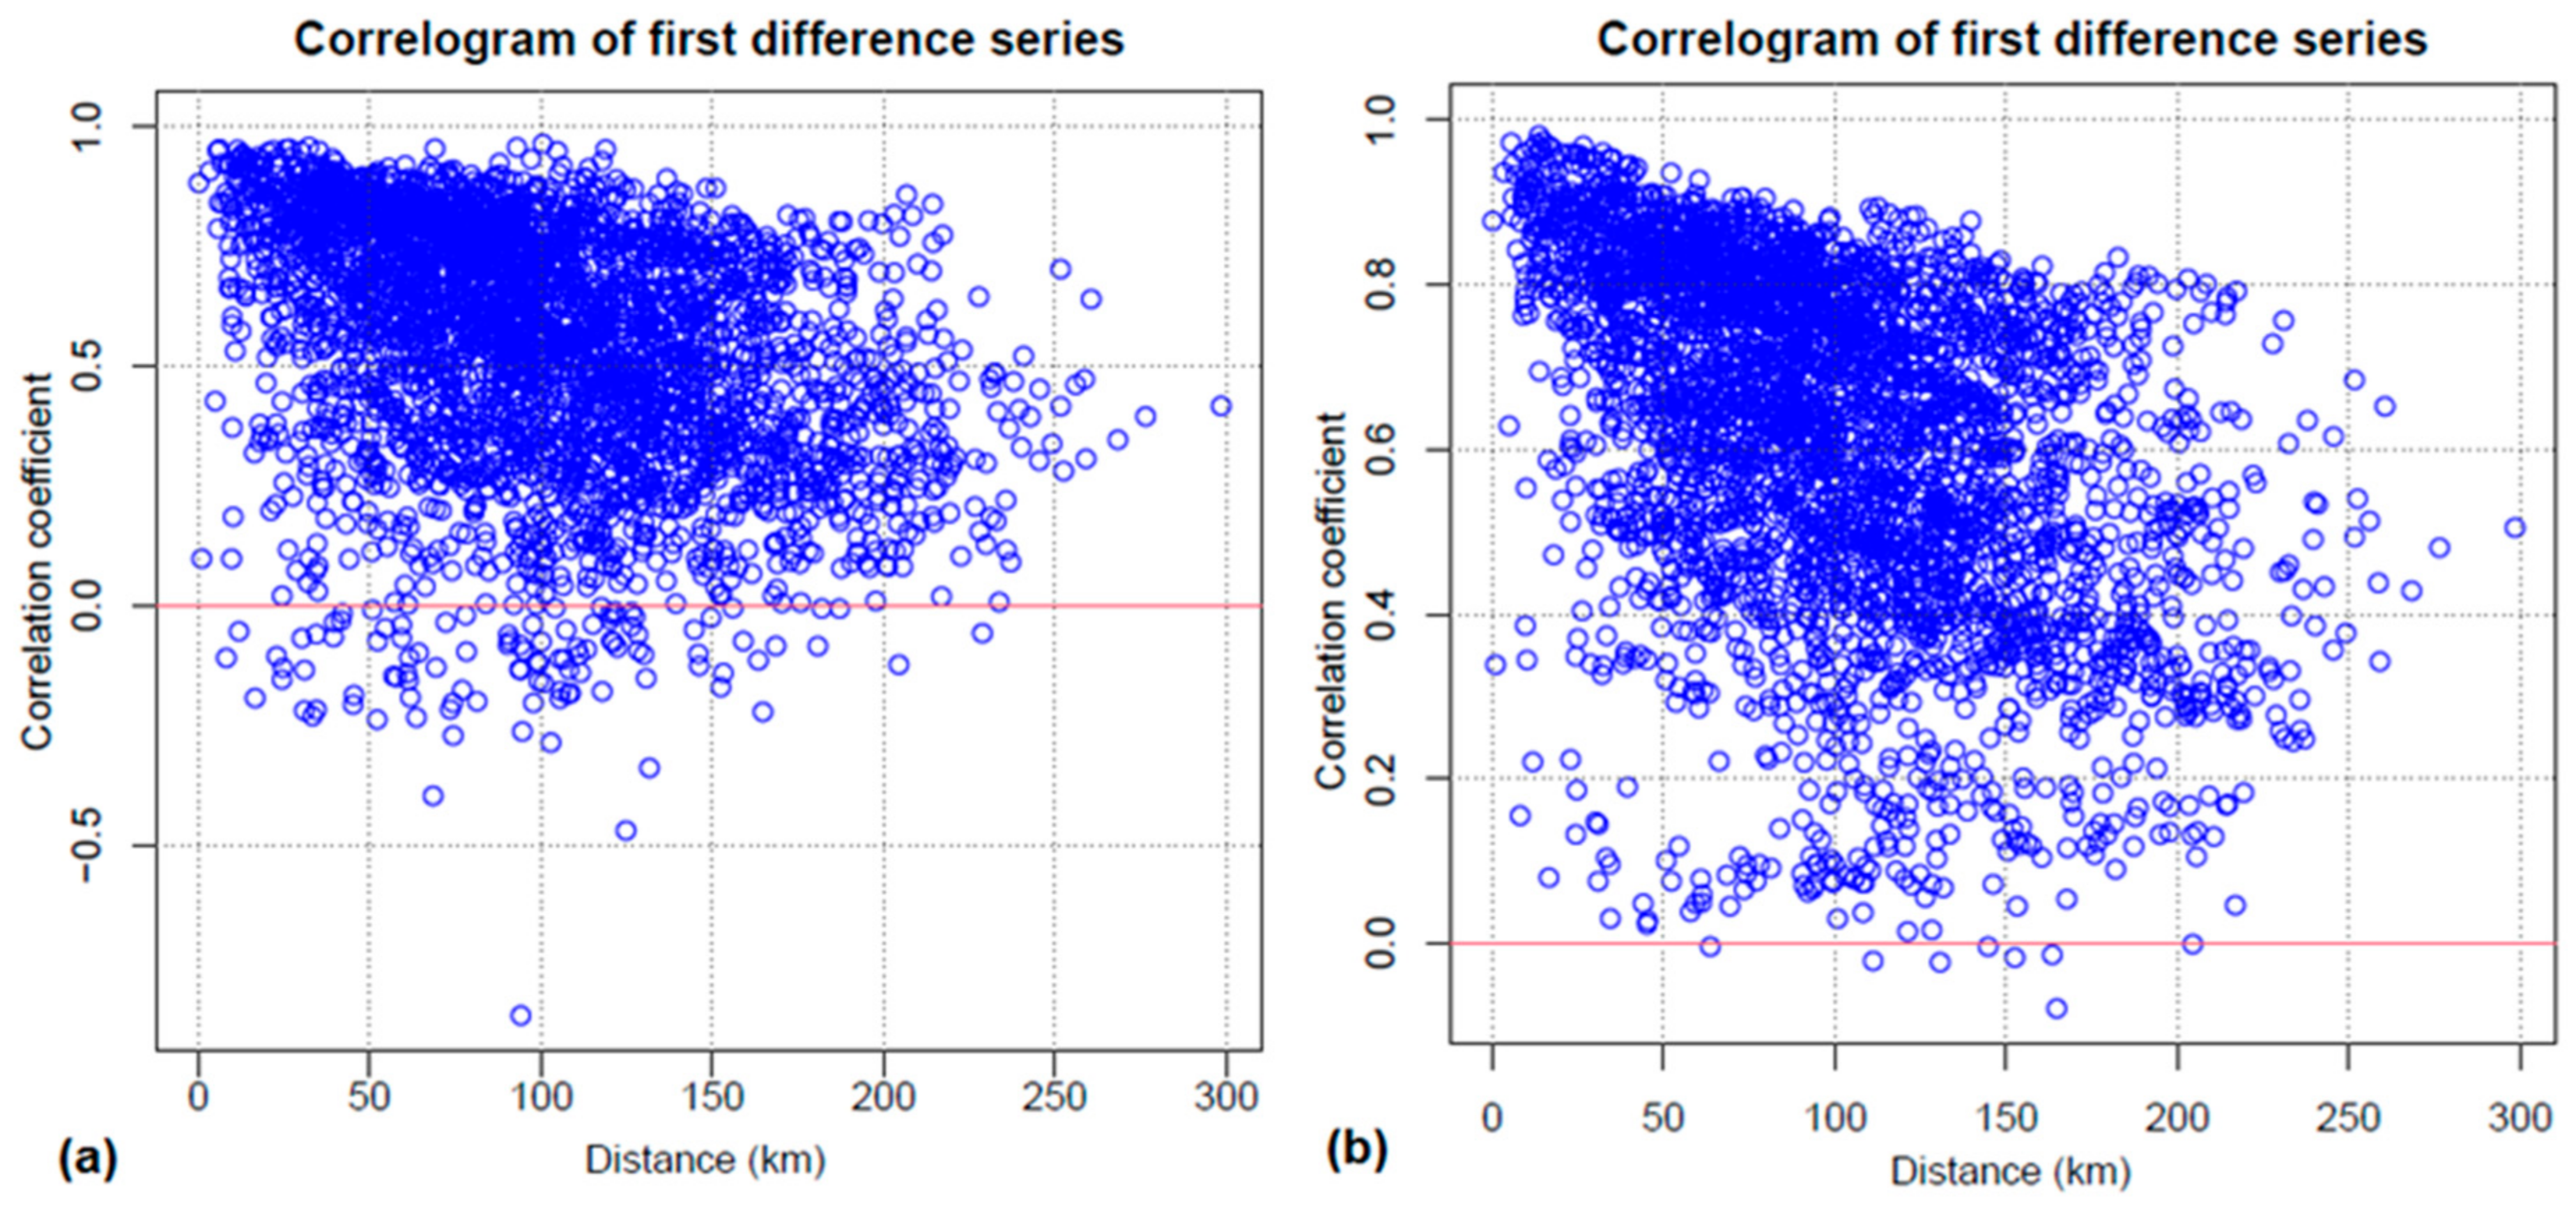
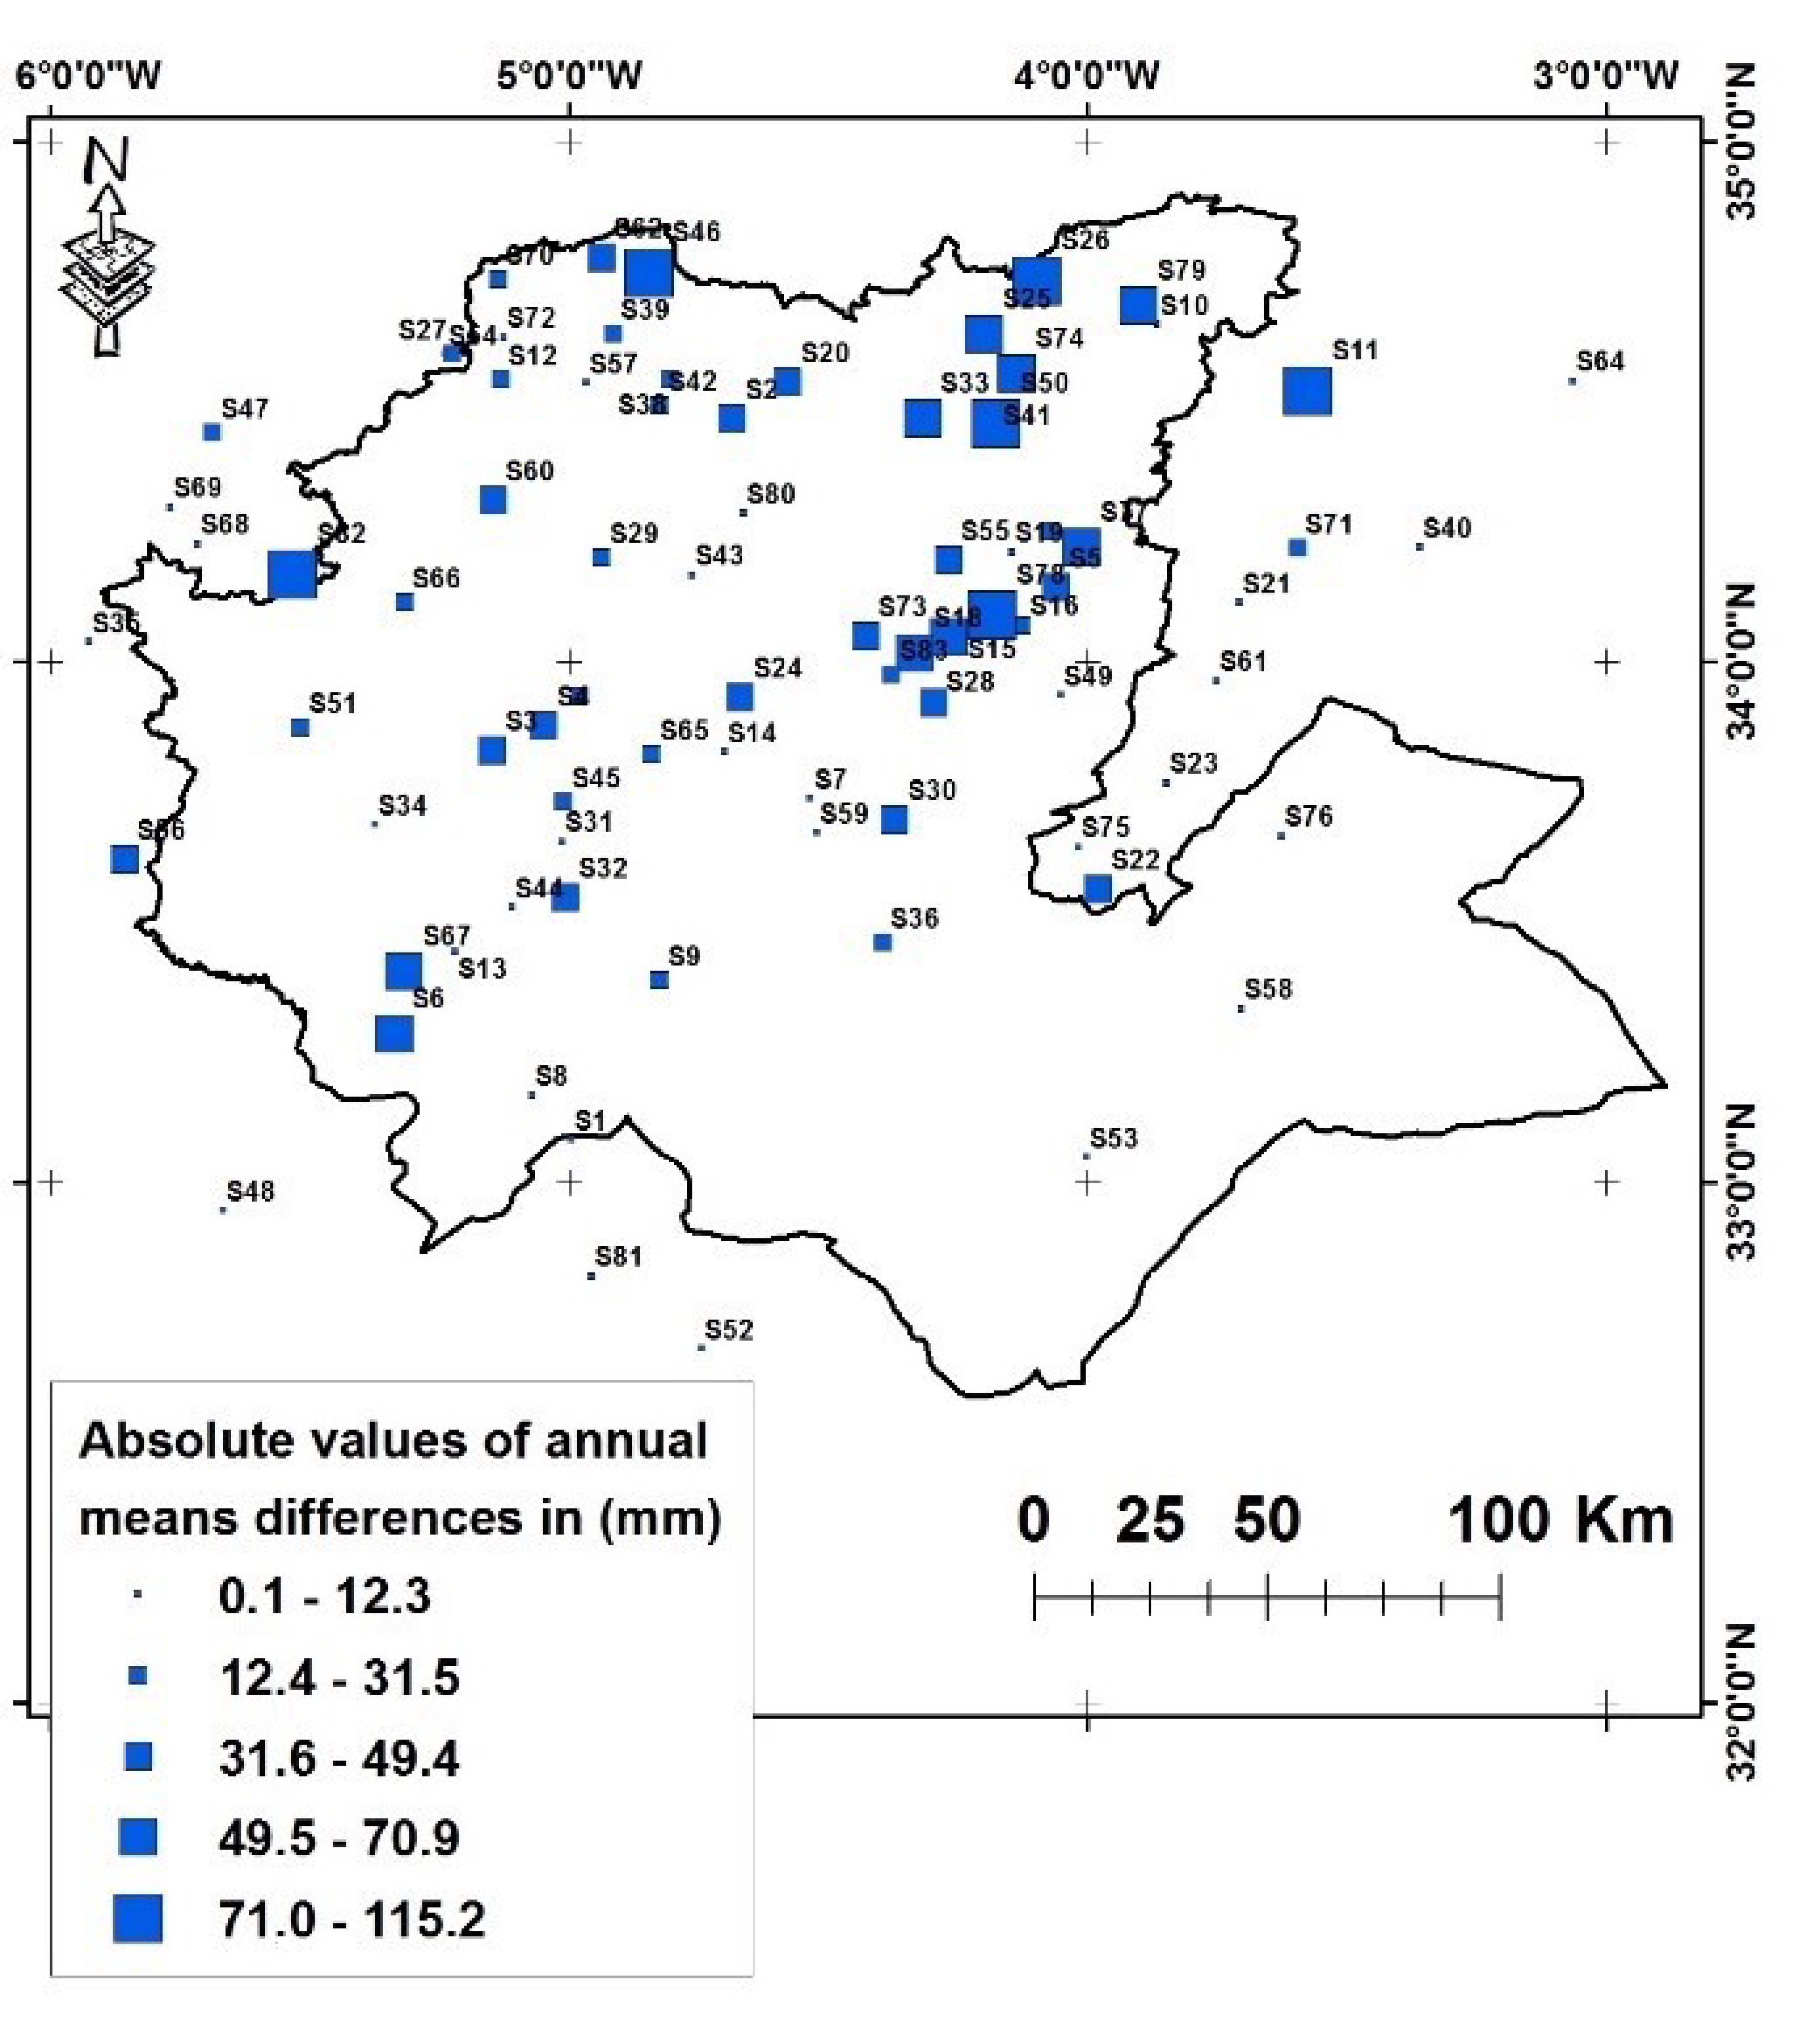
4.2. Regionalization of Stations
4.3. Trend Analysis
5. Discussion
6. Conclusions
Author Contributions
Funding
Institutional Review Board Statement
Informed Consent Statement
Acknowledgments
Conflicts of Interest
References
- Xoplaki, E.; González-Rouco, J.F.; Luterbacher, J.; Wanner, H. Wet season Mediterranean precipitation variability: Influence of large-scale dynamics and trends. Clim. Dyn. 2004, 23, 63–78. [Google Scholar] [CrossRef] [Green Version]
- Driouech, F. Distribution des Précipitations Hivernales sur le Maroc Dans le Cadre d’un Changement Climatique: Descente d’Echelle et Incertitudes; L’université de Toulouse: Toulouse, France, 2010; pp. 1–164. [Google Scholar]
- Tramblay, Y.; Badi, W.; Driouech, F.; el Adlouni, S.; Neppel, L.; Servat, E. Climate change impacts on extreme precipitation in Morocco. Glob. Planet. Change 2012, 82–83, 104–114. [Google Scholar] [CrossRef]
- Tomaszkiewicz, M.A. Future Seasonal Drought Conditions over the CORDEX-MENA/Arab Domain. Atmosphere 2021, 12, 856. [Google Scholar] [CrossRef]
- Lelieveld, J.; Proestos, Y.; Hadjinicolaou, P.; Tanarhte, M.; Tyrlis, E.; Zittis, G. Strongly increasing heat extremes in the Middle East and North Africa (MENA) in the 21st century. Clim. Change 2016, 137, 245–260. [Google Scholar] [CrossRef] [Green Version]
- Zittis, G. Observed rainfall trends and precipitation uncertainty in the vicinity of the Mediterranean, Middle East and North Africa. Theor. Appl. Climatol. 2018, 134, 1207–1230. [Google Scholar] [CrossRef]
- Driouech, F.; Mahé, G.; Deque, M.; Dieulin, C.; El Heirech, T.; Milano, M. Evaluation d’impacts potentiels de changements climatiques sur l’hydrologie du bassin versant de la Moulouya au Maroc. In Proceedings of the Sixth World FRIEND Conference, Fez, Morocco, 25–29 October 2010; AISH Publications: Wallingford, UK, 2010; Volume 340, pp. 561–567. [Google Scholar]
- Filahi, S.; Tramblay, Y.; Mouhir, L.; Diaconescu, E.P. Projected changes in temperature and precipitation indices in Morocco from high-resolution regional climate models. Int. J. Climatol. 2017, 37, 4846–4863. [Google Scholar] [CrossRef]
- Tuel, A.; Eltahir, E.A.B. Why Is the Mediterranean a Climate Change Hot Spot? J. Clim. 2020, 33, 5829–5843. [Google Scholar] [CrossRef]
- Schilling, J.; Freier, K.P.; Hertig, E.; Scheffran, J. Climate change, vulnerability and adaptation in North Africa with focus on Morocco. Agric. Ecosyst. Environ. 2012, 156, 12–26. [Google Scholar] [CrossRef]
- Gubler, S.; Hunziker, S.; Begert, M.; Croci-Maspoli, M.; Konzelmann, T.; Brönnimann, S.; Schwierz, C.; Oria, C.; Rosas, G. The influence of station density on climate data homogenization. Int. J. Climatol. 2017, 37, 4670–4683. [Google Scholar] [CrossRef] [Green Version]
- Easterling, D.R.; Alexander, L.V.; Mokssit, A.; Detemmerman, V. CCI/CLIVAR workshop to develop priority climate indices. Bull. Am. Meteorol. Soc. 2003, 84, 1403–1407. [Google Scholar]
- Ribeiro, S.; Caineta, J.; Costa, A.C. Review and discussion of homogenisation methods for climate data. Phys. Chem. Earth Parts A/B/C 2016, 94, 167–179. [Google Scholar] [CrossRef]
- Karl, T.R.; Williams, C.N. An Approach to Adjusting Climatological Time Series for Discontinuous Inhomogeneities. J. Appl. Meteorol. Climatol. 1987, 26, 1744–1763. [Google Scholar] [CrossRef] [Green Version]
- Hunziker, S.; Brönnimann, S.; Calle, J.; Moreno, I.; Andrade, M.; Ticona, L.; Huerta, A.; Lavado-Casimiro, W. Effects of undetected data quality issues on climatological analyses. Clim. Past 2018, 14, 1–20. [Google Scholar] [CrossRef] [Green Version]
- Aguilar, E.; Auer, I.; Brunet, M.; Peterson, T.C.; Wieringa, J. Guidelines on Climate Metadata and Homogenization; World Meteorological Organization: Geneva, Switzerland, 2003; Volume 53. [Google Scholar]
- Guijarro, J.A. Daily series homogenization and gridding with Climatol v.3. In Proceedings of the Ninth Seminar for Homogenization and Quality Control in Climatological Databases and Fourth Conference on Spatial Interpolation Techniques in Climatology and Meteorology, Budapest, Hungary, 3–7 April 2017; WMO: Geneva, Switzerland, 2017; Volume 85, pp. 175–180. [Google Scholar]
- Shi, P.; Zhang, G.; Kong, F.; Chen, D.; Azorin-Molina, C.; Guijarro, J.A. Variability of winter haze over the Beijing-Tianjin-Hebei region tied to wind speed in the lower troposphere and particulate sources. Atmos. Res. 2019, 215, 1–11. [Google Scholar] [CrossRef]
- Alexandersson, H. A homogeneity test applied to precipitation data. J. Climatol. 1986, 6, 661–675. [Google Scholar] [CrossRef]
- Beaulieu, C.; Ouarda, T.; Seidou, O. A review of homogenization techniques for climate data and their applicability to precipitation series. Hydrol. Sci. J. 2007, 52, 18–37. [Google Scholar] [CrossRef] [Green Version]
- Azorin-Molina, C.; Guijarro, J.A.; McVicar, T.R.; Vicente-Serrano, S.M.; Chen, D.; Jerez, S.; Espírito-Santo, F. Trends of daily peak wind gusts in Spain and Portugal, 1961–2014. J. Geophys. Res. Atmos. 2016, 121, 1059–1078. [Google Scholar] [CrossRef] [Green Version]
- Peterson, T.C.; Easterling, D.R.; Karl, T.R.; Groisman, P.; Nicholls, N.; Plummer, N.; Torok, S.; Auer, I.; Boehm, R.; Gullett, D.; et al. Homogeneity adjustments of in situ atmospheric climate data: A review. Int. J. Climatol. 1998, 18, 1493–1517. [Google Scholar] [CrossRef]
- Guijarro, J.A. Homogenization of Climatological Series with Climatol Version 3.1.1; State Meteorological Agency (AEMET): Balearic Islands, Spain, 2018; Volume 1, p. 20. [Google Scholar]
- Paulhus, J.L.H.; Kohler, M.A. Interpolation of Missing Precipitation Records. Mon. Weather Rev. 1952, 80, 129–133. [Google Scholar] [CrossRef] [Green Version]
- Guijarro, J.A.; López Díaz, J.A.; Aguilar, E.; Domonkos, P.; Venema, V.K.; Sigró, J.; Brunet, M. Comparison of homogenization packages applied to monthly series of temperature and precipitation: The MULTITEST Project. In Proceedings of the 9th Seminar for Homogenization and Quality Control in Climatological Databases, Budapest, Hungary, 3–7 April 2017; pp. 46–62. [Google Scholar]
- Azorin-Molina, C. Recent trends in wind speed across Saudi Arabia, 1978–2013: A break in the stilling. Int. J. Climatol. 2018, 38, e966–e984. [Google Scholar] [CrossRef]
- Coll, J. Application of homogenization methods for Ireland’s monthly precipitation records: Comparison of break detection results. Int. J. Climatol. 2020, 40, 6169–6188. [Google Scholar] [CrossRef] [PubMed]
- Azorin-Molina, C.; Guijarro, J.A.; McVicar, T.R.; Trewin, B.C.; Frost, A.J.; Chen, D. An approach to homogenize daily peak wind gusts: An application to the Australian series. Int. J. Climatol. 2019, 39, 2260–2277. [Google Scholar] [CrossRef] [Green Version]
- Skrynyk, O.; Aguilar, E.; Guijarro, J.; Randriamarolaza, L.Y.A.; Bubin, S. Uncertainty evaluation of Climatol’s adjustment algorithm applied to daily air temperature time series. Int. J. Climatol. 2021, 41, E2395–E2419. [Google Scholar] [CrossRef]
- Curci, G.; Guijarro, J.A.; di Antonio, L.; di Bacco, M.; di Lena, B.; Scorzini, A.R. Building a local climate reference dataset: Application to the Abruzzo region (Central Italy), 1930–2019. Int. J. Climatol. 2021, 41, 4414–4436. [Google Scholar] [CrossRef]
- Abahous, H.; Guijarro, J.A.; Sifeddine, A.; Chehbouni, A.; Ouazar, D.; Bouchaou, L. Monthly precipitations over semi-arid basins in Northern Africa: Homogenization and trends. Int. J. Climatol. 2020, 40, 6095–6105. [Google Scholar] [CrossRef]
- HCP. Recensement Général de la Populatiion et de l’Habitat. Monograpie de la Région Marrakech-Safi; Direction Régionale de Marrakech-Safi; Ministère de l’Intérieur: Rabat, Morocco, 2014; p. 171. Available online: https://www.regions-maroc.ma/wp-content/uploads/2020/10/MONOGRAPPHIE-DE-LA-REGION-DE-MARRAKECH-SAFI.pdf (accessed on 27 March 2022).
- DGCL. In Monographie Générale, Région de Fès-Meknès; Ministère de l’Intérieur: Rabat, Morocco, 2015; p. 62. Available online: https://hazbane.asso-web.com/uploaded/monographie-de-la-region-de-fes-meknes-fr.pdf (accessed on 27 March 2022).
- El Moçayd, N.; Kang, S.; Eltahir, E.A.B. Climate change impacts on the Water Highway project in Morocco. Hydrol. Earth Syst. Sci. 2020, 24, 1467–1483. [Google Scholar] [CrossRef] [Green Version]
- Ameur, F.; Kuper, M.; Lejars, C.; Dugué, P. Prosper, survive or exit: Contrasted fortunes of farmers in the groundwater economy in the Saiss plain (Morocco). Agric. Water Manag. 2017, 191, 207–217. [Google Scholar] [CrossRef]
- Hssaisoune, M.; Bouchaou, L.; Sifeddine, A.; Bouimetarhan, I.; Chehbouni, A. Moroccan Groundwater Resources and Evolution with Global Climate Changes. Geosciences 2020, 10, 81. [Google Scholar] [CrossRef] [Green Version]
- Quarouch, H.; Kuper, M.; Abdellaoui, E.H.; Bouarfa, S. Eaux souterraines, sources de dignité et ressources sociales: Cas d’agriculteurs dans la plaine du Saïss au Maroc. Cah. Agric. 2014, 23, 158–165. [Google Scholar]
- Fofack, R. The social and political impact of the privatization of groundwater: Conflict and cooperation around the aquifer of Sais, Morocco. Water Soc. 2015, 200, 11143. [Google Scholar]
- Hanchane, M. Variabilité des pluies exceptionnelles dans le bassin versant de Sebou (Maroc): Intensité et période de retour selon l’hypothèse de non stationnarité temporelle. In Proceedings of the XXIX Colloque de l’Association Internationale de Climatologie, Lausanne Besançon, Switzerland, 6–9 July 2016; pp. 279–283. [Google Scholar]
- Leduc, D.J. A comparative analysis of the reduced major axis technique of fitting lines to bivariate data. Can. J. For. Res. 1987, 17, 654–659. [Google Scholar] [CrossRef]
- Zhang, L.; Bi, H.; Gove, J.H.; Heath, L.S. A comparison of alternative methods for estimating the self-thinning boundary line. Can. J. For. Res. 2005, 35, 1507–1514. [Google Scholar] [CrossRef]
- Solomon, D.S.; Zhang, L.Z. Maximum size-density relationships for mixed-hardwood forest stands in New England. In Integrated Tools for Natural Resources Inventories in the 21st Century; General Technical Reports; Department of Agriculture, Forest Service, North Central Forest Experiment Station: St. Paul, MN, USA, 2000. [Google Scholar]
- Mann, H.B. Nonparametric Tests Against Trend. Econometrica 1945, 13, 245–259. [Google Scholar] [CrossRef]
- Kendall, M.G.; Stuart, A. The Advanced Theory of Statistics; Macmillan: New York, NY, USA, 1977; Volume 1, p. 168. [Google Scholar]
- Sen, P.K. Estimates of the Regression Coefficient Based on Kendall’s Tau. J. Am. Stat. Assoc. 1968, 63, 1379–1389. [Google Scholar] [CrossRef]
- Driouech, F.; Déqué, M.; Mokssit, A. Numerical simulation of the probability distribution function of precipitation over Morocco. Clim. Dyn. 2009, 32, 1055–1063. [Google Scholar] [CrossRef]
- Singla, S.; Mahé, G.; Dieulin, C.; Driouech, F.; Milano, M.; El Guelai, F.Z.; Ardoin-Bardin, S. Evolution des relations pluie-débit sur des bassins versants du Maroc. In Proceedings of the Sixth World FRIEND Conference, Fez, Morocco, 25–29 October 2010; AISH Publications: Wallingford, UK, 2010; Volume 340, pp. 679–687. [Google Scholar]
- Goovaerts, P. Geostatistical approaches for incorporating elevation into the spatial interpolation of rainfall. J. Hydrol. 2000, 228, 113–129. [Google Scholar] [CrossRef]
- Pellicone, G.; Caloiero, T.; Modica, G.; Guagliardi, I. Application of several spatial interpolation techniques to monthly rainfall data in the Calabria region (southern Italy). Int. J. Climatol. 2018, 38, 3651–3666. [Google Scholar] [CrossRef]
- Ward, M.N.; Lamb, P.J.; Portis, D.H.; el Hamly, M.; Sebbari, R. Climate Variability in Northern Africa: Understanding Droughts in the Sahel and the Maghreb. In Beyond El Niño: Decadal and Interdecadal Climate Variability; Navarra, A., Ed.; Springer: Berlin/Heidelberg, Germany, 1999; pp. 119–140. [Google Scholar]
- Knippertz, P.; Christoph, M.; Speth, P. Long-term precipitation variability in Morocco and the link to the large-scale circulation in recent and future climates. Meteorol. Atmos. Phys. 2003, 83, 67–88. [Google Scholar] [CrossRef]
- Knippertz, P. A Simple Identification Scheme for Upper-Level Troughs and Its Application to Winter Precipitation Variability in Northwest Africa. J. Clim. 2004, 17, 1411–1418. [Google Scholar]
- Zamrane, Z.; Mahé, G.; Laftouhi, N.E. Wavelet analysis of rainfall and runoff multidecadal time series on large river basins in western north Africa. Water 2021, 13, 3243. [Google Scholar] [CrossRef]
- Driouech, F.; Stafi, H.; Khouakhi, A.; Moutia, S.; Badi, W.; El Rhaz, K.; Chehbouni, A. Recent observed country-wide climate trends in Morocco. Int. J. Climatol. 2021, 41, E855–E874. [Google Scholar] [CrossRef]
- Joelsson, L.M.T.; Sturm, C.; Södling, J.; Engström, E.; Kjellström, E. Automation and evaluation of the interactive homogenization tool HOMER. Int. J. Climatol. 2021, 42, 2861–2880. [Google Scholar] [CrossRef]


| ID | Station Name | Latitude (° N) | Longitude (° W) | Altitude (m) | Begin Year | End Year | Missing Data (%) |
|---|---|---|---|---|---|---|---|
| S1 | Aguelman Sidi Ali | 33.08 | −4.99 | 2089 | 1961 | 2017 | 0.0 |
| S2 | Ain Aicha | 34.47 | −4.68 | 236 | 1981 | 2017 | 4.5 |
| S3 | Ain Betit | 33.83 | −5.15 | 732 | 1978 | 2017 | 1 |
| S4 | Ain Chgag | 33.88 | −5.05 | 658 | 1977 | 2000 | 1.4 |
| S5 | Ain Khabbab | 34.14 | −4.06 | 1281 | 1974 | 2004 | 0 |
| S6 | Ain Leuh | 33.28 | −5.34 | 1497 | 1974 | 2004 | 2.5 |
| S7 | Ain Timdrin | 33.74 | −4.53 | 677 | 1961 | 2017 | 1.2 |
| S8 | Ait Aissa | 33.16 | −5.07 | 1905 | 2010 | 2018 | 39.2 |
| S9 | Ait Khabbach | 33.39 | −4.82 | 1491 | 1970 | 2017 | 1.4 |
| S10 | Aknoul | 34.65 | −3.87 | 1003 | 1961 | 2013 | 1.3 |
| S11 | Anguid MZ | 34.52 | −3.57 | 1170 | 1978 | 2007 | 3.3 |
| S12 | Azib Soltane | 34.54 | −5.13 | 298 | 1962 | 2017 | 0.7 |
| S13 | Azrou | 33.44 | −5.22 | 1411 | 1961 | 2010 | 0.7 |
| S14 | Azzaba | 33.82 | −4.7 | 759 | 1961 | 2017 | 0.1 |
| S15 | Bab Azhar | 34.05 | −4.27 | 788 | 1962 | 2003 | 2.4 |
| S16 | Bab Bouidir | 34.07 | −4.13 | 1543 | 1974 | 2011 | 1.3 |
| S17 | Bab Echhoub | 34.25 | −4.07 | 407 | 1994 | 2019 | 1.3 |
| S18 | Bab Louta | 34.02 | −4.33 | 575 | 1998 | 2009 | 7.6 |
| S19 | Bab Marzouka | 34.21 | −4.15 | 398 | 1971 | 2017 | 0 |
| S20 | Bab Ounder | 34.53 | −4.58 | 509 | 1961 | 2017 | 0 |
| S21 | Belfarah | 34.11 | −3.71 | 512 | 1970 | 2019 | 1.4 |
| S22 | Beni Bou Iloul | 33.56 | −3.98 | 1882 | 1976 | 2000 | 3.8 |
| S23 | Berkine | 33.77 | −3.85 | 1287 | 1961 | 2012 | 0.6 |
| S24 | BGE Allal Alfassi | 33.93 | −4.67 | 465 | 1991 | 2008 | 7.5 |
| S25 | BGE Asfalou | 34.63 | −4.2 | 829 | 1998 | 2017 | 0 |
| S26 | Boured | 34.73 | −4.1 | 817 | 1966 | 2012 | 2.5 |
| S27 | Brag El Wahda | 34.59 | −5.22 | 108 | 1961 | 2002 | 0.8 |
| S28 | Chaara | 33.92 | −4.3 | 1525 | 1978 | 1997 | 1.7 |
| S29 | Dar El Arsa | 34.2 | −4.94 | 174 | 1974 | 2017 | 0 |
| S30 | Dar El Hamra | 33.7 | −4.37 | 1142 | 1983 | 2017 | 0 |
| S31 | Dayet Aoua | 33.65 | −5.01 | 1470 | 1961 | 2006 | 4.1 |
| S32 | Dayet Hachlef | 33.55 | −5.01 | 1674 | 1980 | 2005 | 0 |
| S33 | Echoyeb | 34.47 | −4.32 | 467 | 1973 | 2006 | 2 |
| S34 | EL Hajeb | 33.69 | −5.37 | 1036 | 1961 | 1995 | 0 |
| S35 | EL Kansra Brg | 34.04 | −5.92 | 117 | 1961 | 2009 | 3.1 |
| S36 | Elmers | 33.46 | −4.39 | 1242 | 1982 | 2017 | 0 |
| S37 | Fez DRH | 33.93 | −4.98 | 569 | 1972 | 2017 | 0 |
| S38 | Galaz | 34.54 | −4.8 | 221 | 1981 | 2012 | 0.8 |
| S39 | Ghaffsai | 34.63 | −4.91 | 330 | 1961 | 2002 | 0 |
| S40 | Guercif | 34.22 | −3.36 | 362 | 1967 | 2019 | 1.3 |
| S41 | Had Mssila | 34.43 | −4.18 | 553 | 1970 | 2005 | 1.9 |
| S42 | Hajria | 34.49 | −4.82 | 191 | 1997 | 2017 | 0 |
| S43 | Idriss 1er Barrage | 34.17 | −4.76 | 191 | 1975 | 2017 | 0.4 |
| S44 | Ifrane | 33.53 | −5.11 | 1661 | 1961 | 2016 | 0 |
| S45 | Imouzzar Kendar | 33.73 | −5.01 | 1362 | 1963 | 2002 | 3.3 |
| S46 | Jbel Oudka | 34.75 | −4.84 | 1589 | 1979 | 2017 | 0 |
| S47 | Kenichat | 34.44 | −5.68 | 30 | 1970 | 2009 | 1.9 |
| S48 | Khnifra Tarhat | 32.94 | −5.67 | 836 | 1961 | 2000 | 0.2 |
| S49 | Maghraoua | 33.93 | −4.05 | 1140 | 1970 | 1997 | 2.4 |
| S50 | Marticha | 34.46 | −4.17 | 580 | 1963 | 1980 | 5.6 |
| S51 | Meknes | 33.87 | −5.52 | 570 | 1961 | 2012 | 1 |
| S52 | Midelt | 32.68 | −4.74 | 1497 | 1961 | 2016 | 0 |
| S53 | Missour | 33.05 | −4 | 891 | 1963 | 2019 | 0.6 |
| S54 | Mjaara | 34.59 | −5.24 | 128 | 1961 | 2012 | 0 |
| S55 | Oued Amlil | 34.19 | −4.27 | 295 | 1978 | 2009 | 3.1 |
| S56 | Ouljet Essoultan | 33.62 | −5.86 | 334 | 1982 | 2009 | 2.7 |
| S57 | Ourtzagh | 34.53 | −4.96 | 195 | 1961 | 1996 | 0 |
| S58 | Outat El Haj | 33.33 | −3.7 | 763 | 1971 | 2012 | 2.2 |
| S59 | Pont Medz | 33.67 | −4.52 | 742 | 1961 | 2017 | 0 |
| S60 | Pont Sebou | 34.31 | −5.15 | 87 | 1961 | 2008 | 0.9 |
| S61 | Ras Laksar | 33.96 | −3.75 | 726 | 1973 | 2000 | 3.6 |
| S62 | Ratba | 34.78 | −4.94 | 637 | 1999 | 2017 | 2.9 |
| S63 | Sais Aeroport | 33.93 | −4.98 | 572 | 1961 | 2016 | 0 |
| S64 | Saka | 34.54 | −3.06 | 240 | 1970 | 2011 | 2.7 |
| S65 | Sefrou | 33.82 | −4.84 | 863 | 1968 | 2006 | 4.7 |
| S66 | Sidi Chahid | 34.11 | −5.32 | 240 | 1971 | 2001 | 0 |
| S67 | Sidi el Mokhfi | 33.4 | −5.32 | 1085 | 1976 | 2017 | 1.6 |
| S68 | Sidi Kacem | 34.23 | −5.71 | 53 | 1961 | 1981 | 1.6 |
| S69 | Souk el Had Rdom | 34.3 | −5.77 | 34 | 1964 | 2018 | 1.8 |
| S70 | Tabouda | 34.74 | −5.14 | 213 | 1979 | 2009 | 2.7 |
| S71 | Taddert | 34.22 | −3.59 | 445 | 1989 | 2007 | 5.3 |
| S72 | Tafrant | 34.62 | −5.12 | 289 | 1961 | 1996 | 0.2 |
| S73 | Tahla | 34.05 | −4.43 | 571 | 1971 | 2013 | 0.8 |
| S74 | Tainasst | 34.55 | −4.14 | 1103 | 1973 | 2007 | 2.9 |
| S75 | Tamjilt | 33.64 | −4.02 | 1645 | 1967 | 2000 | 3 |
| S76 | Tandit | 33.66 | −3.62 | 667 | 1973 | 2011 | 0.2 |
| S77 | Taza | 34.22 | −4.01 | 522 | 1961 | 2011 | 0.7 |
| S78 | Tazzeka | 34.09 | −4.18 | 1971 | 1977 | 2003 | 3.7 |
| S79 | Tighezratine | 34.68 | −3.9 | 1115 | 1963 | 1984 | 4.8 |
| S80 | Tissa | 34.29 | −4.66 | 204 | 1963 | 2009 | 0.4 |
| S81 | Zaida | 32.82 | −4.95 | 1457 | 1964 | 2019 | 0.6 |
| S82 | Zeggouta | 34.17 | −5.53 | 408 | 1968 | 1973 | 18.5 |
| S83 | Zrarda | 33.97 | −4.38 | 841 | 1999 | 2019 | 3.2 |
| Q. Flag | NB of Data | % | |
|---|---|---|---|
| Missing (filled in) | 1 | 20,151 | 34.3 |
| Corrected data | 2 | 2492 | 4.2 |
| Observed data | 0 | 36,121 | 61.5 |
Publisher’s Note: MDPI stays neutral with regard to jurisdictional claims in published maps and institutional affiliations. |
© 2022 by the authors. Licensee MDPI, Basel, Switzerland. This article is an open access article distributed under the terms and conditions of the Creative Commons Attribution (CC BY) license (https://creativecommons.org/licenses/by/4.0/).
Share and Cite
Kessabi, R.; Hanchane, M.; Guijarro, J.A.; Krakauer, N.Y.; Addou, R.; Sadiki, A.; Belmahi, M. Homogenization and Trends Analysis of Monthly Precipitation Series in the Fez-Meknes Region, Morocco. Climate 2022, 10, 64. https://0-doi-org.brum.beds.ac.uk/10.3390/cli10050064
Kessabi R, Hanchane M, Guijarro JA, Krakauer NY, Addou R, Sadiki A, Belmahi M. Homogenization and Trends Analysis of Monthly Precipitation Series in the Fez-Meknes Region, Morocco. Climate. 2022; 10(5):64. https://0-doi-org.brum.beds.ac.uk/10.3390/cli10050064
Chicago/Turabian StyleKessabi, Ridouane, Mohamed Hanchane, Jose A. Guijarro, Nir Y. Krakauer, Rachid Addou, Abderrazzak Sadiki, and Mohamed Belmahi. 2022. "Homogenization and Trends Analysis of Monthly Precipitation Series in the Fez-Meknes Region, Morocco" Climate 10, no. 5: 64. https://0-doi-org.brum.beds.ac.uk/10.3390/cli10050064