
Examining the Spatiotemporal Changes in the Annual, Seasonal, and Daily Rainfall Climatology of Puerto Rico


1
Department of Geography Environment and Planning, Climate Research Center, Sonoma State University, 1801 E Cotati Ave, Rohnert Park, CA 94928, USA
2
Natural Sciences Department, Atmospheric Sciences Lab, University of Puerto Rico at Carolina, 2100 Av. Sur, Carolina 00984, Puerto Rico
*
Author to whom correspondence should be addressed.
Climate 2023, 11(11), 225; https://0-doi-org.brum.beds.ac.uk/10.3390/cli11110225
Submission received: 19 September 2023
/
Revised: 25 October 2023
/
Accepted: 31 October 2023
/
Published: 6 November 2023
Abstract
:This study explores spatial and temporal changes in the rainfall climatology of Puerto Rico in order to identify areas where annual, seasonal or daily precipitation is increasing, decreasing, or remaining normal. Total annual, seasonal, and daily rainfall were retrieved from 23 historical rain gauges with consistent data for the 1956–2021 period. Mann–Kendall trend tests were done on the annual and seasonal rainfall series, and percentage change differences between two different climatologies (1956–1987 and 1988–2021) were calculated. Most of the stations did not exhibit statistically significant annual or seasonal trends in average rainfall. However, of the sites that did experience changes, most of them had statistically significant decreasing trends in mean precipitation. The annual, dry, and early wet season had more sites with negative trends when compared with positive trends, especially in the northwestern and southeastern region of the island. The late wet season was the only period with more sites showing statistically significant trends when compared with negative trends, specifically in the northern region of the island. Results for daily events show that extreme rainfall occurrences have generally decreased, especially in the western region of the island. When the 1955–1987 and 1988–2022 climatologies are compared, the results for annual average rainfall show two main regions with mean precipitation reductions, and those are the northwestern and southeastern areas of the island. The dry season was the only period with more areas exhibiting percentage increases in mean rainfall when the two climatologies were analyzed. The early and late wet season months exhibited similar patterns, with more areas on the island showing negative percentage decreases in average seasonal precipitation. The best predictor for the decreasing annual and seasonal trend in the northwest was a higher sea level pressure, and the variable that best explained the increasing trend in the northeast was total precipitable water.
1. Introduction
Understanding changes in the spatial and temporal distribution of rainfall at various scales is of crucial importance to all countries on Earth, especially to the ones that have experienced exceptional drought periods and extreme precipitation events in the more recent decades. The island of Puerto Rico is one of those areas of the planet where drier periods and wetter periods in the past decades have caused water rationing and major agricultural losses on the one hand [1,2] and extreme floods and landslides on the other [3,4,5]. In the last decade, Puerto Rico experienced a major drought period (2013–2016) that led to serious water challenges on the island [6,7,8], while in the years 2017 and 2022, Puerto Rico experienced record-breaking rainfall accumulations associated with the passages of Hurricane Maria and Hurricane Fiona that caused catastrophic flash floods and landslides [9,10,11] The droughts and extreme rainfall events that have impacted the island have caused billions of dollars in losses over the last decade alone, so it is extremely important to determine if Puerto Rico is experiencing changes in its rainfall climatology and if it will experience more of these extreme events in the near future.
It is well known that rainfall in Puerto Rico is controlled by several factors, including topography, direction of prevailing winds (easterlies), localized convection, easterly waves, tropical cyclones, troughs, and frontal systems [12,13,14]. Various studies have examined the relationship between teleconnections like the El Niño Southern Oscillation (ENSO), the Atlantic Multidecadal Oscillation (AMO), the North Atlantic Oscillation (NAO), and the Arctic Oscillation (AO) with interannual rainfall variability on the island [12,13,15]) with recent findings suggesting that the AMO is strongly correlated with wet season rain variability and the NAO and AO with dry season precipitation [16].
When it comes to changing trends in rainfall in Puerto Rico, some studies have detected a drying trend [17] during the wet season (May–November), while other studies have found increasing trends in the number of rainy days and a decreasing pattern in the number of dry days for the metropolitan area of San Juan [18]. A study using Coupled Model Intercomparison Project 5 data found an upward trend in rainfall in northern Puerto Rico and a drying trend in the southern part of the island [19]. Recent work on droughts in the Caribbean and Puerto Rico suggests that more areas in the Caribbean are experiencing severe droughts [20] and that climate change accounted for ~15–17% of the drought’s severity and ~7% of its spatial extent [8]
Based on the research that has been done on the precipitation variability of Puerto Rico, it is clear that there is no consensus on whether annual, seasonal, or daily rainfall is overall increasing or decreasing over the island. Some studies suggest that rainfall over Puerto Rico is increasing during the drier months [16], while others suggest that the area where Puerto Rico is located is experiencing a drying trend that is being exacerbated by human-induced climate change [8]. The lack of consensus between the different studies that have examined rainfall trends in Puerto Rico could be the result of differences in data and methodological approaches, since some studies have focused on annual [12] or daily trends [18] using fewer sites in a specific region, with some analysis focusing on the relationship of precipitation and teleconnections [6,15] between rain and some analysis focusing on examining the heavy precipitation brought by tropical cyclones [11]. In contrast to prior research, this manuscript takes a comprehensive approach, taking into account annual, seasonal, and daily fluctuations simultaneously. This method is especially remarkable because it enables a more profound understanding of how rainfall patterns evolve over time and across various timescales.
Since it is not clear from the literature if Puerto Rico is generally experiencing drier or wetter conditions over time, this study examines the spatial and temporal changes in annual, seasonal, and daily rainfall for the 1956–2021 period. This study focuses on identifying areas where annual and seasonal average precipitation is increasing, decreasing, or remaining normal. Total average annual and seasonal rainfall were retrieved from 23 historical rain gauges with consistent data for the 1956–2021 period. Mann–Kendall (MK) trend tests were done on the annual and seasonal rainfall series to determine if any of the sites are experiencing decreasing or increasing trends. The annual and seasonal rainfall data are then separated into two different climatologies (1956–1987 and 1988–2021) in order to examine the changes that occurred from one period to the next. The two different climatologies are then compared in order to identify areas that have experienced annual or seasonal rainfall reductions or increases. The number of extreme rainfall days (90th, 95th, and 99th percentiles) are calculated for each site, and the trends analyzed are employed to determine if any changes occurred.
2. Data and Methods
Monthly and daily rainfall data for the 1956–2021 period were obtained from the National Center for Environmental Information (NCEI). Stations with at least 90% of data were selected, with 23 historical stations meeting that requirement (Figure 1). The annual rainfall total was calculated from the monthly data, and the seasonal rain was calculated from the monthly precipitation totals, producing three seasonal series—the dry season (December–March), the early wet season (April–July), and the late wet season (August–November). It is well known in the literature that Puerto Rico has a very defined wet season and dry season [14], so in this study, the wet season was divided into early and late in order to capture changes that might have occurred in the earlier or later months of the season [6].
Annual and seasonal means for the following climate variables—surface air temperature (SAT), sea surface temperature (SST), sea level pressure (SLP), and total precipitable water (TPW)—were obtained from the European Center for Medium Weather Forecasting Reanalysis v5 (ERA5) for the area of Puerto Rico (18–16 lat, −68–64 lon). Annual and seasonal carbon dioxide (CO2) data were obtained from the site in Mauna Loa, and yearly and seasonal averages for the following teleconnections—the Atlantic Multidecadal Oscillation (AMO), the North Atlantic Oscillation (NAO), the Arctic Oscillation (AO), and the El Niño Southern Oscillation (ONI)—were obtained from NOAA’s Climate Prediction Center. These nine variables have been found to play an important role in driving precipitation trends in Puerto Rico and the Caribbean [16,21].
Mann–Kendall (MK) tests for trends were implemented on the annual and seasonal rainfall series in order to identify whether certain sites have experienced significant increasing or decreasing trends. The MK test involves computing a statistic S, which is the difference between the numbers of pairwise differences that are positive and the numbers that are negative. If the S is a large positive value, there is an increasing trend in the data; if it is a large negative value, there is a decreasing trend in the data.
The equation for the Mann–Kendall trend test is as follows:
where S is the Mann–Kendall statistic, which measures the strength and direction of the trend, n is the number of data points in the time series, xi represents the data value at time I, xj represents the data value at time j, (xj − xi) is the sign function, which returns +1 if xj − xi is positive (indicating an increasing trend) and −1 if xj − xi is negative (indicating a decreasing trend). If xj − xi is zero, it is generally ignored.
This test has the advantage of not assuming any special form for the distribution function of the data while having a power nearly as high as their parametric equivalents. This is why it is widely used in the rainfall trend analysis literature and highly recommended by the World Meteorological Organization [22].
In the next step, the 90th, 95th, and 99th percentiles of the daily rainfall series were retrieved in order to determine if the number of extreme rainfall events has been increasing or decreasing over time. The percentile based on extreme daily rainfall events was calculated as follows:
where n is the total number of data points. This same equation was modified to calculate the 95th and 99th percentiles. The values at or above each of the percentiles were extracted, and a partial duration series was constructed for each site. A partial duration series was created for each site by selecting only those rainfall days in the time series that were at or exceeded the selected percentiles. The end product was a series of extreme rainfall days per year. Next, each of the 23 extreme daily rainfall series were analyzed using the MK test in order to determine if the total number of events at or above the percentile thresholds had been increasing or decreasing over time.
In the following step, two sites—one with statistically significant decreasing trends in annual and seasonal rainfall and a site with significant increasing trends—were selected for further analysis in order to determine which climate factors best predict the observed changes. Forward stepwise regression (FSR) procedures were implemented to select the climate variables (SAT, SST, SLP, TPW, CO2, NAO, AMO, AO, and ONI) that best predict annual and seasonal rainfall at those sites with decreasing and increasing trends.
The basic idea behind FSR is to start with an empty model with no predictors and then, in a stepwise procedure, add one variable at a time. At each step, the predictor that, when added, improves the model fit the most is selected. The process continues until a stopping criterion is met (e.g., a pre-defined number of variables or a significance limit). In this case, the threshold to select the variables was if the p-value was 0.1 or lower. The formula for forward stepwise regression can be written as follows:
where Y is the dependent variable you want to predict. β1X1, β2X2,..., βpXp are the predictor variables, β0 is the intercept, β1, β2,..., βp are the regression coefficients. ε represents the error term. FSR is a useful method for variable selection when we have multiple potential predictor variables and want to identify the best ones that explain the variation in the dependent variable—in this case, annual and seasonal rainfall. The FSR has been used in recent studies that have identified important factors that control TC frequency in the Caribbean [21].
In the next step, the annual and monthly seasonal series were divided into two different climatologies—one from 1956–1988 and the other from 1989–2021. This was done to determine if the annual or seasonal rainfall averages have changed from one climatology to the next. The climatologies were divided into two 33-year periods (1956–1988 and 1989–2021) in order to determine if changes in annual or seasonal rainfall occurred between the older and more recent climatologies. Surfaces of annual and seasonal rainfall interpolated by Ordinary Co-Kriging (OCK), with elevation as a covariate, were produced for both climatologies. The OCK is a multivariate variant of the ordinary kriging interpolation method, with the task of estimating or predicting poorly sampled data with the help of a well-sampled variable like elevation [23,24].
The equation for ordinary co-kriging involves the following components: for a single variable, ordinary kriging estimates the value Z(u) at an unobserved location (u) as a weighted linear combination of the values of the variable at known locations (Z(xi)).
where Z(u) is the estimated value at location u, Z(xi) is the value at the known location xi, n is the number of known locations, and λi are the weights assigned to each known location to optimize the estimation. For ordinary co-kriging, the kriging equation is extended to include a secondary variable (Y) in addition to the variable of interest (Z). The equation then becomes:
where Z(u) is the estimated value of the variable of interest at location u, Y(u) is the value of the secondary variable at location u, Y(xj) is the value of the secondary variable at known location xj, m is the number of known locations for the secondary variable, and γj are the weights assigned to the secondary variable, optimizing the estimation. The OCK method has been found to be one of the best interpolation methods to construct interpolated surfaces of rainfall in Puerto Rico [9]. The OCK surfaces for the 1988–2021 climatology were subtracted from the 1955–1987 climatology, and percentage changes were calculated in order to identify areas where annual and seasonal rainfall increased, decreased, or stayed near normal.
3. Results
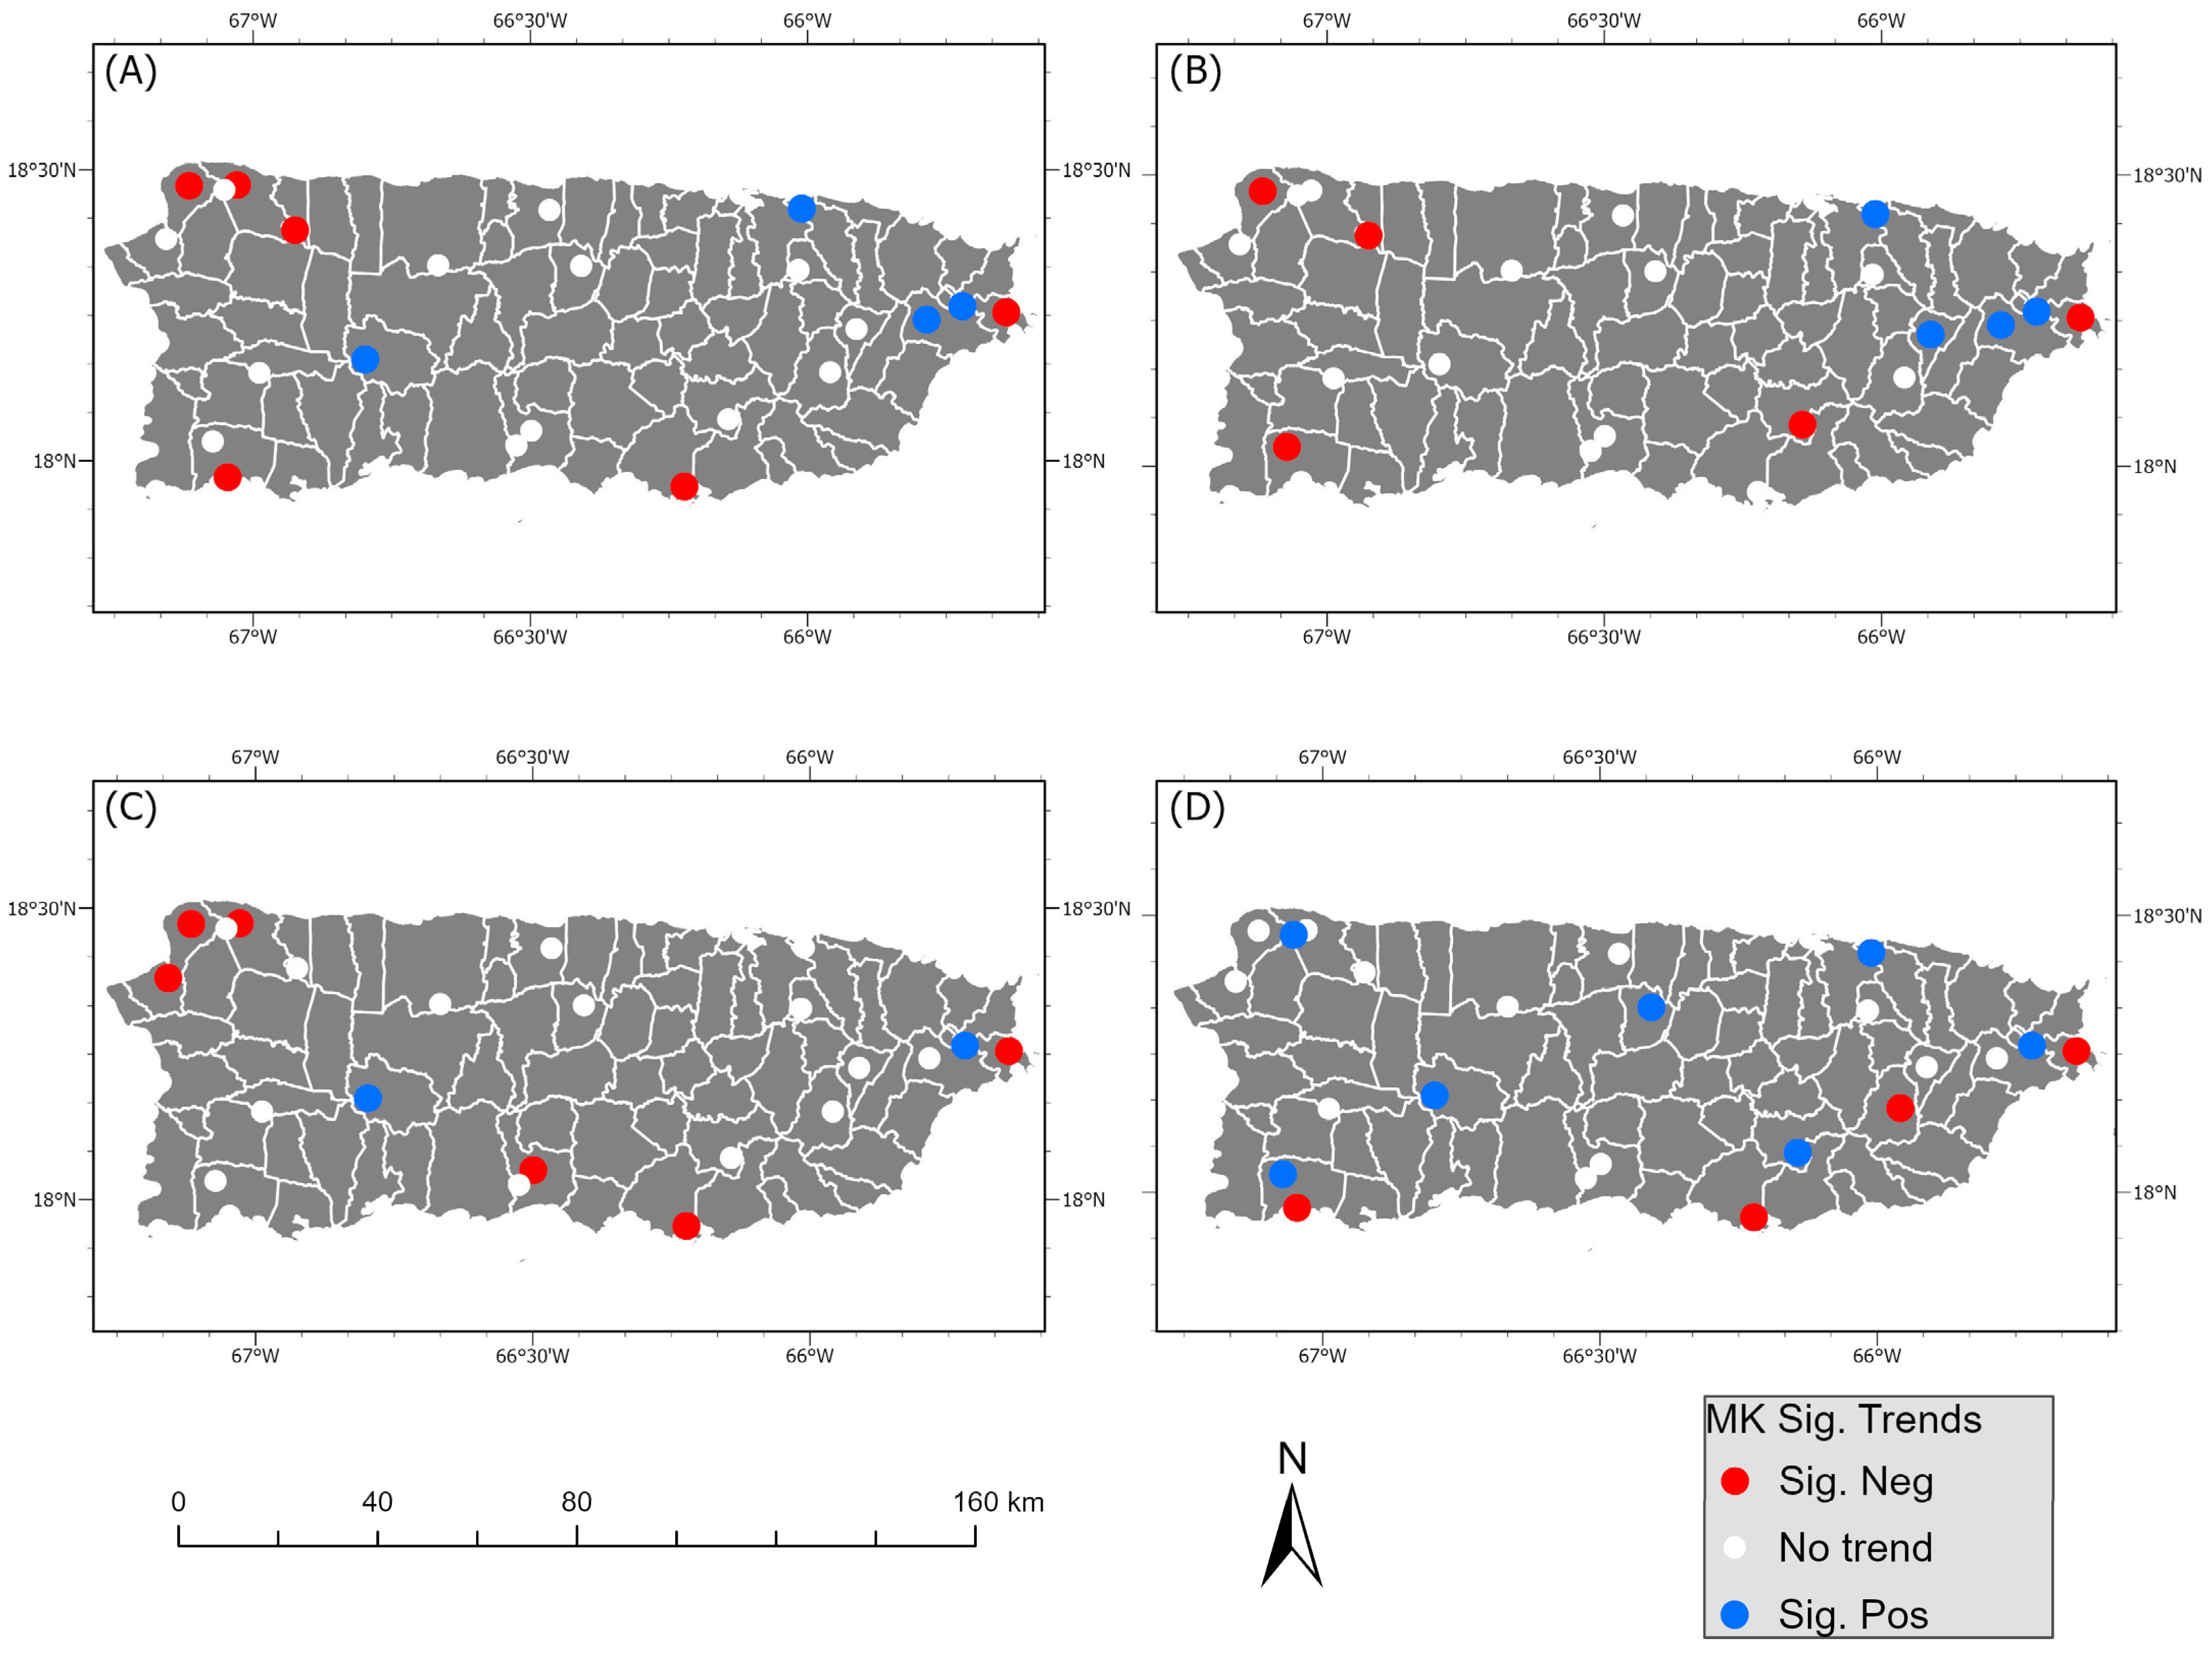
The results of the MK trend test for annual rainfall over Puerto Rico exhibited stations with decreasing and increasing trends. Most of the sites (15) showed negative trends in annual precipitation, with five of those stations exhibiting statistically significant trends (Figure 2A). Of the nine stations that exhibited positive trends in annual rainfall, only one had a statistically significant trend. The northwestern region of the island showed the most stations with decreasing trends in annual rainfall. The two sites with the most significant decreasing trends in annual precipitation were located in the southeastern and northeastern regions of the island. The eastern region of the island had the most stations with positive trends in annual rainfall, with three of the sites with statistically significant trends located in the northeast and one in the western interior region of the island.
The trends for the dry season rainfall were found to be very similar to those of the annual precipitation, with 13 stations showing decreasing trends and 10 exhibiting positive trends (Figure 2B). Three stations were found to have statistically significant negative trends, while one site had significantly positive trends. Northwestern, southwestern, and southeastern Puerto Rico had various stations with negative trends in dry season rainfall, while northeastern Puerto Rico was the region with the most sites showing increasing trends (Figure 2B). Dry season rainfall in Puerto Rico is mostly the product of atmospheric processes that include cold fronts and high-altitude troughs that produce a west to east rainfall pattern [14]. Previous research on the subject found that dry season rainfall over Puerto Rico is strongly negatively correlated with teleconnections like the North Atlantic Oscillation (NAO) and the Arctic Oscillation (AO) [16]—modes of variability that influence the frequency and extent of cold front incursions into the Caribbean.
The results for the early wet season (April–July) show more stations (Figure 2C) with positive trends (13) in rainfall than those with decreasing trends (10). Four of the stations with increasing trends exhibited statistically significant increments in early wet season rainfall, with the sites located in the northeastern and western interior regions of the island (Figure 2C). Of the ten stations that exhibited negative trends, only three had statistically significant decreasing rainfall for the early dry season, with one site located in the northwest, one in the southeast, and another one in the eastern region of the island. Similar to the patterns identified in the annual and dry season rainfall trend maps, the early wet season shows the northwestern, southern, and far eastern regions of the island as the areas that are experiencing a decreasing trend in precipitation. The late wet season (August–November) exhibited the most stations (6) with statistically significant increasing trends in rainfall. Overall, ten sites showed positive trends in late wet season rainfall, while thirteen sites showed negative trends. Of the stations with decreasing trends in late wet season rainfall, only two showed statistically significant trends, and these were located in the southwestern and far eastern regions of the island (Figure 3D).
Previous studies examining rainfall variability over Puerto Rico have shown that wet season rainfall over the island is strongly correlated with the warm phase of the Atlantic Multidecadal Oscillation (AMO) [16]. During the warm phase of the AMO, the tropical waters of the North Atlantic are warmer than normal, and this leads to higher evaporation rates and higher moisture content in the region. This higher moisture content during the warmer phases of the AMO is then manifested in higher precipitation accumulations on Puerto Rico during the late wet season months. The late season months are also characterized by the development and progression of easterly waves and tropical cyclones that also bring ample precipitation to the island [14]. Recent research suggests that the total number of tropical cyclones and major hurricanes has been increasing since the mid-1960s, with the last three decades having the highest number of tropical storms [21]. One potential explanation for the increase in precipitation in those stations during the late wet season months could be due to the higher number of tropical cyclones that have impacted Puerto Rico over the last decades [25,26].
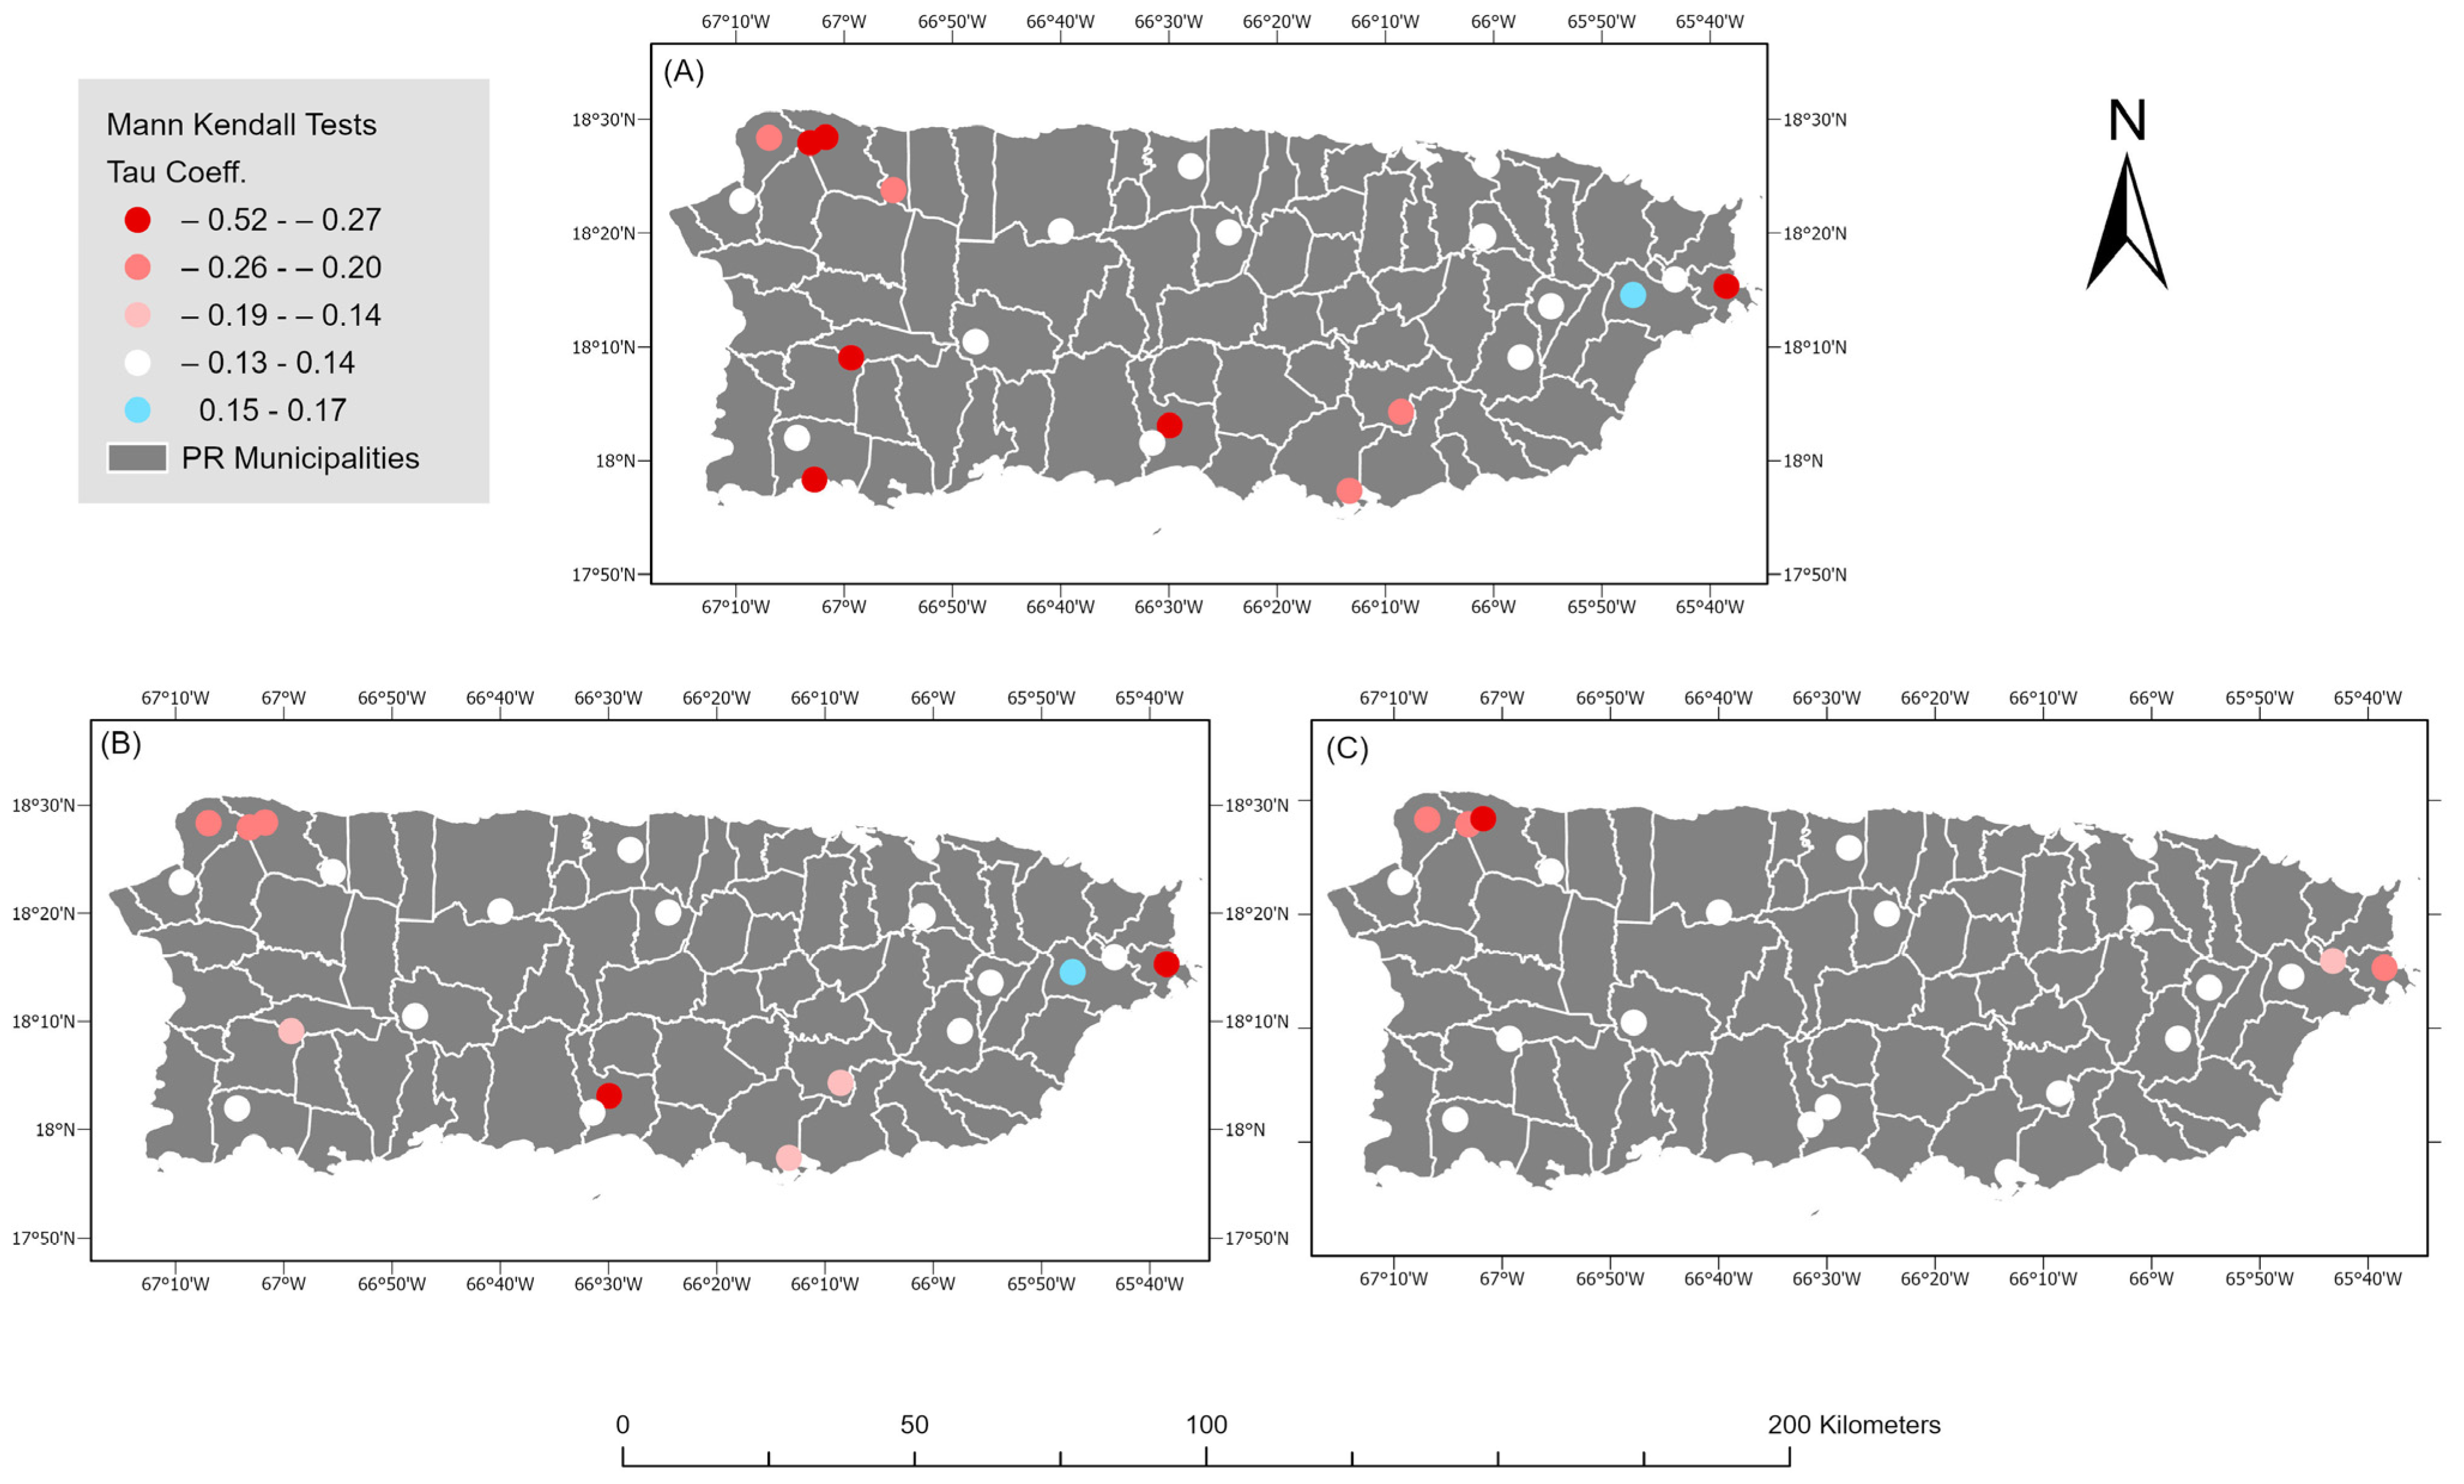
Trends in extreme daily rainfall events show that extreme excessive precipitation occurrences (99th, 95th, and 90th percentiles) have been decreasing in different sectors (Figure 3). Results of daily rainfall trends in the highest 10% (90th percentile) of events show a significant decrease in western and southeastern sectors (Figure 3A). Most of the stations located in the north and center showed no change in the trend, while only one station located in the east (El Yunque) showed an increase in extreme daily rainfall events at or above the highest 10%. (Figure 3A). The results of the daily rainfall trend tests for events within or above 5% (95th percentile) show that most stations did not suffer significant changes (Figure 3B). Of the analyzed daily rain stations, only six showed a decrease in the number of daily rain events within or above 5% (Figure 3B). These stations that show a negative trend (less extreme rain events) exists in western and southern sectors of Puerto Rico.
When two sites that showed statistically significant decreasing (Guajataca Dam) and increasing (Paraiso) trends in rainfall are examined further using FSR procedures, we found that various key climate variables were identified as the best predictors. The site located in the northwest—an area with decreasing trends in annual, seasonal, and daily rainfall—was analyzed further, and the FSR procedure selected SLP as the best predictor (Table 1). The idea is that, as SLP increases in the area of Puerto Rico, annual and seasonal rainfall will tend to decrease in the northwestern region of the island. It is important to note that the mean annual SLP in the area of Puerto Rico has been increasing over the last decades, suggesting more stable conditions that could develop into severe droughts like the one that occurred in 2015 [6,7,8] Similar to the findings of another study [16], the other predictors that were found to be important, especially for annual and dry season rainfall, were the AO and NAO teleconnections.
On the other side of the island, in the northeast, the FSR procedure identified TPW as the best overall predictor of the increasing annual and seasonal trend in rainfall in that area of Puerto Rico (Table 1). This area of the island is already very humid because of the presence of the El Yunque Mountain, which promotes persistent orographic lifting of moist air that could develop into clouds and precipitate [14]. TPW was selected as the number one predictor of the increase in annual and seasonal rainfall in this site located in the northeast. Overall, TPW has been found to be increasing over time in the region around Puerto Rico [21], and it seems that the eastern area of the island is responding to those higher moisture environments. Although behind TPW (Table 1), other variables that were also found to be important predictors for the trends in annual and seasonal rainfall were SAT (annual and late wet season), SLP (early wet season), and ONI (late wet season).
These results are quite similar to the results presented in the previous section, where a trend of less accumulated rain overall in the northwest and southeast was found. When examining the events of extreme daily rainfall at or above the top 1% (99th percentile), we can again observe that the vast majority of the analyzed stations (18) did not show significant changes in their trends (Figure 3C). Only five of the 23 stations examined showed a significant decrease in the number of events by or above 1% (Figure 3C). The stations that showed significant decreases in their trends are located in the northwest and extreme east. The results of the daily rainfall trend analysis at different extreme statistical thresholds show that, in general, the island has not experienced significant changes in extreme daily rainfall; they also show that some sectors in the west, south, and east have seen a reduction in those extreme rain events.
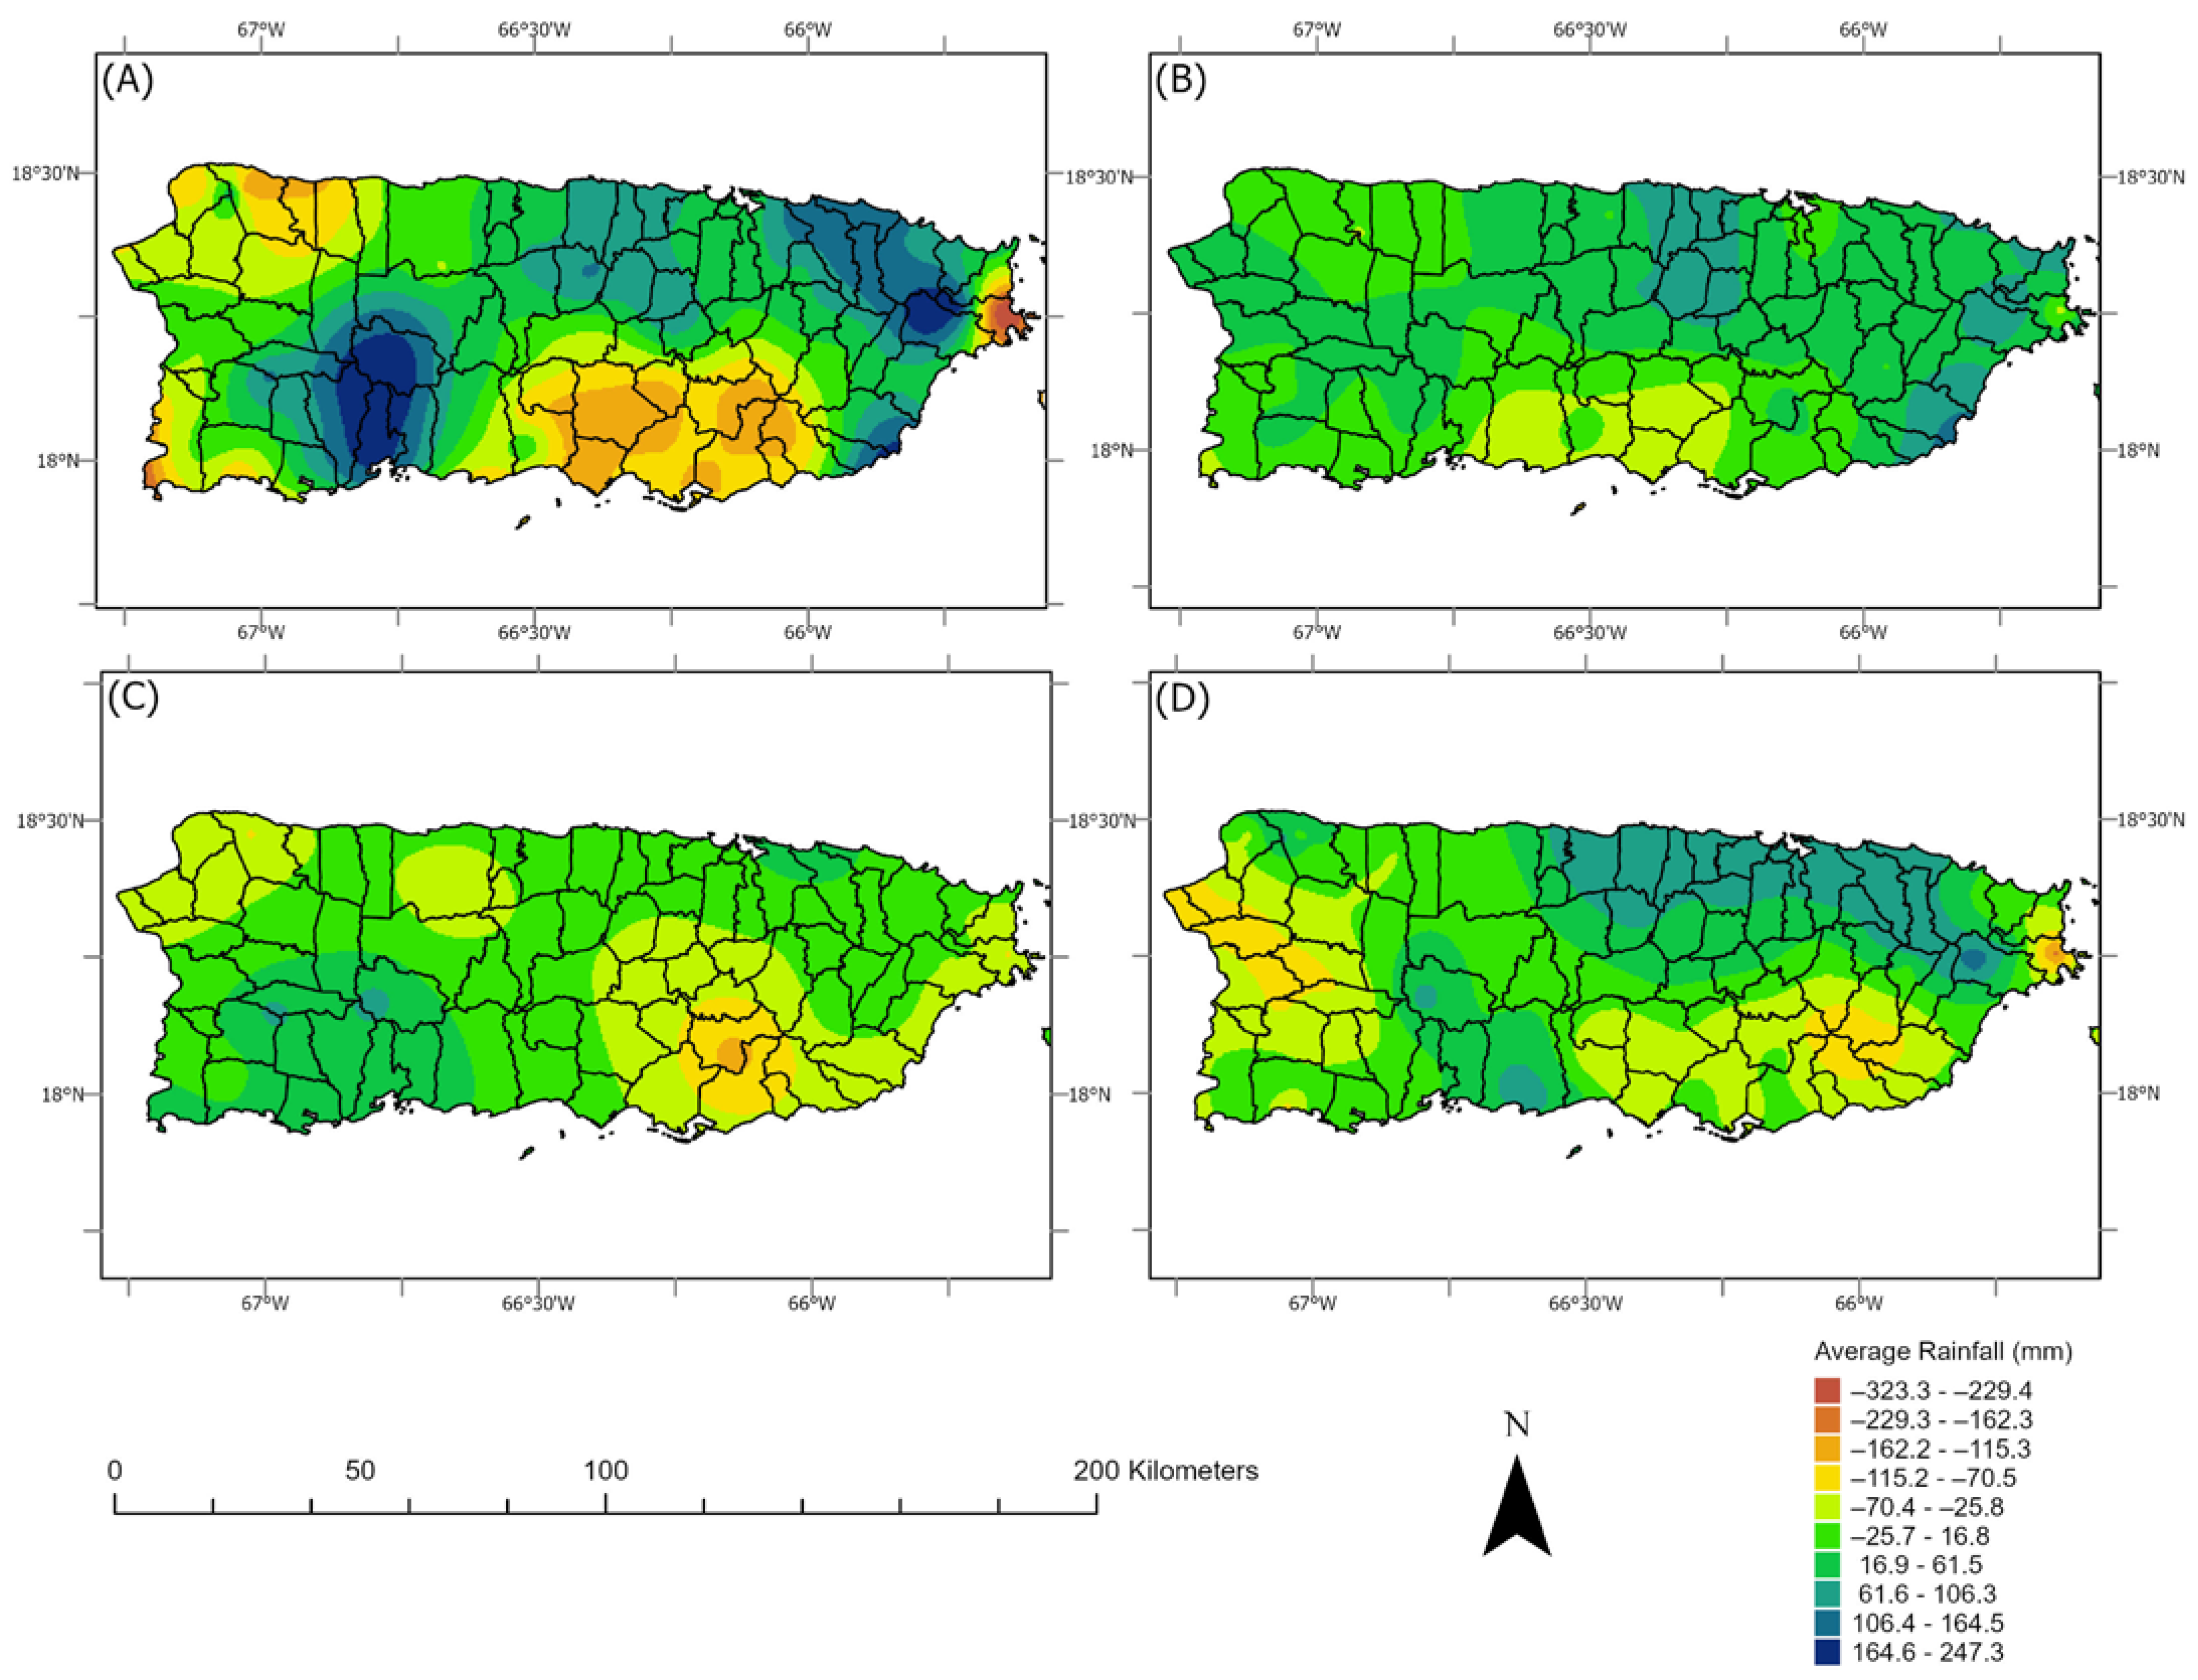
When the differences between the 1955–1987 and 1988–2021 climatologies are examined, we find that some regions of Puerto Rico have experienced a decrease or an increase in average annual and seasonal rainfall (Figure 4). Annual average rainfall has decreased in the northwestern, southeastern, and far eastern regions of the island (Figure 4A). These results coincide with those of the MK trend tests for annual rainfall. The regions of Puerto Rico that experienced an increase in average annual rainfall from one climatology to the next were the southwestern and northeastern regions of the island (Figure 4A). Of the different seasons examined here, the dry season was the one that reflected an overall moderate increase in precipitation for most of the island (Figure 4B), with sectors in the east (Yunque) exhibiting the largest increase.
The results for the early dry season show most of the island being dryer in the latest climatology (1988–2021) when compared with the previous one (1955–1987), with the northwestern and southeastern regions showing the largest reductions in total average rainfall (Figure 4C). Changes in the rainfall climatologies for the late wet season show areas with a decrease, an increase, and little change in average rainfall (Figure 4D). A reduction in mean precipitation for the late wet season from one climatology to the next is evident in much of the west and southeast, while the northeastern part of the island exhibited increases in average rainfall (Figure 4D). These results show the complex rainfall patterns that characterize islands like Puerto Rico, where some areas have experienced a decrease in average rainfall, while other zones have seen an increase in the mean precipitation.
When percentage changes in precipitation between the two climatologies are examined, we find that, in general, most of Puerto Rico has experienced a reduction in the percentage of average annual and seasonal rainfall (Figure 5). The percentage change in average annual rainfall shows the most significant negative percentages (−21.9–−10.1) in the northwestern and southeastern regions of the island, confirming the previous results which suggest that these regions are the ones that experienced more significant decreases in their mean yearly precipitation (Figure 5A). Only two smaller regions in the northeast and southwest exhibited positive percentage increases (6–11.8%) in average annual rainfall. Of all of the seasons analyzed, the dry season exhibited the most areas with increasing percentages in average rainfall (Figure 5B). However, it is important to note that average rainfall totals for the dry season are generally low when compared with the wet season months, so those percentage increases do not necessarily suggest significant increases in mean precipitation. On the other hand, the early and wet seasons exhibited more areas with percentage reductions than areas with percentage increases in seasonal average rainfall (Figure 5C,D). Most of the island, except for a small region in the southwest, exhibited average early wet seasonal rainfall reductions ranging from −0.4–−10, with some areas in the southeast showing percentage reductions between −10.1 and −21.9 (Figure 5C). Although this period had a large area in the northeastern region exhibiting positive percentage increases that ranged from 6–20%, the late wet season changes in percentage were similar to those of the early wet (Figure 5D).
4. Discussion
The results of the Mann–Kendall (MK) trend test for annual rainfall patterns over Puerto Rico have revealed several notable trends and variations. These trends, both increasing and decreasing, bear significant implications for various sectors, including water resources, disaster management, and agriculture.
Given the significance of annual rainfall in maintaining adequate water resources, the findings of decreasing trends in annual precipitation hold vital implications for water availability on the island. Regions with increasing trends in annual rainfall may experience improved water availability, whereas those with decreasing trends, especially in the northwestern and southeastern region of the island, may face water scarcity challenges. Similar to the findings of this study, the most current research on the topic suggests that the island is experiencing more drier periods than wet periods [6,7,8]. Therefore, effective water resource management and conservation strategies will be essential to ensure a sustainable supply of water for various uses, including domestic, industrial, and agricultural.
The trends observed in different rainfall seasons, including the dry season and early–late wet seasons, also have implications for disaster management and preparedness. The increasing trends in early wet season rainfall, particularly in the northeastern and western interior regions, could lead to an increased risk of flooding. Another study [18] found that the metropolitan area of San Juan, located in the northeastern region of the island, has been experiencing an increasing trend in precipitation. Since these higher rainfall accumulations could lead to catastrophic urban floods in the metro area, disaster management authorities need to be vigilant and prepared to respond to potential flood events in that area of the island. Conversely, the decreasing trends in the late wet season, despite some stations with statistically significant increases, may pose challenges for maintaining water reservoir levels and ensuring a continuous water supply, which could impact disaster response efforts.
The trends in extreme daily rainfall events, categorized by percentiles (99th, 95th, and 90th), provide further insights into the changing precipitation patterns. The decrease in extreme excessive precipitation occurrences, particularly in the western and southeastern sectors, may suggest a reduced risk of flash floods and landslides in these regions. While the reduction of extreme rainfall events in those regions might reduce the probabilities of flash floods, they could also impact total precipitation accumulations that could worsen the already dry conditions that persist in those areas of the island. However, the increase in extreme daily rainfall events at or above the highest 10% percentile in the east (e.g., El Yunque) highlights the need for heightened vigilance and emergency preparedness in areas susceptible to such events.
The observation that the majority of the rainfall stations (15 out of 24) exhibited negative trends in annual precipitation is of particular concern for the agricultural sector. These negative trends, indicating decreasing annual rainfall, could potentially impact crop production and overall agricultural yield. Furthermore, the presence of statistically significant trends in five of these stations underscores the need for adaptive measures within the agricultural industry. To mitigate the potential adverse effects of decreasing rainfall, farmers and policymakers may need to consider improved water management practices, drought-resistant crop varieties, and irrigation systems.
Mean annual and seasonal SLP was found to be the most important predictor of the decreasing trend in annual and seasonal rainfall in the northwestern region of the island. These findings suggest that if more stable conditions persist in future years, these area of the island will continue to experience a drying trend that could become more and more problematic for the impacted communities and activities. Similar to the findings of a recent study [16], seasonal rainfall was also influenced by the AO and NAO teleconnections. Mean annual and seasonal TPW was found to be the most important variable behind the increasing trend in annual and seasonal rainfall in the northeastern region of the island. These results suggest that higher moisture environments in the region will have a more significant impact on the precipitation of the northeastern area of Puerto Rico.
It is important to note that the trends and percentage changes in precipitation exhibit considerable regional variation. While some regions have experienced decreases in precipitation, others have seen increases. This regional variability will demand localized strategies for adaptation and mitigation, reflecting the unique challenges and opportunities in different parts of the island.
5. Conclusions
This study focused on examining trends in annual, seasonal, and daily rainfall in Puerto Rico and its spatial temporal characteristics. Annual, seasonal, and daily rainfall data from 23 historical sites from 1955–2021 were collected and analyzed using Mann–Kendall tests for trends. Trends in daily extreme precipitation events were also analyzed using different percentiles (90th, 95th, and 99th). The annual and seasonal data were divided into two separate climatologies, the 1955–1987 and 1988–2022 periods, and spatial analysis was used to identify areas where rainfall has changed over time. Various maps were generated to identify the areas on the island that have experienced no change, or a decreasing or increasing trend in annual, seasonal, or daily rainfall.
Results for annual rainfall show most stations with decreasing trends, with the northwestern region of the island exhibiting the most sites with statistically significant reductions. Fewer stations exhibited increasing trends in annual rainfall; however, they were clustered in the northeastern region of the island. Results for dry season rain exhibit most stations with decreasing trends, and the northwest was again found to be the area with the most sites showing significant reductions, while the northeast was the area with some stations exhibiting increases. The early wet season had more sites with decreasing trends, especially in the northwestern and southern regions of the island. The late wet season was the only period with more stations exhibiting an increasing trend in average rainfall, especially in the northern region of the island. Daily rainfall extreme events are decreasing in their frequency in the western part of the island, with the northwestern region exhibiting the sites with the most significant reductions in excessive precipitation occurrences.
When the previous rainfall climatology (1955–1987) is compared via spatial analysis with the 1988–2021 period, results show that annual average precipitation decreased between 0.4 and 21.9 percent in the northwestern and southeastern regions of the island. Two smaller regions located in the northeast and southwest exhibited moderate increases (6–11%) in annual rainfall. Although the larger changes in average rainfall percentages were found in this period, no major changes were observed between the dry season rainfall climatologies. The early wet season was found to be drier in general when the older and newer climatologies were compared, with the northwest and southeast once again identified as the areas that experienced a larger reduction in average seasonal precipitation (0.4–21.9%). The late wet season showed more areas with very small changes in precipitation, although a drier pattern was identified in the western and southeastern regions of the island. A smaller area in the northeastern coastal plains exhibited an increase in the average late season precipitation (6–20%), although most of the island showed a drying pattern.
The findings of this study have identified the regions of the island that have experienced changes in annual, seasonal, and daily trends. Similar to other studies that have focused on the region, the results of this analysis suggest that northwestern and southeastern Puerto Rico are experiencing a decrease in annual, dry season, and early wet season rainfall. The late wet season was the only period with a greater number of sites showing an increase in average precipitation rather than a decrease, especially in the northeastern region of the island. The major findings of this study suggest that Puerto Rico’s average annual and seasonal rainfall amounts have been mostly decreasing since 1955, although some regions like the northeastern area of the island have actually experienced an increase in mean precipitation. The results of this work will help local authorities address water supply issues in those areas that were found to be experiencing a decreasing or increasing trend in annual, seasonal, and daily precipitation.
In conclusion, the observed changes in rainfall patterns across Puerto Rico carry far-reaching implications for agriculture, water resource management, disaster preparedness, and long-term climate considerations. These findings highlight the need for comprehensive and context-specific strategies to address the challenges and harness the opportunities associated with evolving precipitation trends in this region. Such strategies should integrate climate science, disaster management, and sustainable resource utilization to safeguard the well-being and resilience of Puerto Rico’s communities and ecosystems. Future research will explore the impacts that those changes in rainfall trends will have on water resources in Puerto Rico.
Author Contributions
Conceptualization, J.J.H.A. and R.M.T.; methodology, J.J.H.A.; software, J.J.H.A.; validation, J.J.H.A. and R.M.T.; formal analysis, J.J.H.A.; investigation, J.J.H.A.; resources, J.J.H.A.; data curation, J.J.H.A.; writing—original draft preparation, J.J.H.A.; writing—review and editing, J.J.H.A.; visualization, J.J.H.A.; supervision, R.M.T.; project administration, R.M.T.; funding acquisition, R.M.T. All authors have read and agreed to the published version of the manuscript.
Funding
This research received no external funding.
Data Availability Statement
Annual, seasonal and daily rainfall data were obtained from the National Center for Environmental Prediction (NCEI) Climate Data Online (CDO) tool using this link https://www.ncei.noaa.gov/maps-and-geospatial-products accessed on 10 May 2023. Surface air temperature, sea surface temperature, total precipitable water, and sea level pressure were obtained from the European Center for Medium Weather Forecasting Reanalysis v5 (ERA5) for the area of Puerto Rico (18–16 lat, −68–64 lon) using the monthly reanalysis time series tool in the Climate Reanalyzer webtool https://climatereanalyzer.org/research_tools/monthly_tseries/ accessed on 2 of October 2023. Carbon dioxide data were obtained from the Global Monitoring Lab in Mauna Loa https://gml.noaa.gov/ccgg/trends/data.html accessed on 2 of October 2023. The Atlantic Multidecadal Oscillation, the North Atlantic Oscillation, the Arctic Oscillation, and the El Niño Southern Oscillation indexes were obtained from NOAA’s Climate Prediction Center https://www.cpc.ncep.noaa.gov/products/precip/CWlink/MJO/climwx.shtml accessed on 2 of October 2023.
Acknowledgments
We thank the Committee of Experts and Advisors on Climate Change (CEACC) of Puerto Rico for encouraging this work and providing data for this study.
Conflicts of Interest
The authors declare no conflict of interest.
References
- Lugo, A.E.; Martinó, A.G.; Ninci, H.; Ruiz, B. Cartilla del Agua Para Puerto Rico; Instituto Internacional de Dasonomía Tropical, Servicio Forestal del Departamento de Agricultura de los Estados Unidos: Washington, DC, USA, 1996. [Google Scholar]
- Larsen, M.C. Analysis of 20th century rainfall and streamflow to characterize drought and water resources in Puerto Rico. Phys. Geogr. 2000, 21, 494–521. [Google Scholar] [CrossRef]
- Smith, J.A.; Sturdevant-Rees, P.; Baeck, M.L.; Larsen, M.C. Tropical cyclones and the flood hydrology of Puerto Rico. Water Resour. Res. 2005, 41, 1–16. [Google Scholar] [CrossRef]
- Pando, M.A.; Ruiz, M.E.; Larsen, M.C. Rainfall-Induced Landslides in Puerto Rico: An Overview. In Proceedings of the Geo-Frontiers Congress 2005, Austin, TX, USA, 24–26 January 2005. [Google Scholar]
- Bessette-Kirton, E.K.; Cerovski-Darriau, C.; Schulz, W.H.; Coe, J.A.; Kean, J.W.; Godt, J.W.; Thomas, M.A.; Hughes, K.S. Landslides triggered by Hurricane Maria: Assessment of an extreme event in Puerto Rico. GSA Today 2019, 29, 4–10. [Google Scholar]
- Hernández Ayala, J.J.; Heslar, M. Examining the spatiotemporal characteristics of droughts in the Caribbean using the standardized precipitation index (SPI). Clim. Res. 2019, 78, 103–116. [Google Scholar] [CrossRef]
- Herrera, D.; Ault, T. Insights from a New High-Resolution Drought Atlas for the Caribbean Spanning 1950–2016. J. Clim. 2017, 30, 7801–7825. [Google Scholar] [CrossRef]
- Herrera, D.A.; Ault, T.R.; Fasullo, J.T.; Coats, S.J.; Carrillo, C.M.; Cook, B.I.; Williams, A.P. Exacerbation of the 2013–2016 Pan-Caribbean Drought by Anthropogenic Warming. Geophys. Res. Lett. 2018, 45, 10619–10626. [Google Scholar] [CrossRef] [PubMed]
- Ramos-Scharrón, C.E.; Arima, E. Hurricane María’s Precipitation Signature in Puerto Rico: A Conceivable Presage of Rains to Come. Sci. Rep. 2019, 9, 15612. [Google Scholar] [CrossRef]
- Ramos-Scharrón, C.; Arima, E.; Hughes, K. An assessment of the spatial distribution of shallow landslides induced by Hurricane María in Puerto Rico. Phys. Geogr. 2020, 43, 163–191. [Google Scholar] [CrossRef]
- Ramos-Scharrón, C.; Hernández Ayala, J.J.; Arima, E.Y.; Russell, F. Preliminary Analyses of the Hydro-Meteorological Characteristics of Hurricane Fiona in Puerto Rico. Hydrology 2023, 10, 40. [Google Scholar] [CrossRef]
- Malmgren, B.A.; Winter, A.; Chen, D. El Niño–Southern Oscillation and North Atlantic Oscillation Control of Climate in Puerto Rico. J. Clim. 1998, 11, 2713–2717. [Google Scholar] [CrossRef]
- Jury, M.; Malmgren, B.A.; Winter, A. Subregional precipitation climate of the Caribbean and relationships with ENSO and NAO. J. Geophys. Res. Atmos. 2007, 112. [Google Scholar] [CrossRef]
- Colón, J.A. Climatología de Puerto Rico; University of Puerto Rico Press: San Juan, Puerto Rico, 2009. [Google Scholar]
- Torres-Valcárcel, A.R. Teleconnections between ENSO and rainfall and drought in Puerto Rico. Int. J. Clim. 2018, 38, E1190–E1204. [Google Scholar] [CrossRef]
- Hernández Ayala, J.J. Atmospheric teleconnections and their effects on the annual and seasonal rainfall climatology of Puerto Rico. Theor. Appl. Clim. 2019, 137, 2915–2925. [Google Scholar] [CrossRef]
- Neelin, J.D.; Münnich, M.; Su, H.; Meyerson, J.E.; Holloway, C.E. Tropical drying trends in global warming models and observations. Proc. Natl. Acad. Sci. USA 2006, 103, 6110–6115. [Google Scholar] [CrossRef] [PubMed]
- Méndez-Lázaro, P.A.; Nieves-Santiango, A.; Miranda-Bermúdez, J. Trends in total rainfall, heavy rain events, and number of dry days in San Juan, Puerto Rico, 1955–2009. Ecol. Soc. 2014, 19, 50. [Google Scholar] [CrossRef]
- Jury Climatic trends in Puerto Rico: Observed and projected since 1980. Clim. Res. 2015, 66, 113–123. [CrossRef]
- Peters, E.J. The 2009/2010 Caribbean drought: A case study. Disasters 2015, 39, 738–761. [Google Scholar] [CrossRef]
- Hernández Ayala, J.J.; Méndez-Tejeda, R. The Extremely Active 2020 Hurricane Season in the North Atlantic and Its Relation to Climate Variability and Change. Atmosphere 2022, 13, 1945. [Google Scholar] [CrossRef]
- McLeod, A.I. Kendall Rank Correlation and Mann-Kendall Trend Test; R Package Kendall: Vienna, Austria, 2005; Volume 602, pp. 1–10. [Google Scholar]
- Goovaerts, P. Geostatistics for Natural Resources Evaluation; Oxford University Press: Oxford, UK, 1997. [Google Scholar]
- Goovaerts, P. Geostatistical approaches for incorporating elevation into the spatial interpolation of rainfall. J. Hydrol. 2000, 228, 113–129. [Google Scholar] [CrossRef]
- Reed, K.A.; Wehner, M.F.; Zarzycki, C.M. Attribution of 2020 hurricane season extreme rainfall to human-induced climate change. Nat. Commun. 2022, 13, 1905. [Google Scholar] [CrossRef]
- Vosper, E.L.; Mitchell, D.; Emanuel, K. Extreme hurricane rainfall affecting the Caribbean mitigated by the Paris agreement goals. Environ. Res. Lett. 2020, 15, 104053. [Google Scholar] [CrossRef]
Figure 1.
The topography of the island of Puerto Rico and the 23 historical rain gauges used in this study.
Figure 1.
The topography of the island of Puerto Rico and the 23 historical rain gauges used in this study.

Figure 2.
Mann–Kendall trend tests for annual (A), dry season (B), early wet season (C), and late wet season (D) rainfall over Puerto Rico.
Figure 2.
Mann–Kendall trend tests for annual (A), dry season (B), early wet season (C), and late wet season (D) rainfall over Puerto Rico.

Figure 3.
Results of Mann–Kendall trend tests on daily rainfall events at the 99th percentile (A), 95th percentile (B), and 90th percentile (C).
Figure 3.
Results of Mann–Kendall trend tests on daily rainfall events at the 99th percentile (A), 95th percentile (B), and 90th percentile (C).

Figure 4.
Differences in rainfall climatologies between the 1955–1987 and the 1988–2021 periods for the annual (A), dry season (B), early wet season (C), and later wet season rainfall (D).
Figure 4.
Differences in rainfall climatologies between the 1955–1987 and the 1988–2021 periods for the annual (A), dry season (B), early wet season (C), and later wet season rainfall (D).

Figure 5.
Percentage change of rainfall between the 1955–1987 and 1988–2022 climatologies for average annual precipitation (A), dry season (B), early wet season (C), and late wet season (D).
Figure 5.
Percentage change of rainfall between the 1955–1987 and 1988–2022 climatologies for average annual precipitation (A), dry season (B), early wet season (C), and late wet season (D).


Table 1.
Forward Stepwise Regression (FSR) procedure results for the selected sites with significant decreasing and increasing trends in rainfall.
Table 1.
Forward Stepwise Regression (FSR) procedure results for the selected sites with significant decreasing and increasing trends in rainfall.
| Step | Predictor Entered | R-Square | Adj. R-Squared | C (p) | AIC | RMSE |
|---|---|---|---|---|---|---|
| Guajataca Annual Rainfall FSR | ||||||
| 1 | SLP | 0.269 | 0.257 | 0.411 | 504.570 | 12.860 |
| 2 | AO | 0.303 | 0.280 | −0.371 | 503.549 | 12.659 |
| Guajataca Dry Season Rainfall FSR | ||||||
| 1 | SLP | 0.248 | 0.235 | 5.862 | 391.743 | 5.252 |
| 2 | NAO | 0.348 | 0.326 | −0.763 | 384.754 | 4.931 |
| Guajataca Early Wet Season Rainfall FSR | ||||||
| 1 | SLP | 0.123 | 0.109 | 4.471 | 424.546 | 6.814 |
| Guajataca Late Wet Season Rainfall FSR | ||||||
| 1 | SLP | 0.12 | 0.11 | 4.47 | 424.55 | 6.81 |
| Paraiso Annual Rainfall FSR | ||||||
| 1 | TPW | 0.404 | 0.394 | 7.956 | 548.683 | 18.251 |
| 2 | SAT | 0.459 | 0.441 | 3.721 | 544.525 | 17.524 |
| Paraiso Dry Season Rainfall FSR | ||||||
| 1 | TPW | 0.217 | 0.204 | −1.495 | 430.743 | 7.158 |
| Paraiso Early Wet Season Rainfall FSR | ||||||
| 1 | TPW | 0.2684 | 0.2564 | 0.2539 | 482.1975 | 10.76 |
| 2 | SLP | 0.3123 | 0.2894 | −1.3039 | 480.2966 | 10.52 |
| Paraiso Late Wet Season Rainfall FSR | ||||||
| 1 | TPW | 0.144 | 0.1299 | 10.2339 | 490.9232 | 11.539 |
| 2 | SAT | 0.2495 | 0.2245 | 3.6989 | 484.6346 | 10.894 |
| 3 | ONI | 0.3138 | 0.2789 | 0.4968 | 480.9898 | 10.505 |
Disclaimer/Publisher’s Note: The statements, opinions and data contained in all publications are solely those of the individual author(s) and contributor(s) and not of MDPI and/or the editor(s). MDPI and/or the editor(s) disclaim responsibility for any injury to people or property resulting from any ideas, methods, instructions or products referred to in the content. |
© 2023 by the authors. Licensee MDPI, Basel, Switzerland. This article is an open access article distributed under the terms and conditions of the Creative Commons Attribution (CC BY) license (https://creativecommons.org/licenses/by/4.0/).
Share and Cite
MDPI and ACS Style
Hernández Ayala, J.J.; Méndez Tejeda, R. Examining the Spatiotemporal Changes in the Annual, Seasonal, and Daily Rainfall Climatology of Puerto Rico. Climate 2023, 11, 225. https://0-doi-org.brum.beds.ac.uk/10.3390/cli11110225
AMA Style
Hernández Ayala JJ, Méndez Tejeda R. Examining the Spatiotemporal Changes in the Annual, Seasonal, and Daily Rainfall Climatology of Puerto Rico. Climate. 2023; 11(11):225. https://0-doi-org.brum.beds.ac.uk/10.3390/cli11110225
Chicago/Turabian StyleHernández Ayala, José Javier, and Rafael Méndez Tejeda. 2023. "Examining the Spatiotemporal Changes in the Annual, Seasonal, and Daily Rainfall Climatology of Puerto Rico" Climate 11, no. 11: 225. https://0-doi-org.brum.beds.ac.uk/10.3390/cli11110225
Note that from the first issue of 2016, this journal uses article numbers instead of page numbers. See further details here.