A Climate-Smart Approach to the Implementation of Land Degradation Neutrality within a Water Catchment Area in Kenya


Instituto de Ciências Agrárias e Ambientais Mediterrânicas (ICAAM), Universidade de Évora, Ap. 94, 7006-554 Évora, Portugal
*
Author to whom correspondence should be addressed.
Climate 2019, 7(12), 136; https://0-doi-org.brum.beds.ac.uk/10.3390/cli7120136
Submission received: 6 November 2019
/
Revised: 25 November 2019
/
Accepted: 29 November 2019
/
Published: 4 December 2019
Abstract
:At the sub-national level, the United Nations Convention to Combat Desertification (UNCCD) proposes the analysis and contextualization of land degradation-neutrality (LDN) at a water catchment scale to provide decision support for the formulation of policies and programmes towards transformative LDN interventions. Building on a number of national LDN studies in Kenya, an approach for the implementation of LDN that is based on the spatial and temporal characterization of key land degradation and climate change variables was defined. For a selected water catchment area, the LDN baseline was computed, the drivers that affect land degradation and regeneration trends within the main land cover types were identified and described, the trends of key climate change variables were described, and appropriate sustainable land management interventions for the main land cover types were identified. A climate-smart landscape approach that delineated the catchment area into zones focused on adaptation, and both adaptation and mitigation objectives was then proposed. The operationalization of a climate-smart landscape will require significant investment to not only provide an understanding of the bio-physical processes and interactions occurring at the catchment level but also to develop the institutional and technical capacities of relevant actors. The landscape approach proposed for the catchment area has the potential to improve livelihoods and the productivity of ecosystems while concurrently facilitating synergies between land degradation, climate change, and other development objectives.
1. Introduction
Land degradation and climate change are two of the most pressing global problems affecting terrestrial ecosystems. The landmark assessment report on land degradation and restoration by the Intergovernmental Science-Policy Platform on Biodiversity and Ecosystem Services (IPBES) underscores that land degradation is occurring in all parts of the terrestrial world, resulting in the reduced well-being of at least 3.2 billion people, and the loss of biodiversity and ecosystem services at a cost of more than 10% of the annual global gross product [1]. In addition, the Intergovernmental Panel on Climate Change (IPCC) states that in recent decades, changes in climate have caused impacts on natural and human systems on all continents by altering hydrological systems, affecting the quantity and quality of water resources, causing, inter alia, mainly negative impacts on crop yields, and the shift of geographic ranges, seasonal activities, migration patterns, and abundances of many terrestrial and freshwater species [2]. Furthermore, land degradation and climate change are inextricably linked. Soils contain vast reserves of organic carbon, which are estimated to be three times the amount of carbon in vegetation and twice the amount in the atmosphere [3]. When land is degraded, carbon dioxide (CO2) is released from cleared and dead vegetation, and through the reduction of the carbon sequestration potential of the degraded land [4]. Over the period 1970 to 2010, CO2 from forestry and other land use (FOLU) generated approximately 15% of total annual anthropogenic greenhouse gas (GHG) emissions [2]. Moreover, climate change may exacerbate land degradation through alteration of spatial and temporal patterns in temperature, rainfall, solar radiation, and winds [4], which could adversely affect both above- and below-ground fauna and flora. The inter-linkages between land degradation and climate change (as well as biodiversity loss) have been recognized and conceptualized in the Millennium Ecosystem Assessment (MEA) [5].
The Sustainable Development Goals (SDGs), adopted by the global community in 2015, include goals and targets related to land degradation and climate change. Specifically, goal 15.3 of the SDGs states: “By 2030, combat desertification, restore degraded land and soil, including land affected by desertification, drought and floods, and strive to achieve a land degradation-neutral world” [6]. The United Nations Convention to Combat Desertification (UNCCD) defines land degradation-neutrality (LDN) as a “state whereby the amount and quality of land resources necessary to support ecosystem functions and services and enhance food security remain stable or increase within specified temporal and spatial scales and ecosystems” [7]. SDG 13 is expressed as a clarion call to “take urgent action to combat climate change and its impacts” with targets related to: Strengthening resilience; integrating climate change measures into national policies and planning; improving human and institutional capacity on climate change, particularly in vulnerable groups; and monitoring progress towards climate financial commitments [6].
Notwithstanding the complex interconnections between land degradation and climate change [5], concurrently addressing these two phenomena is not an insurmountable problem. The IPBES report emphasizes that not only will the adoption of sustainable land management (SLM) practices avoid, reduce, and reverse land degradation (also known as the LDN response hierarchy, as elaborated by [8] in an article that summarizes the key features of the scientific conceptual framework for LDN), but SLM practices may also substantially contribute to the adaptation and mitigation of climate change [1]. In a report on the best SLM technologies and approaches for sub-Saharan Africa, the authors of [9] define SLM as “the adoption of land use systems that, through appropriate management practices, enables land users to maximize the economic and social benefits from the land whilst maintaining or enhancing the ecological support functions of the land resources.” The IPBES message [1] above, that actions to address land degradation can also contribute to addressing climate change, is aligned with the recommendations by [2] that the most cost-effective mitigation options in forestry are afforestation, sustainable forest management, and reducing deforestation; and in agriculture, these are cropland management, grazing land management, and restoration of organic soils. Further, included in the suite of low-cost and simple low-regret adaptation measures proposed by the IPCC for Africa [10] are: i) Harnessing Africa’s longstanding experiences with natural resource management, biodiversity use, and ecosystem-based responses, such as afforestation, rangeland regeneration, catchment rehabilitation, and community-based natural resource management to develop effective and ecologically sustainable local adaptation strategies; and ii) technological and infrastructural approaches in agricultural and water management, such as planting crop varieties that are better suited to shorter and more variable growing seasons, and constructing bunds to more effectively capture rainwater and reduce soil erosion.
A growing body of literature has documented that many SLM practices can lead to both mitigation and adaptation outcomes [9,11,12,13,14]. The framing of practices in terms of their potential to attain both adaptation and mitigation benefits has resulted in the emergence of the term “climate-smart” as a development concept. The term was first used by the Food and Agriculture Organization of the United Nations (FAO) to describe the needed transformation and reorientation of agricultural production systems in the face of climate change [15]. The term is now broadly used to express the pursuit of adaptation and mitigation objectives simultaneously across various ecosystems, e.g., climate-smart forests [16], climate-smart soils [17], and climate-smart landscapes [13]. The three main concepts that define a climate-smart approach are: Sustainably increasing productivity and incomes, adapting and building resilience to climate change, and reducing and/or removing greenhouse gas emissions.
The UNCCD LDN Target-Setting Programme (TSP) provides technical and financial support to over 120 countries, including Kenya, in three key areas: Accessing the best available data for the target setting, conducting a multi-stakeholder consultation processes to mainstream LDN into national SDG agendas, and identifying investment opportunities for LDN implementation [18]. At the sub-national level, the UNCCD TSP proposes the analysis and contextualization of LDN at the watershed scale to provide decision support for the formulation of policies and programmes towards transformative LDN interventions [19]. A watershed is an area that drains to a common outlet (stream, river, wetland, lake, or ocean), and where water, soil, geology, flora, fauna, and human land-use practices interact [20]. The use of watersheds as a socioeconomic-political unit for management, planning, and implementation is not a new concept, and has evolved from a focus on water resource management and the hydrological cycle, to the current integrated multidisciplinary approach of broadly managing ecosystems using the boundaries of the watershed, now commonly known as integrated watershed management [21].
To reduce the impacts of degradation and enhance the resilience of both ecosystems and rural livelihoods, one of the urgent step changes recommended by the IPBES [1] is the implementation of integrated landscape-wide approaches. The term ‘landscape approach’ has been applied in many different contexts, but can generally be termed to refer to a set of concepts, tools, methods, and processes used in landscapes to achieve multiple economic, social, and environmental objectives (multifunctionality), involving different actors [22]. Landscape initiatives at the watershed level are among the oldest landscape approaches [23], with the first written reference to watershed management dating to as far back as 800 BC [21]. As the terms water catchment and watershed are generally used synonymously [20], in the current study, the term water catchment will be used.
The operability of the LDN concept at the national level is an area of recent and growing research, resulting in a number of publications on the characterization of LDN. For example, the LDN baseline for Kenya (580,000 km2) in terms of the three LDN indicators (land cover, land productivity, and soil organic carbon (SOC)) was established using trends in the normalised difference vegetation index (NDVI) and land cover datasets over the 24-year period from 1992 to 2015 [24]; SOC baseline maps were derived by comparing different digital soil mapping methods and sampling densities in the Otjozondjupa Region (150,000 km2) in Namibia to provide new insights and guidance for future LDN SOC baseline mapping in other areas [25]; and for the Entity Republic of Srpska (a 25,024-km2 region that is part of Bosnia and Herzegovina), the baseline condition based on trends for land cover, land productivity dynamics, and SOC were derived based on a global dataset provided by the UNCCD for the three indicators [26]. More recently, [27] examined the impact of land use and land cover changes, surface runoff, and soil types to establish land capability maps to determine the extent of land degradation in the Awali basin (301 km2) in Lebanon.
Given this background, the present study aimed to propose an approach for the implementation of LDN at a water catchment level that is based on the spatial and temporal characterization of key land degradation and climate change variables. The present study builds on the results obtained from the following national level studies in Kenya: LDN baseline assessment [24], the identification of the key drivers of land degradation and regeneration [28], and the assessment of the potential of the current land-use policy framework in Kenya to achieve LDN [29]. For a selected water catchment area in Kenya, the specific objectives of this study were as follows: i) Compute the LDN baseline; ii) identify and describe the drivers that affect greening and browning trends within the main land cover types, and make a comparison with the results obtained at the national level; iii) characterize the water catchment area using key climate change variables; iv)identify appropriate SLM interventions for the main land cover areas; and v) conceptualize a climate-smart landscape and reflect on the possible benefits, challenges, and policy implications of LDN implementation therein.
2. Materials and Methods
2.1. Study Area
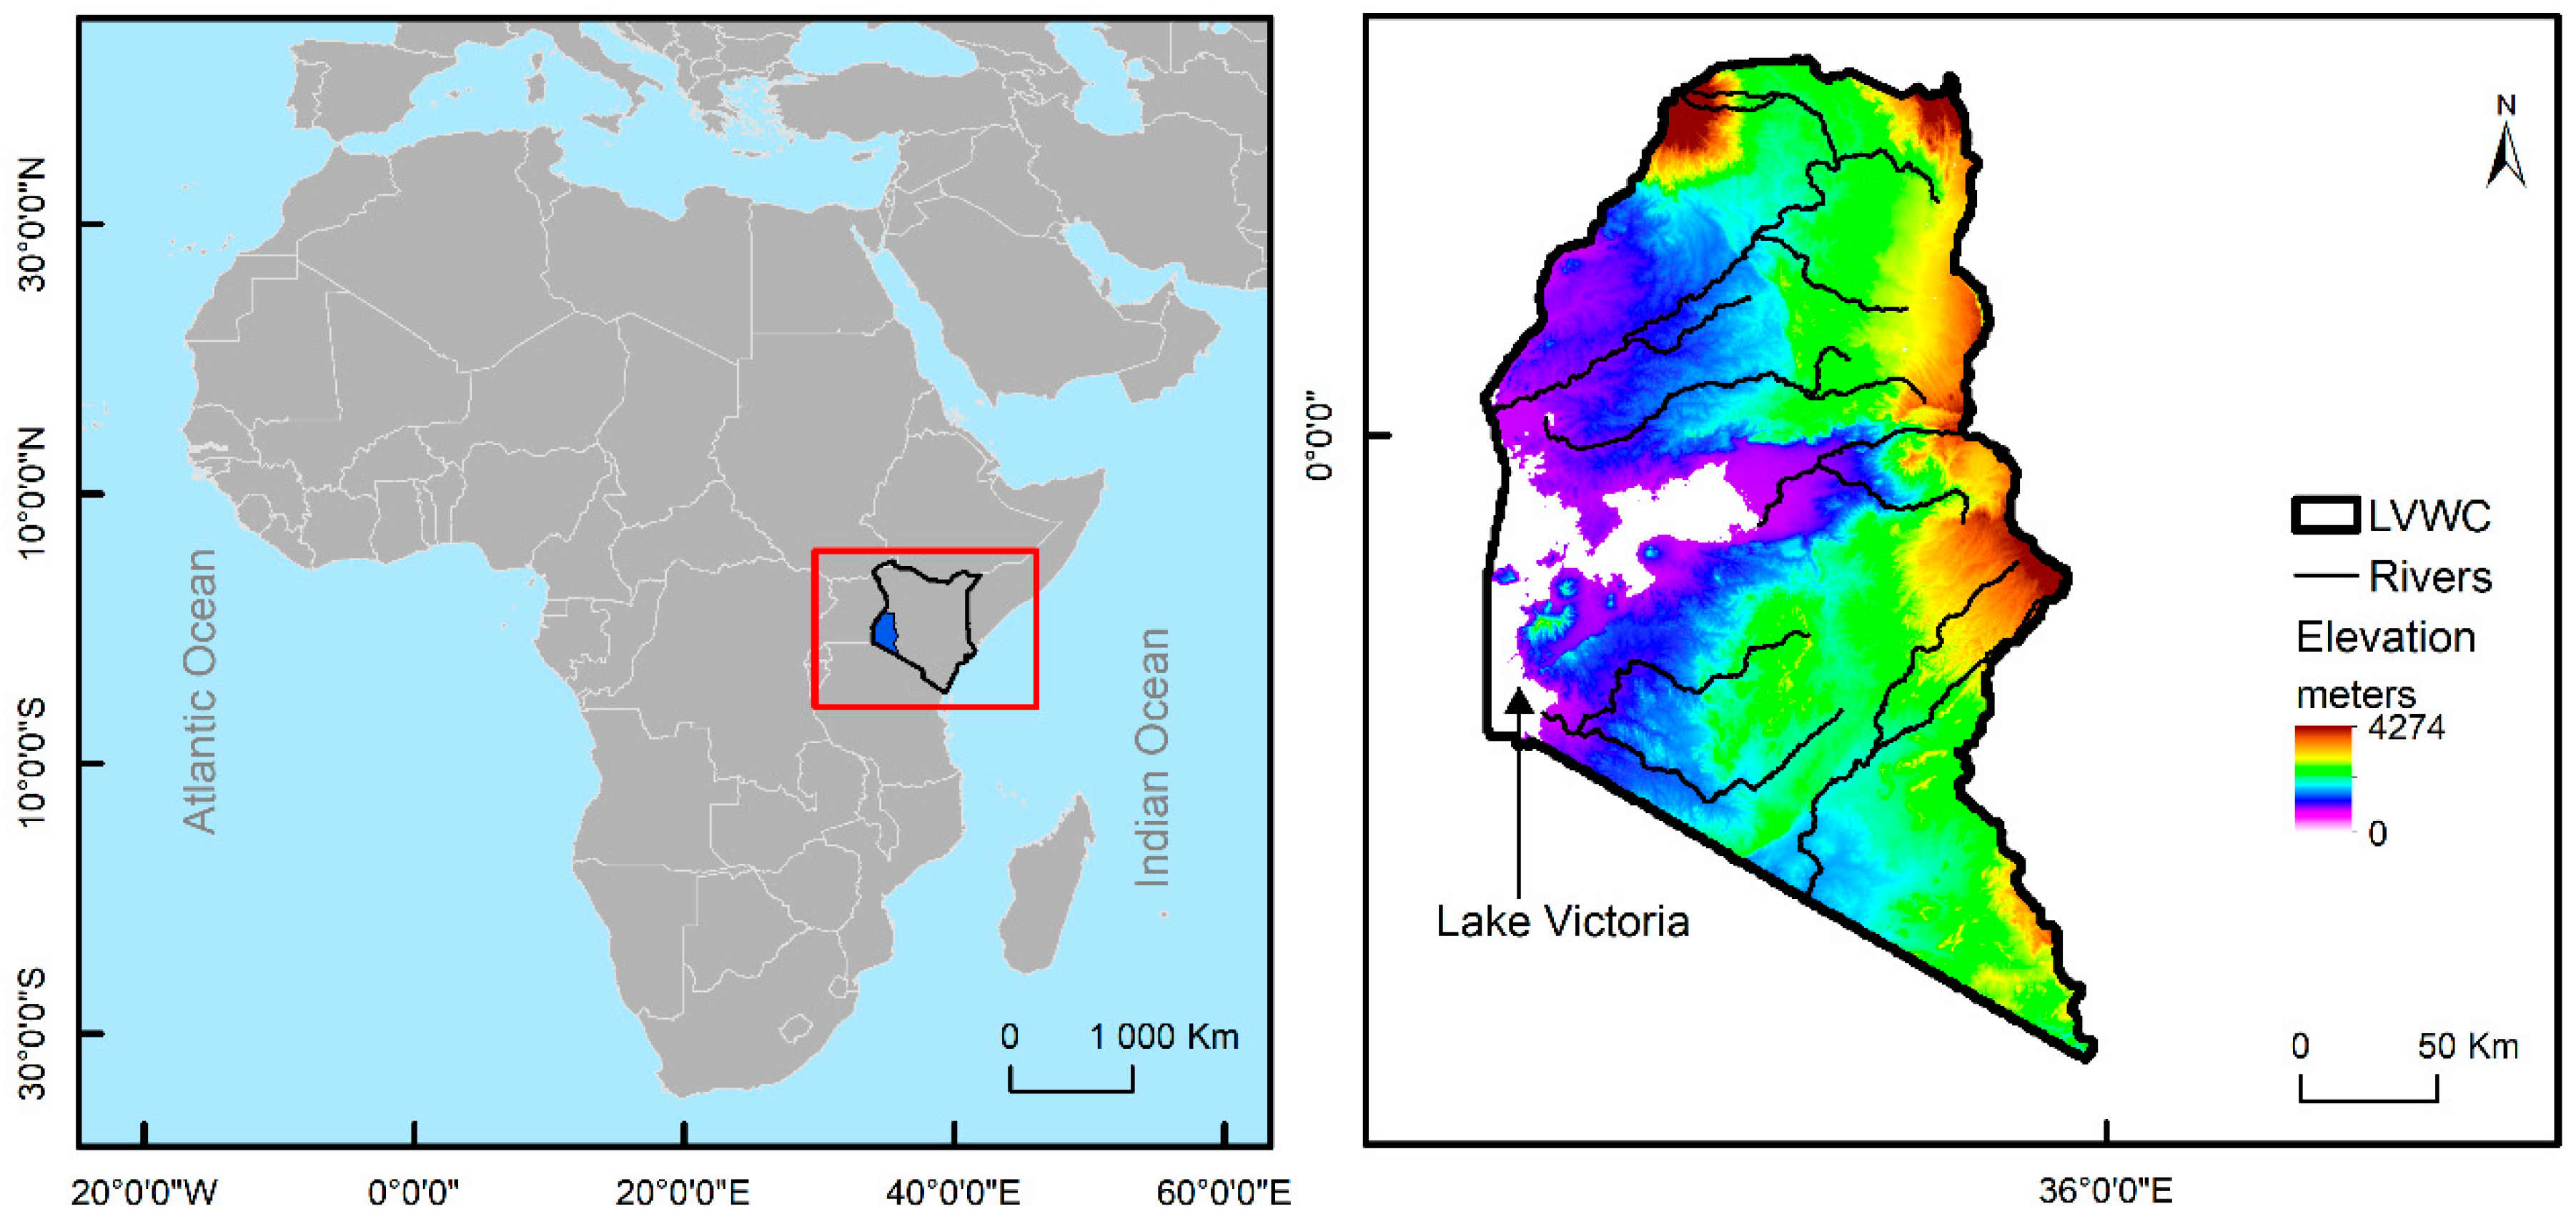
Kenya is located on the eastern coast of Africa and has a total area of 582,646 km2. The terrain and climate of the country varies considerably, and it is hot and humid along the coast, temperate inland, and very dry in the north and northeast parts of the country [30]. According to the National Water Master Plan 2030 [31], the country can be delineated into six main catchment areas. As the major rivers in the two smallest and contiguous catchment areas, Lake Victoria North and Lake Victoria South, drain into Lake Victoria [31], we merged these two water catchment areas into one. The merged area was termed the Lake Victoria Water Catchment (LVWC) and is the focus of our analysis (Figure 1).
LVWC is located at the western most part of the country as shown in Figure 1. It borders Uganda in the north, Tanzania in the south, and the Rift Valley catchment area in the east. Lake Victoria, which is the second largest fresh water lake in the world, forms the most western extent of the LVWC. The total area of the catchment area is 49,292 km2, corresponding to 8.5% of the country’s total area. Based on the population projections for 2017, the population of the area is estimated at 17.7 million, or 37.6% of the total population of Kenya [32]. The average population density is approximately 500 persons/km2, and ranges from 62 persons/km2 (in Narok county) to as high as 1202 persons/km2 (in Vihiga county). The LVWC encompasses 18 counties, of which 4 counties are partially located in the catchment area. An illustration of the county boundaries within the LVWC is provided in Appendix A.
According to the National Water Master Plan [31], the catchment area can be described as follows. The topography of the catchment area varies, peaking at an altitude of 4321 m above mean sea level (amsl) in Mt. Elgon, to Lake Victoria at 1134 m amsl. The major rivers in the catchment area are the Nzoia, Yala, Malaba, Malikisi, Sio, Nyando, Sondu, Kuja, and Mara rivers. The source of a number of these rivers is a large forest area in the eastern part of the catchment area, known as the Mau Forest Complex. LVWC has been the most vulnerable area to flood disasters in Kenya. The majority of the LVWC is classified as a humid area, and the mean annual rainfall ranges between 1200 and 1800 mm. The northern half of the catchment area has ample annual rainfall and is wet, but the lower southern part has less rainfall. Major crops cultivated are rain-fed and include horticultural crops and food crops, such as maize. Rice cultivation is active in the low-lying area near Lake Victoria. The share of irrigation area against cropping area ranges is low (less than 3%).
2.2. Data
2.2.1. Water Catchment Area
Vector data for the river basins of Kenya were downloaded from the Intergovernmental Authority on Development (IGAD) Climate Prediction and Applications Centre (ICPAC) GeoPortal (http://geoportal.icpac.net/layers/geonode%3Aken_riverbasins) [33]. The data were cropped to the extent of the LVWC, and projected to the WGS84 coordinate system.
2.2.2. LDN Baseline
The LDN national baseline for Kenya [24] was established as follows: The state in 2015 of each of the three LDN indicators (i.e., land cover, land productivity, and SOC) across the main land cover classes, and the trends in Global Inventory Monitoring and Modelling System (GIMMS) Normalised Difference Vegetation Index (NDVI) and land cover data for the 1992–2015 period. The LDN baseline is the reference state of the three LDN indicators at time zero (i.e., the year 2015 when the SDGs were adopted) against which the LDN target will be assessed in 2030 (the target date for the SDGs) [24]. The following layers (at 300-m resolution), as derived from the [24] study, were cropped to the extent of the LVWC:
- Land cover: The land cover maps for the period 1992–2015.
- Net primary productivity (NPP): MODIS annual NPP data for 2015.
- Soil organic carbon (SOC): SOC at the standard fixed depth interval of 0 to 30 cm (ton/ha).
- Greening and browning NDVI trends: Trends in the normalised difference vegetation index (NDVI) were used as a proxy for trends in land productivity. Persistent negative NDVI trends (an indication of land degradation) were termed as browning trends while persistent positive NDVI trends (an indication of land regeneration) were termed as greening trends.
2.2.3. Drivers of Greening and Browning Trends
- Dependent variable: The NDVI trends layer described above was used to derive the dependent variable. In 2015, the main land cover classes in the LVWC were agriculture (75%) and forests (13%). The share of greening and browning trends within the agriculture and forest layers (at a 300-m resolution), as well as the number of observations, are presented in Table 1.
- Explanatory variables: On the basis of the study undertaken by [28] on the analysis of the drivers that affect greening and browning trends in Kenya, the same dataset of 28 explanatory variables (broadly grouped into natural and anthropogenic variables) were used to identify the key drivers affecting greening and browning trends in the LVWC. A full description of the explanatory variables, the sources of data, and the SDG each variable most closely represents are contained in [28].
2.2.4. Climate Change Variables
The following three climate change variables were selected to characterize the water catchment area.
- Soil moisture: Soil moisture refers to the amount of water stored in the unsaturated soil zone [34]. Soil moisture is a slowly varying component of the Earth’s system, which can influence weather through its impact on evaporation and other surface energy fluxes [35]. In a review of soil moisture–climate interactions, [34] highlight that soil moisture constrains plant transpiration and photosynthesis in several regions of the world, with consequent impacts on the water, energy, and biogeochemical cycles. Soil moisture is a key variable of the climate system, through its action as a storage component for precipitation and radiation anomalies, thus inducing persistence in the climate system [34]. The soil moisture data was obtained from the combined active–passive microwave data set of the European Space Agency Climate Change Initiative (ESA-CCI) (https://www.esa-soilmoisture-cci.org/node/145). The combined ESA-CCI soil moisture data product (CCI SM v04.4) (in m3/m3 volumetric units, at a resolution of 0.25 degrees, and flag 0 pixels indicating no data inconsistency detected) for the period January 1992 to December 2017 was used in this study. The global daily data were cropped to the extent of Kenya, and then cropped again to the extent of the LVWC, and aggregated to monthly and annual mean values.
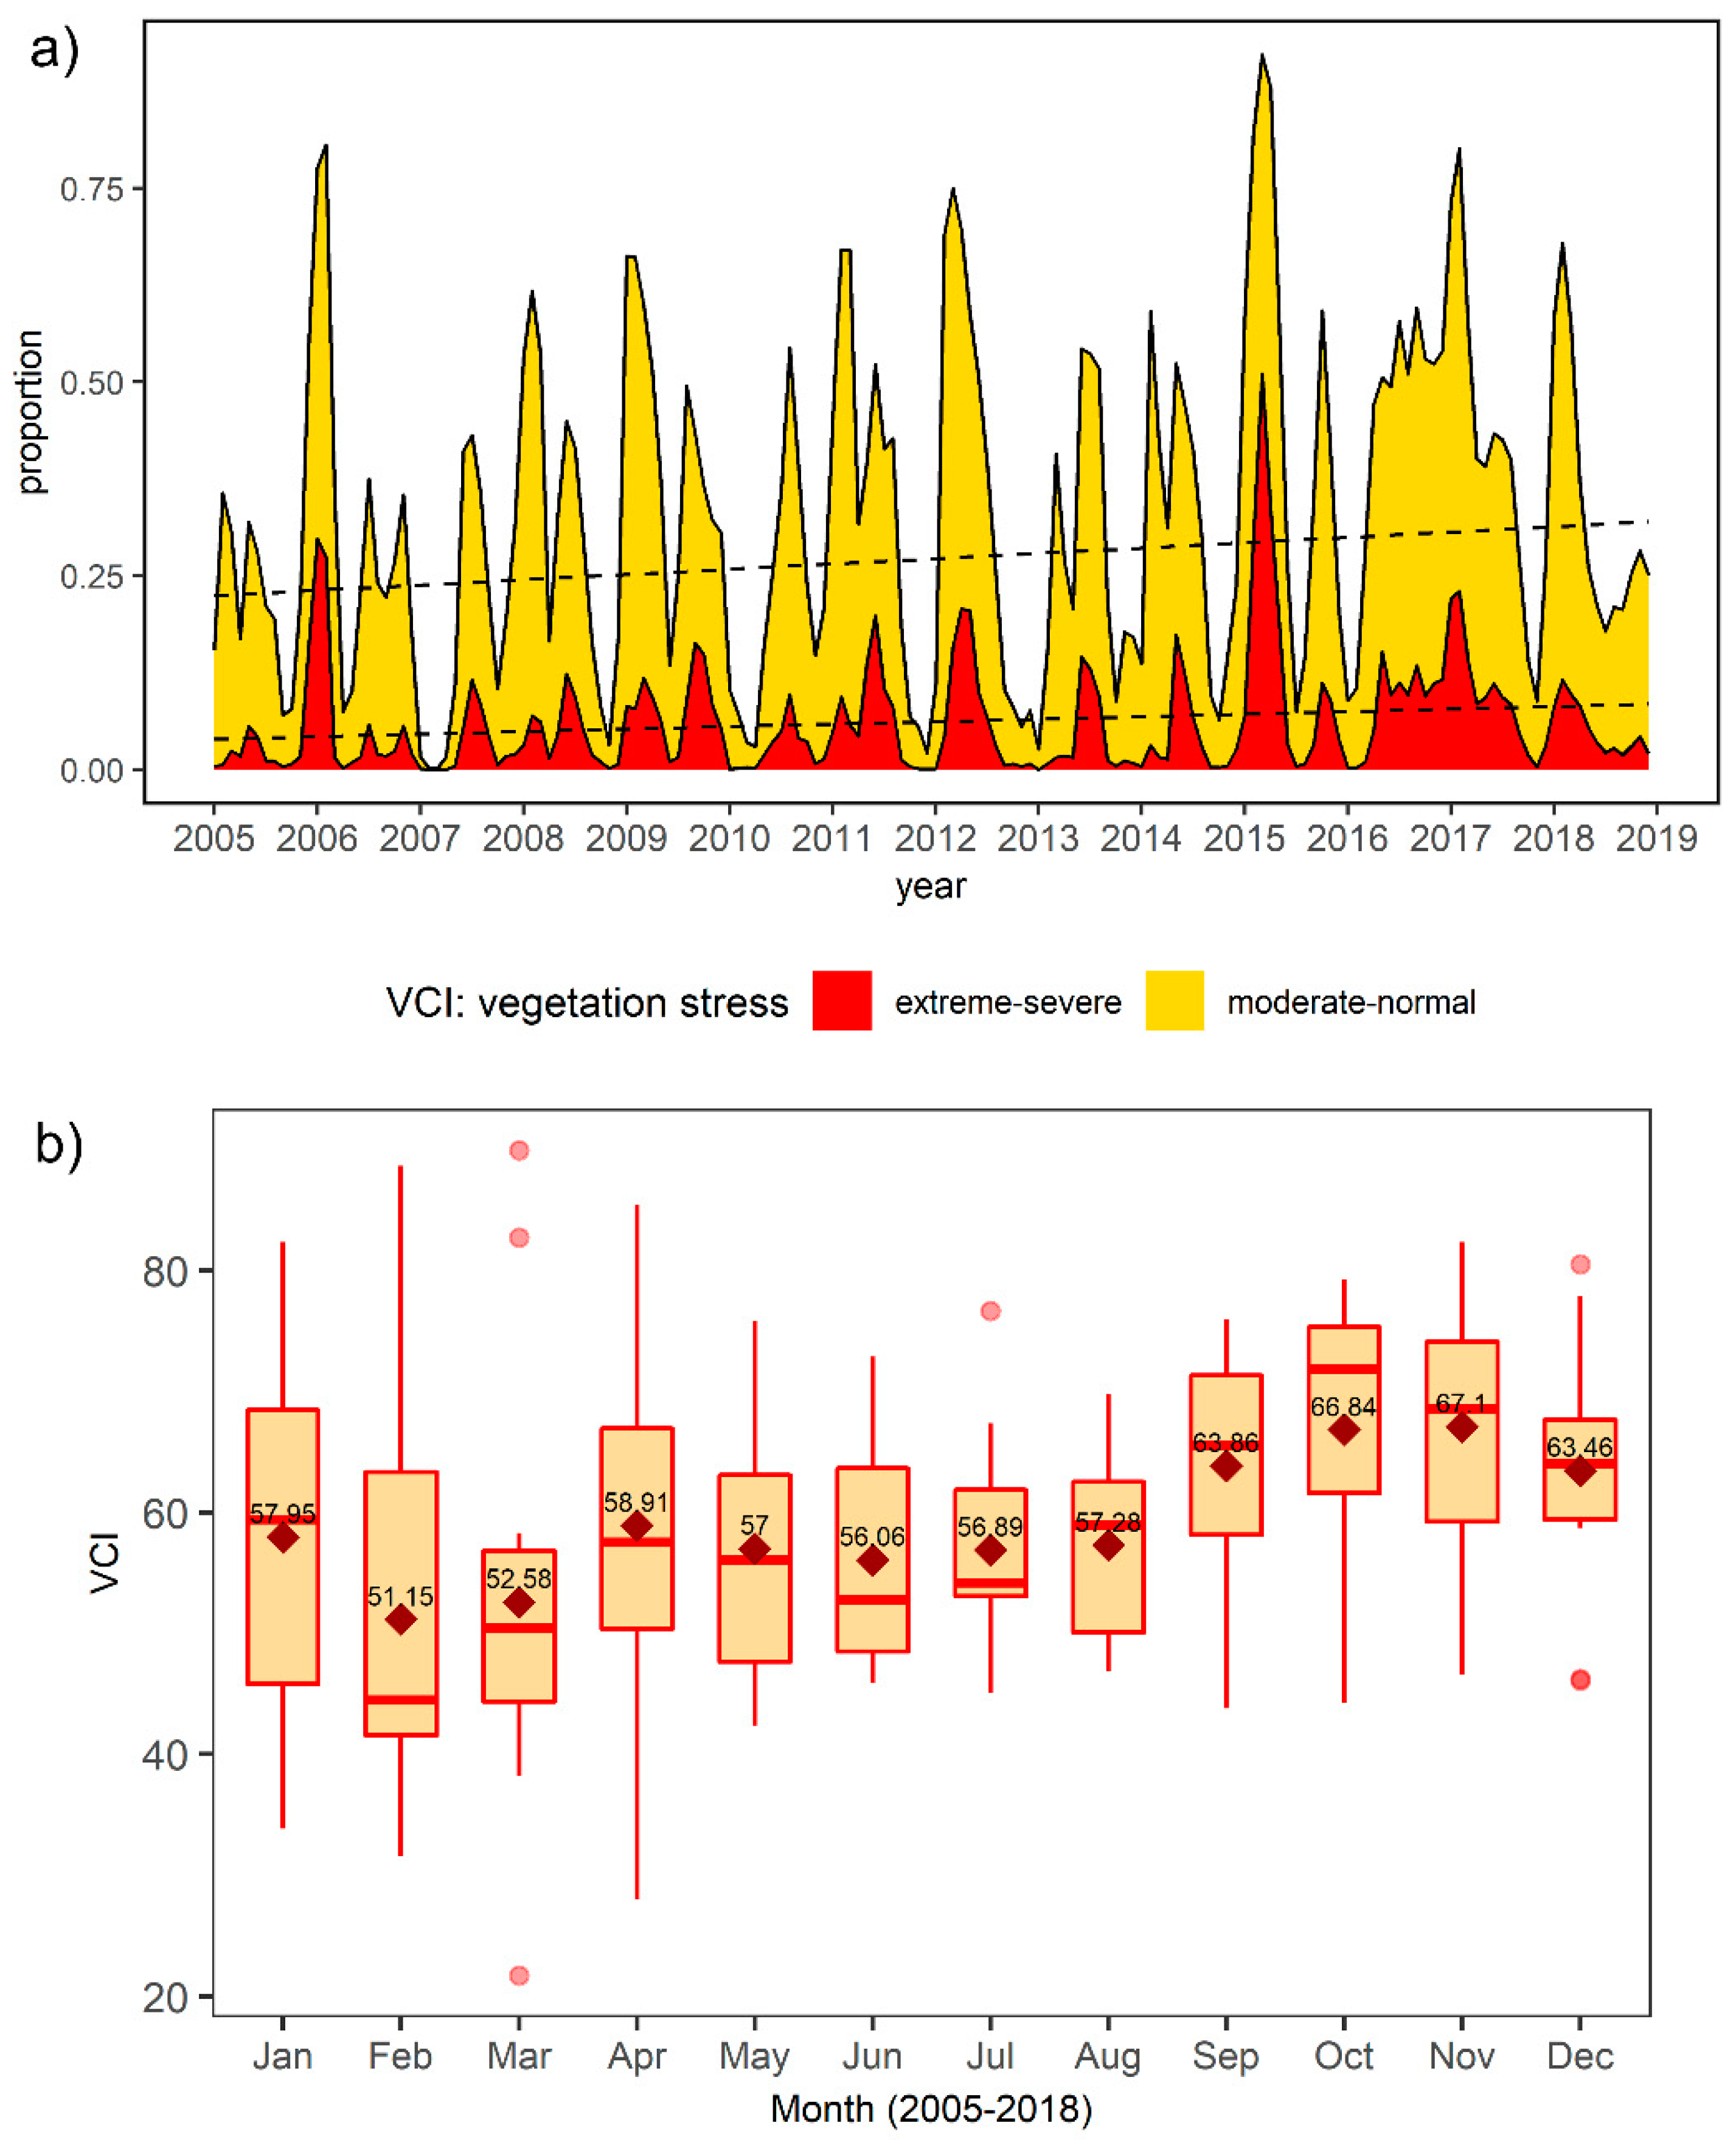
- Vegetation condition index: Since 2014, Kenya’s National Drought Management Authority (NDMA) uses the vegetation condition index (VCI) as the basis for providing disaster contingency funds to counties in drought conditions [36]. The VCI is an NDVI-based index that serves as a proxy for moisture vegetation health, and ranges from zero (representing extreme vegetation stress) to 100 (indicating optimal conditions) [37]. The NDMA uses the following thresholds to indicate the category of drought: ≥50 = wet; 35–50 = normal; 21–34 = moderate drought; 10–20 = severe drought; and <10 = extreme drought [36]. The VCI data at a resolution of 4-km, were derived from the National Oceanic and Atmospheric Administration (NOAA) and the Advanced Very High Resolution Radiometer (AVHRR) dataset [38]. The weekly records for the period 2005–2018 (prior to 2005 there are years with missing data) were cropped to the extent of Kenya, and then cropped again to the extent of the LVWC, and aggregated to monthly and annual mean values.
- Vulnerability index: The degree to which human and natural systems are susceptible to and unable to cope with the adverse effects of climate change, including climate variability and extremes, is referred to as vulnerability [39]. The vulnerability index spatial dataset (30-arc/sec spatial resolution), indicating the level of vulnerability to climate change impacts in Africa in 2010, was downloaded from the FAO GeoNetwork site (http://www.fao.org/geonetwork/srv/en/main.home) [40].
2.3. Methods
2.3.1. LDN Baseline
Using the extent for the LVWC, and following [24], we calculated the baseline state of each of the three LDN indicators per land cover type as follows: The area of each land cover class using the land cover map for 2015, the annual MODIS NPP in 2015, and the mean SOC in 2000. We also computed the change from year to year for each of the land cover classes over the 24-year period (increase or decrease in km2).
2.3.2. Drivers of Greening and Browning Trends
Following [28], the methodological approach used to identify the key drivers of greening and browning trends in the LVWC was the random forest (RF) machine learning algorithm. The methodological steps, outputs (variable importance (VI) plots using the mean decrease in accuracy (MDA) measure; and relative importance plots by SDG group), and performance metrics (accuracy; and Kappa) are described in [28]. However, the current study differs from the [28] study in the method used to balance the data. As indicated in Table 1, browning trends are predominant (more than 90%) in agriculture and forest areas. As the RF algorithm performs poorly for the classification of imbalanced data [41], we used the synthetic minority oversampling technique (SMOTE) to balance the data. The SMOTE algorithm, instead of replicating and adding observations from the minority class (in our case the greening class), generates artificial data through a combination of over-sampling of the minority class, and under-sampling of the majority class [42]. We split the dataset into a training set (80%) and a test set (20%). Using the training set and the DMwR package [43], we created a SMOTE training set by setting perc.over = 100 to double the greening cases, and setting perc.under = 200 to keep half of what was created as browning cases. The SMOTE training set was used as input to the RF model while the test set was used to score the model.
2.3.3. Trends of the Climate Change Variables
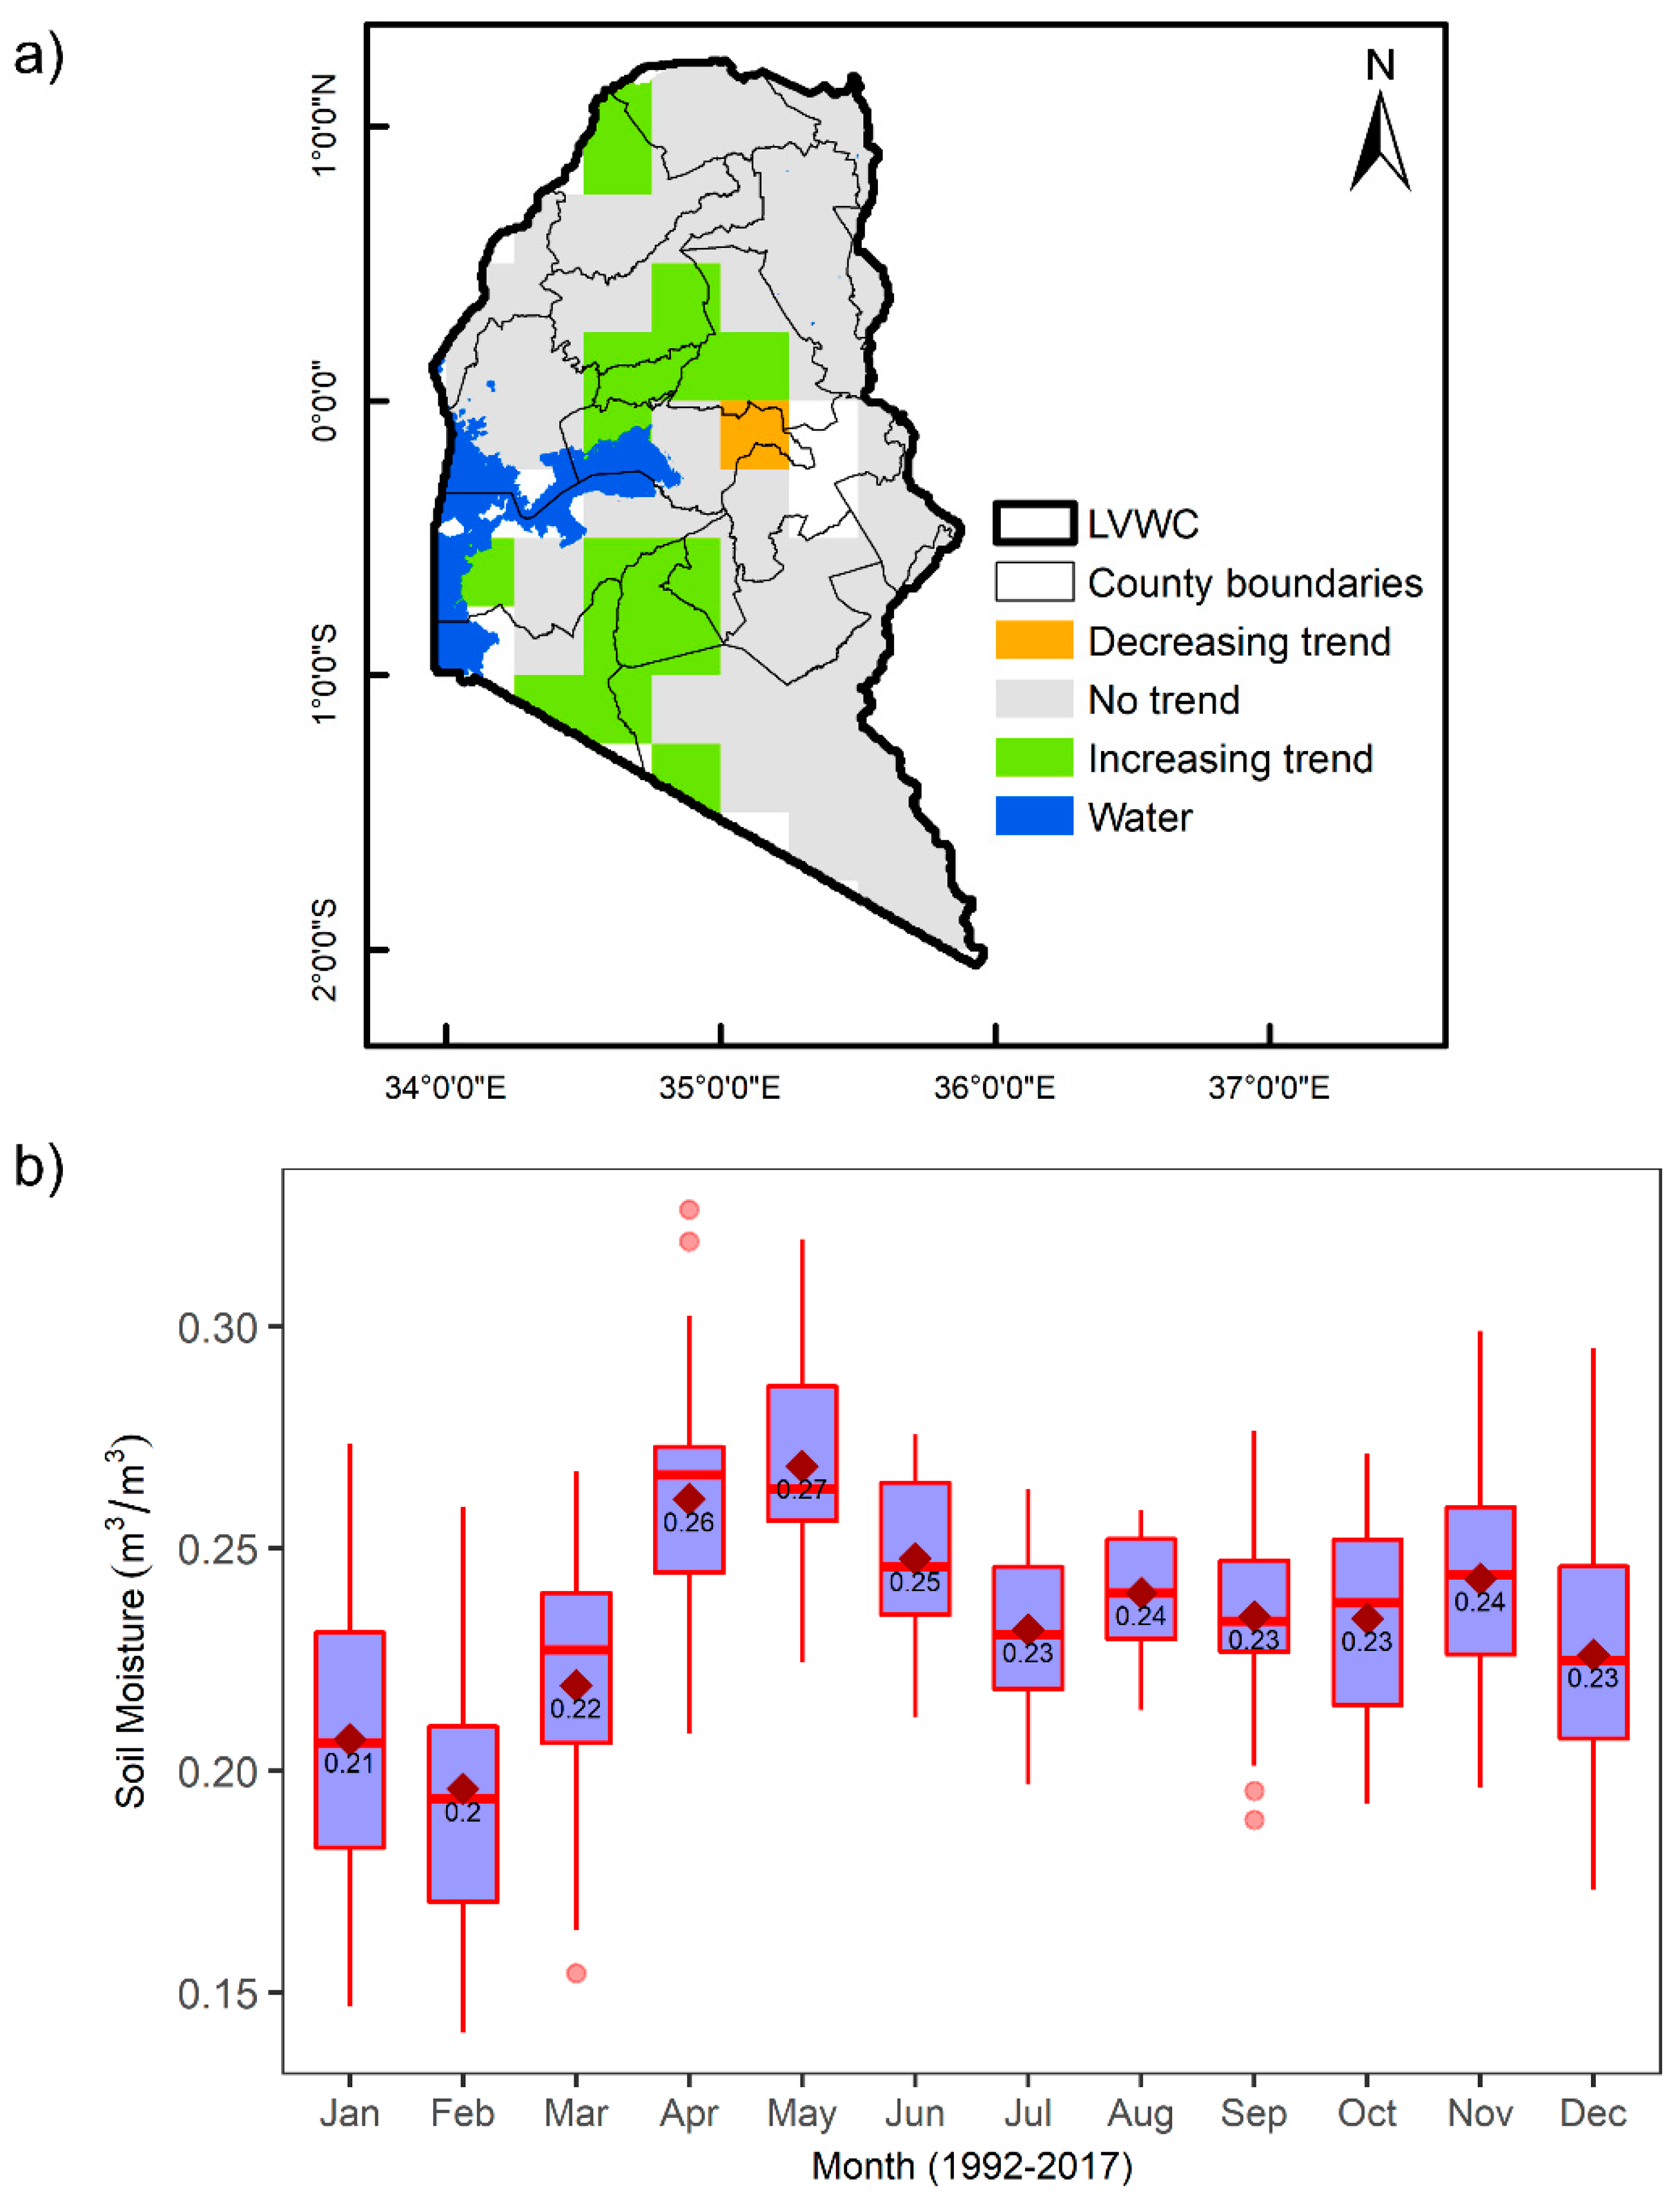
- Soil moisture trends and monthly variability: Using the greenbrown R package [44,45], we computed the pixelwise trend analysis on annual mean aggregated soil moisture time series (1992–2017) to extract significant trends (at a confidence level of 95%) for the water catchment area. The output was a single layer classified into three areas: Non-significant trends, positive significant trends, and negative significant trends. The trends layer was then resampled and projected to match the 300-m land cover data using the nearest-neighbour algorithm. We also examined the monthly variability of the soil moisture data by generating boxplots.
- VCI trends and monthly variability: Using the monthly aggregated data and the NDMA drought categories, the drought dynamics at the water catchment level was calculated as the percent of the area affected by drought as follows: VCI ranging from 21 to 50 indicates moderate-to-normal drought intensity; and VCI ≤ 20 indicates extreme-to-severe drought intensity. Linear trend lines were plotted to illustrate the direction of change of the proportion of the areas affected by drought. We also examined the monthly variability of the VCI data by generating boxplots.
- Vulnerability index: Based on the quantiles assigned to the vulnerability index layer [40], the values in the layer were grouped into the following three categories: low: <0.9; medium: 0.9 to 1.1; and high: >1.1. The vulnerability index layer was then cropped to the extent of the water catchment area, and then resampled and projected to match the 300-m land cover data using the nearest-neighbour algorithm.
2.3.4. SLM Interventions
A qualitative assessment of the potential of the current land-use policy framework to effectively implement LDN objectives was undertaken by [29]. One of the key findings of the aforementioned study was that the National Climate Change Action Plan (NCCAP) [46] contained targeted land-based interventions, which although aimed at mainstreaming adaption and mitigation actions into sector functions, could also comprehensively support the implementation of LDN. In this regard, [29] recommended that this 5-year action plan could be used as a first step towards implementing LDN, and as a tool for addressing synergies between climate change and land degradation. In this step of the analysis, we first identified SLM initiatives from the NCCAP [46] that could be implemented within the main land cover areas in the LVWC. Using the population density and land area of the LVWC, we then scaled down the national targets. For each broad cluster of SLM practices (e.g., water management, agroforestry, soil fertility management), we described the potential to address the three climate-smart objectives (i.e., increasing productivity and incomes, adapting and building resilience to climate change, and reducing and/or removing greenhouse gas emissions).
3. Results
3.1. LDN Baseline
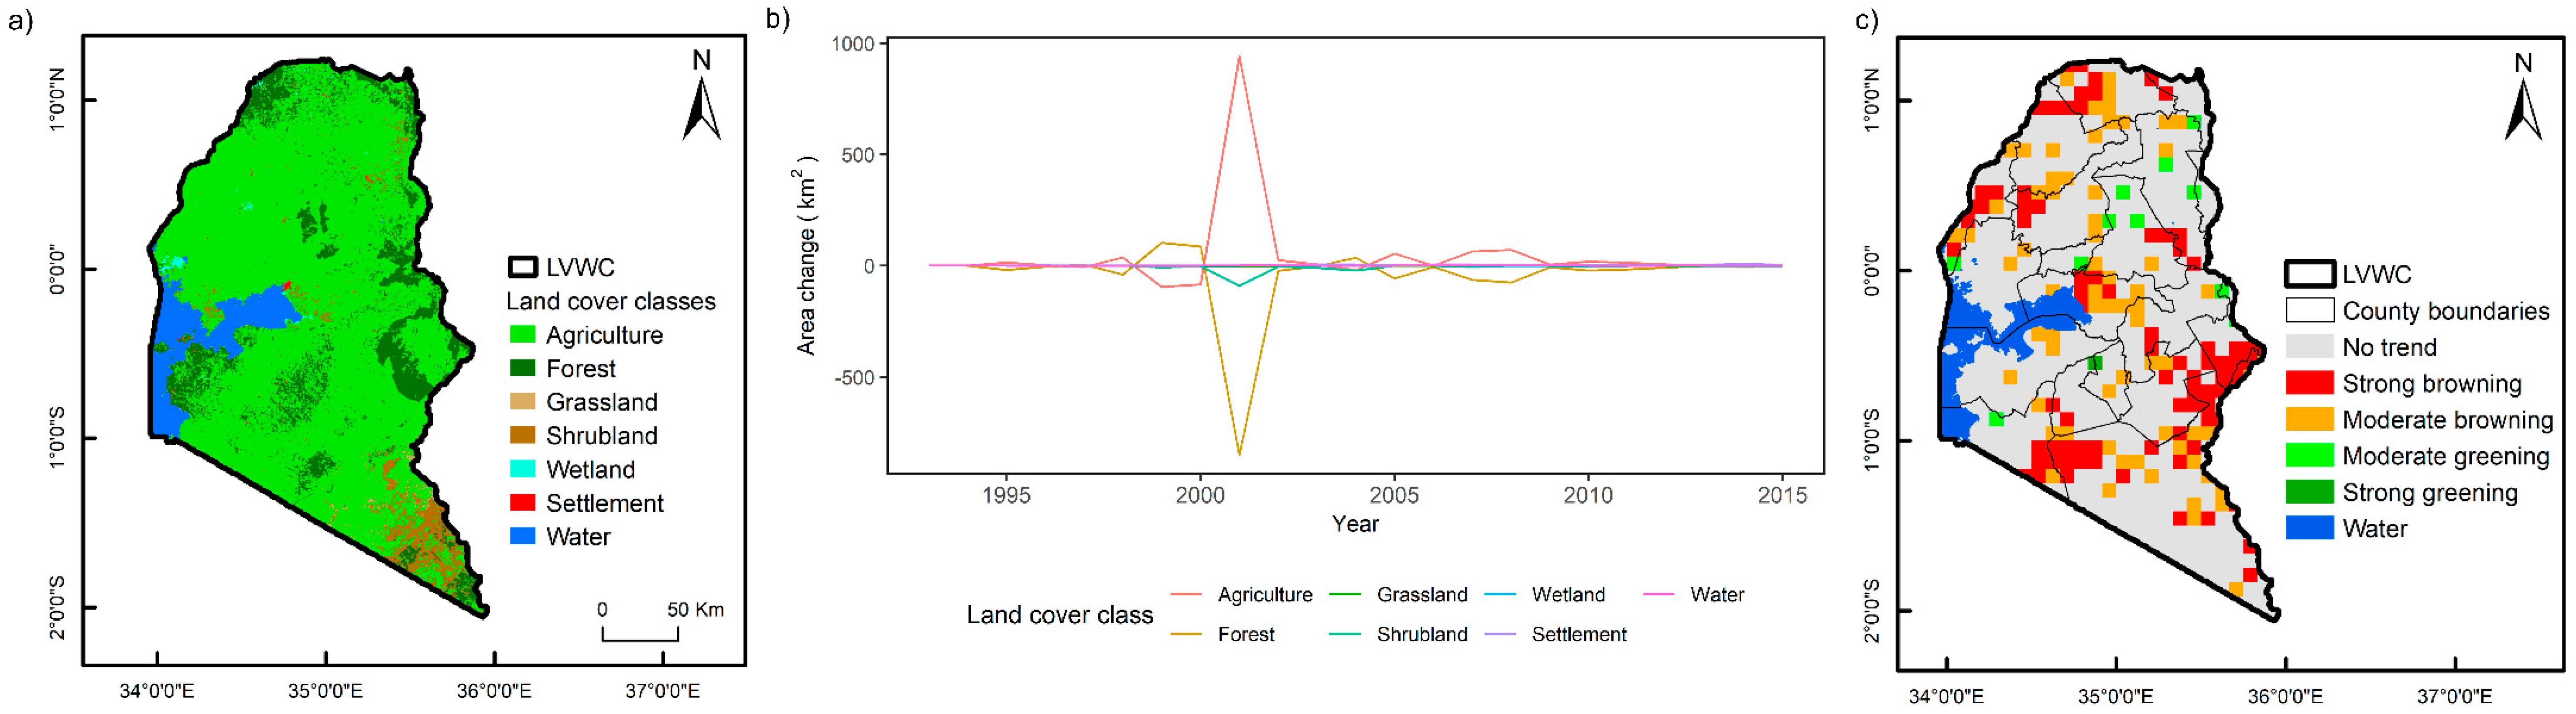
The LDN baseline is provided in Table 2. The highest values of NPP and SOC occur in forests and wetlands. In the LVWC, the predominant land cover class is agriculture (75%), followed by forest (13%) and water bodies (7%) (Figure 2a). The annual change in area (increase or decrease in km2) within each land cover class was examined and showed that the magnitude of change was more pronounced during the first half of the 24-year period (Figure 2b). Of note is that at the national level, a high rate of land cover change was also observed in the first half of the 24-year period from 1992 to 2015 [24]. The largest annual change in area occurred in 2001, whereby approximately 940 km2 of agriculture area increased at the expense of forest areas and shrublands.
In the catchment area, 67% of the area is characterized by non-significant NDVI trends (Figure 2c). Browning trends account for approximately a quarter of the area (with strong browning = 13%, and moderate browning = 11%). Greening trends (predominantly moderate greening) account for only 2% of the area (Figure 2c). Of note is that the trends illustrated in Figure 2c refer to human-induced trends, as the climate influence was removed from the NDVI trends [24].
3.2. Drivers of Greening and Browning Trends and Comparison with National-Level Results
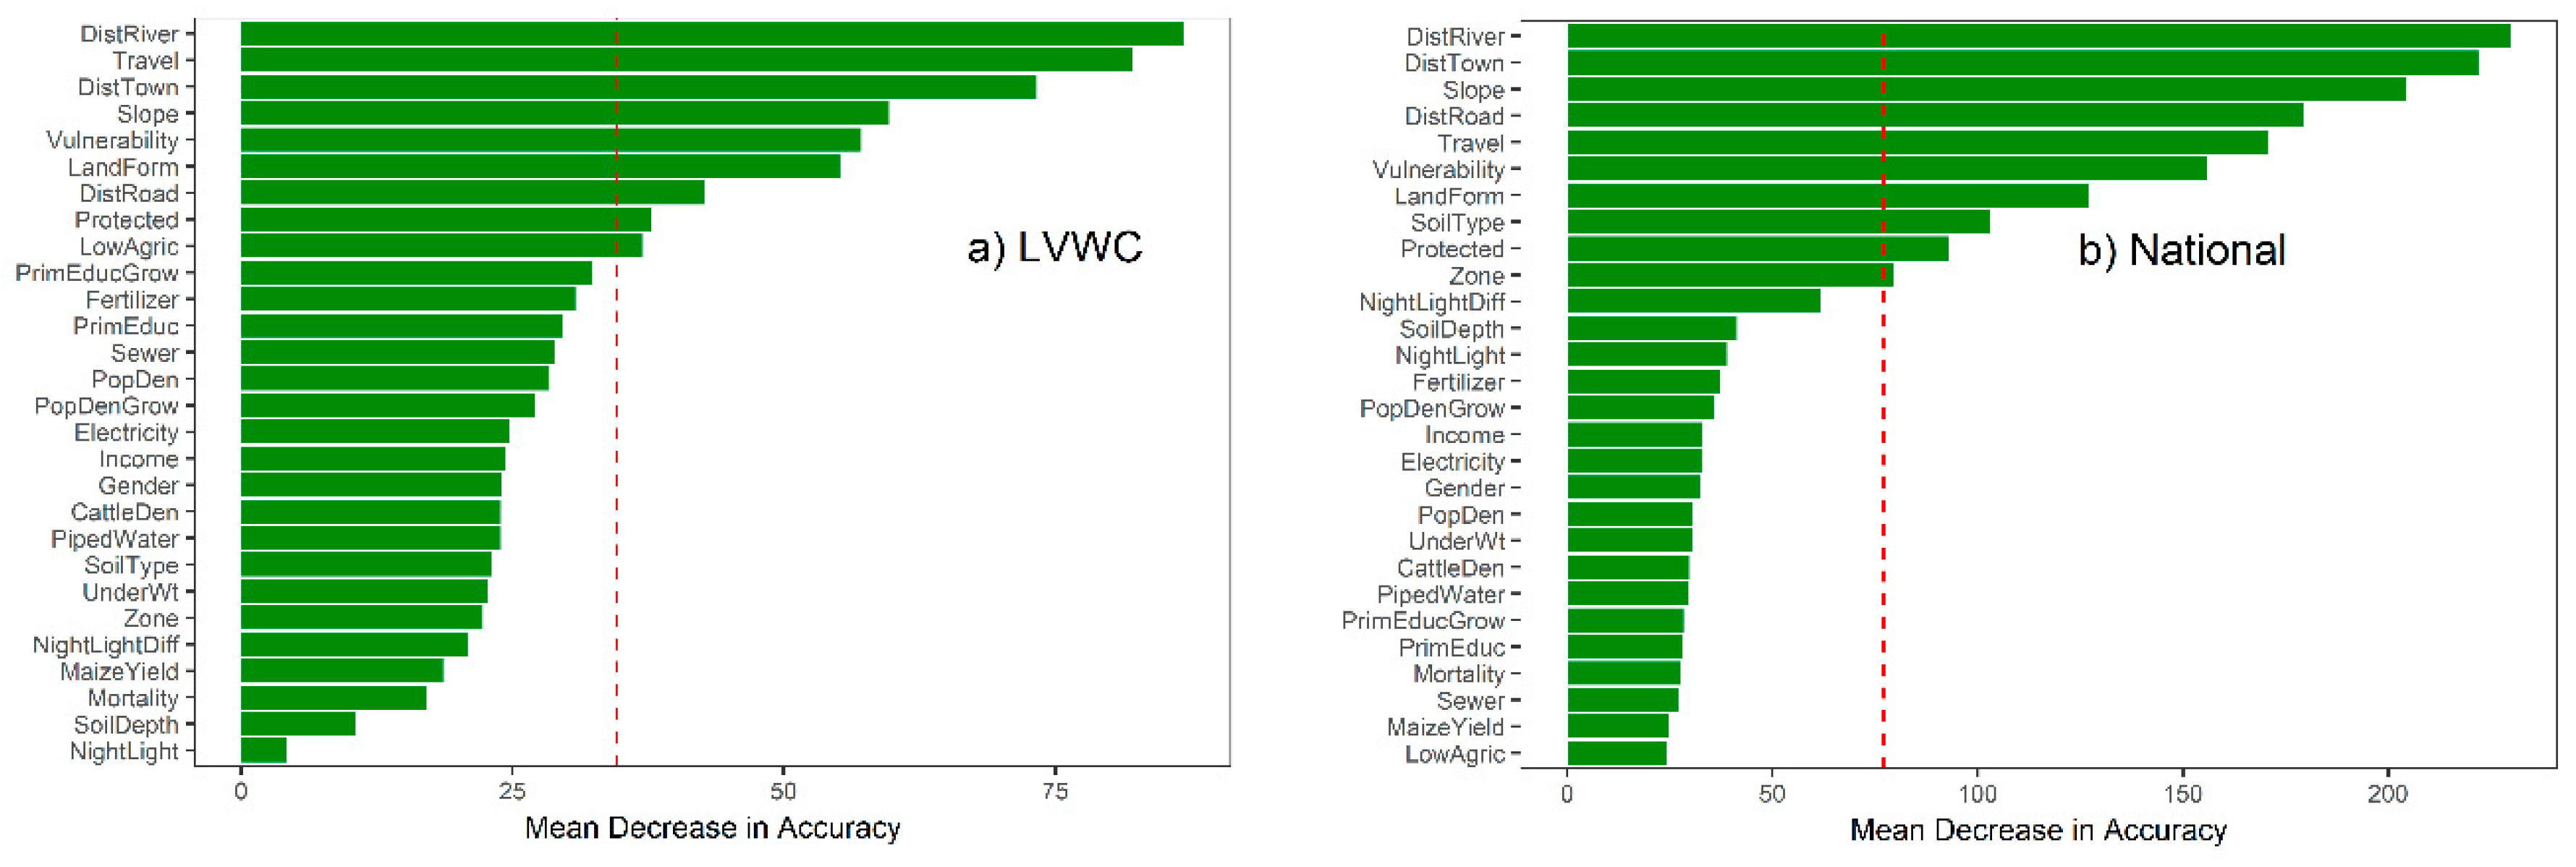
For the agriculture dataset, none of the 28 explanatory variables were rejected from the Boruta procedure (i.e., step 1 of the methodology as described in [28]. However, for the forest dataset, the variable night-time lights was rejected from the Boruta procedure. Hence, the RF analysis involved the use of all 28 explanatory variables in the agriculture dataset, and the use of 27 explanatory variables in the forest dataset. The two RF models showed strong performance, and the mean values for accuracy and Kappa are provided in Table 3.
The VI plots for the two datasets were derived from the mean of the 100 classifications. As depicted in the two VI plots (Figure 3 and Figure 4), the most important variables can be grouped as those with an MDA greater than the mean MDA (illustrated in Figure 3 and Figure 4 as the vertical red-dashed line). In agricultural areas, the most important variables in the LVWC (Figure 3a) were primarily the natural variables (slope, landform, and vulnerability) and the variables representing accessibility to markets both for the inputs and outputs of agricultural production (distance to roads, distance to towns, and travel time). For the most part, the most important variables at the national level (Figure 3b [28]) coincide with those at the LVWC. However the differences between the two levels are as follows. At the national level, the soil type and zone are above the mean MDA while in the LVWC, these two variables are below the mean MDA. Further, in the LVWC, the potential of agricultural land (i.e., the variable LowAgric) has a strong influence on greening and browning trends, unlike at the national level, where this variable is ranked the lowest. Most of the LVWC falls within the humid moisture zone. Agricultural areas in the LVWC have a predominant soil type (i.e., acrisols), and are mainly of medium or high potential.
Similar to agricultural areas in the LVWC, the most important variables in forest areas were primarily the natural variables and the variables representing accessibility to markets (Figure 4a). As well, the most important variables in forest areas at the national level (Figure 4b [28]) coincide with those at the LVWC. However, the differences between the two levels are as follows. At the national level, zone, soil type, and protected areas are above the mean MDA, while in the LVWC, these three variables are below the mean MDA. Of note is that in the LVWC, one social development variable, the growth in primary school enrolments between 1992 and 2015, has a strong influence on greening and browning trends. Andosols are the predominant soil type group in forest areas in the LVWC. Unlike at the national level, where most of the forest areas are not within protected areas, in the LVWC, forests are equally distributed within both protected and non-protected areas.
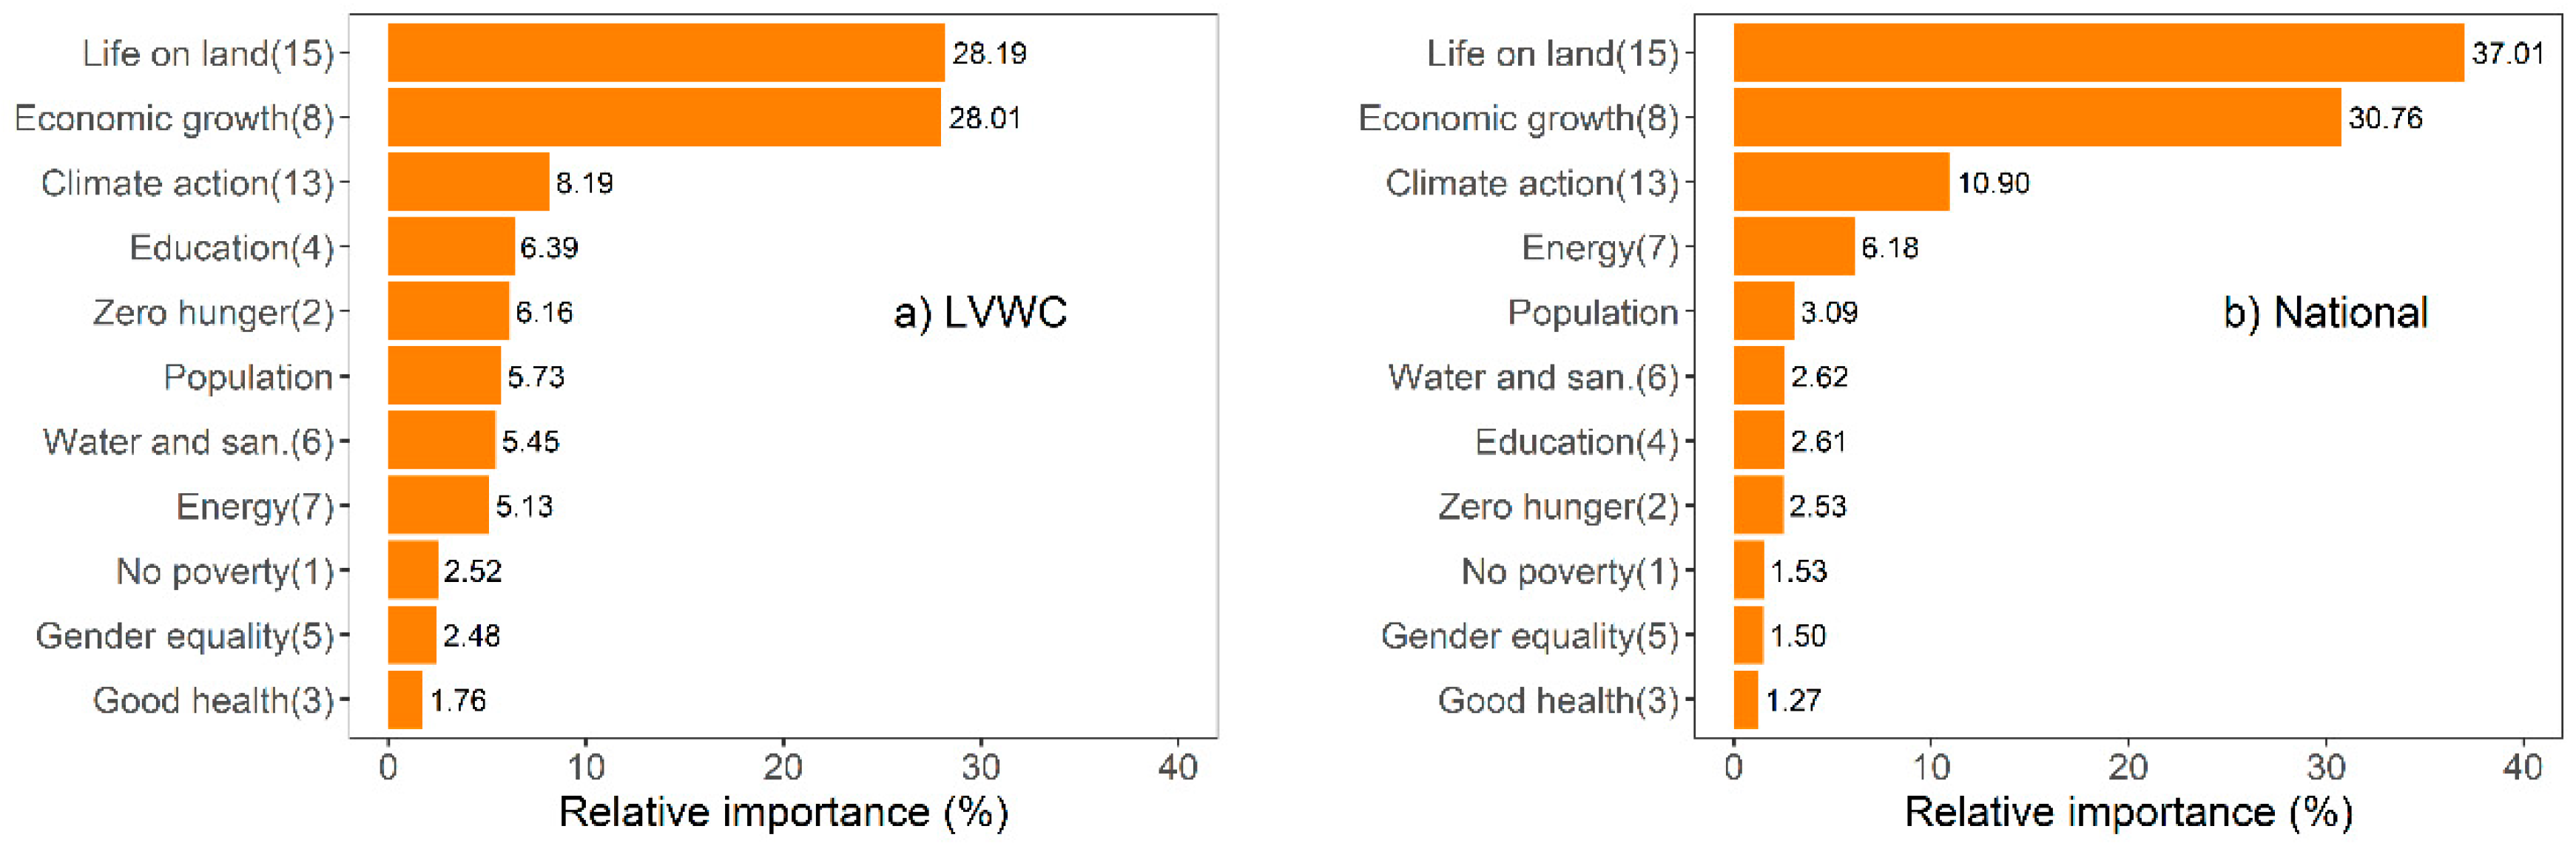
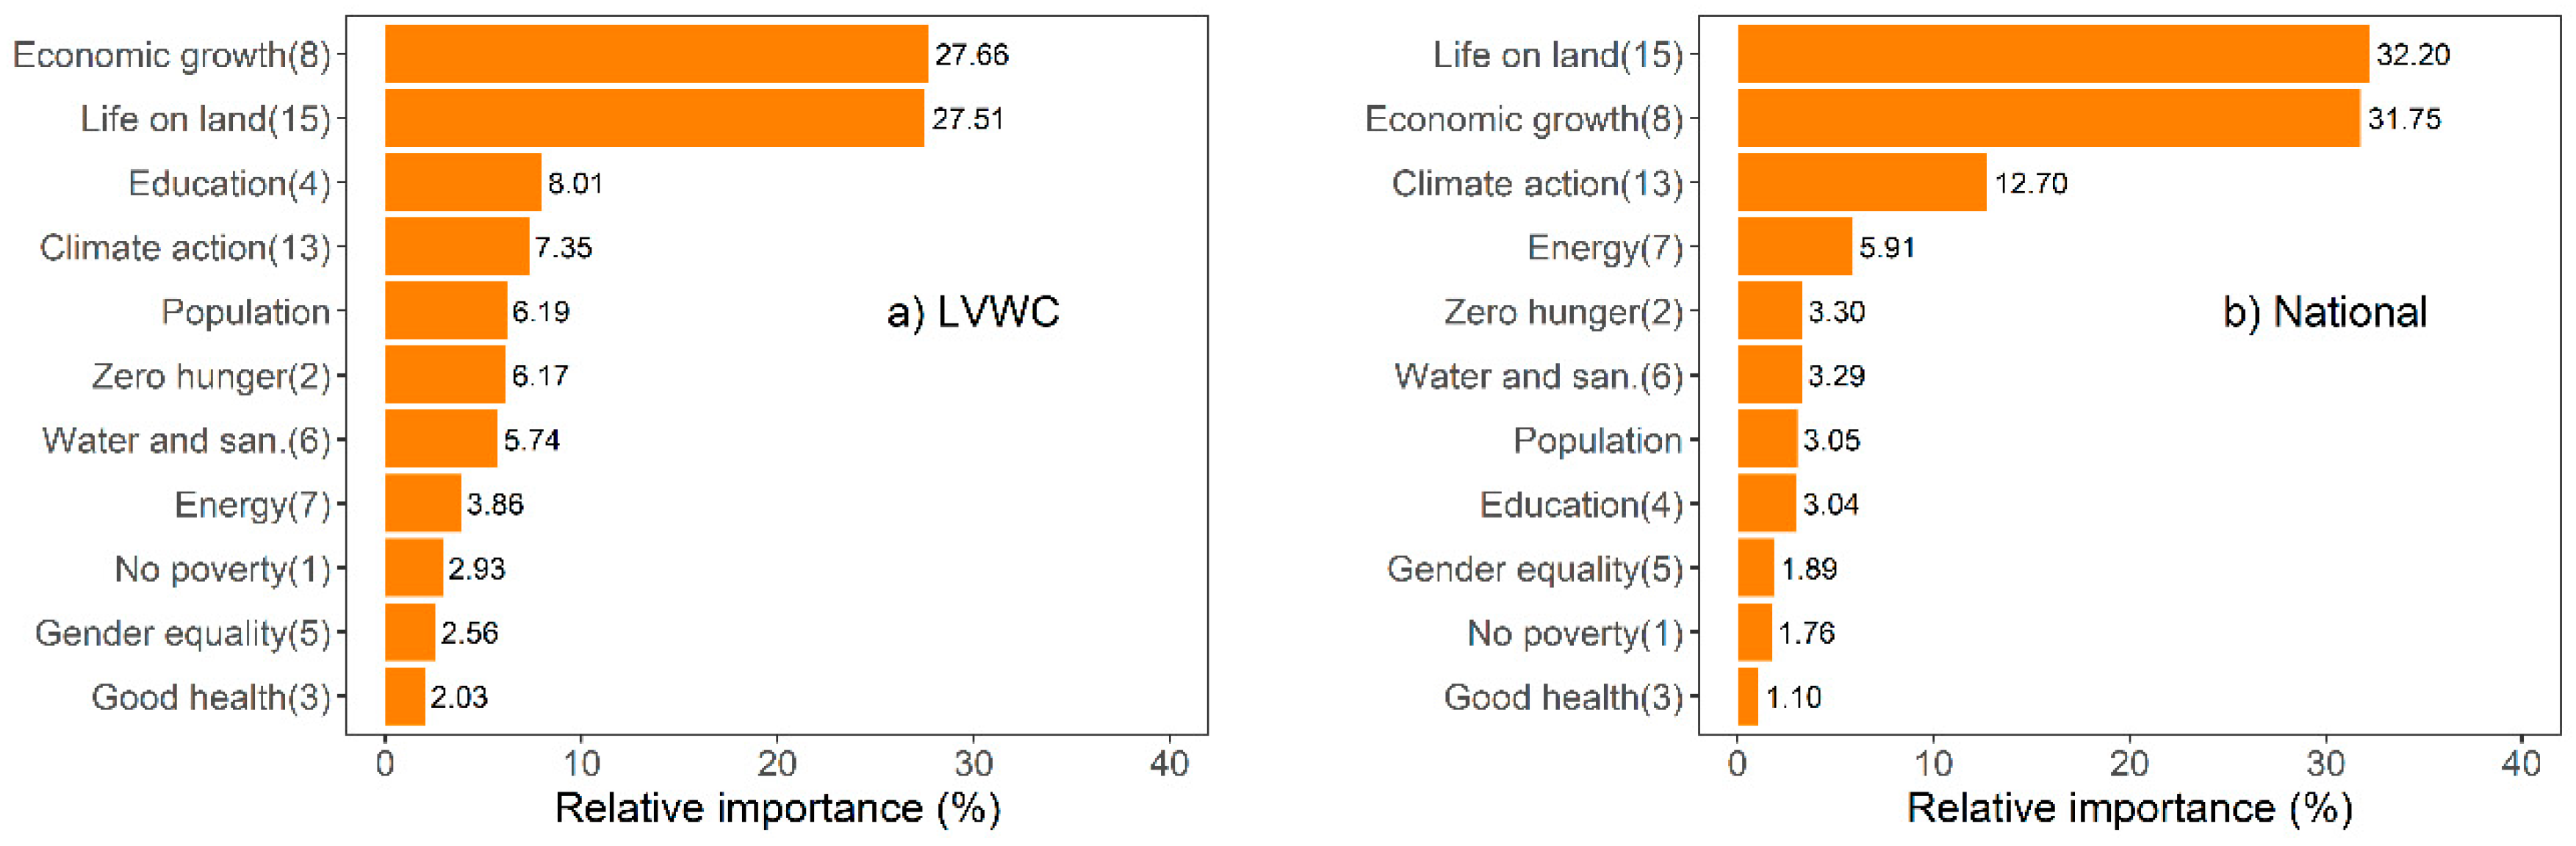
When the variables were grouped by SDGs, we note the similarity of the results obtained across the two datasets in the LVWC. In both agricultural and forest areas in the LVWC, the variables grouped under the SDGs 15 (life on land) and 8 (economic growth) cumulatively account for over 50% of the prediction of the greening and browning trends (Figure 5a and Figure 6a). The main difference between the national level results (as obtained from [28]) and the results in the catchment area in both agricultural and forest areas, was the higher relative importance of the social dimensions of sustainable development, and in particular education (SDG 4), in contributing to greening and browning trends.
3.3. Trends of the Climate Change Variables
Non-significant soil moisture trends account for the largest share of the area (70%) (Figure 7a). Increasing soil moisture trends account for approximately one-fifth of the area (22%), and occur both north and south of Lake Victoria. Decreasing soil moisture trends are a very small share of the area (<2%). The boxplot depicting the monthly soil moisture variability indicates that over the 26-year period (1992–2017), there was considerable variability in the range of soil moisture values in each month (Figure 7b). May is the month with the maximum mean soil moisture. Outlier values (i.e., those points that are outside 1.5 times the interquartile range either above the upper quartile or below the lower quartile) occurred in the upper quartile in April, and below the lower quartile in March and September.
Figure 8 shows the drought dynamics expressed as a percent of the drought-affected area to the area of the entire region, for the 14-year period (2005–2018) using the VCI. In general, extreme to severe drought does not cover more than 25% of the LVWC. However, there were two main peaks in the areas with extreme to severe drought: Late 2005 and early 2006, and over the first half of 2015. As per the NDMA classification, most of the area can be characterized as being wet (i.e., VCI ≥ 50). However, as illustrated in Figure 8a, the increasing linear trend lines indicate that the proportion of the area in the LVWC under extreme-severe and moderate-normal has been increasing over the 14-year period. The boxplot illustrating the monthly VCI variability also indicates that over the 14-year period, each month was wet (minimum mean VCI was 51.15 in the month of February) (Figure 8b). There was considerable variability in the range of VCI values, particularly in the months of January, February, and April. The maximum mean VCI occurred in October (66.84). Outlier values occurred both above the upper quartile and below the lower quartile in March and December, and above the upper quartile in July.
The spatial distribution of the vulnerability index indicates the predominance of low vulnerability (47%) and medium vulnerability (43%) areas (Figure 9). High vulnerability areas account for approximately 4% of the area and are located primarily north of Lake Victoria.
3.4. SLM Interventions
The main SLM initiatives identified in the NCCAP [46] that could be implemented within the LVWC are provided in Table 4. These SLM interventions were obtained from the following four main priority areas of the NCCAP [46]: Food and nutrition security; water and the blue economy; forestry, wildlife, and tourism; and energy. We focused on those land-based SLM interventions with clear quantifiable targets, and the national targets were scaled down using the population density and land area of the LVWC. The SLM practices broadly fall into the following clusters: Minimum soil disturbance, soil fertility management, agroforestry, water management, and planted forests. The potential for each broad cluster of SLM practices to address the three climate-smart objectives (i.e., increasing productivity and incomes, adapting and building resilience to climate change, and reducing and/or removing greenhouse gas emissions) is described in Table 4.
4. Discussion
4.1. A Climate-Smart Landscape for the LVWC
Following the characterization of the LVWC by key land degradation and climate change variables, the identification of the key drivers that affect greening and browning trends within the two main land cover types (agriculture and forest), and the identification of appropriate SLM practices from the NCCAP [46], we now propose a climate-smart landscape [13] for the LVWC, followed by a discussion of the benefits, challenges, and policy implications of LDN implementation therein. The proposed climate-smart landscape for the LVWC is based on the delineation of land units to provide benefits for adaptation, mitigation, and for both adaptation and mitigation, as exemplified by [47]. As illustrated in Figure 10, the climate-smart landscape for the LVWC is composed of the following three distinct zones: i) The highland areas (>2200 m), forming part of the northern and eastern border of the water catchment, are to be reserved for forest protection and restoration (combined focus on mitigation and adaptation); ii) the central part is to be reserved for annual crops or livestock (adaptation focus); and iii) the lowlands (<1500 m) around Lake Victoria are to be reserved for perennial crops (combined focus on mitigation and adaptation).
The forest zone corresponds primarily to the areas within the LVWC with a high forest cover (Figure 2a). There are strong browning trends located in the protected areas around Mt Elgon and the Mau Forest Complex (Figure 2c). These protected areas should be the first priority for implementation of the enhanced protection of natural forests to curb deforestation and forest degradation, as identified in Table 4. To increase tree cover outside of the protected areas, two other interventions identified in Table 4 that can be implemented in this zone are the establishment of plantations by the private sector, and the planting of one million trees per county per year. Apart from the latter target, more ambitious targets are proposed for the other two interventions as browning trends account for 26% of forest areas or 172,500 ha in the LVWC. Increasing soil moisture trends around Mt. Elgon indicate more favourable conditions for increasing forest cover, as compared to other areas in the forest zone with non-significant soil moisture trends (Figure 7a). The forest zone is primarily characterized as an area with low vulnerability to climate change (Figure 9), and the proposed SLM interventions in this zone could be sufficient to maintain and even reinforce the resilience of the socio-ecological systems to undesirable change.
Both the annual and perennial zones are located in areas within the LVWC where the predominant land cover class is agriculture (Figure 2a). The SLM interventions identified in Table 4 for agricultural areas are all suitable measures that can be implemented in the annual and perennial zones. As a priority, these interventions should target those areas with browning trends, which account for 26% or approximately one million ha of agricultural land in the LVWC. As noted above for the SLM interventions proposed for forest areas, more ambitious targets are also needed within agricultural areas.
The annual zone of LVWC (i.e., areas with an altitude ranging from >1500 m and <2200 m), is characterized by areas with increasing soil moisture trends in a number of counties (Figure 7a), indicating favourable conditions for growing annual crops, pastures, and establishing agroforestry. Some examples of the main annual crops grown in the LVWC are maize, beans, sorghum, millet, rice, sweet potato, and various vegetables [48]. The main area with strong browning trends is in the western area of Narok county (Figure 2c). The annual zone is also characterized as an area with low to medium vulnerability to climate change (Figure 9), and the proposed SLM interventions could be sufficient to strengthen the resilience of agricultural and livelihood systems in this zone.
The lowland areas (i.e., elevation of <1500 m) are proposed for perennial crops primarily because there are several locations with strong browning trends (in Busia, Kakamega, Kisumu, and Migori counties) (Figure 2c), and because the lowlands contain areas with decreasing soil moisture trends (in the eastern part of Kisumu county) (Figure 7a). The planting of perennial crops with the incorporation of minimum and/or no tillage has the potential to reduce physical soil deterioration, resulting in an increase of the soil’s capacity to absorb and hold water due to the improvement of the soil structure (Table 4). Some examples of perennial crops grown in the LVWC are sugarcane, cassava, groundnuts, cotton, tea, bananas, and tobacco [48]. The perennial zone is also characterized as an area with medium to high vulnerability, with the latter occurring in areas north of Lake Victoria (Figure 9). Hence, to bolster the resilience of agricultural and livelihood systems in this zone, consideration should also be given to alternative livelihood systems that have minimal dependence (and pressure) on land resources [49] and to social protection programmes that guarantee minimum incomes or food access [50].
The bimodal rainfall pattern that is typical for the country (with long rains from March to May, and short rains from October to December [51]) is not exhibited in the LVWC, as illustrated in the monthly boxplots for the variables of soil moisture and VCI (Figure 7b and Figure 8b). Further, for the 14-year period from 2005 to 2018, most of the land area of the LVWC can be categorized as being in a wet state, but with increasing trends in the proportion of the area in the LVWC under extreme-severe and moderate-normal drought (Figure 8a). Thus, the water management measures identified in Table 4 will be instrumental in not only enhancing the resilience of an area that is the most vulnerable to flooding in Kenya [31] but also in providing water storage to address incidences of increasing water scarcity.
By computing the relative importance of variables grouped by SDGs (Figure 5 and Figure 6), we provided an alternative way for policy makers to understand the interconnectedness of social, environmental, and economic factors in addressing LDN. As compared to the national level, at the water catchment level, we demonstrated that the social dimensions of sustainable development account for a greater weight in influencing greening and browning trends. This result reinforces the message that achieving LDN will require integrated approaches through greater alignment and closer coordination across social, economic, and environmental development priorities (e.g., food, energy, water, climate change, health, education, etc.) [1].
4.2. Implications of LDN Implementation in the Climate-Smart Landscape
The operationalization of a climate-smart landscape for the implementation of measures to address LDN in the LVWC could contribute to building what is termed as “climate-resilient” pathways [52], which are iterative, continually evolving processes within complex systems that combine adaptation and mitigation to realize the goal of sustainable development. The concept of pathways is not new, and has been used to describe potential trajectories of future development that communities could take in response to local and global environmental, economic, political, and social changes [53]. In this regard, different studies [50,54] have conceptualized various approaches to address complex ecological challenges (e.g., climate change, land degradation, biodiversity loss) within landscapes. In general, these approaches can be broadly clustered around four key pillars, as described by [55] in their identification of the governance components of an integrated approach for ecosystem restoration: Political (laws, jurisdictions, and institutions); economic (financial resources); social (collaboration, coordination, and participation); and research (science, technology, and information).
In a study that examined whether the current land-use policy framework in Kenya has the potential to implement LDN objectives [29], the first two components of an integrated approach for ecosystem management (i.e., political and economic) were discussed extensively. The aforementioned study highlighted that the main shortcoming is the disjointed approach on the management and protection of soil and land resources, which is scattered across various policy areas. To address this shortcoming, the authors of [29] recommended a number of key policy and institutional improvements, including a national soil policy on the management and protection of soil and land resources, a systematic and coordinated data collection strategy on soils, mobilization of adequate and sustained financial resources, and streamlined responsibilities and governance structures across national, regional, and county levels. These recommendations are also of relevance to support the implementation of climate-smart LDN interventions at the water catchment level. We devote the remainder of the discussion to issues pertaining to coordination/collaboration and research.
Given the complex and changing nature of landscape processes, competent and effective institutions and representation that are able to engage with all the issues raised in dynamic landscapes are critically required [54]. Within landscapes, there are multiple stakeholders (represented by public, private, and civic entities) who operate at different levels (e.g., national, regional, and county), and who often have conflicting objectives and perspectives [56]. The implementation of a climate-smart landscape as proposed for the LVWC would require that first and foremost a shared vision for the landscape be agreed upon by the stakeholders, with a broad consensus on general goals, challenges, and concerns, as well as on options and opportunities [54].
The LVWC falls under the mandate of the Lake Basin Development Authority (LBDA), which is one of the six regional development authorities (RDAs) established by acts of parliament on the basis of river basins and large water bodies. The main mandate of the RDAs, which exist at a governance level between the national and county governments, is to plan and coordinate the implementation of development projects within river basins. Other government actors at the LVWC level would be the 18 county governments, and key national line ministries and their specialized agencies.
A number of formalized multi-stakeholder forums exist at the sub-national level that could facilitate the coordination of actors at the LVWC, e.g., the Basin Water Resource Committee (established under the Water Act [57], and responsible for the management of the water resources within a respective basin area), and the Forest Conservation Committee (established under the Forest Conservation and Management Act [58], and responsible for making recommendations to the relevant national and county government organizations in relation to the conservation and utilization of forests). Both these committees are to be represented by each county government whose area falls within the basin or forest conservation area, the responsible national government ministry, and non-governmental actors (farmers or pastoralists, business community, organizations involved in water resources, or forest management programmes). Significant investment will be required to sufficiently develop the institutional and technical capacities of all actors operating within the water catchment.
Watersheds, and more broadly landscapes, are complex and dynamic systems in which a diverse range of influences and constraints (water, soil, geology, flora, fauna, etc.) interact with human natural resource-use practices [20,54]. Scientific and experiential research is necessary to provide an understanding of the biophysical components and interactions within the landscape, the drivers of change at different scales, and on the interventions that encourage resilience within ecosystems [54]. This type of focused research for the LVWC could be undertaken by a number of government specialized agencies, including the Kenya Agricultural and Livestock Research Organization (KALRO) (which has a number of specialized institutes located within LVWC, e.g., the Sugar Research Institute in Kisumu; Food Crops Research Centre in Kisii; Non-Ruminant Research Institute in Kakamega; and Food Crops Research Centre in Busia), the Kenya Forest Service, and the Kenya Wildlife Services.
To guide the implementation of climate-smart interventions across the three climate-smart zones proposed in this study, it is paramount that field-level assessments be undertaken. In particular, although NDVI can serve as a proxy for land degradation, it does not provide information on the kind of degradation or regeneration processes [59]. In this regard, field studies in selected sites with browning trends will provide information on the types of land degradation occurring in the LVWC (e.g., water erosion, wind erosion, plough and mechanical erosion, chemical degradation, and biological degradation that are all induced or aggravated by human activities [60]). Further, combining the results of the current study that used spatially explicit information on key climate change and land degradation variables with participatory approaches involving key governmental and non-governmental stakeholders [61,62] would enable the articulation of a guiding vision for the landscape and thus identify and prioritize entry points for stakeholders to begin to work together [54], as well as help to clarify the facilitation processes that best foster effectiveness, efficiency, and equity in decision-making by actors within the catchment area [63].
5. Conclusions
The operationalization of LDN at the landscape scale can be initiated in water catchment areas using climate change as a specific policy entry point. For the LVWC in Kenya, we documented how operational synergy between land degradation and climate change can be pursued through the implementation of targeted land-based climate change adaptation and mitigation interventions articulated in the NCCAP [46] that broadly address soil fertility management, minimum soil disturbance, water management, agroforestry, and planted forests. Further, we proposed a climate-smart landscape that delineated the LVWC area into three zones that are dedicated to forest protection and restoration, annual crops or livestock, and perennial crops.
To support the implementation LDN interventions at the landscape scale, Kenya has the unique advantage in that dedicated institutions (i.e., the regional development authorities) and multi-stakeholder forums (e.g., forest and water basin committees) exist at the sub-national level. However, significant investment will be required to create competent and effective institutions and representation, as well as to support scientific and experiential research to foster broad-scale adoption of climate-smart approaches at the landscape scale. Complementing the results of the current study that focused on providing spatially explicit information on key climate change and land degradation variables with participatory approaches involving key governmental and non-governmental stakeholders may provide a mechanism for building consensus on oft-competing objectives, as well as for identifying starting points for stakeholders to begin to work together at the landscape scale.
Substantial action is needed in the next decade to achieve the LDN target, and more broadly, the SDGs. The landscape approach is an emerging and expanding practice that holds promise for allocating and managing land to achieve multiple objectives, such as food security, poverty alleviation, climate change mitigation, biodiversity conservation, and other goals. We recommend that Kenya, in identifying how the country will achieve the LDN target by 2030, include programmes that can test how water catchment areas can provide an operating space where synergies between land degradation, climate change, and other development objectives can concurrently be exploited to improve livelihoods and the productivity of ecosystems.
Author Contributions
Conceptualization, H.G. and S.G.; Methodology, H.G. and S.G.; Formal Analysis, H.G.; Writing—Original Draft Preparation, H.G.; Writing—Review and Editing, H.G. and S.G.; Visualization, H.G. and S.G.; Supervision, S.G.
Funding
This research received no external funding.
Conflicts of Interest
The authors declare no conflict of interest.
Appendix A
Figure A1.
County boundaries within the LVWC.

References
- Intergovernmental Science-Policy Platform on Biodiversity and Ecosystem Services (IPBES). Summary for Policymakers of the Assessment Report on Land Degradation and Restoration of the Intergovernmental Science-Policy Platform on Biodiversity and Ecosystem Services; Scholes, R., Montanarella, L., Brainich, A., Barger, N., Ten Brink, B., Cantele, M., Erasmus, B., Fisher, J., Gardner, T., Holland, T.G., Eds.; IPBES Secretariat: Bonn, Germany, 2018. [Google Scholar]
- Intergovernmental Panel on Climate Change (IPCC). Climate Change 2014: Synthesis Report. Contribution of Working Groups I, II and III to the Fifth Assessment Report of the Intergovernmental Panel on Climate Change; Pachauri, R.K., Meyer, L.A., Eds.; IPCC: Geneva, Switzerland, 2014. [Google Scholar]
- Smith, P. Soils and climate change. Curr. Opin. Environ. Sustainability 2012, 4, 539–544. [Google Scholar] [CrossRef]
- Sivakumar, M.V.K.; Stefanski, R. Climate and land degradation—An overview. In Climate and Land Degradation; Sivakumar, M.V.K., Ndiang’ui, N., Eds.; Environmental Science and Engineering (Environmental Science); Springer: Berlin/Heidelberg, Germany, 2007; pp. 105–135. [Google Scholar]
- Millennium Ecosystem Assessment (MEA). Ecosystems and Human Wellbeing: Desertification Synthesis; World Resources Institute: Washington, DC, USA, 2005. [Google Scholar]
- United Nations (UN). Revised list of global Sustainable Development Goal indicators. Report of the inter-agency and expert group on Sustainable Development Goal indicators (E/CN.3/2017/2), Annex III. 2017. Available online: https://unstats.un.org/sdgs/indicators/Official%20Revised%20List%20of%20global%20SDG%20indicators.pdf (accessed on 12 January 2019).
- United Nations Convention to Combat Desertification (UNCCD). Climate change and land degradation: Bridging Knowledge and Stakeholders. In Proceedings of the UNCCD 3rd Scientific Conference, Cancun, Mexico, 9–12 March 2015; Available online: http://www.unccd.int/Lists/SiteDocumentLibrary/Publications/2015_Climate_LD_Outcomes_CST_Conf_ENG.pdf (accessed on 12 January 2019).
- Cowie, A.L.; Orr, B.J.; Sanchez, V.M.C.; Chasek, P.; Crossman, N.D.; Erlewein, A.; Louwagie, G.; Maron, M.; Metternicht, G.I.; Minelli, S.; et al. Land in balance: The scientific conceptual framework for land degradation neutrality. Environ. Sci. Policy 2018, 79, 25–35. [Google Scholar] [CrossRef]
- Liniger, H.P.; Studer, R.M.; Hauert, C.; Gurtner, M.; Sustainable land management in practice: Guidelines and best practices for Sub-Saharan Africa. TerrAfrica, World Overview of Conservation Approaches and Technologies (WOCAT) and Food and Agriculture Organization of the United Nations (FAO). 2011. Available online: http://www.fao.org/docrep/014/i1861e/i1861e.pdf (accessed on 1 November 2018).
- Niang, I.; Ruppel, O.C.; Abdrabo, M.A.; Essel, A.; Lennard, C.; Padgham, J.; Urquhart, P. Africa. In Climate Change 2014: Impacts, Adaptation, and Vulnerability. Part. B: Regional Aspects; Contribution of Working Group II to the Fifth Assessment Report of the Intergovernmental Panel on Climate Change; Cambridge University Press: Cambridge, UK; New York, NY, USA, 2014; pp. 1199–1265. [Google Scholar]
- Delgado, J.A.; Groffman, P.M.; Nearing, M.A.; Goddard, T.; Reicosky, D.; Lal, R.; Kitchen, N.R.; Rice, C.W.; Towery, D.; Salon, P. Conservation practices to mitigate and adapt to climate change. J. Soil Water Conserv. 2011, 66, 118A–129A. [Google Scholar] [CrossRef] [Green Version]
- Branca, G.; Lipper, L.; McCarthy, N.; Jolejole, M.C. Food security, climate change, and sustainable land management. A review. Agron. Sustain. Dev. 2013, 33, 635–650. [Google Scholar] [CrossRef] [Green Version]
- Harvey, C.A.; Chacón, M.; Donatti, C.I.; Garen, E.; Hannah, L.; Andrade, A.; Bede, L.; Brown, D.; Calle, A.; Chará, J.; et al. Climate-smart landscapes: Opportunities and challenges for integrating adaptation and mitigation in tropical agriculture. Conserv. Lett. 2014, 7, 77–90. [Google Scholar] [CrossRef]
- Locatelli, B.; Pavageau, C.; Pramova, E.; Gregorio, M.D. Integrating climate change mitigation and adaptation in agriculture and forestry: Opportunities and trade-offs. WIREs Clim. Chang. 2015, 6, 585–598. [Google Scholar] [CrossRef]
- Rosenstock, T.S.; Lamanna, C.; Chesterman, S.; Bell, P.; Arslan, A.; Richards, M.; Rioux, J.; Akinleye, A.O.; Champalle, C.; Cheng, Z.; et al. The Scientific Basis of Climate-Smart Agriculture: A Systematic Review Protocol; CCAFS Working Paper no. 138; CGIAR Research Program on Climate Change, Agriculture and Food Security (CCAFS): Copenhagen, Denmark, 2016; Available online: www.ccafs.cgiar.org (accessed on 12 January 2019).
- Nabuurs, G.-J.; Delacote, P.; Ellison, D.; Hanewinkel, M.; Hetemäki, L.; Lindner, M. By 2050 the mitigation effects of EU forests could nearly double through climate smart forestry. Forests 2017, 8, 484. [Google Scholar] [CrossRef] [Green Version]
- Paustian, K.; Lehmann, J.; Ogle, S.; Reay, D.; Robertson, P.; Smith, P. Climate-smart soils. Nature 2016, 532, 49–57. [Google Scholar] [CrossRef] [Green Version]
- UNCCD. The LDN Target. Setting Programme; UNCCD: Bonn, Germany, 2019; Available online: https://www.unccd.int/actions/ldn-target-setting-programme (accessed on 12 January 2019).
- UNCCD. Methodological Note to Set National Voluntary Land Degradation Neutrality (LDN) Targets Using the UNCCD Indicator Framework; UNCCD: Bonn, Germany, 2017; Available online: https://knowledge.unccd.int/sites/default/files/2018-08/LDN%20Methodological%20Note_02-06-2017%20ENG.pdf (accessed on 12 January 2019).
- Darghouth, S.; Ward, C.; Gambarelli, G.; Styger, E.; Roux, J. Watershed Management Approaches, Policies, and Operations: Lessons for Scaling up; Water sector board discussion paper series; Paper No. 11; The World Bank: Washington, DC, USA, 2008; Available online: http://documents.worldbank.org/curated/en/142971468779070723/Watershed-management-approaches-policies-and-operations-lessons-for-scaling-up (accessed on 12 January 2019).
- Wang, G.; Mang, S.; Cai, H.; Liu, S.; Zhang, Z.; Wang, L.; Innes, J.L. Integrated watershed management: Evolution, development and emerging trends. J. For. Res. 2016, 27, 967–994. [Google Scholar] [CrossRef] [Green Version]
- Minang, P.A.; van Noordwijk, M.; Freeman, O.E.; Duguma, L.A.; Mbow, C.; de Leeuw, J.; Catacutan, D. Introduction and basic propositions. In Climate-Smart Landscapes: Multifunctionality in Practice; Minang, P.A., van Noordwijk, M., Freeman, O.E., Mbow, C., de Leeuw, J., Catacutan, D., Eds.; World Agroforestry Centre (ICRAF): Nairobi, Kenya, 2015; pp. 1–17. [Google Scholar]
- van Noordwijk, M.; Leimona, B.; Xing, M.; Tanika, L.; Namirembe, S.; Suprayogo, D. Water-focused landscape management. In Climate-Smart Landscapes: Multifunctionality in Practice; Minang, P.A., van Noordwijk, M., Freeman, O.E., Mbow, C., de Leeuw, J., Catacutan, D., Eds.; World Agroforestry Centre (ICRAF): Nairobi, Kenya, 2015; pp. 179–193. [Google Scholar]
- Gichenje, H.; Godinho, S. Establishing a land degradation neutrality national baseline through trend analysis of GIMMS NDVI time-series. Land Degrad. Dev. 2018, 29, 2985–2997. [Google Scholar] [CrossRef]
- Nijbroek, R.; Piikki, K.; Söderström, M.; Kempen, B.; Turner, K.G.; Hengari, S.; Mutua, J. Soil organic carbon baselines for land degradation neutrality: Map accuracy and cost tradeoffs with respect to complexity in Otjozondjupa, Namibia. Sustainability 2018, 10, 1610. [Google Scholar] [CrossRef] [Green Version]
- Solomun, M.K.; Barger, N.; Cerda, A.; Keesstra, S.; Marković, M. Assessing land condition as a first step to achieving land degradation neutrality: A case study of the Republic of Srpska. Environ. Sci. Policy 2018, 90, 19–27. [Google Scholar] [CrossRef]
- Al Sayah, M.J.; Abdallah, C.; Khouri, M.; Nedjai, R.; Darwich, T. Application of the LDN concept for quantification of the impact of land use and land cover changes on Mediterranean watersheds, Al Awali basin, Lebanon as a case study. Catena 2019, 176, 264–278. [Google Scholar] [CrossRef]
- Gichenje, H.; Pinto-Correia, T.; Godinho, S. An analysis of the drivers that affect greening and browning trends in the context of pursuing land degradation-neutrality. Remote Sens. Appl. Soc. Environ. 2019, 15, 100251. [Google Scholar] [CrossRef]
- Gichenje, H.; Muñoz-Rojas, J.; Pinto-Correia, T. Opportunities and limitations for achieving land degradation-neutrality through the current land-use policy framework in Kenya. Land 2019, 8, 115. [Google Scholar] [CrossRef] [Green Version]
- Government of Kenya (GoK). Second National Communication to the United Nations Framework Convention on Climate Change. 2015. Available online: http://unfccc.int/resource/docs/natc/kennc2.pdf (accessed on 5 March 2019).
- GoK. National Water Master Plan 2030, Volume I—Executive Summary. 2013. Available online: https://wasreb.go.ke/downloads/National%20Water%20Master%20Plan%202030%20Exec.%20Summary%20Vol.%201%20Main%201.pdf (accessed on 5 March 2019).
- GoK. Statistical Abstract 2018. 2018. Available online: https://www.knbs.or.ke/download/statistics-abstract-2018/ (accessed on 5 March 2019).
- ICPAC (Intergovernmental Authority on Development (IGAD) Climate Prediction and Applications Centre). Kenya: Riverbasins. 2019. Available online: http://geoportal.icpac.net/layers/geonode%3Aken_riverbasins (accessed on 5 March 2019).
- Seneviratne, S.I.; Corti, T.; Davin, E.L.; Hirschi, M.; Jaeger, E.B.; Lehner, I.; Orlowsky, B.; Teuling, A.J. Investigating soil moisture–climate interactions in a changing climate: A review. Earth-Sci. Rev. 2010, 99, 125–161. [Google Scholar] [CrossRef]
- Koster, R.D.; Dirmeyer, P.A.; Guo, Z.; Bonan, G.; Chan, E.; Cox, P.; Gordon, C.T.; Kanae, S.; Kowalczyk, E.; Lawrence, D.; et al. Regions of strong coupling between soil moisture and precipitation. Science 2004, 305, 1138–1140. [Google Scholar] [CrossRef] [Green Version]
- Klisch, A.; Atzberger, C. Operational drought monitoring in Kenya using MODIS NDVI time series. Remote Sens. 2016, 8, 267. [Google Scholar] [CrossRef] [Green Version]
- Kogan, F.; Guo, W. 2006–2015 mega-drought in the western USA and its monitoring from space data. Geomat. Nat. Hazards Risk 2015, 6, 651–668. [Google Scholar] [CrossRef] [Green Version]
- National Oceanic and Atmospheric Administration (NOAA). NOAA Center for Satellite Applications and Research: Global Vegetation Health Products. 2019. Available online: https://www.star.nesdis.noaa.gov/smcd/emb/vci/VH/vh_ftp.php (accessed on 5 March 2019).
- IPCC. Climate Change 2007: Impacts, Adaptation and Vulnerability; Contribution of Working Group II to the Fourth Assessment Report of the Intergovernmental Panel on Climate, Change; Parry, M.L., Canziani, O.F., Palutikof, J.P., van der Linden, P.J., Hanson, C.E., Eds.; Cambridge University Press: Cambridge, UK, 2007. [Google Scholar]
- Food and Agriculture Organization of the United Nations (FAO). FAO GeoNetwork Site. 2019. Available online: http://www.fao.org/geonetwork/srv/en/main.home (accessed on 5 March 2019).
- Chen, C.; Liaw, A.; Breiman, L. Using random forest to learn imbalanced data. University of California at Berkeley, Statistics Department. 2004. Available online: https://statistics.berkeley.edu/sites/default/files/tech-reports/666.pdf (accessed on 12 January 2019).
- Chawla, N.V.; Bowyer, K.W.; Hall, L.O.; Kegelmeyer, W.P. SMOTE: Synthetic minority over-sampling technique. J. Artif. Intell. Res. 2002, 16, 321–357. [Google Scholar] [CrossRef]
- Torgo, L. Data Mining with R, Learning with Case Studies, R package version 0.4.1; Chapman & Hall/CRC: Boca Raton, FL, USA, 2010. [Google Scholar]
- Forkel, M.; Migliavacca, M.; Thonicke, K.; Reichstein, M.; Schaphoff, S.; Weber, U.; Carvalhais, N. Co-dominant water control on global inter-annual variability and trends in land surface phenology and greenness. Glob. Chang. Biol. 2015, 21, 3414–3435. [Google Scholar] [CrossRef] [PubMed]
- Forkel, M.; Carvalhais, N.; Verbesselt, J.; Mahecha, M.D.; Neigh, C.; Reichstein, M. Trend change detection in NDVI time series: Effects of inter-annual variability and methodology. Remote Sens. 2013, 5, 2113–2144. [Google Scholar] [CrossRef] [Green Version]
- GoK. National Climate Change Action Plan. 2018. Available online: http://www.kcckp.go.ke/download/NCCAP-2018-2022_draft-3.1_10June2018_2.pdf (accessed on 12 January 2019).
- Torquebiau, E. Whither landscapes? Compiling requirements of the landscape approach. In Climate-Smart Landscapes: Multifunctionality in Practice; Minang, P.A., van Noordwijk, M., Freeman, O.E., Mbow, C., de Leeuw, J., Catacutan, D., Eds.; World Agroforestry Centre (ICRAF): Nairobi, Kenya, 2015; pp. 21–35. [Google Scholar]
- GoK. Kenya National Bureau of Statistics: County Statistical Abstracts. 2019. Available online: https://www.knbs.or.ke/publications/ (accessed on 5 March 2019).
- Méndez, R.P. Alternative livelihood systems in the drylands: The need for a new paradigm. GeoJournal 1993, 31, 67–75. [Google Scholar] [CrossRef]
- Lipper, L.; Thornton, P.; Campbell, B.M.; Baedeker, T.; Braimoh, A.; Bwalya, M.; Caron, P.; Cattaneo, A.; Garrity, D.; Henry, K.; et al. Climate-smart agriculture for food security. Nat. Clim. Chang. 2014, 4, 1068–1072. [Google Scholar] [CrossRef]
- Gichangi, E.M.; Gatheru, M.; Njiru, E.N.; Mungube, E.O.; Wambua, J.M.; Wamuongo, J.W. Assessment of climate variability and change in semi-arid eastern Kenya. Clim. Chang. 2015, 130, 287–297. [Google Scholar] [CrossRef]
- Denton, F.; Wilbanks, T.J.; Abeysinghe, A.C.; Burton, I.; Gao, Q.; Lemos, M.C.; Warner, K. Climate-resilient pathways: Adaptation, mitigation, and sustainable development. In Climate Change 2014: Impacts, Adaptation, and Vulnerability. Part A: Global and Sectoral Aspects; Contribution of Working Group II to the Fifth Assessment Report of the Intergovernmental Panel on Climate Change; Field, C.B., Barros, V.R., Dokken, D.J., Mach, K.J., Mastrandrea, M.D., Bilir, T.E., Chatterjee, M., Ebi, K.L., Estrada, Y.O., Genova, R.C., et al., Eds.; Cambridge University Press: Cambridge, UK; New York, NY, USA, 2014; pp. 1101–1131. [Google Scholar]
- Eisenhauer, D.C. Pathways to climate change adaptation: Making climate change action political. Geogr. Compass 2016, 10, 207–221. [Google Scholar] [CrossRef]
- Sayer, J.; Sunderland, T.; Ghazoul, J.; Pfund, J.-L.; Sheil, D.; Meijaard, E.; Venter, M.; Boedhihartono, A.K.; Day, M.; Garcia, C.; et al. Ten principles for a landscape approach to reconciling agriculture, conservation, and other competing land uses. PNAS 2013, 110, 8349–8356. [Google Scholar] [CrossRef] [Green Version]
- Sapkota, R.P.; Stahl, P.D.; Rijal, K. Restoration governance: An integrated approach towards sustainably restoring degraded ecosystems. Environ. Dev. 2018, 27, 83–94. [Google Scholar] [CrossRef]
- Minang, P.A.; Duguma, L.A.; van Noordwijk, M.; Prabhu, R.; Freeman, O.E. Enhancing multifunctionality through system improvement and landscape democracy processes: A synthesis. In Climate-Smart Landscapes: Multifunctionality in Practice; Minang, P.A., van Noordwijk, M., Freeman, O.E., Mbow, C., de Leeuw, J., Catacutan, D., Eds.; World Agroforestry Centre (ICRAF): Nairobi, Kenya, 2015; pp. 389–405. [Google Scholar]
- GoK. Water Act. 2016. Available online: http://kenyalaw.org/lex//actview.xql?actid=No.%2043%20of%202016 (accessed on 12 January 2019).
- GoK. Forest Conservation and Management Act. 2016. Available online: http://kenyalaw.org/lex//actview.xql?actid=No.%2034%20of%202016 (accessed on 12 January 2019).
- Bai, Z.G.; Dent, D.L.; Olsson, L.; Schaepman, M.E. Proxy global assessment of land degradation. Soil Use Manag. 2008, 24, 223–234. [Google Scholar] [CrossRef]
- Brabant, P. A Land Degradation Assessment and Mapping Method: A Standard Guideline Proposal; Les dossiers thématiques du CSFD. N°8; CSFD/Agropolis International: Montpellier, France, 2010. [Google Scholar]
- Willemen, L.; Crossman, N.D.; Quatrini, S.; Egoh, B.; Kalaba, F.K.; Mbilinyi, B.; de Groot, R. Identifying ecosystem service hotspots for targeting land degradation neutrality investments in south-eastern Africa. J. Arid Environ. 2018, 159, 75–86. [Google Scholar] [CrossRef]
- Stringer, L.C.; Reed, M.S. Land degradation assessment in Southern Africa: Integrating local and scientific knowledge bases. Land Degrad. Dev. 2007, 18, 99–116. [Google Scholar] [CrossRef]
- Minang, P.A.; Duguma, L.A.; Alemagi, D.; van Noordwijk, M. Scale considerations in landscape approaches. In Climate-Smart Landscapes: Multifunctionality in Practice; Minang, P.A., van Noordwijk, M., Freeman, O.E., Mbow, C., de Leeuw, J., Catacutan, D., Eds.; World Agroforestry Centre (ICRAF): Nairobi, Kenya, 2015; pp. 121–133. [Google Scholar]
Figure 1.
Study area (with elevation and rivers illustrated for the LVWC).

Figure 2.
The Land Degradation Neutrality (LDN) baseline for the Lake Victoria Water Catchment (LVWC): (a) land cover map for 2015; (b) annual change in area (km2) for each land cover class from 1992 to 2015; and (c) distribution of human-induced greening and browning trends.
Figure 2.
The Land Degradation Neutrality (LDN) baseline for the Lake Victoria Water Catchment (LVWC): (a) land cover map for 2015; (b) annual change in area (km2) for each land cover class from 1992 to 2015; and (c) distribution of human-induced greening and browning trends.

Figure 3.
Comparison of the variable importance (VI) plots for agriculture areas: (a) VI plot for the LVWC; and (b) VI plot at the national level (note: the national plot is obtained from [28]; and the average Mean Decrease in Accuracy (MDA) is represented by the vertical red-dashed line).
Figure 3.
Comparison of the variable importance (VI) plots for agriculture areas: (a) VI plot for the LVWC; and (b) VI plot at the national level (note: the national plot is obtained from [28]; and the average Mean Decrease in Accuracy (MDA) is represented by the vertical red-dashed line).

Figure 4.
Comparison of the variable importance (VI) plots for forest areas: (a) VI plot for the LVWC; and (b) VI plot at the national level (note: the national plot is obtained from [28]; and the average MDA is represented by the vertical red-dashed line).
Figure 4.
Comparison of the variable importance (VI) plots for forest areas: (a) VI plot for the LVWC; and (b) VI plot at the national level (note: the national plot is obtained from [28]; and the average MDA is represented by the vertical red-dashed line).

Figure 5.
Comparison of the relative importance by SDGs for agriculture areas: (a) relative importance for the LVWC; and (b) relative importance at the national level (note: the national plot is obtained from [28]).
Figure 5.
Comparison of the relative importance by SDGs for agriculture areas: (a) relative importance for the LVWC; and (b) relative importance at the national level (note: the national plot is obtained from [28]).

Figure 6.
Comparison of the relative importance by SDGs for forest areas: (a) relative importance for the LVWC; and (b) relative importance at the national level (note: the national plot is obtained from [28]).
Figure 6.
Comparison of the relative importance by SDGs for forest areas: (a) relative importance for the LVWC; and (b) relative importance at the national level (note: the national plot is obtained from [28]).

Figure 7.
Soil moisture: (a) spatial distribution of trends (white patches denote no data); and (b) monthly variability.
Figure 7.
Soil moisture: (a) spatial distribution of trends (white patches denote no data); and (b) monthly variability.

Figure 8.
Vegetation Condition Index (VCI):(a) percent of the LVWC under extreme-severe and moderate-normal vegetation stress (trend line for the two areas represented as the dashed line); and (b) monthly variability.
Figure 8.
Vegetation Condition Index (VCI):(a) percent of the LVWC under extreme-severe and moderate-normal vegetation stress (trend line for the two areas represented as the dashed line); and (b) monthly variability.

Figure 9.
Vulnerability index.

Figure 10.
A climate-smart landscape for the LVWC.


Table 1.
Share of greening and browning trends within the different datasets.
| NDVI Trend. | Agriculture | Forest |
|---|---|---|
| (300 m Resolution) | ||
| Greening | 7.8% | 9.3% |
| Browning | 92.2% | 90.7% |
| Total observations | 103,062 | 17,284 |
Table 2.
Status of the three LDN indicators in the baseline year (2015).
| Land Cover Classes | Land Cover (Area) | MODIS NPP | Soil Organic Carbon 1 (0–30 cm) | |
|---|---|---|---|---|
| km2 | % | g C/m2 | ton/ha | |
| Agriculture | 36,928 | 74.9 | 996 | 90 |
| Forest | 6553 | 13.3 | 1170 | 118 |
| Grassland | 226 | 0.5 | 754 | 62 |
| Shrubland | 1955 | 4.0 | 816 | 72 |
| Wetland | 179 | 0.4 | 1146 | 121 |
| Settlement | 68 | 0.1 | 806 | 94 |
| Water | 3382 | 6.9 | - | - |
1 The SOC is for the year 2000. In the absence of a national SOC database, the UNCCD recommends that SoilGrids250m can be used to compute the SOC stocks as representative data for the year 2000 [19].
Table 3.
Mean performance metrics from 100 random forest iterations for the two datasets.
| Metric | Agriculture | Forest |
|---|---|---|
| Accuracy | 0.9925 | 0.9968 |
| Kappa | 0.9501 | 0.9813 |
Table 4.
Sustainable Land Management (SLM) interventions and their potential to address the three climate-smart objectives.
Table 4.
Sustainable Land Management (SLM) interventions and their potential to address the three climate-smart objectives.
| SLM Intervention 1 | Land Degradation Addressed 2 | Potential to Address Climate Smart Objectives 2 | ||
|---|---|---|---|---|
| Productivity | Adaptation (A) and Mitigation (M) | |||
| Forest | ||||
| Plant one million trees per county per year | Planted forests can rehabilitate degraded land (e.g., eroded or overgrazed areas), particularly if replanted and/or left to coppice after the mature trees are harvested. | In some areas of the central highlands of Kenya, the average gross margin from trees per farm per year was US$ 734, which includes the contribution of: coffee and tea (65%); fruits (28%); and timber and firewood contribute (7%). For 70% to 80% of the households the trees grown on farms function also as major sources of fuelwood. | A: Planted forests can positively influence the microclimate, which can enhance the resilience to climate variability. M: Planted forests are carbon sinks, especially on marginal agricultural land and degraded soils. | Planted forests |
| Deforestation and forest degradation reduced through enhanced protection of additional 8000 ha of natural forests | ||||
| Area under private sector-based commercial and industrial plantations increased by at least 4000 ha | ||||
| Agriculture | ||||
| Farm area under conservation agriculture increased to 8000 ha, incorporating minimum/no tillage | Reduced physical soil deterioration increase the soil’s capacity to absorb and hold water due to the improvement of the soil structure. | Positive effects on crop yields are widely reported and the average for sub-Saharan Africa is 134% [12]. | A: Increases tolerance to changes in temperature and rainfall including incidences of drought and flooding. M: Increases soil organic matter (SOM) (less exposure to oxygen and thus less SOM mineralization) | Minimum soil disturbance |
| Area under integrated soil nutrient management increased by 8000 ha | Nutrient-rich sludge from biogas plant can be used as fertilizer for plants. Reduced chemical soil degradation due to increased SOM and biomass, which increases the water-holding capacity of soils. | Organic fertilization (compost, animal, and green manure) is widely found to have positive effects on the yields. For example, maize yields increased by 100% (from 2 to 4 t/ha) in Kenya in 2005 [12]. | A: Soils with better water-holding capacity can support more drought-tolerant cropping systems. M: Increases SOM. | Soil fertility management |
| Manure management improved through the adoption of biogas technology by 28,240 households and at least 70 abattoirs | ||||
| Total area under agroforestry (AF) at farm level increased by 6500 ha | Agroforestry (AF) can help stop and reverse land degradation by providing a favourable micro-climate, providing permanent cover, improving organic carbon content, improving soil structure, increasing infiltration, and enhancing the fertility and biological activity of soils. | In Kitui district, Kenya, over an 11-year rotation growing Melia volkensii trees in croplands, the accumulated income from tree products exceeded the accumulated value of crop yield lost by 42% during average years, and by 180% with the assumption of 50% crop failure due to drought. | A: AF systems are characterized by creating their own microclimates, and buffering extremes (excessive storms, or dry and hot periods). M: AF can sequester significant amounts of carbon from the atmosphere; integrated with bioenergy production it can also reduce GHG emissions [11]. | Agroforestry |
| Number of institutions and households harvesting water for agricultural production increased to 176,500 | Proper water management can reduce erosion by water, which leads to a loss of fertile topsoil. Sediment may be captured from the water catchment area and conserved within the cropped area. | More water available to crops is crucially important for increased agricultural production; e.g. water conservation techniques resulted in a 50 % increase in productivity in Kenya in 2001 [12]. | A: The storage of excess rainfall and the efficient use of irrigation reduces risks of production failure due to water shortage associated with rainfall variability and helps cope with more extreme events; enhances aquifer recharge; irrigation can increase incomes of the farmers by producing more, and higher-value crops. M: Irrigation can improve the soil organic carbon sequestration potential by increasing the available water in the root zone. M: Protecting watershed can benefit hydropower and clean energy production [14]. | Water management |
| Livelihood systems improved on 4800 ha of degraded land through construction of water pans/ponds | ||||
| Acreage under irrigation increased by 22,720 ha | ||||
| Cross cutting | ||||
| Increase annual per capita water availability by construction of two multipurpose dams | ||||
| Conserve and rehabilitate water catchment areas feeding the hydro-power dams | ||||
| Increase the annual number of climate-proofed water harvesting, flood control and water storage infrastructure by 460 | ||||
© 2019 by the authors. Licensee MDPI, Basel, Switzerland. This article is an open access article distributed under the terms and conditions of the Creative Commons Attribution (CC BY) license (http://creativecommons.org/licenses/by/4.0/).
Share and Cite
MDPI and ACS Style
Gichenje, H.; Godinho, S. A Climate-Smart Approach to the Implementation of Land Degradation Neutrality within a Water Catchment Area in Kenya. Climate 2019, 7, 136. https://0-doi-org.brum.beds.ac.uk/10.3390/cli7120136
AMA Style
Gichenje H, Godinho S. A Climate-Smart Approach to the Implementation of Land Degradation Neutrality within a Water Catchment Area in Kenya. Climate. 2019; 7(12):136. https://0-doi-org.brum.beds.ac.uk/10.3390/cli7120136
Chicago/Turabian StyleGichenje, Helene, and Sérgio Godinho. 2019. "A Climate-Smart Approach to the Implementation of Land Degradation Neutrality within a Water Catchment Area in Kenya" Climate 7, no. 12: 136. https://0-doi-org.brum.beds.ac.uk/10.3390/cli7120136
Note that from the first issue of 2016, this journal uses article numbers instead of page numbers. See further details here.