West African Summer Monsoon Precipitation Variability as Represented by Reanalysis Datasets

 , , and
Abstract
:1. Introduction
2. Data and Methods
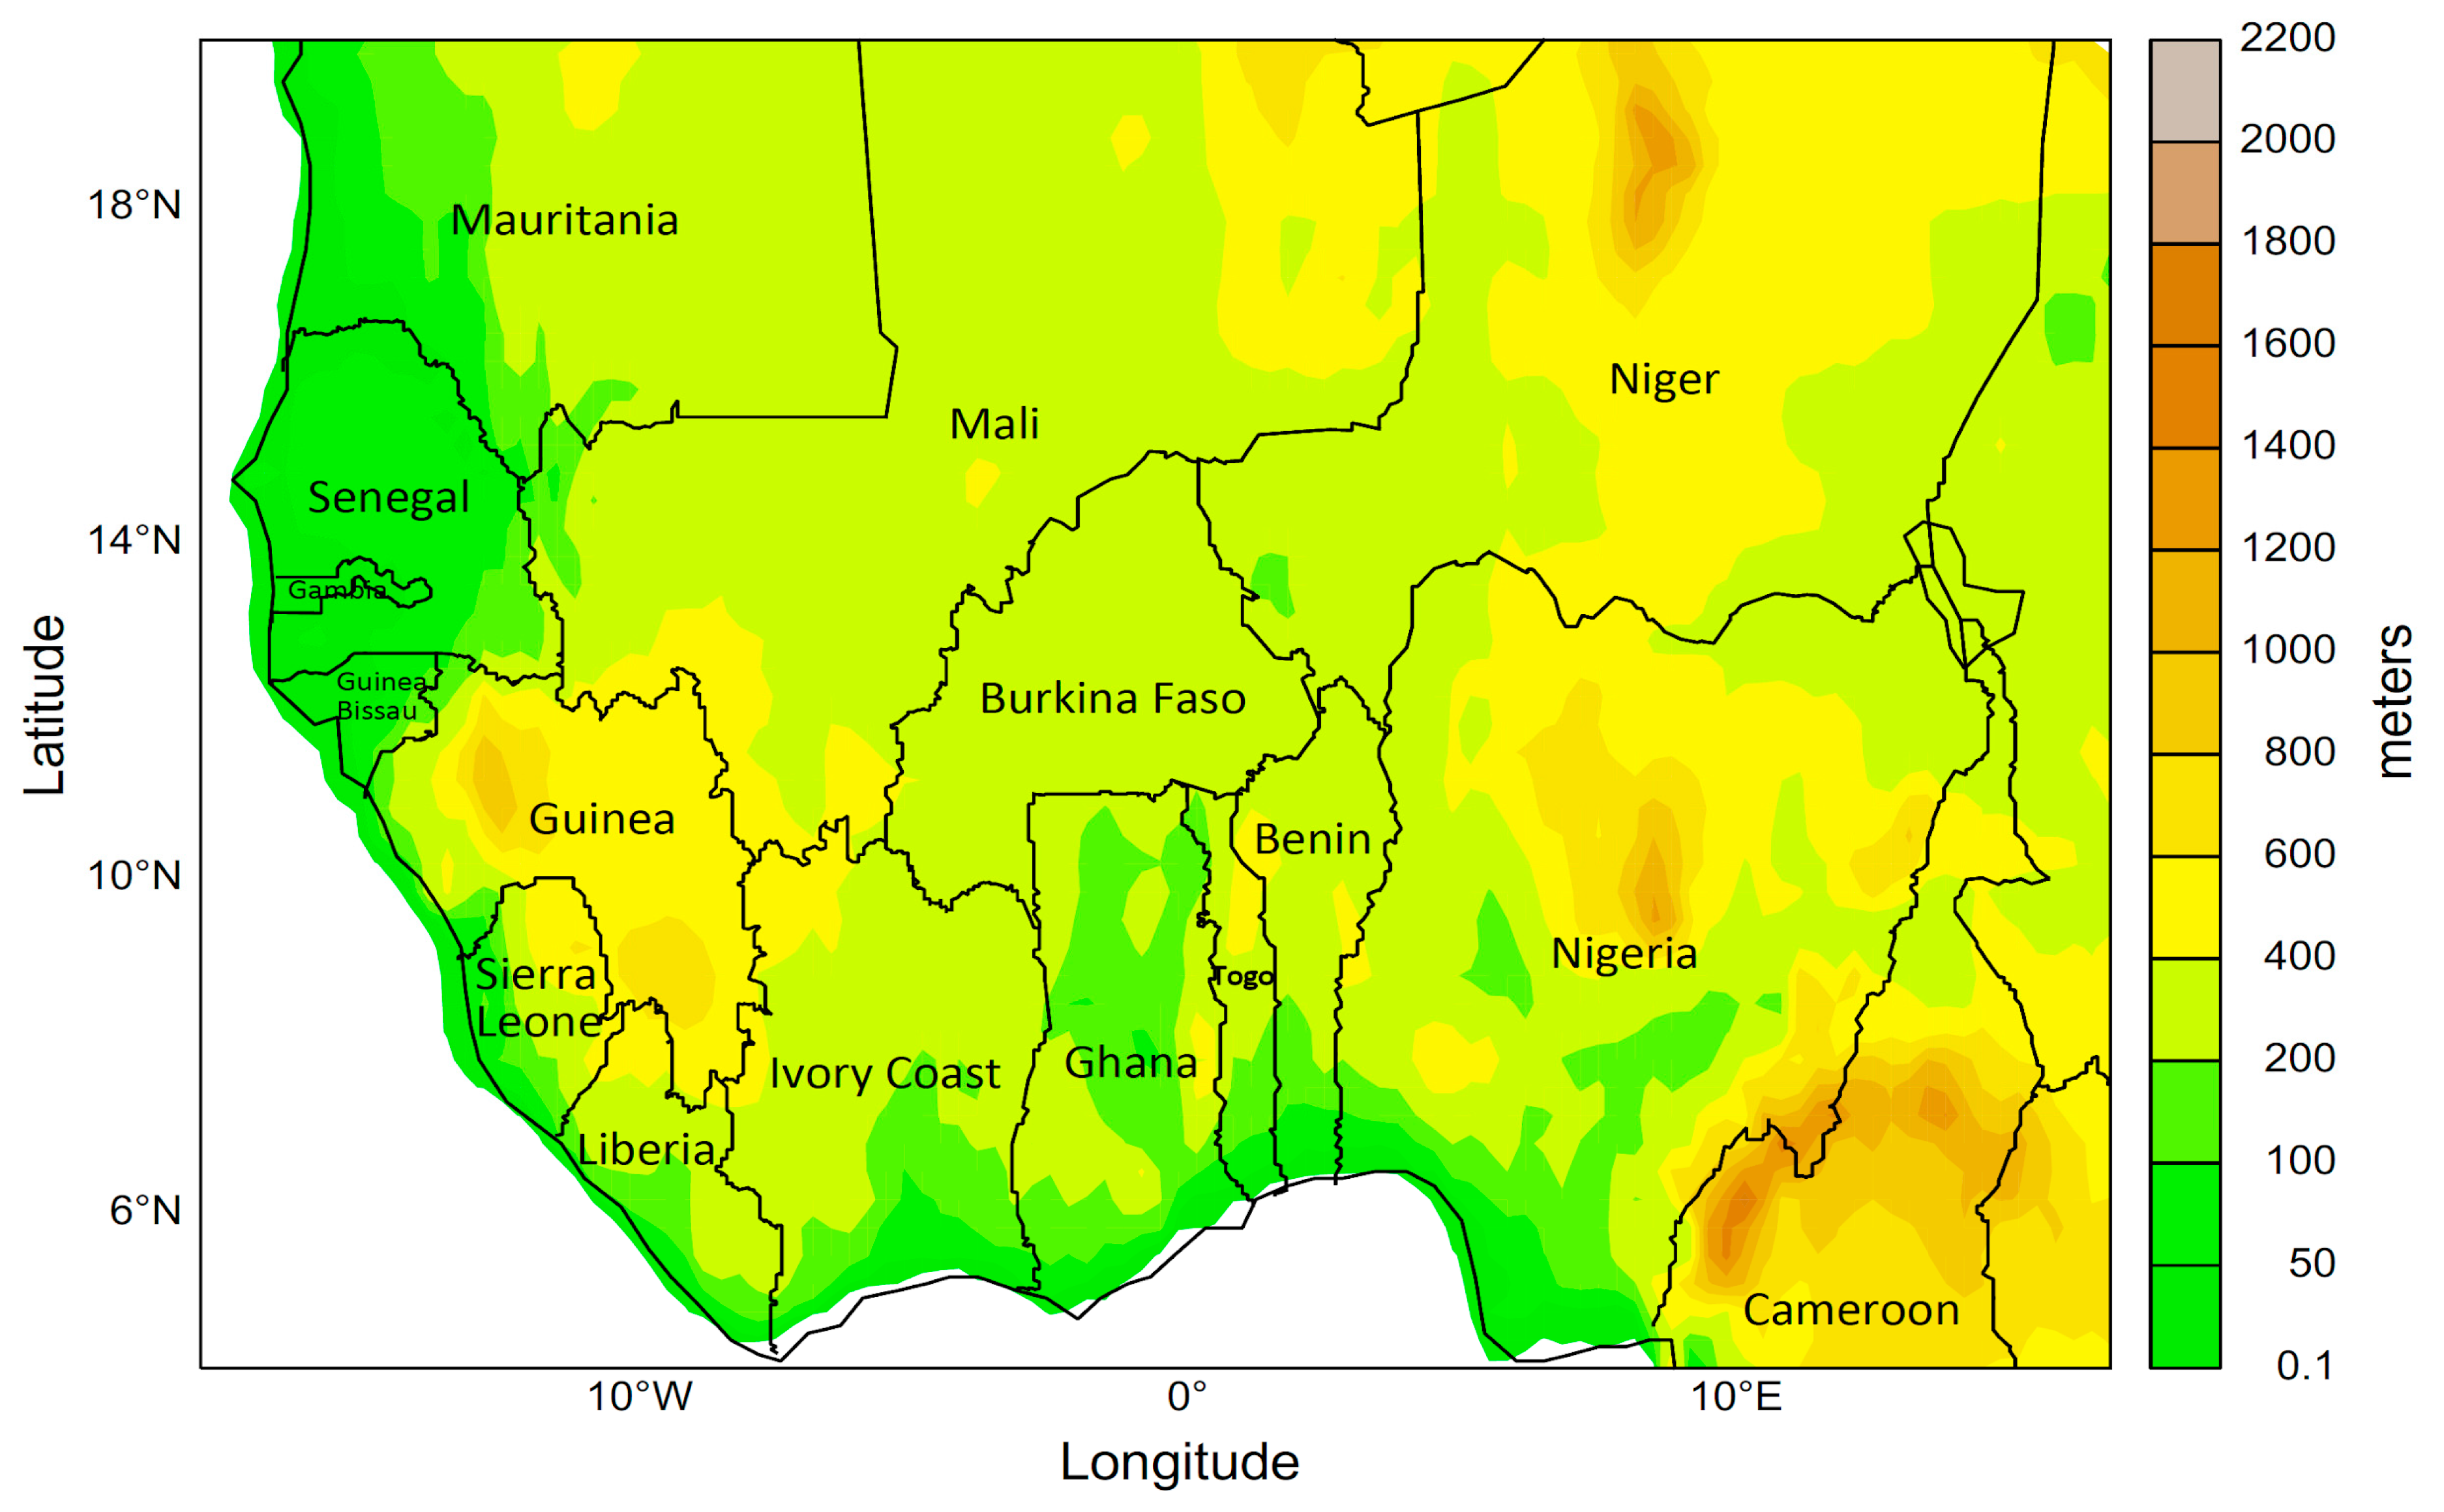
2.1. Study Area
2.2. Data
2.2.1. Observation Dataset
2.2.2. Global Reanalysis Datasets
2.3. Methods
3. Results
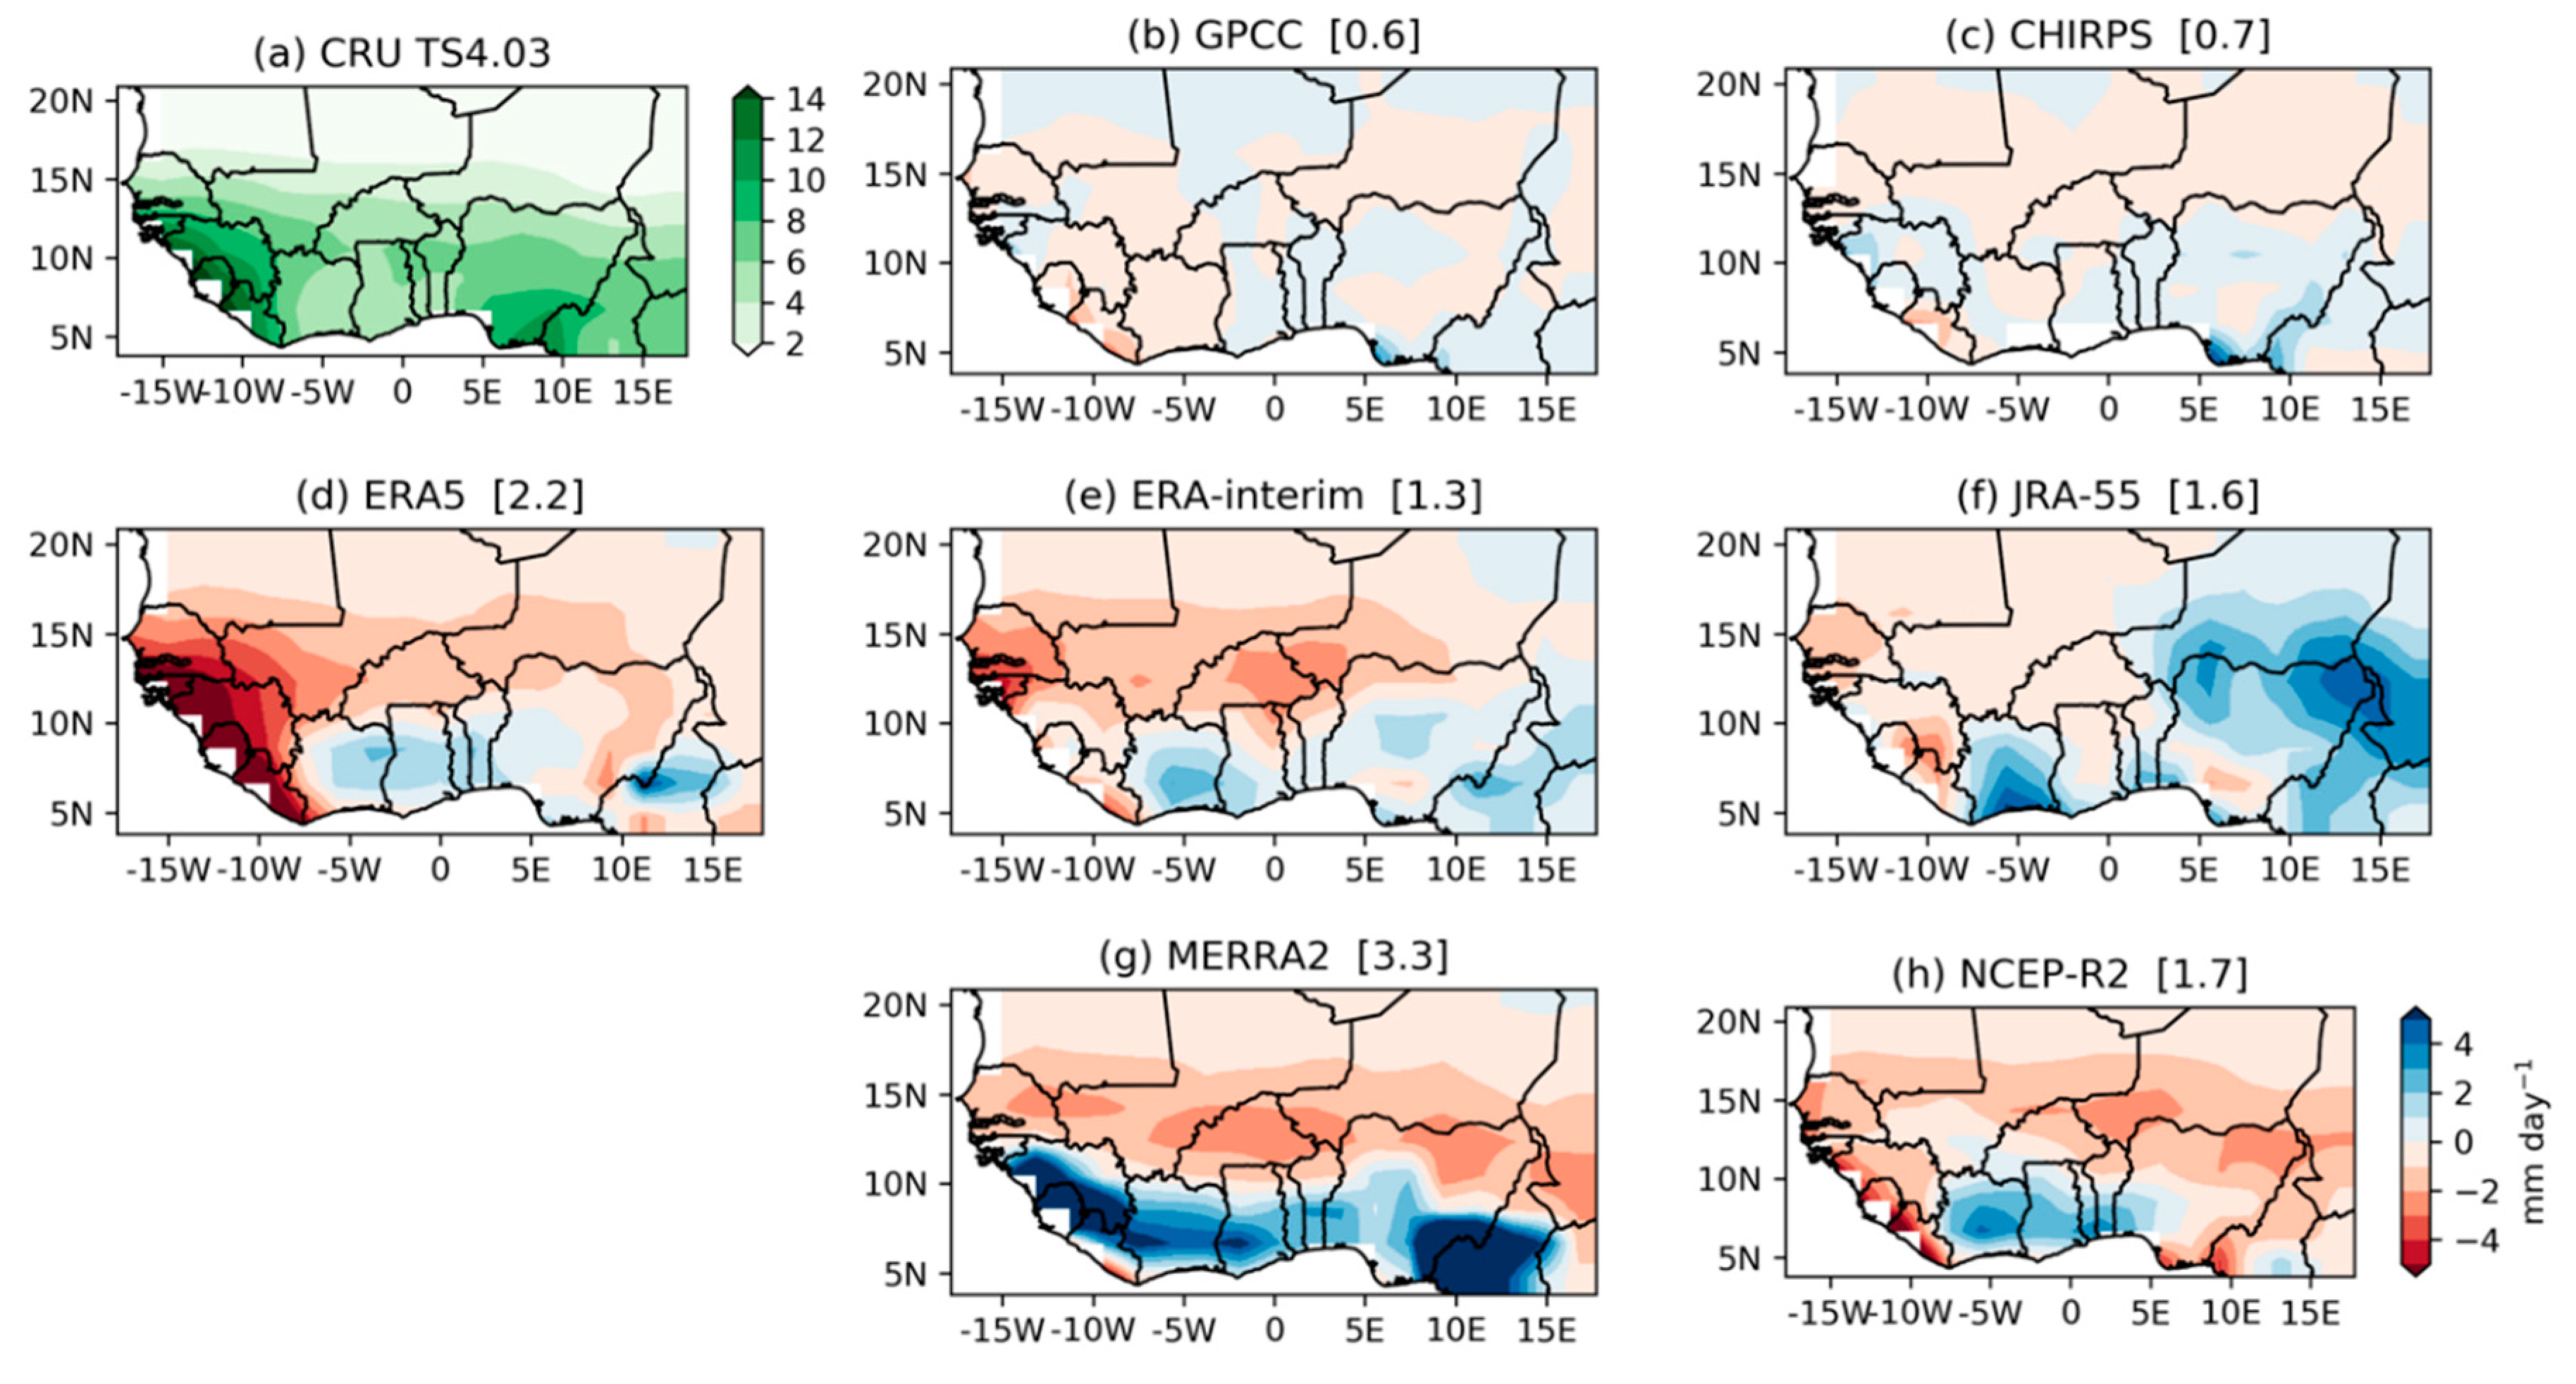
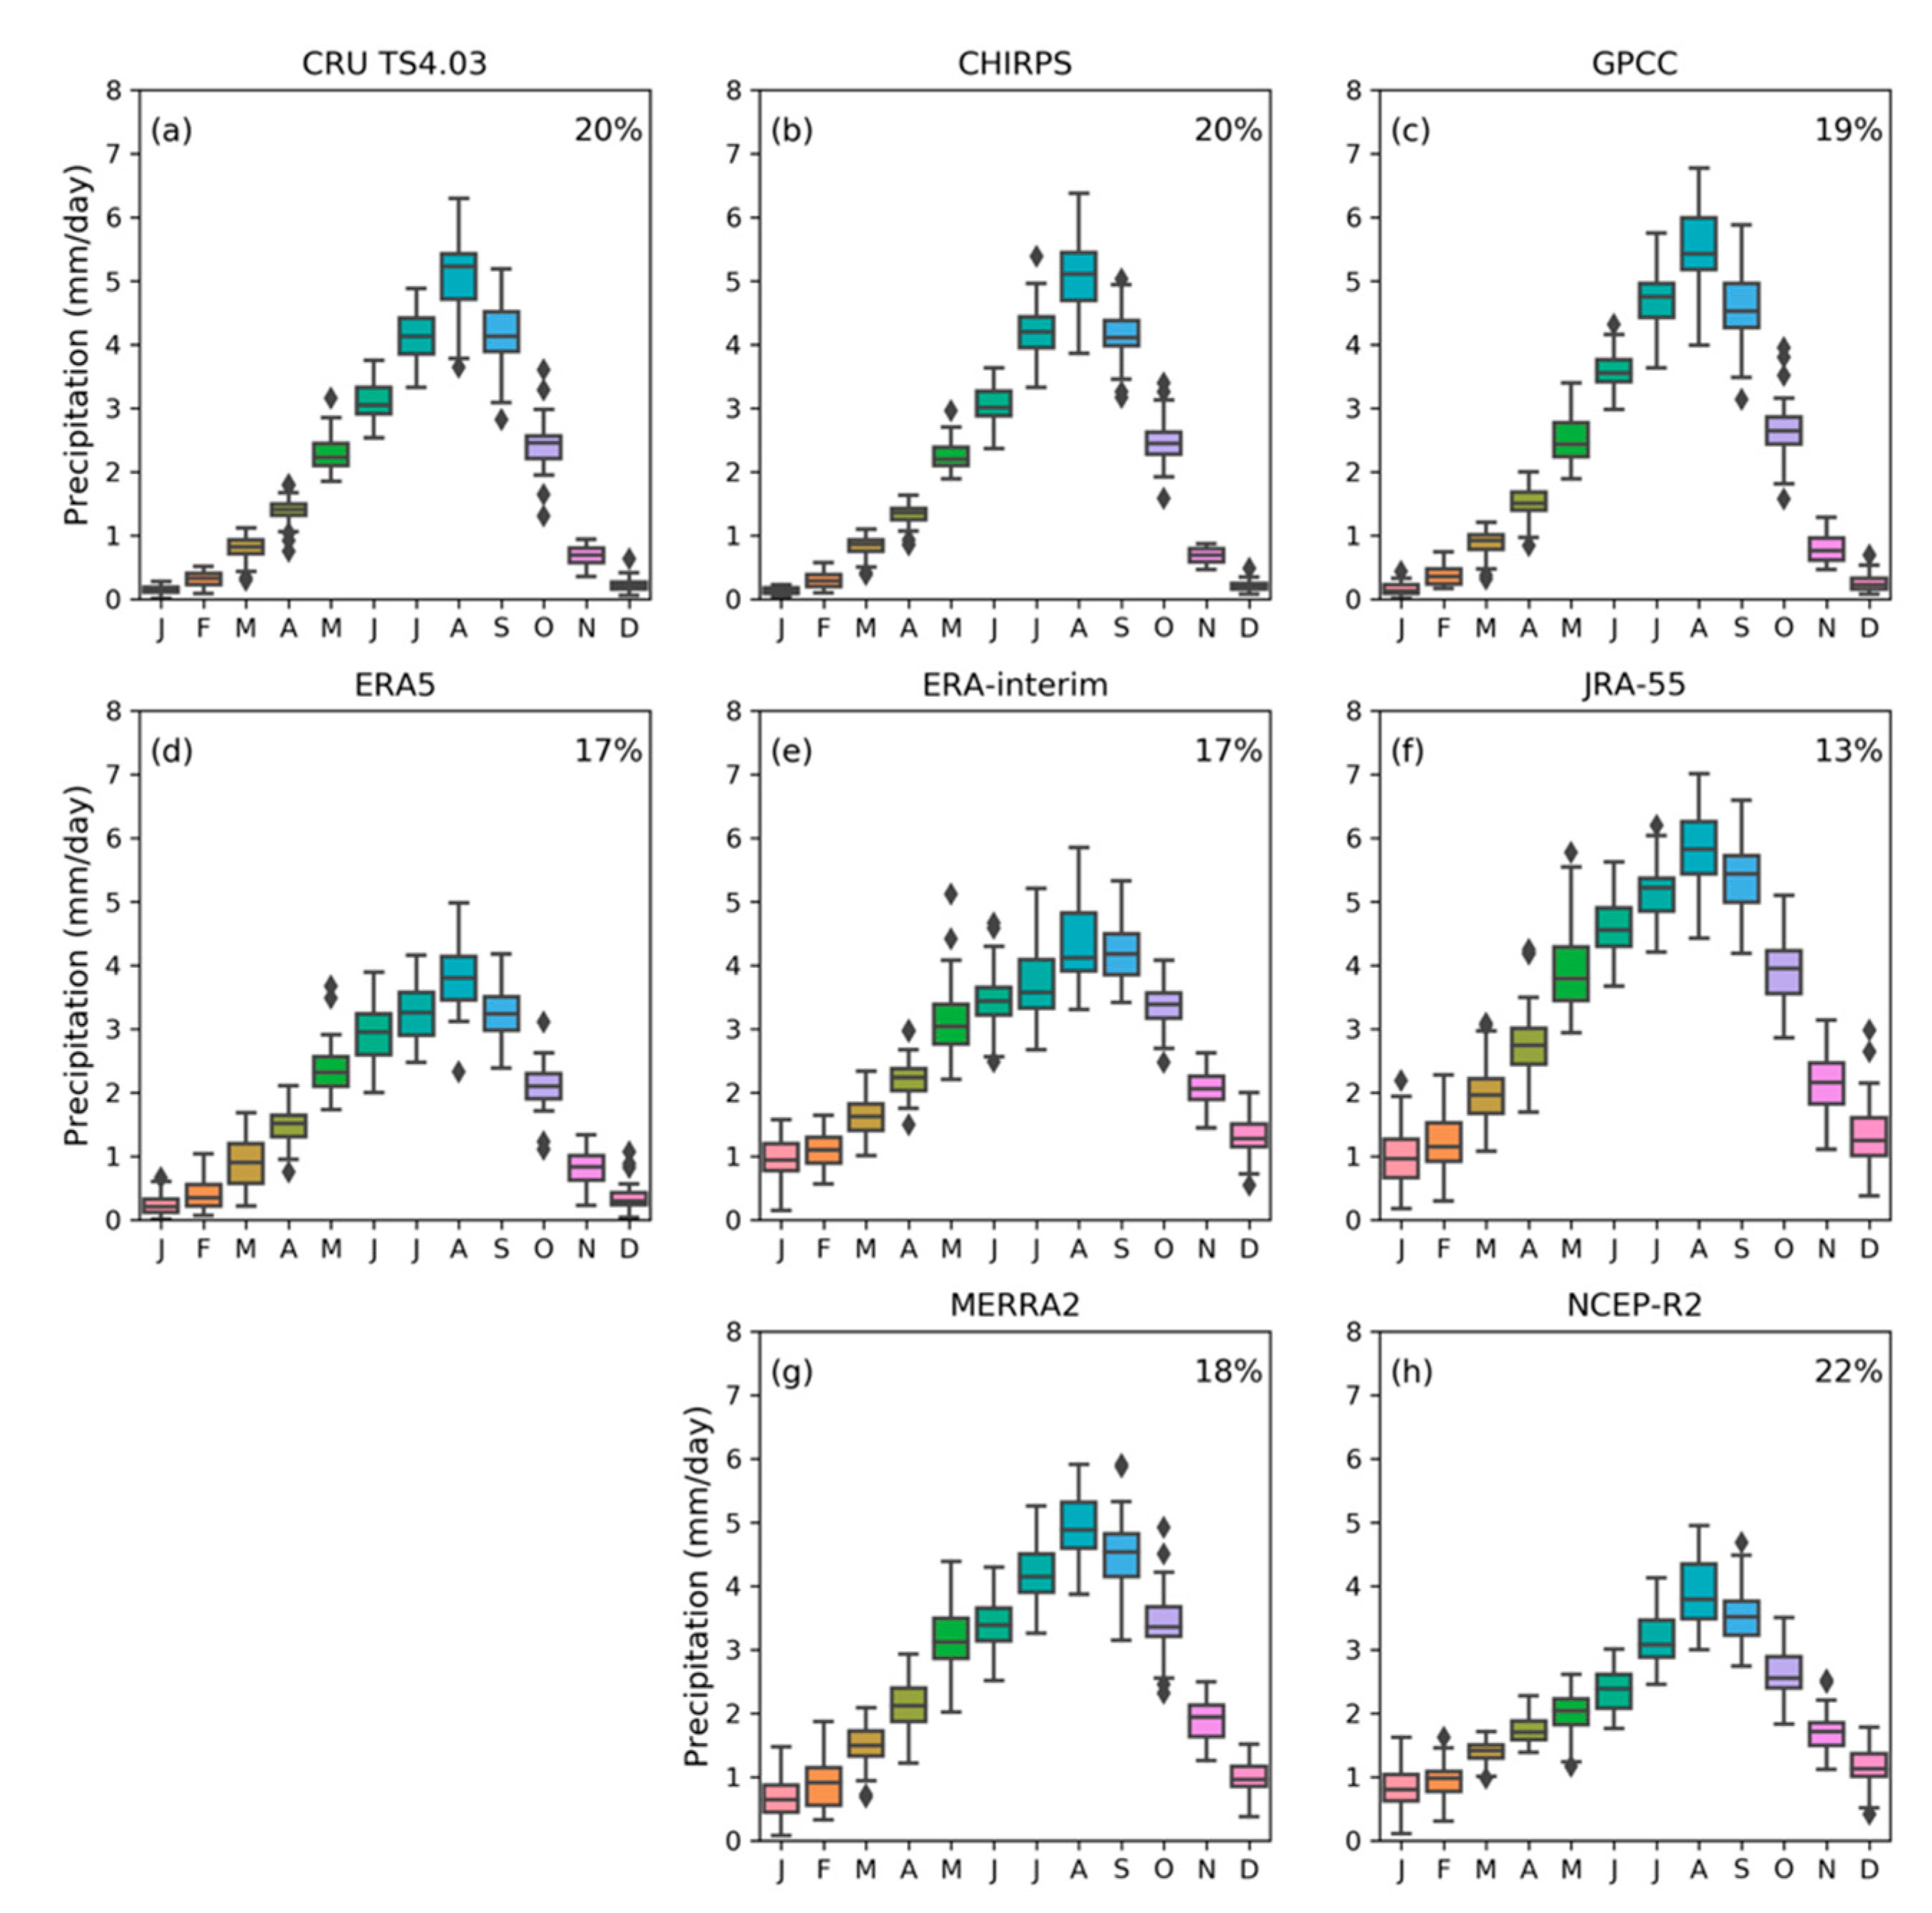
3.1. Rainfall Average and Seasonal Cycle
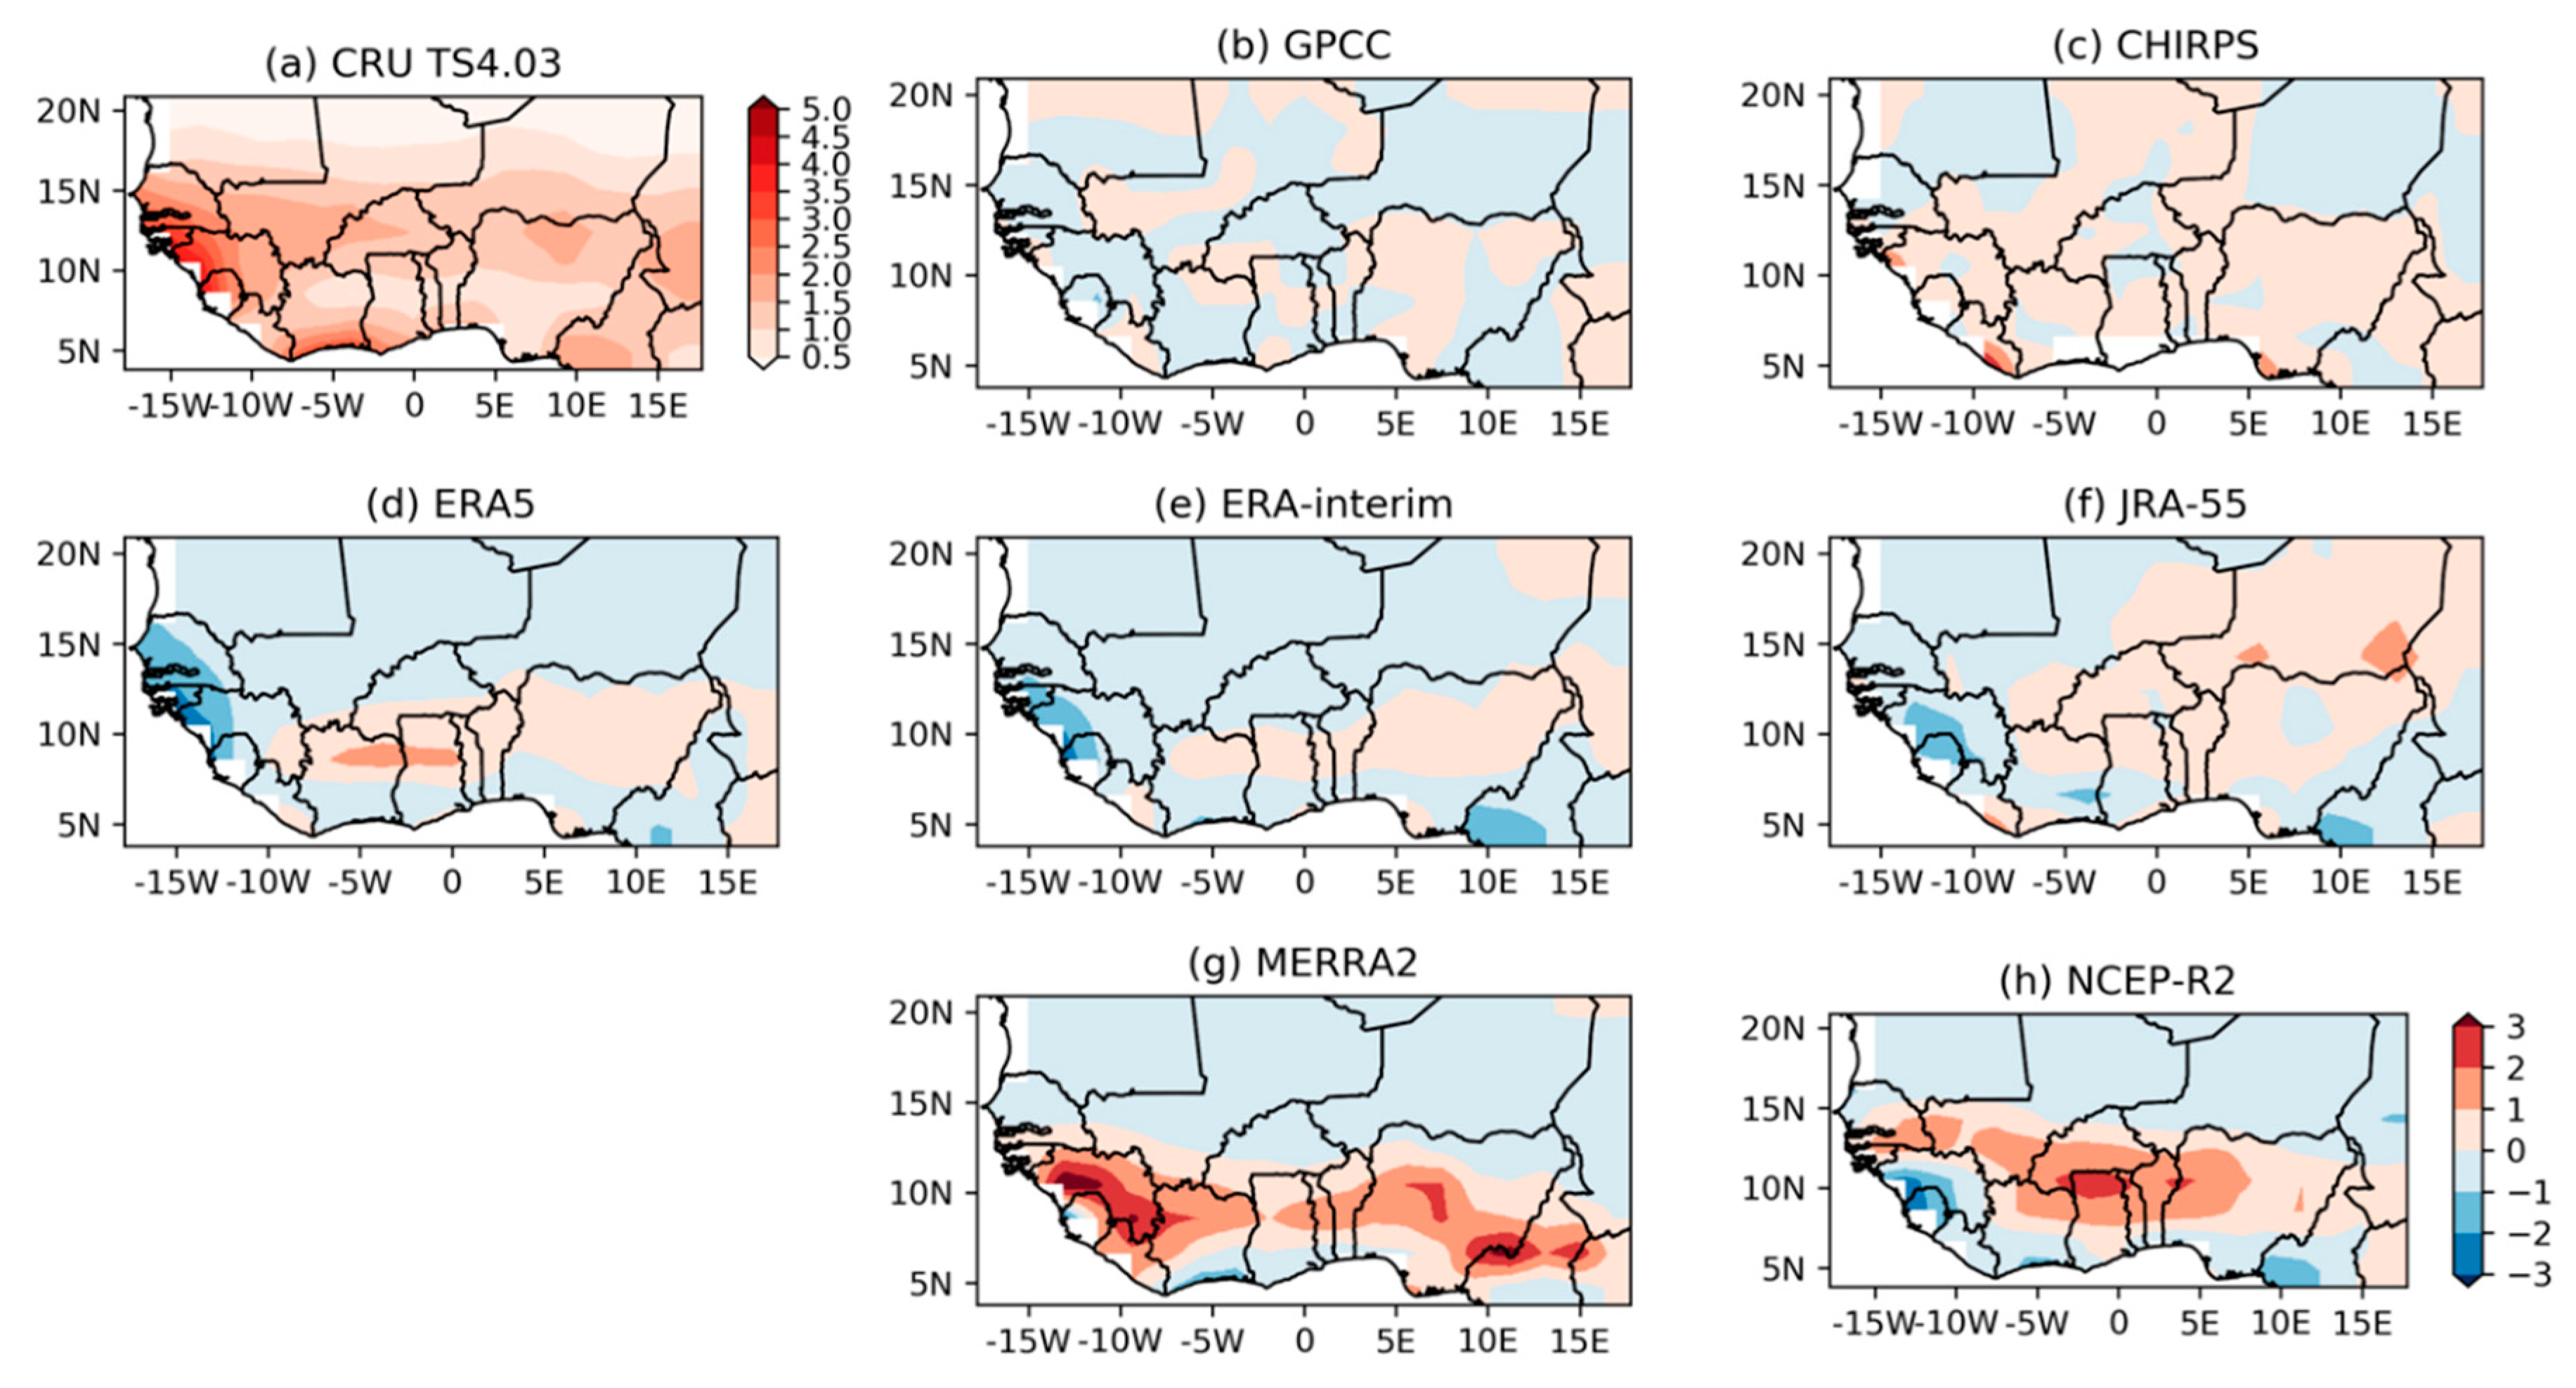
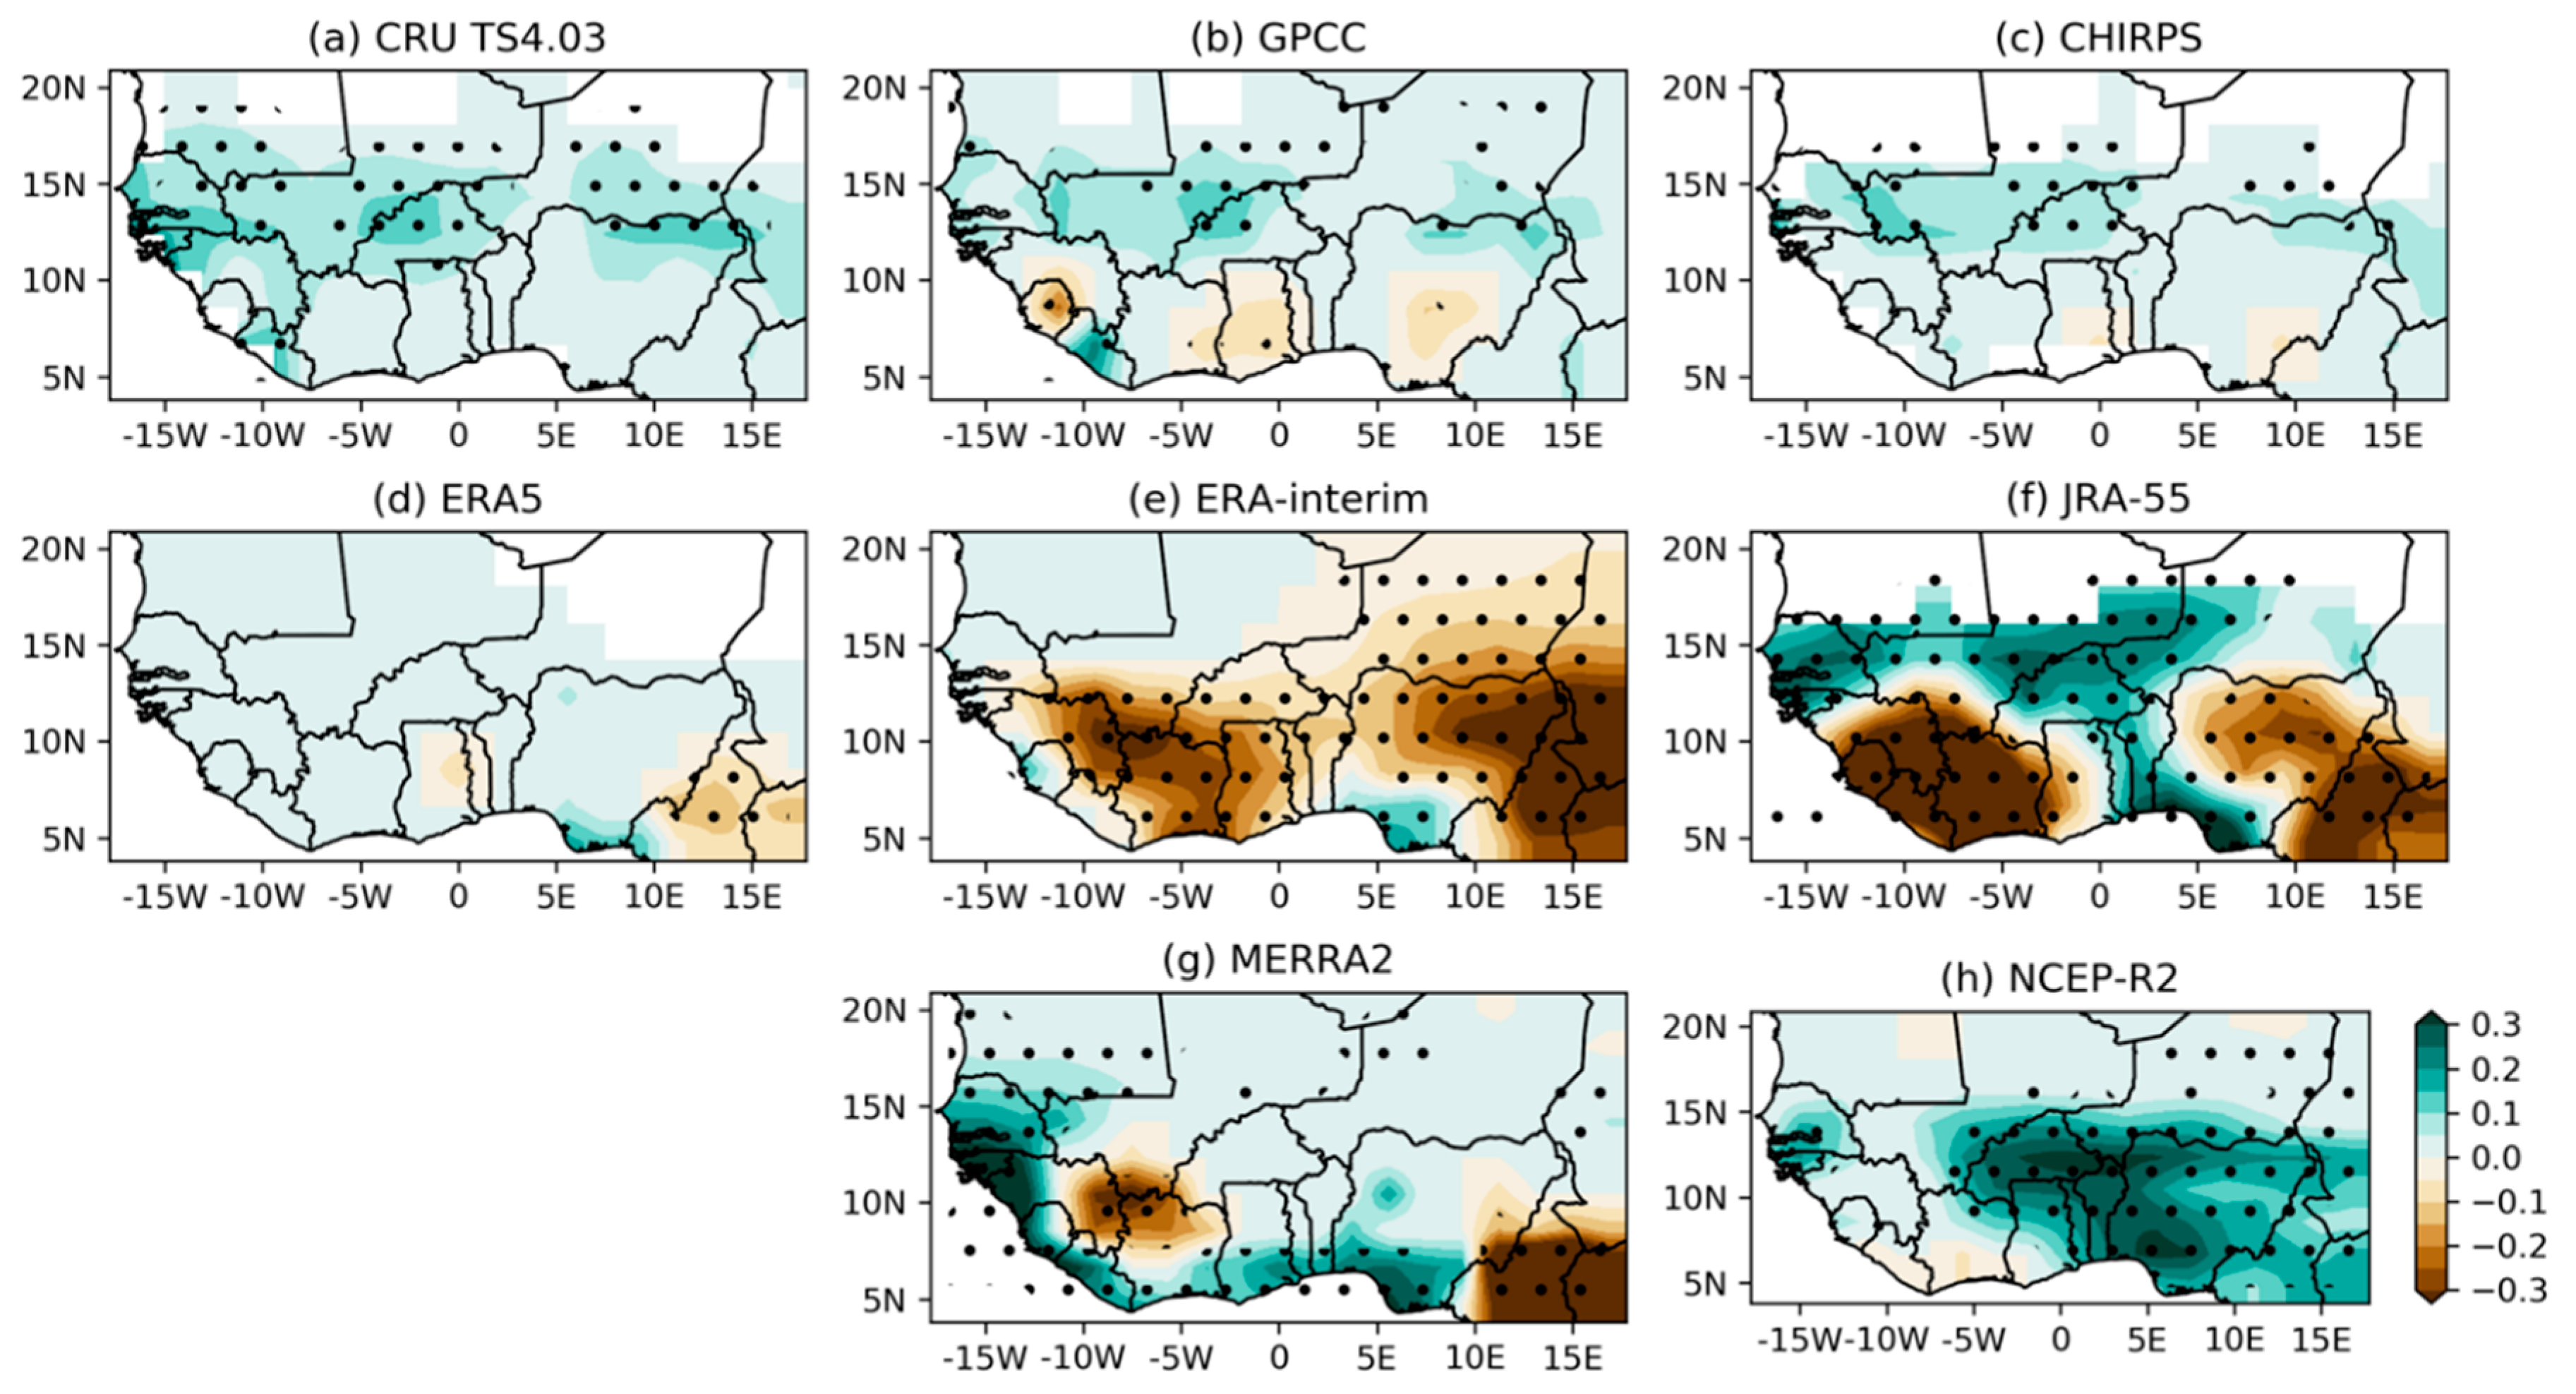
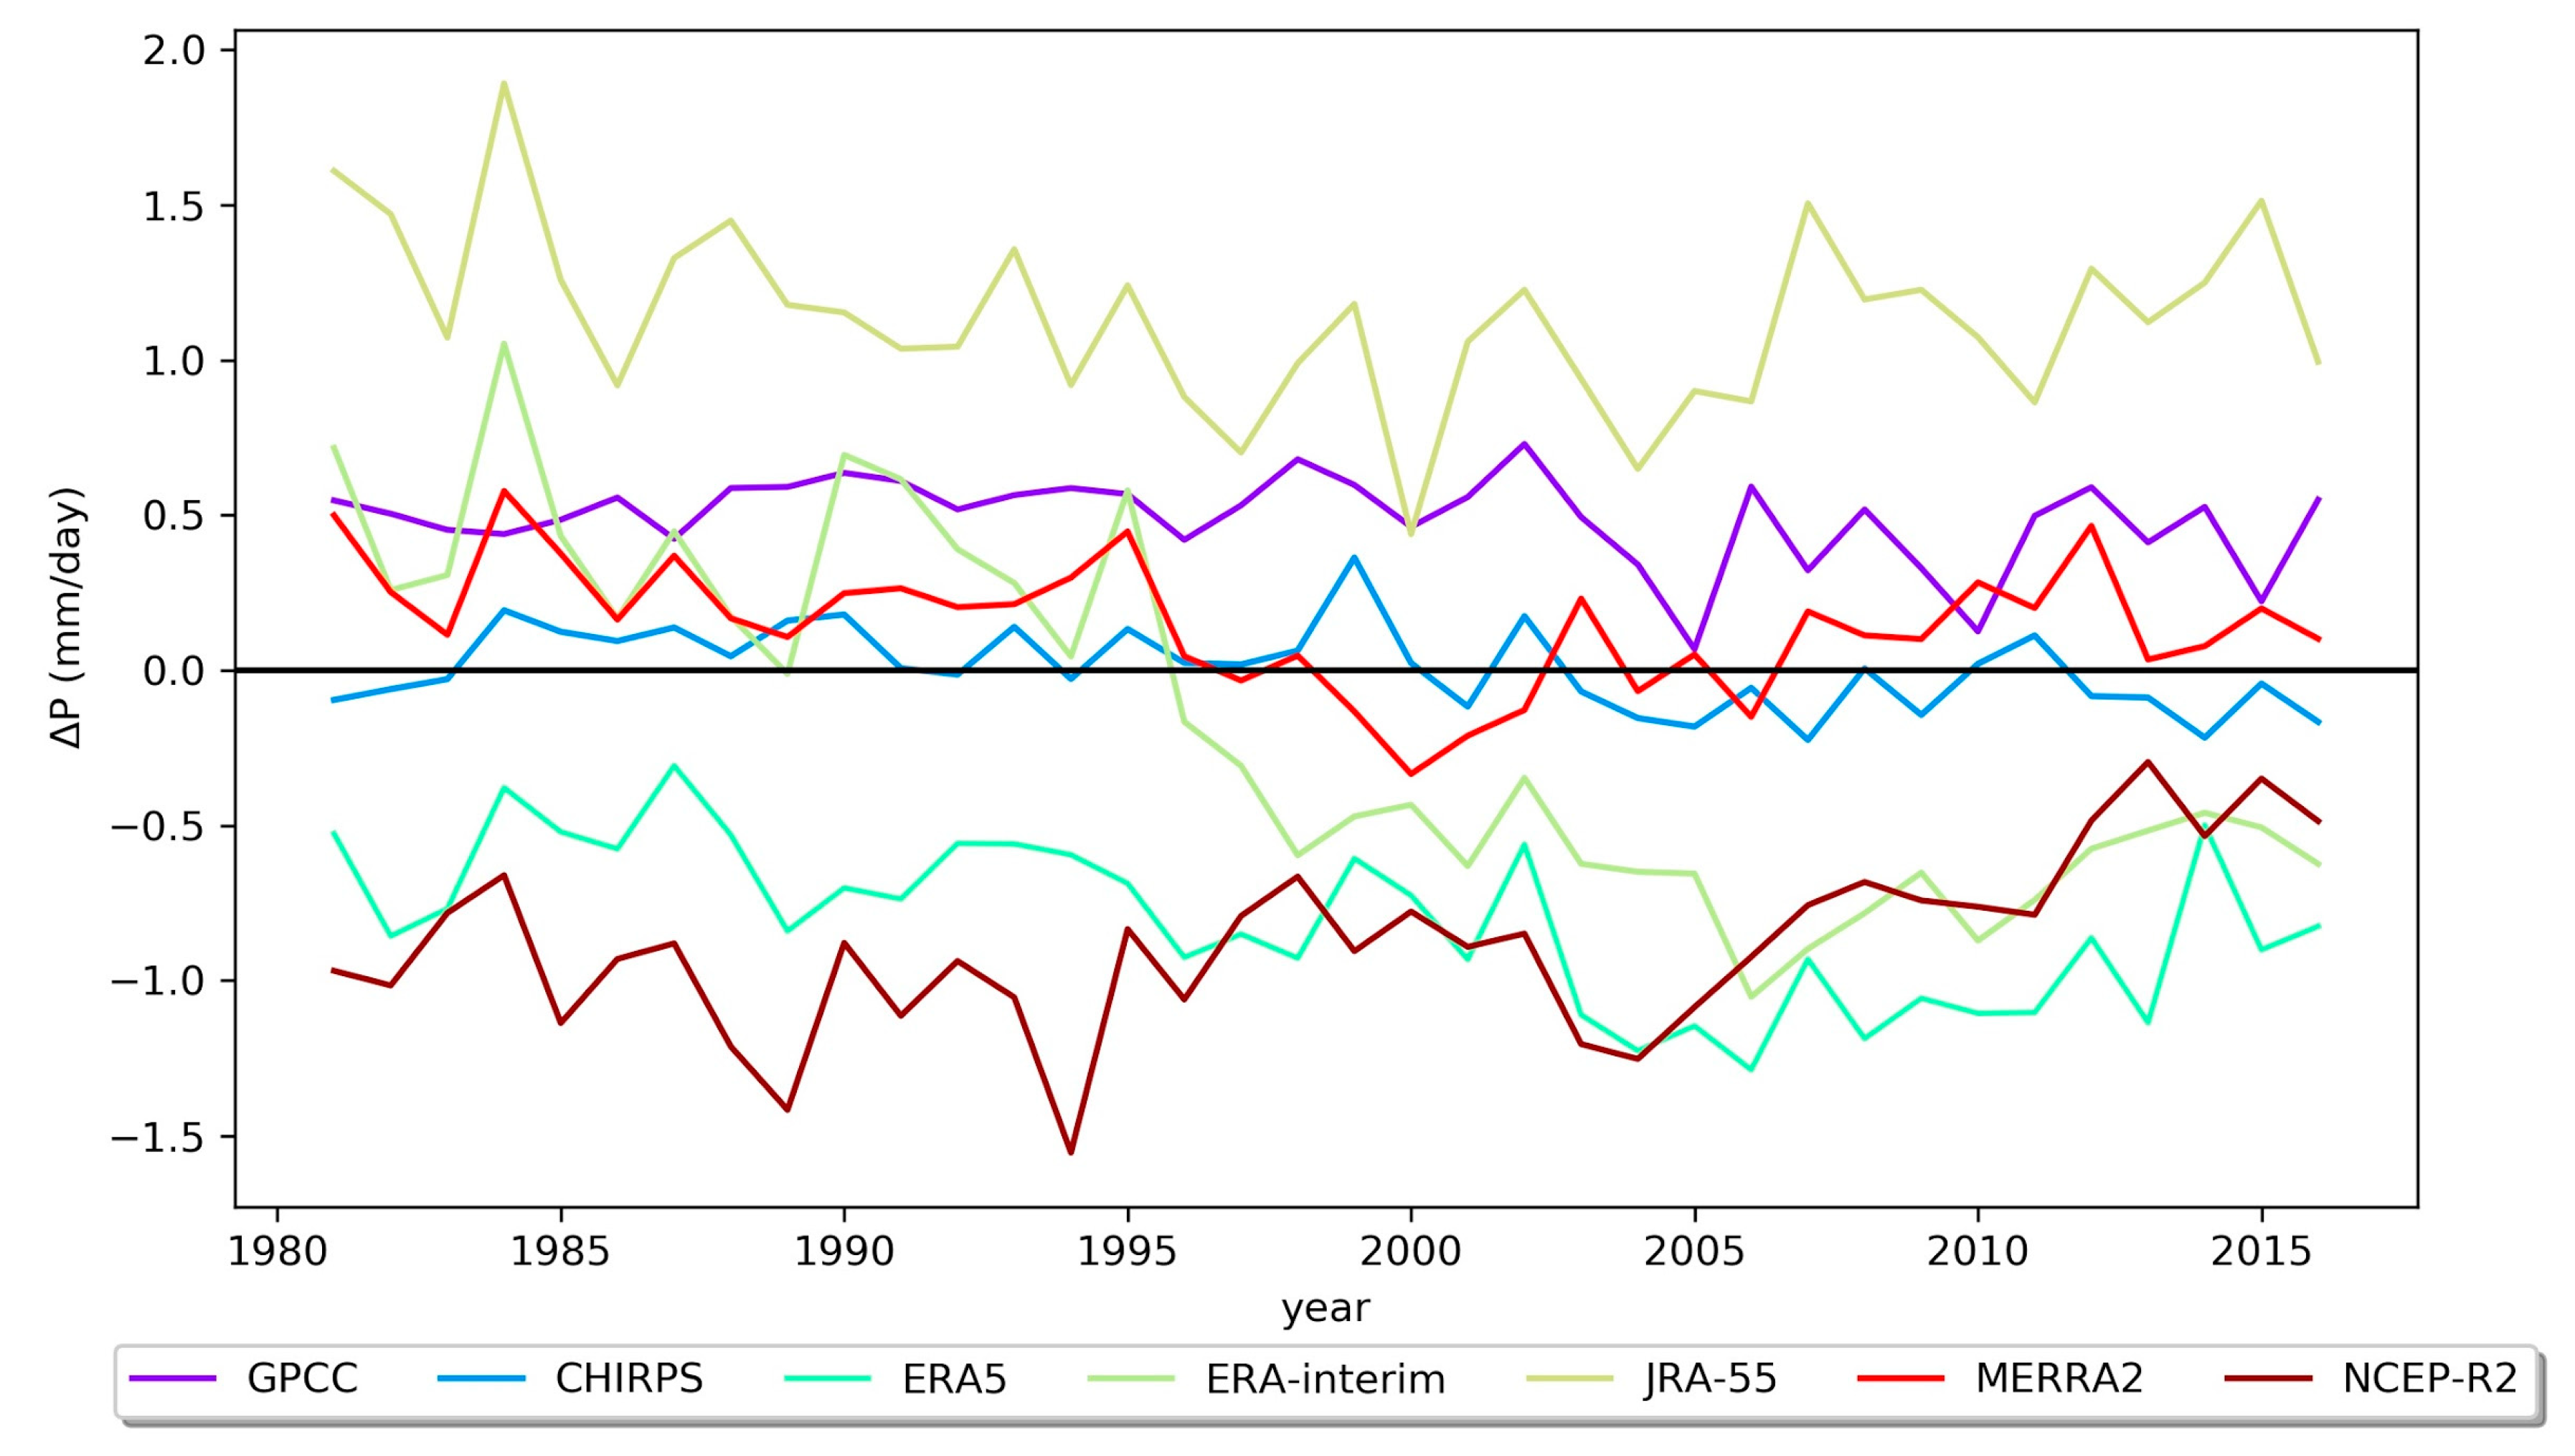
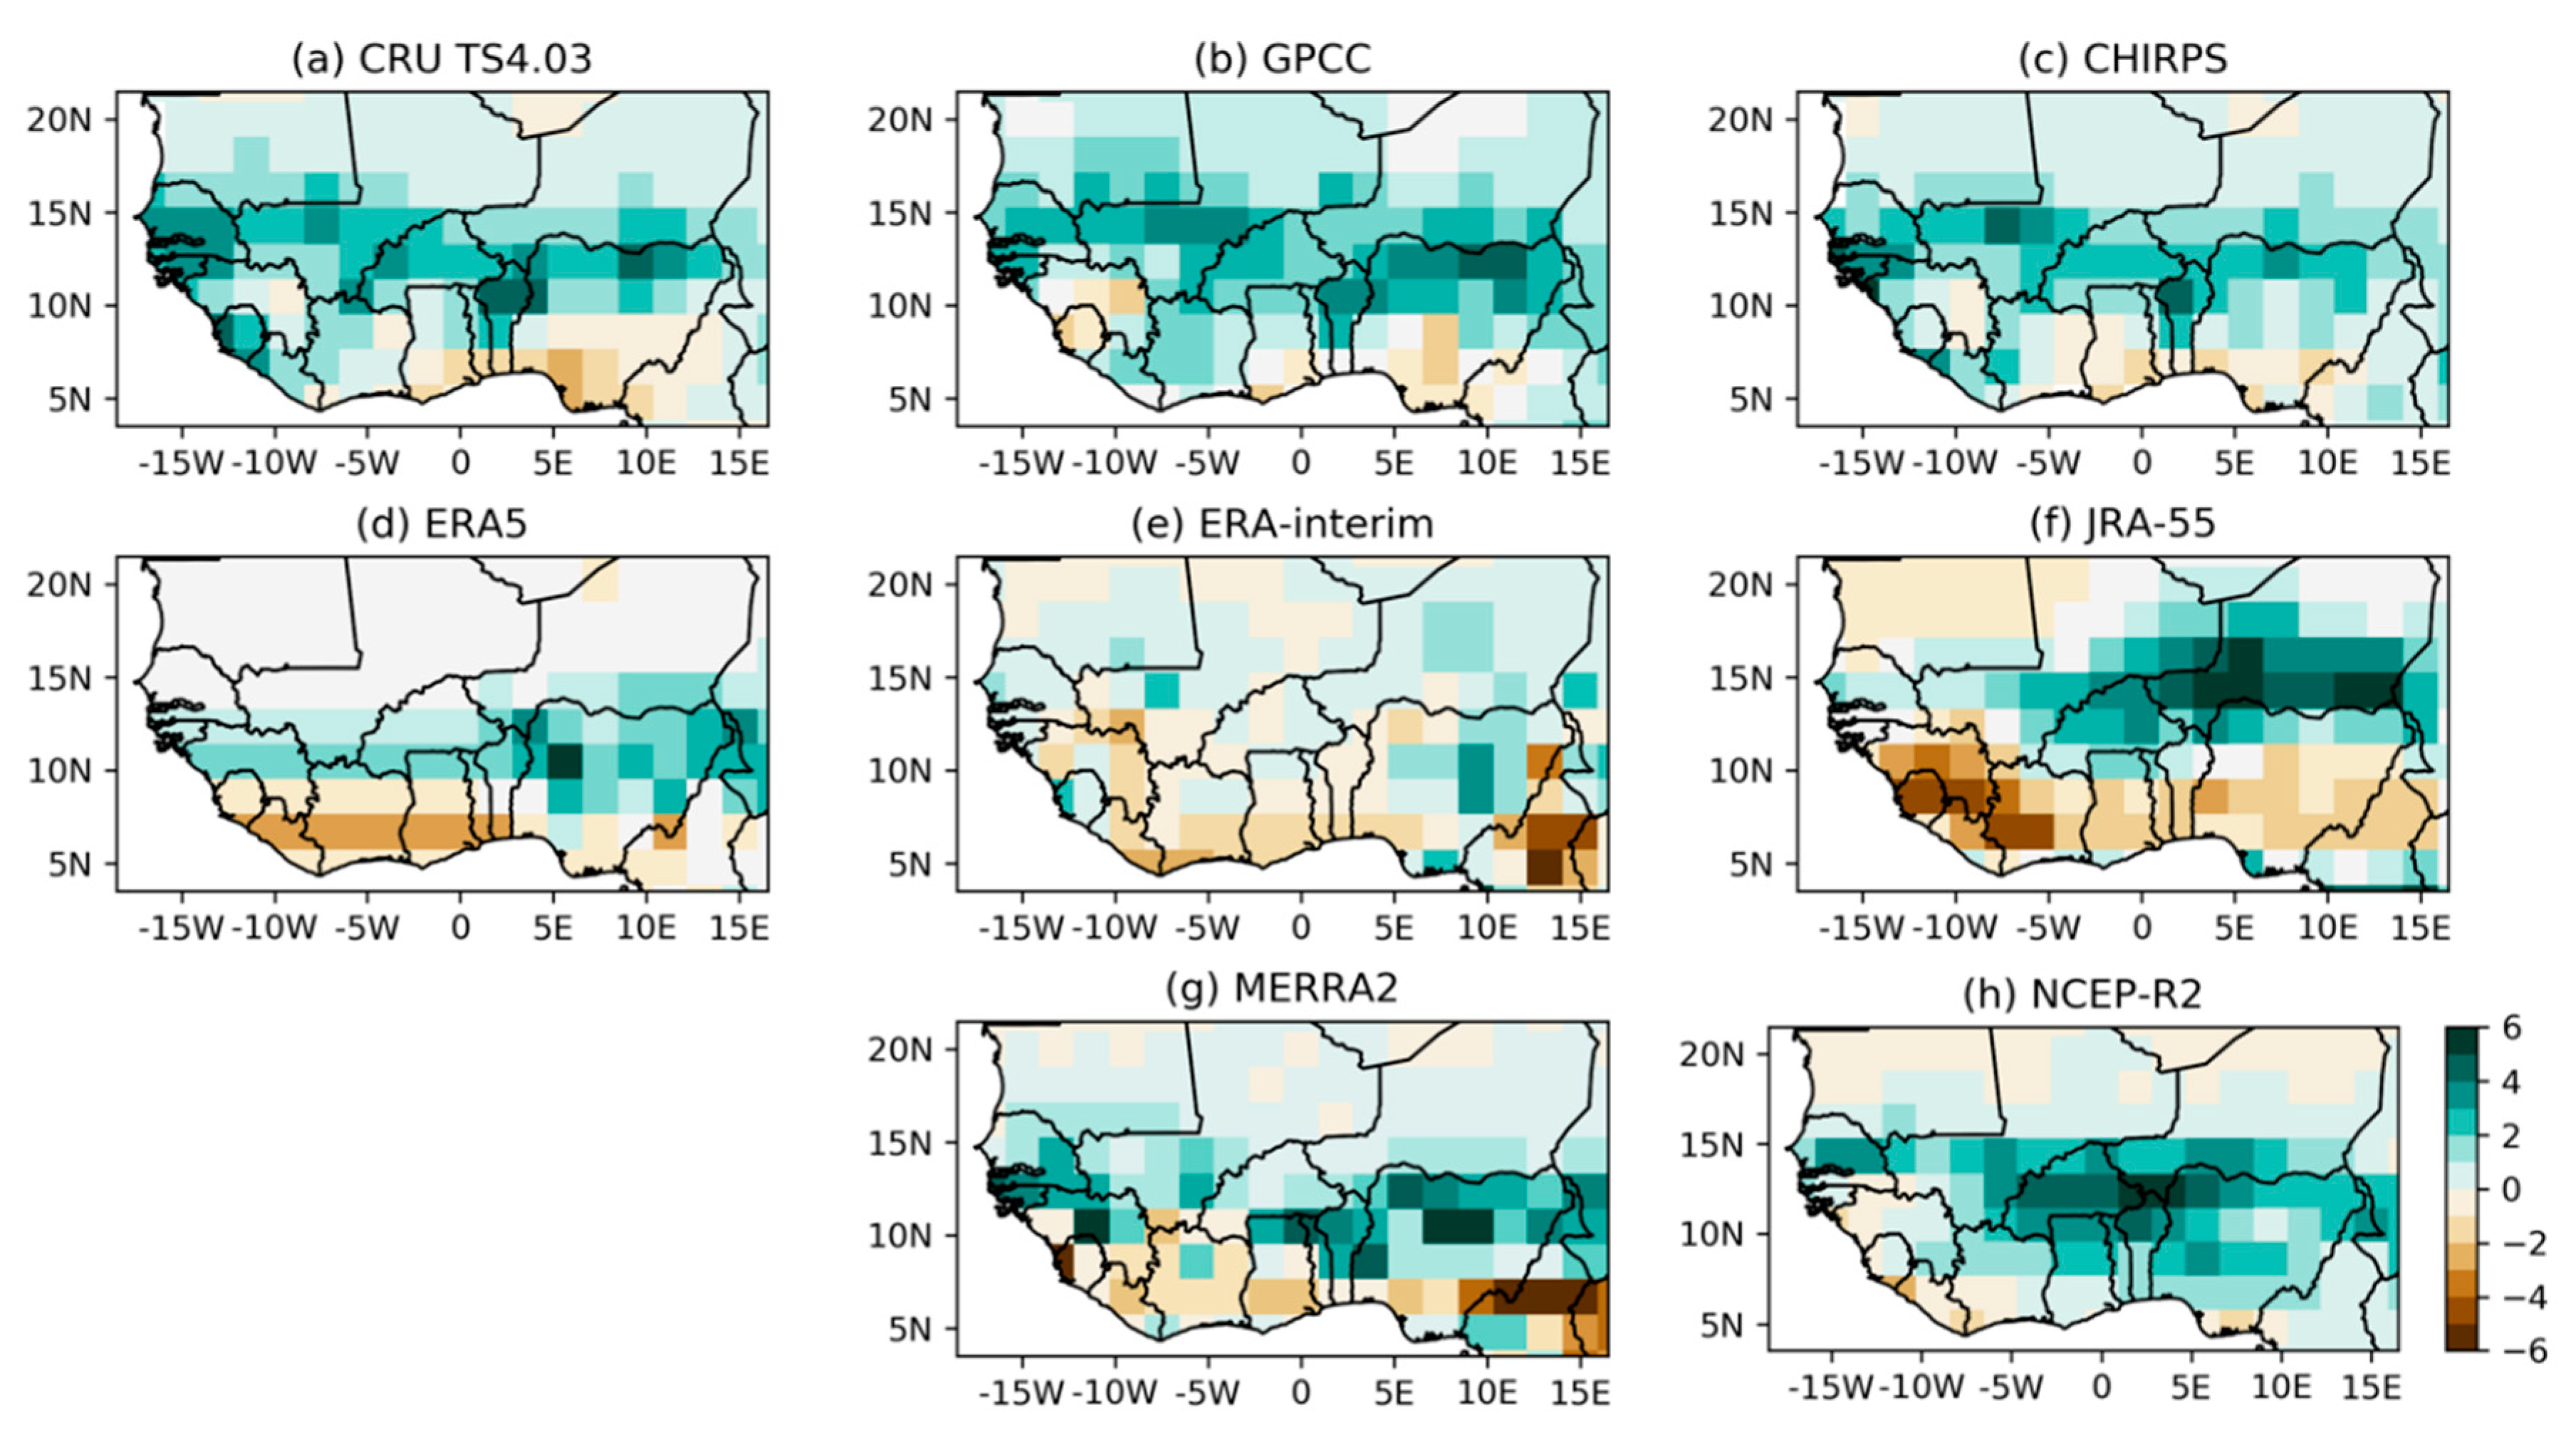
3.2. Precipitation Trends and Bias Drift
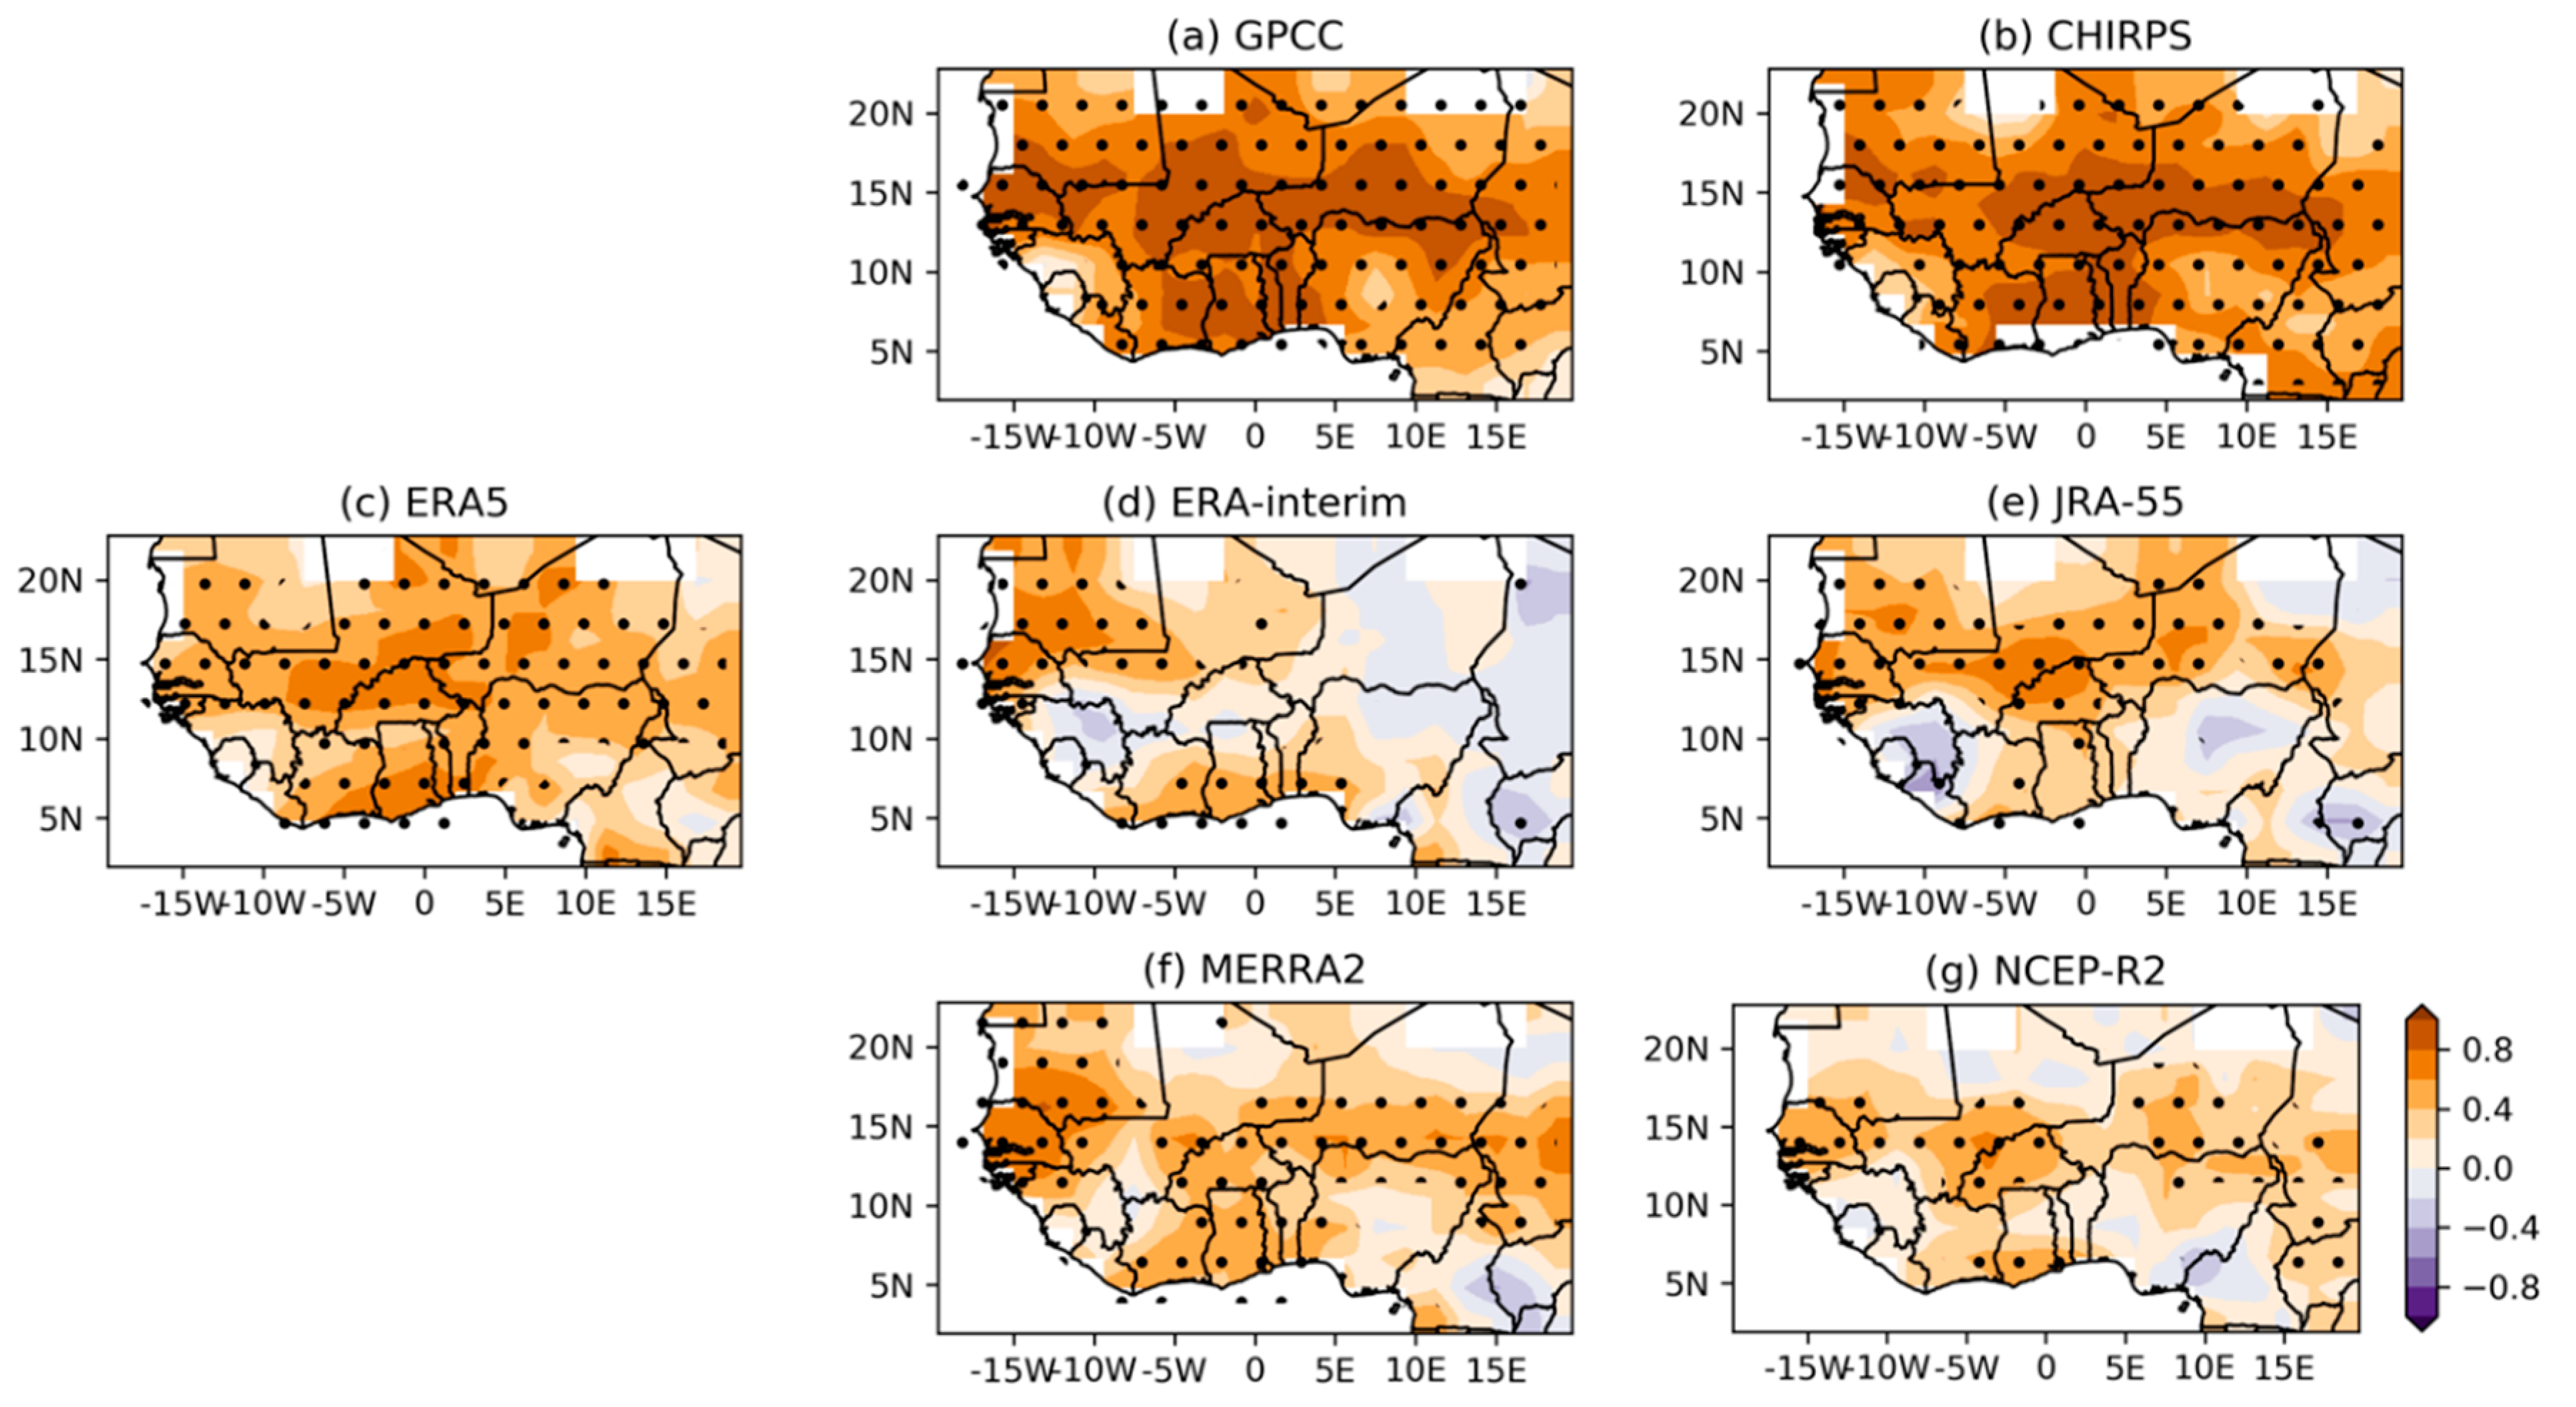
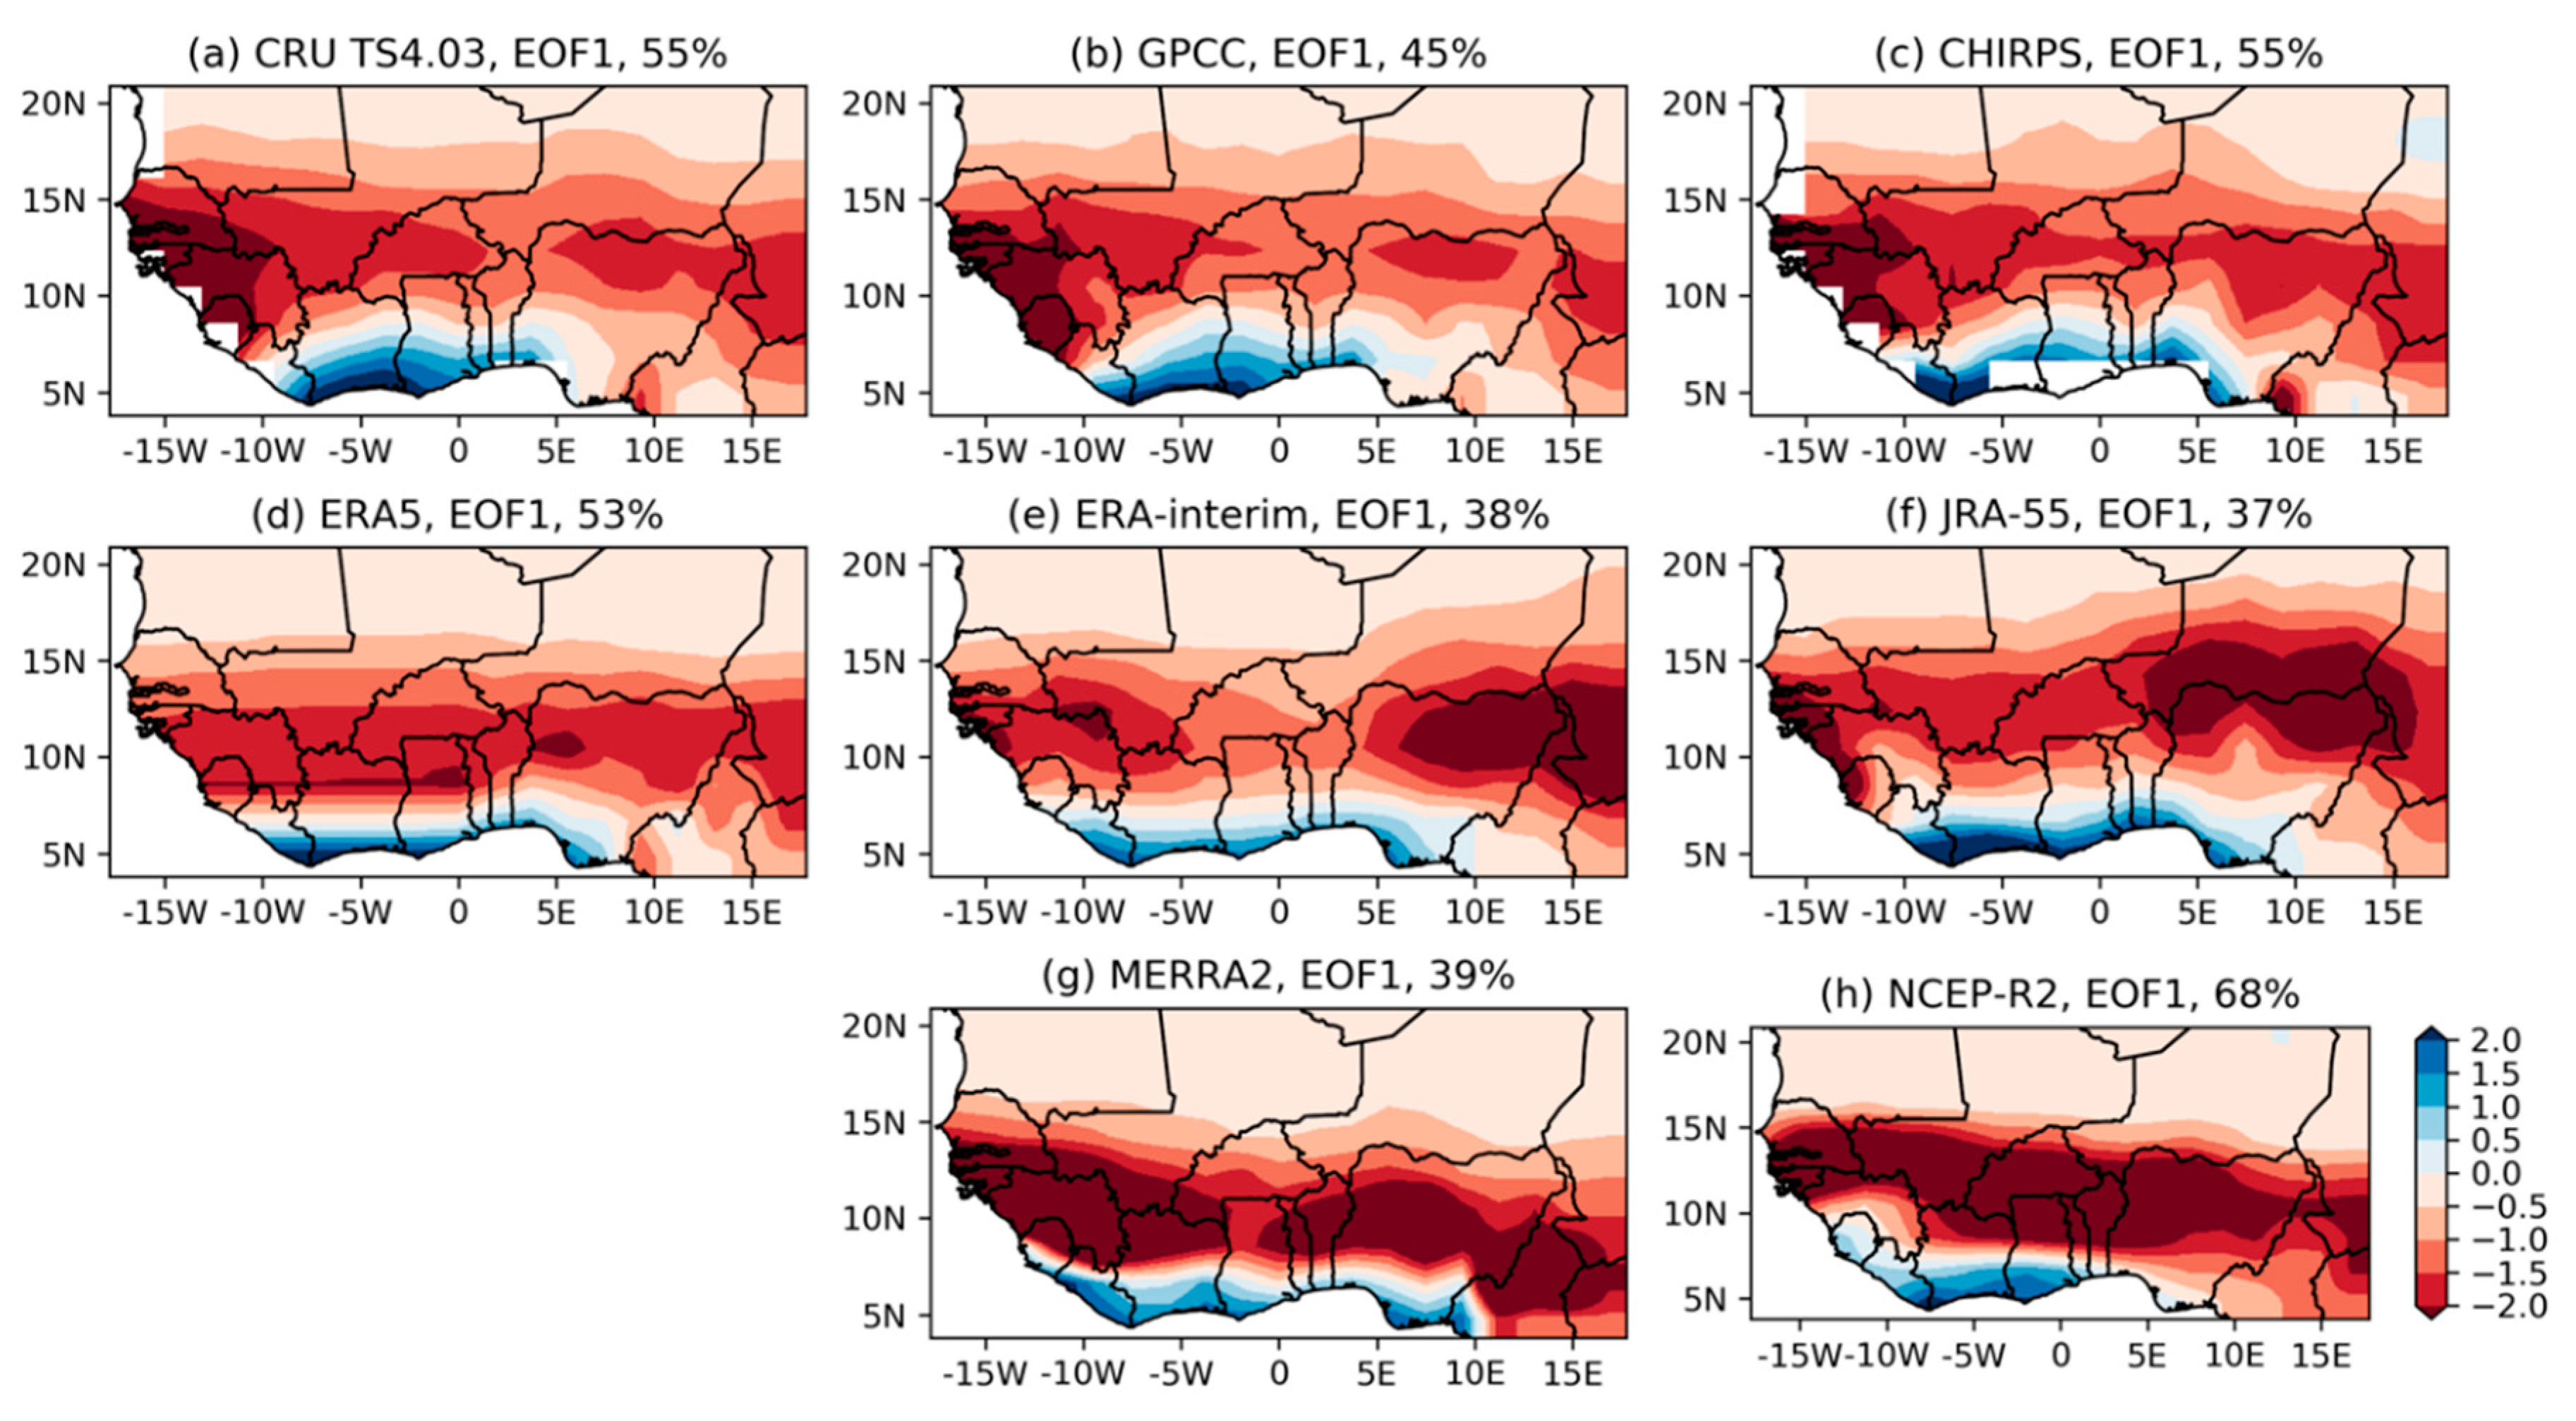
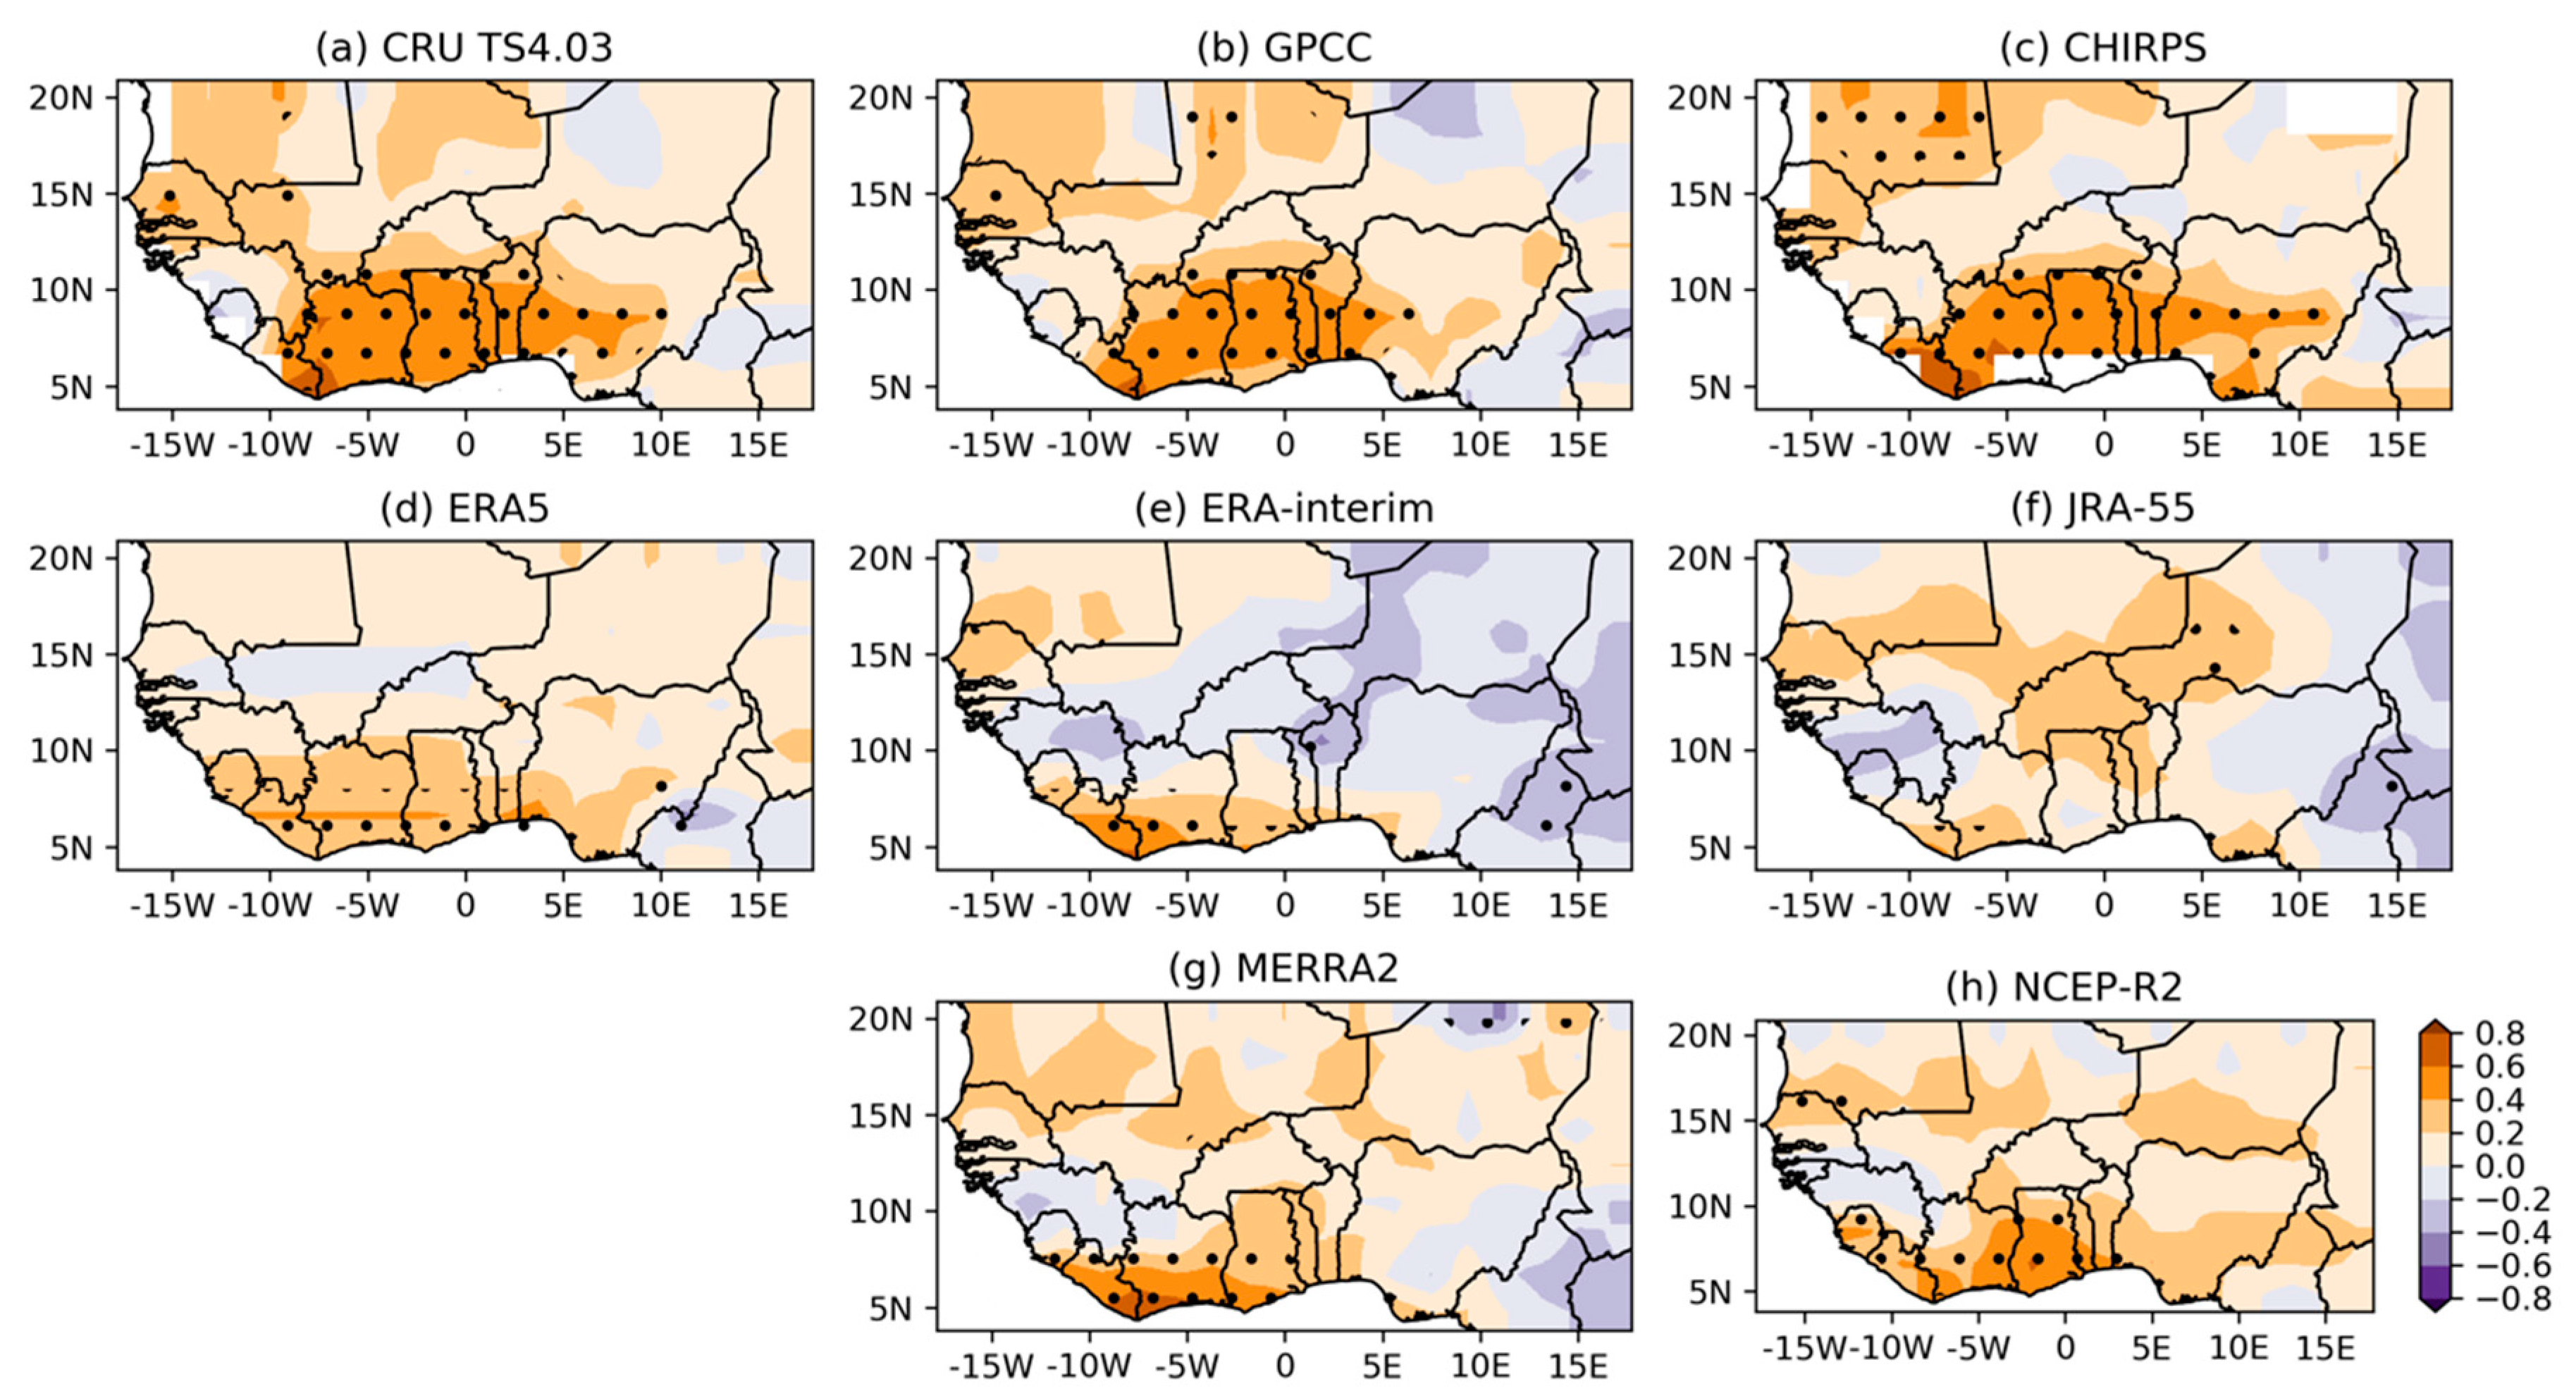
3.3. Teleconnections of West African Rainfall
4. Summary and Conclusions
Author Contributions
Funding
Acknowledgments
Conflicts of Interest
References
- Hagos, S.M.; Cook, K.H. Dynamics of the West African monsoon jump. J. Clim. 2007, 20, 5264–5284. [Google Scholar] [CrossRef]
- Niang, I.; Ruppel, O.C.; Abdrabo, M.A.; Essel, A.; Lennard, C.; Padgham, J.; Urquhart, P. Africa. In Climate Change 2014: Impacts, Adaptation, and Vulnerability. Part B: Regional Aspects. Contribution of Working Group II to the Fifth Assessment Report of the Intergovernmental Panel on Climate Change; Cambridge University Press: Cambridge, UK; New York, NY, USA, 2014; pp. 1199–1265. [Google Scholar]
- Sylla, M.B.; Dell’Aquila, A.; Ruti, P.M.; Giorgi, F. Simulation of the intraseasonal and the interannual variability of rainfall over West Africa with RegCM3 during the monsoon period. Int. J. Climatol. 2010, 30, 1865–1883. [Google Scholar] [CrossRef]
- Nicholson, S.E. The West African Sahel: A Review of Recent Studies on the Rainfall Regime and Its Interannual Variability. ISRN Meteorol. 2013, 2013, 1–32. [Google Scholar] [CrossRef]
- Nicholson, S.E.; Ba, M.B.; Kim, J.Y. Rainfall in the Sahel during 1994. J. Clim. 1996, 9, 1673–1676. [Google Scholar] [CrossRef] [Green Version]
- Nicholson, S.E. Dryland Climatology; Cambridge University Press: Cambridge, UK, 2011; ISBN 9780511973840. [Google Scholar]
- Nkiaka, E.; Nawaz, N.R.; Lovett, J.C. Evaluating global reanalysis precipitation datasets with rain gauge measurements in the Sudano-Sahel region: Case study of the Logone catchment, Lake Chad Basin. Meteorol. Appl. 2017, 24, 9–18. [Google Scholar] [CrossRef]
- Hewitson, B.C.; Reason, C.J.C.; Tennant, W.; Tadross, M.; Jack, C.; MacKellar, N.; Lennard, C.; Hansingo, K.; Walawege, R.; Mdoka, M. Dynamical Modelling of Present and Future Climate Systems; Techinical Report; South African Water Research Commission: Gezina, South Africa, 2004; ISBN 1-77005-280-1. [Google Scholar]
- Donat, M.G.; Alexander, L.V.; Yang, H.; Durre, I.; Vose, R.; Dunn, R.J.H.; Willett, K.M.; Aguilar, E.; Brunet, M.; Caesar, J.; et al. Updated analyses of temperature and precipitation extreme indices since the beginning of the twentieth century: The HadEX2 dataset. J. Geophys. Res. Atmos. 2013, 118, 2098–2118. [Google Scholar] [CrossRef]
- Bosilovich, M.G.; Chen, J.; Robertson, F.R.; Adler, R.F. Evaluation of global precipitation in reanalyses. J. Appl. Meteorol. Climatol. 2008, 47, 2279–2299. [Google Scholar] [CrossRef]
- Le Coz, C.; Van De Giesen, N. Comparison of rainfall products over sub-saharan africa. J. Hydrometeorol. 2020, 21, 553–596. [Google Scholar] [CrossRef]
- van der Linden, R.; Knippertz, P.; Fink, A.H.; Ingleby, B.; Maranan, M.; Benedetti, A. The influence of DACCIWA radiosonde data on the quality of ECMWF analyses and forecasts over southern West Africa. Q. J. R. Meteorol. Soc. 2020, 146, 1719–1739. [Google Scholar] [CrossRef] [Green Version]
- Koutsouris, A.J.; Chen, D.; Lyon, S.W. Comparing global precipitation data sets in eastern Africa: A case study of Kilombero Valley, Tanzania. Int. J. Climatol. 2016, 36, 2000–2014. [Google Scholar] [CrossRef]
- Acharya, S.C.; Nathan, R.; Wang, Q.J.; Su, C.-H.; Eizenberg, N. An evaluation of daily precipitation from a regional atmospheric reanalysis over Australia. Hydrol. Earth Syst. Sci. 2019, 23, 3387–3403. [Google Scholar] [CrossRef] [Green Version]
- Jones, B.L.; Carabine, E.; Hickman, A.; Langston, L.; Moosa, S.; Mukanya, R. Exploring the role of climate science in supporting long-term adaptation and decision-making in sub-Saharan Africa; The Climate and Development Knowledge Network, Working Paper. 2014. Available online: https://www.preventionweb.net/publications/view/37331 (accessed on 28 September 2020).
- Maidment, R.I.; Allan, R.P.; Black, E. Recent observed and simulated changes in precipitation over Africa. Geophys. Res. Lett. 2015, 42, 8155–8164. [Google Scholar] [CrossRef]
- Manney, G.L.; Hegglin, M.I.; Lawrence, Z.D.; Wargan, K.; Millán, L.F.; Schwartz, M.J.; Santee, M.L.; Lambert, A.; Pawson, S.; Knosp, B.W.; et al. Reanalysis comparisons of upper tropospheric-lower stratospheric jets and multiple tropopauses. Atmos. Chem. Phys. 2017, 17, 11541–11566. [Google Scholar] [CrossRef] [Green Version]
- Thorne, P.W.; Vose, R.S. Reanalyses suitable for characterizing long-term trends. Bull. Am. Meteorol. Soc. 2010, 91, 353–361. [Google Scholar] [CrossRef] [Green Version]
- Walters, C.K.; Winkler, J.A.; Husseini, S.; Keeling, R.; Nikolic, J.; Zhong, S. Low-level jets in the North American Regional Reanalysis (NARR): A comparison with rawinsonde observations. J. Appl. Meteorol. Climatol. 2014, 53, 2093–2113. [Google Scholar] [CrossRef]
- Zhang, Q.; Körnich, H.; Holmgren, K. How well do reanalyses represent the southern African precipitation? Clim. Dyn. 2013, 40, 951–962. [Google Scholar] [CrossRef]
- Manzanas, R.; Amekudzi, L.K.; Preko, K.; Herrera, S.; Gutiérrez, J.M. Precipitation variability and trends in Ghana: An intercomparison of observational and reanalysis products. Clim. Change 2014, 124, 805–819. [Google Scholar] [CrossRef] [Green Version]
- Egbebiyi, T.S.; Lennard, C.; Crespo, O.; Mukwenha, P.; Lawal, S.; Quagraine, K. Assessing future spatio-temporal changes in crop suitability and planting season over West Africa: Using the concept of crop-climate departure. Climate 2019, 7, 102. [Google Scholar] [CrossRef] [Green Version]
- Sultan, B.; Gaetani, M. Agriculture in West Africa in the twenty-first century: Climate change and impacts scenarios, and potential for adaptation. Front. Plant Sci. 2016, 7, 1–20. [Google Scholar] [CrossRef] [Green Version]
- Sylla, M.B.; Diallo, I.; Pal, S.J. West African Monsoon in State-of-the-Science Regional Climate Models. In Climate Variability—Regional and Thematic Patterns; InTech: London, UK, 2013; pp. 3–36. [Google Scholar]
- Klutse, N.A.B.; Ajayi, V.O.; Gbobaniyi, E.O.; Egbebiyi, T.S.; Kouadio, K.; Nkrumah, F.; Quagraine, K.A.; Olusegun, C.; Diasso, U.J.; Abiodun, B.J.; et al. Potential impact of 1.5 °C and 2 °C global warming on consecutive dry and wet days over West Africa. Environ. Res. Lett. 2018, 13, 1–6. [Google Scholar] [CrossRef]
- Harris, I.; Jones, P.D.; Osborn, T.J.; Lister, D.H. Updated high-resolution grids of monthly climatic observations—The CRU TS3.10 Dataset. Int. J. Climatol. 2014, 34, 623–642. [Google Scholar]
- Becker, A.; Finger, P.; Meyer-Christoffer, A.; Rudolf, B.; Schamm, K.; Schneider, U.; Ziese, M. A description of the global land-surface precipitation data products of the Global Precipitation Climatology Centre with sample applications including centennial (trend) analysis from 1901-present. Earth Syst. Sci. Data 2013, 5, 71–99. [Google Scholar] [CrossRef] [Green Version]
- Schneider, U.; Becker, A.; Finger, P.; Meyer-Christoffer, A.; Ziese, M.; Rudolf, B. GPCC’s new land surface precipitation climatology based on quality-controlled in situ data and its role in quantifying the global water cycle. Theor. Appl. Climatol. 2014, 115, 15–40. [Google Scholar] [CrossRef] [Green Version]
- Diaconescu, E.P.; Gachon, P.; Scinocca, J.; Laprise, R. Evaluation of daily precipitation statistics and monsoon onset/retreat over western Sahel in multiple data sets. Clim. Dyn. 2015, 45, 1325–1354. [Google Scholar] [CrossRef] [Green Version]
- Lorenz, C.; Kunstmann, H. The hydrological cycle in three state-of-the-art reanalyses: Intercomparison and performance analysis. J. Hydrometeorol. 2012, 13, 1397–1420. [Google Scholar] [CrossRef] [Green Version]
- Maidment, R.I.; Grimes, D.; Allan, R.P.; Tarnavsky, E.; Stringer, M.; Hewison, T.; Roebeling, R.; Black, E. Atmospheres And Time series (TARCAT) data set. J. Geophys. Res. Atmos. 2014, 119, 10619–10644. [Google Scholar]
- Funk, C.; Peterson, P.; Landsfeld, M.; Pedreros, D.; Verdin, J.; Shukla, S.; Husak, G.; Rowland, J.; Harrison, L.; Hoell, A.; et al. The climate hazards infrared precipitation with stations—A new environmental record for monitoring extremes. Sci. Data 2015, 2, 150066. [Google Scholar] [CrossRef] [Green Version]
- Hersbach, H.; Bell, B.; Berrisford, P.; Hirahara, S.; Horányi, A.; Muñoz-Sabater, J.; Nicolas, J.; Peubey, C.; Radu, R.; Schepers, D.; et al. The ERA5 global reanalysis. Q. J. R. Meteorol. Soc. 2020, 1–51. [Google Scholar]
- Dee, D.P.; Uppala, S.M.; Simmons, A.J.; Berrisford, P.; Poli, P.; Kobayashi, S.; Andrae, U.; Balmaseda, M.A.; Balsamo, G.; Bauer, P.; et al. The ERA-Interim reanalysis: configuration and performance of the data assimilation system. Q. J. R. Meteorol. Soc. 2011, 137, 553–597. [Google Scholar] [CrossRef]
- Kobayashi, S.; Ota, Y.; Harada, Y.; Ebita, A.; Moriya, M.; Onoda, H.; Onogi, K.; Kamahori, H.; Kobayashi, C.; Endo, H.; et al. The JRA-55 reanalysis: General specifications and basic characteristics. J. Meteorol. Soc. Japan 2015, 93, 5–48. [Google Scholar] [CrossRef] [Green Version]
- Huang, Y.; Dong, X.; Qiu, S.; Xi, B.; Dolinar, E.K.; Stanfield, R.E. Quantifying the uncertainties of reanalyzed Arctic cloud and radiation properties using satellite surface observations. J. Clim. 2017, 30, 8007–8029. [Google Scholar] [CrossRef]
- Bosilovich, M.G.; Robertson, F.R.; Takacs, L.; Molod, A.; Mocko, D. Atmospheric water balance and variability in the MERRA-2 reanalysis. J. Clim. 2017, 30, 1177–1196. [Google Scholar] [CrossRef]
- Gelaro, R.; McCarty, W.; Suárez, M.J.; Todling, R.; Molod, A.; Takacs, L.; Randles, C.A.; Darmenov, A.; Bosilovich, M.G.; Reichle, R.; et al. The modern-era retrospective analysis for research and applications, version 2 (MERRA-2). J. Clim. 2017, 30, 5419–5454. [Google Scholar] [CrossRef] [PubMed]
- Kanamitsu, M.; Ebisuzaki, W.; Woollen, J.; Yang, S.-K.; Hnilo, J.J.; Fiorino, M.; Potter, G.L. NCEP-DOE AMIP-II Renalalysys (R-2). Bull. Am. Meteorol. Soc. 2002, 83, 1631–1643. [Google Scholar] [CrossRef]
- Mann, H.B. Nonparametric Tests Against Trend. Econometrica 1945, 13, 245. [Google Scholar] [CrossRef]
- Kendall, M.G. Rank Correlation Methods, 5th ed.; Griffin, C., Ed.; Oxford University Press: London, UK, 1975; ISBN 978-0195208375. [Google Scholar]
- Van der Walt, S.; Aivazis, M. The NumPy Array: A Structure for Efficient Numerical Computation, Computing in Science & Engineering. Comput. Sci. Eng. 2011, 13, 22–30. [Google Scholar]
- McKinney, W. Data Structures for Statistical Computing in Python. In Proceedings of the 9th Python in Science Conference, Austin, TX, USA, 28 June–3 July 2010; pp. 51–56. [Google Scholar]
- Hoyer, S.; Hamman, J.J. xarray: N-D labeled Arrays and Datasets in Python. J. Open Res. Softw. 2017, 5, 1–6. [Google Scholar] [CrossRef] [Green Version]
- Hunter, J.D. Matplotlib: A 2D graphics environment. Comput. Sci. Eng. 2007, 9, 90–95. [Google Scholar] [CrossRef]
- Maussion, F.; Siller, M.; Rothenberg, D.; Roth, T.; Dusch, M.; Landmann, J. Salem Python Package. Available online: https://zenodo.org/record/1295582 (accessed on 28 September 2020).
- Salack, S.; Klein, C.; Giannini, A.; Sarr, B.; Worou, O.N.; Belko, N.; Bliefernicht, J.; Kunstman, H. Global warming induced hybrid rainy seasons in the Sahel. Environ. Res. Lett. 2016, 11, 104008. [Google Scholar] [CrossRef]
- Fontaine, B.; Bigot, S. West African rainfall deficits and sea surface temperatures. Int. J. Climatol. 1993, 13, 271–285. [Google Scholar]
- Fontaine, B.; Janicot, S. Sea Surface Temperature Fields Associated with West African Rainfall Anomaly Types. J. Clim. 1996, 9, 2935–2940. [Google Scholar] [CrossRef] [Green Version]
- Polo, I.; Lazar, A.; Rodriguez-Fonseca, B.; Arnault, S. Oceanic Kelvin waves and tropical Atlantic intraseasonal variability: 1. Kelvin wave characterization. J. Geophys. Res. Ocean. 2008, 113, 1–18. [Google Scholar] [CrossRef]
- Nkrumah, F. Dynamic Analysis of the West African Monsoon and Its Variability over Ghana. Master’s Thesis, University of Cape Coast, Cape Coast, Ghana, 2014. [Google Scholar]
- Cook, K.H.; Vizy, E.K. Detection and analysis of an amplified warming of the Sahara Desert. J. Clim. 2015, 28, 6560–6580. [Google Scholar] [CrossRef]
- Gaetani, M.; Flamant, C.; Bastin, S.; Janicot, S.; Lavaysse, C.; Hourdin, F.; Braconnot, P.; Bony, S. West African monsoon dynamics and precipitation: the competition between global SST warming and CO2 increase in CMIP5 idealized simulations. Clim. Dyn. 2017, 48, 1353–1373. [Google Scholar] [CrossRef] [Green Version]
- Giannini, A.; Saravanan, R.; Chang, P. Long-term simulation of global dust distribution with the GOCART model: Correlation with North Atlantic Oscillation. Science 2004, 302, 1027–1030. [Google Scholar] [CrossRef] [Green Version]
- Janicot, S. Spatiotemporal Variability of West African Rainfall. Part II: Associated Surface and Airmass Characteristics. J. Clim. 1992, 5, 499–511. [Google Scholar] [CrossRef] [Green Version]
- Lutz, K.; Jacobeit, J.; Rathmann, J. Atlantic warm and cold water events and impact on African west coast precipitation. Int. J. Climatol. 2015, 35, 128–141. [Google Scholar] [CrossRef]
- Losada, T.; Rodríguez-Fonseca, B.; Janicot, S.; Gervois, S.; Chauvin, F.; Ruti, P. A multi-model approach to the Atlantic Equatorial mode: Impact on the West African monsoon. Clim. Dyn. 2010, 35, 29–43. [Google Scholar] [CrossRef]
- Zebiak, S.E. Air-Sea Interaction in the Equitorial Atlantic Region. J. Clim. 1993, 6, 1567–1586. [Google Scholar] [CrossRef]
- Balas, N.; Nicholson, S.E.; Klotter, D. The relationship of rainfall variability in West Central Africa to sea-surface temperature fluctuation. Int. J. Climatol. 2008, 27, 1335–1349. [Google Scholar] [CrossRef]
- Enfield, D.B.; Mestas-Nuñez, A.M.; Mayer, D.A.; Cid-Serrano, L. How ubiquitous is the dipole relationship in tropical Atlantic sea surface temperatures? J. Geophys. Res. Ocean. 1999, 104, 7841–7848. [Google Scholar] [CrossRef]
- Reynolds, R.W.; Rayner, N.A.; Smith, T.M.; Stokes, D.C.; Wang, W. An improved in situ and satellite SST analysis for climate. J. Clim. 2002, 15, 1609–1625. [Google Scholar] [CrossRef]
- Hua, W.; Zhou, L.; Nicholson, S.E.; Chen, H.; Qin, M. Assessing reanalysis data for understanding rainfall climatology and variability over Central Equatorial Africa. Clim. Dyn. 2019, 53, 651–669. [Google Scholar] [CrossRef] [Green Version]
- Xue, Y.; e Sales, F.; Lau, W.K.M.; Boone, A.; Feng, J.; Dirmeyer, P.; Guo, Z.; Kim, K.M.; Kitoh, A.; Kumar, V.; et al. Intercomparison and analyses of the climatology of the West African Monsoon in the West African Monsoon Modeling and Evaluation project (WAMME) first model intercomparison experiment. Clim. Dyn. 2010, 35, 3–27. [Google Scholar] [CrossRef] [Green Version]
- Druyan, L.M.; Fulakeza, M. Downscaling reanalysis over continental Africa with a regional model: NCEP versus ERA Interim forcing. Clim. Res. 2013, 56, 181–196. [Google Scholar] [CrossRef]
- Lin, R.; Zhou, T.; Qian, Y. Evaluation of Global Monsoon Precipitation Changes based on Five Reanalysis Datasets. J. Clim. 2014, 27, 1271–1289. [Google Scholar] [CrossRef]
- Trenberth, K.E.; Fasullo, J.T.; Mackaro, J. Atmospheric moisture transports from ocean to land and global energy flows in reanalyses. J. Clim. 2011, 24, 4907–4924. [Google Scholar] [CrossRef]


| ERA5 | ERA-Interim | JRA-55 | MERRA-2 | NCEP-R2 | |
|---|---|---|---|---|---|
| Model Resolution | TL639 L137 | TL255 L60 | TL319 L60 | 72 sigma levels | T62 |
| Grid spacing (lon × lat) | 0.25° × 0.25° | 0.75° × 0.75° | 1.25° × 1.25° | 0.625° × 0.5° | 2.5° × 2.5° |
| Assimilation method | 4D-Var | 4D-Var | 4D-Var | 3D-Var | 3D-Var |
| Period Used | 1981–2016 | 1981–2016 | 1981–2016 | 1981–2016 | 1981–2016 |
| Reference | [33] | [34] | [35] | [37,38] | [39] |
| Consecutive Dry Years | Consecutive Wet Years |
|---|---|
| 1988, 1998, 1999, 2010 | 1983, 1987, 1997, 2002 |
© 2020 by the authors. Licensee MDPI, Basel, Switzerland. This article is an open access article distributed under the terms and conditions of the Creative Commons Attribution (CC BY) license (http://creativecommons.org/licenses/by/4.0/).
Share and Cite
Quagraine, K.A.; Nkrumah, F.; Klein, C.; Klutse, N.A.B.; Quagraine, K.T. West African Summer Monsoon Precipitation Variability as Represented by Reanalysis Datasets. Climate 2020, 8, 111. https://0-doi-org.brum.beds.ac.uk/10.3390/cli8100111
Quagraine KA, Nkrumah F, Klein C, Klutse NAB, Quagraine KT. West African Summer Monsoon Precipitation Variability as Represented by Reanalysis Datasets. Climate. 2020; 8(10):111. https://0-doi-org.brum.beds.ac.uk/10.3390/cli8100111
Chicago/Turabian StyleQuagraine, Kwesi Akumenyi, Francis Nkrumah, Cornelia Klein, Nana Ama Browne Klutse, and Kwesi Twentwewa Quagraine. 2020. "West African Summer Monsoon Precipitation Variability as Represented by Reanalysis Datasets" Climate 8, no. 10: 111. https://0-doi-org.brum.beds.ac.uk/10.3390/cli8100111