Impact of Climate Change on Vegetation Cover at South Port Sudan Area


Ocean College, Zhejiang University, Zhoushan 316021, China
*
Author to whom correspondence should be addressed.
Climate 2020, 8(10), 114; https://0-doi-org.brum.beds.ac.uk/10.3390/cli8100114
Submission received: 4 September 2020
/
Revised: 4 October 2020
/
Accepted: 6 October 2020
/
Published: 10 October 2020
(This article belongs to the Section Climate and Environment)
Abstract
:Arid regions worldwide, for example, Sudan, are affected by climate change and susceptible to environmental deterioration. In this study, temperature and rainfall data from 1985 to 2015 obtained from the Sudan Meteorological Authority were compared with satellite images of vegetation coverage in southern Port Sudan. The objective of this study was to determine the impact of climate change on the vegetation cover in this area. Results showed significant increases in the annual maximum, minimum and average temperatures with time, and precipitation showed a slight but not significant decrease from 1985 to 2015. The rates of increase for the annual maximum, minimum and average temperatures were 0.08 °C/year, 0.03 °C/year and 0.06 °C/year, respectively, and precipitation decreased at a rate of 0.12 mm/year. Higher shrub abundance and greater water area in 2013, 1995 and 1990 were probably due to high rainfall in the years preceding these years. Decreased shrub abundance in the year 2000 could be due to the significantly higher temperatures after 1998. There was no decreasing trend in shrub coverage from 1985 to 2015, but the overall increase in temperature and decrease in precipitation from 1985 to 2015 indicate a potential threat to vegetation in this area in the future.
1. Introduction
Increasing greenhouse gases, the trapping of these gases in the atmosphere and increasing absorption of energy have resulted in increasing temperatures and climate change [1]. Climate change is a cause for apprehension [2,3], as lives at all levels [4,5] as well as different regions, economic sectors and social groups are affected [6]. In addition, people are displaced by floods, droughts and the submergence of islands [7]. Increased temperatures and fluctuations in precipitation have been common during the past 50 years, and these phenomena are projected to continue [8,9]. Wet regions are becoming wetter, and dry and arid regions are becoming drier. Annual precipitation has increased in the mid and high latitudes of the Northern Hemisphere but has decreased in sub-tropical areas, and droughts have increased in parts of Asia and Africa in recent decades [10]. Land use, temperature increases and droughts have resulted in decreased vegetation coverage, thereby accelerating desertification in arid regions [11] and causing poverty, environmental degradation and loss of biodiversity [12]. As arid, semi-arid and sub-humid zones increase and humid areas decrease, there will be less water in these regions in the future [13]. Arid regions are most vulnerable to extreme hydrological changes and severe droughts [14,15], as well as to human activities such as land use and deforestation [16]. One of the major consequences of climate change, the change in flora composition and land cover [17], will be more pronounced in arid regions [18].
Sudan is located in eastern Africa, one of the most arid regions in the world. Some studies that have been carried out along the Sudanese coastal zone include the determination of seasonal sea level change [19], radioactivity in sediments, changes in seagrass and algae [20] and seasonal variations in chlorophyll [21]. Vegetation coverage off the Sudanese Red Sea coast is highly dynamic and responds to both variations in climate and changes in land use [22,23]. Some examples of studies which determined the changes of meteorological parameters and vegetation cover are as follows: Elagib and Elhag [24] investigated temperature and precipitation changes from the 1940s to 2008 at 14 stations around Sudan and found an increase in the frequency of drought. Dawelbait and Morari [25] analysed Landsat images in 1987 and 2008 and found increased desertification in the Savannah region in Sudan. Sulieman and Elagib [26] compared the temperature, rainfall and aridity index with land cover change in the El-Gedaref region in east Sudan and found an increase in warming and arid areas. Another study determined the factors affecting land cover change in the Erawashda Forest between 1973 and 2015 [27]. However, besides Sulieman and Elagib [26], few studies have investigated the changes in vegetation coverage with meteorological parameters. In this study, rainfall and temperature data from 1985 to 2015 obtained from the Sudanese Meteorological Authority of the Port Sudan station were compared to satellite images of vegetation coverage along the Sudanese Red Sea coastal plain to the south of Port Sudan. The purpose of this study was to determine the impact of climate change on vegetation coverage in the area.
2. Materials and Methods
2.1. Study Area
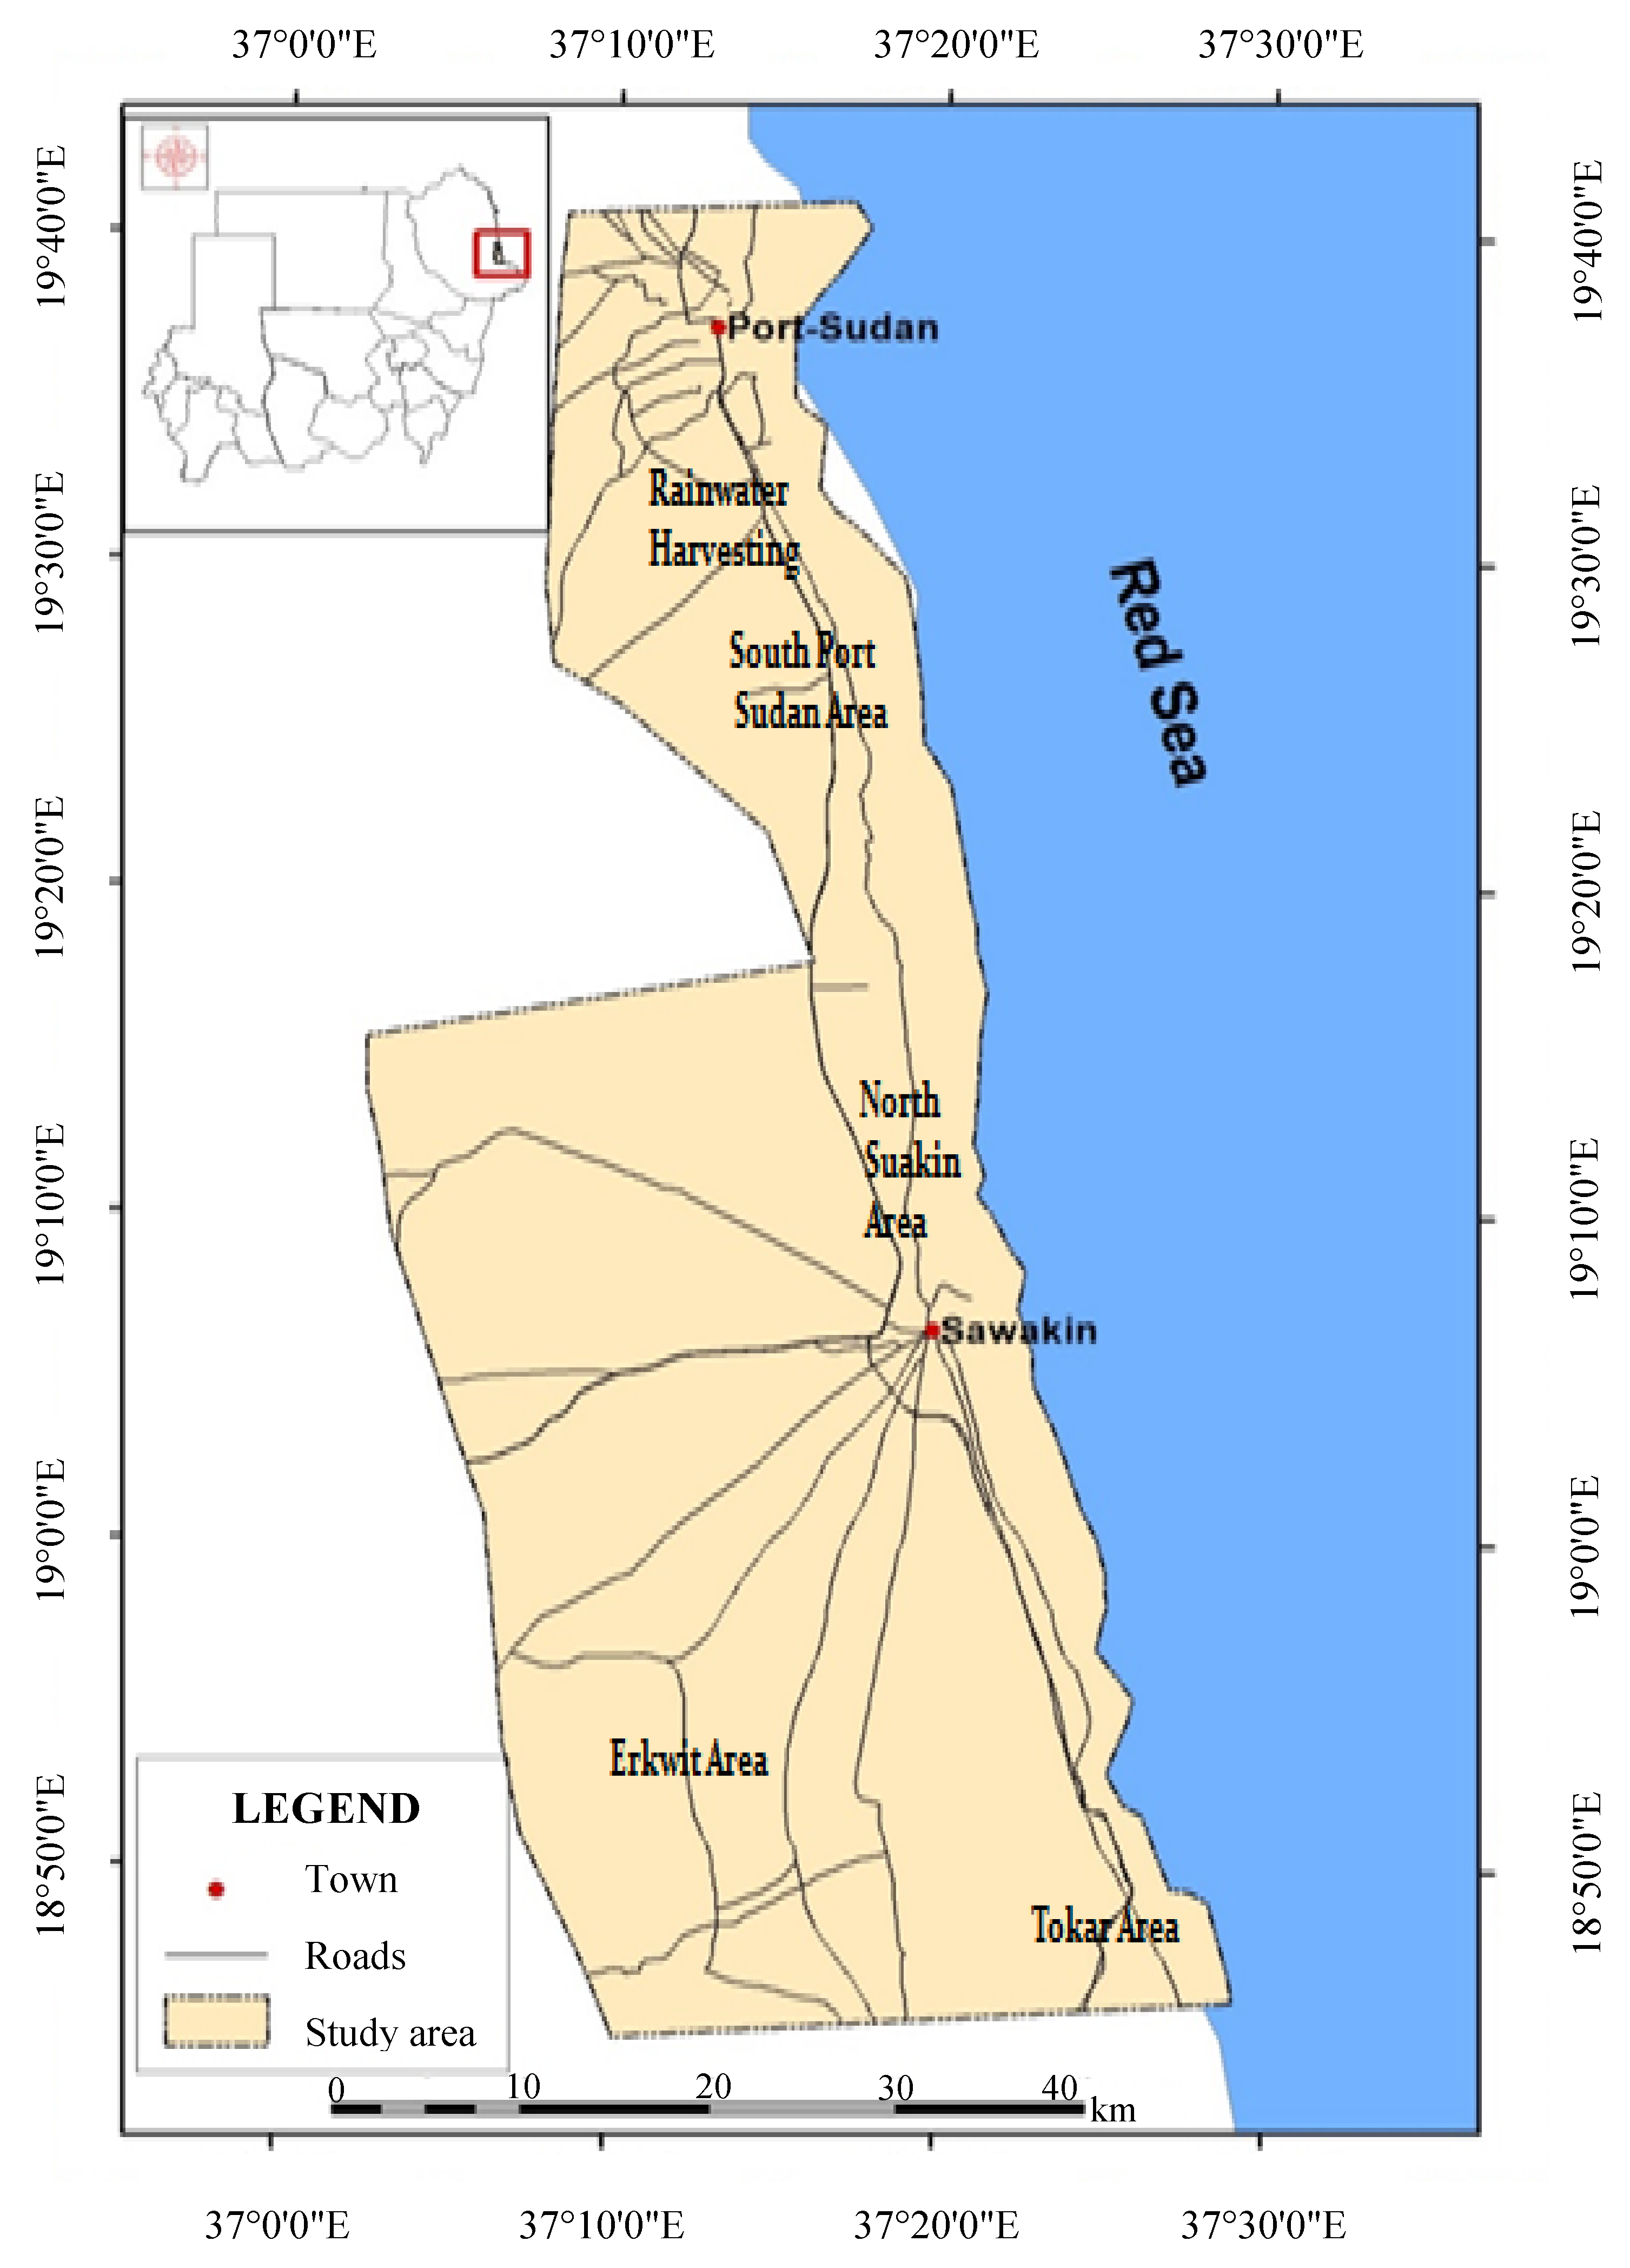
The study area is located south of Port Sudan, and it is approximately 180 km long and 40 km wide (Figure 1). The Sudanese Red Sea coastline is approximately 750 km long. The coastal plain is a narrow and mostly semi-desert region that is sparsely populated, except for a few villages and the cities of Port Sudan and Suakin. Port Sudan is the major seaport in the country, where most of the industrial and economic activities are concentrated [28]. The coastline has many estuaries, inland bays and lagoons [29]. The climate along the coast is very dry, with rainfall amounts varying between 39 mm at Halayib (northern Sudanese Red Sea coast) and 164 mm at Suakin Harbour (southern coast) and a mean annual rainfall of approximately 111 mm [30]. Precipitation usually occurs in the winter months, from October to January. The warmest month of the year along the coastal plain is August, with average daily maximum and minimum temperatures of 41 °C and 30 °C, respectively. The coolest month is January, with average daily maximum and minimum temperatures of 27 °C and 20 °C, respectively [28].
2.2. Assessment Methods
2.2.1. Data Sources
Monthly rainfall and temperature data from 1985 to 2015 were obtained from the Sudan Meteorological Authority (Port Sudan station).
2.2.2. Data Analyses
The maximum, minimum and annual temperatures and rainfall amounts were averaged from monthly values for each year; the annual values are presented in Table 1. The average maximum, minimum and annual temperatures and average annual precipitation were plotted against years from 1985 to 2015. The slopes of these plots represent the rates of increase or decrease in the maximum, minimum and annual temperatures and precipitation. Linear regression analyses were used to determine the significances of the relationships of temperature and precipitation with time. The Mann-Kendall test was used to determine whether the temperature and precipitation patterns showed an upward or downward trend. The Sen’s slope method was then used to test the magnitude of the Mann-Kendall trend. The statistics for both methods were based on Byakatonda et al. [31]. Temperature and precipitation anomalies were calculated using this formula: [Ʃ (X1 − AV) + (X2 − AV) + (X3 − AV) + …]/31, where X represents the annual value for temperature or precipitation and AV represents the average values for temperature and precipitation over the 31 years. Although the weather station from which the meteorological data were obtained was not located at the centre of the study area, we presumed the temperature and rainfall profiles of the 180 km long and 40 km wide area south of Port Sudan would not be very different.
2.2.3. Remote Sensing
Seven remotely sensed datasets, for 1985, 1990, 1995, 2000, 2003, 2013 and 2015, which fall within Path 171 Row 46 and Path 171 Row 47, were downloaded from the U.S. Geological Survey (USGS) Earth Explorer Landsat Archive. Erdas Imagine 9.2 was used in the pre-processing and classification (unsupervised) work. During the layer stacking of the bands of every period interval, the bands used for Landsat 5 were 1, 2, 3 and 4, and those used for Landsat 8 were 2, 3, 4 and 5. The unsupervised classification method was then used to identify and classify the signature areas, such as those with bare land, shrubs, water and mountains. ArcGIS 10.2 was used for the final classification of the map layouts.
3. Results
3.1. Temperature and Rainfall
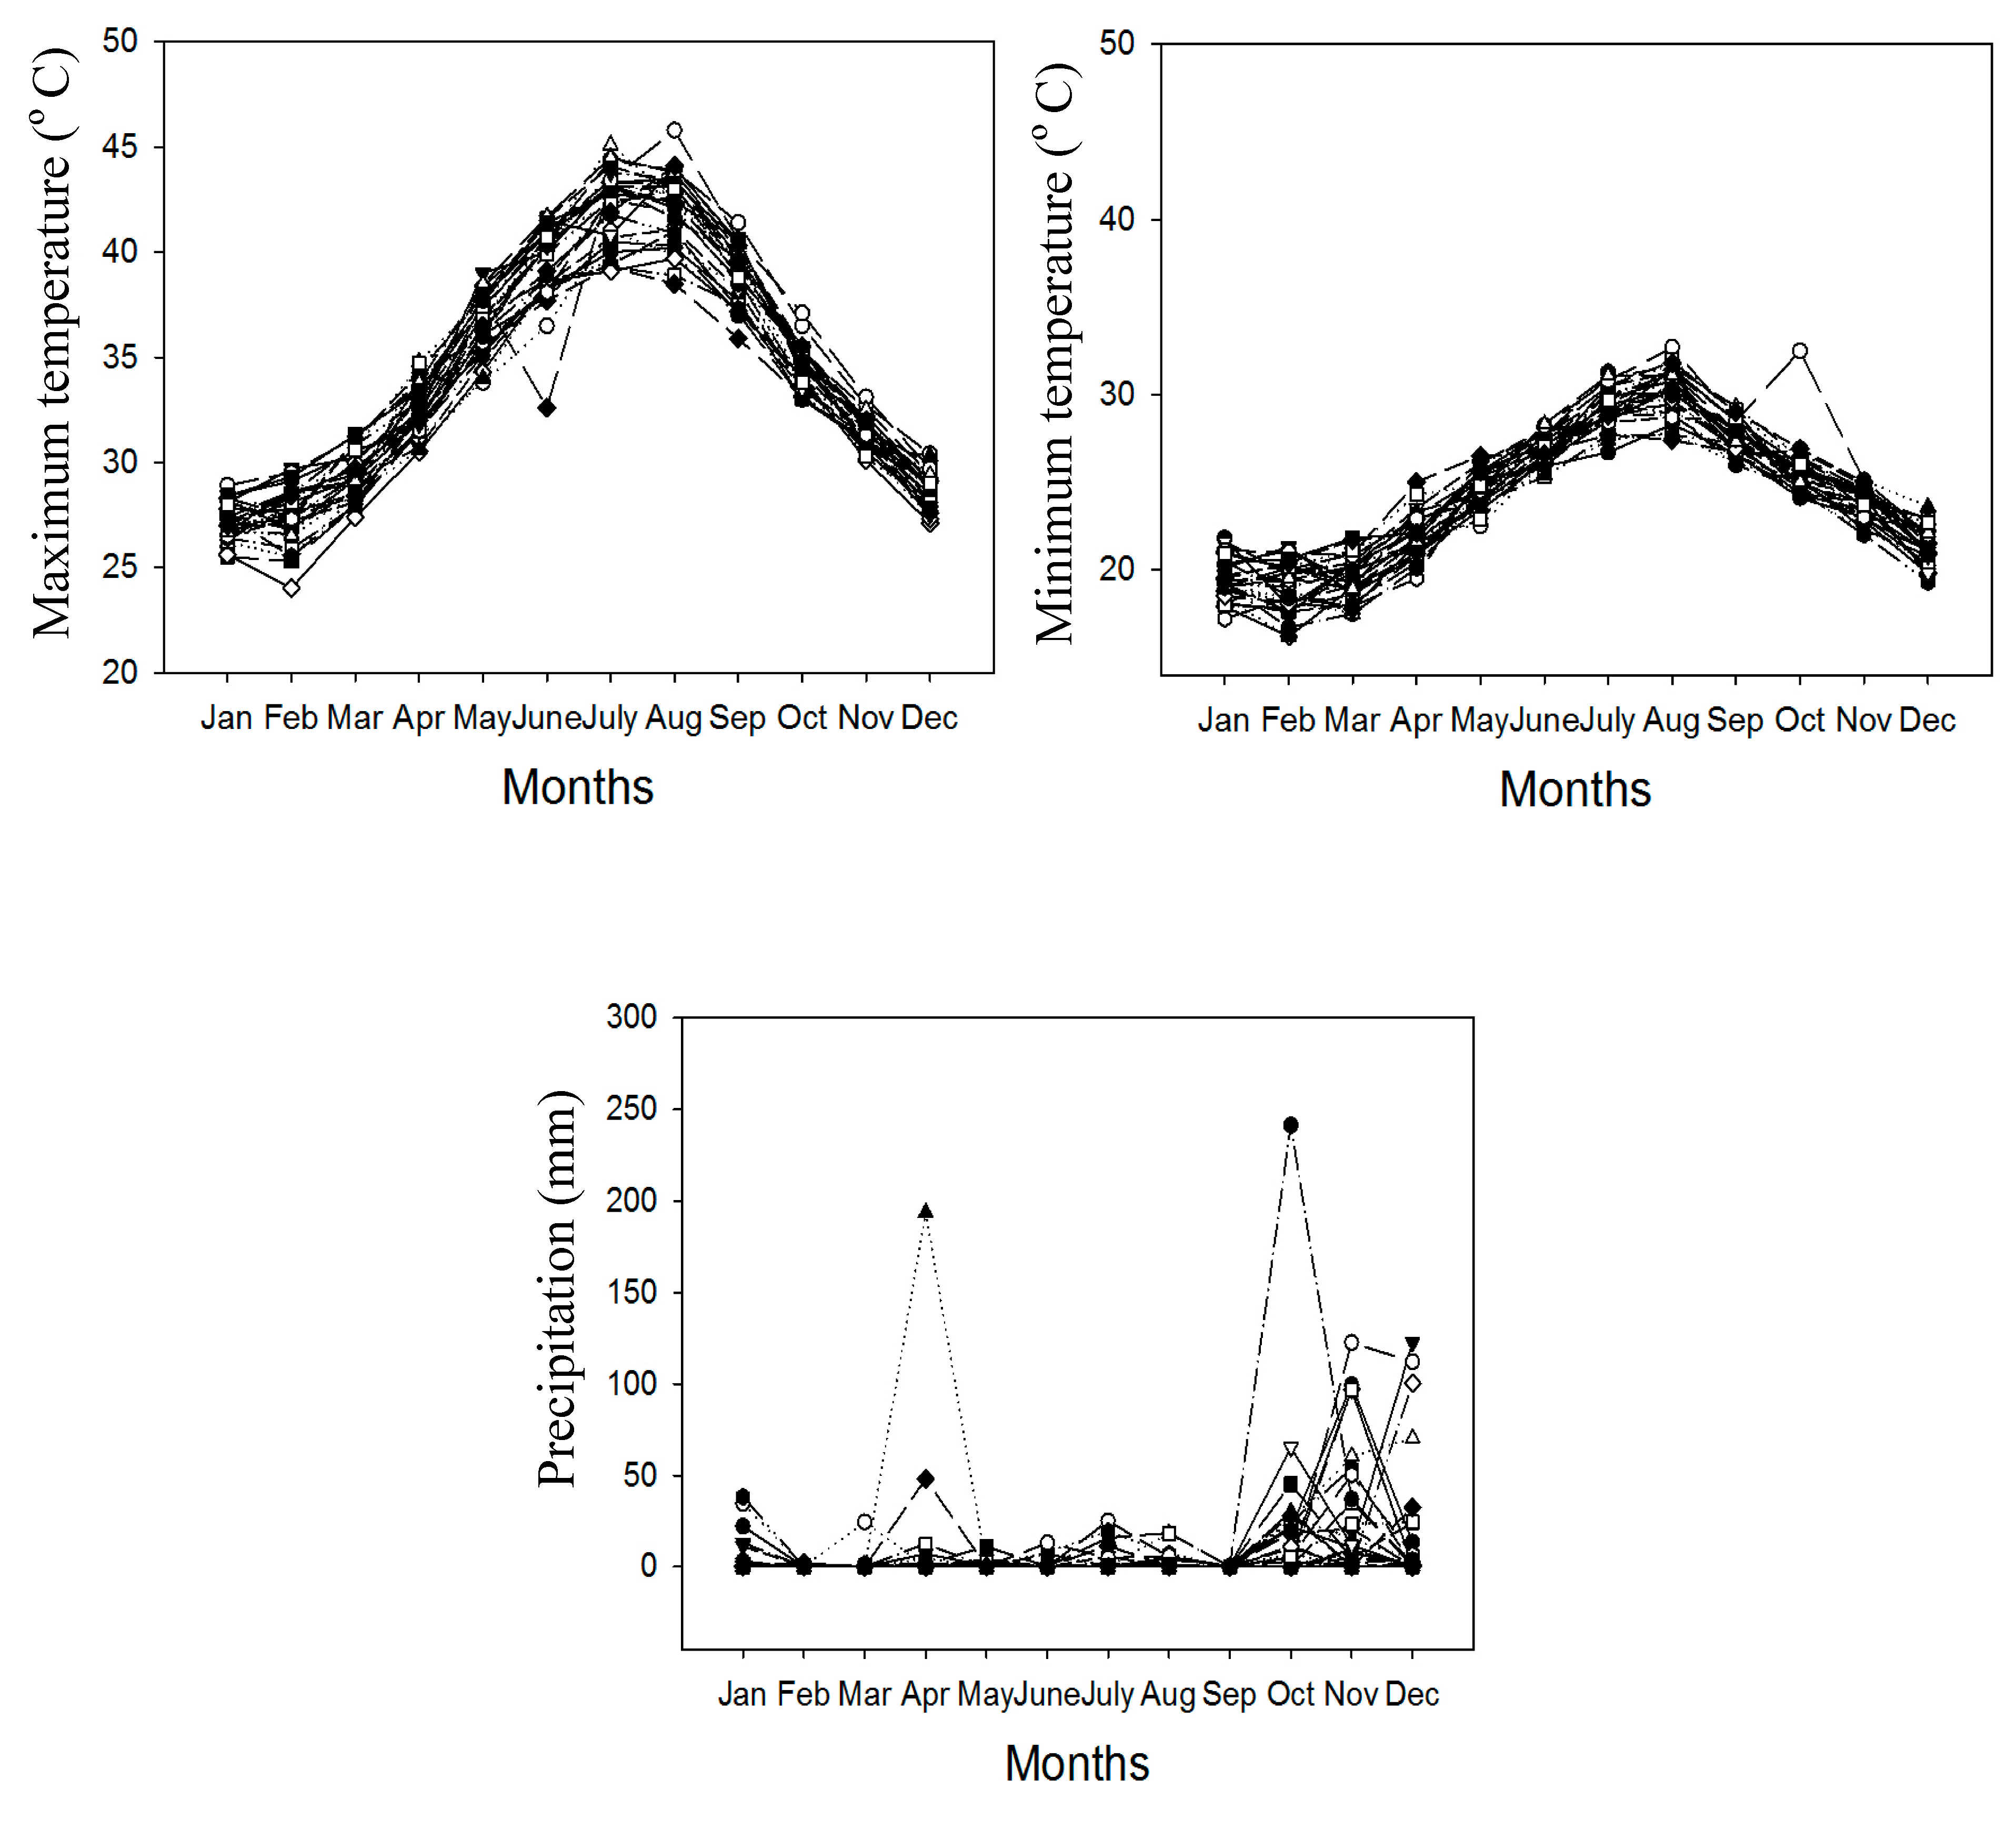
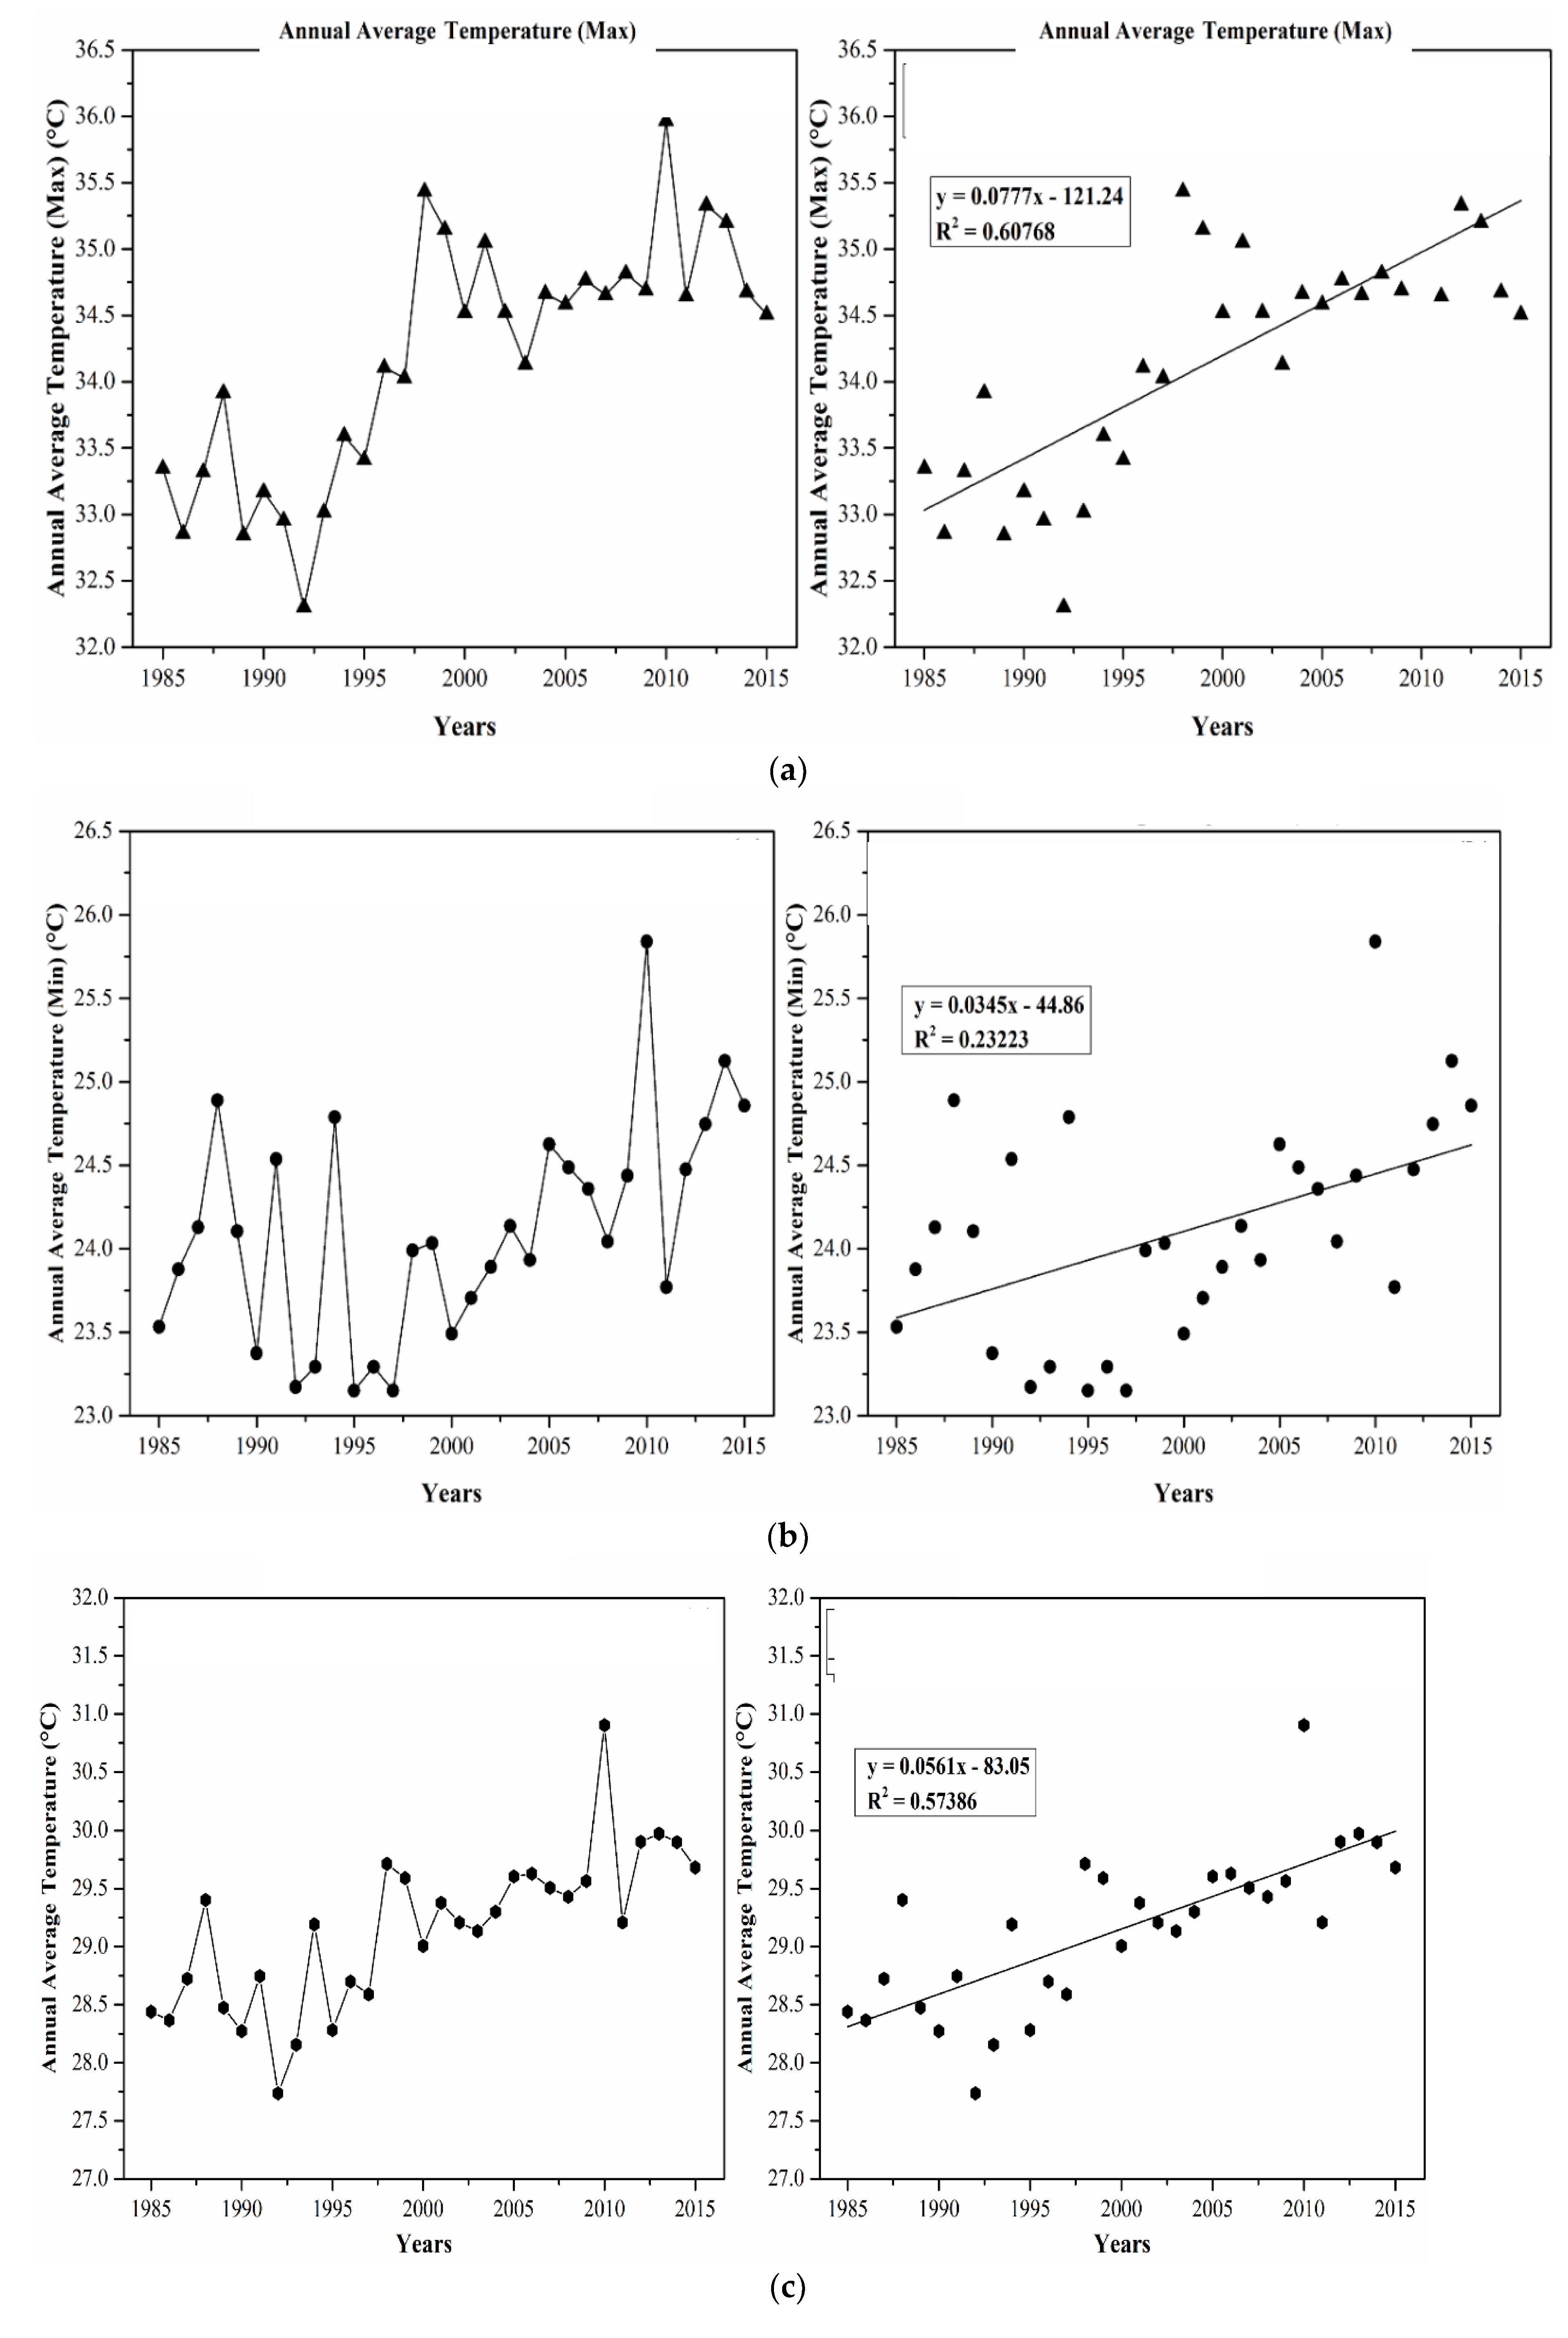
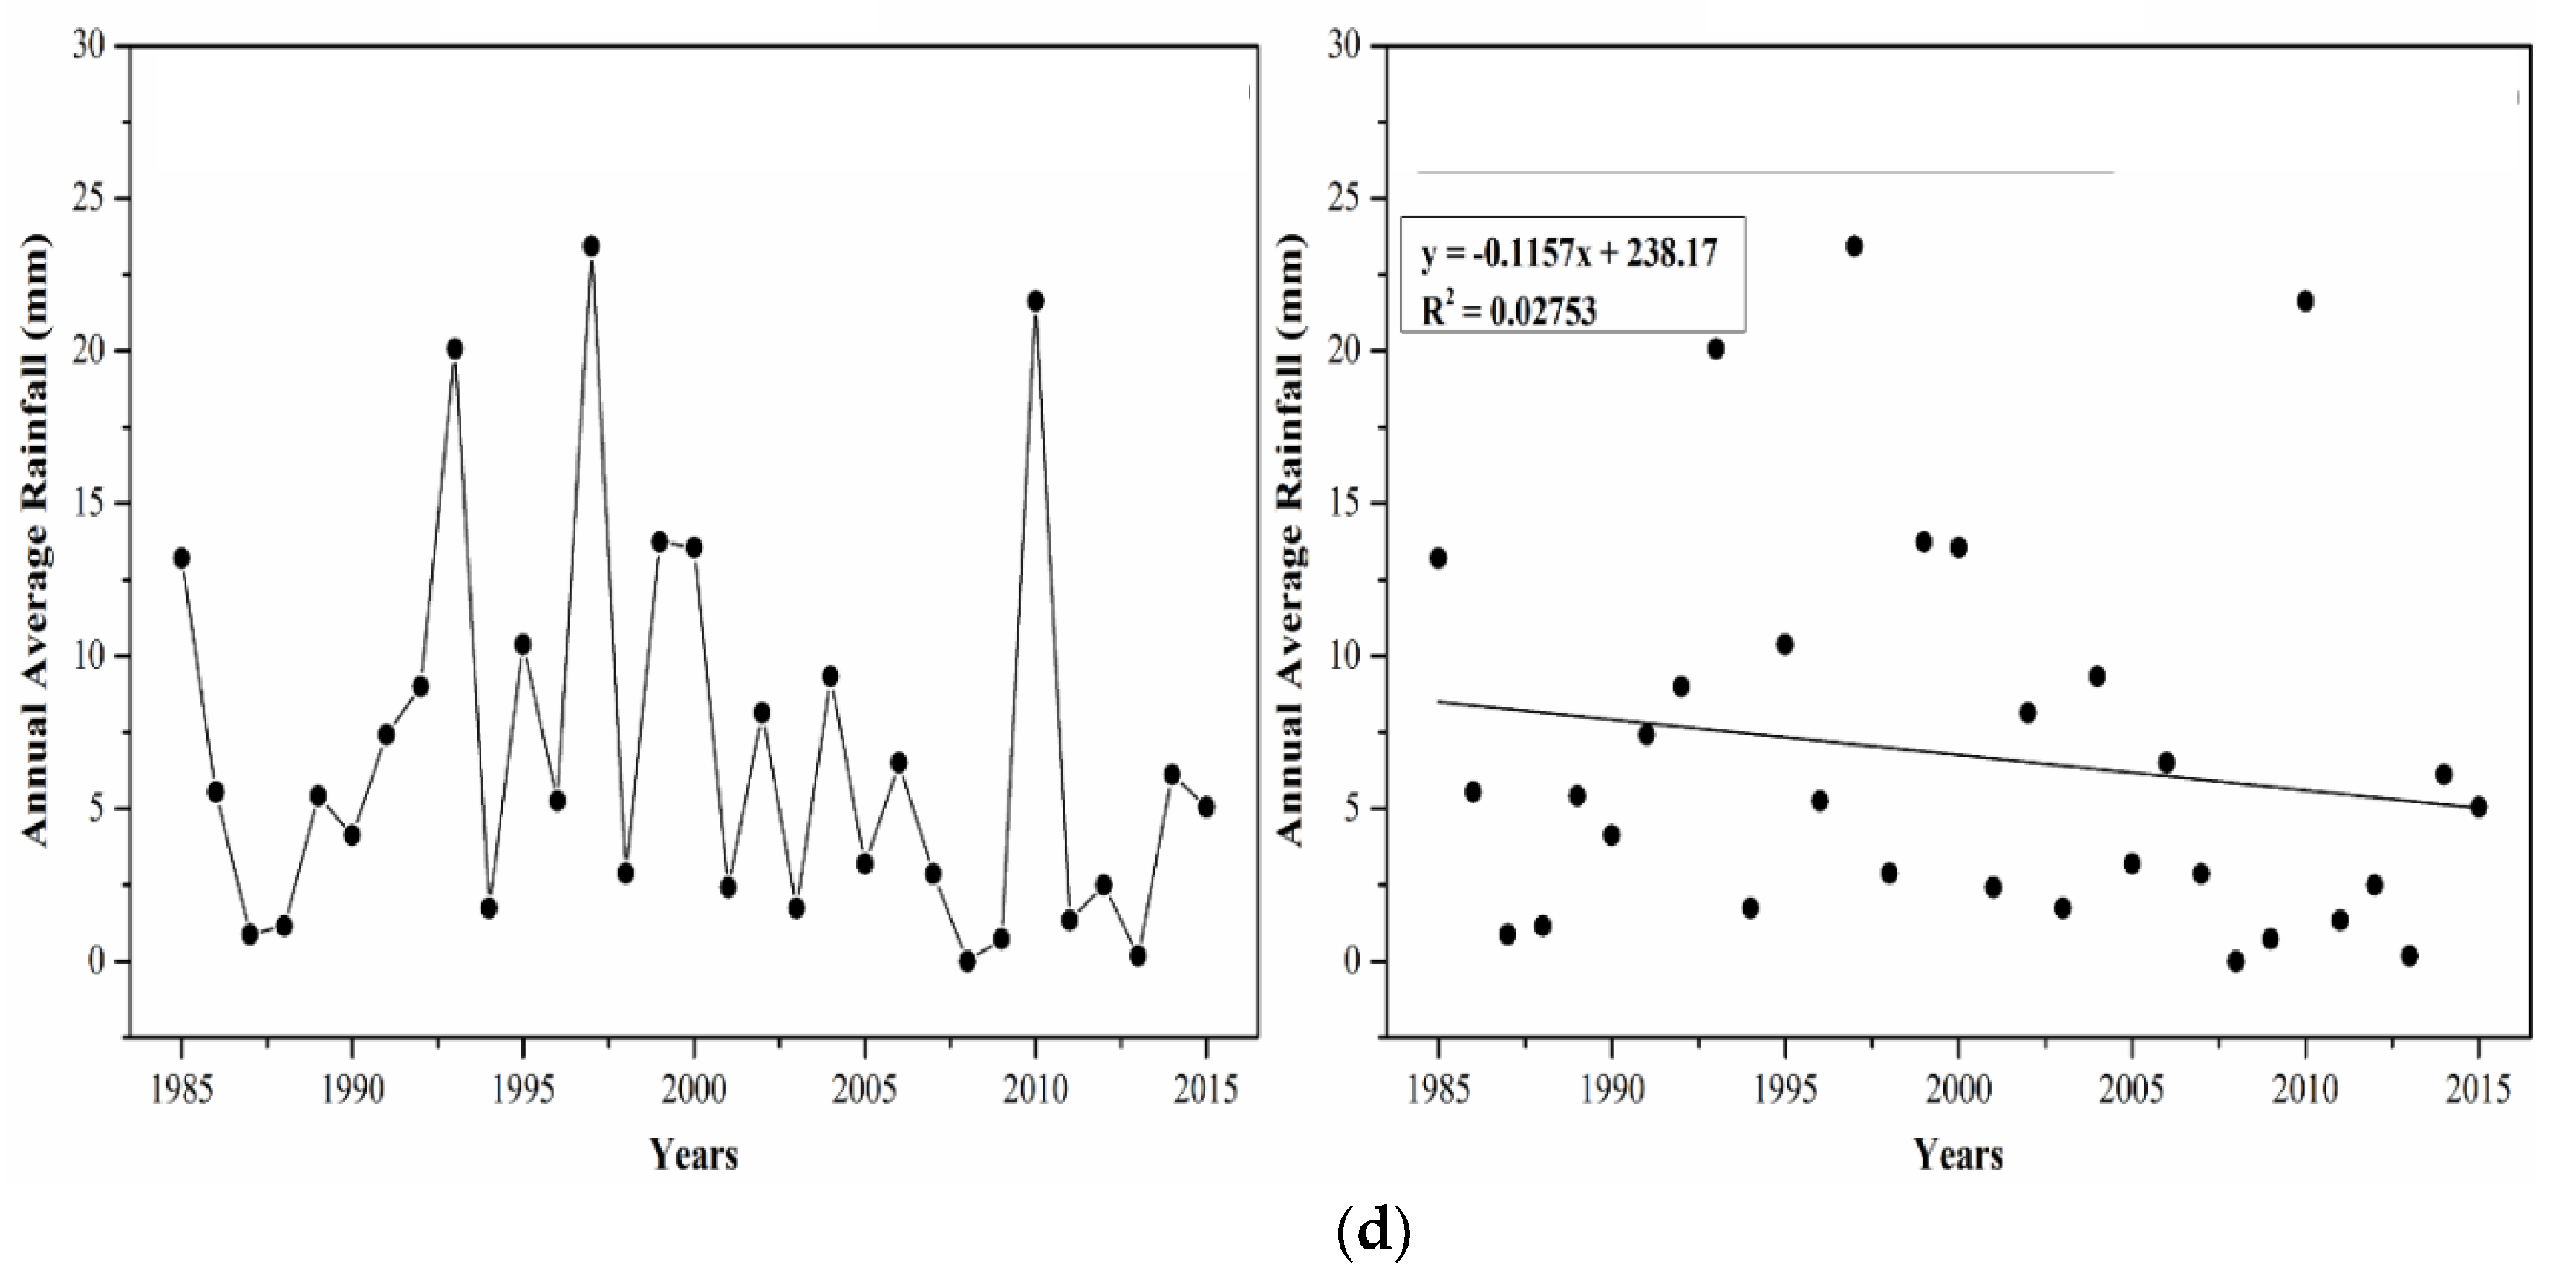
Complete temperature and rainfall results are presented in the Appendix A (Table A1, Table A2 and Table A3). The monthly changes of maximum and minimum temperatures and precipitation, from 1985 to 2015, showed that temperature and precipitation pattern were attributable to the annual seasonal pattern (Figure 2). The annual maximum, minimum and average temperatures showed gradual increases from 1985 to 2015. The annual maximum temperatures showed a distinct trend: they were below 34.1 °C before 1997 and above 34.1 °C after 1997 (Figure 3a). Hence, the maximum temperatures from 1985 to 1997, which ranged from 32.3 °C to 34.1 °C, were significantly lower than the maximum temperatures from 1998 to 2015, which ranged from 34.1 °C to 36 °C (single-factor ANOVA: p < 0.05). The annual minimum temperatures showed greater fluctuations before 1997. After 1997, the annual minimum temperatures increased gradually into 2015 (Figure 3b). Similar to the annual maximum and minimum temperatures, the annual average temperature also showed a gradual increase from 1985 to 2015. The highest annual maximum temperature of 36.0 °C (Figure 3a) and the highest minimum temperature of 25.8 °C (Figure 3b) were detected in 2010; the year 2010 also showed the highest annual mean temperature of 31.0 °C, while the lowest annual average temperature of 27.7 °C occurred in 1992 (Figure 3c). The highest mean precipitation amount of 23.8 mm occurred in 1997, followed by 21.6 mm in 2010 and 20.1 mm in 1993, while 2008 and 2013 had the lowest rainfall amount (0.2 mm). Rainfall showed considerable variation between 1985 and 1997. After the highest precipitation in 1997, rainfall started to decrease gradually towards 2009, just before the drastic increase in 2010, which was followed by low rainfall similar to that in the preceding years (Figure 3d).
There was a significant positive relationship between the annual maximum temperatures and years (Figure 3a); there was a weaker but significant relationship between the annual minimum temperatures and years (Figure 3b); and annual mean temperatures and years also showed a significant positive relationship (Figure 3c; linear regression analyses: p < 0.05). On the other hand, the correlation coefficient for precipitation versus years was rather weak (p > 0.05; Figure 3d). Thus, there was a negative correlation between the average annual rainfall and average annual temperature (p > 0.05; Table 1). The slopes of these relationships indicated that the maximum, minimum and average annual temperatures were increasing at rates of 0.08 °C/year, 0.03 °C/year and 0.06 °C/year, respectively, and precipitation decreased at a rate of 0.12 mm/year (Figure 3). This was confirmed by results of the Mann-Kendall test, which showed positive values of Zw for maximum (4.39), minimum (2.69) and mean annual (4.56) temperatures, indicating upward trends and a negative Zw value for precipitation (−1.19), indicating a downward trend (Table 2). Moreover, the anomalies also showed increasing trends for the maximum, minimum and annual temperatures and decreasing trend for precipitation (Table 3).
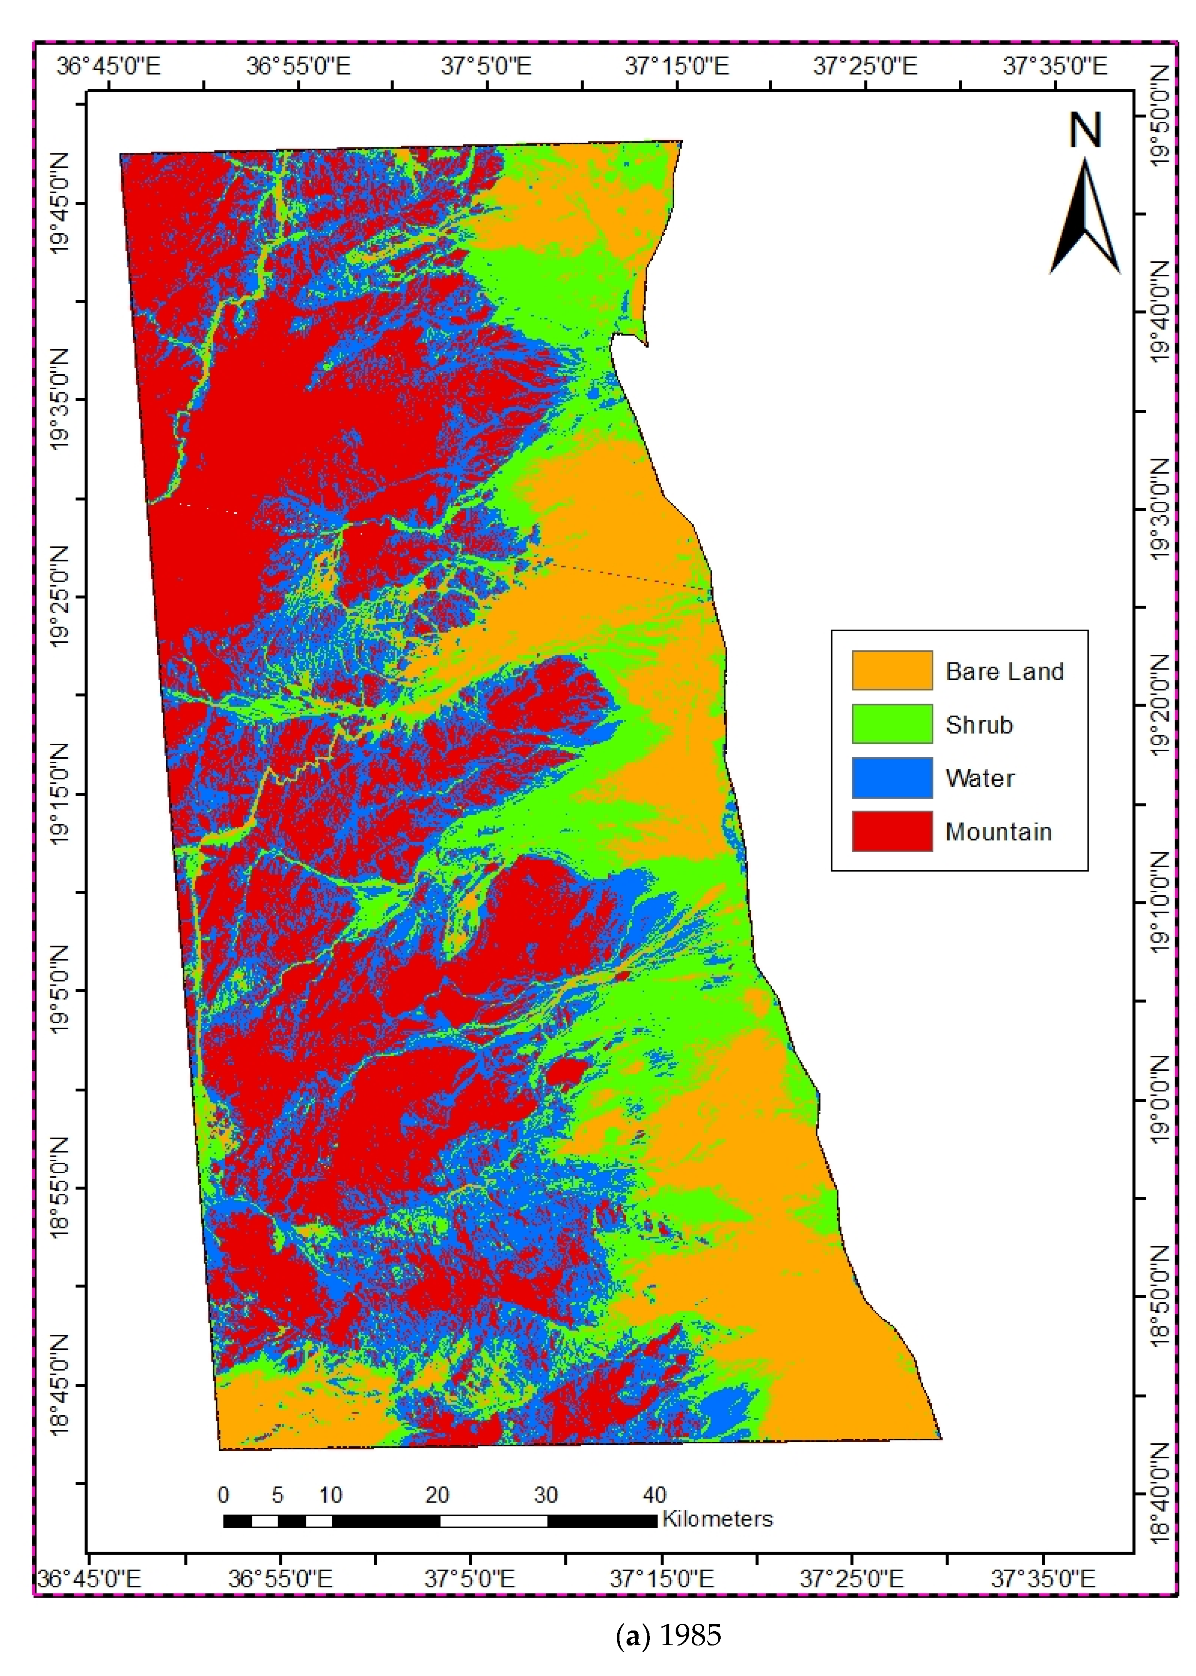
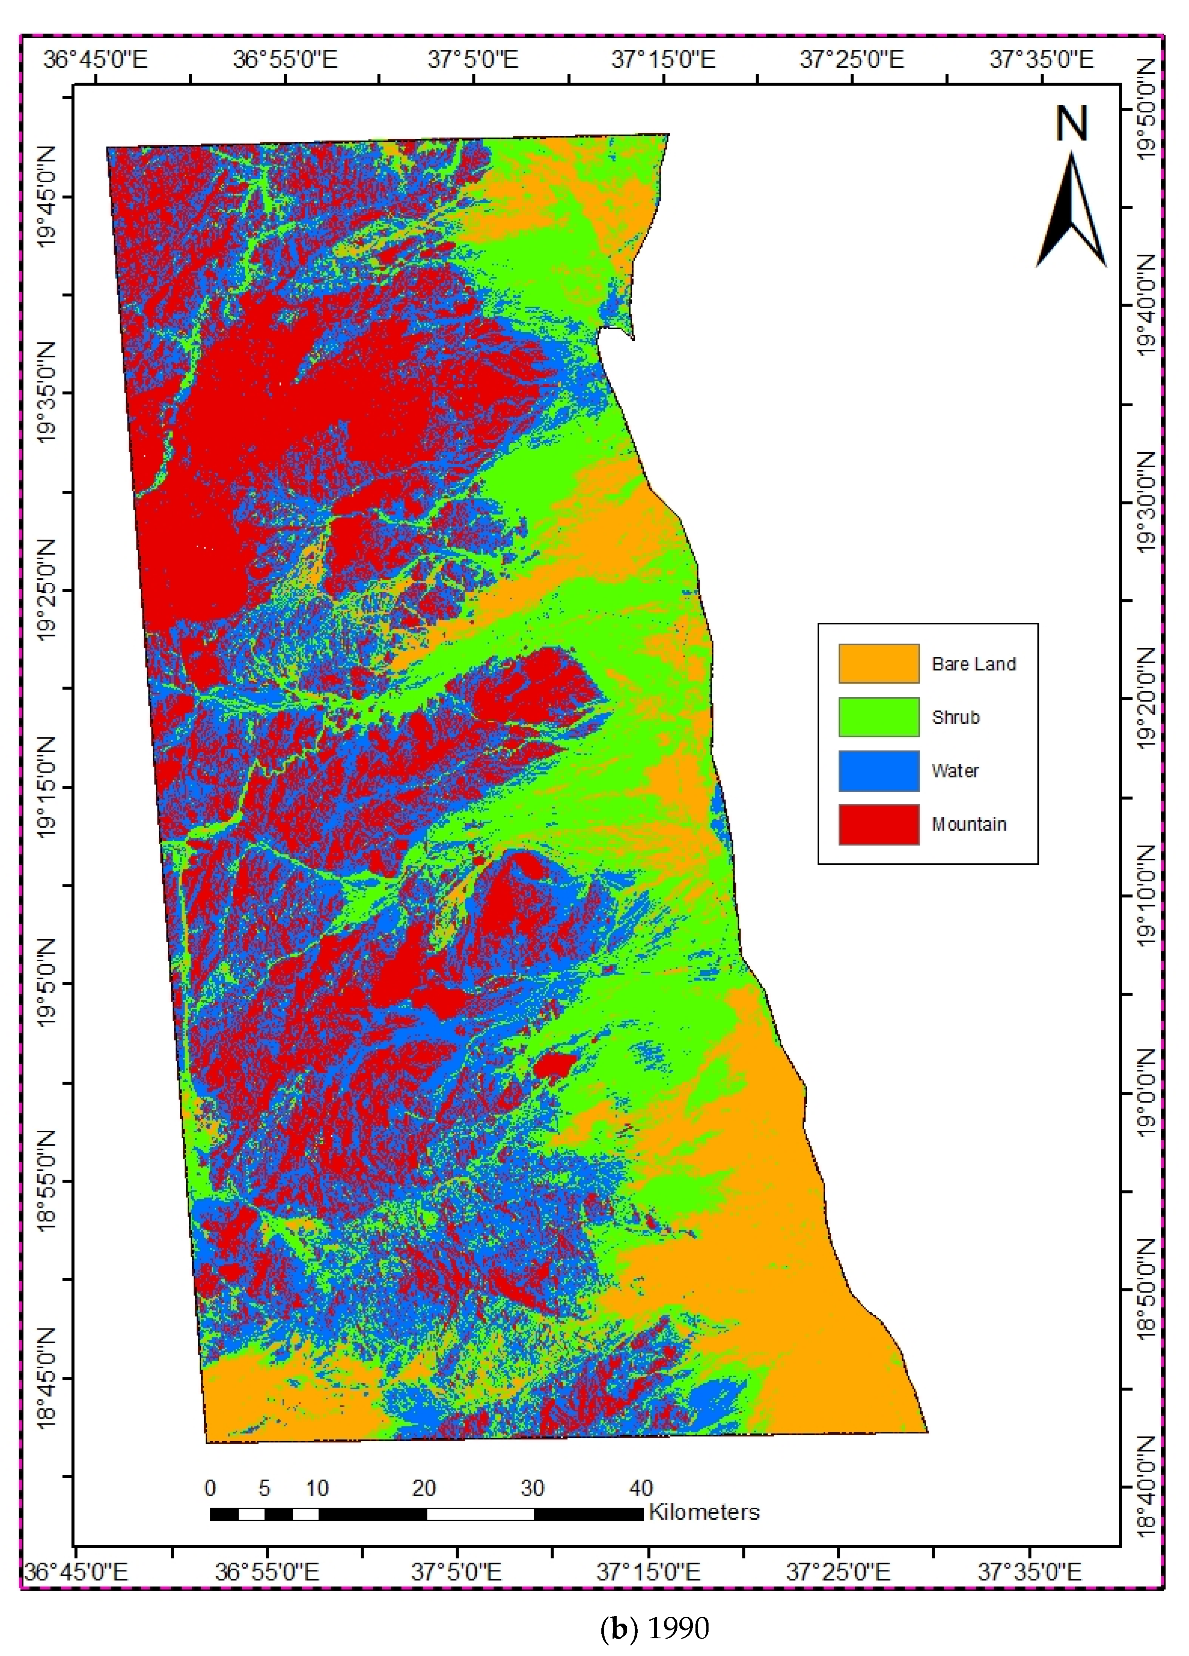
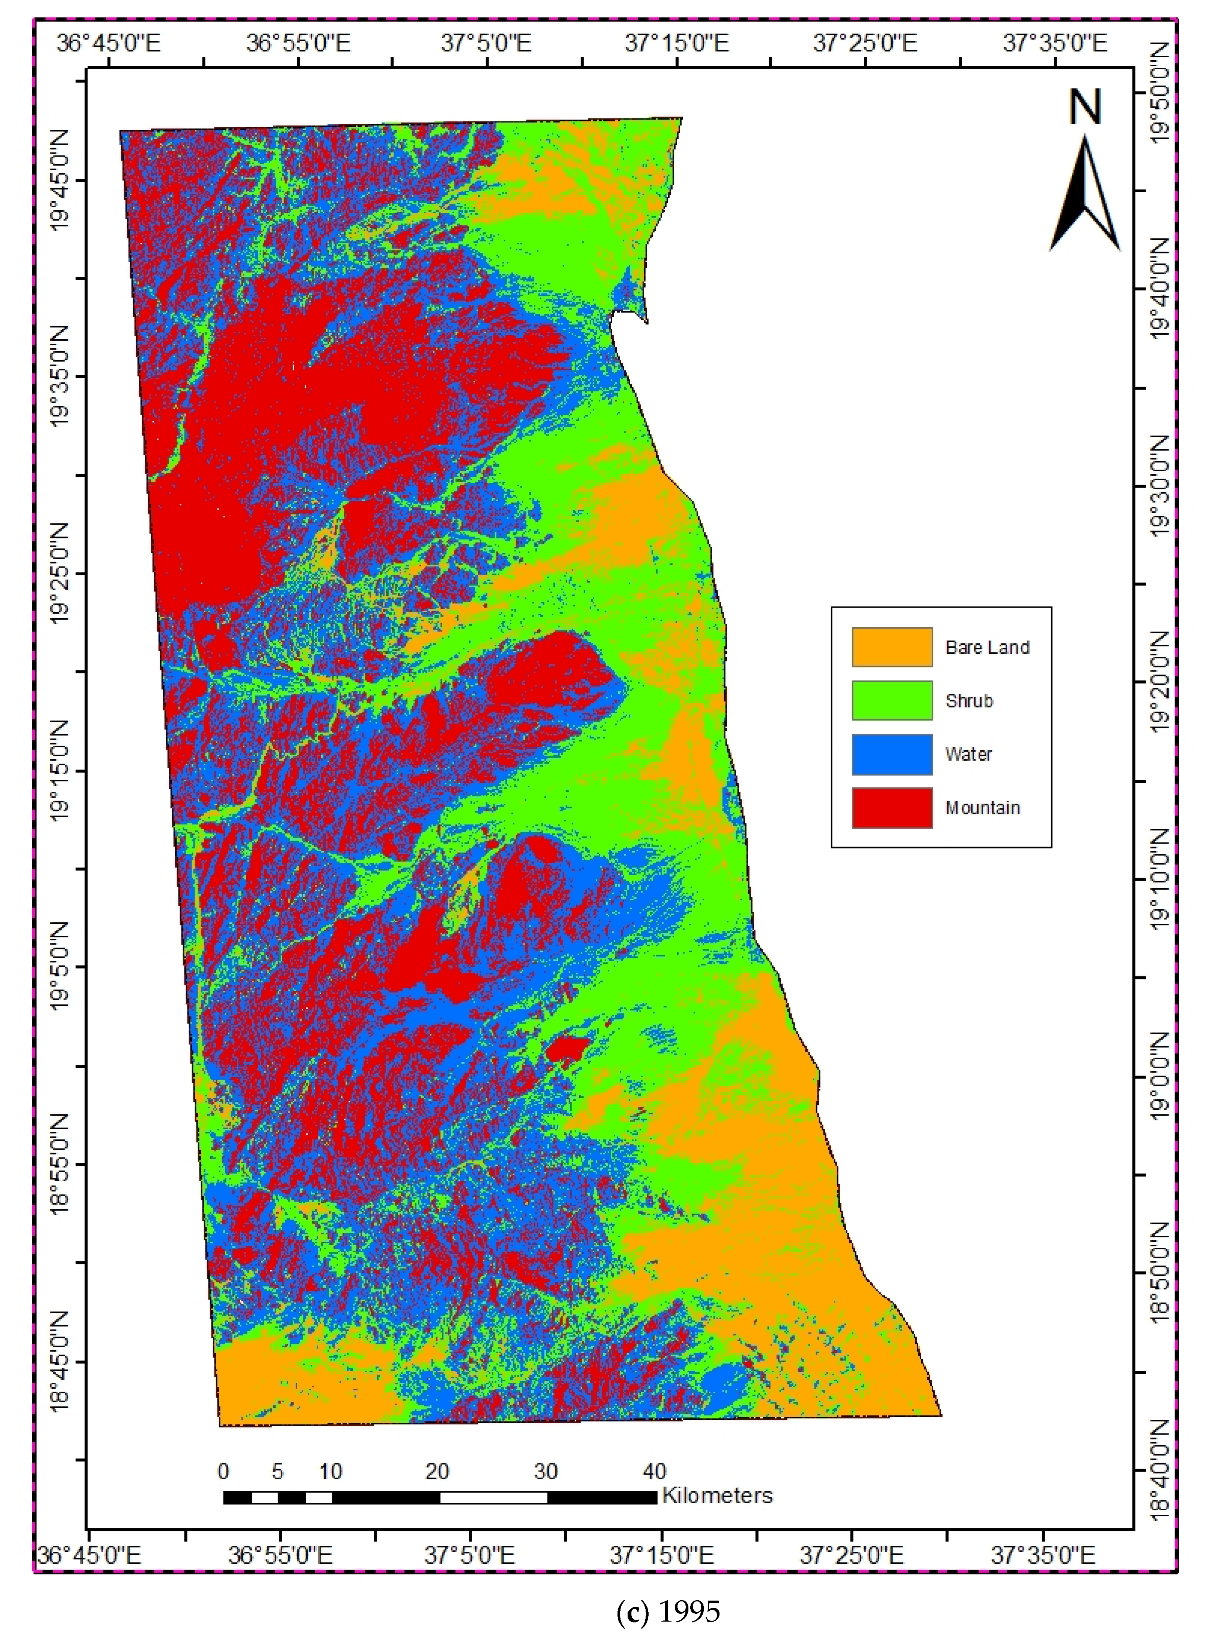
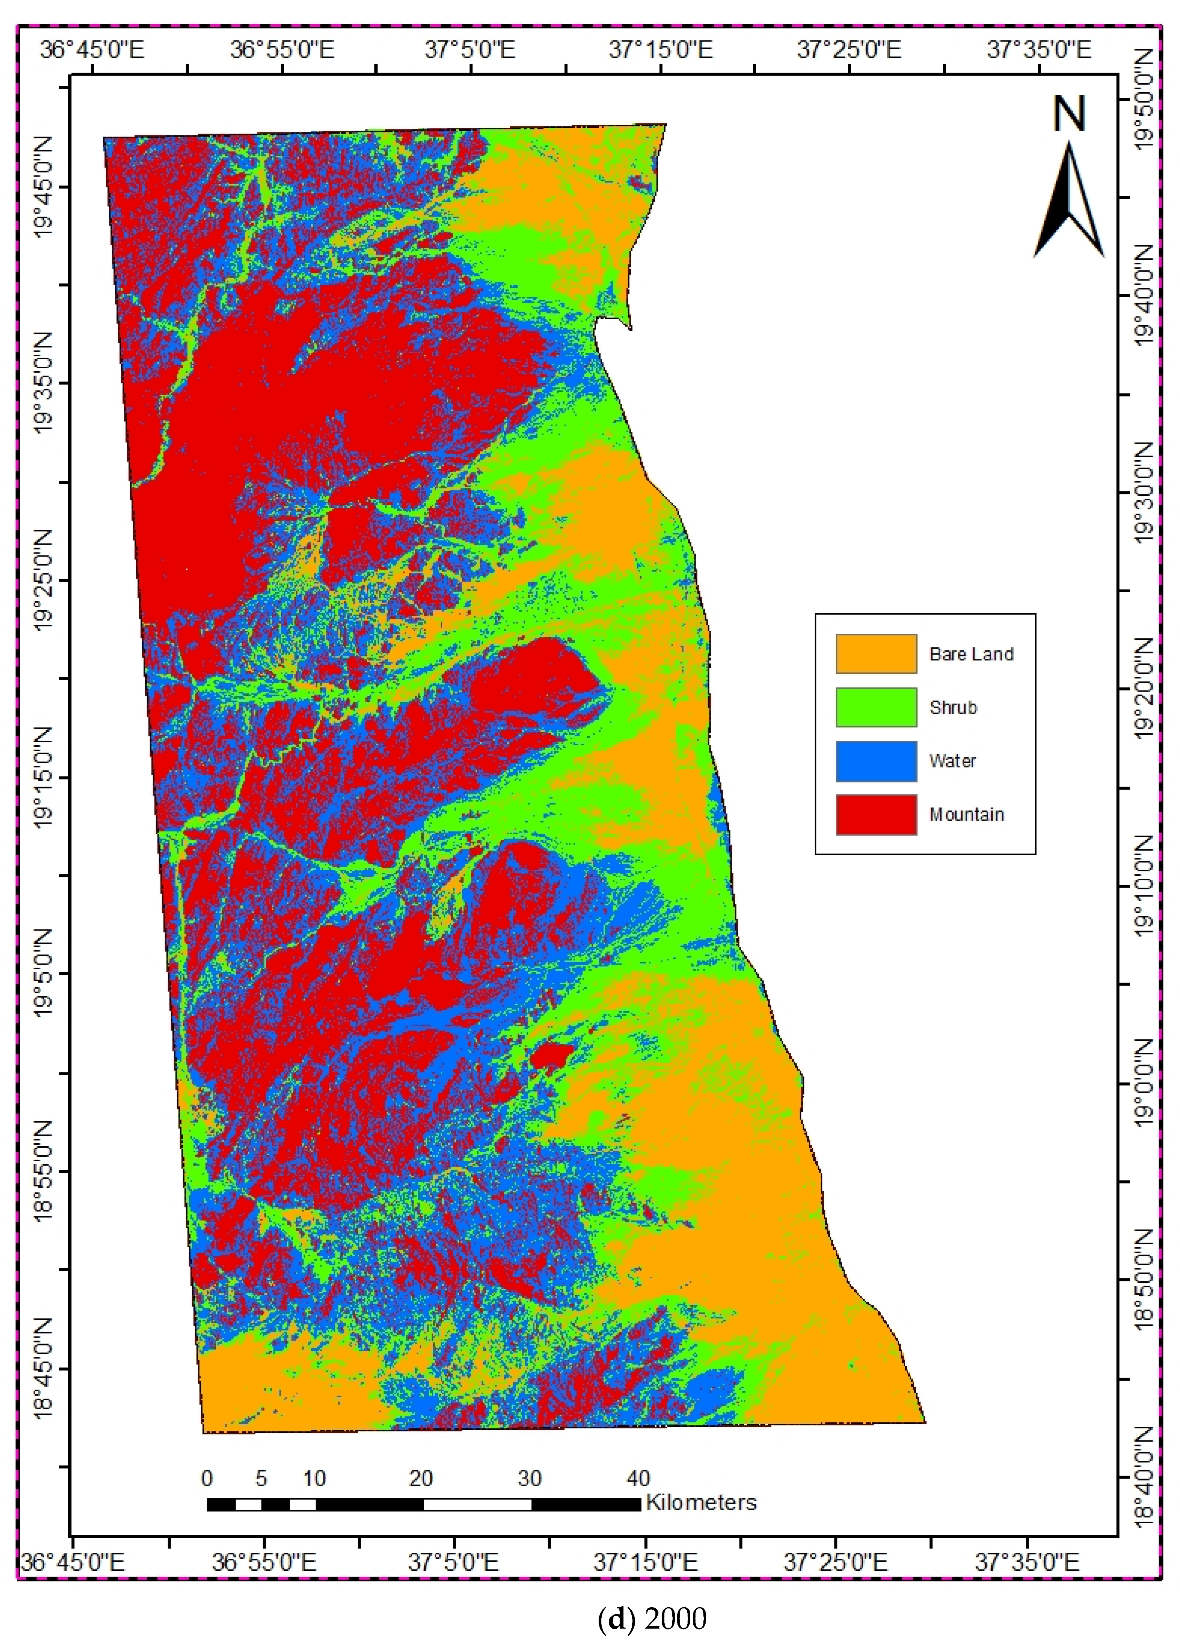
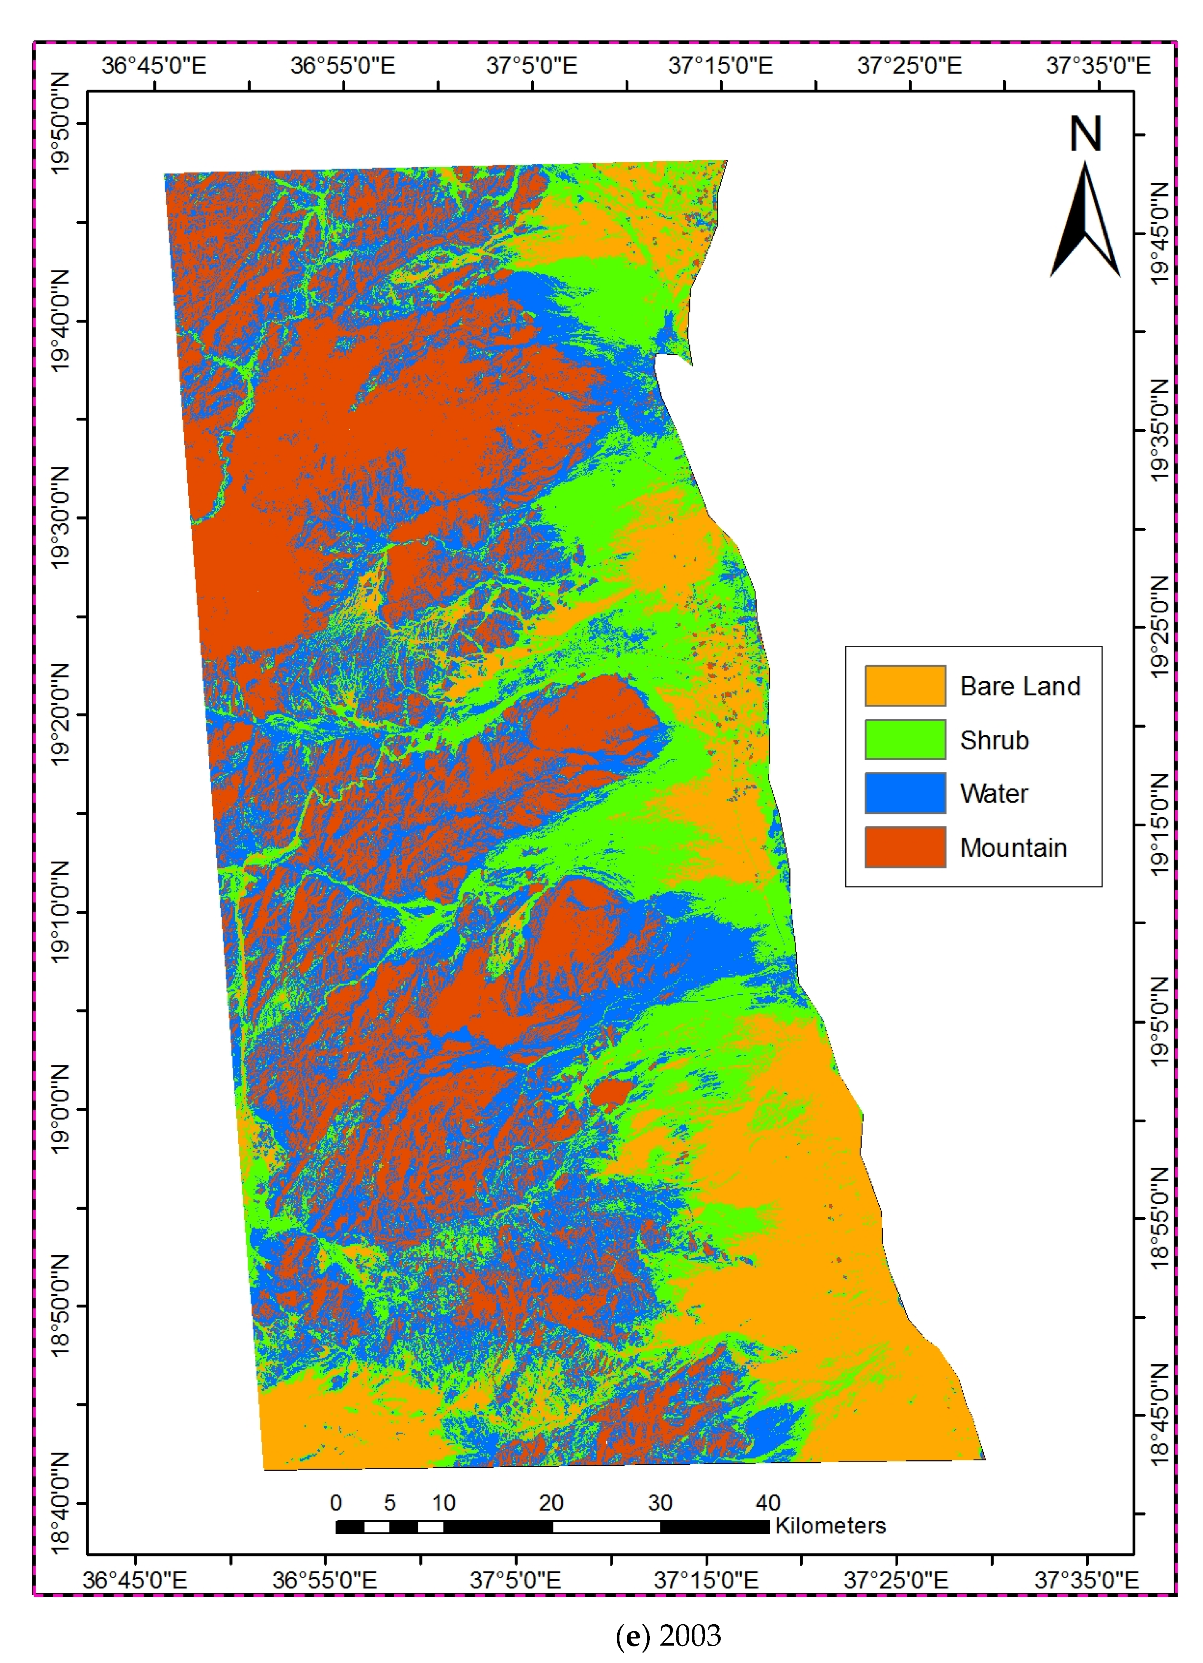
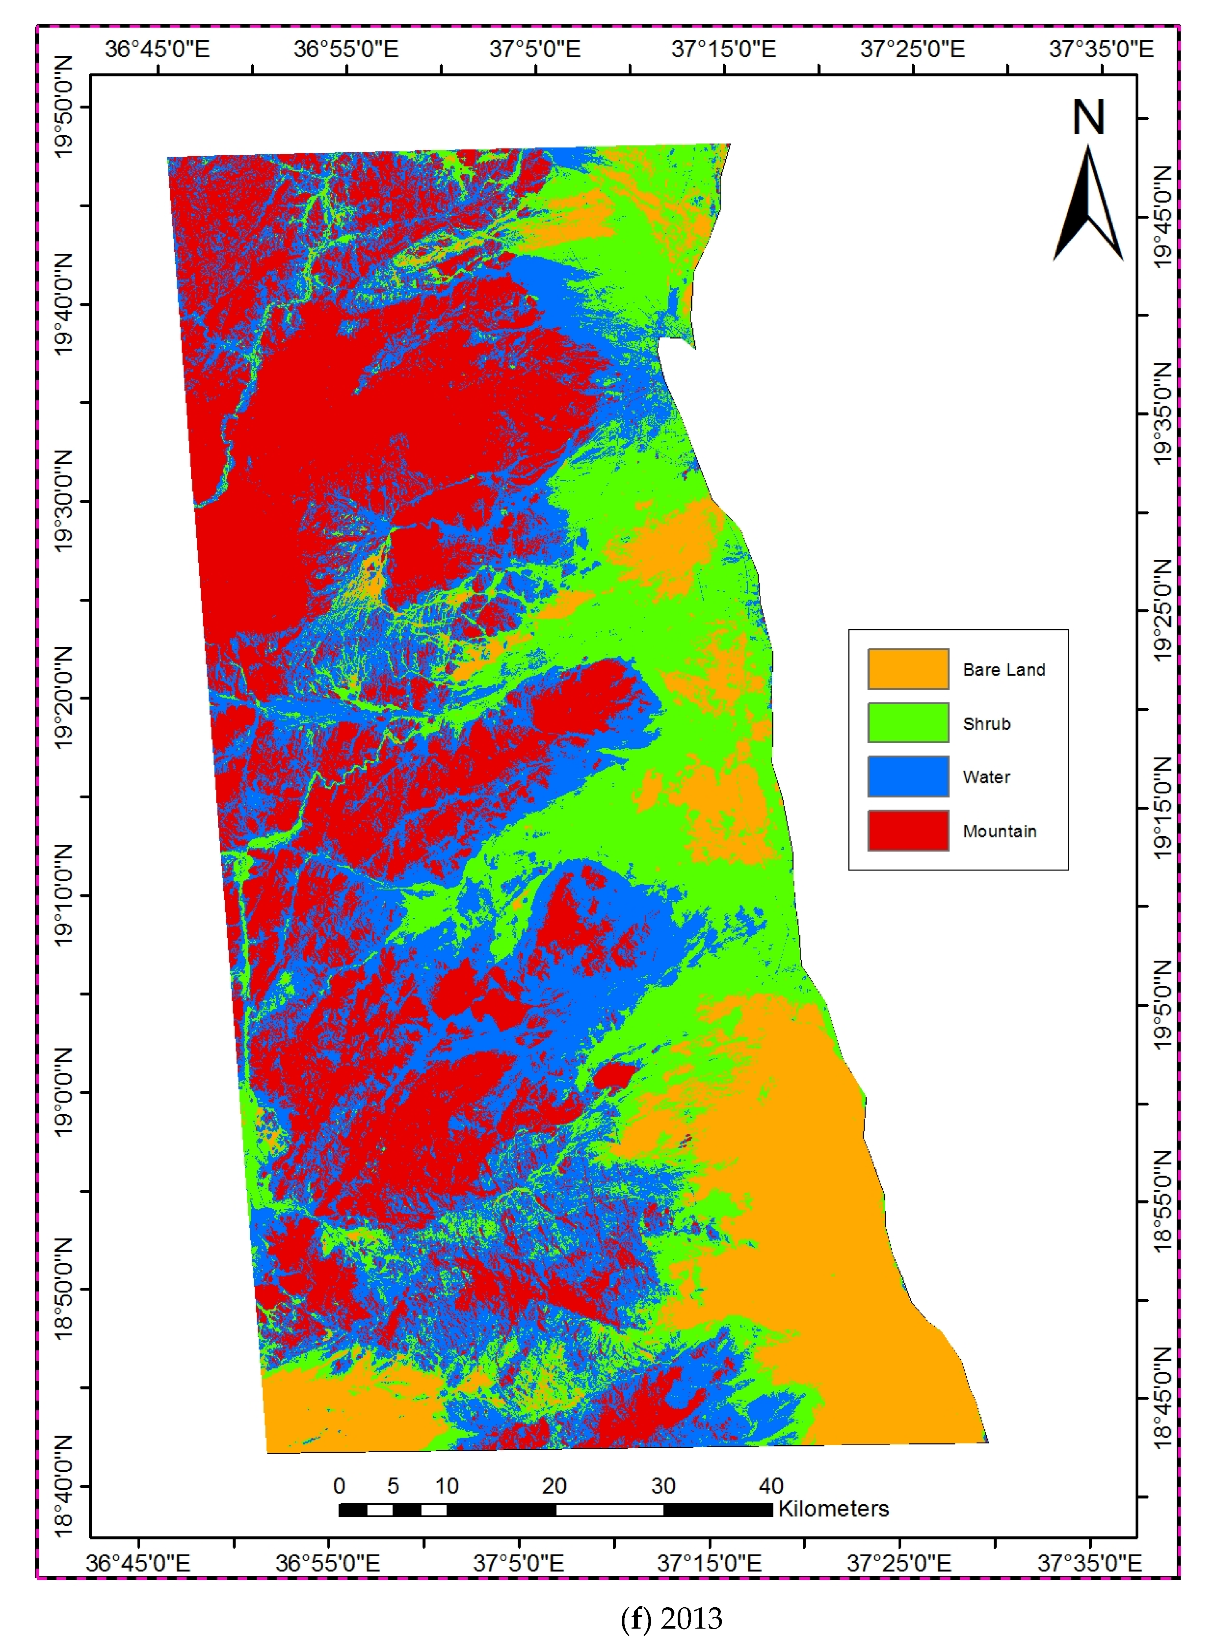
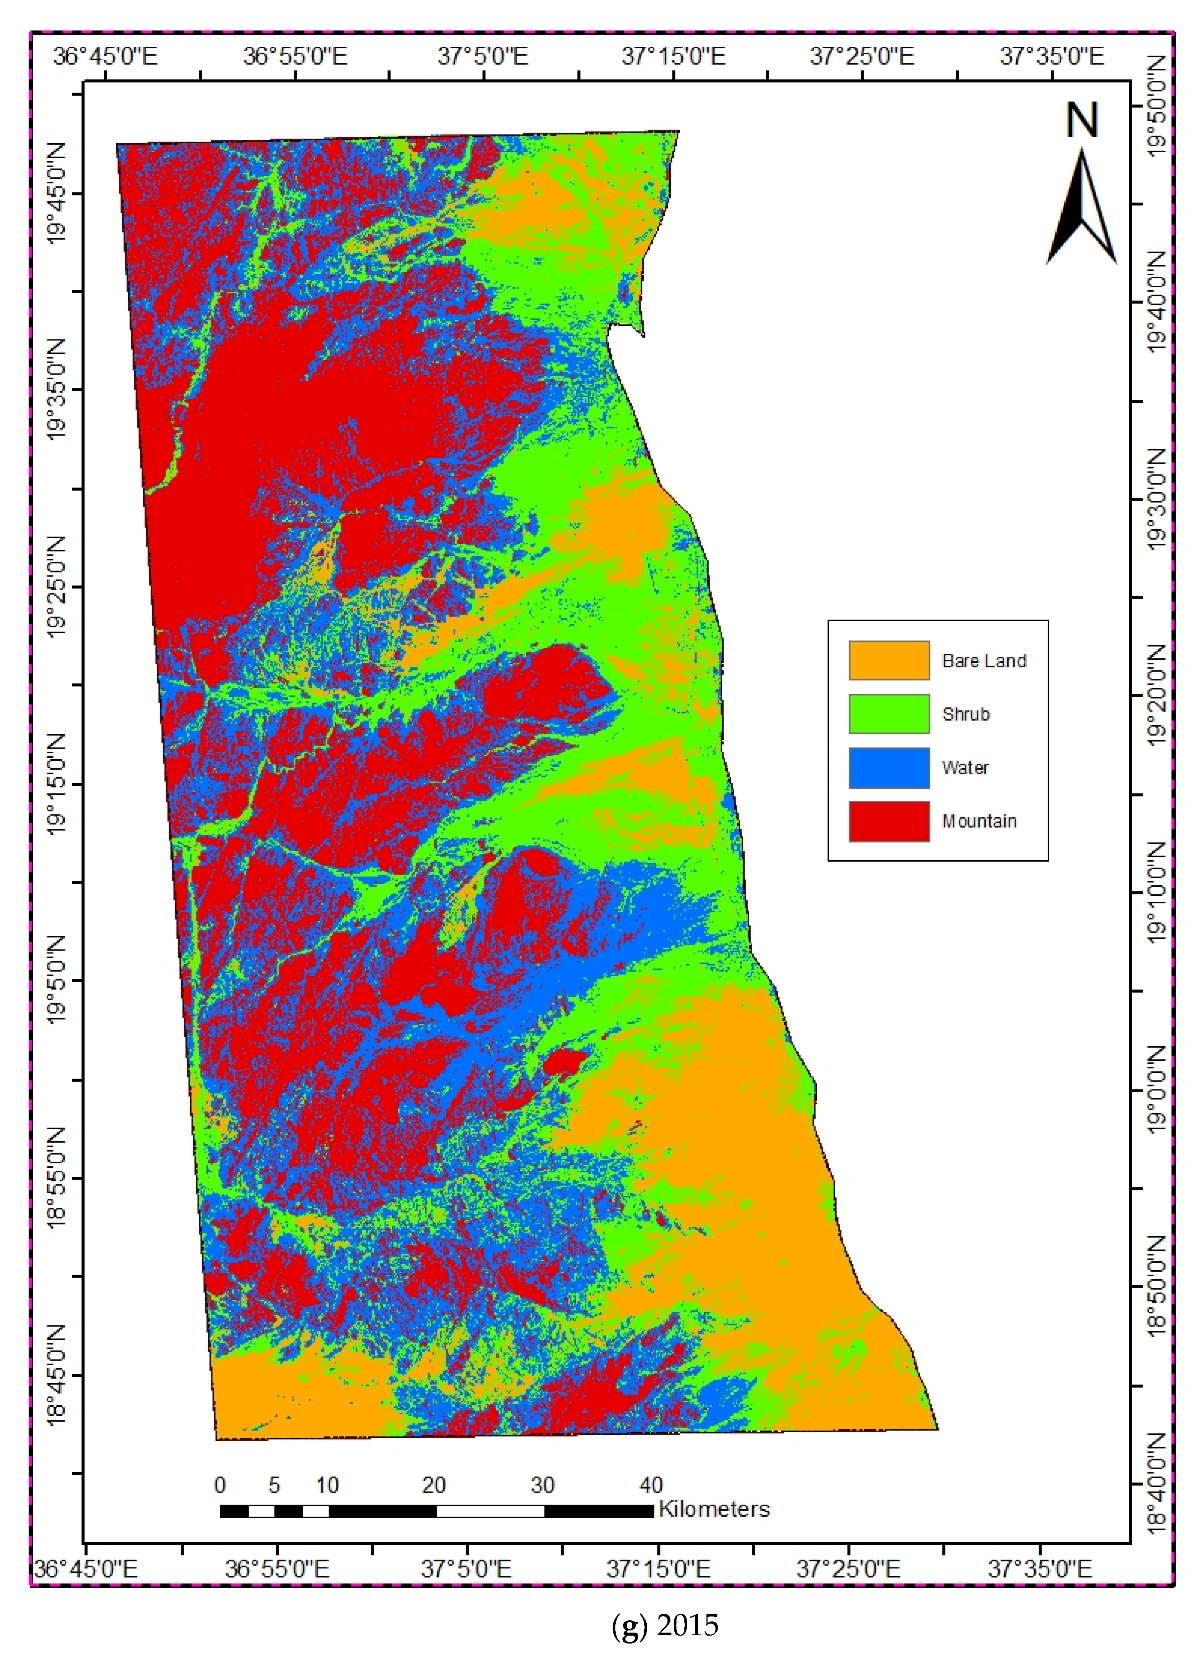
3.2. Land Cover Change
The satellite images show changes in the main classifications, which consist of bare land, shrubs, water and mountains, for the years 1985, 1990, 1995, 2000, 2003, 2013 and 2015 (Figure 4). The surface areas of bare land, shrubs, water and mountains for the seven satellite images are presented in Table 4a. The years fall into the following order, from greatest to least, with regard to shrub area: 2013 > 1995 > 1990 > 2015 > 2003 > 2000 > 1985. Correlation analyses showed positive relationships between shrubs and water (R = 0.9000) and between bare land and mountains (R = 0.652); however, shrubs (R = −0.860) and water (R = −0.793) had negative correlations with bare land and mountains. Thus, the largest areas were covered with shrubs and water in 1990, 1995 and 2013, resulting in the relatively smaller bare land areas.
Table 4b shows the percentage changes in the areas of bare land, shrub, water and mountains in comparison to the preceding years. Shrub and water areas showed the highest increase in 1990 (from 1985), and a slight increase in 1995 (from 1990), 2003 (from 2000) and 2013 (from 2003). Shrub and water areas were 25.6% and 20.8% larger in 1990 than in 1985. Shrub and water areas then increased slightly by 2.9% and 5.2%, respectively, from 1990 to 1995, and shrubs and water showed a slight increase of 6.38% and 9.97% from 2000 to 2003 and an increase of 15.66% and 7.81% from 2003 to 2013. Both shrub and water areas showed a decrease in 2000 (from 1995) and 2015 (from 2013). There was an 18.5% and a 13.8% decrease in shrubs and water, respectively, from 1995 to 2000. Shrub and water areas showed a decrease of 8.23% and 13.41% between 2013 and 2015.
4. Discussion
4.1. Climate Change
The meteorological data presented in the current study were obtained from the Sudan Meteorological Authority at Port Sudan. These data are consistent with the trends of increasing temperature and decreasing precipitation observed by Elagib and Elhag [24], who presented the mean annual temperature and rainfall data from 14 stations across Sudan from the 1940s to 2004. They found drastic increases in the maximum, minimum and mean temperatures and a significant decrease in rainfall. The frequency of droughts increased from 8.8% to 40% from 1941 to 1974 and from 44.1% to 70.6% from 1975 to 2008. Overall, the meteorological data presented in this study showed higher temperatures after 1998 than before 1998, with the highest maximum, minimum and average annual temperature occurring in 2010, whilst the lowest maximum and average annual temperature occurred in 1992, and the lowest minimum temperature occurred in 1995 and 1997. Trends of increasing temperatures and a decrease in the rainfall amount throughout the past 30 years point towards a hotter and drier climate for the Red Sea coastal plain to the south of Port Sudan.
Increasing temperatures and mixed precipitation patterns are common phenomena worldwide. For example, an increase in temperature at a rate of 0.34 °C/decade and increased precipitation have been reported in the arid region of Northwest China; thus, there were more warm days and fewer cold days in this area [9,14]. The temperature in Southwestern Europe was approximately 0.5 °C to 1.0 °C warmer during 1991 to 2020 than in 1961 to 1990, but precipitation showed an increase in the north and a decrease in the southern regions [8]. The mean surface temperature in the Hindu Kush Himalayan region showed an increasing trend from 1901 to 2014, with the mean, maximum and minimum temperatures increasing at rates of 0.104 °C/decade, 0.077 °C/decade and 0.176 °C/decade, respectively. There was a slight decrease in precipitation in this region during this time [32]. The mean warming rate in the Yellow, Yangtze and Pearl River basins was 0.22 °C/decade from 1956 to 2013, but there has been no significant trend in the precipitation pattern for the past 58 years [33].
Despite the overall trend of increasing temperature and the slight decrease in precipitation, the temperature and precipitation data also showed some abrupt changes from 1985 to 2015. Moreover, these changes could be attributable to the natural interannual to decadal scales variations [34,35], such as the maximum temperature and rainfall patterns in this study. Some of the abrupt changes in temperature and precipitation may have been caused by climate anomalies. For instance, the high rainfall in 1999 (Figure 3d) was due to the El Niño Southern Oscillation (ENSO), during which severe floods occurred in China, India and Australia. Around this time, heavy rainfall occurred in July, August and September in 1999, resulting in severe floods in central Sudan and the breaking of the bank of a major canal in the Gezira irrigation area [36].
4.2. Factors Affecting Vegetation Coverage along the Sudanese Coastal Plain
The most degraded areas in Sudan were the arid and semi-arid zones, which are inhabited by 76% of the country’s population. Overgrazing was the major factor causing soil degradation, followed by inappropriate farming practices, clearance of forests for firewood and charcoal, and overexploitation of vegetation for domestic use. Other factors, such as fire incidents and infestation by grasshoppers, rats and locusts, also caused land degradation [37]. Another study, a comparison of two Landsat images from 1987 and 2008, found that there was higher desertification than vegetation regrowth in the central part of the Sudanese state of North Kurdufan as a result of land use changes and mismanagement of natural resources [25]. Analyses of temperature, rainfall and the aridity index for 1941 to 2009 showed an increasing trend of warming and rainfall variability in the El-Gedaref region of eastern Sudan, which was attributable to the conversion of natural vegetation into large-scale mechanized agricultural areas [26]. Another study found that there were 16.9% and 5.4% increases in bare land and large-scale mechanized agriculture, respectively, as well as a 37% decrease in dense forest cover and a 20% increase in light forest cover in the Erawashda Forest in eastern Sudan. The expansion of mechanized agriculture, the cutting of trees, grazing and construction were the main factors contributing to forest degradation [27].
In this study, the largest shrub areas were detected in 2013, followed by those in 1995 and 1990. The highest shrub area in 2013, even though 2013 had the lowest rainfall of 0.2 mm, could be due to the high rainfall in 2010 (21.6 mm). The higher shrub area in 1995 could be due to the high rainfall in 1993 (20.1 mm) and 1995 (10.4 mm). Although the absence of floods may suppress vegetation growth, subsequent floods have been shown to cause a resurgence of vegetation, thus, a precipitation time lag can affect vegetation growth [18]. This could have been the case for the largest shrub areas in 1995 and 2013, which could have been due to the very high rainfall that occurred in 1993, 1995 and 2010. The highest rainfall was recorded in 1997, but 1998 was one of the lowest rainfall years. After that, 1999 and 2000 also had quite high rainfall. However, the shrub area was smaller in 2000 than in 1995. One of the reasons could be the overall higher mean annual temperature after 1998 than before 1998, as higher temperatures contribute to the loss of soil moisture due to evaporation and transpiration [38]. Another reason could be that the high rainfall in 1999 and 2000 resulted in increased land erosion, destroying some vegetation and covering some of the water areas with sand. On the other hand, 2015 had lower rainfall and higher temperatures than the previous years, yet it had a slightly higher shrub abundance than in 2000 and 2003. This could be attributable to improved adaptation strategies, such as water harvesting and control of overgrazing and deforestation activities.
4.3. Adaptation Strategies
Adaptation strategies such as water harvesting have a better capacity to retain moisture than the conventional tillage method [39] and sustain rain-fed agriculture by improving soil water content and can therefore improve rainwater use efficiency [40], thus improving agricultural production [41] and vegetation resilience to drought [42]. Such measures have reduced the risk and vulnerability faced by small-scale farmers [43], as it provides them with better food security and a higher income. Other benefits of water harvesting include improvement of infiltration and groundwater discharge, enrichment of soil nutrients and increased biomass production [44].
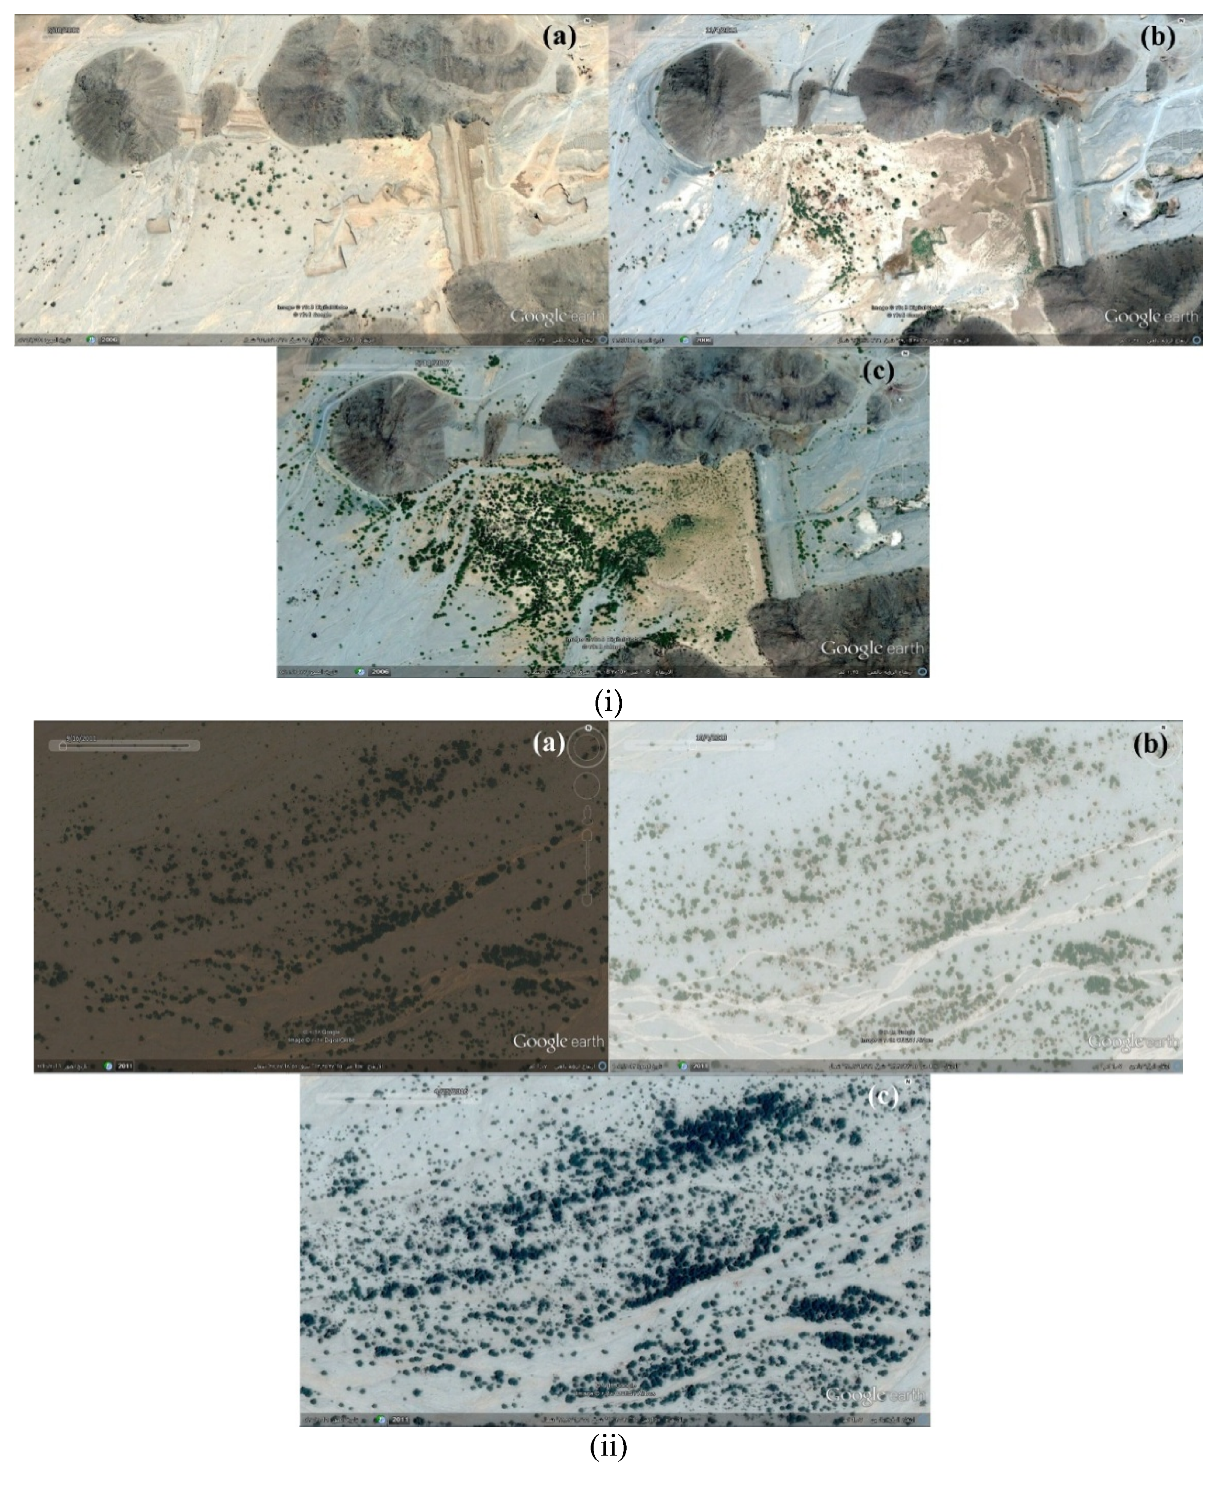
Some examples of efforts that have successfully overcome the problems of decreasing vegetation coverage are given here. Figure 5a shows a 0.73-km-long and 1.31-km-wide rainwater-harvesting area. This is a good example of the result of positive human intervention, such as the harvesting of rainwater along with the cultivation of new plant species that are capable of adapting to low-rainfall conditions, in an increase in vegetation abundance. Three satellite images taken over the Erkwit area (0.61 km long and 1.05 km wide) at a spatial resolution of 1.07 km showed improved vegetation cover in 2016 compared to 2011 and 2013 as a result of local government efforts to protect vegetation from overgrazing (Figure 5b).
5. Conclusions
In this study, temperature and rainfall data from 1985 to 2015 were obtained from the Sudan Meteorological Authority in south Port Sudan and compared with satellite images of land cover changes from 1985, 1995, 2003 and 2015 to determine the effects of climate change on vegetation coverage along the Red Sea coastal plain of the southern Port Sudan area. The maximum, minimum and annual average temperatures showed increases from 1985 to 2015, but precipitation decreased from 1985 to 2015. Thus, the temperature and precipitation data showed a hotter and drier climate towards the present. Nevertheless, we should also keep in mind that these changes could be interannual or decadal variations; more data are needed to prove this.
Vegetation abundance is affected by a complex interaction between climate change and human factors. The smaller shrub area in 1985 could have been due to the impacts of human activities, and the largest shrub area in 1995 and 2013 could have been due to the very high rainfall that occurred in 1993 and 2010, respectively. The shrub area was smaller in 2000, which could be due to the overall high temperature after 1998 resulting in increased evaporation. The slightly improved shrub area in 2015 was most likely due to the success of some adaptation strategies such as water harvesting and control of grazing and deforestation activities. Although our results did not indicate any trend of decreasing shrub abundance in recent years, vegetation in arid Sudan will no doubt face further stress and degradation due to hotter and drier conditions along the Red Sea coastal plain.
The results of this study would provide a good reference for the people and policymakers of the southern Port Sudan area on the effect of climate change and changes in vegetation cover in this area. Extensive efforts will be required to maintain the sustainability of vegetation in these arid environments. In light of the extent of vegetation deterioration, adaptation strategies such as rainwater harvesting and the control of overgrazing and deforestation should be given priority in order to rejuvenate some areas of vegetation.
Author Contributions
Conceptualization, P.S.L., H.I.M.A. and S.H.; methodology, H.I.M.A.; software, H.I.M.A.; validation, P.S.L. and S.H.; writing—review and editing, P.S.L. and H.I.M.A.; supervision, P.S.L.; funding acquisition, S.H. All authors have read and agreed to the published version of the manuscript.
Funding
The authors acknowledge the National Key Research and Development Plan of China (Grant No. 2016YFC1401603).
Acknowledgments
The authors wish to thank Ibrahim Al-Toum for his kind advice and the Sudan Meteorological Authority for the temperature and rainfall data. The authors are grateful to the reviewers for their comments which have improved the manuscript.
Conflicts of Interest
The authors declare no conflict of interest.
Appendix A. Monthly Temperature and Rainfall from 1985 to 2015

Table A1.
Maximum temperature (°C).
| JAN | FEB | MAR | APR | MAY | JUN | JUL | AUG | SEP | OCT | NOV | DEC | Mean | |
|---|---|---|---|---|---|---|---|---|---|---|---|---|---|
| 1985 | 28.2 | 26.8 | 29.2 | 31.9 | 35.4 | 38.3 | 40.0 | 40.2 | 37.7 | 33.0 | 31.1 | 28.5 | 33.4 |
| 1986 | 27.0 | 27.5 | 29.1 | 31.2 | 33.8 | 36.5 | 41.0 | 39.9 | 37.0 | 33.3 | 30.6 | 27.4 | 32.9 |
| 1987 | 27.1 | 28.1 | 29.2 | 30.7 | 34.9 | 38.3 | 39.4 | 41.0 | 37.3 | 33.5 | 31.4 | 28.8 | 33.3 |
| 1988 | 26.7 | 26.6 | 29.5 | 31.9 | 36.9 | 38.7 | 42.5 | 41.9 | 38.7 | 33.8 | 30.6 | 29.3 | 33.9 |
| 1989 | 25.5 | 25.3 | 27.9 | 31.5 | 36.1 | 37.9 | 40.5 | 40.3 | 37.1 | 33.0 | 30.9 | 28.1 | 32.8 |
| 1990 | 26.4 | 25.9 | 27.9 | 31.7 | 36.2 | 38.7 | 39.3 | 38.9 | 37.5 | 34.0 | 31.6 | 29.9 | 33.2 |
| 1991 | 27.0 | 27.3 | 29.3 | 33.2 | 35.6 | 37.7 | 39.3 | 38.5 | 35.9 | 33.1 | 31.0 | 27.6 | 33.0 |
| 1992 | 25.6 | 24.0 | 27.4 | 30.5 | 34.3 | 38.6 | 39.1 | 39.7 | 37.2 | 34.1 | 30.1 | 27.1 | 32.3 |
| 1993 | 26.2 | 25.5 | 28.4 | 30.6 | 34.0 | 38.5 | 39.6 | 40.5 | 38.2 | 33.8 | 31.5 | 29.5 | 33.0 |
| 1994 | 28.1 | 27.2 | 28.1 | 32.4 | 35.2 | 38.5 | 40.7 | 41.1 | 38.2 | 33.5 | 31.1 | 29.0 | 33.6 |
| 1995 | 27.5 | 26.8 | 28.7 | 31.5 | 35.1 | 38.9 | 41.8 | 40.9 | 37.3 | 33.9 | 30.5 | 28.0 | 33.4 |
| 1996 | 26.7 | 27.6 | 28.5 | 31.5 | 35.7 | 38.1 | 42.6 | 43.3 | 40.5 | 35.0 | 30.8 | 29.0 | 34.1 |
| 1997 | 27.5 | 25.5 | 28.0 | 32.2 | 36.0 | 40.6 | 43.2 | 41.6 | 39.7 | 34.7 | 30.9 | 28.5 | 34.0 |
| 1998 | 27.4 | 28.6 | 28.9 | 33.2 | 37.4 | 40.6 | 44.4 | 43.9 | 41.4 | 36.5 | 32.7 | 30.4 | 35.5 |
| 1999 | 28.1 | 29.7 | 30.2 | 32.3 | 39.0 | 40.0 | 43.3 | 43.5 | 39.8 | 35.3 | 31.9 | 28.9 | 35.2 |
| 2000 | 26.8 | 26.5 | 28.5 | 34.8 | 37.7 | 40.5 | 45.1 | 42.6 | 39.6 | 33.8 | 30.2 | 28.1 | 34.5 |
| 2001 | 26.8 | 27.2 | 31.0 | 34.3 | 37.9 | 41.6 | 44.1 | 43.2 | 38.8 | 35.3 | 31.4 | 28.9 | 35.0 |
| 2002 | 26.2 | 28.5 | 30.8 | 32.9 | 36.9 | 39.9 | 42.5 | 42.6 | 38.9 | 35.3 | 31.6 | 28.2 | 34.5 |
| 2003 | 28.3 | 27.4 | 28.4 | 32.8 | 37.8 | 32.6 | 43.3 | 43.3 | 39.6 | 34.8 | 32.2 | 29.1 | 34.1 |
| 2004 | 27.8 | 27.7 | 30.0 | 33.0 | 38.4 | 40.9 | 42.9 | 42.4 | 39.0 | 34.9 | 31.8 | 27.3 | 34.7 |
| 2005 | 26.5 | 28.4 | 29.7 | 32.2 | 36.4 | 40.3 | 43.1 | 43.1 | 39.4 | 34.9 | 30.7 | 30.3 | 34.6 |
| 2006 | 28.4 | 29.1 | 30.5 | 31.8 | 37.6 | 41.5 | 40.8 | 44.0 | 40.5 | 34.7 | 30.9 | 27.5 | 34.8 |
| 2007 | 26.4 | 27.9 | 29.4 | 33.0 | 37.9 | 40.8 | 43.2 | 42.8 | 39.4 | 35.0 | 31.1 | 28.9 | 34.7 |
| 2008 | 26.5 | 27.3 | 31.1 | 33.8 | 37.2 | 41.0 | 43.1 | 42.4 | 40.6 | 34.2 | 31.3 | 29.4 | 34.8 |
| 2009 | 27.4 | 28.6 | 29.1 | 34.0 | 36.1 | 40.9 | 43.2 | 42.1 | 38.5 | 35.3 | 32.0 | 29.1 | 34.7 |
| 2010 | 28.9 | 29.5 | 31.2 | 33.6 | 37.7 | 41.0 | 43.4 | 45.8 | 40.6 | 37.1 | 33.1 | 29.7 | 36.0 |
| 2011 | 27.1 | 28.6 | 29.4 | 32.5 | 36.9 | 40.3 | 43.8 | 43.5 | 39.7 | 35.5 | 30.5 | 27.9 | 34.6 |
| 2012 | 26.7 | 28.6 | 29.1 | 33.8 | 38.5 | 41.7 | 44.5 | 43.8 | 40.1 | 35.3 | 32.5 | 29.4 | 35.3 |
| 2013 | 28.4 | 29.3 | 31.3 | 33.4 | 37.7 | 41.4 | 42.8 | 42.4 | 40.6 | 34.4 | 31.9 | 28.7 | 35.2 |
| 2014 | 28.0 | 28.1 | 30.6 | 34.7 | 36.8 | 40.7 | 42.3 | 43.0 | 38.8 | 33.8 | 30.3 | 29.0 | 34.7 |
| 2015 | 27.0 | 28.4 | 29.7 | 32.0 | 36.5 | 39.1 | 41.9 | 44.1 | 40.3 | 35.5 | 32.0 | 27.6 | 34.5 |
Table A2.
Minimum temperature (°C).
| JAN | FEB | MAR | APR | MAY | JUN | JUL | AUG | SEP | OCT | NOV | DEC | Mean | |
|---|---|---|---|---|---|---|---|---|---|---|---|---|---|
| 1985 | 21.8 | 17.9 | 20.3 | 22.2 | 25.2 | 25.9 | 26.7 | 28.3 | 26.6 | 24.1 | 23.0 | 20.3 | 23.5 |
| 1986 | 19.3 | 19.1 | 21.2 | 22.4 | 22.5 | 26.2 | 28.9 | 29.0 | 27.4 | 26.9 | 23.8 | 19.8 | 23.9 |
| 1987 | 19.7 | 20.2 | 18.8 | 20.8 | 24.8 | 25.9 | 28.8 | 30.4 | 26.6 | 26.8 | 24.8 | 21.9 | 24.1 |
| 1988 | 19.2 | 19.0 | 19.9 | 22.2 | 25.3 | 27.7 | 31.0 | 31.6 | 29.3 | 26.4 | 24.1 | 22.8 | 24.9 |
| 1989 | 18.1 | 17.7 | 20.2 | 23.1 | 25.3 | 26.8 | 29.1 | 29.4 | 28.6 | 25.5 | 24.6 | 20.9 | 24.1 |
| 1990 | 19.2 | 17.6 | 18.0 | 20.8 | 23.8 | 25.3 | 27.7 | 27.7 | 27.2 | 25.9 | 24.2 | 22.9 | 23.4 |
| 1991 | 21.0 | 20.0 | 20.9 | 25.0 | 26.5 | 26.7 | 27.7 | 27.4 | 26.7 | 26.4 | 24.6 | 21.5 | 24.5 |
| 1992 | 17.9 | 16.2 | 19.0 | 20.9 | 23.4 | 26.2 | 28.5 | 30.3 | 28.0 | 25.0 | 22.8 | 19.8 | 23.2 |
| 1993 | 18.4 | 16.2 | 19.0 | 21.5 | 24.1 | 25.4 | 27.4 | 27.8 | 26.1 | 25.0 | 25.1 | 23.6 | 23.3 |
| 1994 | 21.6 | 19.8 | 20.4 | 23.5 | 26.1 | 28.0 | 28.5 | 30.4 | 27.9 | 25.0 | 24.3 | 22.0 | 24.8 |
| 1995 | 20.5 | 18.5 | 18.1 | 20.4 | 23.7 | 26.5 | 28.9 | 28.8 | 26.5 | 24.5 | 22.0 | 19.3 | 23.1 |
| 1996 | 17.2 | 18.4 | 17.9 | 19.5 | 25.5 | 27.2 | 28.7 | 29.5 | 26.9 | 24.7 | 22.9 | 21.1 | 23.3 |
| 1997 | 19.2 | 16.7 | 17.5 | 20.1 | 24.3 | 27.2 | 29.5 | 28.9 | 26.0 | 24.6 | 22.8 | 21.1 | 23.2 |
| 1998 | 18.0 | 17.8 | 18.6 | 20.8 | 24.1 | 26.5 | 30.5 | 31.9 | 29.0 | 24.8 | 23.9 | 22.1 | 24.0 |
| 1999 | 20.1 | 21.3 | 18.6 | 20.8 | 25.0 | 26.1 | 29.8 | 30.8 | 27.2 | 24.3 | 23.4 | 21.0 | 24.0 |
| 2000 | 18.9 | 18.2 | 17.5 | 22.1 | 24.7 | 26.8 | 30.2 | 29.8 | 26.6 | 24.3 | 22.3 | 20.5 | 23.5 |
| 2001 | 18.1 | 17.6 | 19.9 | 21.4 | 23.9 | 26.0 | 29.5 | 31.1 | 26.5 | 25.0 | 23.4 | 22.0 | 23.7 |
| 2002 | 18.0 | 20.0 | 20.3 | 21.4 | 22.9 | 26.5 | 30.1 | 30.8 | 26.8 | 26.2 | 23.6 | 20.1 | 23.9 |
| 2003 | 18.8 | 18.1 | 17.8 | 21.5 | 26.2 | 27.7 | 29.9 | 31.2 | 27.9 | 25.5 | 24.2 | 21.0 | 24.2 |
| 2004 | 18.5 | 18.1 | 19.1 | 22.9 | 24.1 | 26.8 | 29.5 | 29.7 | 26.9 | 26.3 | 24.3 | 21.0 | 23.9 |
| 2005 | 19.0 | 20.1 | 19.7 | 23.3 | 24.4 | 27.7 | 30.5 | 31.3 | 28.5 | 24.3 | 23.9 | 22.9 | 24.6 |
| 2006 | 20.9 | 20.1 | 19.3 | 21.8 | 25.6 | 27.9 | 28.5 | 31.5 | 28.5 | 26.0 | 24.1 | 19.8 | 24.5 |
| 2007 | 19.0 | 18.4 | 19.2 | 21.8 | 26.1 | 27.5 | 31.3 | 30.0 | 28.0 | 25.4 | 23.7 | 21.9 | 24.4 |
| 2008 | 19.1 | 19.4 | 20.2 | 22.9 | 23.9 | 26.9 | 28.4 | 28.7 | 28.5 | 25.2 | 23.0 | 22.3 | 24.0 |
| 2009 | 20.3 | 21.1 | 19.3 | 21.8 | 24.1 | 27.3 | 30.0 | 30.1 | 27.6 | 25.7 | 24.2 | 21.7 | 24.4 |
| 2010 | 21.1 | 21.0 | 20.8 | 22.9 | 24.5 | 28.2 | 30.8 | 32.7 | 28.5 | 32.5 | 25.1 | 22.0 | 25.8 |
| 2011 | 19.1 | 19.8 | 20.0 | 21.2 | 23.8 | 26.4 | 29.2 | 30.1 | 27.5 | 25.2 | 22.3 | 20.8 | 23.8 |
| 2012 | 19.4 | 19.5 | 18.9 | 21.6 | 24.6 | 28.3 | 31.1 | 31.1 | 27.3 | 25.0 | 24.7 | 22.1 | 24.5 |
| 2013 | 20.4 | 20.6 | 21.8 | 22.1 | 25.7 | 27.1 | 29.4 | 30.3 | 27.9 | 25.8 | 24.6 | 21.1 | 24.7 |
| 2014 | 20.9 | 20.2 | 21.1 | 24.3 | 24.8 | 27 | 29.7 | 32 | 29.1 | 26 | 23.7 | 22.7 | 25.1 |
| 2015 | 19.5 | 20.4 | 21.7 | 22.1 | 25.6 | 26.6 | 28.8 | 31.8 | 29.0 | 26.9 | 25.0 | 20.9 | 24.9 |
Table A3.
Rainfall (mm).
| JAN | FEB | MAR | APR | MAY | JUN | JUL | AUG | SEP | OCT | NOV | DEC | Mean | |
|---|---|---|---|---|---|---|---|---|---|---|---|---|---|
| 1985 | 22.0 | 0.0 | 0.0 | 0.0 | 2.3 | 0.0 | 0.0 | 0.0 | 0.0 | 21.2 | 99.5 | 13.4 | 13.2 |
| 1986 | 34.5 | 0.0 | 24.4 | 0.0 | 0.0 | 0.0 | 0.0 | 0.3 | 0.0 | 7.0 | 0.4 | 0.0 | 5.6 |
| 1987 | 0.0 | 0.0 | 0.0 | 0.0 | 0.0 | 0.0 | 0.0 | 0.0 | 0.0 | 10.0 | 0.5 | 0.0 | 0.9 |
| 1988 | 0.5 | 0.0 | 0.0 | 0.0 | 0.0 | 0.0 | 0.0 | 4.0 | 0.0 | 0.1 | 9.3 | 0.0 | 1.2 |
| 1989 | 0.0 | 0.0 | 0.0 | 1.6 | 10.9 | 0.0 | 0.0 | 0.0 | 0.0 | 45.1 | 4.9 | 2.4 | 5.4 |
| 1990 | 0.0 | 0.0 | 0.0 | 12.4 | 0.0 | 0.0 | 0.0 | 0.0 | 0.0 | 0.1 | 35.0 | 2.0 | 4.1 |
| 1991 | 0.0 | 2.0 | 0.0 | 48.0 | 0.0 | 0.0 | 0.0 | 0.0 | 0.0 | 18.3 | 20.8 | 0.0 | 7.4 |
| 1992 | 0.0 | 0.0 | 0.0 | 0.5 | 0.0 | 0.0 | 0.1 | 5.0 | 0.0 | 5.2 | 96.9 | 0.4 | 9.0 |
| 1993 | 0.0 | 0.2 | 0.0 | 193.8 | 0.0 | 0.0 | 0.0 | 0.0 | 0.0 | 27.6 | 15.0 | 4.2 | 20.1 |
| 1994 | 11.2 | 0.0 | 0.0 | 0.0 | 4.0 | 0.0 | 5.5 | 0.2 | 0.0 | 0.0 | 0.0 | 0.0 | 1.7 |
| 1995 | 38.2 | 0.0 | 1.4 | 0.0 | 0.0 | 7.0 | 0.0 | 0.0 | 0.0 | 24.2 | 53.8 | 0.0 | 10.4 |
| 1996 | 1.0 | 0.0 | 0.0 | 0.0 | 0.0 | 0.0 | 0.0 | 0.0 | 0.0 | 5.0 | 50.4 | 6.6 | 5.3 |
| 1997 | 0.0 | 0.0 | 0.0 | 0.0 | 1.1 | 0.0 | 1.7 | 0.0 | 0.0 | 241.3 | 36.9 | 0.0 | 23.4 |
| 1998 | 0.0 | 0.0 | 0.0 | 0.0 | 1.2 | 0.0 | 25.0 | 5.4 | 0.0 | 3.0 | 0.0 | 0.0 | 2.9 |
| 1999 | 2.1 | 0.0 | 0.0 | 7.0 | 0.5 | 0.0 | 0.0 | 0.0 | 0.0 | 22.0 | 10.6 | 122.8 | 13.8 |
| 2000 | 0.0 | 0.0 | 0.0 | 4.4 | 0.0 | 0.0 | 2.0 | 0.0 | 0.0 | 25.4 | 60.5 | 70.3 | 13.6 |
| 2001 | 0.0 | 0.0 | 0.0 | 0.0 | 0.0 | 0.0 | 0.0 | 0.0 | 0.0 | 0.0 | 4.9 | 24.1 | 2.4 |
| 2002 | 0.0 | 0.6 | 0.4 | 0.0 | 0.0 | 0.0 | 0.0 | 0.0 | 0.0 | 0.0 | 96.6 | 0.0 | 8.1 |
| 2003 | 0.0 | 0.0 | 0.0 | 0.0 | 1.0 | 0.0 | 11.3 | 0.0 | 0.0 | 0.0 | 7.6 | 1.0 | 1.7 |
| 2004 | 0.5 | 0.0 | 0.0 | 0.0 | 0.0 | 0.0 | 0.0 | 0.0 | 0.0 | 11.1 | 0.0 | 100.3 | 9.3 |
| 2005 | 0.0 | 0.0 | 0.0 | 2.0 | 0.0 | 0.0 | 15.8 | 18.4 | 0.0 | 0.0 | 0.0 | 2.0 | 3.2 |
| 2006 | 0.0 | 0.0 | 0.0 | 0.0 | 0.0 | 0.0 | 0.0 | 1.0 | 0.0 | 65.2 | 11.8 | 0.0 | 6.5 |
| 2007 | 0.0 | 0.0 | 0.0 | 0.0 | 0.0 | 8.0 | 19.3 | 7.0 | 0.0 | 0.0 | 0.1 | 0.0 | 2.9 |
| 2008 | 0.0 | 0.0 | 0.0 | 0.0 | 0.0 | 0.0 | 0.0 | 0.0 | 0.0 | 0.0 | 0.0 | 0.0 | 0.0 |
| 2009 | 3.0 | 0.0 | 0.0 | 0.0 | 0.0 | 0.0 | 0.0 | 0.0 | 0.0 | 0.0 | 2.1 | 3.6 | 0.7 |
| 2010 | 0.0 | 0.0 | 0.0 | 1.0 | 0.0 | 13.0 | 4.8 | 5.8 | 0.0 | 0.0 | 122.7 | 112.2 | 21.6 |
| 2011 | 13.1 | 0.0 | 0.0 | 0.5 | 0.0 | 0.0 | 1.5 | 0.0 | 0.0 | 0.0 | 0.0 | 1.0 | 1.3 |
| 2012 | 0.0 | 0.0 | 0.0 | 0.0 | 0.0 | 0.0 | 0.0 | 0.0 | 0.0 | 30.0 | 0.0 | 0.0 | 2.5 |
| 2013 | 0.0 | 0.0 | 0.0 | 0.0 | 0.0 | 0.0 | 0.0 | 1.1 | 0.0 | 0.0 | 0.0 | 1.0 | 0.2 |
| 2014 | 0.0 | 0.0 | 0.0 | 0.0 | 2.3 | 0.0 | 18.2 | 0.0 | 0.0 | 5.4 | 23.1 | 24.4 | 6.1 |
| 2015 | 0.0 | 0.0 | 0.0 | 0.0 | 0.0 | 0.0 | 0.0 | 0.0 | 0.0 | 28.1 | 0.0 | 32.4 | 5.0 |
References
- Dutta, P.K.; Radner, R. A strategic analysis of global warming: Theory and some numbers. J. Econ. Behav. Organ. 2009, 71, 187–209. [Google Scholar] [CrossRef] [Green Version]
- Hughes, L. Biological consequences of global warming: Is the signal already apparent? Trends Ecol. Evol. 2000, 15, 56–61. [Google Scholar] [CrossRef]
- McCarthy, J.J.; Canziani, O.F.; Leary, N.A.; Dokken, D.J.; White, K.S. Climate Change 2001: Impacts, Adaptation, and Vulnerability. Contribution of Working Group II to the Third Assessment Report of the Intergovernmental Panel on Climate Change; Published for the Intergovernmental Panel on Climate Change (IPCC); Cambridge University Press: Cambridge, UK, 2001; pp. 1–1032. [Google Scholar]
- Nadeau, C.P.; Urban, M.C.; Bridle, J.R. Climates Past, Present, and Yet-to-Come Shape Climate Change Vulnerabilities. Trends Ecol. Evol. 2007, 32, 786–800. [Google Scholar] [CrossRef] [PubMed] [Green Version]
- Ye, X.P.; Yu, X.P.; Yu, C.Q.; Taybazhaer, A.; Xu, F.J.; Skidmore, A.K.; Wang, J.J. Impacts of future climate and land cover changes on threatened mammals in the semi-arid Chinese Altai Mountains. Sci. Total Environ. 2018, 612, 775–787. [Google Scholar] [CrossRef] [PubMed]
- Watson, R.T.; Zinyowera, M.C.; Moss, R.H.; Dokken, D.J. Climate Change 1995. Impacts, Adaptions and Mitigation of Climate Change: Scientific-Technical Analyses. Contribution of Working Group II to the Second Assessment Report of the Intergovernmental Panel on Climate Change; Cambridge University Press: Cambridge, UK, 1996; pp. 1–879. [Google Scholar]
- Berchin, I.I.; Valduga, I.B.; Garcia, J.; de Andrade Guerra, J.B.S.O. Climate change and forced migrations: An effort towards recognizing climate refugees. Geoforum 2017, 84, 147–150. [Google Scholar] [CrossRef]
- Cheval, S.; Dumitrescu, A.; Birsan, M.-V. Variability of the aridity in the South-Eastern Europe over 1961–2050. Catena 2007, 151, 74–86. [Google Scholar] [CrossRef]
- Wang, H.J.; Pan, Y.P.; Chen, Y.N.; Ye, Z.W. Linear trend and abrupt changes of climate indices in the arid region of northwestern China. Atmos. Res. 2007, 196, 108–118. [Google Scholar] [CrossRef]
- Dore, M.H. Climate change and changes in global precipitation patterns: What do we know? Environ. Int. 2005, 31, 1167–1181. [Google Scholar] [CrossRef]
- Fu, Q.; Li, B.; Hou, Y.; Bi, X.; Zhang, X.S. Effects of land use and climate change on ecosystem services in Central Asia’s arid regions: A case study in Altay Prefecture, China. Sci. Total Environ. 2017, 607–608, 633–646. [Google Scholar] [CrossRef]
- Wang, Y.; Yan, X.D. Climate change induced by Southern Hemisphere desertification. Phys. Chem. Earth 2017, 102, 40–47. [Google Scholar] [CrossRef]
- Zarch, M.A.A.; Sivakumar, B.; Malekinezhad, H.; Sharma, A. Future aridity under conditions of global climate change. J. Hydrol. 2017, 554, 451–469. [Google Scholar] [CrossRef]
- Chen, Y.N.; Li, Z.; Fan, Y.T.; Wang, H.J.; Deng, H.J. Progress and prospects of climate change impacts on hydrology in the arid region of northwest China. Environ. Res. 2015, 139, 11–19. [Google Scholar] [CrossRef] [PubMed]
- Xie, Z.Y.; Huete, A.; Ma, X.L.; Restrepo-Coupe, N.; Devadas, R.; Clarke, K.; Lewis, M. Landsat and GRACE observations of arid wetland dynamics in a dryland river system under multi-decadal hydroclimatic extremes. J. Hydrol. 2016, 543, 818–831. [Google Scholar] [CrossRef]
- Becerril-Piña, R.; Mastachi-Loza, C.A.; González-Sosa, E.; Díaz-Delgado, C.; Bâ, K.M. Assessing desertification risk in the semi-arid highlands of central Mexico. J. Arid Environ. 2015, 120, 4–13. [Google Scholar] [CrossRef]
- Klein, J.A.; Harte, J.; Zhao, X.Q. Experimental warming, not grazing, decreases rangeland quality on the Tibetan Plateau. Ecol. Appl. 2007, 17, 541–557. [Google Scholar] [CrossRef]
- Djebou, D.C.S.; Singh, V.P.; Frauenfeld, O.W. Vegetation response to precipitation across the aridity gradient of the southwestern United States. J. Arid Environ. 2015, 115, 35–43. [Google Scholar] [CrossRef]
- Sultan, S.E. Phenotypic plasticity and plant adaptation. Acta Bot. Neerl. 1995, 44, 363–383. [Google Scholar] [CrossRef]
- Sam, A.K.; Ahamed, M.M.; El Khangi, F.A.; El Nigum, Y.O.; Holm, E. Radioactivity levels in the Red Sea coastal environment of Sudan. Mar. Pollut. Bull. 1998, 36, 19–26. [Google Scholar] [CrossRef]
- Archer, D.R.; Fowler, H.J. Characterizing flash flood response to intense rainfall and impacts using historical information and gauged data in Britain. J. Flood Risk Manag. 2018, 11, S121–S133. [Google Scholar] [CrossRef]
- Herrmann, S.M.; Anyamba, A.; Tucker, C.J. Recent trends in vegetation dynamics in the African Sahel and their relationship to climate. Glob. Environ. Chang. 2005, 15, 394–404. [Google Scholar] [CrossRef]
- Lebel, T.; Cappelaere, B.; Galle, S.; Hanan, N.; Kergoat, L.; Levis, S.; Vieux, B.; Descroix, L.; Gosset, M.; Mougin, E.; et al. AMMA-CATCH studies in the Sahelian region of West-Africa: An overview. J. Hydrol. 2009, 375, 3–13. [Google Scholar] [CrossRef] [Green Version]
- Elagib, N.A.; Elhag, M.M. Major climate indicators of ongoing drought in Sudan. J. Hydrol. 2011, 409, 612–625. [Google Scholar] [CrossRef]
- Dawelbait, M.; Morari, F. Monitoring desertification in a Savannah region in Sudan using Landsat images and spectral mixture analysis. J. Arid Environ. 2012, 80, 45–55. [Google Scholar] [CrossRef]
- Sulieman, H.M.; Elagib, N.A. Implications of climate, land-use and land-cover changes for pastoralism in eastern Sudan. J. Arid Environ. 2012, 85, 132–141. [Google Scholar] [CrossRef]
- Sulieman, H.M. Exploring drivers of forest degradation and fragmentation in Sudan: The case of Erawashda forest and its surrounding community. Sci. Total Environ. 2018, 621, 895–904. [Google Scholar] [CrossRef]
- Krupp, F.; Türkay, M.; El Hag, A.G.D.; Nasr, D. Comparative Ecological Analysis of Biota and Habitats in Littoral and Shallow Sublittoral Waters of the Sudanese Red Sea; Forschungsinstitut Senckenberg: Frankfurt, Germany; Faculty of Marine Science and Fisheries: Port Sudan, Sudan, 1994; pp. 1–89. [Google Scholar]
- Backer, H.; Schoell, M. New deeps with brines and metalliferous sediments in the Red Sea. J. Nat. Phys. Sci. 1972, 240, 153–158. [Google Scholar] [CrossRef]
- Elawad, A.N. Some Biological Aspects of Fish by-Catch Trawling. Master’s Thesis, Department of Zoology, Faculty of Science, University of Khartoum, Khartoum, Sudan, 2002; pp. 1–79. [Google Scholar]
- Byakatonda, J.; Parida, B.P.; Kenabatho, P.K.; Moalafhi, D.B. Analysis of rainfall and temperature time series to detect long-term climatic trends and variability over semi-arid Botswana. J. Earth Syst. Sci. 2018, 127, 25. [Google Scholar] [CrossRef] [Green Version]
- Ren, Y.-Y.; Ren, G.-Y.; Sun, X.-B.; Shrestha, A.B.; You, Q.-L.; Zhan, Y.-J.; Rajbhandari, R.; Zhang, P.-Y.; Wen, K.-M. Observed changes in surface air temperature and precipitation in the Hindu Kush Himalayan region over the last 100-plus years. Adv. Clim. Chang. Res. 2017, 8, 148–156. [Google Scholar] [CrossRef]
- Tian, Q.; Yang, S. Regional climatic response to global warming: Trends in temperature and precipitation in the Yellow, Yangtze and Pearl River basins since the 1950s. Quat. Int. 2017, 440, 1–11. [Google Scholar] [CrossRef]
- Sun, F.; Roderick, M.L.; Farquhar, G.D. Rainfall statistics, stationarity, and climate change. Proc. Natl. Acad. Sci. USA 2018, 115, 2305–2310. [Google Scholar] [CrossRef] [Green Version]
- Chowdhury, A.F.M.K.; Kar, K.K.; Shahid, S.; Chowdhury, R.; Rashid, M.M. Evaluation of spatio-temporal rainfall variability and performance of a stochastic rainfall model in Bangladesh. Int. J. Climatol. 2019, 39, 4256–4273. [Google Scholar] [CrossRef]
- Williams, M.; Nottage, J. Impact of extreme rainfall in the central Sudan during 1999 as a partial analogue for reconstructing early Holocene prehistoric environments. Quat. Int. 2006, 150, 82–94. [Google Scholar] [CrossRef]
- Ayoub, A.T. Extent, severity and causative factors of land degradation in the Sudan. J. Arid Environ. 1998, 38, 397–409. [Google Scholar] [CrossRef]
- Zewdie, W.; Csaplovics, E.; Inostroza, L. Monitoring ecosystem dynamics in northwestern Ethiopia using NDVI and climate variables to assess long term trends in dryland vegetation variability. Appl. Geogr. 2017, 79, 167–178. [Google Scholar] [CrossRef]
- Motsi, K.E.; Chuma, E.; Mukamuri, B.B. Rainwater harvesting for sustainable agriculture in communal lands of Zimbabwe. Phys. Chem. Earth 2004, 29, 1069–1073. [Google Scholar] [CrossRef]
- Biazin, B.; Sterk, G.; Temesgen, M.; Abdulkedir, A.; Stroosnijder, L. Rainwater harvesting and management in rainfed agricultural systems in sub-Saharan Africa—A review. Phys. Chem. Earth 2012, 47–48, 139–151. [Google Scholar] [CrossRef]
- Kahsay, G.A.; Hansen, L.G. The effect of climate change and adaptation policy on agricultural production in Eastern Africa. Ecol. Econ. 2016, 121, 54–64. [Google Scholar] [CrossRef] [Green Version]
- Dile, Y.T.; Karlberg, L.; Temesgen, M.; RockstrÖm, J. The role of water harvesting to achieve sustainable agricultural intensification and resilience against water related shocks in sub-Saharan Africa. Agric. Ecosyst. Environ. 2013, 181, 69–79. [Google Scholar] [CrossRef]
- Bunclark, L.; Gowing, J.; Oughton, E.; Ouattara, K.; Ouaba, S.; Benao, D. Understanding farmers’ decisions on adaptation to climate change: Exploring adoption of water harvesting technologies in Burkina Faso. Glob. Environ. Chang. 2018, 48, 243–254. [Google Scholar] [CrossRef]
- Vohland, K.; Barry, B. A review of in situ rainwater harvesting (RWH) practices modifying landscape functions in African drylands. Agric. Ecosyst. Environ. 2009, 131, 119–127. [Google Scholar] [CrossRef]
Figure 1.
Map showing the study area along the Sudanese Red Sea coastal plain, south of Port Sudan.

Figure 2.
Monthly profile of maximum temperature, minimum temperature and precipitation from 1985 to 2015.
Figure 2.
Monthly profile of maximum temperature, minimum temperature and precipitation from 1985 to 2015.

Figure 3.
Changes in annual (a) maximum, (b) minimum and (c) average temperatures and (d) precipitation across years.
Figure 3.
Changes in annual (a) maximum, (b) minimum and (c) average temperatures and (d) precipitation across years.


Figure 4.
The spatial distribution of bare land, shrubs, water and mountains in the study area for the years (a) 1985, (b) 1990, (c) 1995, (d) 2000, (e) 2003, (f) 2013 and (g) 2015.
Figure 4.
The spatial distribution of bare land, shrubs, water and mountains in the study area for the years (a) 1985, (b) 1990, (c) 1995, (d) 2000, (e) 2003, (f) 2013 and (g) 2015.


Figure 5.
Satellite images showing changes in vegetation coverage in different areas. (i) Vegetation change in a rainwater harvesting area during (a) 2006, (b) 2011 and (c) 2017 (Source: Google Earth). (ii) Vegetation change in the Erkwit area during (a) 2011, (b) 2013 and (c) 2016 (Source: Google Earth).

Table 1.
Results of correlation analyses.
| Correlation between Parameters | Correlation Coefficient, R | p-Value |
|---|---|---|
| Max T versus years | 0.877 | 0.010 |
| Min T versus years | 0.880 | 0.010 |
| Average T versus years | 0.930 | 0.002 |
| Precipitation versus years | −0.584 | 0.108 |
| Shrub area versus years | 0.359 | 0.429 |
Table 2.
Results of Mann-Kendall test and Sen’s slope analysis for the maximum, minimum and average temperatures and precipitation.
Table 2.
Results of Mann-Kendall test and Sen’s slope analysis for the maximum, minimum and average temperatures and precipitation.
| MK-Zw | Sen’s Slope | p-Value | |
|---|---|---|---|
| Maximum T | 4.3851 | 0.0733 | 1.1595 e−5 |
| Minimum T | 2.6854 | 0.0400 | 0.0072 |
| Average T | 4.5550 | 0.0545 | 5.2376 e−6 |
| Precipitation | −1.1897 | −0.1263 | 0.2341 |
Table 3.
Precipitation anomalies from 1985 to 2015.
| Year | Max T | Min T | Ave T | Ave P | Anomaly | |||
|---|---|---|---|---|---|---|---|---|
| Max T | Min T | Ave T | P | |||||
| 1985, X1 | 33.35 | 23.53 | 28.44 | 13.2 | −0.85 | −0.57 | −0.70 | 6.44 |
| 1986, X2 | 32.86 | 23.88 | 28.37 | 5.6 | −1.34 | −0.22 | −0.77 | −1.16 |
| 1987, X3 | 33.32 | 24.13 | 28.72 | 0.9 | −0.88 | 0.03 | −0.42 | −5.86 |
| 1988, X4 | 33.92 | 24.89 | 29.40 | 1.2 | −0.28 | 0.79 | 0.26 | −5.56 |
| 1989, X5 | 32.80 | 24.11 | 28.47 | 5.4 | −1.36 | 0.01 | −0.67 | −1.36 |
| 1990, X6 | 33.20 | 23.38 | 28.27 | 4.1 | −1.03 | −0.72 | −0.87 | −2.66 |
| 1991, X7 | 32.96 | 24.54 | 28.75 | 7.4 | −1.24 | 0.44 | −0.39 | 0.64 |
| 1992, X8 | 32.30 | 23.17 | 27.74 | 9.0 | −1.90 | −0.93 | −1.40 | 2.24 |
| 1993, X9 | 33.02 | 23.29 | 28.16 | 20.1 | −1.18 | −0.81 | −0.98 | 13.34 |
| 1994, X10 | 33.60 | 24.79 | 29.19 | 1.7 | −0.61 | 0.69 | 0.05 | −5.06 |
| 1995, X11 | 33.40 | 23.15 | 28.28 | 10.4 | −0.79 | −0.95 | −0.86 | 3.64 |
| 1996, X12 | 34.11 | 23.29 | 28.70 | 5.3 | −0.09 | −0.81 | −0.44 | −1.46 |
| 1997, X13 | 34.03 | 23.15 | 28.59 | 23.4 | −0.17 | −0.95 | −0.55 | 16.64 |
| 1998, X14 | 35.43 | 23.99 | 29.71 | 2.9 | 1.23 | −0.11 | 0.57 | −3.86 |
| 1999, X15 | 35.15 | 24.03 | 29.59 | 13.8 | 0.95 | −0.07 | 0.45 | 7.04 |
| 2000, X16 | 34.52 | 23.49 | 29.01 | 13.6 | 0.32 | −0.61 | −0.14 | 6.84 |
| 2001, X17 | 35.05 | 23.70 | 29.38 | 2.4 | 0.85 | −0.40 | 0.24 | −4.36 |
| 2002, X18 | 34.52 | 23.89 | 29.21 | 8.1 | 0.32 | −0.21 | 0.07 | 1.34 |
| 2003, X19 | 34.13 | 24.14 | 29.13 | 1.7 | −0.07 | 0.04 | −0.01 | −5.06 |
| 2004, X20 | 34.67 | 23.93 | 29.30 | 9.3 | 0.47 | −0.17 | 0.16 | 2.54 |
| 2005, X21 | 34.58 | 24.63 | 29.60 | 3.2 | 0.38 | 0.53 | 0.46 | −3.56 |
| 2006, X22 | 34.77 | 24.49 | 29.63 | 6.5 | 0.57 | 0.39 | 0.49 | −0.26 |
| 2007, X23 | 34.65 | 24.36 | 29.51 | 2.9 | 0.45 | 0.26 | 0.37 | −3.86 |
| 2008, X24 | 34.81 | 24.04 | 29.43 | 0.0 | 0.61 | −0.06 | 0.29 | −6.76 |
| 2009, X25 | 34.69 | 24.44 | 29.56 | 0.7 | 0.49 | 0.34 | 0.42 | −6.06 |
| 2010, X26 | 35.97 | 25.84 | 30.90 | 21.6 | 1.77 | 1.74 | 1.76 | 14.84 |
| 2011, X27 | 34.65 | 23.77 | 29.21 | 1.3 | 0.45 | −0.33 | 0.07 | −5.46 |
| 2012, X28 | 35.33 | 24.47 | 29.90 | 2.5 | 1.13 | 0.37 | 0.76 | −4.26 |
| 2013, X29 | 35.20 | 24.75 | 29.97 | 0.2 | 1.00 | 0.65 | 0.59 | −6.56 |
| 2014, X30 | 34.68 | 25.13 | 29.90 | 6.1 | 0.48 | 1.03 | 0.76 | −0.66 |
| 2015, X31 | 34.51 | 24.86 | 29.68 | 5.0 | 0.31 | 0.76 | 0.54 | −1.76 |
| AV = | 34.20 | 24.10 | 29.15 | 6.76 | ||||
Table 4.
Areas of bare land, shrub, water and mountain in the study area.
| (a) Areas in km2 | |||||
| Years | Bare Land | Shrub | Water | Mountain | |
| 1985 | 137,885.4 | 122,686.9 | 161,783.6 | 230,373.7 | |
| 1990 | 113,302.7 | 154,140.7 | 195,421.5 | 189,110.7 | |
| 1995 | 100,163.7 | 158,568.1 | 205,538.2 | 187,670.7 | |
| 2000 | 136,286.5 | 129,212.2 | 177,182.6 | 209,300.7 | |
| 2003 | 118,777.2 | 137,457.2 | 194,845.1 | 200,899.2 | |
| 2013 | 119,751.6 | 158,988.0 | 210,053.0 | 235,635.3 | |
| 2015 | 118,270.4 | 145,909.0 | 181,891.8 | 205,913.9 | |
| (b) Percentage changes of areas compared to the preceding years. | |||||
| Years | Bare land | Shrub | Water | Mountain | |
| 1990 | −17.83 | 25.64 | 20.79 | −17.91 | |
| 1995 | −11.60 | 2.87 | 5.18 | −0.76 | |
| 2000 | 36.06 | −18.51 | −13.80 | 11.53 | |
| 2003 | −12.85 | 6.38 | 9.97 | −4.01 | |
| 2013 | 0.82 | 15.66 | 7.81 | 17.29 | |
| 2015 | −1.24 | −8.23 | −13.41 | −12.61 | |
© 2020 by the authors. Licensee MDPI, Basel, Switzerland. This article is an open access article distributed under the terms and conditions of the Creative Commons Attribution (CC BY) license (http://creativecommons.org/licenses/by/4.0/).
Share and Cite
MDPI and ACS Style
Loh, P.S.; Mohammed Alnoor, H.I.; He, S. Impact of Climate Change on Vegetation Cover at South Port Sudan Area. Climate 2020, 8, 114. https://0-doi-org.brum.beds.ac.uk/10.3390/cli8100114
AMA Style
Loh PS, Mohammed Alnoor HI, He S. Impact of Climate Change on Vegetation Cover at South Port Sudan Area. Climate. 2020; 8(10):114. https://0-doi-org.brum.beds.ac.uk/10.3390/cli8100114
Chicago/Turabian StyleLoh, Pei Sun, Hussien Ibrahim Mohammed Alnoor, and Shuangyan He. 2020. "Impact of Climate Change on Vegetation Cover at South Port Sudan Area" Climate 8, no. 10: 114. https://0-doi-org.brum.beds.ac.uk/10.3390/cli8100114
Note that from the first issue of 2016, this journal uses article numbers instead of page numbers. See further details here.