Scale-Dependent Reliability of Projected Rainfalls over Bangladesh with the PRECIS Model


1
Institute of Water and Flood Management (IWFM), Bangladesh University of Engineering and Technology (BUET), Dhaka-1000, Bangladesh
2
Department of Civil Engineering, Boise State University, Boise, ID 83706, USA
*
Author to whom correspondence should be addressed.
Climate 2020, 8(2), 20; https://doi.org/10.3390/cli8020020
Submission received: 6 December 2019
/
Revised: 18 January 2020
/
Accepted: 22 January 2020
/
Published: 27 January 2020
Abstract
:The regional climate model, Providing REgional Climates for Impact Studies (PRECIS), has been widely used throughout the world to generate climate change projections for impact studies and adaptations. Its recent application in South Asia also includes the projection of rainfall extremes. In spite of its wide application, a stringent validation of the model is yet to be reported. In this study, we assessed the performance of the model in simulating annual, monthly and extreme rainfalls over Bangladesh by using a number of statistical techniques, e.g., pattern (both spatial and temporal) correlation, root mean square difference (RMSD), mean absolute difference (MAD), Student’s t-test for significance, probability density functions, etc. The results indicated that the PRECIS model could capture the overall spatial pattern of mean annual and monthly rainfalls very well. However, the inter-annual variability was poorly simulated by the model. In addition, the model could not capture the rainfall extremes. A spatial aggregation of rainfall data did not improve the reliability of the model as far as variability and extremes are concerned. Therefore, further improvements of the model and/or its driving global climate model are warranted for its practical use in the generation of rainfall scenarios.
1. Introduction
Reliable climate change scenarios are needed in assessing the potential impacts of climate change in different socioeconomic sectors, as well as in identifying suitable adaptation measures. Global Climate Models (GCMs) and Regional Climate Models (RCMs) are used to derive future scenarios of different hydro-climatic variables. RCMs are used to dynamically downscale coarser resolution climatic variables into finer resolution ones and to better represent meso-scale climatic phenomena. These models simulate complex interactions between atmospheric, oceanic and land processes, and as such exhibit a lot of uncertainties in projected climates. The regional models can add value to GCM projections, but only for certain variables and locations [1] as RCMs develop their own climatology which is not consistent with the driving global datasets of precipitation [2]. The downscaling strategy also introduces uncertainties associated with model physics [3]. The choice of model domain is important in applying an RCM, since a sub-optimal domain may not represent regional climate realistically [4,5,6,7]. The optimum domain size may also vary from place to place depending on local driving factors. With the increase in spatial and temporal resolutions of the regional models, the uncertainties are expected to increase. However, these spatial and temporal scale dependencies of the models have not been systematically investigated in climate change studies.
Providing REgional Climates for Impacts Studies (PRECIS) is an RCM developed by the Hadley Center of the United Kingdom. It has 19 vertical levels in the atmosphere and obtains its lateral boundary conditions from a coupled atmosphere–ocean general circulation model, HadCM3 [8,9,10]. A PRECIS model description is provided in detail in Supplementary Section S1. Since the release of PRECIS, the model has been extensively used in different parts of the world to generate climate change scenarios. It appeared from the review of published literature (see details in Section 2) that, though the PRECIS model has been used to project the monsoon rainfall over Bangladesh, India, Nepal and Bhutan, there has not been any systematic study checking the reliability of the model. The only check that has been done is a comparison of aggregated (both spatial and temporal) rainfall between the observation and model simulation. It has been frequently reported in the literature that there is a bias in simulated rainfalls [11]. It is likely that this bias in the projected (annual, seasonal and monthly) rainfalls would adversely affect the projection of rainfall extremes, such as annual maximum, 99th percentile and 95th percentile. In fact, if a model including the PRECIS fails to simulate the base climate adequately, its projected climates, particularly projected rainfall extremes, are expected to be uncertain. Therefore, with continued and increasing use of the model, more stringent tests, such as frequency distribution of quantities over different spatial scales, even on a specific grid, are warranted [12].
In this study, the performance of the PRECIS model in simulating the rainfall over Bangladesh is evaluated. The selection of Bangladesh as a case study area is guided by the fact that (a) the country is identified as one of the most vulnerable countries to climate change impacts, and (b) a number of vulnerability studies are currently being conducted for the country using projected climate data (for example, the Ecosystem Services for Poverty Alleviation [ESPA] project funded by the UK′s Department for International Development [DfID], and the DEltas, vulnerability and Climate Change: Migration and Adaptation [DECCMA] project funded jointly by DfID and Canada′s International Development Research Center [IDRC]; both the ESPA and DECCMA projects are using RCM projection).
The paper is organized as follows. In the next section, the current state of the research field on PRECIS model is reviewed. The study area, methodology and the data collected and used in the study are described in Section 3. The climate model used and the statistical analyses employed are also described in this section. The findings of the study—particularly the comparison between observed and model-simulated rainfalls at various spatial and temporal scales—are then discussed in Section 4. Finally, some conclusions are drawn in the final section of the paper.
2. Literature Reviews
Since the release of PRECIS, the model has been widely used to generate climate change impact scenarios for South Asia including Bangladesh. For example, Islam et al. [13] and Islam [14] generated rainfall and temperature scenarios for Bangladesh by running the model at a horizontal resolution of 50 km. It was reported that the model overestimated the pre-monsoon season rainfall and underestimated the monsoon season rainfall and, therefore, the model-generated rainfall could not be used directly in application purposes. A linear regression technique between simulated and observed rainfalls was also proposed there, to adjust the model-generated rainfall. Nowreen et al. [15] studied the changes in rainfall extremes in the northeastern part of Bangladesh using the PRECIS generated rainfalls. However, the inherent limitation of the PRECIS model is also apparent from the results therein. The model had difficulty in capturing important topographical and physical processes responsible for precipitation patterns at the regional scale [10]. For example, the simulated rainfalls of the model from March to October were lower than the observed rainfalls indicating that the model underestimated the rainfalls in these months. The underestimation was also higher for the months having higher rainfalls. This is in line with the observations in [16] on the underestimation of rainfall by the PRECIS as a model for Pakistan. Rajib [4] studied the changes in monthly rainfalls in three time periods (i.e., 2011–2040, 2041–2070 and 2071–2100) and compared those with the observed rainfall of a base period (1971–2000) over Bangladesh. The monthly rainfalls for future periods were obtained from four GCMs and the PRECIS outputs at the country level as 30 years’ average. Though the PRECIS outputs were not reported separately, it was reported that the rainfalls in all the months would increase in the future.
The PRECIS model was used to develop high resolution climate change scenarios over India [17]. Here, the model was found to be overestimating all-India summer monsoon rainfall and underestimating the variability. Furthermore, there was significant positive bias in the rainfall during the onset phase of the monsoon (May and June). Revadekar et al. [18] studied precipitation extremes over India based on a comparison of baseline and future simulations of PRECIS. The authors, however, did not report on the performance of the model in simulating baseline extremes, which could have been done by a comparison of the observed and simulated rainfall extremes during the base period. Projections of the summer monsoon rainfall over India were made in [19] with the PRECIS simulation. Here, it was found that the model could simulate the 30-year average rainfall magnitude well, but it underestimated the seasonal rainfall variability. The latter indicates that there is a smoothing tendency in the rainfall response in the model. The precipitation over the Bay of Bengal region was also reported as being overestimated. The spatial pattern of the projected number of rainy days was found to differ among the ensembles, suggesting uncertainties in the projections.
The uncertainties in the two regional climate model simulations (RegCM4 and PRECIS) of the South Asian summer monsoon were evaluated in Syed et al. [2]. Their results show large differences in rainfalls between the two RCMs and the observations. The inter-annual variability over the six sub-regions studied, which included Bangladesh, was not well captured during the summer monsoon. They also mentioned that both GCMs and RCMs were impacted by uncertainties that weakened the confidence in end projections, and thereby limited the usefulness thereof in planning and policy decisions. Zacharias et al. [10] reported that the PRECIS generated rainfalls across India had a bias of +34% to −89% in the annual scale, indicating ‘poor performance of the model in simulating the baseline rainfall patterns’. The model also simulated more rainy days in the baseline period than those observed. The PRECIS simulation was found to capture the shape of the annual rainfall cycle over the western and central Himalayas [20]. However, for the eastern Himalayas, where Bangladesh is located, the peak of the rainfall hydrograph was simulated two months earlier in May or June. A wet bias in model simulation was also reported for the three regions.
3. Study Area, Methodology and Data
Bangladesh is extremely vulnerable to climate change and, in fact, it is one of the most vulnerable countries in the world [21]. Having a huge population (about 180 million) spread over a small geographic area (about 147,000 km2), the country is located at the confluence of the three mighty rivers—the Ganges, the Brahmaputra and the Meghna—and at the northern margin of the Bay of Bengal. It experiences a tropical monsoonal climate with distinct dry and wet seasons. Mean annual rainfall varies between 1500 to 4400 mm (Figure 1). About 80% of the country is floodplain and 33% is in the coastal zone with a low altitude. The major livelihood activities of the country are dependent on natural resources. The economic condition of the country is poor and there is wide-spread poverty and unemployment. All these factors have made the country vulnerable to different hydro-climatic hazards. Floods, cyclones, river erosion, soil and water salinization, groundwater contamination with arsenic, and waterlogging are among the major hazards affecting the country. Climate change led by global warming is expected to further aggravate the situation. To assess the potential impacts of climate change on different socioeconomic sectors and to plan for possible adaptation and mitigation measures, the reliable projection of climatic variables for the country is essential.
The reliability of the PRECIS model in simulating rainfall of Bangladesh was assessed by employing a number of statistical techniques. Among the techniques, a pattern similarity statistic suggested in Santer et al. [22] was used to compare the observed time-evolving change patterns of a climatic variable with the model-predicted signal patterns. Such pattern/map correlation between the model-simulated and observed rainfalls was computed for a base period of 1986–2005. The same period was used in the fifth assessment report of the Intergovernmental Panel on Climate Change (IPCC) [23] as the base period. The pattern correlation was computed for annual, seasonal, monthly, annual maximum, 99th percentile and 95th percentile rainfalls. The pattern correlation method was used by IPCC in its second and third assessment reports. From the 20 yearly values of a variable corresponding to a model grid point, a grid point average value of the variable was obtained. The pattern correlation was obtained from the different grid point average values between the model and observed series.
In addition to the spatial-pattern correlation, temporal correlation, root mean square difference (RMSD), the mean absolute difference (MAD) and probability density functions (PDFs) between the model and observed rainfalls were computed to check the appropriateness of the model projections. RMSD and MAD were expressed in percentages by dividing those with the corresponding observed mean rainfalls. For each model grid, the yearly rainfall time series was generated first for each rainfall variable (annual, monthly or extreme rainfall), and then the presence of temporal trends in each variable was investigated and, where present, it was removed by detrending. The detrending was done by subtracting and adding the respective rise and fall of the trend line above and below a horizontal base line from the observed or simulated rainfall. The detrending was done to avoid spurious correlation solely due to the presence of trends in the series. The correlation between the detrended model and observed rainfalls was then computed. The correlation facilitates a better evaluation of the capacity of a climate model to reproduce the observed inter-annual variability [24]. The inter-annual correlation/variability between climate model-simulated and observed rainfalls was also investigated in earlier studies [2,10,24,25,26,27]. The statistical significance of the correlation was determined by applying the standard Student’s t-test. In addition, PDFs were calculated for rainfall indices namely, annual, monthly and annual maximum between observed and modelled simulations over the base period at different locations/grids near 28 BMD stations.
The simulated daily rainfall was collected from the Met Office, UK for a period of 1971–2099 at an approximate horizontal resolution of 0.22° × 0.22° (25 km × 25 km). The data were generated from the PRECIS regional climate model driven by atmosphere–ocean coupled HadCM3 boundary conditions. The basic aspects, such as dynamical flow, the atmospheric sulphur cycle, clouds and precipitation, radiative processes, the land surface and the deep soil, are explicitly handled by the model and are described in Jones et al. [12]. The validation of the model is done by Caesar et al. [28]. The HadCM3 simulation used here is from the standard original parameter settings in the atmospheric component of the model. The simulation utilizes observed greenhouse gas forcing for the historical period and A1B scenario of the Special Report on Emissions Scenarios (SRES) for the future period. The SRES A1B scenario [29] represents a medium-high emissions scenario which assumes a future of strong economic growth leading to an increase in the rate of greenhouse gas emissions with no explicit climate change mitigation policy. The atmospheric carbon dioxide equivalent concentration rises throughout the 21st century to around 900 ppm by 2100. This scenario provides overlap and consistency with much of the existing climate modeling work, and is fairly consistent with observed carbon emissions since the 1980s [30,31]. IPCC has used one ensemble from each model in its latest 5th Assessment Report [23].
Measured daily rainfall data were collected from the Bangladesh Meteorological Department (BMD), Dhaka. BMD is the sole government organization which measures and maintains credible climatic data. There are 28 observational stations of BMD within the study area of about 147,000 km2. Daily rainfall monitored at all 28 gauges of BMD successfully passed the homogeneity test by various literatures [32,33,34,35]. Notably, for all 28 BMD stations Khan et al. [34] found almost straight lines with no breakpoint in the double mass curves and Mahmud et al. [35] observed homogenous using Standard Normal Homogeneity test, Von Neumann Ratio test, Buishand Range test and Pettitt test. Thereby, the BMD rainfall data are considered reliable and is widely used in scientific studies [36,37,38] and government documents. We used data from all 28 stations within the study area for the purpose of generating a baseline map, and for the quantitative comparison of observed and model-simulated rainfalls. A point-to-point comparison was made between the two data sets and the results are discussed in the next section. The model grid in which a BMD station was located was considered as a point corresponding to that station [14].
4. Results and Discussion
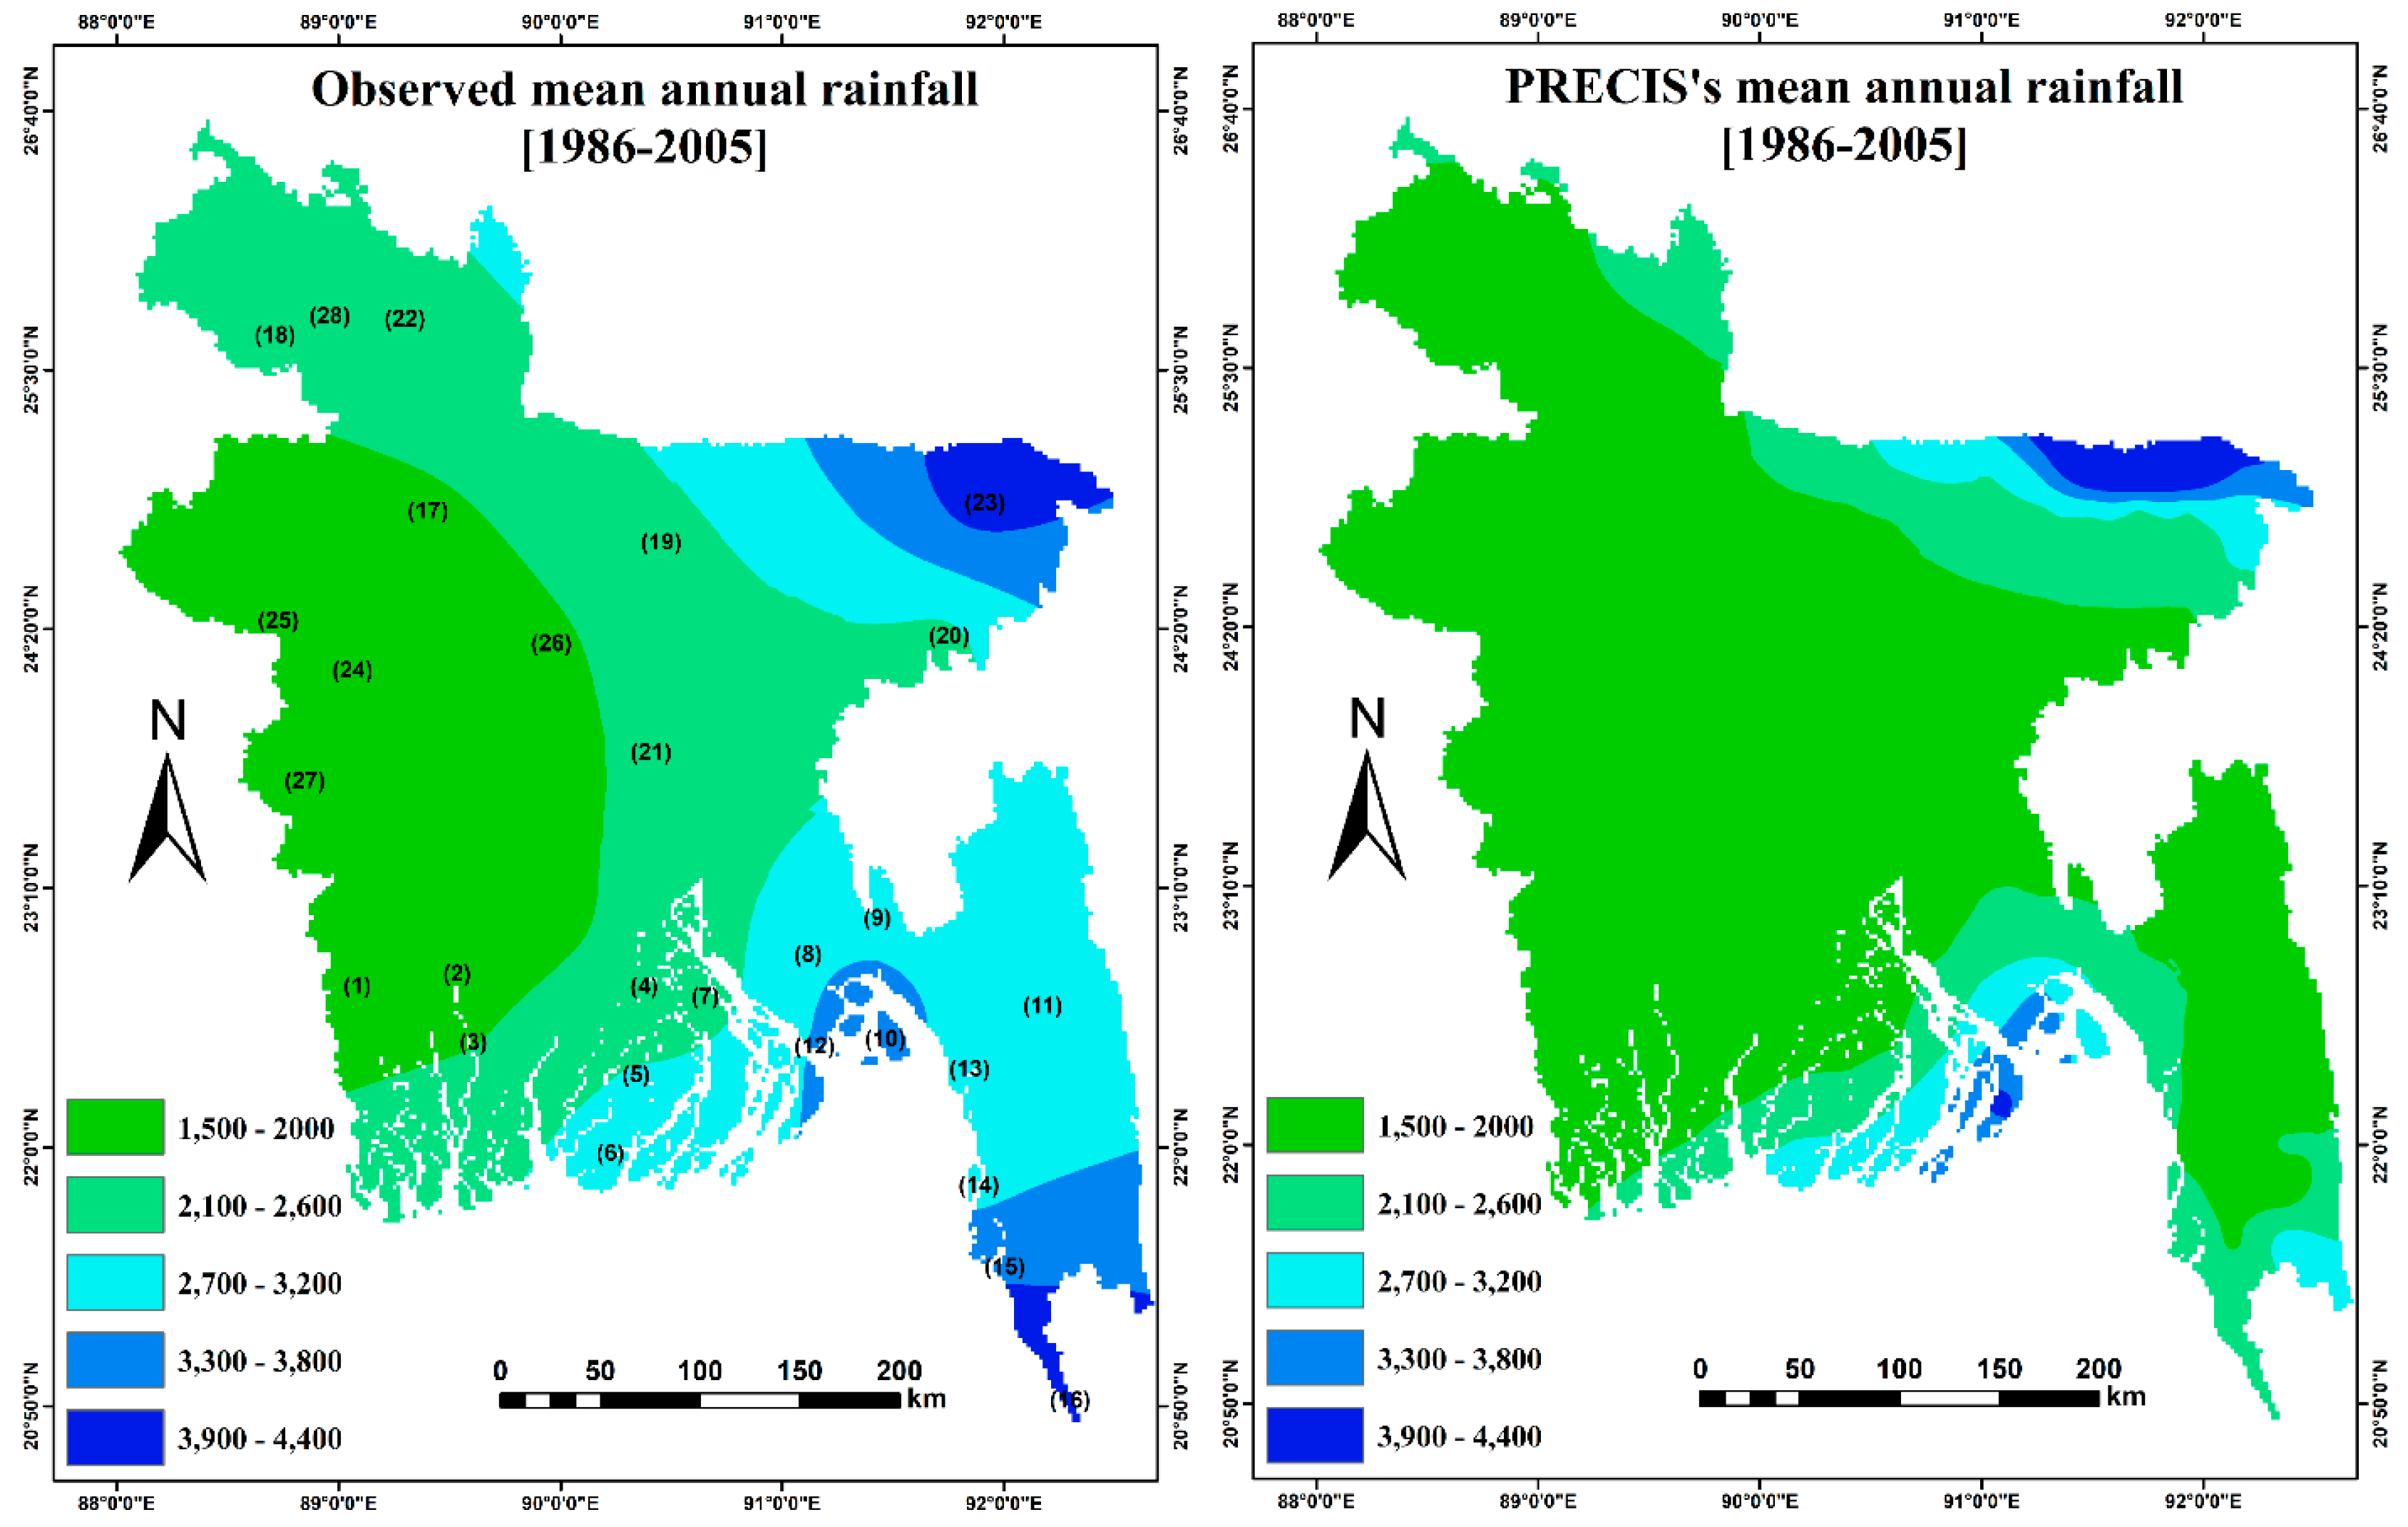
The average annual rainfall over the study area for the base period (1986–2005) was found to be 2025 mm from the model simulation; the same was found to be 2535 mm from the observed data. Thus, the average rainfall from the model simulation was about 20% less than the observed rainfall. The spatial distribution of both observed and model-simulated mean annual rainfalls are given in Figure 1. It is noticed from the figure that the low rainfall domain (1500–2000 mm) is larger in the model-simulated rainfall as compared to that of the observed one. Thus, the low rainfall areas were overestimated in the model. Furthermore, the high rainfall domain (3900–4400 mm)—particularly in the southeastern part—in the simulated rainfall was lower than that in the observed rainfall. Thus, there is a dry bias in the simulated rainfall over Bangladesh in the model. Similar findings were also reported in [14]. This could be due to the poor representation of the topographical and physical processes responsible for monsoon precipitation in the model [10]. In the case of pattern correlation in mean annual rainfall between the observed and simulated rainfalls, a high correlation coefficient of 0.78 was found. This high correlation may be spurious and is probably due to the similar spatial variation pattern in the two data sets. The MAD and RMSD were found to be 23% and 28%, respectively.
The point-to-point scatter plots and correlations between the observed and corresponding simulated annual rainfalls are given in Supplementary Figure S1 and Table 1, respectively. It is seen from the Table 1 that the correlation coefficient varies widely—from −0.52 at Chittagong to +0.61 at Patuakhali. Furthermore, it is evident that the correlation coefficients are relatively small except for Patuakhali. The MAD and RMSD of the simulated rainfalls vary from 16%–45% and 20%–51%, respectively. Thus, there is a large error in simulated annual rainfall over the study area.
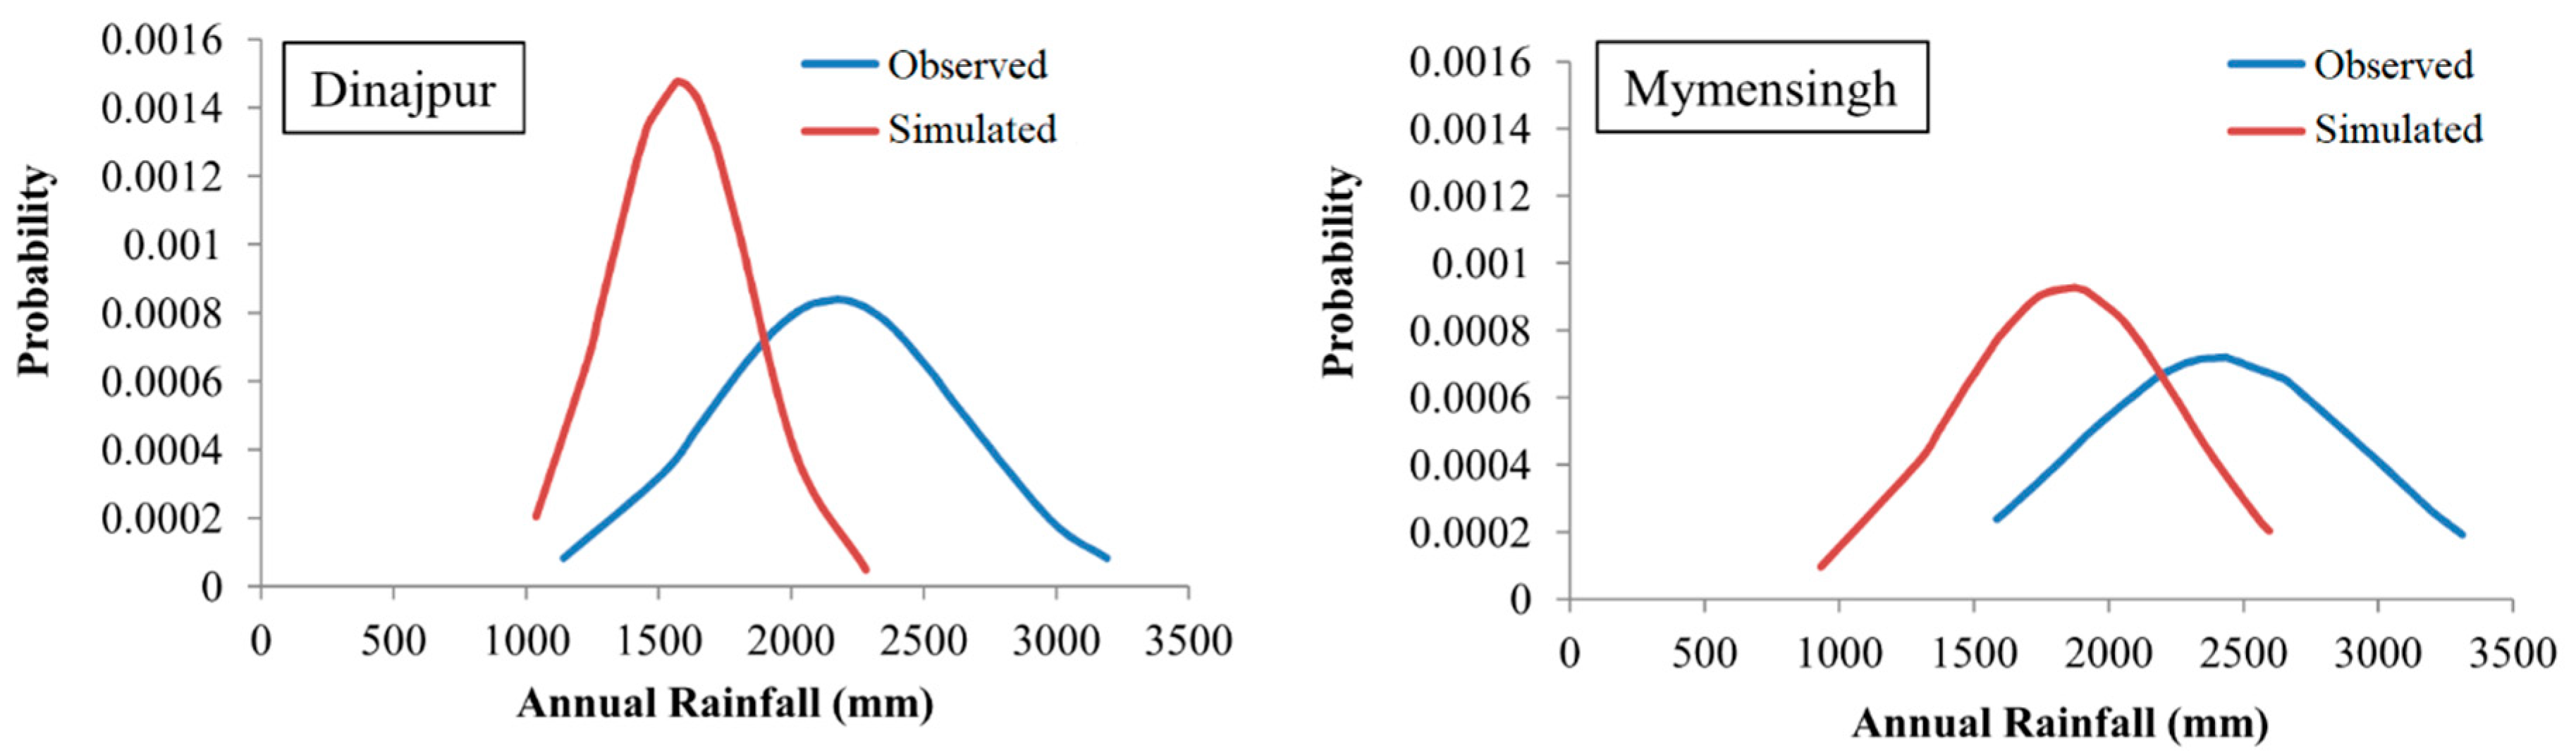
Comparisons of probability density functions (PDFs) between the observed and simulated rainfalls over the base period at different locations of the study area were also made (Supplementary Figure S2). Such comparisons for two locations (Dinajpur in the northwest and Mymensingh in the north-central Bangladesh) are shown in Figure 2 as an example. It is seen from the figure that neither the location parameter nor the shape parameter of the observed rainfall is captured by the simulated rainfall. The location parameter is underestimated in model simulation and the shape parameter always has a higher peak and smaller base in simulated rainfall. Thus, the model fails to capture the spread of observed rainfalls and provides rainfalls within a narrow range. Furthermore, the PDFs from the observed rainfalls are almost symmetrical, whereas that from the simulated rainfalls are either positively (Dinajpur) or negatively (Mymensingh) skewed.
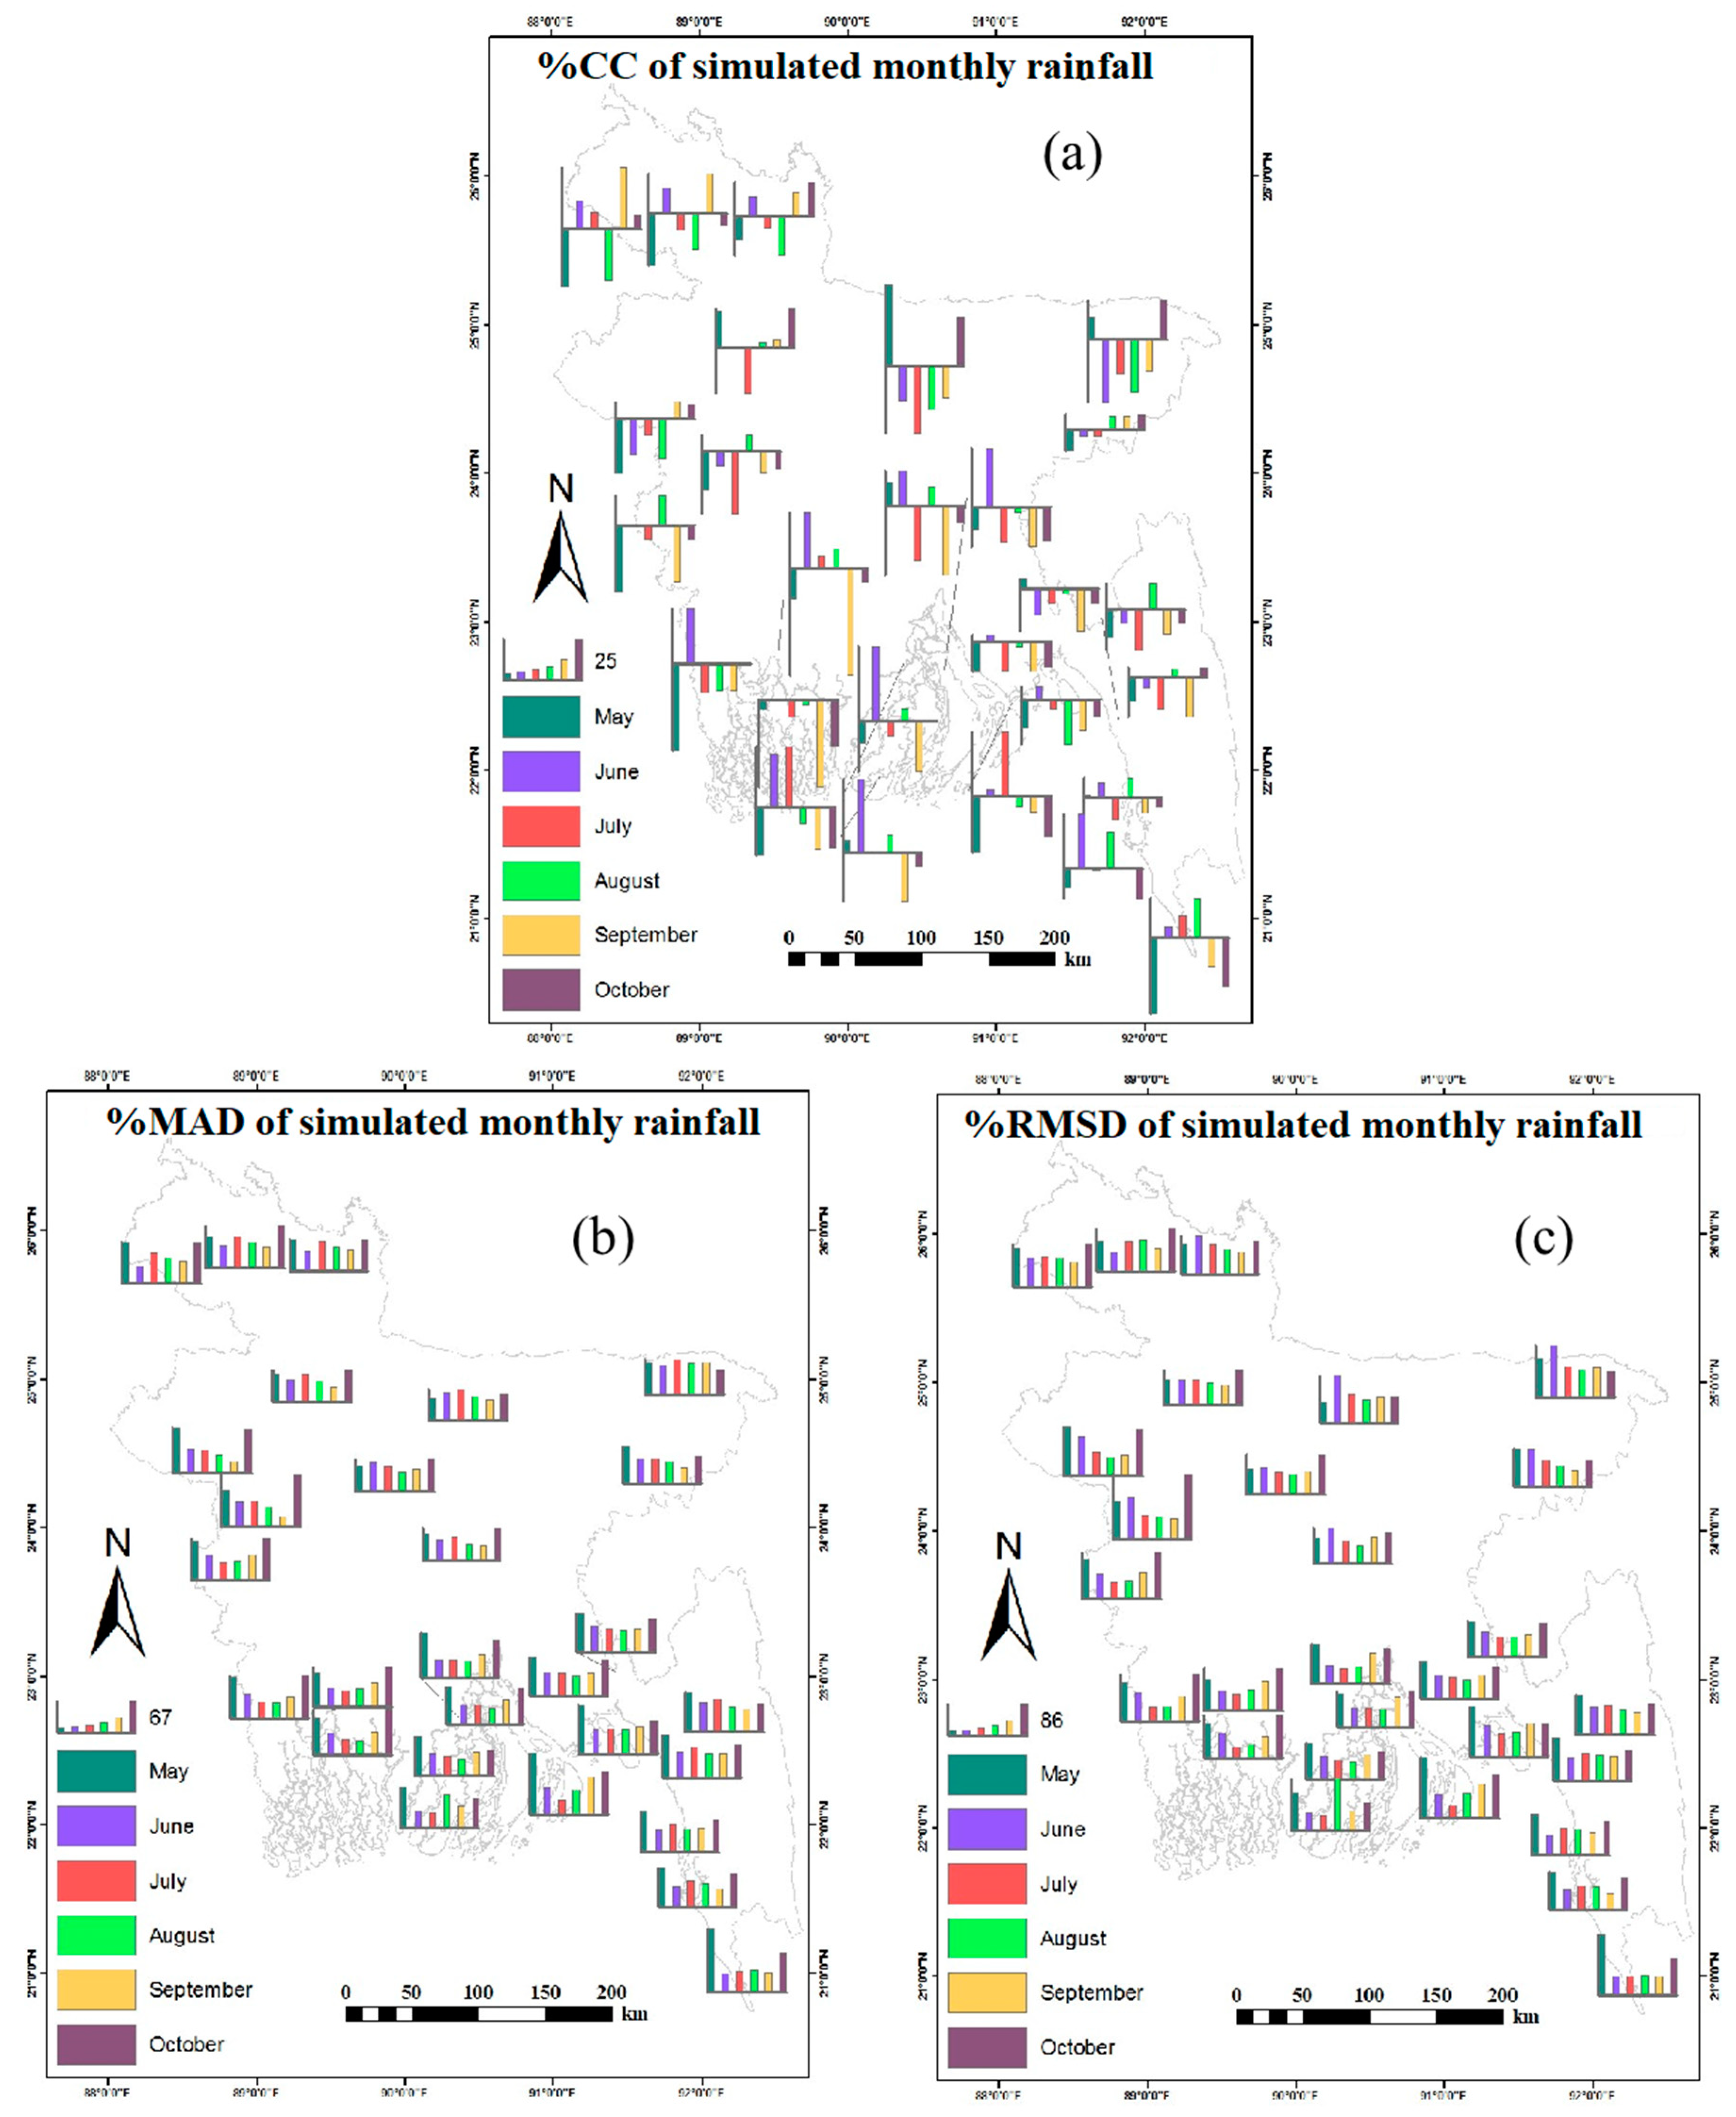
The performance of the model in simulating monthly rainfalls was assessed. The assessment was made only for those months which have monthly rainfalls greater than zero in all the years. The results are shown in Figure 3 (and also reported in Supplementary Table S1) which shows that the model fails to capture the monthly rainfall characteristics at individual stations as the correlation coefficients are often low or negative, and MADs and RMSDs are high. As an example, the correlation coefficients are negative for the month of September at 21 (out of 28) stations in the study area. The other stations also had lower values of correlation coefficients. This indicates that the model is not able to capture the inter-annual rainfall variability in September, the last month of the monsoon season. This could be due to the failure of the model in capturing the monsoon recession from Bangladesh adequately. The MAD varies from 21%–78% and RMSD from 44%–93% for the month of September. The inter-annual variability of rainfall is poorly captured for the months of July and August of the monsoon season. However, it is interesting to note that the pattern correlations are quite high for these months. For example, the pattern correlations for the months of June, July and August were found to be 0.88, 0.69 and 0.67, respectively, which are very high. Thus, it appears that the pattern correlation may not be a good indicator to judge the performance of a climate model. This was also echoed earlier in [39].
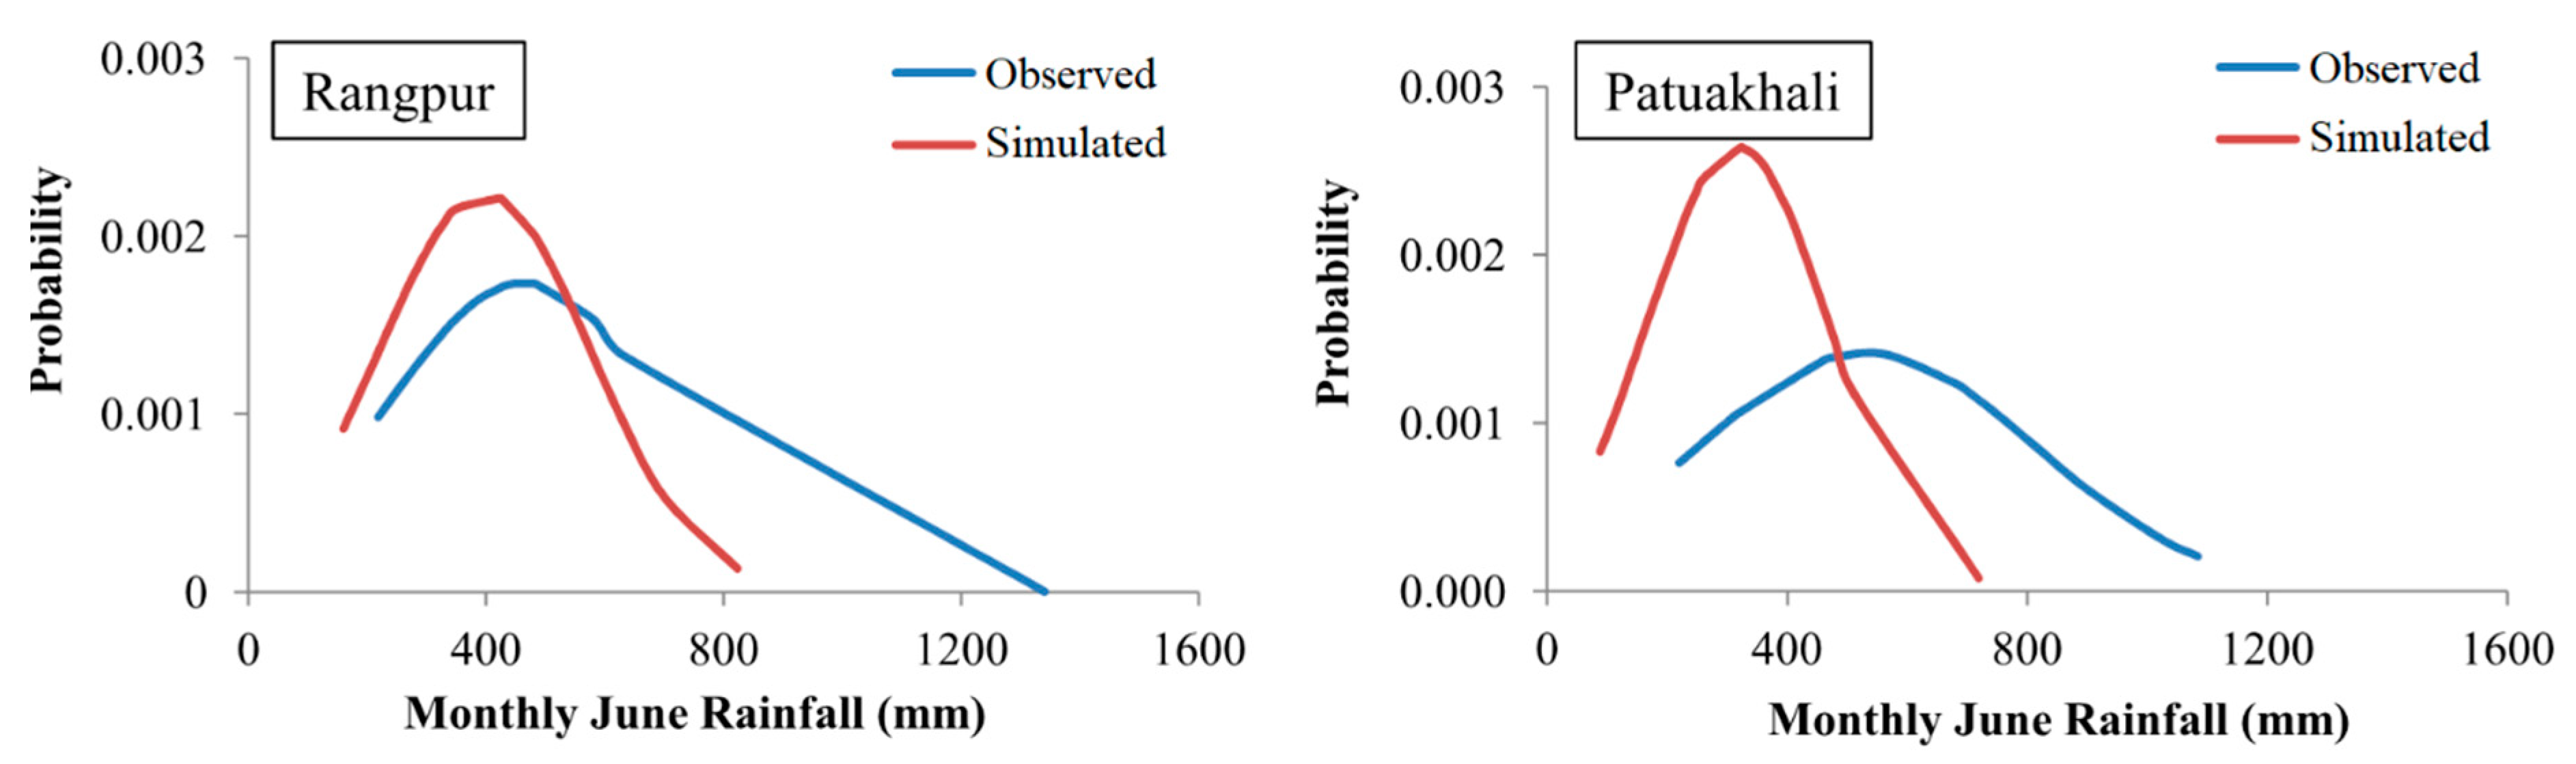
Comparisons of the PDFs between observed and simulated rainfalls for different months at different locations were also made. The results were more or less similar for different months. As an example, the comparison for the month of June for Rangpur in the northwest and Patuakhali in south-central Bangladesh indicated that there was a negative bias in scale parameter and a positive bias in shape parameter (Figure 4). The areal average observed rainfall in June was 491 mm and simulated rainfall was 404 mm. Thus the simulated rainfall was grossly underestimated by the model.
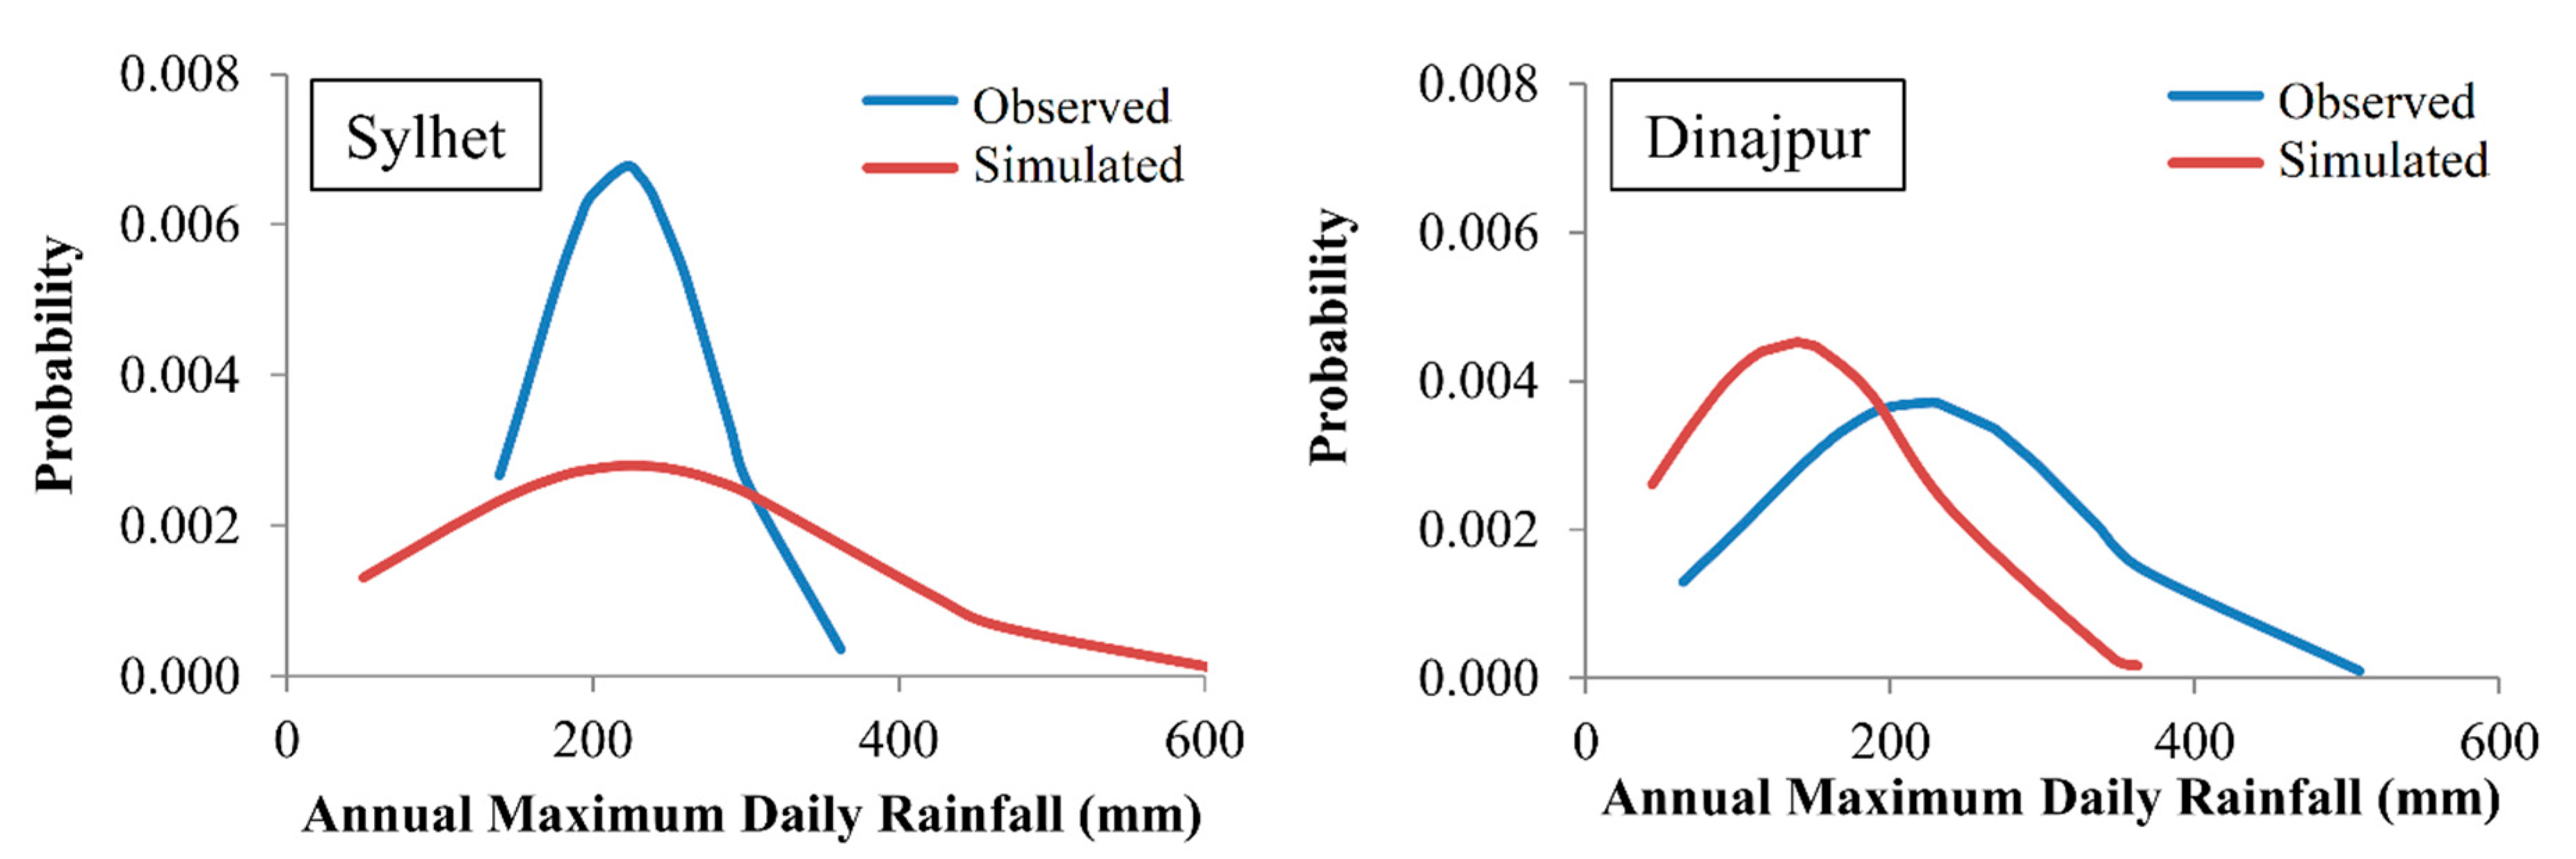
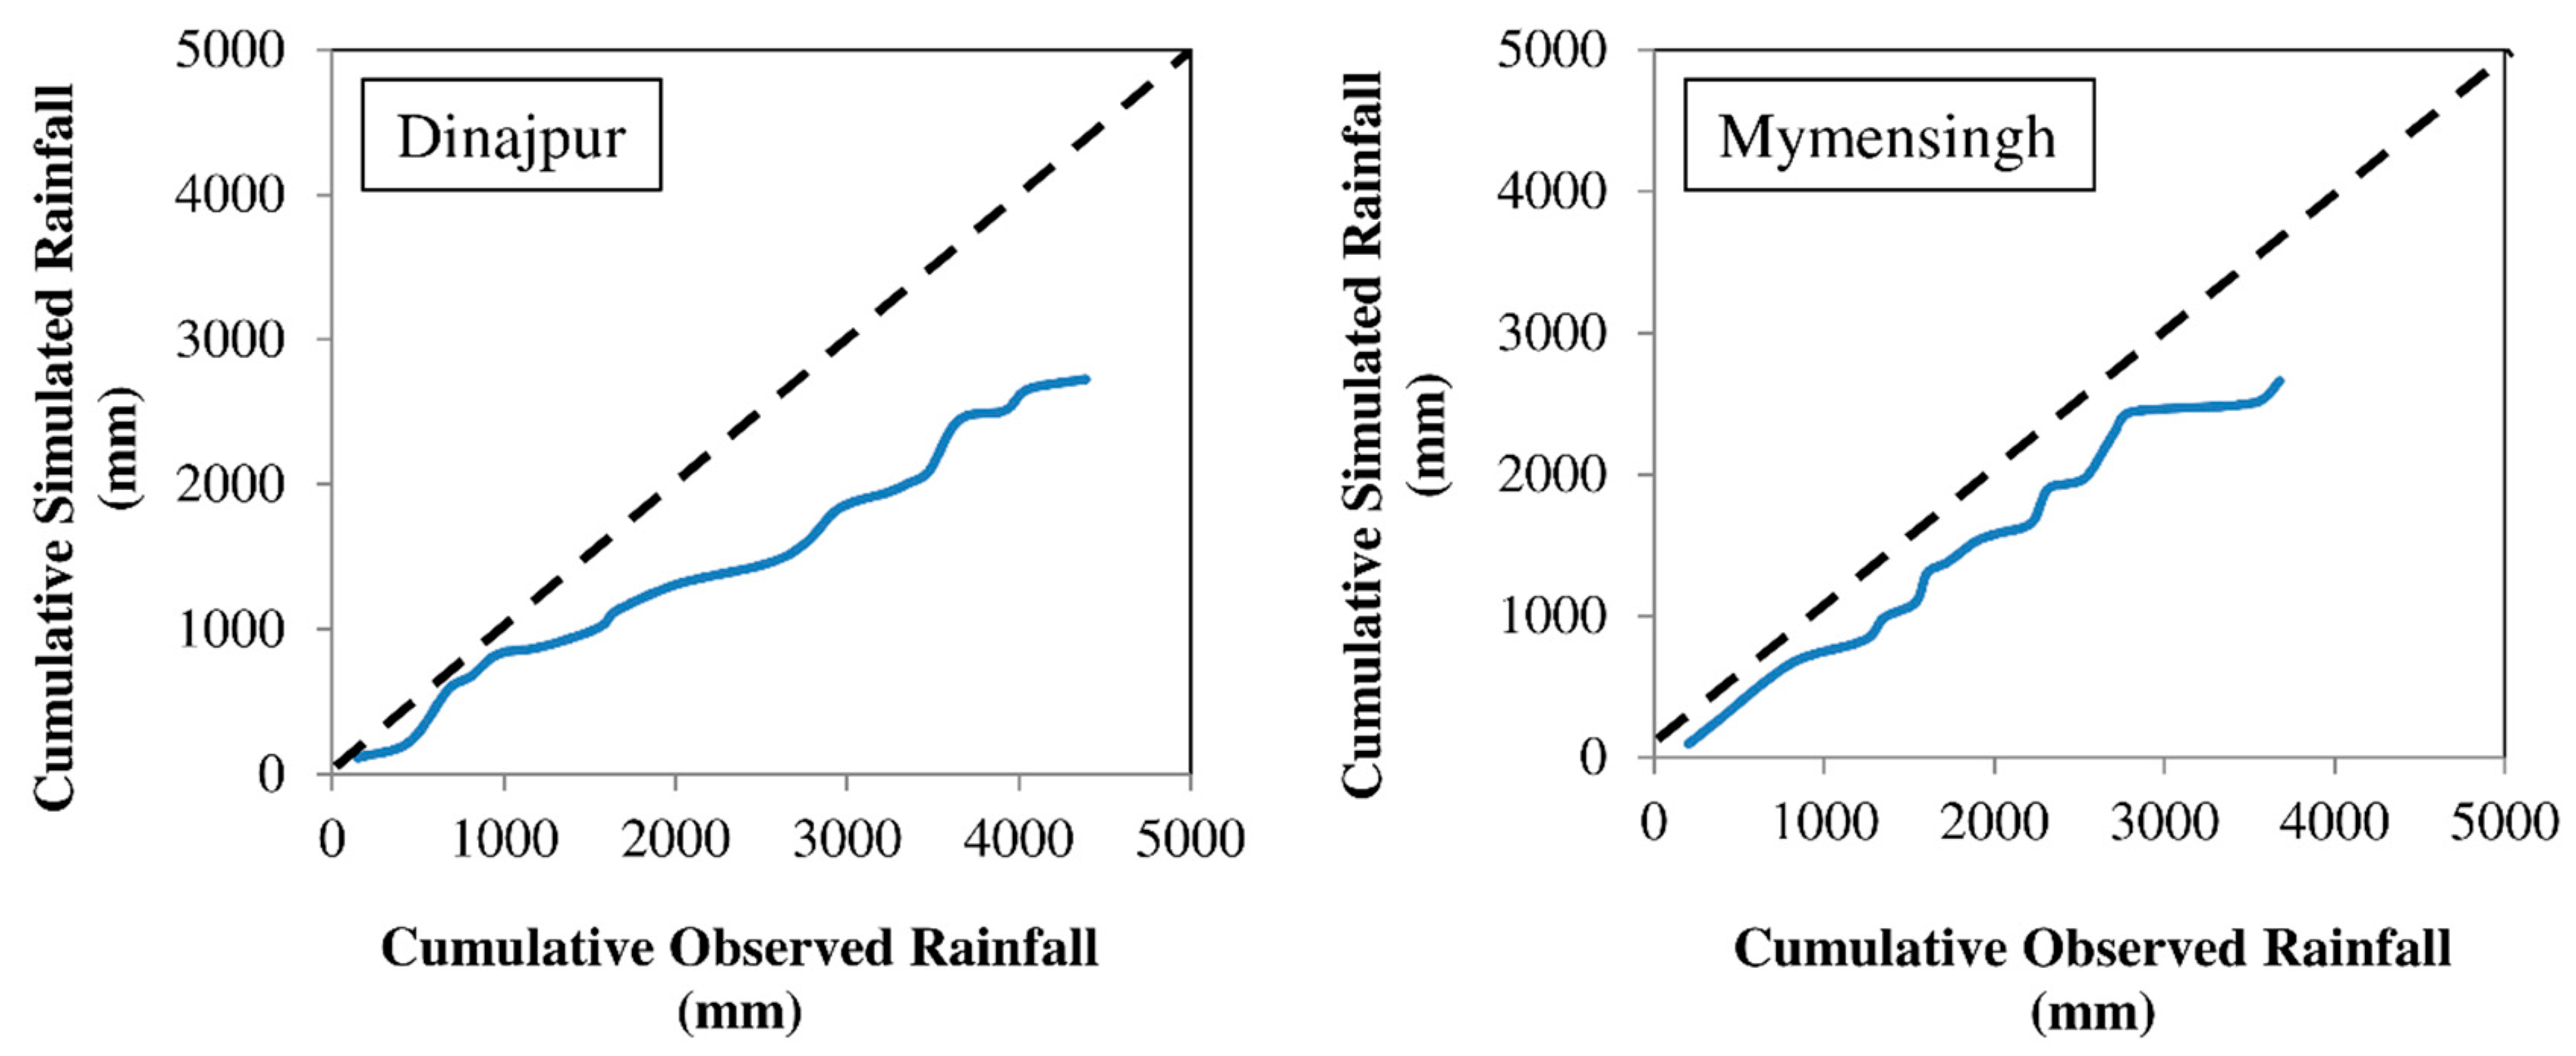
A further comparison was made between the observed and simulated annual maximum daily rainfalls with their PDFs (Supplementary Figure S3). The results are shown in Figure 5 for Sylhet in the northeast and Dinajpur in the northwest Bangladesh. It is seen from the figure that the shape parameter of the PDF for Sylhet and the scale parameter of the PDF for Dinajpur are poorly simulated by the model. The underestimation of the scale parameter was found to be almost universal throughout the study area. This indicates that the annual maximum rainfall was underestimated by the model. In fact, the average annual maximum observed rainfall was found to be about 170 mm and that of the model-simulated rainfall was found to be about 138 mm. The underestimation is also evident in the double mass curves of annual maximum rainfalls (Figure 6). The MAD between the observed and simulated maximum rainfalls was found to vary between 35% and 69%, and the RMSD between 44% and 93% depending on the locations. Thus, the error in simulated annual maximum rainfall was very high. More importantly, the correlation coefficients were negative in 17 out of 28 locations for which observed data were available. The other 11 stations also had very low values. It thus appears that the uncertainty in simulated annual maximum rainfall is higher than that of annual average rainfall.
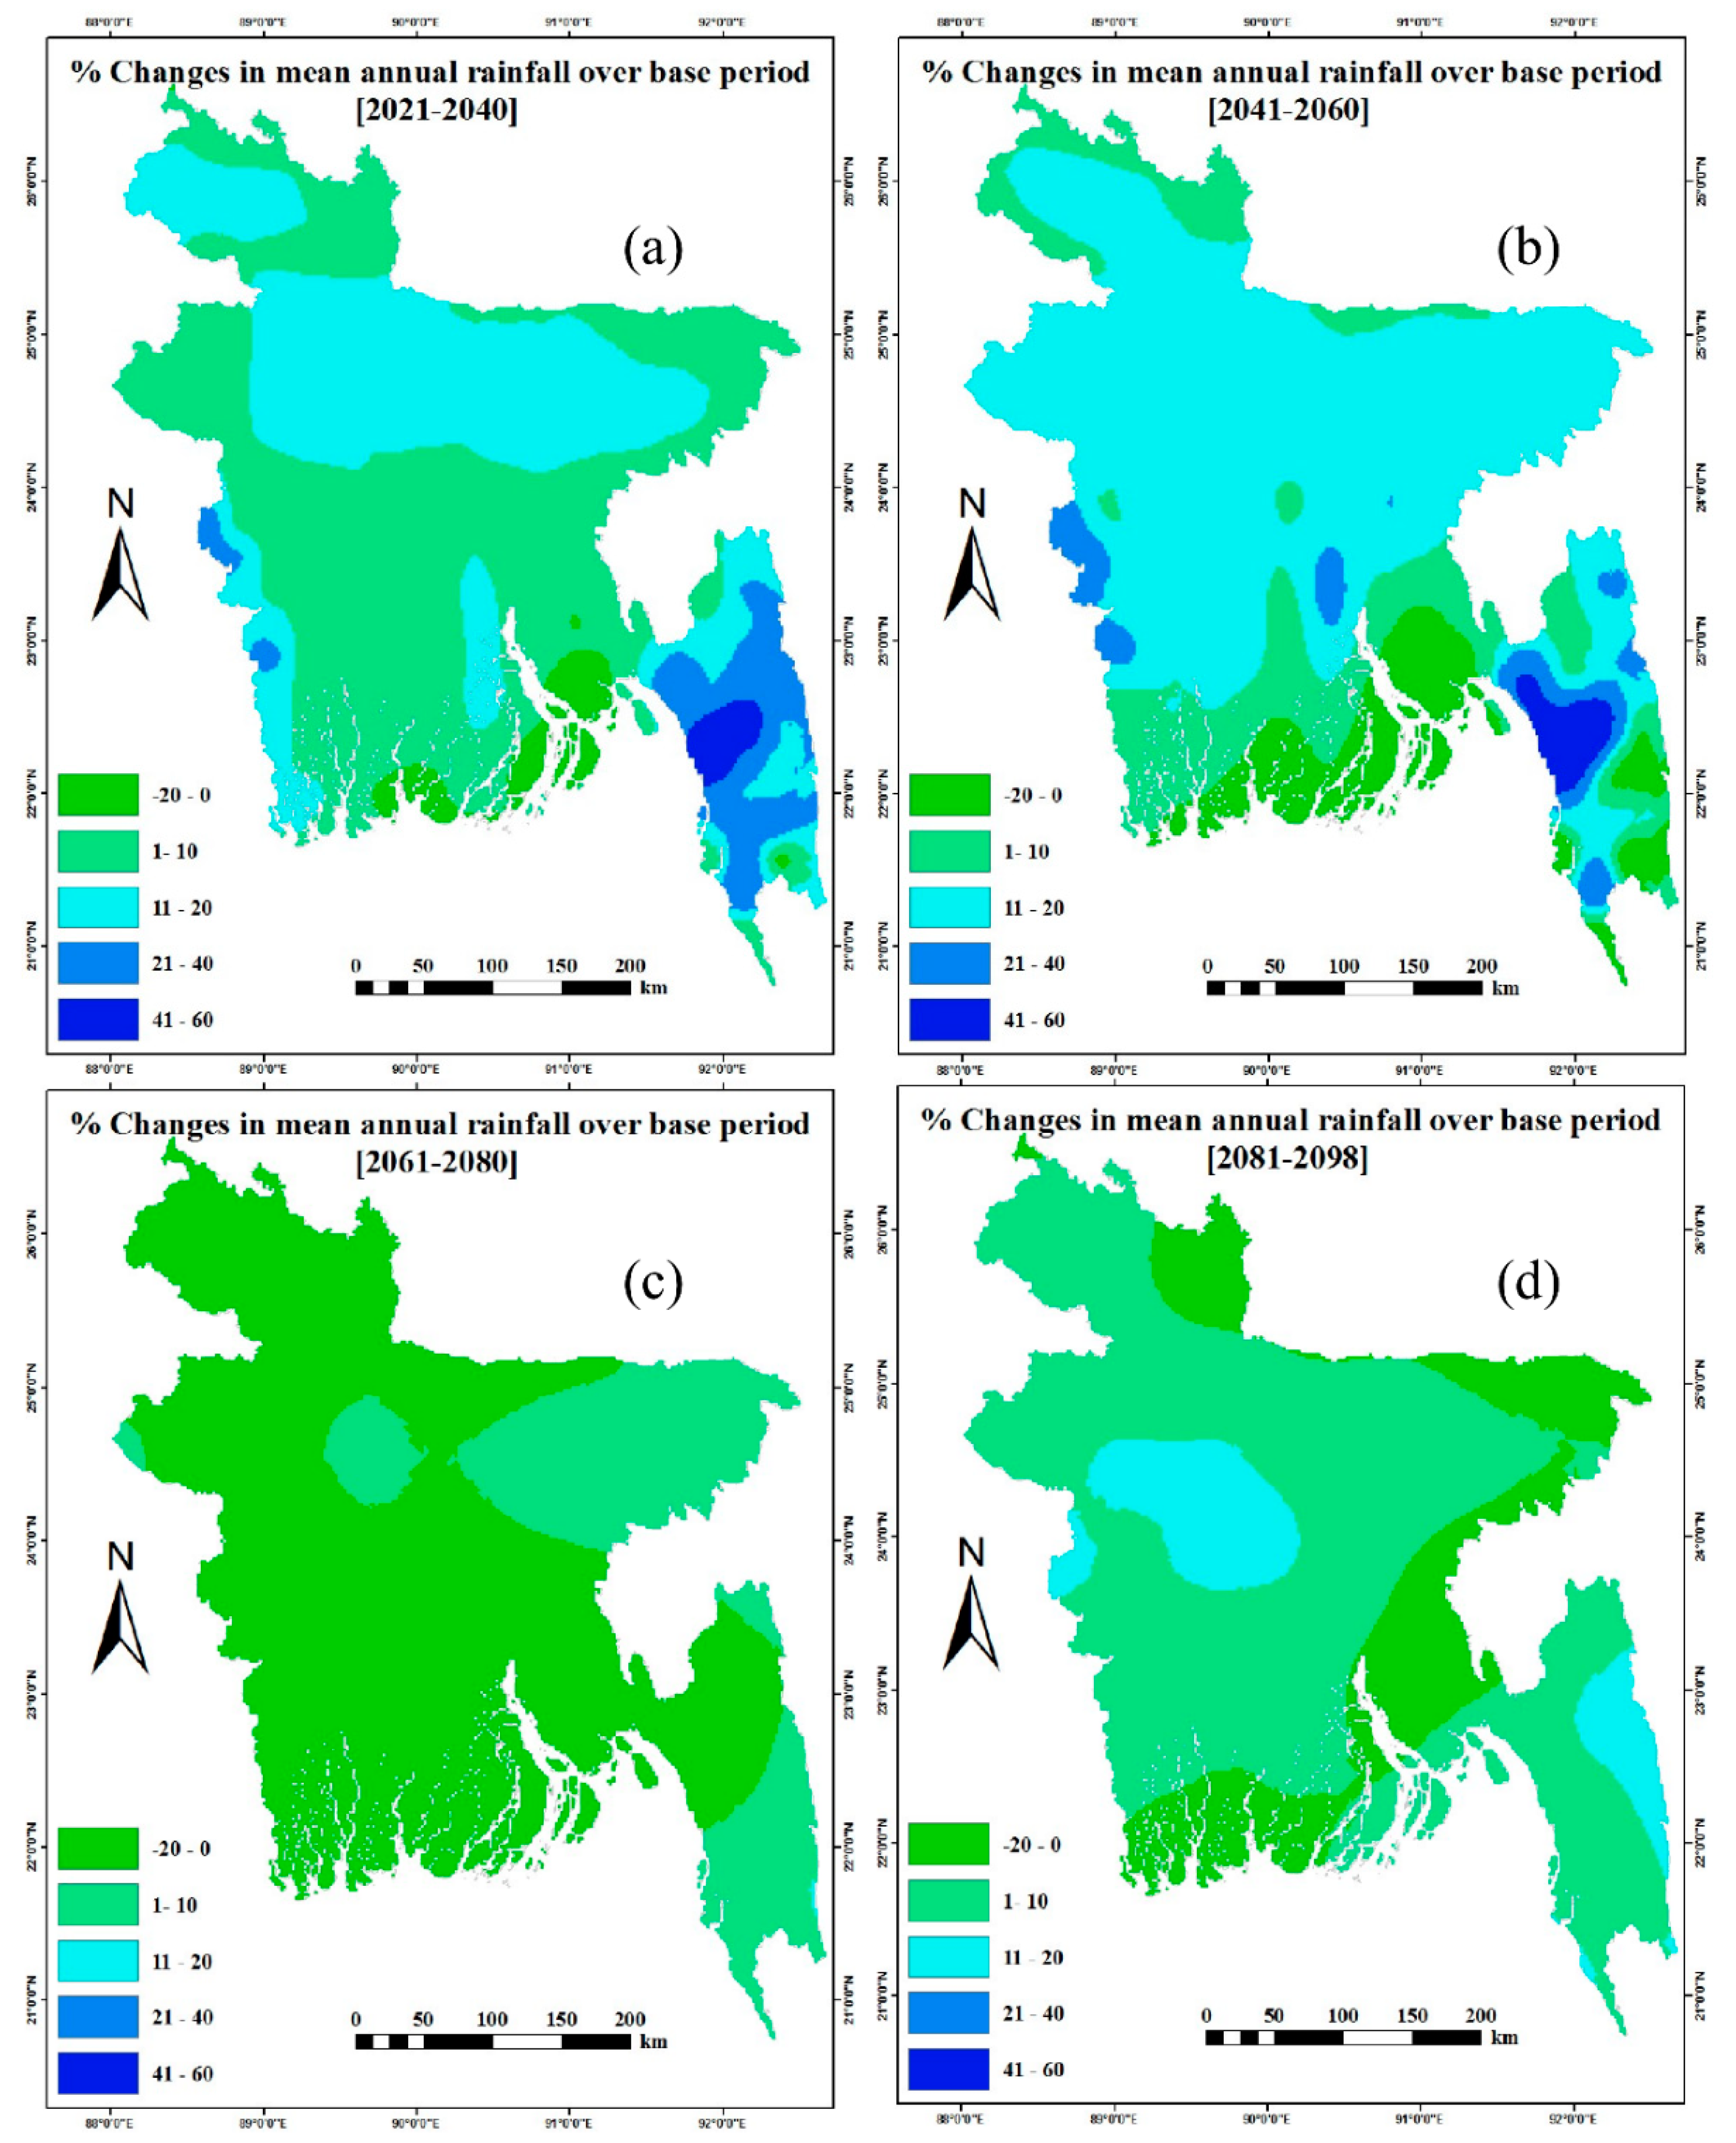
The consistency—and hence reliability—of the model results were also assessed by comparing the simulation results among different future time periods. The results for mean annual rainfall are shown in Figure 7. It is seen from the figure that the rainfall is projected to be mainly increased during the period of 2021–2040. The major increase is expected to be over the Chittagong region. The pattern of increased rainfall is also evident for the period of 2041–2060. However, there is a shift in the zone of maximum change. For 2021–2040, the zone of maximum change is near the south-east side, whereas for 2041–2060, it is almost all over Bangladesh. The reason for this shift in the zone is not understood. Moving to the period of 2061–2080 in the figure, we see that a decrease in rainfall manifests over the entire region. The same is also true for the period of 2081–2100. Thus, one can deduce that the rainfall would decrease in the long term. However, it is not clear whether there is any physical basis of this decrease or if it is simply the result of the incapability of the model to simulate the rainfall.
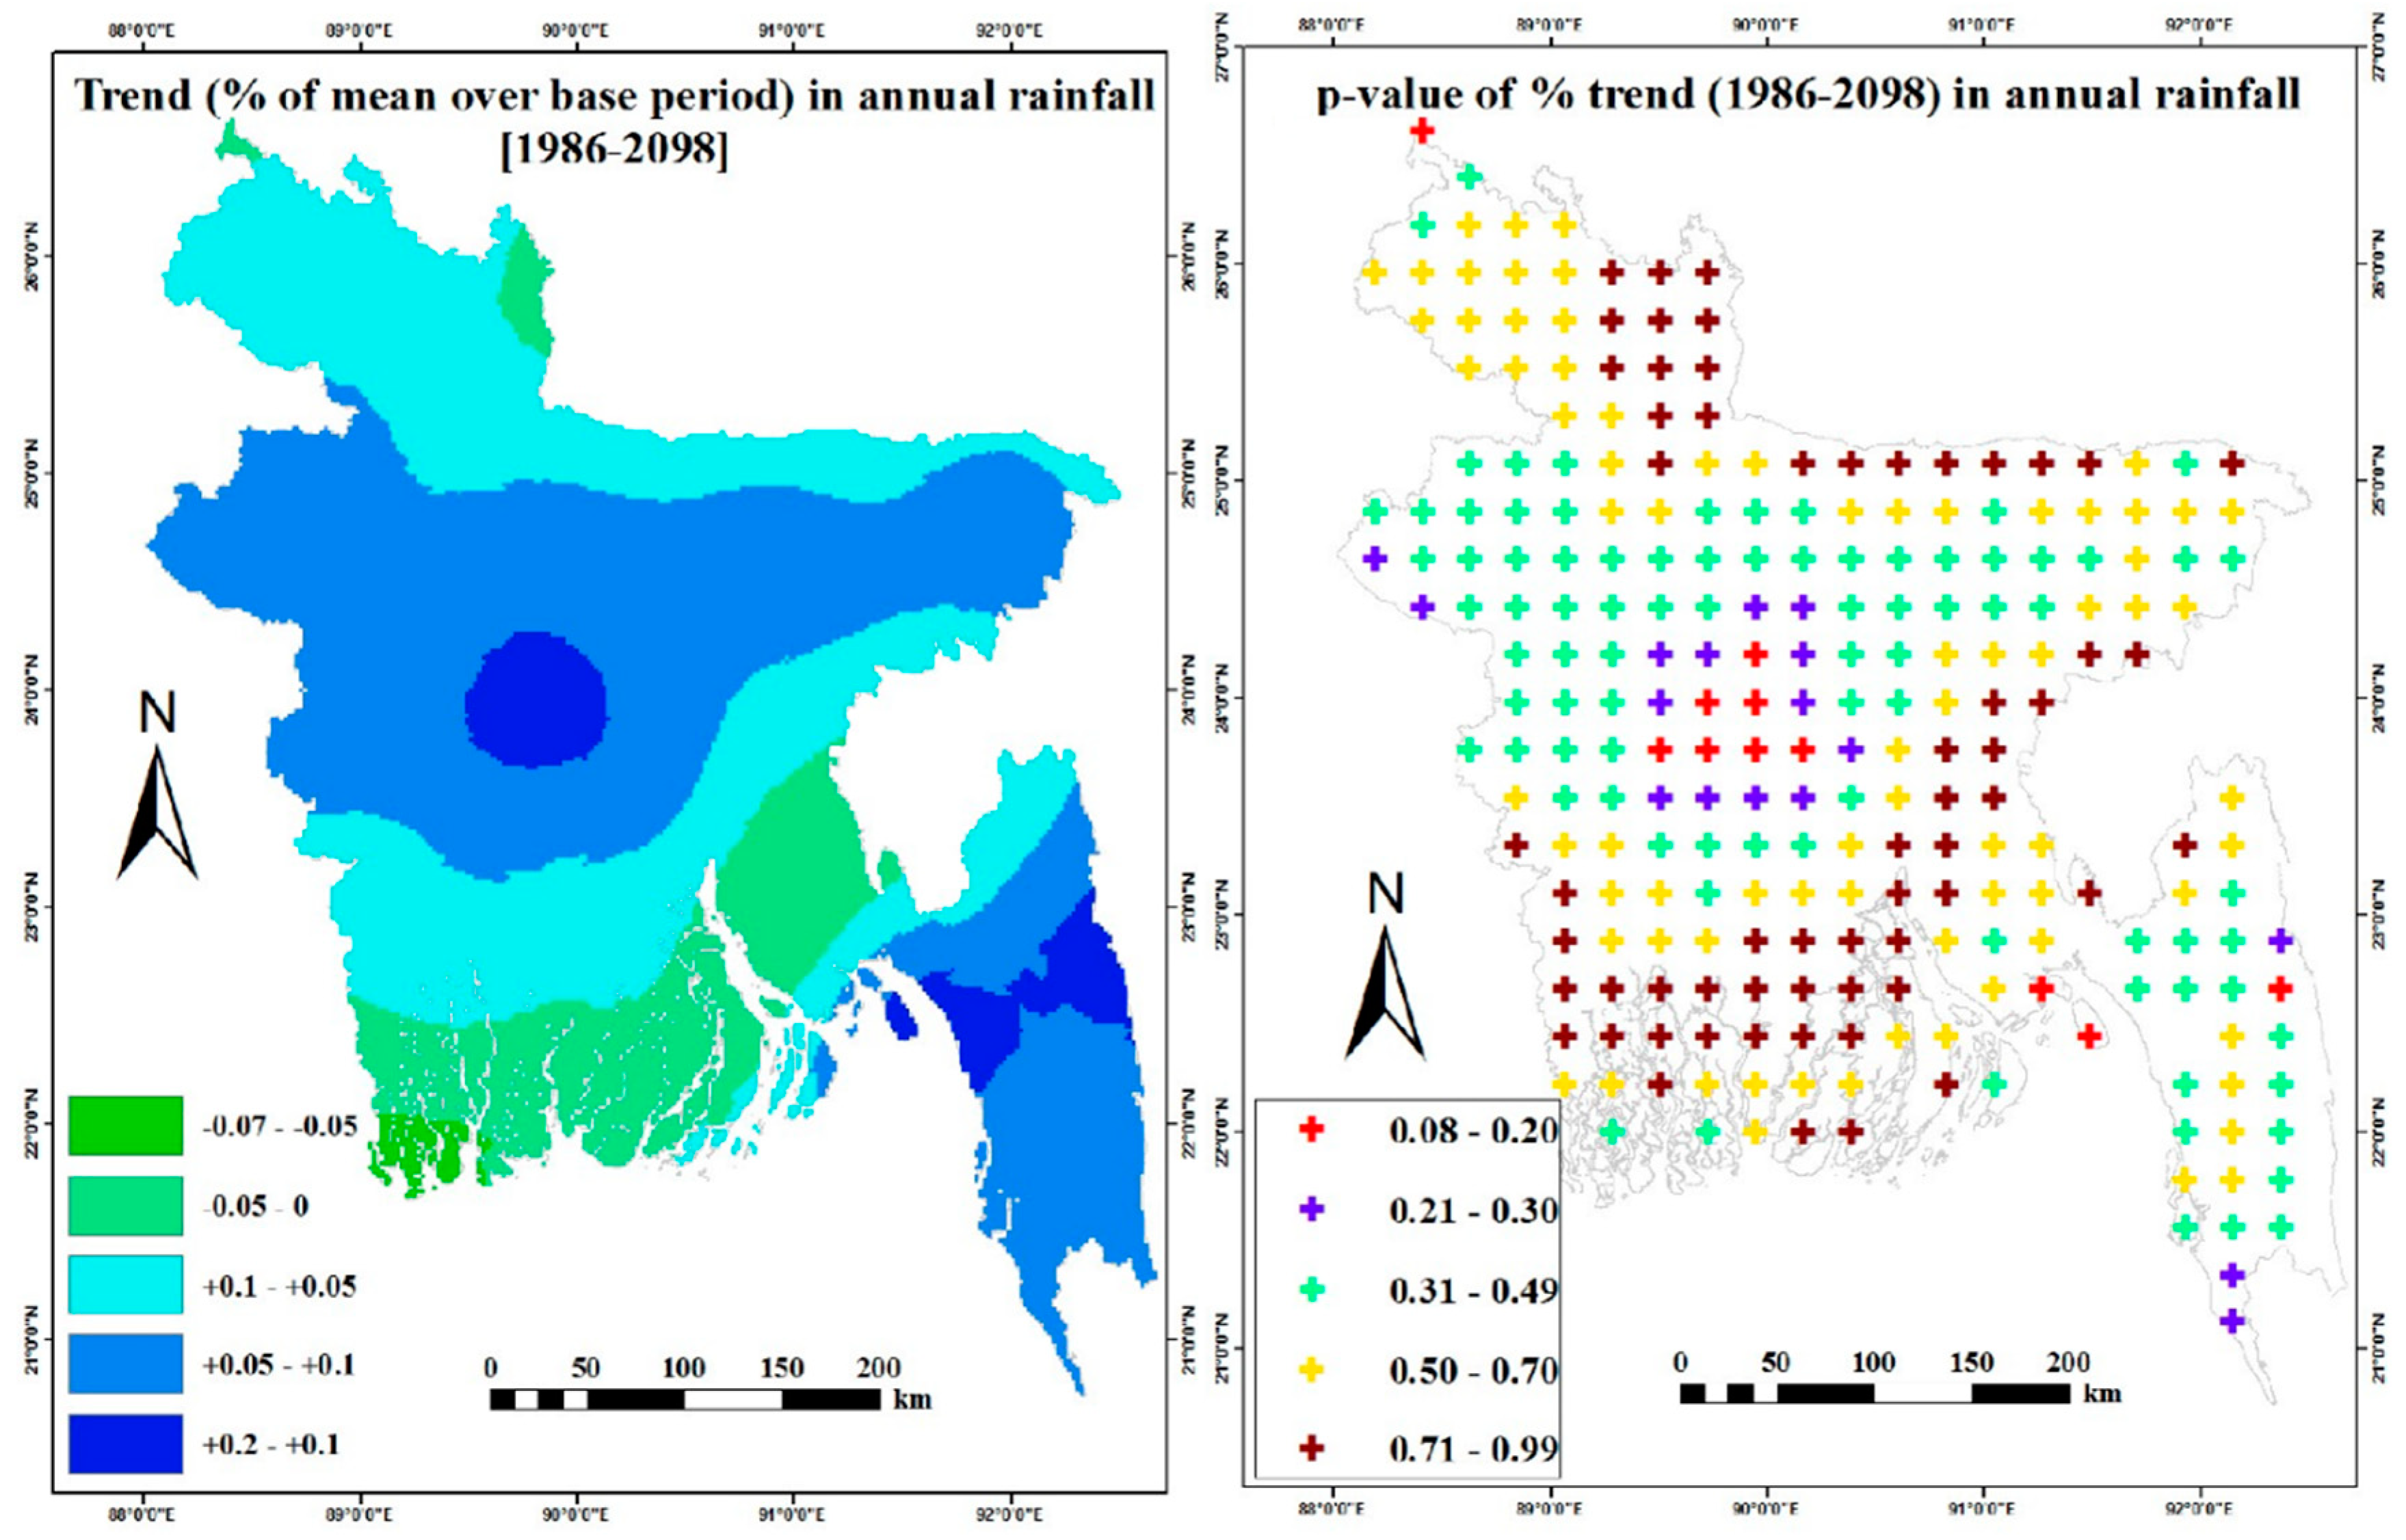
The spatial distribution of the linear trends and their statistical significance is given in Figure 8. It is seen from the figure that the majority of the study areas have positive trends in annual rainfalls. The trends are negative only towards the northern margin and southwestern coastal zone. The p (significance level) values are >0.05, which indicates that the trends are not statistically significant at 95% confidence level.
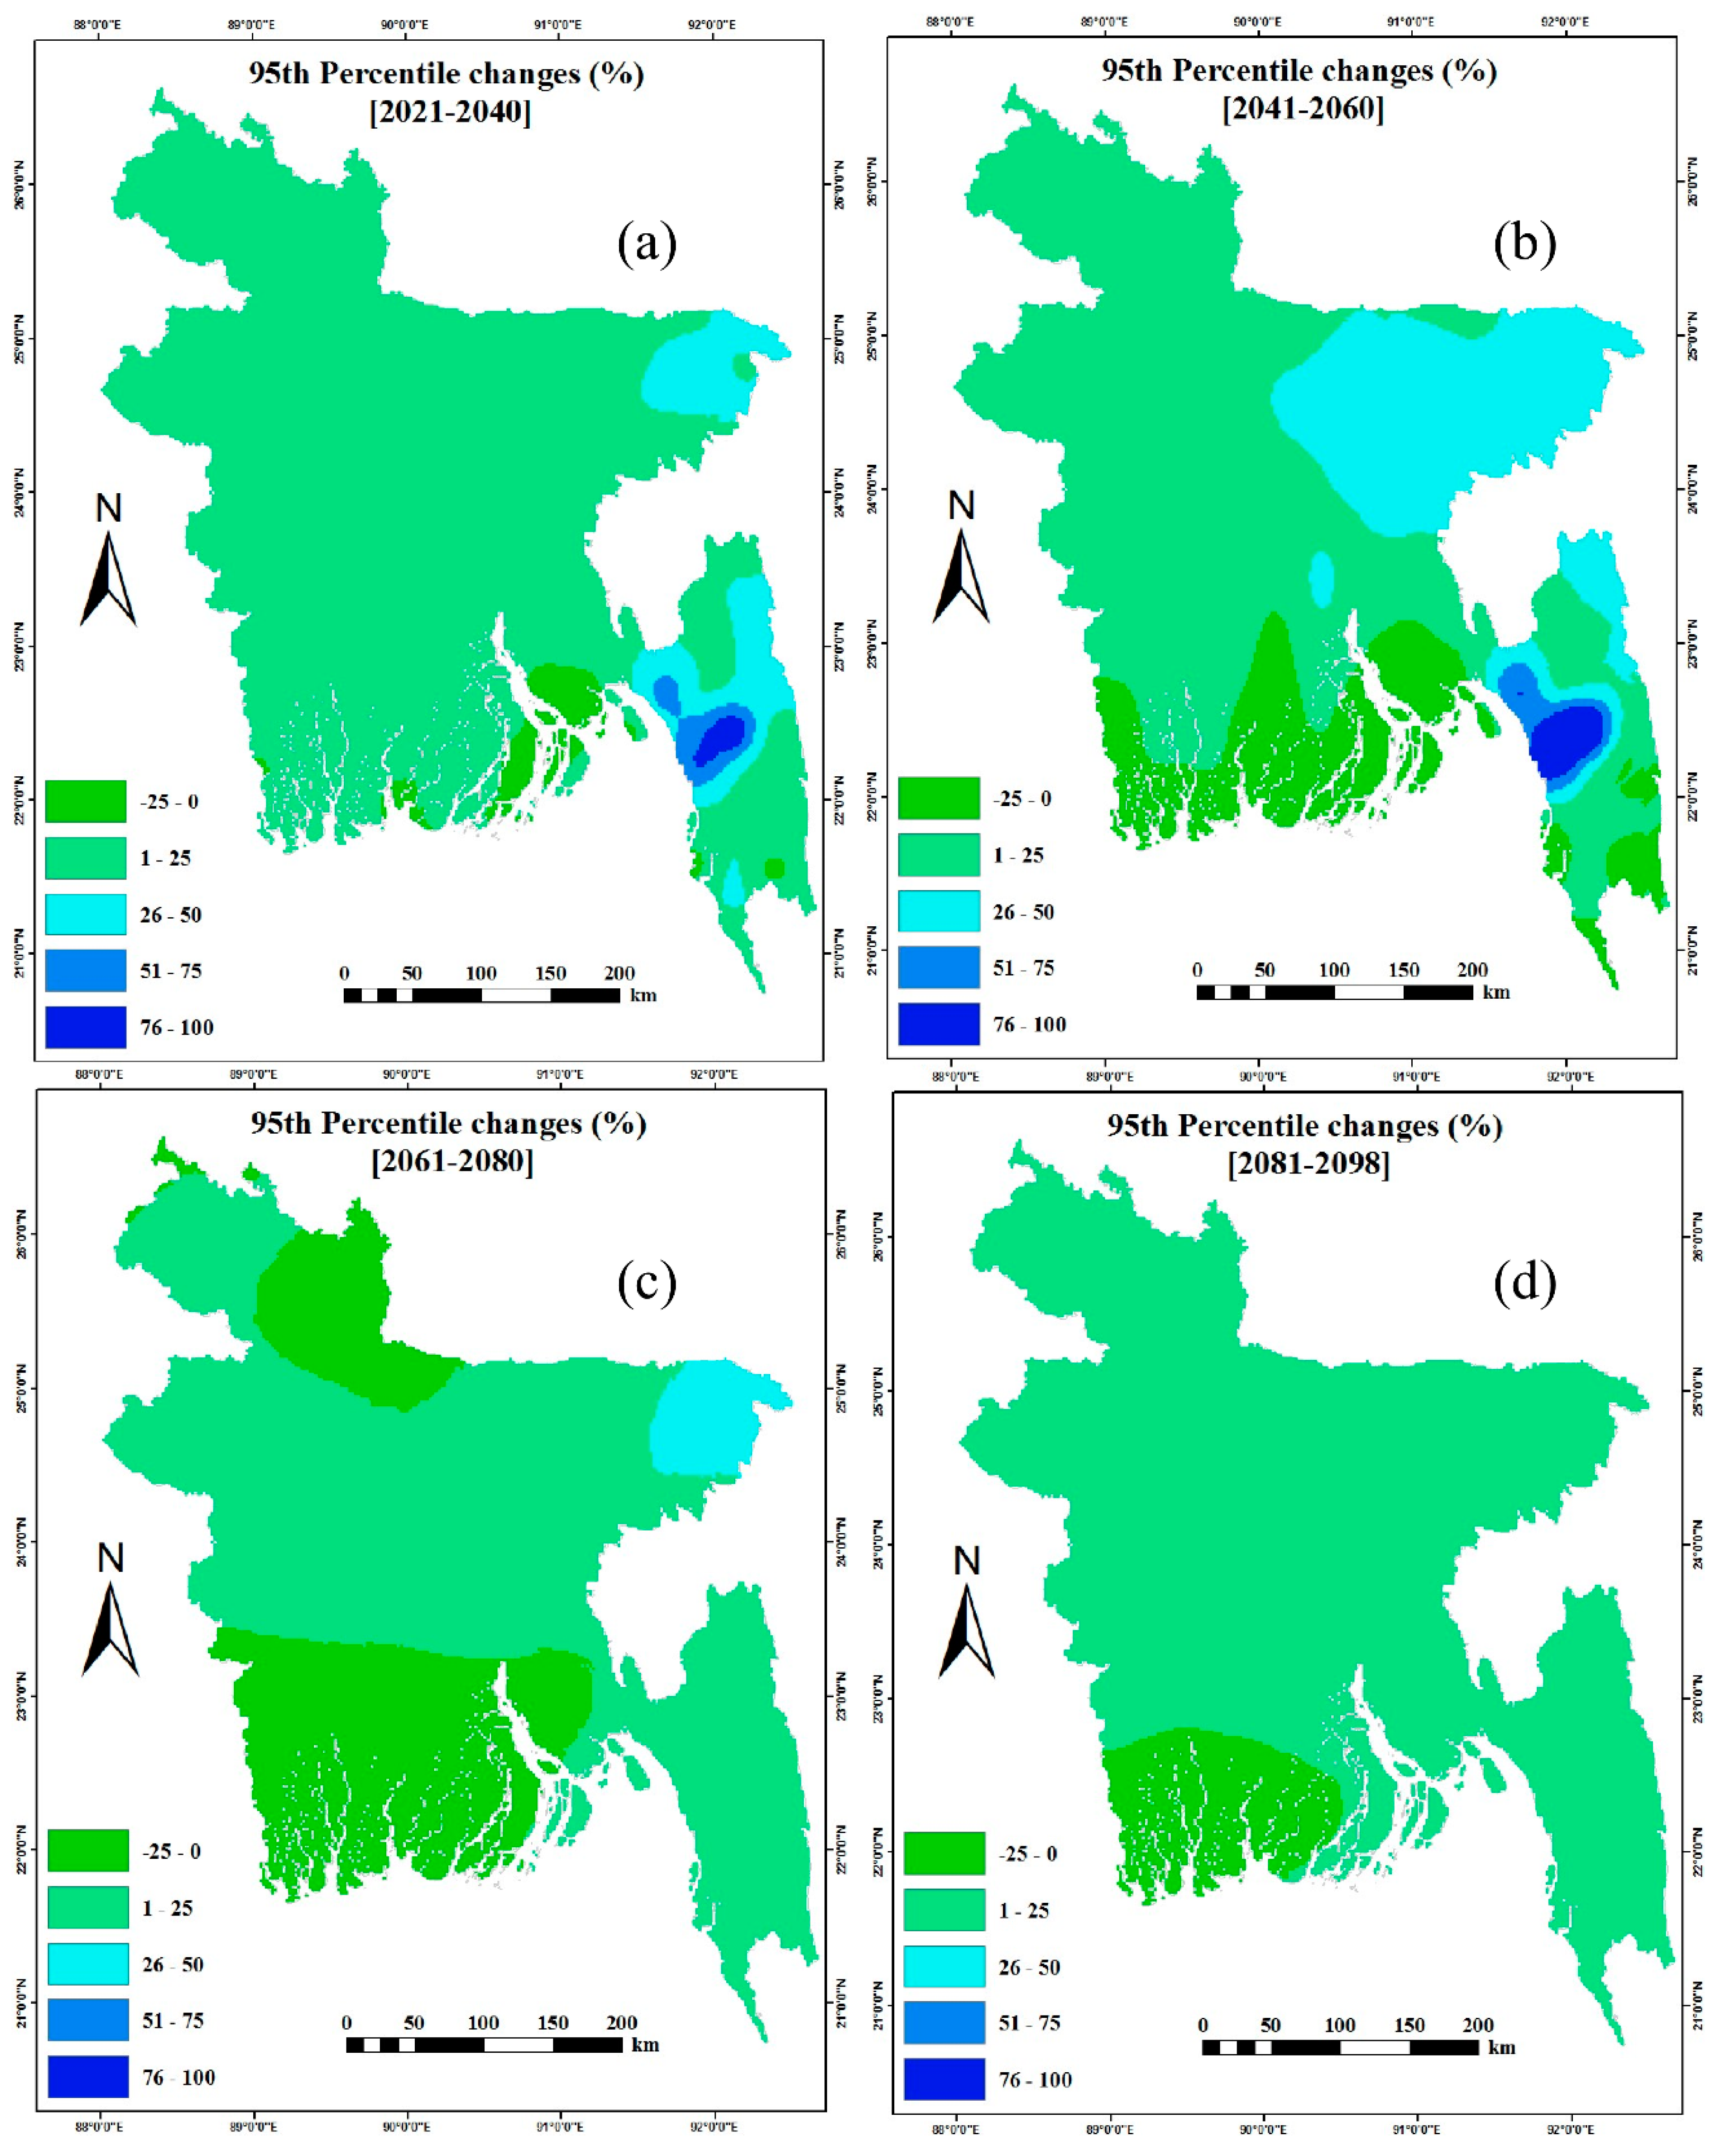
The spatial distribution of the change in the 95th percentile rainfall (Figure 9) indicates that the change is entirely positive for the period of 2021–2040, mainly positive for 2041–2060, mainly negative or weakly positive for 2061–2080, and very weakly positive for 2081–2100 except for the coastal region. This temporal change in the sign is difficult to understand physically and may simply be due to the inadequacy of the model in capturing the important rainfall processes and features of Bangladesh. Overall, the trend is found to be small with its p value ˃0.05. The same analyses for the annual maximum rainfall, 99th percentile, 90th percentile and 80th percentile were carried out and the results were more or less similar to the above results in relation to the 95th percentile.
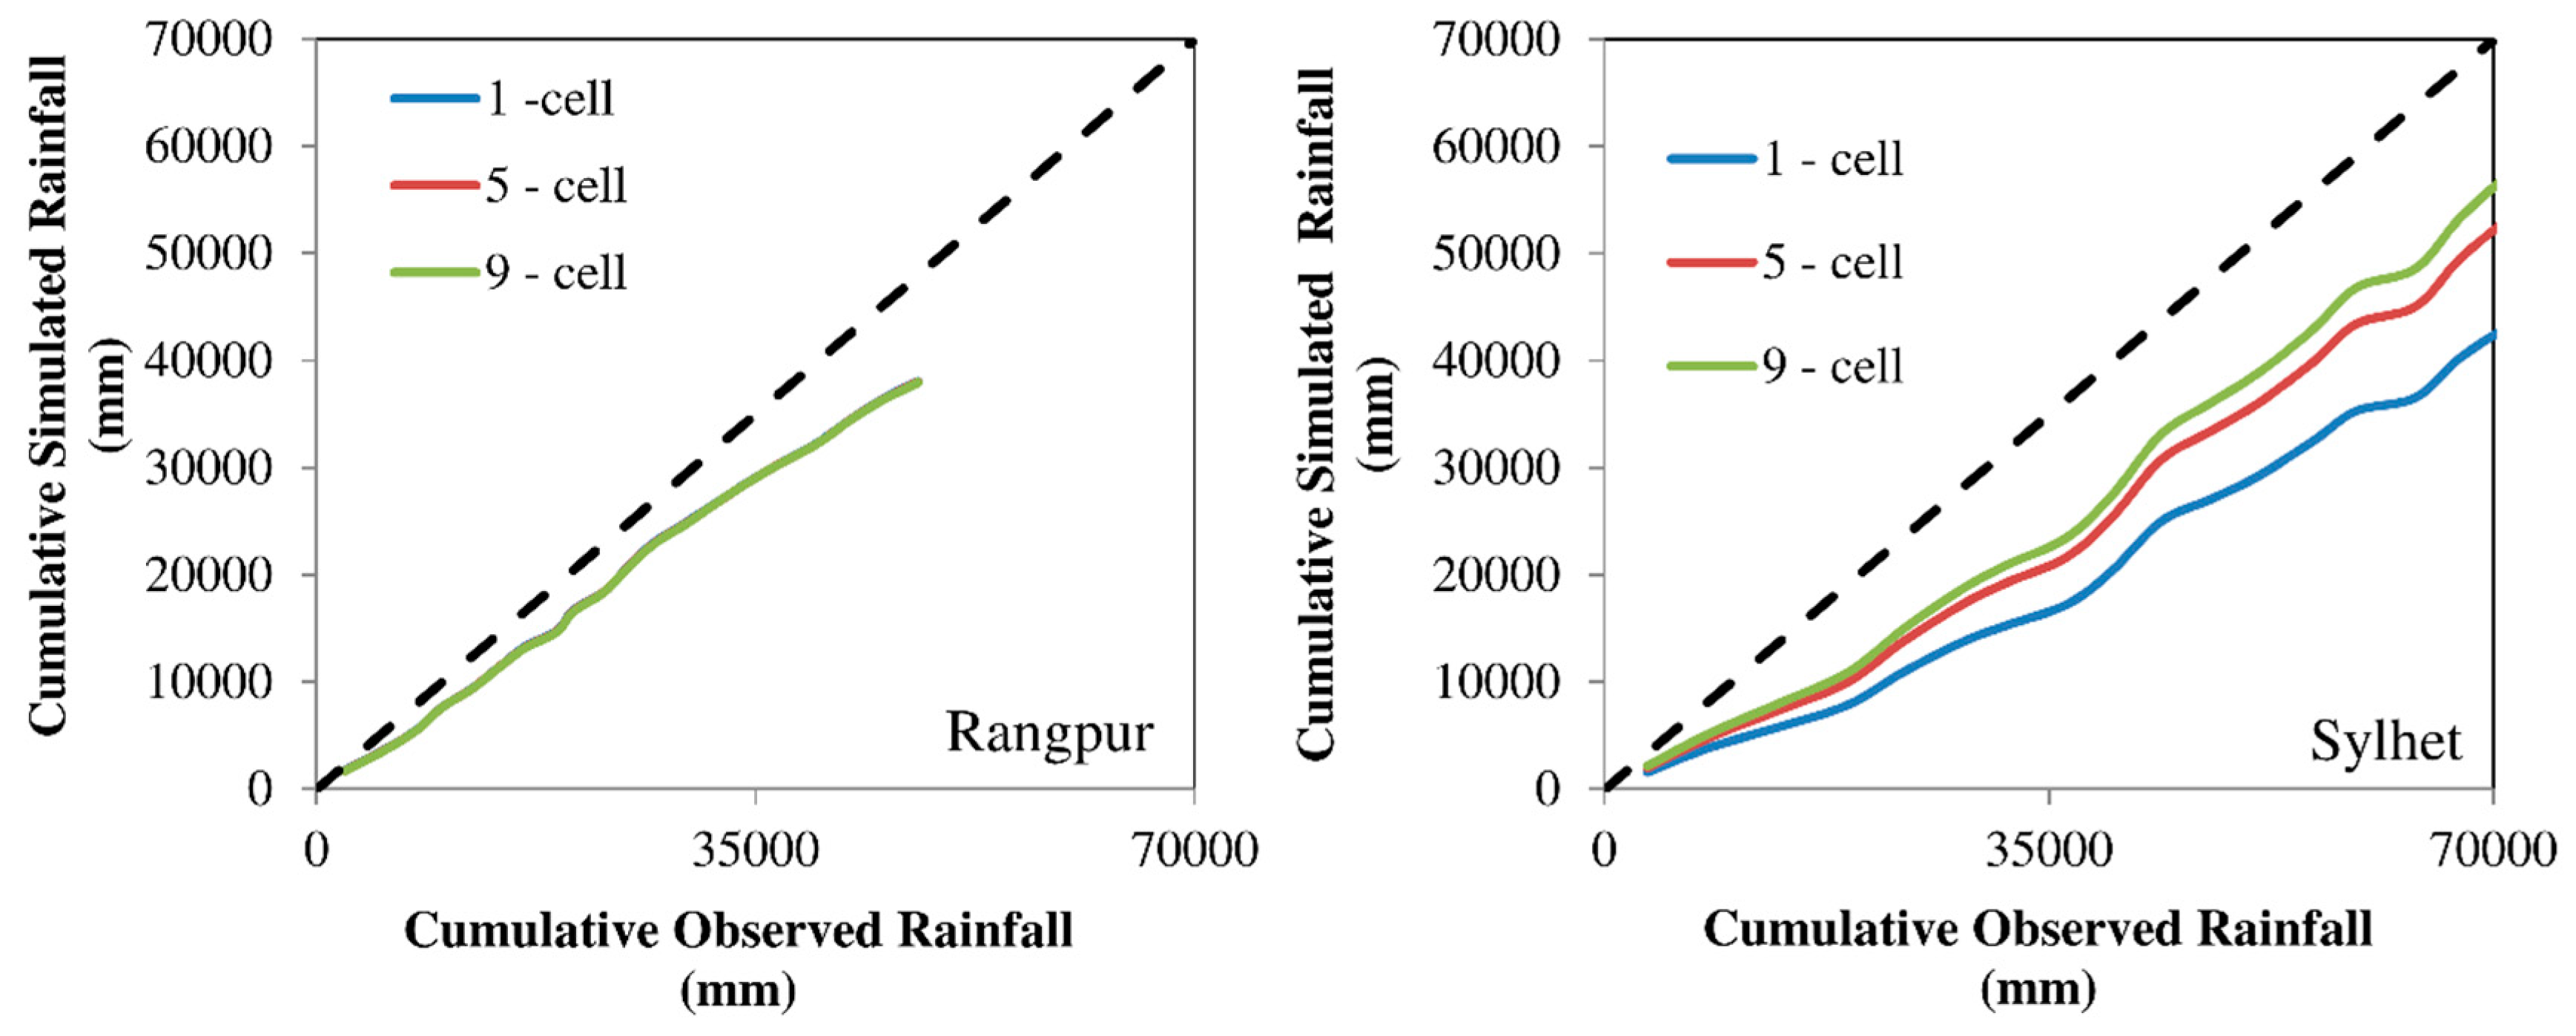
As discussed earlier, there is a high pattern correlation between the observed and simulated rainfalls of the base period, but the correlation coefficient is small and sometimes negative at individual locations. This indicates that the model captures the overall spatial pattern of temporal mean rainfall, but fails to capture the inter-annual variability of rainfall. To see if this failure is due to the spatial resolution of the model, the PDFs of annual rainfalls were estimated for each cell, for averaged rainfalls of five cells and for averaged rainfalls of nine cells. A visual comparison of the one-, five- and nine-cell PDFs (not shown) indicated that there was no significant difference among the three types of PDFs. This indicated that even after aggregation, the inter-annual variability could not be captured. This is further evident from the double mass curves of one-, five- and nine-cell average annual rainfalls (Figure 10). Thus, it appeared that there was no added benefit of spatial aggregation of rainfall in terms of producing inter-annual variability. Inter-annual variability had not been captured in the simulated rainfall. The problem could be due to the poor boundary conditions of the PRECIS model obtained from the driving GCM, or due to the internal structure of the PRECIS, which fails to capture the dynamic characteristics of the rainfall over Bangladesh. These aspects are worthy of investigation in future research.
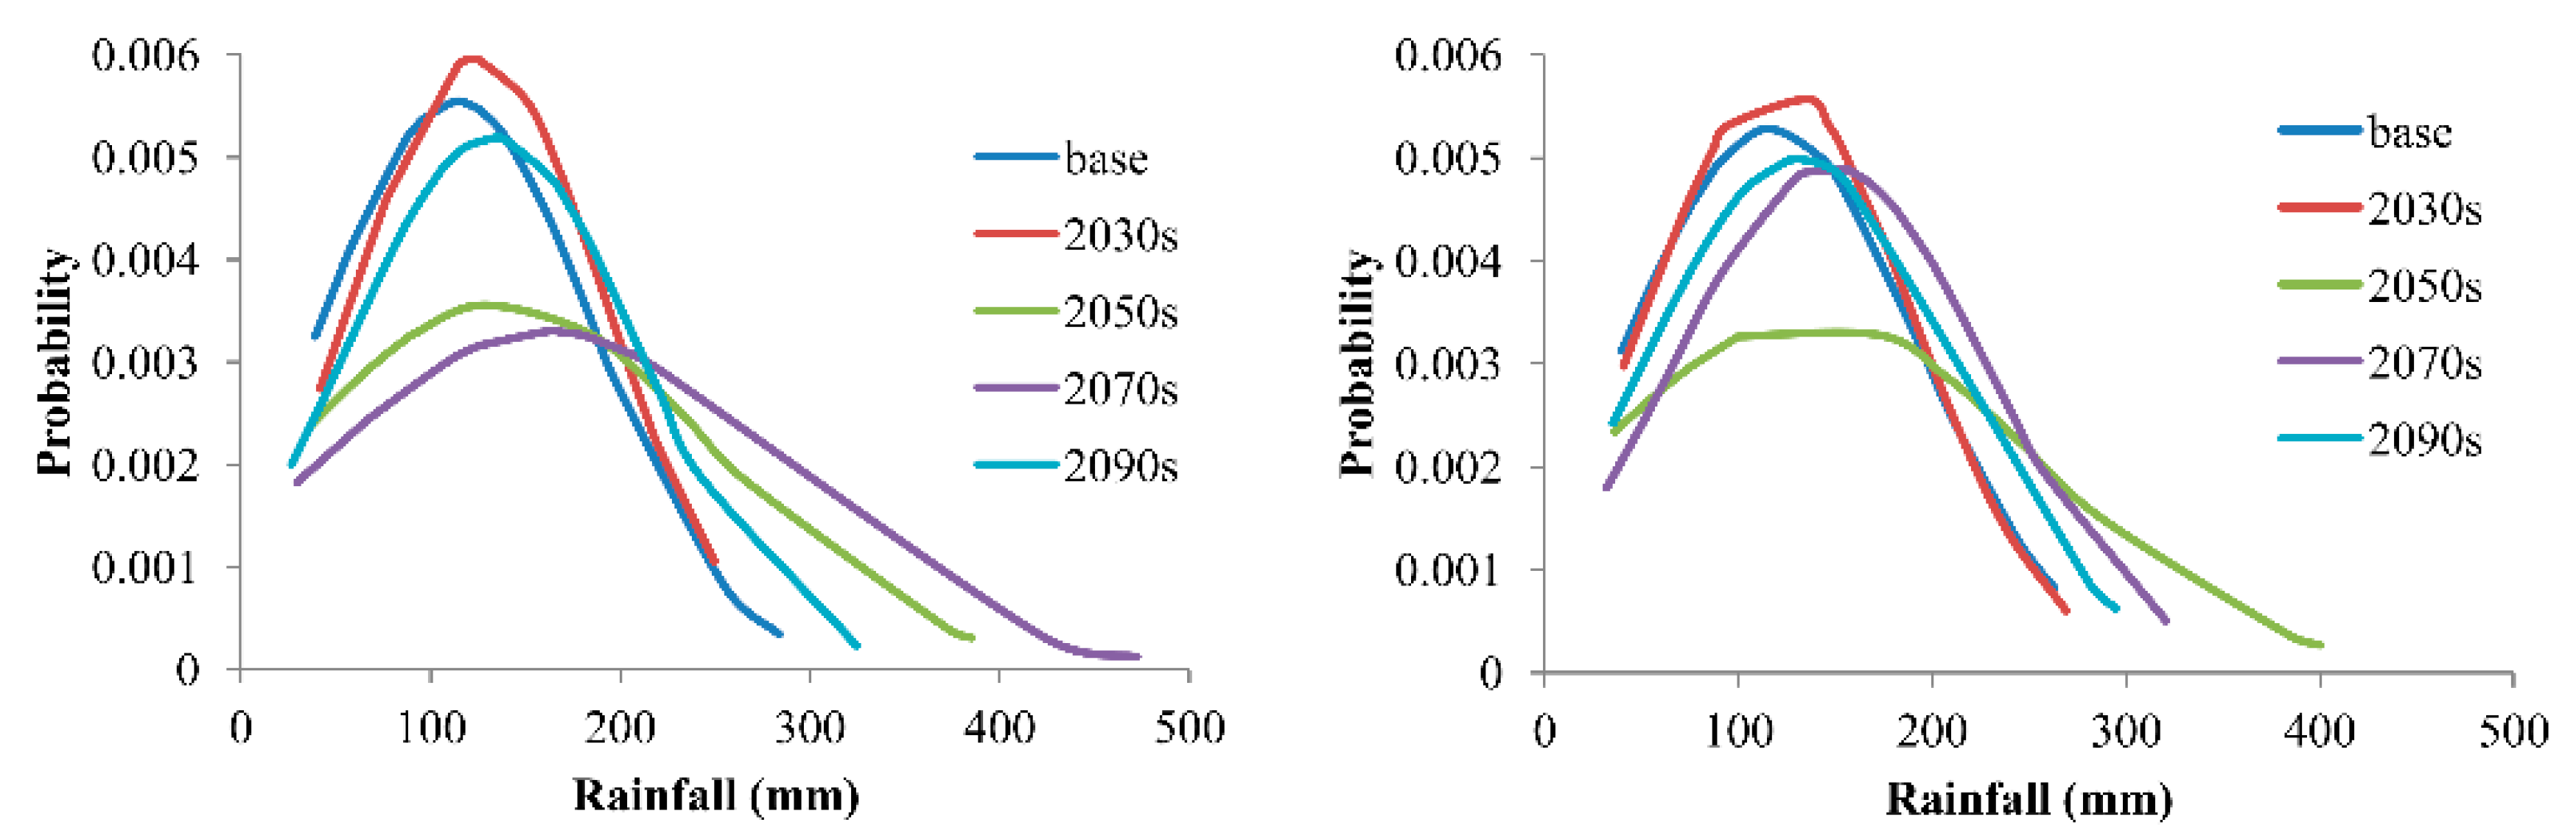
Since the model failed to capture the variability in rainfall at the annual time scale as well as at the monthly time scale (discussed earlier), it is highly unlikely that it had captured the rainfall extremes. This is also evident from Figure 11, which shows the PDFs of the rainfalls of two nearby grid cells in the central coastal region of Bangladesh. While the PDF for one grid cell in Figure 11 has the lowest peak in the 2070s, the PDF for another nearby grid cell has the same lowest peak in the 2050s. The same is also true for the right tails. Thus, any projection of future rainfall extremes based on PRECIS-simulated projection is likely to be highly uncertain.
Our findings suggest that there are large uncertainties in simulated baseline and future rainfalls over Bangladesh when using the PRECIS model. Perhaps this is true for other climate models and other regions as well. The uncertainties could have stemmed from the poor representation of various complex physical, chemical and biological processes and their interactions in the model itself, the input data used to run the model, driving GCM boundary conditions, etc.; however, we did not attempt to assess the sources of these uncertainties. The uncertainties in simulated rainfall grow as the spatial and temporal scales become finer. However, finer data are needed in climate change impact studies involving hydrologic, hydrodynamic, agricultural, ecological, and other models. The PRECIS outputs at the present state are not reliable, particularly in representing rainfall variability and temporal correlation at a finer scale (e.g., daily). Furthermore, there is a bias in the model-simulated rainfall over Bangladesh. Thus, an improvement in the model skill is warranted before using it in practical decision making. One way to achieve this is to involve local scientists in model development so that local context is better understood and captured, and to incorporate locally available observed data in model calibration and validation processes. In the meantime, other potential options to deal with uncertainties could be adaptive water management, institutional capacity development, the development of robust and ‘no regret’ strategies, reliance on multiple models, downscaling methods and scenarios, etc. [40,41].
5. Conclusions
An evaluation of the scale-dependent reliability of the PRECIS regional climate model in simulating rainfall over Bangladesh was carried out by comparing the model-simulated rainfall with the measured rainfall. The model rainfall was simulated using the standard, unperturbed parameter settings and the measured rainfall was collected from the 28 BMD gauge stations. The evaluation revealed that the annual and monthly spatial rainfall patterns of Bangladesh are captured very well by the PRECIS model as far as the pattern correlation is concerned. The value of the spatial pattern correlation coefficient was found to be +0.78 for the average annual rainfall and the values were between +0.76 (during May) and +0.87 (during October) for the average monthly rainfalls. However, the study found that the pattern correlation might not be a good indicator of model performance. In terms of mean rainfall, there was a dry bias in the model-simulated rainfall. The MAD and RMSD in simulated annual rainfall were found to be 23% and 28%, respectively. The PRECIS model also fell short in capturing the inter-annual variability in both annual and monthly rainfalls. For annual rainfall, the temporal correlation coefficients were found to vary from −0.52 to +0.61 depending on the locations. The same coefficients for monthly rainfalls were between −0.67 (during September) and +0.50 (during May) depending on the locations and months. In the case of annual maximum rainfall, the correlation coefficients were negative in most of the stations and were also weakly positive for the remaining few stations. Thus, as the temporal scale of rainfall became finer (i.e., from annual through monthly to daily), the model-simulated rainfall became less reliable. The reliability did not improve with the spatial aggregation of the rainfall data either. Thus, any projection of rainfall variability and extremes based on the PRECIS model should be considered and interpreted with caution in practical uses, and should be subjected to rigorous scrutiny to ascertain its reliability.
Supplementary Materials
The following are available online at https://0-www-mdpi-com.brum.beds.ac.uk/2225-1154/8/2/20/s1, S1: About regional climate model—PRECIS. Table S1. Performance of the PRECIS model in simulation of monthly rainfall of Bangladesh. Figure S1. Scatter plots between observed and simulated annual mean rainfalls at different locations. Figure S2. Comparison of probability density functions between observed and simulated annual rainfalls at different locations. Figure S3. Comparison of probability density functions between observed and simulated annual maximum daily rainfalls at different locations.
Author Contributions
M.S.M. conceived the investigations and led the interpretation; M.N.S. performed the data formatting and formal analyses; S.N. made related contributions; S.N. and M.N.S. led the data visualization; M.S.M. wrote the paper; M.S.M. and S.N. contributed to the interpretation and in review. All authors have read and agreed to the published version of the manuscript.
Funding
The PRECIS data received from the IWFM, BUET (Institute of Water and Flood Management, Bangladesh University of Engineering and Technology) partner of the collaborative research project on ‘Assessing health, livelihoods, ecosystem services and poverty alleviation in populous deltas’ is gratefully acknowledged. And the APC was funded by IDRC-South Asian Water (SAWA) Fellowship.
Conflicts of Interest
The authors have no conflict of interest to disclose.
References
- Feser, F.; Rockel, B.; von Storch, H.; Winterfeldt, J.; Zahn, M. Regional Climate Models Add Value to Global Model Data: A Review and Selected Examples. Bull. Am. Meteorol. Soc. 2011, 92, 1181–1192. [Google Scholar] [CrossRef] [Green Version]
- Syed, F.S.; Iqbal, W.; Syed, A.A.B.; Rasul, G. Uncertainties in the regional climate models simulations of South-Asian summer monsoon and climate change. Clim. Dyn. 2014, 42, 2079–2097. [Google Scholar] [CrossRef]
- Stainforth, D.A.; Aina, T.; Christensen, C.; Collins, M.; Faull, N.; Frame, D.J.; Kettleborough, J.A.; Knight, S.; Martin, A.; Murphy, J.M.; et al. Uncertainty in predictions of the climate response to rising levels of greenhouse gases. Nature 2005, 433, 403–406. [Google Scholar] [CrossRef] [PubMed]
- Rajib, M.A.; Rahman, M.M.; Islam, A.K.M.S.; McBean, E.A. Analyzing the Future Monthly Precipitation Pattern in Bangladesh from Multi-Model Projections Using Both GCM and RCM. In Proceedings of the World Environmental and Water Resources Congress, Providence, RI, USA, 16–20 May 2011; American Society of Civil Engineers: Reston, VA, USA, 2011; pp. 3843–3851. [Google Scholar]
- Janes, T.; Bhaskaran, B. Evaluation of regional model performance in simulating key climate variables over Bangladesh. Met Off. UK 2012. [Google Scholar]
- Rajbhandari, R.; Shrestha, A.B.; Kulkarni, A.; Patwardhan, S.K.; Bajracharya, S.R. Projected changes in climate over the Indus river basin using a high resolution regional climate model (PRECIS). Clim. Dyn. 2015, 44, 339–357. [Google Scholar] [CrossRef] [Green Version]
- Bhaskaran, B.; Ramachandran, A.; Jones, R.; Moufouma-Okia, W. Regional climate model applications on sub-regional scales over the Indian monsoon region: The role of domain size on downscaling uncertainty. J. Geophys. Res. Atmos. 2012, 117. [Google Scholar] [CrossRef]
- Zhang, Y.; Xu, Y.; Dong, W.; Cao, L.; Sparrow, M. A future climate scenario of regional changes in extreme climate events over China using the PRECIS climate model. Geophys. Res. Lett. 2006, 33. [Google Scholar] [CrossRef]
- McSweeney, C.F.; Jones, R.G.; Booth, B.B.B. Selecting ensemble members to provide regional climate change information. J. Clim. 2012, 25, 7100–7121. [Google Scholar] [CrossRef]
- Zacharias, M.; Kumar, S.N.; Singh, S.D.; Rani, D.N.S.; Aggarwal, P.K. Evaluation of a regional climate model for impact assessment of climate change on crop productivity in the tropics. Curr. Sci. 2015, 108, 1119. [Google Scholar]
- González-Zeas, D.; Erazo, B.; Lloret, P.; De Bièvre, B.; Steinschneider, S.; Dangles, O.; González-Zeas, D.; Erazo, B.; Lloret, P.; De Bièvre, B.; et al. Linking global climate change to local water availability: Limitations and prospects for a tropical mountain watershed. Sci. Total Environ. 2019, 650, 2577–2586. [Google Scholar] [CrossRef]
- Jones, R.G.; Noguer, M.; Hassell, D.C.; Hudson, D.; Wilson, S.S.; Jenkins, G.J.; Mitchell, J.F.B. Generating high resolution climate change scenarios using PRECIS. Met Off. Hadley Centre Exet. UK 2004, 40. [Google Scholar]
- Islam, M.N.; Rafiuddin, M.; Ahmed, A.U.; Kolli, R.K. Calibration of PRECIS in employing future scenarios in Bangladesh. Int. J. Climatol. 2008, 28, 617–628. [Google Scholar] [CrossRef]
- Islam, M.N. Rainfall and Temperature Scenario for Bangladesh. Open Atmos. Sci. J. 2009, 3, 93–103. [Google Scholar] [CrossRef] [Green Version]
- Nowreen, S.; Murshed, S.B.; Islam, A.K.M.S.; Bhaskaran, B.; Hasan, M.A. Changes of rainfall extremes around the haor basin areas of Bangladesh using multi-member ensemble RCM. Theor. Appl. Climatol. 2015, 119, 363–377. [Google Scholar] [CrossRef]
- Ahmad, B.; Rasul, G.; Iqbal, W.; Bukhari, S.A.A. Regional Comparison between Global Circulation Model GCM20 and Regional Climate Model PRECIS. Pak. J. Meteorol. 2014, 11, 39–51. [Google Scholar]
- Kumar, K.R.; Sahai, A.K.; Kumar, K.K.; Patwardhan, S.K.; Mishra, P.K.; Revadekar, J.V.; Kamala, K.; Pant, G.B. High-resolution climate change scenarios for India for the 21st century. Curr. Sci. 2006, 90, 334–345. [Google Scholar]
- Revadekar, J.V.; Patwardhan, S.K.; Rupa Kumar, K. Characteristic Features of Precipitation Extremes over India in the Warming Scenarios. Adv. Meteorol. 2011, 2011, 1–11. [Google Scholar] [CrossRef]
- Kumar, K.K.; Patwardhan, S.K.; Kulkarni, A.; Kamala, K.; Rao, K.K.; Jones, R. Simulated projections for summer monsoon climate over India by a high-resolution regional climate model (PRECIS). Curr. Sci. 2011, 101, 312–326. [Google Scholar]
- Kulkarni, A.; Patwardhan, S.; Kumar, K.K.; Ashok, K.; Krishnan, R. Projected Climate Change in the Hindu Kush–Himalayan Region By Using the High-resolution Regional Climate Model PRECIS. Mt. Res. Dev. 2013, 33, 142–151. [Google Scholar] [CrossRef]
- World Bank. Economic of Adaptation to Climate Change: Bangladesh; The World Bank Group: Washington, DC, USA, 2010. [Google Scholar]
- Santer, B.D.; Taylor, K.E.; Wigley, T.M.L.; Penner, J.E.; Jones, P.D.; Cubasch, U. Towards the detection and attribution of an anthropogenic effect on climate. Clim. Dyn. 1995, 12, 77–100. [Google Scholar] [CrossRef]
- IPCC. Climate Change 2013: The Physical Science Basis. Contribution of Working Group I to the Fifth Assessment Report of the Intergovernmental Panel on Climate Change; Cambridge University Press: Cambridge, UK; New York, NY, USA, 2013; p. 1535. [Google Scholar]
- Kisembe, J.; Favre, A.; Dosio, A.; Lennard, C.; Sabiiti, G.; Nimusiima, A. Evaluation of rainfall simulations over Uganda in CORDEX regional climate models. Theor. Appl. Climatol. 2019, 137, 1117–1134. [Google Scholar] [CrossRef] [Green Version]
- Giorgi, F. Variability and trends of sub-continental scale surface climate in the twentieth century. Part II: AOGCM simulations. Clim. Dyn. 2002, 18, 693–708. [Google Scholar]
- Williams, C.J.R.; Kniveton, D.R.; Layberry, R. Assessment of a climate model to reproduce rainfall variability and extremes over Southern Africa. Theor. Appl. Climatol. 2010, 99, 9–27. [Google Scholar] [CrossRef]
- Gbobaniyi, E.; Sarr, A.; Sylla, M.B.; Diallo, I.; Lennard, C.; Dosio, A.; Dhiédiou, A.; Kamga, A.; Klutse, N.A.B.; Hewitson, B. Climatology, annual cycle and interannual variability of precipitation and temperature in CORDEX simulations over West Africa. Int. J. Climatol. 2014, 34, 2241–2257. [Google Scholar] [CrossRef]
- Caesar, J.; Janes, T.; Lindsay, A.; Bhaskaran, B. Temperature and precipitation projections over Bangladesh and the upstream Ganges, Brahmaputra and Meghna systems. Environ. Sci. Process. Impacts 2015, 17, 1047–1056. [Google Scholar] [CrossRef] [PubMed]
- Nakicenovic, N.; Alcamo, J.; Grubler, A.; Riahi, K.; Roehrl, R.A.; Rogner, H.-H.; Victor, N. Special Report on Emissions Scenarios (SRES), A Special Report of Working Group III of the Intergovernmental Panel on Climate Change; Cambridge University Press: Cambridge, UK, 2000; ISBN 0-521-80493-0. [Google Scholar]
- van Vuuren, D.P.; Riahi, K. Do recent emission trends imply higher emissions forever? Clim. Chang. 2008, 91, 237–248. [Google Scholar] [CrossRef]
- Le Quéré, C.; Raupach, M.R.; Canadell, J.G.; Marland, G.; Bopp, L.; Ciais, P.; Conway, T.J.; Doney, S.C.; Feely, R.A.; Foster, P.; et al. Trends in the sources and sinks of carbon dioxide. Nat. Geosci. 2009, 2, 831. [Google Scholar] [CrossRef]
- Das, S. Extreme rainfall estimation at ungauged sites: Comparison between region-of-influence approach of regional analysis and spatial interpolation technique. Int. J. Climatol. 2019, 39, 407–423. [Google Scholar] [CrossRef] [Green Version]
- Mondol, M.A.H.; Haque, A.; Iqbal, M.; Jang, D.H. Precipitation Concentration in Bangladesh over Different Temporal Periods. Adv. Meteorol. 2018, 2018, 1–18. [Google Scholar]
- Khan, M.J.U.; Islam, A.K.M.S.; Das, M.K.; Mohammed, K.; Bala, S.K.; Tarekul Islam, G.M. Observed trends in climate extremes over Bangladesh from 1981 to 2010. Clim. Res. 2019, 77, 45–61. [Google Scholar] [CrossRef]
- Mahmud, I.; Bari, S.H.; Rahman, M.T.U. Monthly rainfall forecast of Bangladesh using autoregressive integrated moving average method. Environ. Eng. Res. 2017, 22, 162–168. [Google Scholar] [CrossRef] [Green Version]
- Mondal, M.S.; Hossain, M.M.A. Characterizing long-term changes of Bangladesh climate in context of agriculture and irrigation. Dep. Environ. Dhaka 2008, 7, 101. [Google Scholar]
- Mondal, M.S.; Islam, A.; Madhu, M.K. Spatial and temporal distribution of temperature, rainfall, sunshine and humidity in context of crop agriculture. Inst. Water Flood Manag. Bangladesh Univ. Eng. Technol. Bangladesh 2012, 179, 1–207. [Google Scholar]
- Mondal, M.S.; Jalal, M.R.; Khan, M.S.A.; Kumar, U.; Rahman, R.; Huq, H. Hydro-Meteorological Trends in Southwest Coastal Bangladesh: Perspectives of Climate Change and Human Interventions. Am. J. Clim. Chang. 2013, 02, 62–70. [Google Scholar] [CrossRef]
- Legates, D.R.; Davis, R.E. The continuing search for an anthropogenic climate change signal: Limitations of correlation-based approaches. Geophys. Res. Lett. 1997, 24, 2319–2322. [Google Scholar] [CrossRef]
- Buytaert, W.; Vuille, M.; Dewulf, A.; Urrutia, R.; Karmalkar, A.; Célleri, R. Uncertainties in climate change projections and regional downscaling in the tropical Andes: Implications for water resources management. Hydrol. Earth Syst. Sci. 2010, 14, 1247–1258. [Google Scholar] [CrossRef] [Green Version]
- Razavi, T.; Switzman, H.; Arain, A.; Coulibaly, P. Regional climate change trends and uncertainty analysis using extreme indices: A case study of Hamilton, Canada. Clim. Risk Manag. 2016, 13, 43–63. [Google Scholar] [CrossRef] [Green Version]
Figure 1.
Comparison of spatial distribution of observed (left) and simulated (right) mean annual rainfalls over the base period (1986–2005). Here, numerical numbers in between black brackets in (left) denotes the location IDs of the observed rainfall stations as provided in Supplementary Table S1.
Figure 1.
Comparison of spatial distribution of observed (left) and simulated (right) mean annual rainfalls over the base period (1986–2005). Here, numerical numbers in between black brackets in (left) denotes the location IDs of the observed rainfall stations as provided in Supplementary Table S1.

Figure 2.
Comparison of probability density functions between observed and simulated annual rainfalls at Dinajpur (left) and Mymensingh (right) during the base period (1986–2005).
Figure 2.
Comparison of probability density functions between observed and simulated annual rainfalls at Dinajpur (left) and Mymensingh (right) during the base period (1986–2005).

Figure 3.
Performance of the PRECIS model in simulating monthly rainfall of Bangladesh. Here (a) CC denotes correlation coefficient, (b) MAD denotes mean absolute difference, and (c) RMSD denotes root mean square difference. The CCs, MADs and RMSDs are shown in bar diagrams for six months (May–October) after multiplying by 100.

Figure 4.
Comparison of probability density functions between observed and simulated June rainfalls at Rangpur (left) and Patuakhali (right) during the base period (1986–2005).
Figure 4.
Comparison of probability density functions between observed and simulated June rainfalls at Rangpur (left) and Patuakhali (right) during the base period (1986–2005).

Figure 5.
Comparison of probability density functions between observed and simulated annual maximum daily rainfalls at Sylhet (left) and Dinajpur (right) during the base period (1986–2005).
Figure 5.
Comparison of probability density functions between observed and simulated annual maximum daily rainfalls at Sylhet (left) and Dinajpur (right) during the base period (1986–2005).

Figure 6.
Double mass curve of annual maximum rainfalls at Dinajpur (left) and Mymensingh (right) of the base period (1986–2005).
Figure 6.
Double mass curve of annual maximum rainfalls at Dinajpur (left) and Mymensingh (right) of the base period (1986–2005).

Figure 7.
Changes in mean annual rainfall (%) in different future periods over base period (1986–2005) from the PRECIS model simulation.
Figure 7.
Changes in mean annual rainfall (%) in different future periods over base period (1986–2005) from the PRECIS model simulation.

Figure 8.
Spatial distribution of trends (% of mean of 1986–2005 in (left) in simulated annual rainfall (1986–2098) and their statistical significance (right).
Figure 8.
Spatial distribution of trends (% of mean of 1986–2005 in (left) in simulated annual rainfall (1986–2098) and their statistical significance (right).

Figure 9.
Spatial distribution of changes (%) in the mean 95th percentile rainfall during different time periods.
Figure 9.
Spatial distribution of changes (%) in the mean 95th percentile rainfall during different time periods.

Figure 10.
Double mass curves of one-, five- and nine-cell average annual rainfalls at Rangpur (left) and Sylhet (right) for the base period (1986–2005).
Figure 10.
Double mass curves of one-, five- and nine-cell average annual rainfalls at Rangpur (left) and Sylhet (right) for the base period (1986–2005).

Figure 11.
Typical PDFs of annual maximum rainfalls in two nearby grid cells in the central, coastal region of Bangladesh.
Figure 11.
Typical PDFs of annual maximum rainfalls in two nearby grid cells in the central, coastal region of Bangladesh.


Table 1.
Performance of the PRECIS Model in Simulation of Annual Rainfall of Bangladesh.
| Station Name | Correlation Coefficient | p Value | MAD (%) | RMSD (%) | Station Name | Correlation Coefficient | p Value | MAD (%) | RMSD (%) |
|---|---|---|---|---|---|---|---|---|---|
| Maijdi | 0.22 | 0.34 | 26 | 31 | Patuakhali | 0.61 | 0.00 | 30 | 31 |
| Feni | −0.07 | 0.77 | 28 | 34 | Khepupara | 0.11 | 0.65 | 17 | 20 |
| Sandwip | −0.01 | 0.95 | 30 | 38 | Bogra | −0.16 | 0.51 | 28 | 32 |
| Rangamati | −0.39 | 0.09 | 45 | 50 | Dinajpur | 0.24 | 0.30 | 29 | 35 |
| Hatia | 0.14 | 0.61 | 41 | 47 | Mymensingh | 0.10 | 0.67 | 29 | 37 |
| Chittagong | −0.52 | 0.03 | 39 | 44 | Sreemangal | −0.19 | 0.42 | 35 | 42 |
| Kutubudia | −0.22 | 0.35 | 34 | 41 | Dhaka | −0.11 | 0.65 | 26 | 32 |
| Cox’s Bazar | 0.03 | 0.89 | 38 | 43 | Rangpur | 0.17 | 0.46 | 26 | 29 |
| Tekhnaf | −0.01 | 0.95 | 26 | 32 | Sylhet | −0.16 | 0.49 | 42 | 48 |
| Satkhira | −0.15 | 0.52 | 19 | 23 | Ishwardi | −0.34 | 0.14 | 25 | 30 |
| Khulna | 0.21 | 0.37 | 21 | 24 | Rajshahi | −0.23 | 0.32 | 25 | 31 |
| Barisal | 0.19 | 0.42 | 20 | 26 | Tangail | −0.13 | 0.59 | 21 | 29 |
| Bhola | −0.09 | 0.72 | 24 | 30 | Chuadanga | −0.46 | 0.06 | 22 | 27 |
| Mongla | 0.21 | 0.45 | 24 | 26 | Syedpur | 0.18 | 0.51 | 32 | 38 |
© 2020 by the authors. Licensee MDPI, Basel, Switzerland. This article is an open access article distributed under the terms and conditions of the Creative Commons Attribution (CC BY) license (http://creativecommons.org/licenses/by/4.0/).
Share and Cite
MDPI and ACS Style
Mondal, M.S.; Nowreen, S.; Sakib, M.N. Scale-Dependent Reliability of Projected Rainfalls over Bangladesh with the PRECIS Model. Climate 2020, 8, 20. https://0-doi-org.brum.beds.ac.uk/10.3390/cli8020020
AMA Style
Mondal MS, Nowreen S, Sakib MN. Scale-Dependent Reliability of Projected Rainfalls over Bangladesh with the PRECIS Model. Climate. 2020; 8(2):20. https://0-doi-org.brum.beds.ac.uk/10.3390/cli8020020
Chicago/Turabian StyleMondal, M. Shahjahan, Sara Nowreen, and Mostofa Najmus Sakib. 2020. "Scale-Dependent Reliability of Projected Rainfalls over Bangladesh with the PRECIS Model" Climate 8, no. 2: 20. https://0-doi-org.brum.beds.ac.uk/10.3390/cli8020020
Note that from the first issue of 2016, this journal uses article numbers instead of page numbers. See further details here.