On Tanzania’s Precipitation Climatology, Variability, and Future Projection


1
Department of Plants, Soils and Climate, Utah State University, Logan, UT 84322, USA
2
Department of Mathematics and Statistics, Utah State University, Logan, UT 84322, USA
3
College of Ocean and Meteorology, Guangdong Ocean University, Zhanjiang 524088, Guangdong, China
4
Utah Climate Center, Utah State University, Logan, UT 84322, USA
*
Author to whom correspondence should be addressed.
Climate 2020, 8(2), 34; https://0-doi-org.brum.beds.ac.uk/10.3390/cli8020034
Submission received: 30 December 2019
/
Revised: 7 February 2020
/
Accepted: 18 February 2020
/
Published: 20 February 2020
Abstract
:We investigate historical and projected precipitation in Tanzania using observational and climate model data. Precipitation in Tanzania is highly variable in both space and time due to topographical variations, coastal influences, and the presence of lakes. Annual and seasonal precipitation trend analyses from 1961 to 2016 show maximum rainfall decline in Tanzania during the long rainy season in the fall (March–May), and an increasing precipitation trend in northwestern Tanzania during the short rainy season in the spring (September–November). Empirical orthogonal function (EOF) analysis applied to Tanzania’s precipitation patterns shows a stronger correlation with warmer temperatures in the western Indian Ocean than with the eastern-central Pacific Ocean. Years with decreasing precipitation in Tanzania appear to correspond with increasing sea surface temperatures (SST) in the Indian Ocean, suggesting that the Indian Ocean Dipole (IOD) may have a greater effect on rainfall variability in Tanzania than the El Niño-Southern Oscillation (ENSO) does. Overall, the climate model ensemble projects increasing precipitation trend in Tanzania that is opposite with the historical decrease in precipitation. This observed drying trend also contradicts a slightly increasing precipitation trend from climate models for the same historical time period, reflecting challenges faced by modern climate models in representing Tanzania’s precipitation.
1. Introduction
In Africa, the change in precipitation extremes affects agriculture and industries that either directly or indirectly rely on the replenishment of water resources. Many studies have identified a widespread decline in precipitation in several eastern and southern African countries and these trends were linked to global warming [1,2,3]. Major water-related threats to Africa’s geographic landmarks include melting of snow caps on Mt. Kilimanjaro in Tanzania [4], receding water levels of Lake Victoria in Tanzania, Kenya, and Uganda [5], and decreasing river flow of the Victoria Falls in Zambia and Zimbabwe [6]. Droughts have become more frequent, longer, and more severe in the last two decades, particularly the 2010–2011 East African drought when famine plunged several countries into a humanitarian crisis. This observed drying trend contradicts a projected increase in East African rainfall by climate models [2,7,8,9]. However, in recent years, East African countries have been plagued by frequent floods that have displaced many people and claimed lives [10]. Further analysis is necessary to understand the seemingly contradictory precipitation trends experienced in East Africa during the recent years.
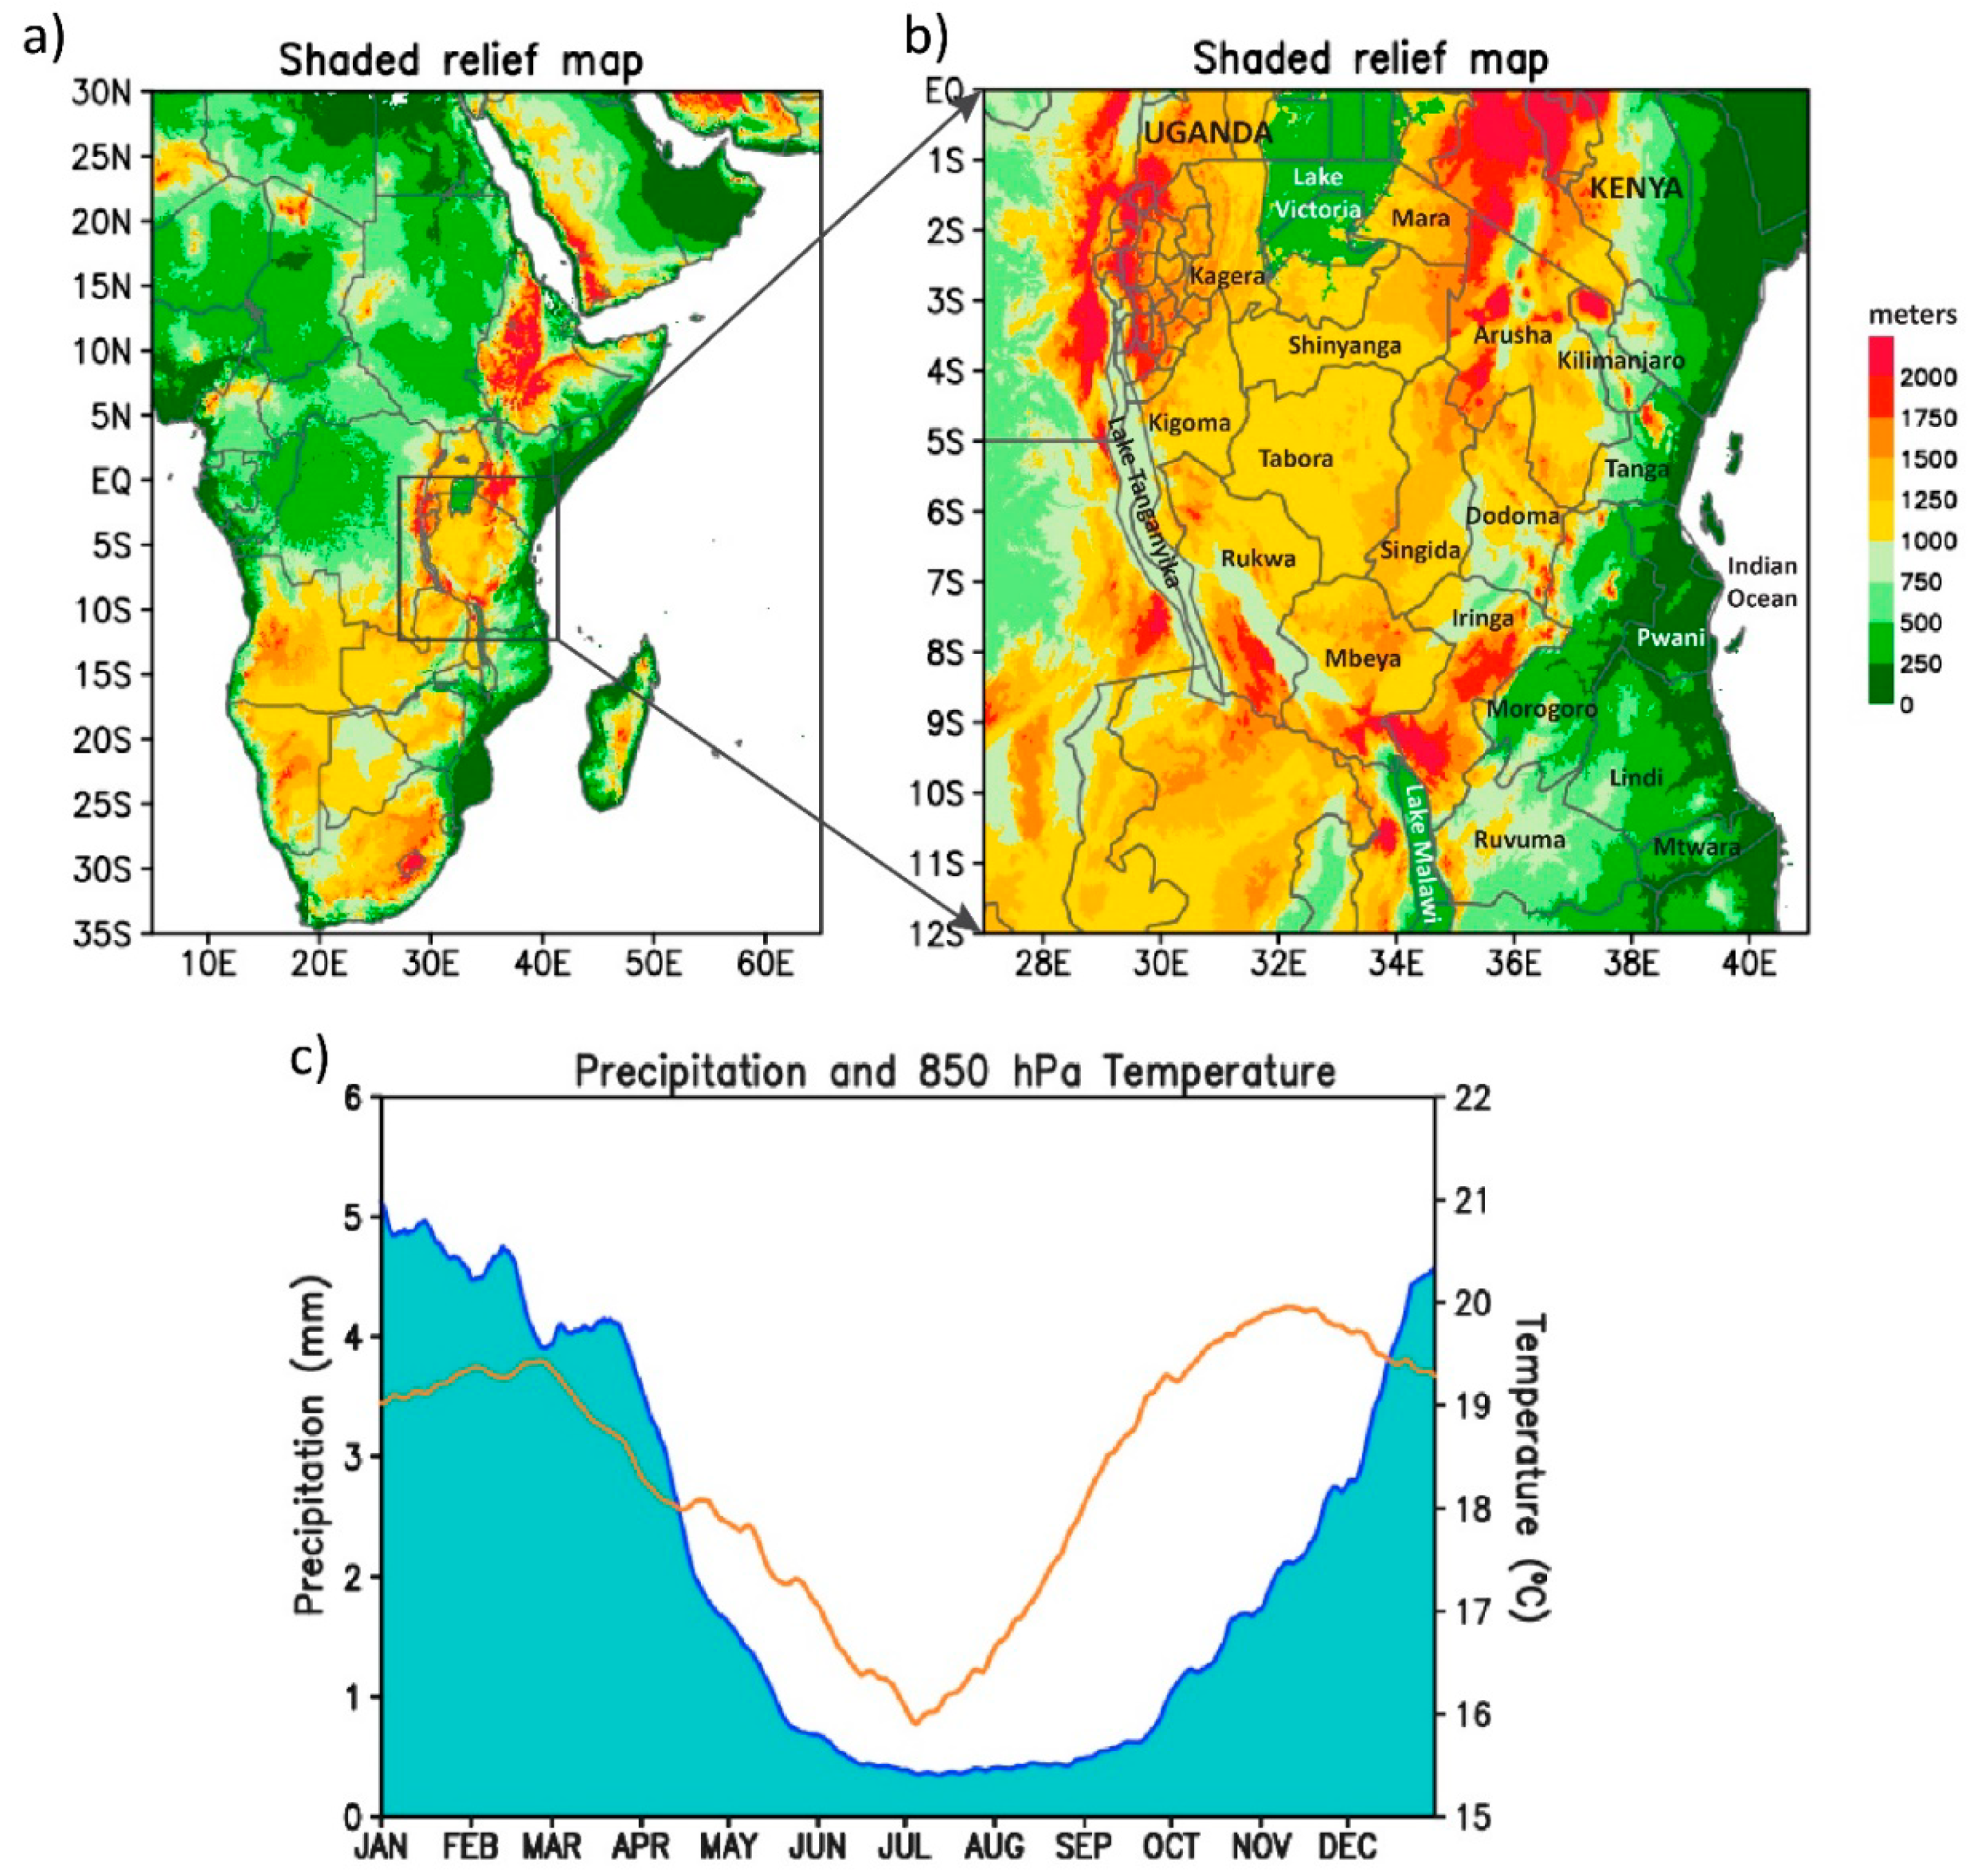
In this study, we focused on Tanzania and explored the historical and projected precipitation trends in the country. Tanzania lies just south of the equator between the East African Great Lakes and the Indian Ocean. Although precipitation extremes affect Tanzania’s livelihood, natural resources, and ecosystems, the future of its climate regime remains uncertain. This drawback is largely due to the shortage of in situ observations, and inconsistencies between observations and climate model simulations. Studies on East African climatology show that mean elevation has a greater effect on the frequency of rainfall than the amount of rainfall [11]. Indeed, topographic differences contribute to regional rainfall variations throughout Tanzania. Elevation increases from coast to inland and is highest in the Southern Highlands in Iringa and Mbeya, and in northeastern Tanzania in Arusha, Kilimanjaro, and Tanga (Figure 1a,b). Average annual rainfall distribution in Tanzania is unimodal (Figure 1c) and is influenced by the movement of the Intertropical Convergence Zone (ITCZ). The ITCZ reaches south of Tanzania in December before retreating north in January until it is furthest from Tanzania in June-July-August (JJA). The peak rainy season in Tanzania is in December-January-February (DJF), followed by a gradual decline in March-April-May (MAM), before the dry season in JJA (Figure 1c). Modes of large-scale climate variability of oceanic origins are also reported to contribute to variations in Tanzania’s precipitation patterns [12,13,14,15,16].
Although considerable research has been done on East African climate, the lack of consensus on dominant modes of climate variability and conflicting past and future precipitation trends calls for re-examination of Tanzania’s precipitation patterns. We present a semi-review paper with new analysis to update literature on Tanzania’s climate and trends. We conducted annual and seasonal climatology and regional analysis within Tanzania using gridded data and compared our results to those of previous studies that focus on East Africa (e.g., [15]). We apply the updated climatology for further examination of variability and trends that are not yet satisfactorily addressed for Tanzania. Section 2 presents the datasets and methods used in this study. Section 3 discusses the results with interpretations and how they compare to findings from other studies. Section 4 presents conclusions derived from this study.
2. Materials and Methods
Observational data used in this study are the 0.25o Global Precipitation Climatology Centre (GPCC) monthly precipitation data provided by the NOAA/OAR/ESRL PSD, Boulder, Colorado, USA, from their website at https://www.esrl.noaa.gov/psd/ [17,18]. GPCC data from 1901 to 2016 are derived from 67,200 quality-controlled global stations [17,18] with a minimum observation of 10 years [19]. The quality of GPCC data with respect to Tanzania’s domain is discussed in the supplementary material. GPCC datasets have high resolution over extended periods that allow for more robust precipitation analyses such as trend and climatological analyses, comparison with climate model simulations, and drought monitoring. For topography, we used the 1-arc-minute shaded relief data from ETOPO1 Global Relief from the National Geophysical Data Center (NGDC) of the National Oceanic and Atmospheric Administration (NOAA; [20]) using bathymetric, topographic, and shoreline data from numerous global and regional digital datasets.
GPCC precipitation datasets were used to perform annual and seasonal trend analyses and empirical orthogonal function (EOF) analysis to study spatial patterns of climate variability and how they change with time [21,22]. EOF analyzes space-time datasets by reducing the data to spatial patterns known as EOFs that explain most of the data, and temporal patterns known as principal components (PC; [23]) that can be correlated with other variables [24]. We applied EOF analysis on annual precipitation in Tanzania during 1961–2016 to explore spatial variations in precipitation patterns and used the principal components of precipitation from EOF analysis to explore the temporal variations of the leading precipitation patterns. Additionally, monthly Sea Surface Temperature (SST) dataset of 2o resolution was derived from NOAA’s extended reconstructed SST (ERSST, version 5; [25]). The SST dataset was used to assess remote climate influences (i.e., teleconnections) of persistent ocean temperature anomalies on regional precipitation patterns by correlating the principal components from the EOF analysis with the SST anomalies.
Reanalysis data are compilations of meteorological data spanning extended time scales (decadal to centennial) from various sources (e.g., rain gauge, remote sensing, radiosonde etc.) that maximize available information and resolution of the data by using numerical weather forecast and data assimilation techniques. Reanalysis data for 850-hPa temperature, winds, and relative humidity of 2.5o resolution were obtained from the National Centers for Environmental Prediction/National Center for Atmospheric Research (NCEP/NCAR) Reanalysis 1 (R1; [26]). Low-level 850-hPa winds and relative humidity were used to study annual and seasonal climatology of the atmospheric circulation patterns over Tanzania.
To understand climate change caused by natural variability or changes in radiative forcings, climate model outputs need to be analyzed collectively for the examination of future climate projections [27,28]. Coupled Model Intercomparison Project (CMIP) is a collaborative effort that set protocols to improve climate models by comparing model simulations under similar scenarios to each other and to observations [29]. Climate model simulations for historical and projected precipitation were downloaded from the CMIP5 server at http://climexp.knmi.nl/ [30]. The annual extremes of daily CMIP5 data are from ETCCDI extreme indices archive at the Canadian Center for Climate Modelling and Analysis [31,32]. Each CMIP5 model was based on anthropogenic forcing of the representative concentration pathway 8.5 (RCP8.5; [33,34]) to study extreme scenario. Historical precipitation time series were derived from 44 ensembles of CMIP5 data from 1861 to 2005 and from 2006 to 2100 for future projections.
3. Results
3.1. Climatology
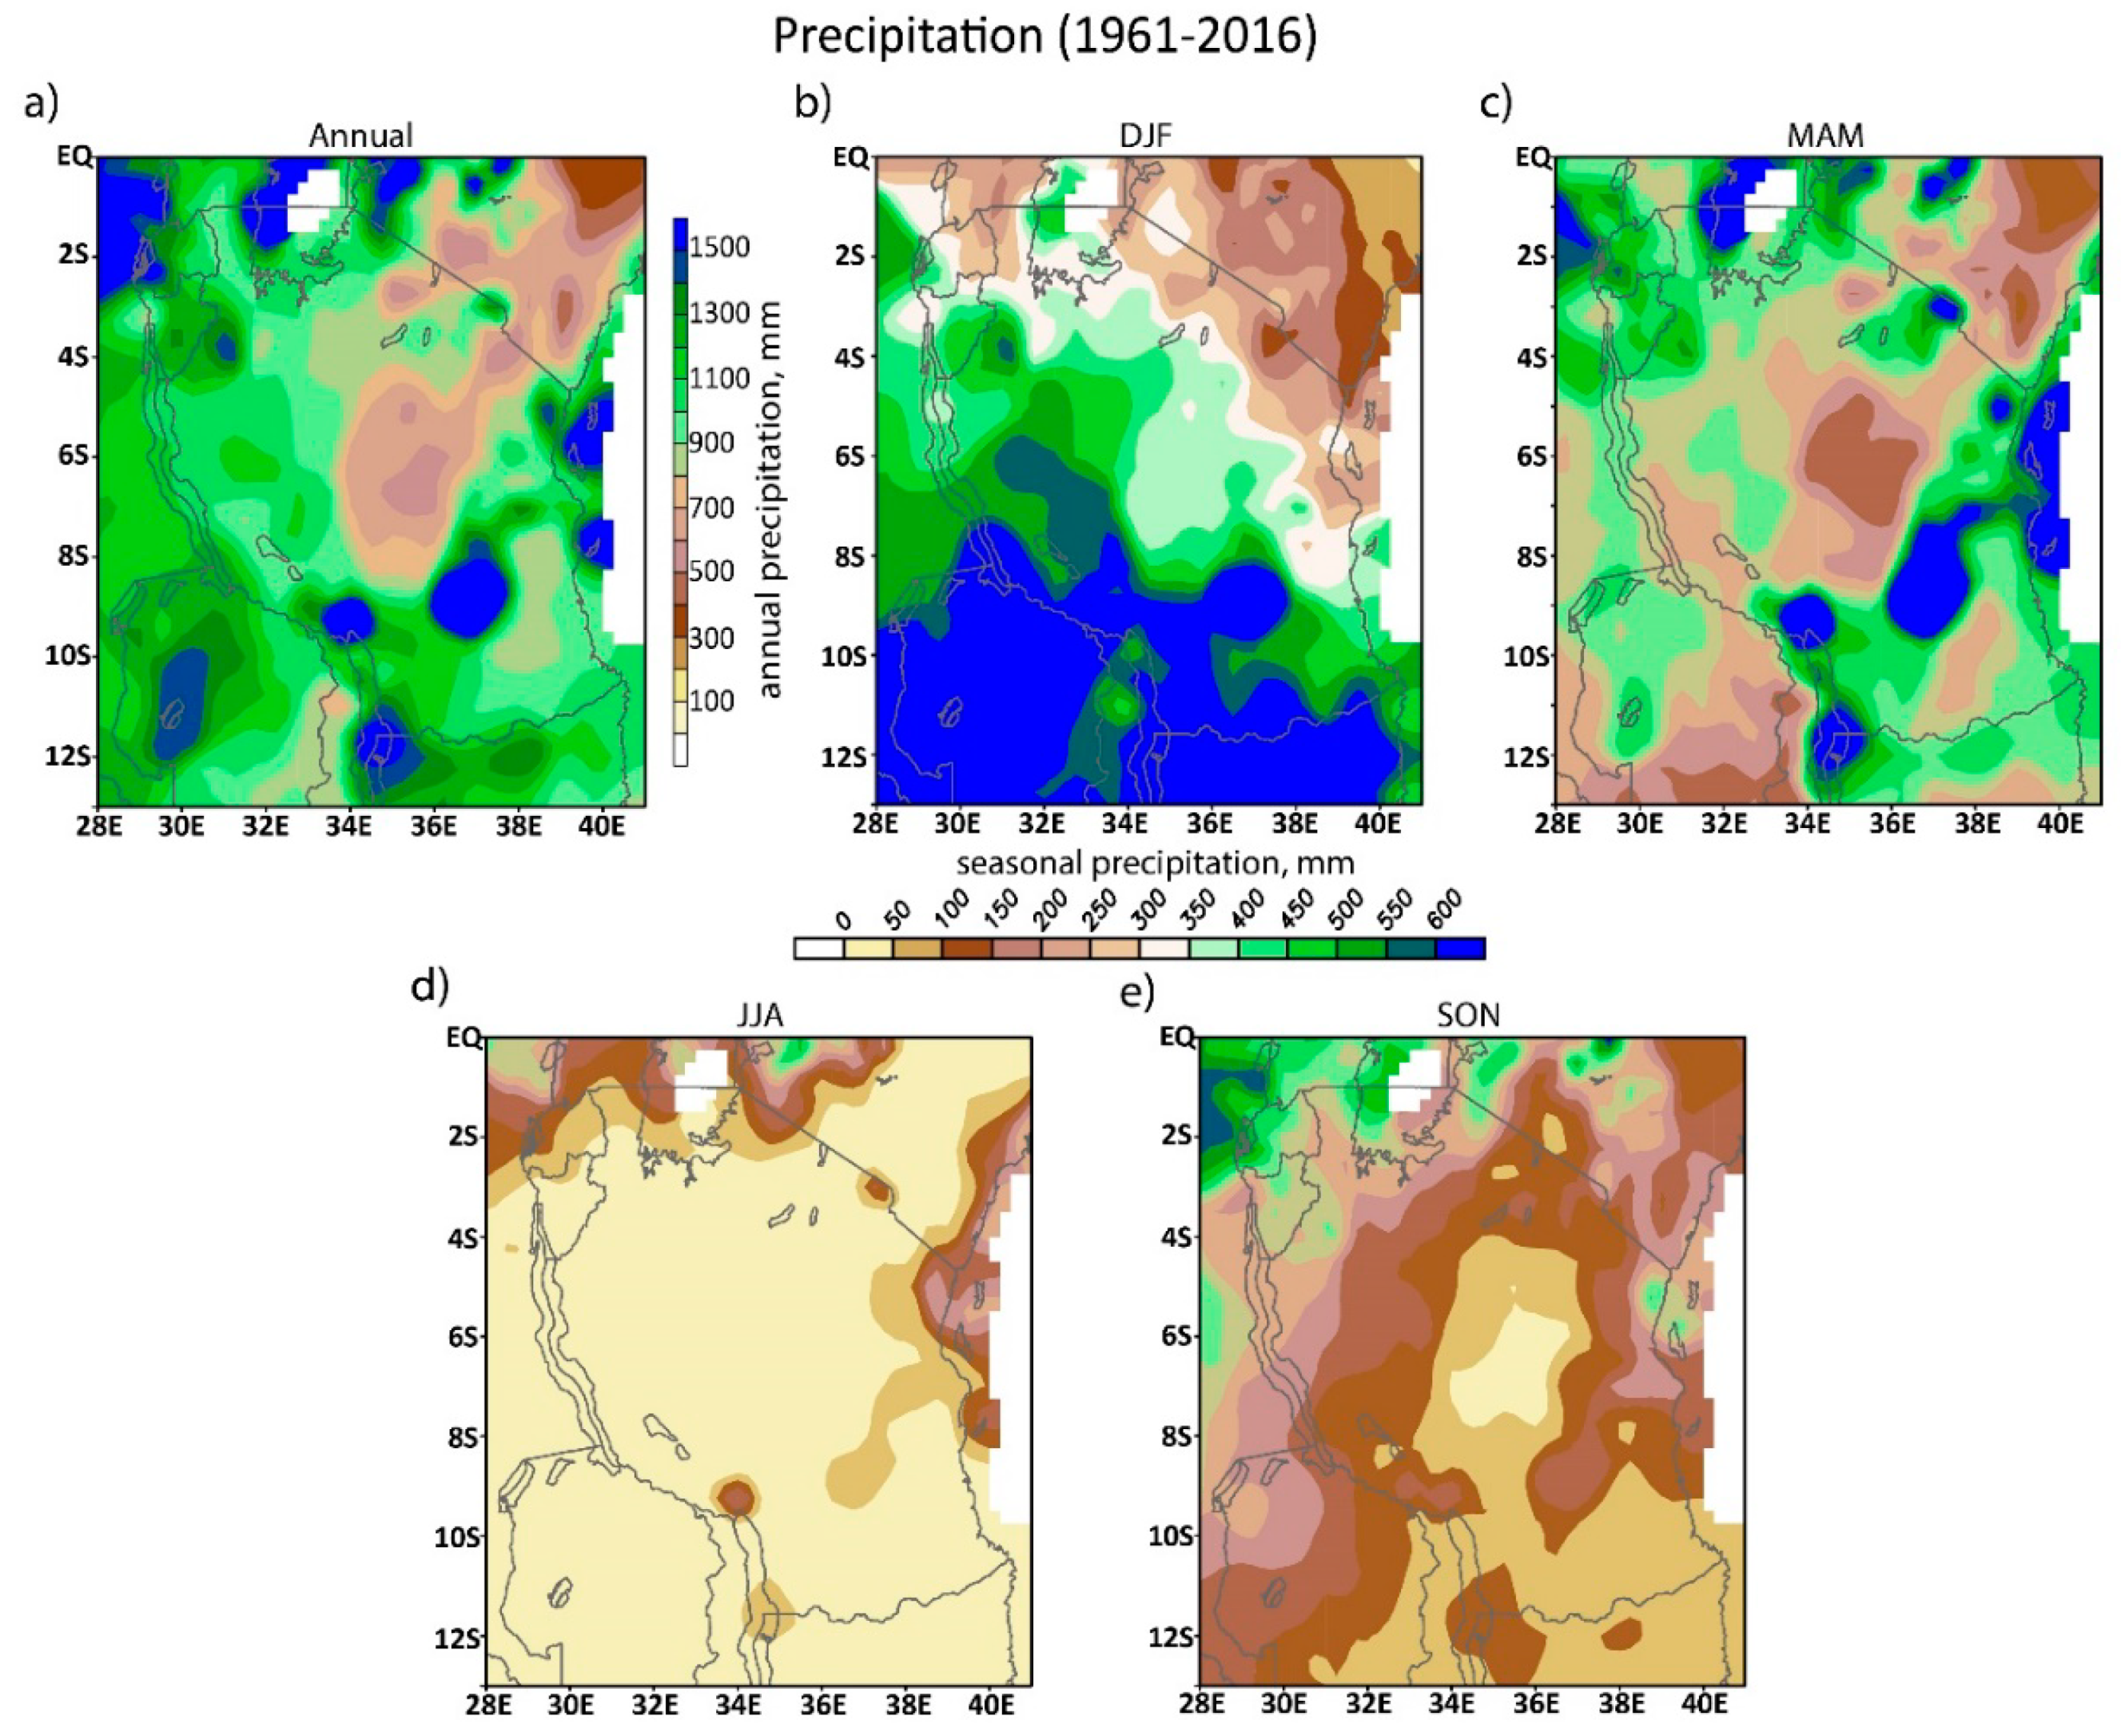
The climatology of Tanzania’s precipitation is heterogeneous across the country due to complexities related to combined large-scale effects of topography, winds, humidity, and dynamics of tropical circulation; therefore, it is important to revisit and examine the climatological features of precipitation. Seasonality of rainfall along coastal areas is different than further inland, and annual precipitation is higher near coasts (Figure 2a–e). Annual precipitation climatology shows maximum cumulative rainfall in southwestern Tanzania while the central region receives the lowest rainfall in the country (Figure 2a). Two high precipitation centers are localized over the Southern Highlands: one over Morogoro and Iringa, and another over Mbeya to the north of Lake Malawi (Figure 2a). Other precipitation centers occur in northwestern Tanzania over Kigoma, Kagera, and western Lake Victoria, and in northeastern Tanzania over Tanga and Kilimanjaro (Figure 2a). Seasonal climatology reveals that most of the annual rainfall occurs between December and May, with varying spatial distribution from DJF to MAM (Figure 2b,c). Southern and western to central Tanzania receive maximum seasonal rainfall in DJF whereas northern and eastern Tanzania receive maximum seasonal rainfall in MAM (Figure 2b,c). In JJA, precipitation is uniformly distributed among regions and does not typically exceed 100 mm (Figure 2d). In the spring of September-October-November (SON), northwestern Tanzania receives the most rainfall in the country (Figure 2e).
An important point of note here is that Tanzania’s precipitation patterns in the southern and central parts do not coincide with those of its East African counterparts in southern Uganda and central to southwestern Kenya (Figure 2a–e), where rainfall distribution is bimodal, i.e., with prolonged rains in MAM when the ITCZ moves northward slowly, and a brief rainy season in SON when the ITCZ moves southward. Distinct high precipitation centers occur in southern Uganda and central to southwestern Kenya just north of Tanzania in MAM and SON (Figure 2a–e). Eastern Kenya is also slightly wetter in MAM than the rest of the year (Figure 2a–e). For bimodal rainfall distribution in East Africa, the precipitation centers are stronger in MAM than SON (Figure 2a–e). As the ITCZ does not linger over southern and western to central Tanzania in the austral spring, SON rainfall is low, and a significant precipitation increase is not observed until December. This yields a more unimodal distribution influenced by position of the ITCZ over southern Tanzania where the rainfall period lasts approximately six months (Figure 2b–e). However, northern Tanzania has a bimodal rainfall distribution similar to Kenya and Uganda (Figure 2b–e), as the ITCZ crosses over the region twice a year. Low-level tropospheric temperatures in Tanzania reflect both precipitation regimes. The 850-hPa air temperature reaches its annual maximum in November before the end of the short rainy season, followed by a slight cooling in December, and peaks again in late February before the onset of the prolonged rainy season (Figure 1c). The 850-hPa air temperature (Figure 1c) reaches its annual minimum in July during the peak of the dry season; the 850-hPa level is about 1500 m above sea level and is therefore representative of the air temperature over the complex terrains.
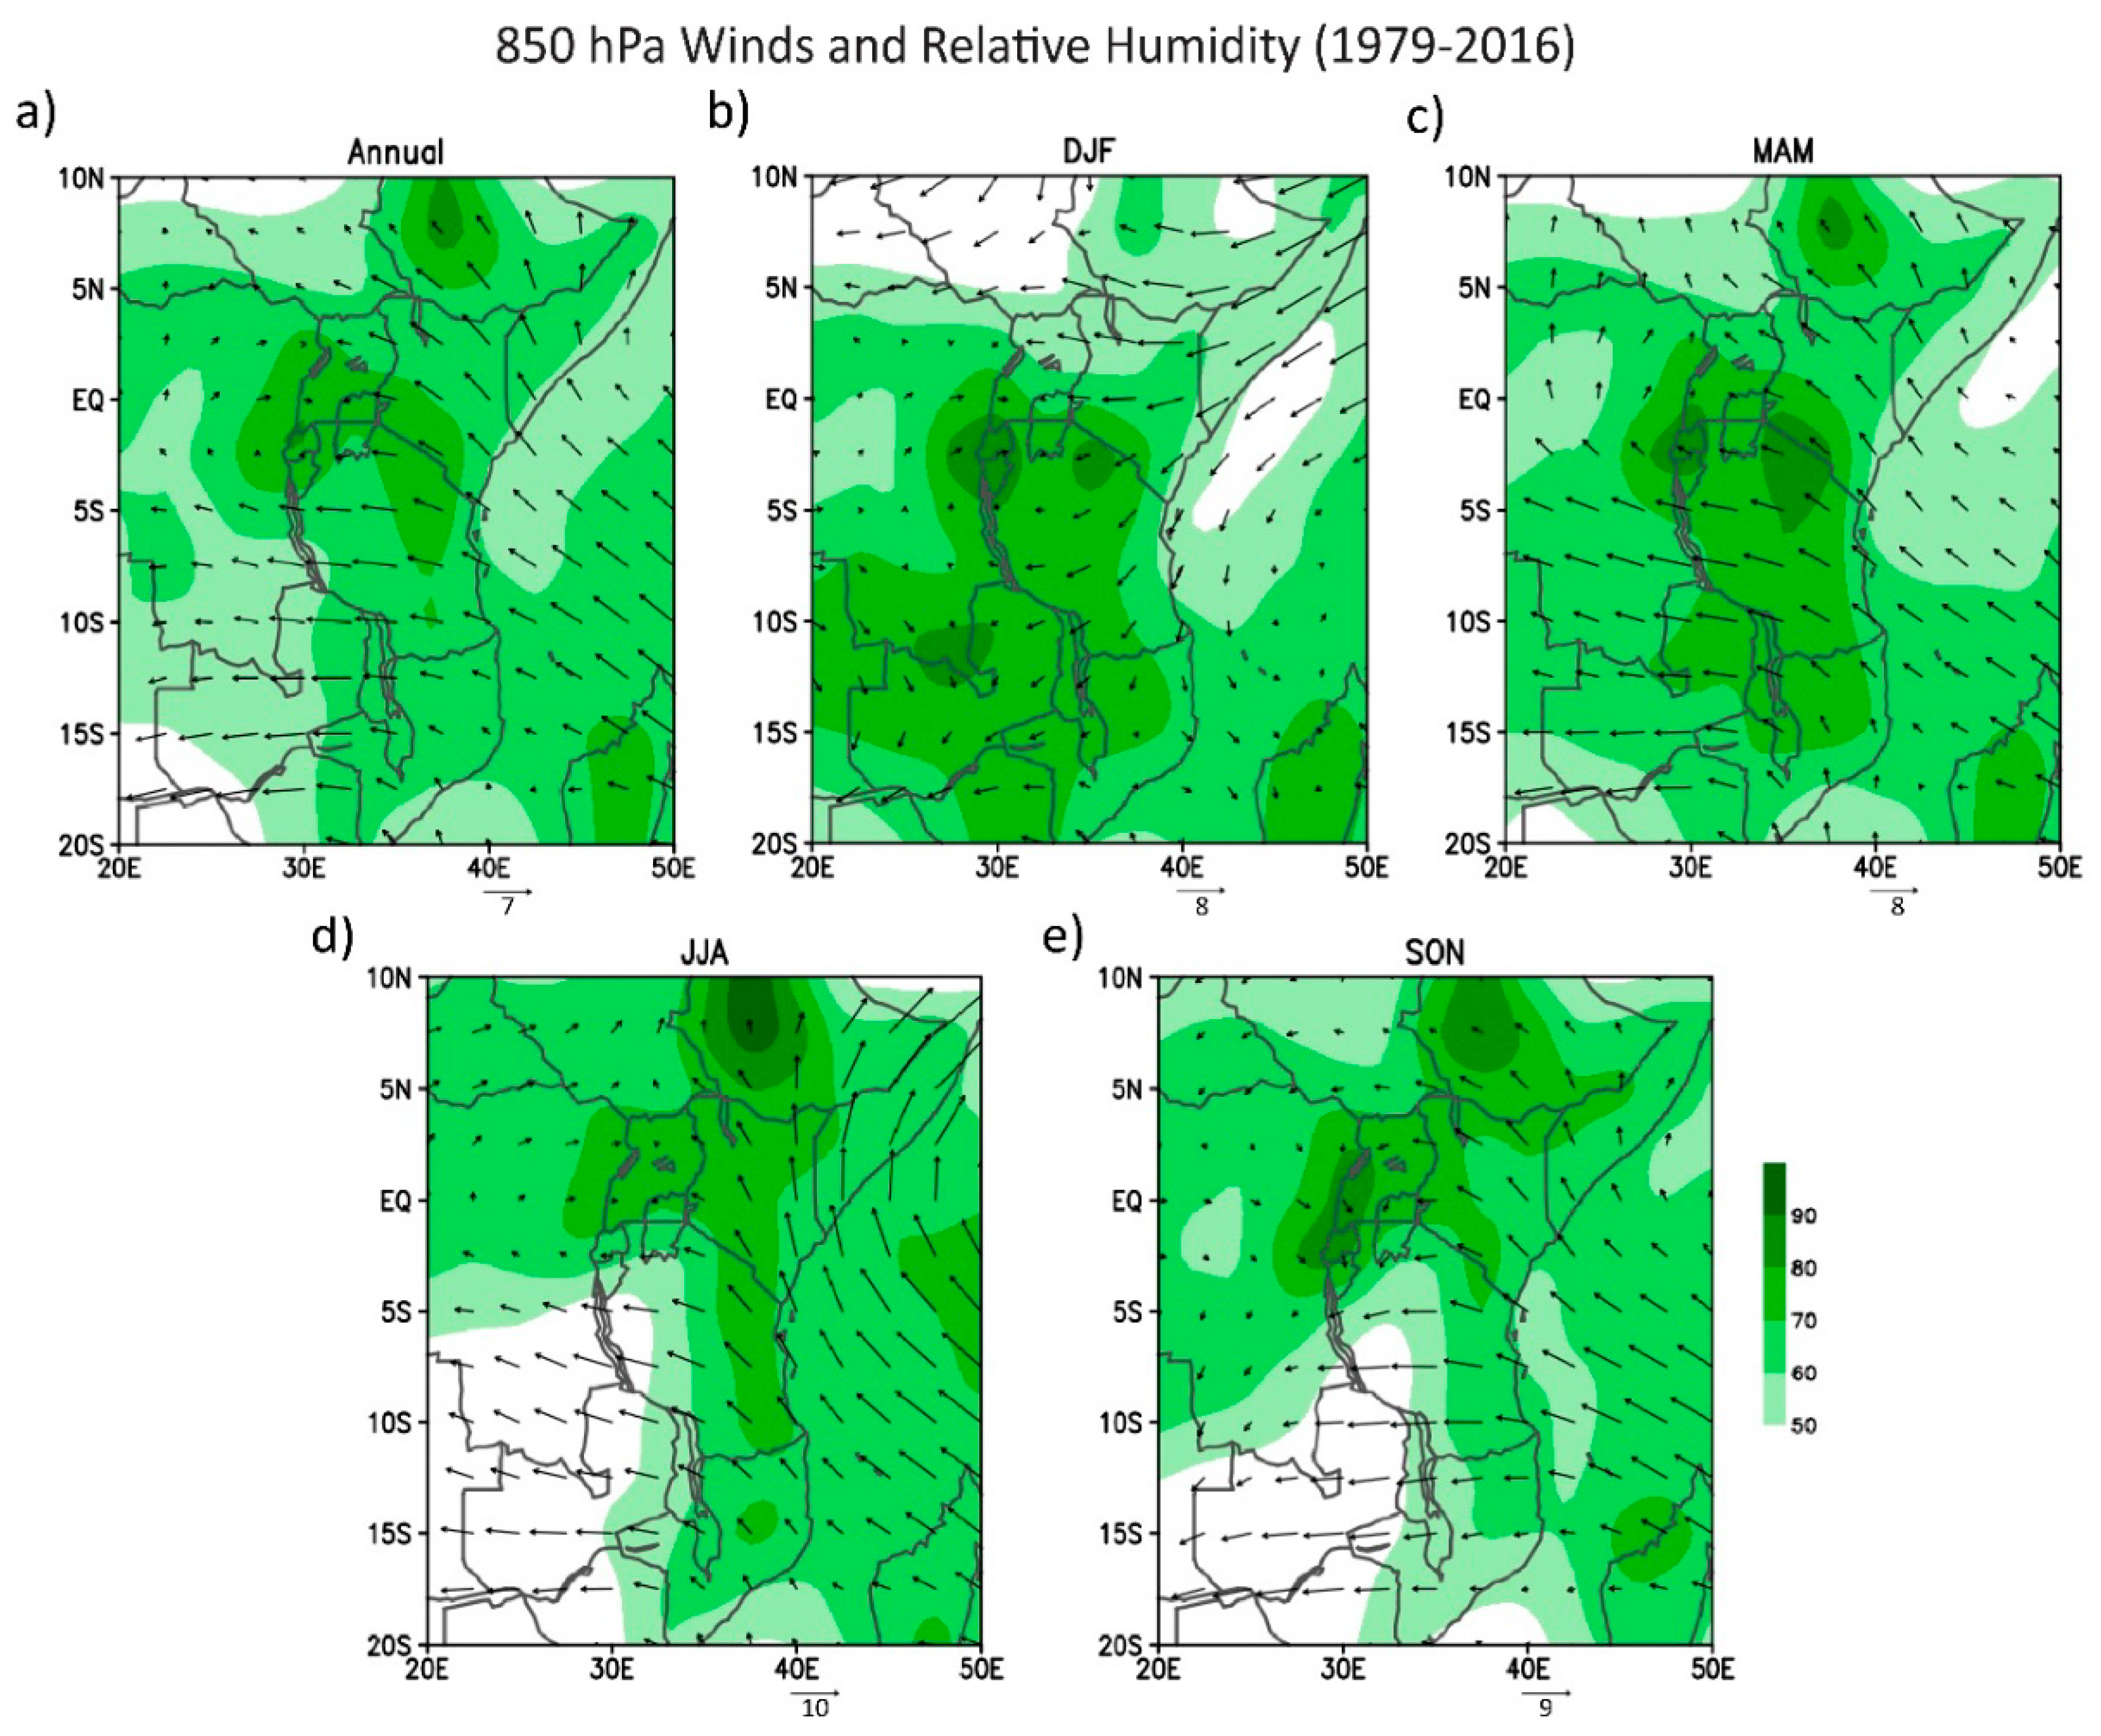
Low-level atmospheric circulation and relative humidity patterns over Tanzania vary considerably throughout the year (Figure 3a–e). Due to Tanzania’s close proximity to the equator, its climate is shaped by trade winds that are controlled by the position of the ITCZ [35]. The three major air streams that affect circulation patterns and distribution of moisture in Tanzania are the northeasterly trade winds, the southeasterly trade winds, and the westerly Congo air [36]. The trade winds are associated with a subsiding motion and are relatively dry while the Congo air is moist and unstable. In the austral summer, when the ITCZ is south of Tanzania, the northeasterly trade winds that are parallel to the Great Horn of Africa diverge along the coastal areas of Tanzania and converge with low-level moisture fluxes from the southern Congo Basin over Lake Tanganyika (Figure 3b). In the austral winter, when the ITCZ is north of Tanzania, the southeasterly trade winds diverge into two different directions (Figure 3d), with one towards western Tanzania and the other northward along the Somali coast (Figure 3d). Coastal areas are drier where northeasterly and southeasterly trade winds are parallel to the coastline because friction between the coast and the water causes subsidence [37]. Coastal aridity is further enhanced by presence of the rift valley system that blocks the warm moist Congo air from reaching the Tanzania shorelines [36].
Tanzania’s precipitation is also influenced by local circulation patterns along coastal areas and around large lakes [38]. Lake Victoria is reported to affect the regional distribution, diurnal cycles, and seasonal variation in precipitation in northern Tanzania [39,40]. Total precipitation for Lake Victoria comes from nocturnal rains over the western lake surface and afternoon rains over the eastern lake surface [39]. Most of the rainfall is controlled by the nocturnal component of land-breeze circulation when the land surface becomes cooler than the lake surface [40,41,42]. The associated convergence and thermal instability produce mesoscale convective systems over the central and western lake surface, and lasts several hours [39]. Prevailing easterly winds ensure that the thunderstorm clusters associated with the convergence are centered over the western and central part of the lake during the mature stage [39]. As a result, most of the Lake Victoria’s rainfall occurs over the western part of the lake (Figure 2a–e), and at night during storm activity. This circulation pattern occurs approximately 175 days a year [43] and generates 80% of the water source for the lake [5]. Although Lake Victoria’s water levels are receding [5], future projections predict an increase in intense thunderstorms and extreme precipitation over the lake [44].
3.2. Trends
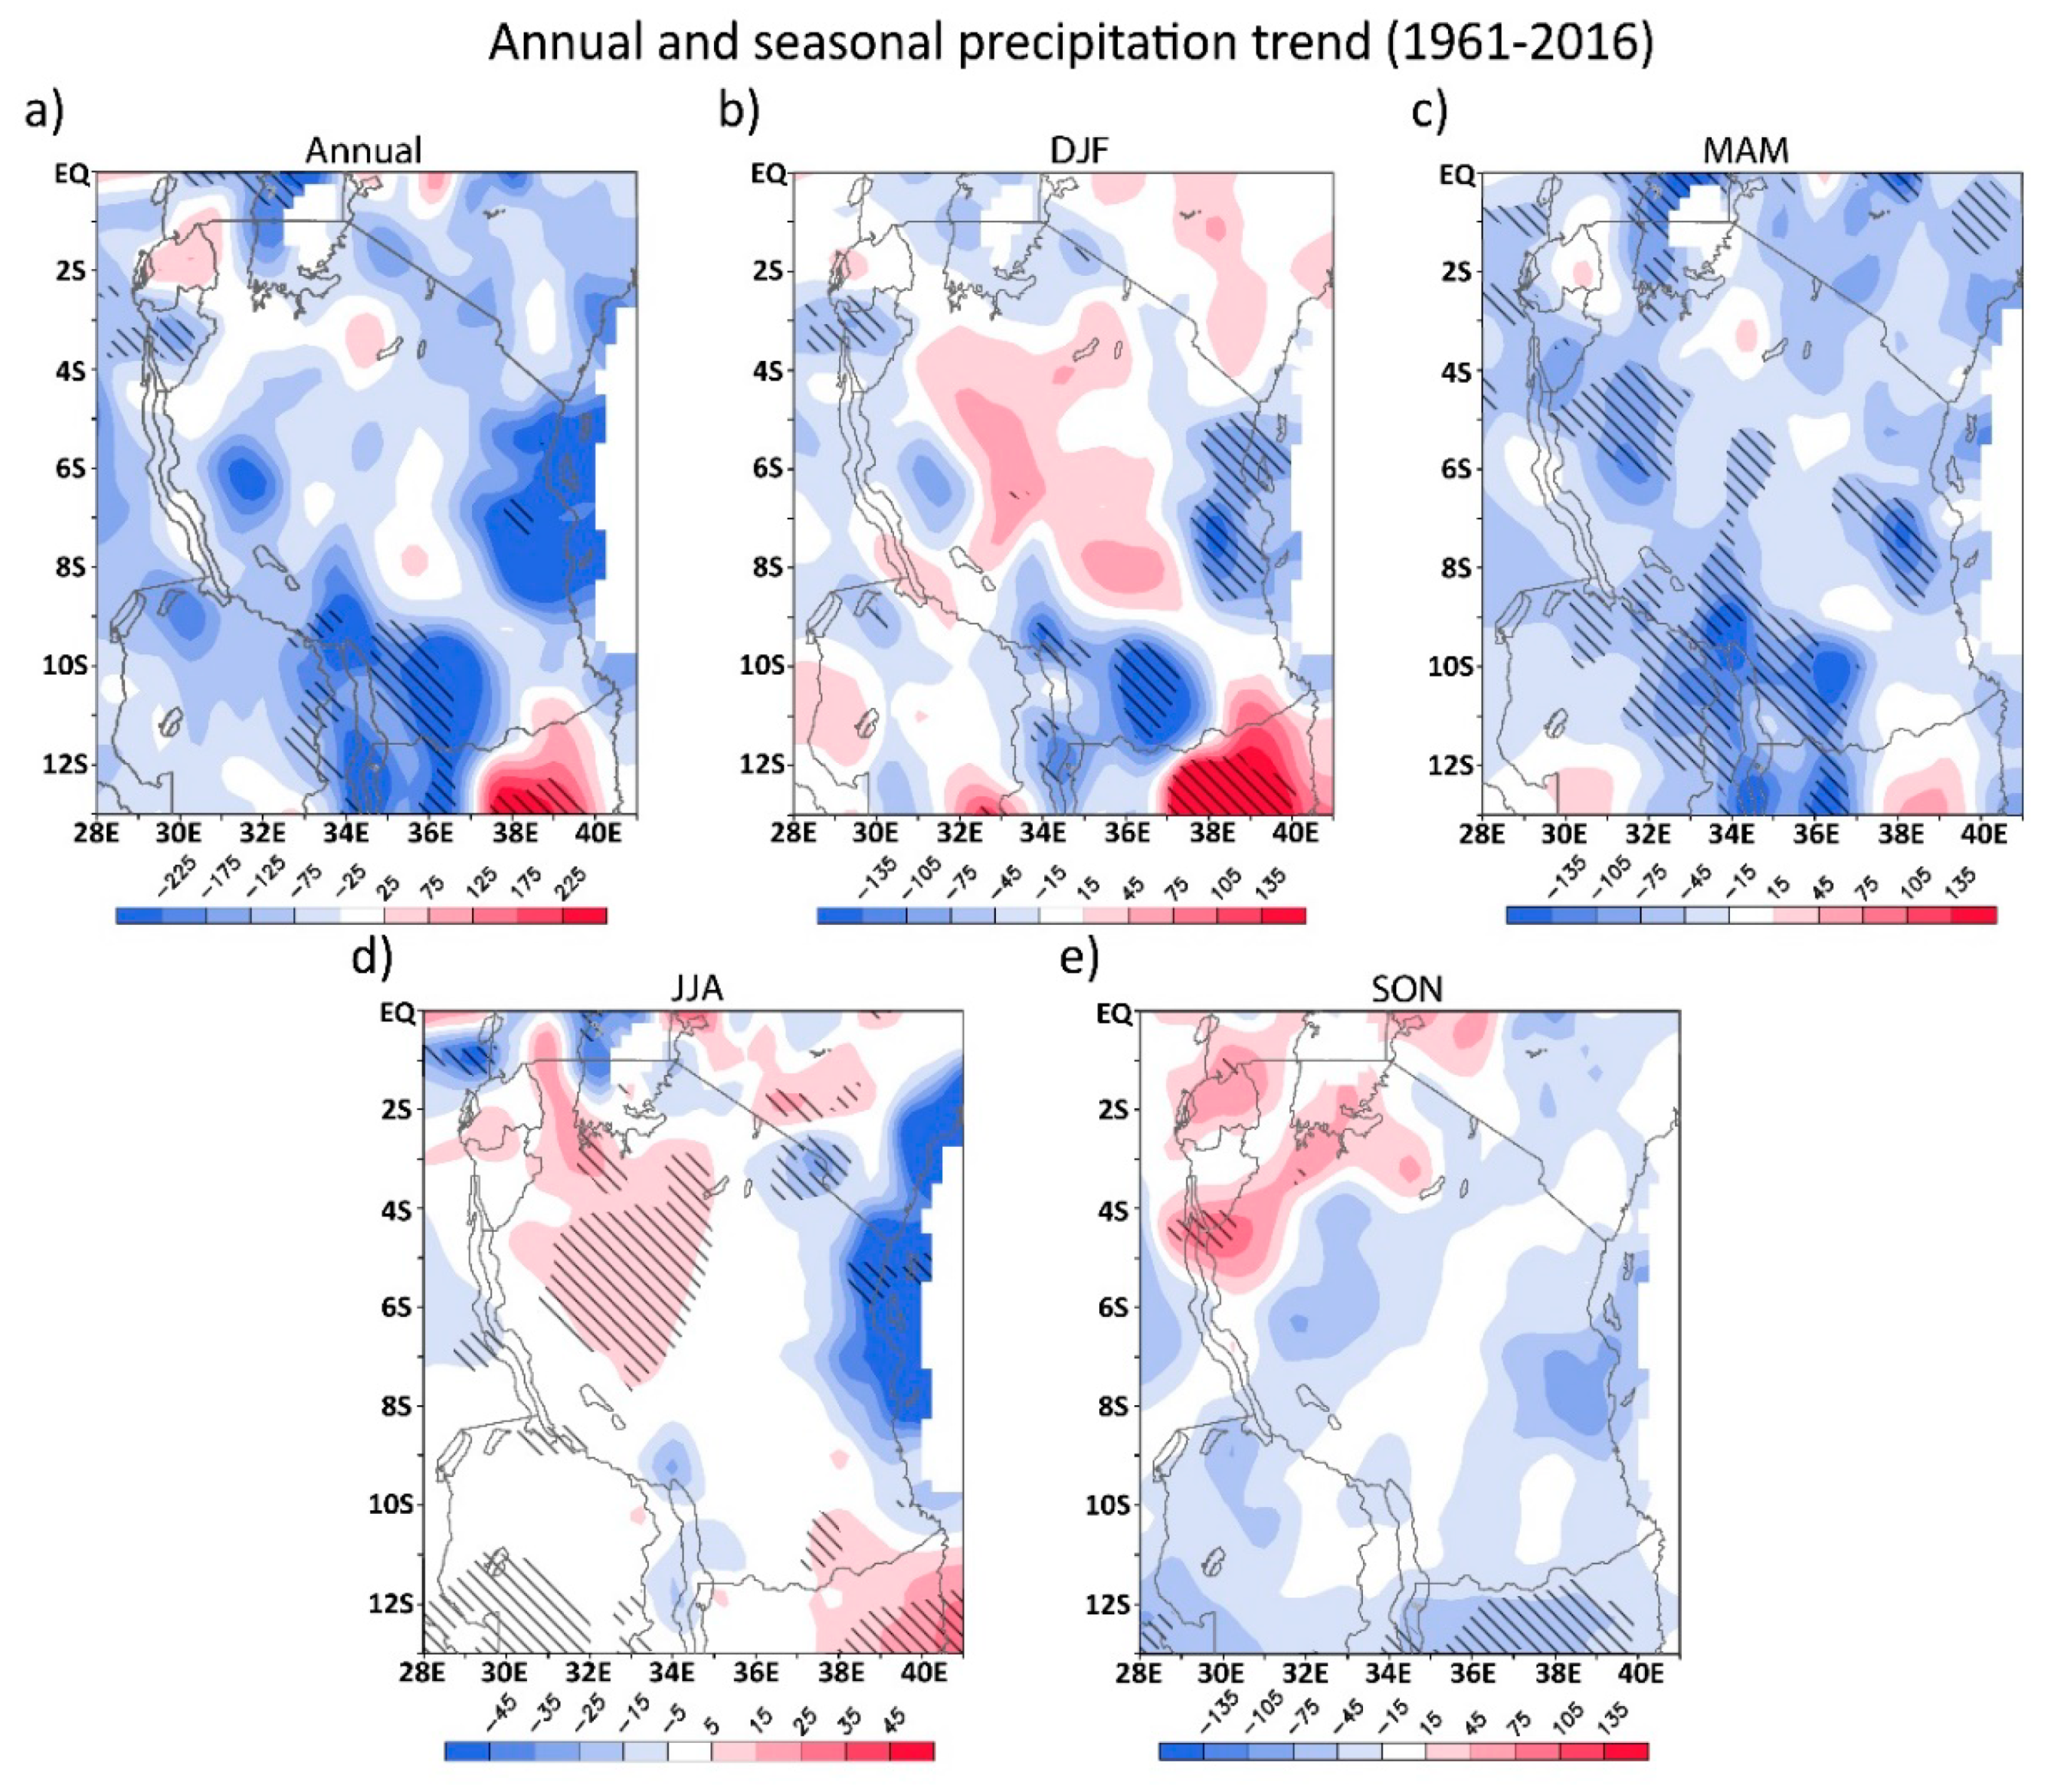
Trend analysis for rainfall accounts for the long-term change in precipitation, and provides information about precipitation patterns and variability [45]. An overall decreasing annual precipitation trend is observed in Tanzania from 1961 to 2016 (Figure 4a). This negative trend is strongest and expansive for the Southern Highlands in Lake Malawi, Ruvuma, and southern Iringa, and near coastal areas in Tanga, Dar-es-Salaam, Morogoro, and Pwani (Figure 1b and Figure 4a). Other strong negative trends are localized in Rukwa and Tabora in western Tanzania, and western Lake Victoria (Figure 1b and Figure 4a) where water levels dropped significantly in recent years [5,46]. In northeastern Tanzania, Arusha and Mara just east of Lake Victoria yield a moderately decreasing annual precipitation trend (Figure 4a). The rest of Tanzania experienced either a very slight increase or no significant change in precipitation (Figure 4a).
Seasonal precipitation trends in Tanzania reveal eminently decreasing precipitation in coastal areas throughout the year (Figure 4b–e). In DJF, the negative trend is strongest in the Southern Highlands and coastal areas, and the positive trend is strongest for central Tanzania in Tabora, Singida, and northern Iringa (Figure 4b). DJF rainfall is also suppressed in western Tanzania, western Lake Victoria, and Mara (Figure 4b). A drying trend in MAM is evident from negative anomalies throughout the country, particularly in the Southern Highlands (Figure 4c). The MAM precipitation trend resembles the annual precipitation trend more closely than other seasons (Figure 4a-e), indicating that the overall drying trend in Tanzania is largely a result of extreme negative anomalies during the long rains season. MAM is the only season in which the most of precipitation in Tanzania exhibits a significant trend; this is consistent with previous studies on East Africa that show the greatest negative rainfall departures in MAM [1,7,8,15,47,48,49,50,51,52]. All other seasons either show a locally significant trend or do not reveal any significant change in the long run. In JJA, the negative trend is strongest near coastal areas, and a positive trend is apparent in central to northwestern Tanzania (Figure 4d). In SON, a general decreasing trend is observed throughout Tanzania with exception of the northwestern regions where precipitation increased i.e., wet areas became wetter and dry areas became drier (Figure 4e). Lake Victoria experienced an increasing trend during the short rains season (Figure 4e). Interestingly, although East African annual rainfall has declined in the past three decades, precipitation during the short rains season has increased [1,16].
3.3. Variability
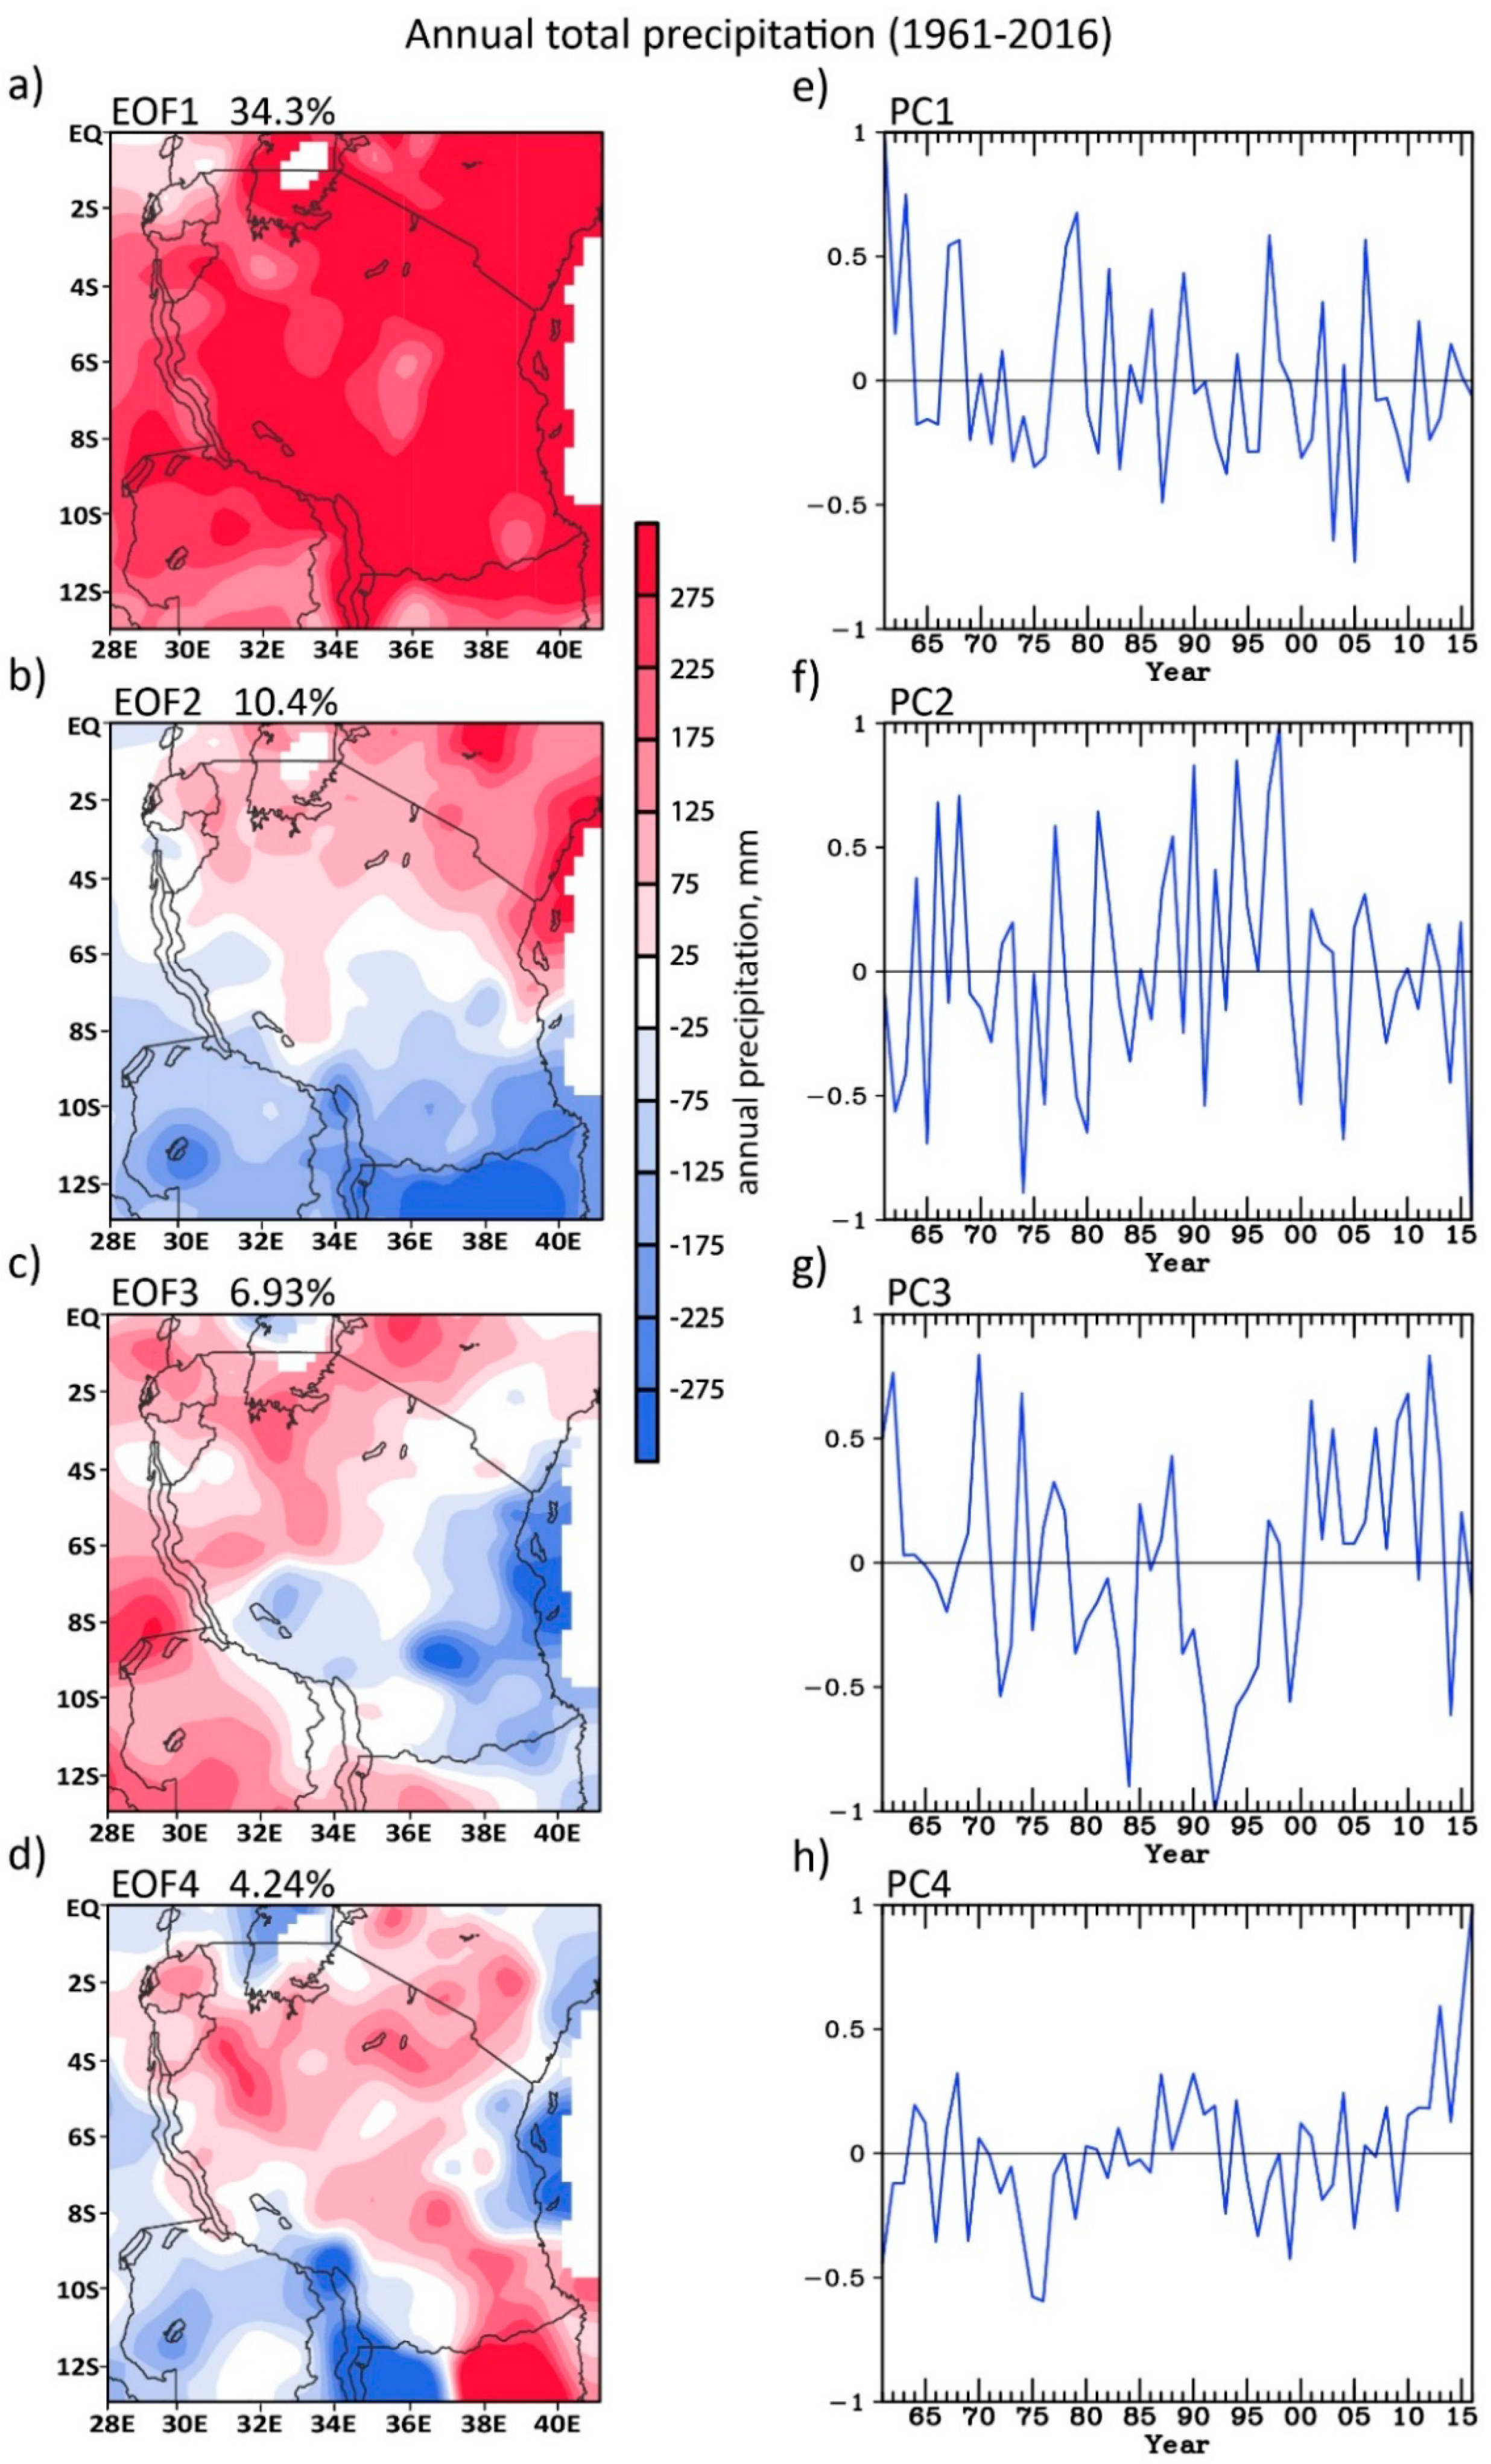
The EOF analysis was used to study spatial and temporal patterns of seasonal precipitation from 1961 to 2016. The first four modes of EOF explain 55% of the variation of annual precipitation in Tanzania. The first mode of EOF (EOF1) of annual precipitation corresponds to the climatology (Figure 5a) and the second mode of EOF (EOF2) of annual precipitation closely resembles the annual precipitation trend (Figure 5b). EOF1 shows positive anomalies throughout Tanzania and explains 34% of the total variation (Figure 5a). EOF2 shows negative anomalies over southern Tanzania and explains 10% of the total variation (Figure 5b). The positive anomalies of EOF1 reflect the decreasing trend in PC1 (Figure 5a,e). The anomalies of EOF2 reflect the multi-decadal increase in PC2 from 1961 to 1997, followed by a decrease from 1998 to 2016 (Figure 5b,f). EOF3 shows the decreasing precipitation with 7% variance over the eastern part of the country in coastal region (Figure 5c) while PC3 does not show any trend (Figure 5g). EOF4 also shows both increasing trend and precipitation with only 4% of the variance (Figure 5d), however PC4 shows the increasing trend (Figure 5h). Additionally, we also looked the seasonal precipitation EOF, focusing on summer rainfall (December to May); the distribution is similar to the annual precipitation (result not shown).
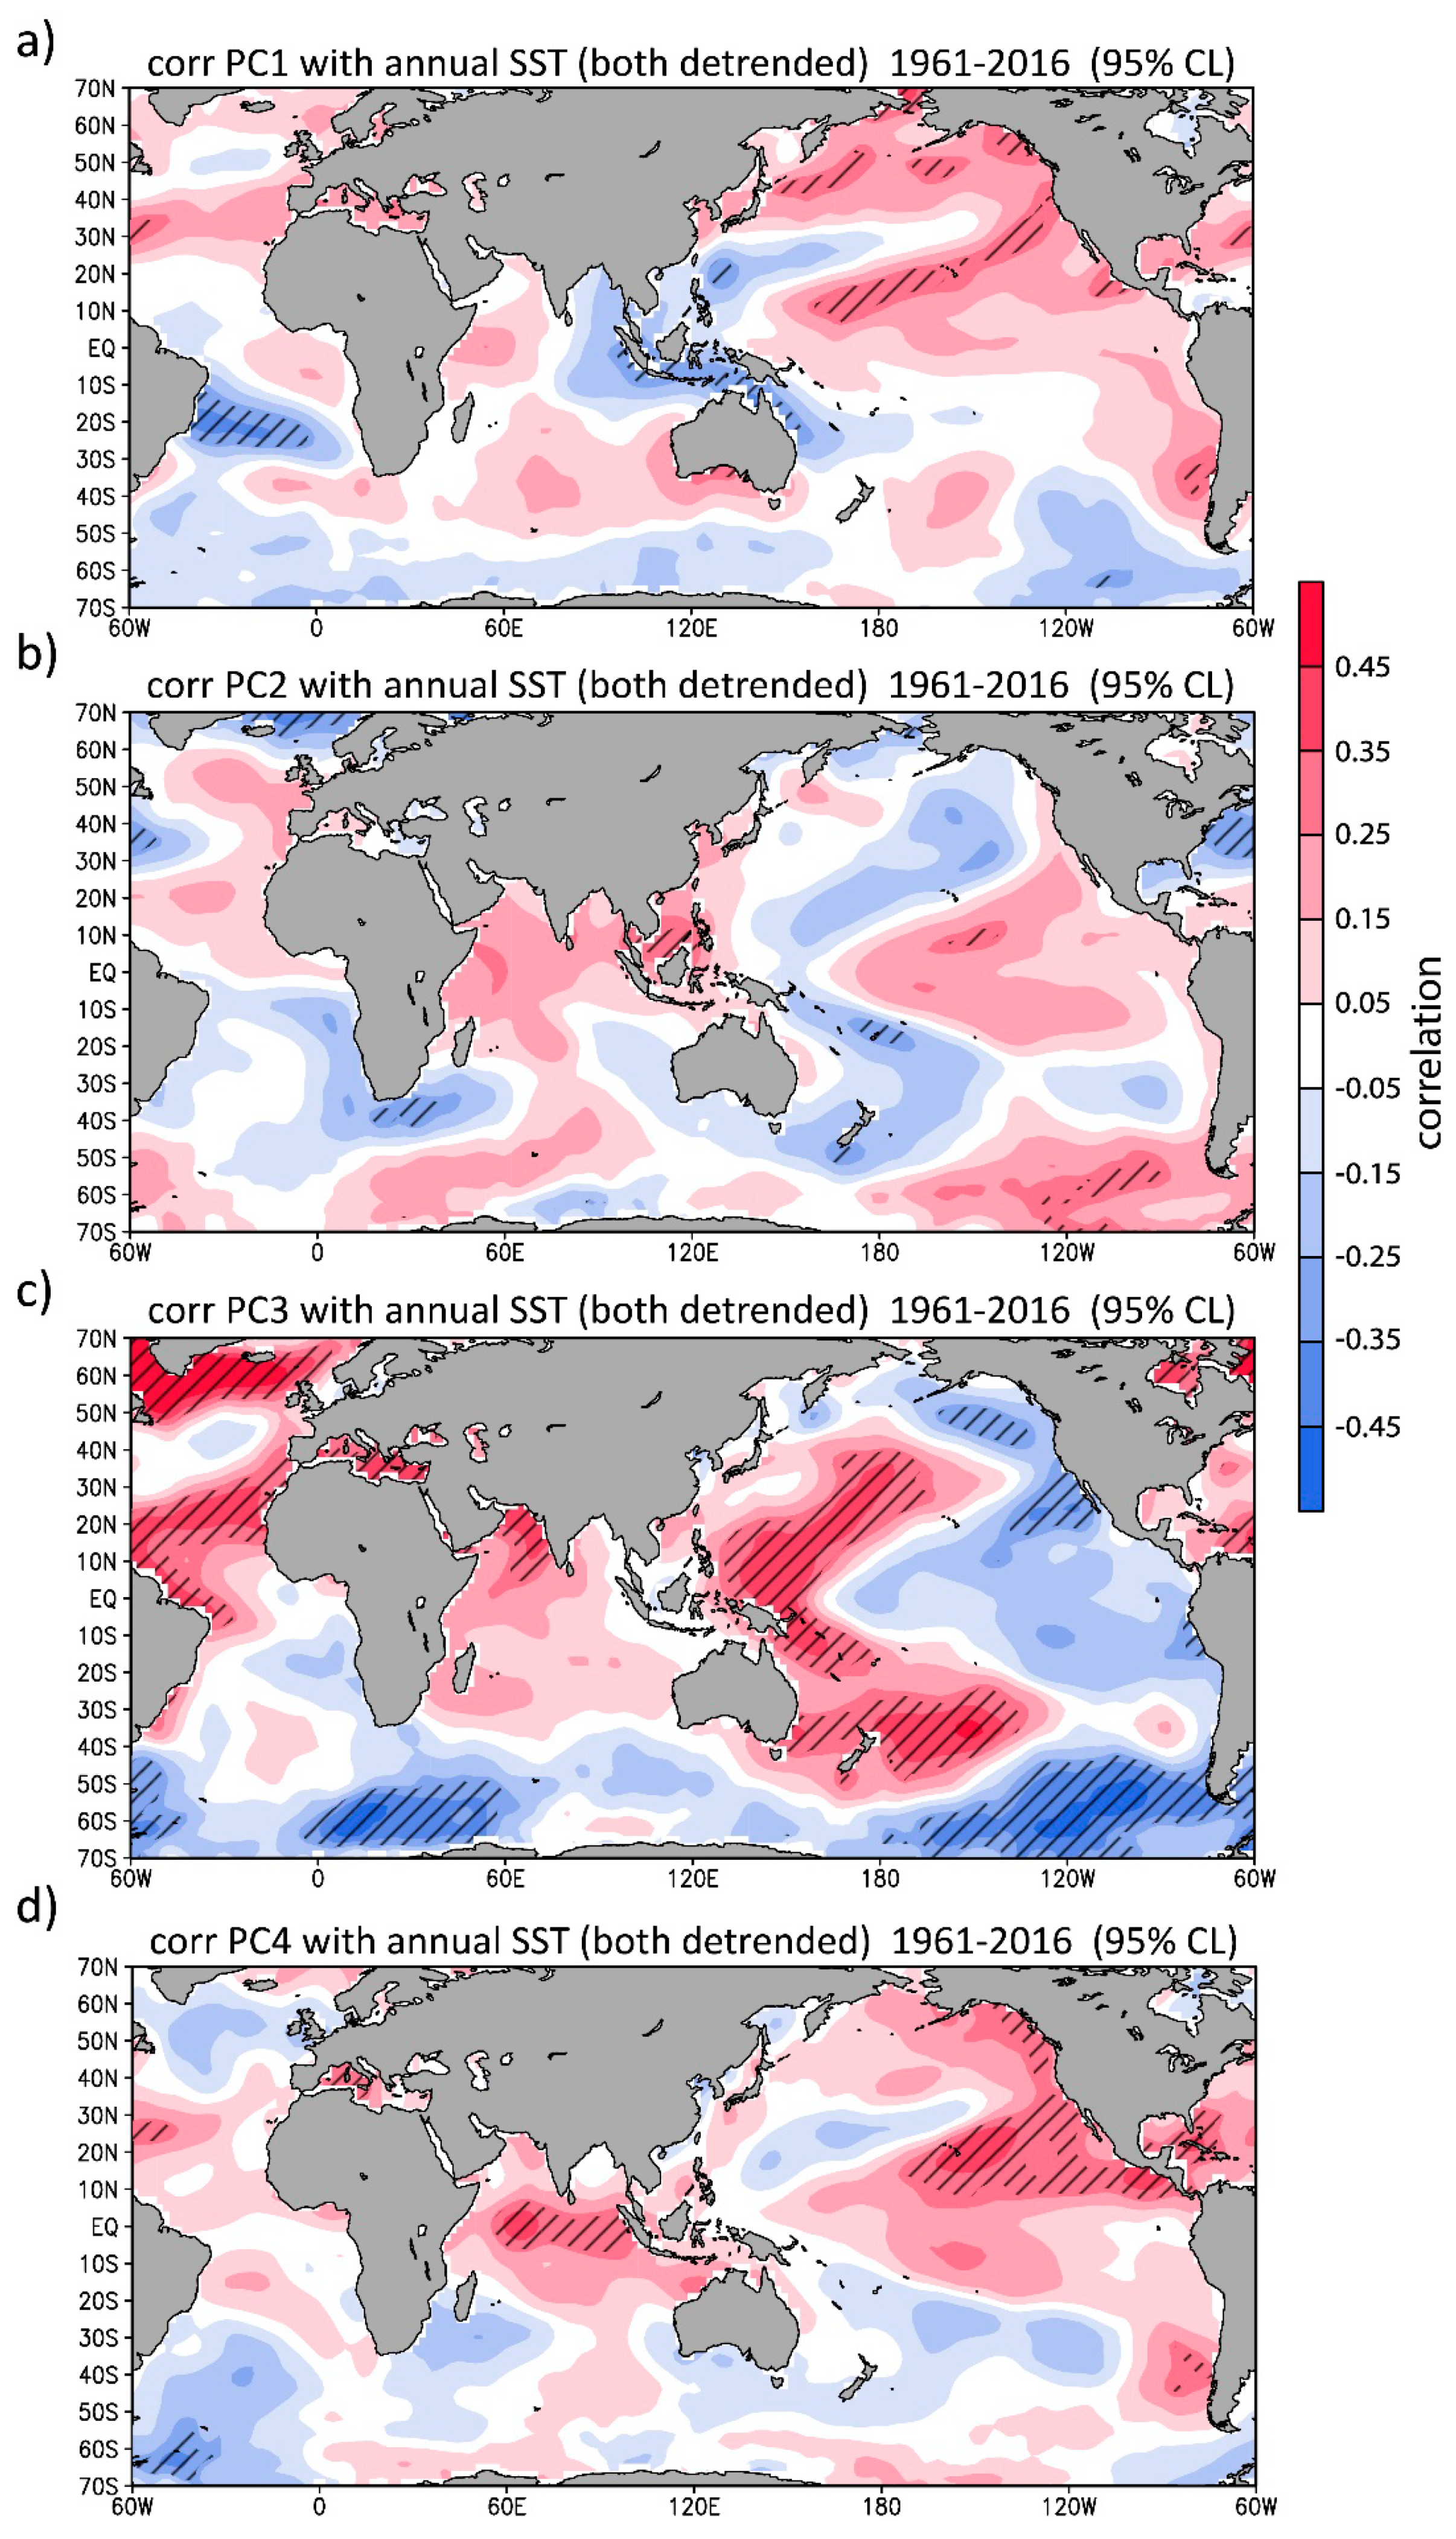
Comparison of the principal components of precipitation time series with global SSTs over the study period 1961-2016 stresses the effects of ocean forcings on Tanzania’s climate (Figure 6). We detrended both variables (PCs and SSTAs) first before constructing the correlation maps of Figure 6 to better depict the interannual variations. The first mode of precipitation is linked to SST variability over the eastern and western Indian Ocean in an opposite manner (Figure 6a), a pattern characteristic of the Indian Ocean Dipole (IOD). Pattern of PC1 correlation with SST shows correlations in the eastern Indian Ocean and western Pacific (Figure 6a), however the correlation is not significant after detrend. PC2 shows a positive yet insignificant correlation with the El Niño-Southern Oscillation (ENSO) pattern, similar to that found by Mazzarella et al. [53], albeit weaker (Figure 6b). PC3 is related to reduced precipitation over the east coast of Tanzania (Figure 5c,g) in association with increased SST in the Arabian Sea and the western Pacific Ocean (Figure 6c). This suggests that when SSTs in the western Pacific Ocean increase, precipitation in eastern Tanzania decreases while precipitation over western Tanzania increases. Finally, PC4 shows strong correlation with increased Indian Ocean and eastern Pacific temperature (Figure 6d). However, PC4 shows increasing trend (Figure 5h) with no significant precipitation change over Tanzania (Figure 5d), indicating that warmer ocean (Indian and Pacific Oceans) may not directly alter precipitation patterns in Tanzania.
Various modes of climate variability have been proposed as possible drivers of interannual and intraseasonal variability of East African rainfall. Some studies link the recent drying trend to changes in SSTs in the tropical Pacific basin [2,49,50]. Lyon and Vigaud [15] show that the decline in MAM rains in East Africa started in 1999 and link the timing of the abrupt shift to the Pacific Decadal Variability (PDV). Wainwright et al. [54] believe that the drying trend is caused by shortening of the MAM rainy season due to more rapid movement of the ITCZ rather than simply decreasing rainfall amounts. They attribute the faster migration of the ITCZ to an increasing pressure gradient caused by the warming SSTs to the north in the Arabian Sea in JJA, and to the south near Madagascar in DJF. Others argue that an increasing east-west SST gradient in the western Pacific intensifies the Walker circulation over the Indian Ocean and enhances subsidence over East Africa [1,55,56], a finding that coincides with our SST correlation analysis with PC1 (Figure 6a). Other remote forcings have also been investigated as possible drivers of East African rainfall variability [57,58]. However, the two most dominant modes of climate variability proposed for East Africa are ENSO [12] and IOD [59,60], which appear to be the case for Tanzania as well.
Numerous studies show that ENSO affects rainfall variability over many parts of the world, including East Africa. Although maximum rainfall for East Africa occurs in MAM, interannual variability of East African rainfall is greater during the short rains period than the long rains period [36,61,62]. Rainfall distribution is also more spatially coherent throughout Tanzania in SON than MAM [36,63], particularly during the peak of the spring rainy season [64]. Spatial rainfall anomaly patterns in May differ from those in March and April, and spatial coherence is stronger for March than April [65]. These seasonal and intraseasonal contrasts are attributed to ENSO which is more intense in OND than MAM. East African rainfall anomalies in OND are positive during El Nino years and negative during La Nina years [14,66,67]. ENSO is either strongly positive or strongly negative in OND but shifts between positive and negative phases in MAM as it gets weaker towards the end of the event [68].
Adding to the above studies, our results show that the Indian Ocean SST also exerts a marked influence on Tanzania’s precipitation, especially on its long-term trend (Figure 6b). Although ENSO has some effect on climate variability in East Africa [12,69], this association is weak in Tanzania and demonstrates considerable spatial variability [60,67,70,71]. Atmospheric general circulation models (AGCM) indicate that Indian Ocean SSTs have a greater effect on the East African rainfall than SSTs in other oceans [72,73,74,75]. Various studies show that the interannual variability of short rains in East Africa is modulated by the IOD as it reaches its peak intensity in SON [76,77]. The increased rainfall during the short rains season is linked to positive IOD events when the western Indian Ocean is warmer than the eastern Indian Ocean [77,78]. This temperature contrast weakens the Walker circulation over the Indian Ocean and reduces subsidence over East Africa [59]. Precipitation is further enhanced by subsequent lowering of mean sea-level pressures over the western Indian Ocean, which allows westerly moisture fluxes from the Congo Basin to converge with easterly moisture fluxes from the Indian Ocean [78].
3.4. Projected change
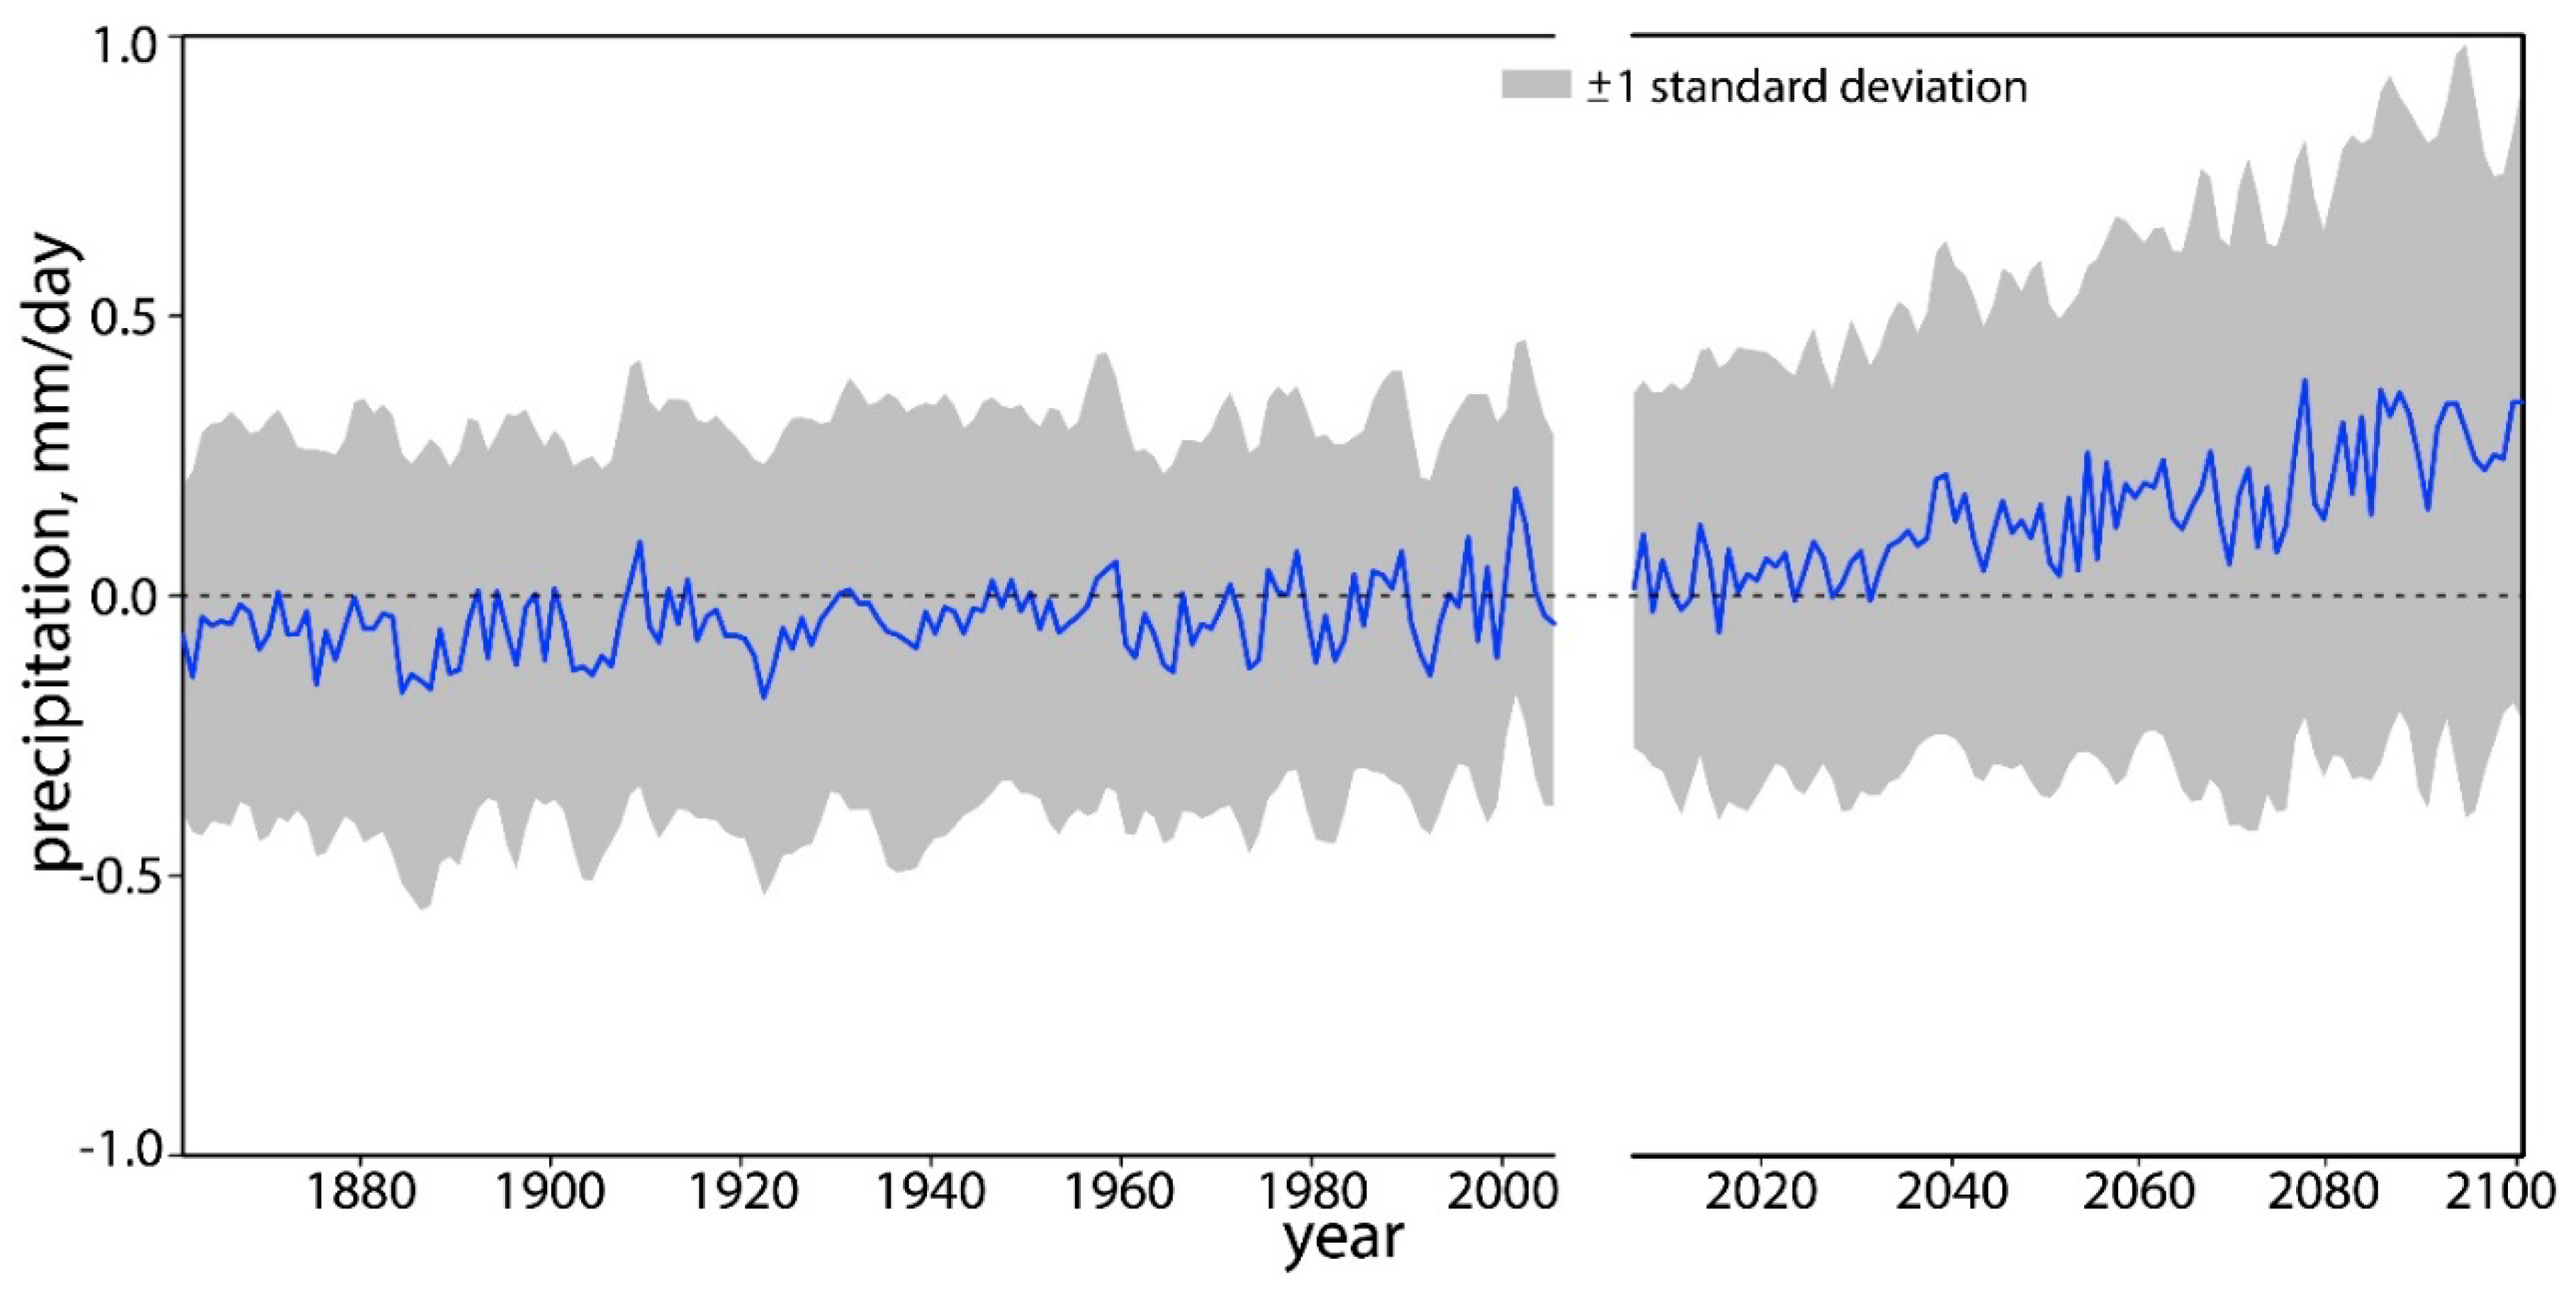
The historical precipitation trend for the entire domain of Tanzania shows a slightly increasing trend from 1860 to 2005 punctuated with short periods of decreasing rainfall (Figure 7). The projected precipitation trend for the same region shows a more significant increase in precipitation from 2005 to 2100 (Figure 7). This increasing trend is consistent with future projections from other studies that consider scenarios with maximum radiative forcings for rainfall projections in East Africa (e.g., [15]). With the global temperature rising, evaporation rates would increase and moisture is retained in the atmosphere over longer periods which can exacerbate drought [79]. Eventually, water in the saturated atmosphere condenses and produces heavy rainfall [80,81,82]. As the long-term response to anthropogenic warming from climate model projections is increasing rainfall for Tanzania, the recent decline in East African rainfall is likely a consequence of lower-frequency natural climate variability superimposed on anthropogenic global warming.
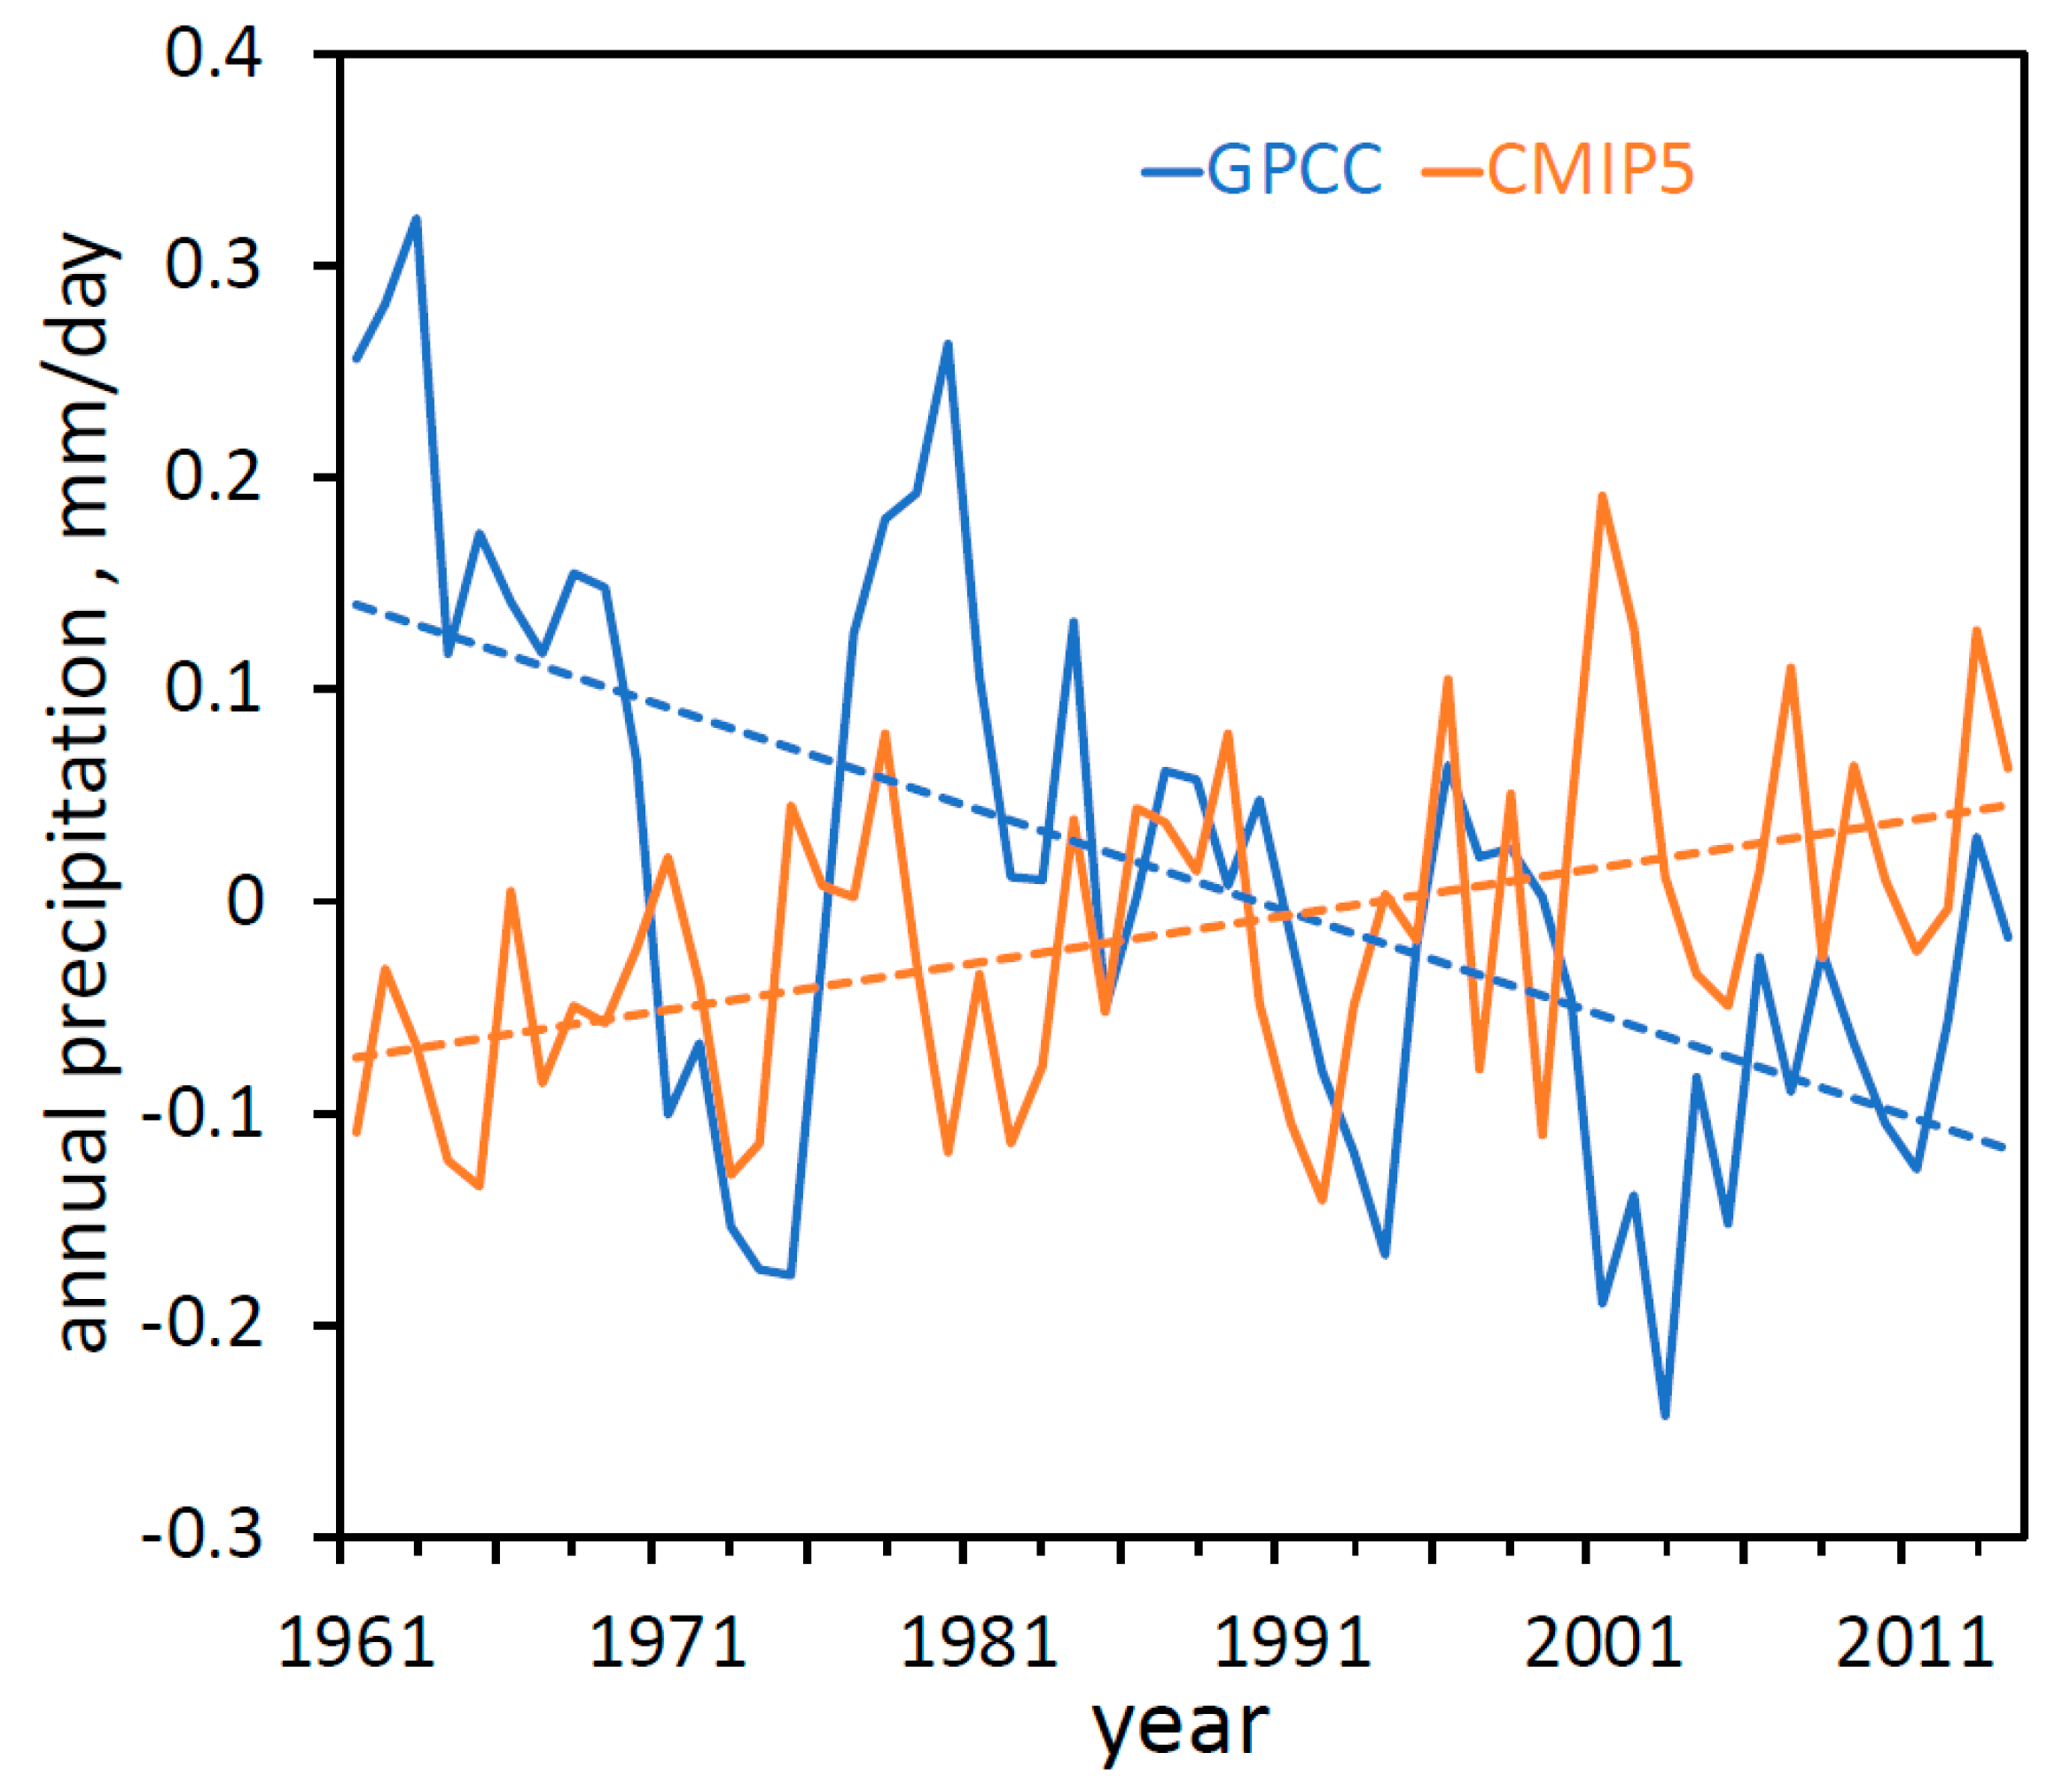
The observational data in this study vary from the climate model data in that they display opposite annual precipitation trends (Figure 8). GPCC data show a general decreasing trend while CMIP5 data show a general increasing trend (Figure 8). However, both datasets capture decadal variability and follow similar trends from 1980 to 2000 and to a lesser degree from 2004 to 2016 (Figure 8). Interactions between global warming and natural variability modes can affect regional precipitation trends [83]. Modes of variability are fluctuations in atmospheric and climate conditions that can occur at a range of time scales and exhibit different characteristics such as periodicity, gradual trends, sudden shifts, and positive vs. negative trends [84]. Instrumental records of climate variables include influences of both natural variability and anthropogenic forcings. Natural variability modes are reported to dampen the effects of anthropogenic warming by redistribution of heat in the climate system [85,86,87,88]. Our results indicate that the natural variability signals in the precipitation trend for Tanzania likely result from superimposition of IOD events and ENSO phases combined. However, with intensification of global warming and the water cycle, the influence of natural variability on the long-term precipitation variation can be overtaken by anthropogenic forcings [89,90].
The inconsistencies in the overall precipitation trend raise questions about the reliability of climate models for future projections. Although significant progress has been made to study extreme events, such events are characterized by the tail ends of probability distribution curves and involve higher-order statistics that are difficult to represent in climate models, especially at longer time scales [91]. Dominant sources of uncertainties in climate models depend on the variable of interest. The robustness of a prediction is indicated by the signal-to-noise ratio (S/N) which is higher for temperature than precipitation [92]. Parametric and structural uncertainties are also much larger for precipitation than temperature. Moreover, cloud and precipitation processes occur at scales too small for coarse resolution models to explicitly resolve [93,94,95]. Internal variability also affects the S/N for precipitation and is reported to account for most of the uncertainty in regional precipitation simulation [91,92]. Parametric and structural uncertainties resulting from the complexities of modeling precipitation can affect both the magnitude and direction of the projected change in precipitation [92]. These uncertainties are especially large in the tropics [91,96,97] where largest precipitation change is projected [98,99,100,101,102,103,104] and the S/N for precipitation is lowest [92], a case that is likely applicable to Tanzania. In short, biases and diverged internal variations in climate models could alternate the trend within the relatively short period (< 50 years).
4. Conclusions
As Tanzania becomes increasingly vulnerable to climate change, a scientific understanding of precipitation patterns across the country is critical to predict the evolution of its climate with ensuing global warming, and develop effective mitigation strategies against water-related natural hazards. In this study, we conducted a review while further examining the annual and seasonal climatology of Tanzania to understand past, present, and future precipitation trends and compared them with findings from other studies. The main conclusions derived from the literature review and our new analyses are as follows:
- Precipitation patterns in Tanzania are highly variable in both space and time, largely due to topographical variations, coastal influences, and presence of lakes.
- The average annual rainfall distribution is unimodal in southern and western to central Tanzania with one rainy season from November to May, and bimodal in northern and eastern Tanzania with two rainy seasons: the MAM long rains and the SON short rains.
- A general decreasing precipitation trend is observed in Tanzania since 1960, with the greatest decline in the MAM long rains season.
- A weak increasing precipitation trend for the SON short rains is observed in northwestern Tanzania around Lake Victoria, contradictory to the decreasing lake level.
- The IOD exerts a greater influence on Tanzania’s precipitation than other modes of climate variability including ENSO.
- Future projections show an increase in Tanzania’s rainfall in response to global warming; this trend contradicts the historical drying trend over East Africa.
- Observational data and climate model data show opposite precipitation trends for Tanzania, reflecting the challenges faced by climate models in the representation of natural variability.
For reliable projections of future climate in Tanzania, historical climate change and forced variability must be consistently simulated by climate models used by the IPCC. Future work should include other means of precipitation measurement derived from long satellite sources, different trend analyses methods, and varying time intervals (e.g., monthly, annual, decadal) to account for possible uncertainties.
Supplementary Materials
The following are available online at https://0-www-mdpi-com.brum.beds.ac.uk/2225-1154/8/2/34/s1, Figure S1: Map of Tanzania showing the number of stations and observations from 1961 to 2016, Figure S2: Graph showing the number of observations per year in Tanzania since 1891, Figure S3: MAM precipitation series from different datasets and their ensemble mean averaged over Tanzania.
Author Contributions
K.B. and B.P. conducted the analysis and wrote the paper; B.B. offered statistical analysis and helped with the discussion; L.D. provided comments and discussion; S.-Y.S.W. designed the project and contributed to the writing. All authors have read and agreed to the published version of the manuscript.
Funding
This research was jointly supported by the Utah Agricultural Experiment Station, Utah State University approved as journal paper number 9288, U.S. Dept. Energy grant number DE-SC0016605, National Natural Science Foundation of China (Grant No.41875071), “Yangfan” Talent Project of Guangdong Province (Grant No. 000001005), and Doctoral Fund of Guangdong Ocean University (Grant No. R17002).
Conflicts of Interest
The authors declare no conflict of interest.
References
- Liebmann, B.; Hoerling, M.P.; Funk, C.; Bladé, I.; Dole, R.M.; Allured, D.; Quan, X.; Pegion, P.; Eischeid, J.K. Understanding recent eastern Horn of Africa rainfall variability and change. J. Clim. 2014, 27, 8630–8645. [Google Scholar] [CrossRef]
- Lyon, B. Seasonal drought in the Greater Horn of Africa and its recent increase during the March-May long rains. J. Clim. 2014, 27, 7953–7975. [Google Scholar] [CrossRef]
- Hoell, A.; Hoerling, M.; Eischeid, J.K.; Quan, X.; Liebmann, B. Reconciling theories for human and natural attribution of recent East Africa drying. J. Clim. 2017, 30, 1939–1957. [Google Scholar] [CrossRef]
- Thompson, L.G. Climate change: The evidence and our options. Behav. Anal. 2010, 33, 153–170. [Google Scholar] [CrossRef] [PubMed]
- Awange, J.L.; Ogalo, L.; Bae, K.H.; Were, P.; Omondi, P.; Omute, P.; Omullo, M. Falling Lake Victoria water levels: Is climate a contributing factor? Clim. Chang. 2008, 89, 281–297. [Google Scholar] [CrossRef]
- Dube, K.; Nhamo, G. Climate variability, change and potential impacts on tourism: Evidence from the Zambian side of the Victoria Falls. Environ. Sci. Policy 2018, 84, 113–123. [Google Scholar] [CrossRef]
- Rowell, D.P.; Booth, B.B.; Nicholson, S.E.; Good, P. Reconciling Past and Future Rainfall Trends over East Africa. J. Clim. 2015, 28, 9768–9788. [Google Scholar] [CrossRef]
- Williams, A.P.; Funk, C. A westward extension of the warm pool leads to a westward extension of the Walker circulation, drying eastern Africa. Clim. Dyn. 2011, 37, 2417–2435. [Google Scholar] [CrossRef] [Green Version]
- Shongwe, M.E.; van Oldenborgh, G.J.; van den Hurk, B. Projected changes in mean and extreme precipitation in Africa under global warming. Part II: East Africa. J. Clim. 2011, 24, 3718–3733. [Google Scholar] [CrossRef] [Green Version]
- Mafuru, K.B.; Guirong, T. Assessing Prone Areas to Heavy Rainfall and the Impaction of the Upper Warm Temperature Anomaly during March–May Rainfall Season in Tanzania. Adv. Meteor. 2018, 2018, 17. [Google Scholar] [CrossRef] [Green Version]
- Camberlin, P.; Boyard-Micheau, J.; Philippon, N.; Baron, C.; Leclerc, C.; Mwongera, C. Climatic gradients along the windward slopes of Mount Kenya and their implication for crop risks. Part 1: Climate variability. Int. J. Climatol. 2014, 34, 2136–2152. [Google Scholar] [CrossRef]
- Indeje, M.; Semazzi, F.H.; Ogallo, L.J. ENSO signals in East African rainfall seasons. Int. J. Climatol. 2000, 20, 19–46. [Google Scholar] [CrossRef]
- Schreck, C.J., III; Semazzi, F.H.M. Variability of the recent climate of eastern Africa. Int. J. Climatol. 2004, 24, 681–701. [Google Scholar] [CrossRef]
- Kijazi, A.; Reason, C. Relationships between intraseasonal rainfall variability of coastal Tanzania and ENSO. Theor. Appl. Climatol. 2005, 82, 153–176. [Google Scholar] [CrossRef]
- Lyon, B.; Vigaud, N. Unraveling East Africa’s Climate Paradox. In Climate Extremes: Patterns and Mechanisms, 1st ed.; Wang, S.Y., Yoon, J.H., Funk, C., Gillies, R., Eds.; John Wiley & Sons Inc.: New York, NY, USA, 2017; Volume 16, pp. 265–281. [Google Scholar] [CrossRef]
- Endris, H.S.; Lennard, C.; Hewitson, B.; Dosio, A.; Nikulin, G.; Artan, G.A. Future changes in rainfall associated with ENSO, IOD and changes in the mean state over Eastern Africa. Clim. Dyn. 2019, 52, 2029–2053. [Google Scholar] [CrossRef] [Green Version]
- Schneider, U.; Becker, A.; Finger, P.; Meyer-Christoffer, A.; Rudolf, B.; Ziese, M. GPCC Full Data Reanalysis Version 6.0 at 0.5°: Monthly Land-Surface Precipitation from Rain-Gauges built on GTS-based and Historic Data. GPCC Data Rep. 2011, 10. [Google Scholar] [CrossRef]
- Meyer-Christoffer, A.; Becker, A.; Finger, P.; Schneider, U.; Ziese, M. GPCC Climatology Version 2018 at 0.25°: Monthly Land-Surface Precipitation Climatology for Every Month and the Total Year from Rain-Gauges built on GTS-based and Historical Data. GPCC Ger. 2018. [Google Scholar] [CrossRef]
- Rudolf, B.; Becker, A.; Schneider, U.; Meyer-Christoffer, A.; Ziese, M. New GPCC Full Data Reanalysis Version 5 Provides High-Quality Gridded Monthly Precipitation Data. GPCC Status Rep. 2011, 21, 1–7. [Google Scholar]
- Amante, C.; Eakins, B.W. ETOPO1 1 Arc-Minute Global Relief Model: Procedures, Data Sources and Analysis. In NOAA Technical Memorandum NESDIS NGDC-24; National Geophysical Data Center-NOAA: Boulder, CO, USA, 2009. [Google Scholar]
- National Center for Atmospheric Research Staff (Ed). Last modified 22 July 2013. The Climate Data Guide: Empirical Orthogonal Function (EOF) Analysis and Rotated EOF Analysis. Available online: https://climatedataguide.ucar.edu/climate-data-tools-and-analysis/empirical-orthogonal-function-eof-analysis-and-rotated-eof-analysis (accessed on 15 December 2019).
- Zhang, Z.; Moore, J.C. Mathematical and Physical Fundamentals of Climate Change, 1st ed.; Elsevier: Amsterdam, The Netherlands, 2015; pp. 161–197. [Google Scholar] [CrossRef]
- Attuabea, D.; Oduro, F.; Ansah, R. Empirical orthogonal function (EOF) analysis of precipitation over Ghana. Int. J. Stat. Adv. Theor. Appl. 2017, 1, 121–141. [Google Scholar]
- Philippon, N.; Doblas-Reyes, F.J.; Ruti, P.M. Skill, reproducibility and potential predictability of the West African monsoon in coupled GCMs. Clim. Dyn. 2010, 35, 53–74. [Google Scholar] [CrossRef]
- Huang, B.; Thorne, P.W.; Banzon, V.F.; Boyer, T.; Chepurin, G.; Lawrimore, J.H.; Menne, M.J.; Smith, T.M.; Vose, R.S.; Zhang, H.M. NOAA Extended Reconstructed Sea Surface Temperature (ERSST), Version 5. NOAA National Centers for Environmental Information 2017. Inf. NNCfE 2017. [Google Scholar]
- Kalnay, E.; Kanamitsu, M.; Kistler, R.; Collins, W.; Deaven, D.; Gandin, L.; Iredell, M.; Saha, S.; White, G.; Woollen, J.; et al. The NCEP/NCAR 40-Year Reanalysis Project. Bull. Amer. Meteor. Soc. 1996, 77, 437–472. [Google Scholar] [CrossRef] [Green Version]
- Bengtsson, L.; Hodges, K.I. Can an ensemble climate simulation be used to separate climate change signals from internal unforced variability? Clim. Dyn. 2019, 52, 3553–3573. [Google Scholar] [CrossRef] [Green Version]
- Eyring, V.; Bony, S.; Meehl, G.A.; Senior, C.A.; Stevens, B.; Stouffer, R.J.; Taylor, K.E. Overview of the Coupled Model Intercomparison Project Phase 6 (CMIP6) experimental design and organization. Geosci. Model Dev. 2016, 9, 1937–1958. [Google Scholar] [CrossRef] [Green Version]
- Meehl, G.; Boer, G.; Covey, C.; Latif, M.; Stouffer, R. The Coupled Model Intercomparison Project (CMIP). Bull. Amer. Meteorol. Soc. 2000, 81, 313–318. [Google Scholar] [CrossRef] [Green Version]
- Taylor, K.E.; Stouffer, R.J.; Meehl, G.A. An overview of CMIP5 and the experiment design. Bull. Am. Meteor. Soc. 2012, 93, 485–498. [Google Scholar] [CrossRef] [Green Version]
- Sillmann, J.; Kharin, V.V.; Zwiers, F.W.; Zhang, X.; Bronaugh, D. Climate extremes indices in the CMIP5 multi-model ensemble. Part 1: Model evaluation in the present climate. J. Geophys. Res. Atmos. 2013, 118, 1716–1733. [Google Scholar] [CrossRef]
- Sillmann, J.; Kharin, V.V.; Zwiers, F.W.; Zhang, X.; Bronaugh, D. Climate extremes indices in the CMIP5 multi-model ensemble. Part 2: Future climate projections. J. Geophys. Res. Atmos. 2013, 118, 2473–2493. [Google Scholar] [CrossRef]
- Moss, R.; Edmonds, J.; Hibbard, K.; Manning, M.; Rose, S.; Vuuren, D.; Carter, T.; Emori, S.; Kainuma, M.; Kram, T.; et al. The next generation of scenarios for climate change research and assessment. Nature 2010, 463, 747–756. [Google Scholar] [CrossRef]
- Freychet, N.; Hsu, H.H.; Chou, C.; Wu, C.H. Asian summer monsoon in CMIP5 projections: A link between the change in extreme precipitation and monsoon dynamics. J. Clim. 2015, 28, 1477–1493. [Google Scholar] [CrossRef]
- Duane, W.J.; Pepin, N.C.; Losleben, M.L.; Hardy, D.R. General Characteristics of Temperature and Humidity Variability on Kilimanjaro, Tanzania. Arct. Antarct. Alp. Res. 2008, 40, 323–334. [Google Scholar] [CrossRef]
- Nicholson, S.E. A review of climate dynamics and climate variability in eastern Africa. In The Limnology, Climatology, and Paleoclimatology of the East African Lakes; Johnson, T.C., Odada, E.O., Eds.; Gordon and Breach Publishers: Amsterdam, The Netherlands, 1996; pp. 25–56. [Google Scholar]
- Bryson, R.; Kuhn, P. Stress—Differential Induced Divergence with Application to Littoral Precipitation. Erdkunde 1961, 15, 287–294. [Google Scholar] [CrossRef]
- Nicholson, S.E. Climate and climatic variability of rainfall over eastern Africa. Rev. Geophys. 2017, 55, 590–635. [Google Scholar] [CrossRef] [Green Version]
- Flohn, H.; Fraedrich, K. Tagesperiodische zirkulation und niederschlagsverteilungam Victoria-See (Ostafrika) (the daily periodic circulation and distribution of rainfall over Lake Victoria, in German). Meteorologische Rundschau 1966, 19, 157–165. [Google Scholar]
- Yin, X.; Nicholson, S.E.; Ba, M.B. On the diurnal cycle of cloudiness over Lake Victoria and its influence on evaporation from the lake. Hydrolog. Sci. J. 2000, 45, 407–424. [Google Scholar] [CrossRef]
- Ba, M.B.; Nicholson, S.E. Analysis of Convective Activity and Its Relationship to the Rainfall over the Rift Valley Lakes of East Africa during 1983–90 Using the Meteosat Infrared Channel. J. Appl. Meteor. 1998, 37, 1250–1264. [Google Scholar] [CrossRef]
- Song, Y.; Semazzi, F.H.M.; Xie, L.; Ogallo, L.J. A coupled regional climate model for the Lake Victoria basin of East Africa. Int. J. Climatol. 2004, 24, 57–75. [Google Scholar] [CrossRef]
- Flohn, H.; Burkhardt, T. Nile Runoff at Aswan and Lake Victoria: A Case of a Discontinuous Climate Time Series. Z. Gletscherk. Glazialgeol. 1985, 21, 125–130. [Google Scholar]
- Thiery, W.; Davin, E.; Seneviratne, S.; Bedka, K.; Lhermitte, S.; van Lipzig, N.P.M. Hazardous thunderstorm intensification over Lake Victoria. Nat. Commun. 2016, 7, 12786. [Google Scholar] [CrossRef] [Green Version]
- Khavse, R.; Deshmukh, R.; Manikandan, N.; Chaudhary, J.L.; Kaushik, D. Statistical Analysis of Temperature and Rain fall Trend in Raipur District of Chhattisgarh. Curr. World Environ. 2015, 10, 305–312. [Google Scholar] [CrossRef] [Green Version]
- Kull, D. Connections between Recent Water Level Drops in Lake Victoria, Dam Operations and Drought. 2006. Available online: http://www.irn.org/programs/nile/pdf/060208vic.pdf (accessed on 20 December 2019).
- Verdin, J.; Funk, C.; Senay, G.; Choularton, R. Climate science and famine early warning. Philos. Trans. R. Soc. Lond. B. Biol. Sci. 2005, 360, 2155–2168. [Google Scholar] [CrossRef] [PubMed] [Green Version]
- Funk, C.C.; Dettinger, M.D.; Michaelsen, J.C.; Verdin, J.P.; Brown, M.E.; Barlow, M.; Hoell, A. Warming of the Indian Ocean threatens eastern and southern African food security but could be mitigated by agricultural development. Proc. Natl. Acad. Sci. USA 2008, 105, 11081–11086. [Google Scholar] [CrossRef] [PubMed] [Green Version]
- Lyon, B.; Dewitt, D.G. A recent and abrupt decline in the East African long rains. Geophys. Res. Lett. 2012, 39, L02702. [Google Scholar] [CrossRef] [Green Version]
- Yang, W.; Seager, R.; Cane, M.A.; Lyon, B. The East African long rains in observations and models. J. Clim. 2014, 27, 7185–7202. [Google Scholar] [CrossRef]
- Tierney, J.E.; Ummenhofer, C.C.; DeMenocal, P.B. Past and future rainfall in the horn of Africa. Sci. Adv. 2015, 1, e1500682. [Google Scholar] [CrossRef] [PubMed] [Green Version]
- Vellinga, M.; Milton, S.F. Drivers of interannual variability of the East African “Long Rains”. Q. J. R. Meteorol. Soc. 2018, 144, 861–876. [Google Scholar] [CrossRef]
- Mazzarella, A.; Giuliacci, A.; Liritzis, I. On the 60-month cycle of multivariate ENSO index. Theor. Appl. Climatol. 2010, 100, 23–27. [Google Scholar] [CrossRef]
- Wainwright, C.M.; Marsham, J.H.; Keane, R.J.; Rowell, D.P.; Finney, D.L.; Black, E.; Allan, R.P. ‘Eastern African Paradox’ rainfall decline due to shorter not less intense Long Rains. npj Clim. Atmos. Sci. 2019, 2, 9. [Google Scholar] [CrossRef]
- Liebmann, B.; Bladé, I.; Funk, C.; Allured, D.; Quan, X.; Hoerling, M.; Hoell, A.; Peterson, P.; Thiaw, W.M. Climatology and Interannual Variability of Boreal Spring Wet Season Precipitation in the Eastern Horn of Africa and Implications for Its Recent Decline. J. Clim. 2017, 30, 3867–3886. [Google Scholar] [CrossRef]
- Funk, C.; Hoell, A.; Shukla, S.; Bladé, I.; Liebmann, B.; Roberts, J.B.; Robertson, F.R.; Husak, G. Predicting East African spring droughts using Pacific and Indian Ocean sea surface temperature indices. Hydrol. Earth Syst. Sci. 2014, 18, 4965–4978. [Google Scholar] [CrossRef] [Green Version]
- Ogallo, L.J.; Okoola, R.E.; Wanjohi, D.N. Characteristics of Quasi-Biennial Oscillation over Kenya and their predictability potential for seasonal rainfall. MAUSAM. Q. J. Meteorol. Hydrol. Geophys. 1994, 45, 57–62. [Google Scholar]
- Pohl, B.; Camberlin, P. Influence of the Madden–Julian Oscillation on East African rainfall. I: Intraseasonal variability and regional dependency. Q. J. R. Meteorol. Soc. 2006, 132, 2521–2539. [Google Scholar] [CrossRef] [Green Version]
- Saji, N.H.; Goswami, B.N.; Vinayachandran, P.N.; Yamagata, T. A dipole mode in the tropical Indian Ocean. Nature 1999, 401, 360–363. [Google Scholar] [CrossRef] [PubMed]
- Webster, P.J.; Moore, A.M.; Loschnigg, J.P.; Leben, R.R. Coupled ocean-atmosphere dynamics in the Indian Ocean during 1997–98. Nature 1999, 401, 356–360. [Google Scholar] [CrossRef] [PubMed]
- Camberlin, P.; Wairoto, J. Intraseasonal wind anomalies related to wet and dry spells during the “long” and “short” rainy seasons in Kenya. Theor. Appl. Climatol. 1997, 58, 57–69. [Google Scholar] [CrossRef]
- Hastenrath, S.; Polzin, D.; Mutai, C. Circulation Mechanisms of Kenya Rainfall Anomalies. J. Clim. 2011, 24, 404–412. [Google Scholar] [CrossRef]
- Moron, V.; Robertson, A.W.; Ward, M.N.; Camberlin, P. Spatial coherence of tropical rainfall at the regional scale. J. Clim. 2007, 20, 5244–5263. [Google Scholar] [CrossRef] [Green Version]
- Camberlin, P.; Moron, V.; Okoola, R.E.; Philippon, N.; Gitau, W. Components of rainy seasons’ variability in equatorial East Africa: Onset, cessation, rainfall frequency and intensity. Theor. Appl. Climatol. 2009, 98, 237–249. [Google Scholar] [CrossRef] [Green Version]
- Camberlin, P.; Philippon, N. The East African March–May Rainy Season: Associated Atmospheric Dynamics and Predictability over the 1968–97 Period. J. Clim. 2002, 15, 1002–1019. [Google Scholar] [CrossRef]
- Ogallo, L.J. Relationships between seasonal rainfall in East Africa and the Southern Oscillation. J. Climatol. 1988, 8, 31–43. [Google Scholar] [CrossRef]
- Reason, C.J.C.; Allan, R.J.; Lindesay, J.A.; Ansell, T.J. ENSO and climatic signals across the Indian Ocean basin in the global context: Part I. Interannual composite patterns. Int. J. Climatol. 2000, 20, 1285–1327. [Google Scholar] [CrossRef]
- Nicholson, S.E.; Kim, J. The relationship of the El Niño–Southern Oscillation to African rainfall. Int. J. Climatol. 1997, 17, 117–135. [Google Scholar] [CrossRef]
- Mahongo, S.B.; Francis, J. Analysis of rainfall variations and trends in Coastal Tanzania. Western Indian Ocean. J. Mar. Sci. 2002, 11, 121–133. [Google Scholar]
- Hastenrath, S.; Nicklis, A.; Greischar, L. Atmospheric-hydrospheric mechanisms of climate anomalies in the western equatorial Indian Ocean. J. Geophys. Res. 1993, 98, 20219–20235. [Google Scholar] [CrossRef]
- Diro, G.T.; Grimes, D.I.F.; Black, E. Teleconnections between Ethiopian summer rainfall and sea surface temperature: Part I—Observation and modelling. Clim. Dyn. 2011, 37, 103–119. [Google Scholar] [CrossRef]
- Goddard, L.; Graham, N.E. Importance of the Indian Ocean for simulating rainfall anomalies over eastern and southern Africa. J. Geophys. Res. Atmos. 1999, 104, 19099–19116. [Google Scholar] [CrossRef] [Green Version]
- Latif, M.; Dommenget, D.; Dima, M.; Grötzner, A. The role of Indian Ocean sea surface temperature in forcing East African rainfall anomalies during December–January 1997/98. J. Clim. 1999, 12, 3497–3504. [Google Scholar] [CrossRef]
- Bahaga, T.K.; Tsidu, M.; Kucharski, G.F.; Diro, G.T. Potential predictability of the sea-surface temperature forced equatorial East African short rains interannual variability in the 20th century. Q. J. R. Meteorol. Soc. 2015, 141, 16–26. [Google Scholar] [CrossRef]
- Endris, H.S.; Lennard, C.; Hewitson, B.; Dosio, A.; Nikulin, G.; Nikulin, G.; Panitz, H.J. Teleconnection responses in multi-GCM driven CORDEX RCMs over Eastern Africa. Clim. Dyn. 2016, 46, 2821–2846. [Google Scholar] [CrossRef]
- Black, E.; Slingo, J.; Sperber, K.R. An Observational Study of the Relationship between Excessively Strong Short Rains in Coastal East Africa and Indian Ocean SST. Mon. Weather Rev. 2003, 131, 74–94. [Google Scholar] [CrossRef]
- Behera, S.K.; Luo, J.J.; Masson, S.; Delecluse, P.; Gualdi, S.; Navarra, A.; Yamagata, T. Paramount impact of the Indian Ocean dipole on the East African short rains: A CGCM study. J. Clim. 2005, 18, 4514–4530. [Google Scholar] [CrossRef] [Green Version]
- Ummenhofer, C.C.; Gupta, A.S.; England, M.H.; Reason, C.J. Contributions of Indian Ocean Sea Surface Temperatures to Enhanced East African Rainfall. J. Clim. 2009, 22, 993–1013. [Google Scholar] [CrossRef] [Green Version]
- Loaiciga, H.A.; Valdes, J.B.; Vogel, R.; Garvey, J.; Schwarz, H. Global warming and the hydrologic cycle. J. Hydrol. 1996, 174, 83–127. [Google Scholar] [CrossRef]
- Arnell, N.W.; Liu, C.; Compagnucci, R.; da Cunha, L.; Hanaki, K.; Howe, C.; Mailu, G.; Shiklomanov, I.; Stakhiv, E. Hydrology and water resources. In Climate Change 2001: Impacts, Adaptation and Vulnerability, 1st ed.; McCarthy, J.J., Canziani, O.F., Leary, N.A., Dokken, D.J., White, K.S., Eds.; Cambridge University Press: Cambridge, UK, 2001; pp. 191–233. [Google Scholar]
- Huntington, T.G. Evidence for intensification of the global water cycle: Review and synthesis. J. Hydrol. 2006, 319, 83–95. [Google Scholar] [CrossRef]
- Souverijns, N.; Thiery, W.; Demuzere, M.; van Lipzig, N.P.M. Drivers of future changes in East African precipitation. Environ. Res. Lett. 2016, 11, 114011. [Google Scholar] [CrossRef] [Green Version]
- Estrada, F.; Tol, R.S.; Botzen, W.J. Global economic impacts of climate variability and change during the 20th century. PLoS ONE 2017, 12, e0172201. [Google Scholar] [CrossRef]
- Terray, L.; Cassou, C. Modes of low-frequency climate variability and their relationships with land precipitation and surface temperature: Application to the Northern Hemisphere winter climate. Stoch. Environ. Res. Risk A 2000, 14, 339–369. [Google Scholar] [CrossRef]
- Meehl, G.A.; Arblaster, J.M.; Fasullo, J.T.; Hu, A.; Trenberth, K.E. Model-based evidence of deep-ocean heat uptake during surface-temperature hiatus periods. Nat. Clim. Chang. 2011, 1, 360–364. [Google Scholar] [CrossRef]
- Meehl, G.A.; Hu, A.; Arblaster, J.M.; Fasullo, J.T.; Trenberth, K.E. Externally forced and internally generated decadal climate variability associated with the Interdecadal Pacific Oscillation. J. Clim. 2013, 26, 7298–7310. [Google Scholar] [CrossRef]
- Trenberth, K.E.; Fasullo, J.T. An apparent hiatus in global warming? Earth’s Future 2013, 1, 19–32. [Google Scholar] [CrossRef]
- Tollefson, J. The case of the missing heat. Nature 2014, 505, 276–278. [Google Scholar] [CrossRef] [PubMed] [Green Version]
- Schmidt, G.A.; Shindell, D.; Tsigaridis, K. Reconciling warming trends. Nat. Geosci. 2014, 7, 158–160. [Google Scholar] [CrossRef]
- Watanabe, M.; Shiogama, H.; Tatebe, H.; Hayashi, M.; Ishii, M.; Kimoto, M. Contribution of natural decadal variability to global warming acceleration and hiatus. Nat. Clim. Chang. 2014, 4, 893–897. [Google Scholar] [CrossRef]
- Flato, G.; Marotzke, J.; Abiodun, B.; Braconnot, P.; Chou, S.C.; Collins, W.; Cox, P.; Driouech, F.; Emori, S.; Eyring, V.; et al. Evaluation of Climate Models. In Climate Change 2013: The Physical Science Basis. Contribution of Working Group I to the Fifth Assessment Report of the Intergovernmental Panel on Climate Change, 1st ed.; Stocker, T.F., Qin, D., Plattner, G.K., Tignor, M., Allen, S.K., Boschung, J., Nauels, A., Xia, Y., Bex, V., Midgley, P.M., Eds.; Cambridge University Press: Cambridge, UK; New York, NY, USA, 2013; pp. 741–866. [Google Scholar]
- Hawkins, E.; Sutton, R. The potential to narrow uncertainty in projections of regional precipitation change. Clim. Dyn. 2011, 37, 407–418. [Google Scholar] [CrossRef]
- Johnson, J.S.; Cui, Z.; Lee, L.A.; Gosling, J.P.; Blyth, A.M.; Carslaw, K.S. Evaluating uncertainty in convective cloud microphysics using statistical emulation. J. Adv. Model. Earth Syst. 2015, 7, 162–187. [Google Scholar] [CrossRef]
- Payne, M.R.; Barange, M.; Cheung, W.W.L.; MacKenzie, B.R.; Batchelder, H.P.; Cormon, X.; Eddy, T.D.; Fernandes, J.A.; Hollowed, A.B.; Jones, M.C.; et al. Uncertainties in projecting climate-change impacts in marine ecosystems. ICES J. Mar. Sci. 2016, 73, 1272–1282. [Google Scholar] [CrossRef]
- Hayhoe, K.; Edmonds, J.; Kopp, R.E.; LeGrande, A.N.; Sanderson, B.M.; Wehner, M.F.; Wuebbles, D.J. Climate models, scenarios, and projections. In Climate Science Special Report: Fourth National Climate Assessment, 1st ed.; Wuebbles, D.J., Fahey, D.W., Hibbard, K.A., Dokken, D.J., Stewart, B.C., Maycock, T.K., Eds.; U.S. Global Change Research Program: Washington, DC, USA, 2017; Volume I, pp. 133–160. [Google Scholar] [CrossRef]
- Kharin, V.V.; Zwiers, F.W.; Zhang, X.B.; Hegerl, G.C. Changes in temperature and precipitation extremes in the IPCC ensemble of global coupled model simulations. J. Clim. 2007, 20, 1419–1444. [Google Scholar] [CrossRef] [Green Version]
- Kharin, V.V.; Zwiers, F.W.; Zhang, X.B.; Wehner, M. Changes in temperature and precipitation extremes in the CMIP5 ensemble. Clim. Chang. 2013, 119, 345–357. [Google Scholar] [CrossRef]
- Chen, C.T.; Knutson, T. On the verification and comparison of extreme rainfall indices from climate models. J. Clim. 2008, 21, 1605–1621. [Google Scholar] [CrossRef]
- Chou, C.; Neelin, J.D. Mechanisms of Global Warming Impacts on Regional Tropical Precipitation. J. Clim. 2004, 17, 2688–2701. [Google Scholar] [CrossRef] [Green Version]
- Giannini, A.; Biasutti, M.; Held, I.M.; Sobel, A.H. A global perspective on African climate. Clim. Chang. 2008, 90, 359–383. [Google Scholar] [CrossRef]
- Allan, R.P.; Soden, B.J.; John, V.O.; Ingram, W.; Good, P. Current chances in tropical precipitation. Environ. Res. Lett. 2010, 5, 25205. [Google Scholar] [CrossRef] [Green Version]
- Xie, S.; Deser, C.; Vecchi, G.A.; Ma, J.; Teng, H.; Wittenberg, A.T. Global Warming Pattern Formation: Sea Surface Temperature and Rainfall. J. Clim. 2010, 23, 966–986. [Google Scholar] [CrossRef]
- Mizuta, R.; Yoshimura, H.; Murakami, H.; Matsueda, M.; Endo, H.; Ose, T.; Kamiguchi, K.; Hosaka, M.; Sugi, M.; Yukimoto, S.; et al. Climate simulations using MRI-AGCM3.2 with 20-km grid. J. Meteorol. Soc. Jpn. 2012, 90A, 233–258. [Google Scholar] [CrossRef] [Green Version]
- James, R.; Washington, R. Changes in African temperature and precipitation associated with degrees of global warming. Clim. Chang. 2013, 117, 859–872. [Google Scholar] [CrossRef]
Figure 1.
Shaded relief (m) maps of (a) Africa and (b) Tanzania from ETOPO1. (c) 10-day running mean (1981–2010) precipitation (mm) for Tanzania (0–15S, 30–40E) (shaded in blue), and 850-hPa temperature (°C, orange curve). The 850-hPa temperature data are taken from the Reanalysis 1 (R1) data archive.

Figure 2.
Annual and seasonal precipitation climatology calculated from 1961–2016 Global Precipitation Climatology Centre (GPCC) precipitation data. (a) Annual precipitation, (b) Dec–Feb summer precipitation, (c) Mar–May fall precipitation, (d) Jun–Aug winter precipitation, and (e) Sep–Nov spring precipitation. Precipitation is in mm.

Figure 3.
Annual and seasonal 850-hPa winds (vectors) and relative humidity (shaded) climatology calculated from 1979–2016 Reanalysis 1 (R1) data. (a) Annual patterns, (b) Dec–Feb summer patterns, (c) Mar–May fall patterns, (d) Jun–Aug winter patterns, and (e) Sep–Nov spring patterns. Winds are in m/s. Relative humidity is expressed as percent.

Figure 4.
Annual precipitation trend (slope*total number of years) in Tanzania calculated from 1961–2016 Global Precipitation Climatology Centre (GPCC) observations. Precipitation trend are plotted during different season with (a) annual precipitation trend, (b) Dec–Feb precipitation trend, (c) Mar–May precipitation trend, (d) Jun–Aug precipitation trend, and (e) Sep–Nov precipitation trend. Hatched areas indicate significant values with confidence level > 90%. Precipitation is in mm.

Figure 5.
(a–d) First four modes of empirical orthogonal function (EOF) of annual precipitation over Tanzania and with their respective (e–h) principal components. Precipitation data are from Global Precipitation Climatology Centre (GPCC) for the period of 1961–2016. Precipitation is in mm.
Figure 5.
(a–d) First four modes of empirical orthogonal function (EOF) of annual precipitation over Tanzania and with their respective (e–h) principal components. Precipitation data are from Global Precipitation Climatology Centre (GPCC) for the period of 1961–2016. Precipitation is in mm.

Figure 6.
Temporal correlation of annual precipitation principal component (PC) to annual sea surface temperature (SST) for the 1961–2016 period. Both variables are detrended. (a) PC1 correlation with SST, (b) PC2 correlation with SST, (c) PC3 correlation with SST, and (d) PC4 correlation with SST. Hatched areas indicate significant values with confidence level > 95%.

Figure 7.
Annual average Coupled Model Intercomparison Project (CMIP) precipitation over Tanzania (2–12S, 30–40E) from CMIP5 simulation. Data from all 44 members are considered to calculate the average precipitation (blue line) and shaded area shows the ± 1 standard deviation calculated from all members. Anomalies in mm/day are calculated based on the average value from 1971–2000.

Figure 8.
Annual precipitation over Tanzania for the 1961–2014 period from observations (orange line: Global Precipitation Climatology Centre (GPCC) 5-year running average) and from climate model (blue line: Coupled Model Intercomparison Project 5 (CMIP5) 44 ensembles average). Dashed lines show the trend of precipitation during that period. Both datasets show significant trend (95% confidence level) however observations show decreasing precipitation trend while climate model show increasing trend. Both datasets capture the decadal variability and show better agreement for the later period ( ̴ after 1980). Anomalies in mm/day are calculated based on the average value from 1971–2000.

© 2020 by the authors. Licensee MDPI, Basel, Switzerland. This article is an open access article distributed under the terms and conditions of the Creative Commons Attribution (CC BY) license (http://creativecommons.org/licenses/by/4.0/).
Share and Cite
MDPI and ACS Style
Borhara, K.; Pokharel, B.; Bean, B.; Deng, L.; Wang, S.-Y.S. On Tanzania’s Precipitation Climatology, Variability, and Future Projection. Climate 2020, 8, 34. https://0-doi-org.brum.beds.ac.uk/10.3390/cli8020034
AMA Style
Borhara K, Pokharel B, Bean B, Deng L, Wang S-YS. On Tanzania’s Precipitation Climatology, Variability, and Future Projection. Climate. 2020; 8(2):34. https://0-doi-org.brum.beds.ac.uk/10.3390/cli8020034
Chicago/Turabian StyleBorhara, Krishna, Binod Pokharel, Brennan Bean, Liping Deng, and S.-Y. Simon Wang. 2020. "On Tanzania’s Precipitation Climatology, Variability, and Future Projection" Climate 8, no. 2: 34. https://0-doi-org.brum.beds.ac.uk/10.3390/cli8020034
Note that from the first issue of 2016, this journal uses article numbers instead of page numbers. See further details here.