
Exceedance and Return Period of High Temperature in the African Region


Mathematics Department, New Jersey City University, Jersey City, NJ 07305, USA
Climate 2021, 9(4), 53; https://0-doi-org.brum.beds.ac.uk/10.3390/cli9040053
Submission received: 25 January 2021
/
Revised: 14 March 2021
/
Accepted: 15 March 2021
/
Published: 31 March 2021
(This article belongs to the Special Issue Climate and Weather Extremes)
Abstract
:Several studies have indicated that the social, economic and other impacts of global warming can be linked with changes in the frequency and intensity of extreme weather/climate events. Developing countries, particularly in the African region, are highly affected by extreme events such as high temperature, usually followed/accompanied by drought. Therefore, studying the probability of occurrence and return period of extreme temperatures, and possible change in these parameters, is of high importance for climate-related policy making and preparedness works in the region. This study aims to address these issues by assessing probability of exceedance and return period of extremes in annual maximum and annual mean temperatures. The analyses of historical data in this study showed that extremes in both annual maximum and mean temperature are highly likely to be exceeded more often in the future compared to the past. For the extreme event marker (threshold) defined in this study, probability of 3 exceedances in the following 19 years (for instance), at any gridpoint, is estimated to be at least 10% for extremes in annual maxima and at least 15% for those in annual means. Most places in the region, however, have much higher (up to 20%) probability of exceedance. The estimated probability of exceedance has shown increasing tendency with time. Return period, based on the most recent data, of extremes in annual maximum temperature is found to be less than 6.5 years at about 48% of the gridpoints in the region. Similarly, return period of extremes in annual mean temperature is estimated to be less than 5.5 years at about 82% of places in the region. These estimates have also shown a strong tendency of getting shorter as time goes on. On average, extremes in annual mean temperature were found to have shorter return periods (4–7 years) compared to those in annual maximum temperature (6–10 years), at 95% confidence. The empirical results presented in this study are generally in agreement with IPCC’s projections of increased warming trend. This data-driven, robust method is used in the present study and the results can also be considered as an alternative approach for detecting changes in climate via estimating and assessing possible changes in frequency of extreme events with time.
1. Introduction
Climate extreme is the occurrence of a value of a weather or climate variable above (or below) a threshold value near the upper (or lower) ends of the range of observed values of the variable [1] (p. 5). Commonly, an event is considered “rare” if it falls in the 10th or 90th percentile of the observed probability density function [2,3] and [4] (p. 275).
Several studies (e.g., [5,6,7,8,9,10]) have indicated that the social and economic costs associated with global warming could be measured in terms of changes in the frequency and intensity of extreme events. Relatively, the burden of such cost is heavier on the developing countries, as they do not have strong capacity for climate change adaptation. Therefore, developing countries are more vulnerable to extremes of normal climatic variability, since climate change is likely to increase the frequency and magnitude of some extreme weather events and disasters [11,12,13] and [14] (chap. 22).
IPCC [15] (pp. 7–73) projected, with medium to high confidence, that climate-related extreme events have multidimensional impacts globally, and on the African region in particular. These include: increases in droughts, floods, stress on water resources, food security, human health, and infrastructure; and sea level rise that would in turn affect coastal settlements and the like. Evidence-based planning and preparedness can minimize damages caused by such events. Among such evidences are identifying quantified estimates of probability of occurrence and quantifying the average length of time takes for such events to happen again. Therefore, it would be of high importance to assess likelihoods of the occurrence of extreme climate events and their return periods using data-driven robust methods that we used in this study. This, in turn, can support preparedness for and to improve the management strategies of risks associated with such extreme events.
Extreme temperature is one of the most common climate-related challenges in the African region. Most of the studies on extreme temperatures are based on daily maxima and minimums (e.g., [2,16,17,18,19,20]). However, extremes can occur/exist at any timescale depending on its use. Studying monthly, seasonal and annual extremes in temperature would be helpful, particularly for agrarian regions like the African region. In addition to extremes in annual maximum temperature, we also consider extremes in annual mean temperatures in this study, since they have longer duration covering the periods of seed preparation and crop growing seasons. Quantitative study of reoccurrence of such events can support informed planning. Therefore, the aim in this study is to assess exceedance chances and return periods of extremes in annual maxima of monthly maximum temperatures (hereafter annual maxima) and annual mean temperatures, and also to examine if there is change in frequency of such extremes with time over this region. That is, the main objective of this paper is to study exceedance probability and return period (and changes therein with time) of extremes using robust data-driven methods which do not heavily depend on geophysical assumptions. Thus, detailed physical/climatological interpretation of the results is not the intention of this study.
To address these objectives, data analyses were carried-out using training data at different time segments, long enough to minimize estimation errors caused by small sample size. In the following sections, we present methods and data used in this study (Section 2), results and discussion (Section 3), and summary of the study (Section 4).
2. Data and Methods
2.1. The Data
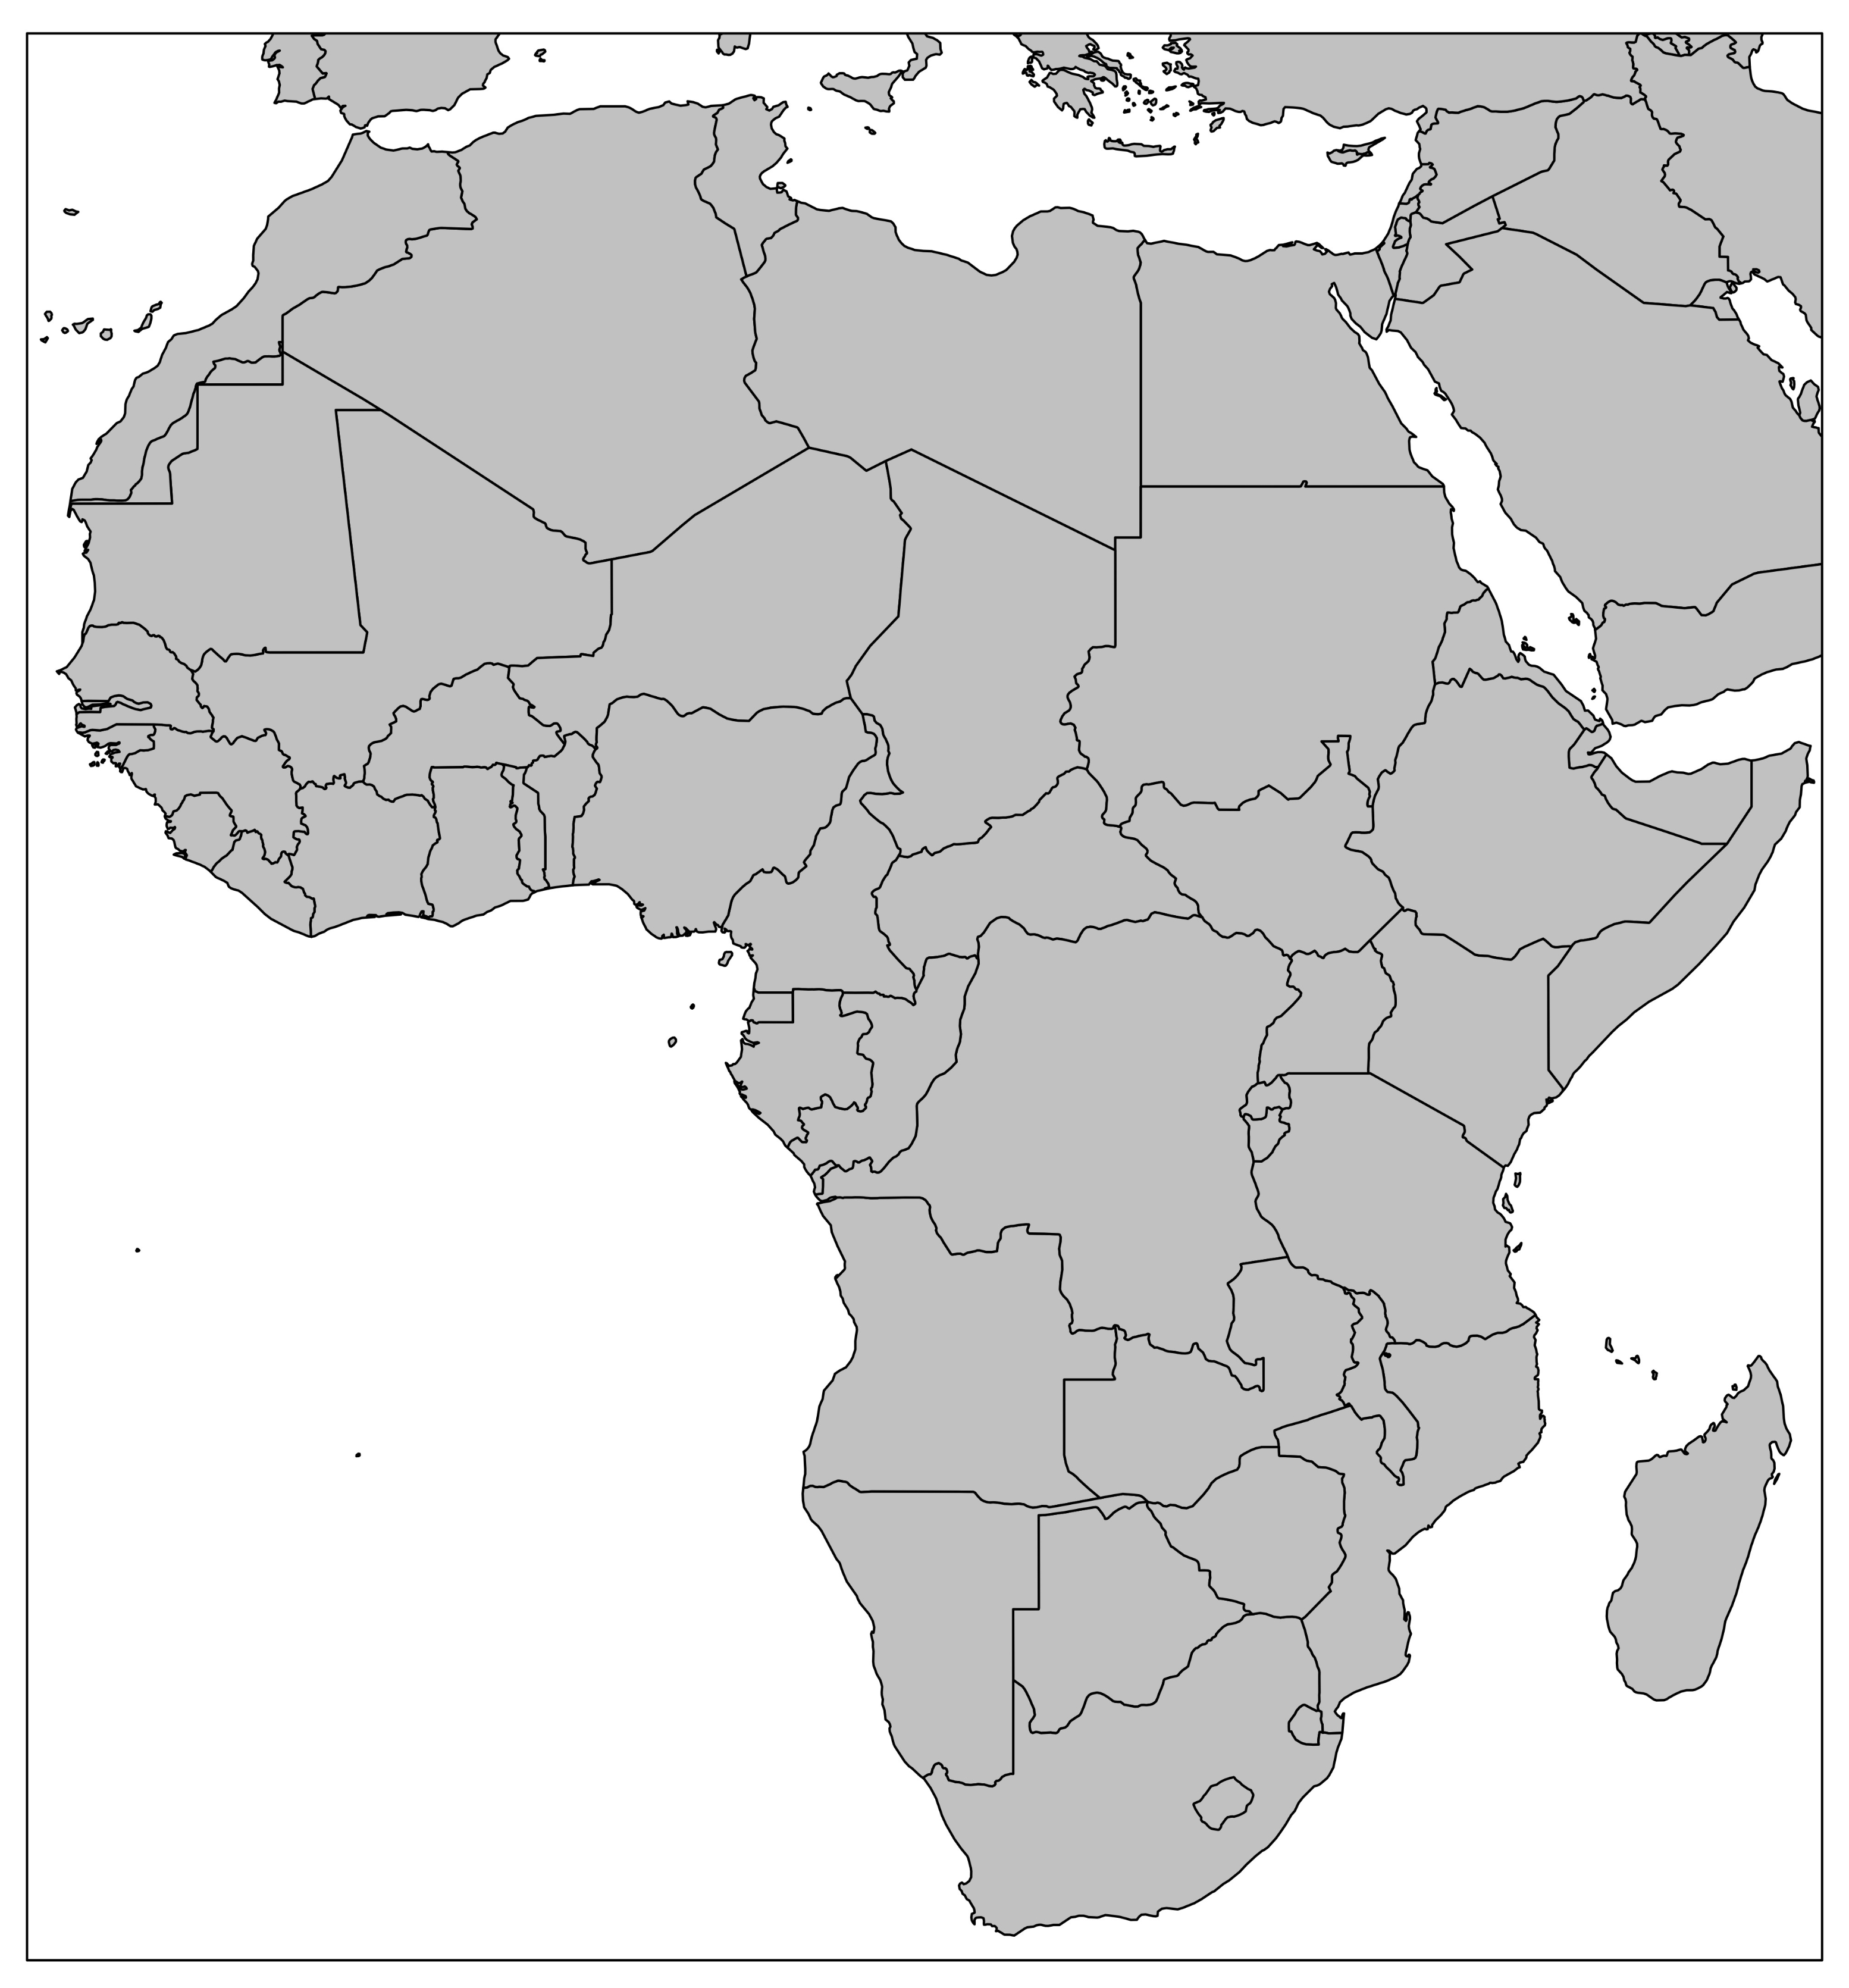
Two variables, namely the monthly maximum temperature and monthly mean temperature, from dataset produced by Climate Research Unit (CRU) at the University of East Anglia [21], version 4.04, were used in this study. This dataset has 0.5 degree spatial resolution, covering the period of 1901–2019. The data for African region are extracted from this global dataset. With the aim of exhaustively including all places within the African continent, data used in this study covers the land areas across 17.75° W–52.25° E and 40.25° S–40.25° N. This may include few parts of southern Europe and Middle East, as shown in the map of the study area (see Figure 1). That is why the title of, and results in, this article refer to the “African region” instead of the African continent.
Annual maximum and annual mean temperature time series are then obtained/ calculated from the original monthly data. This is done by (i) selecting a month with highest monthly maxima for each year to obtain the time series of annual maxima (TS), and (ii) computing mean of monthly means over 12 months to obtain the time series of annual means (TS).
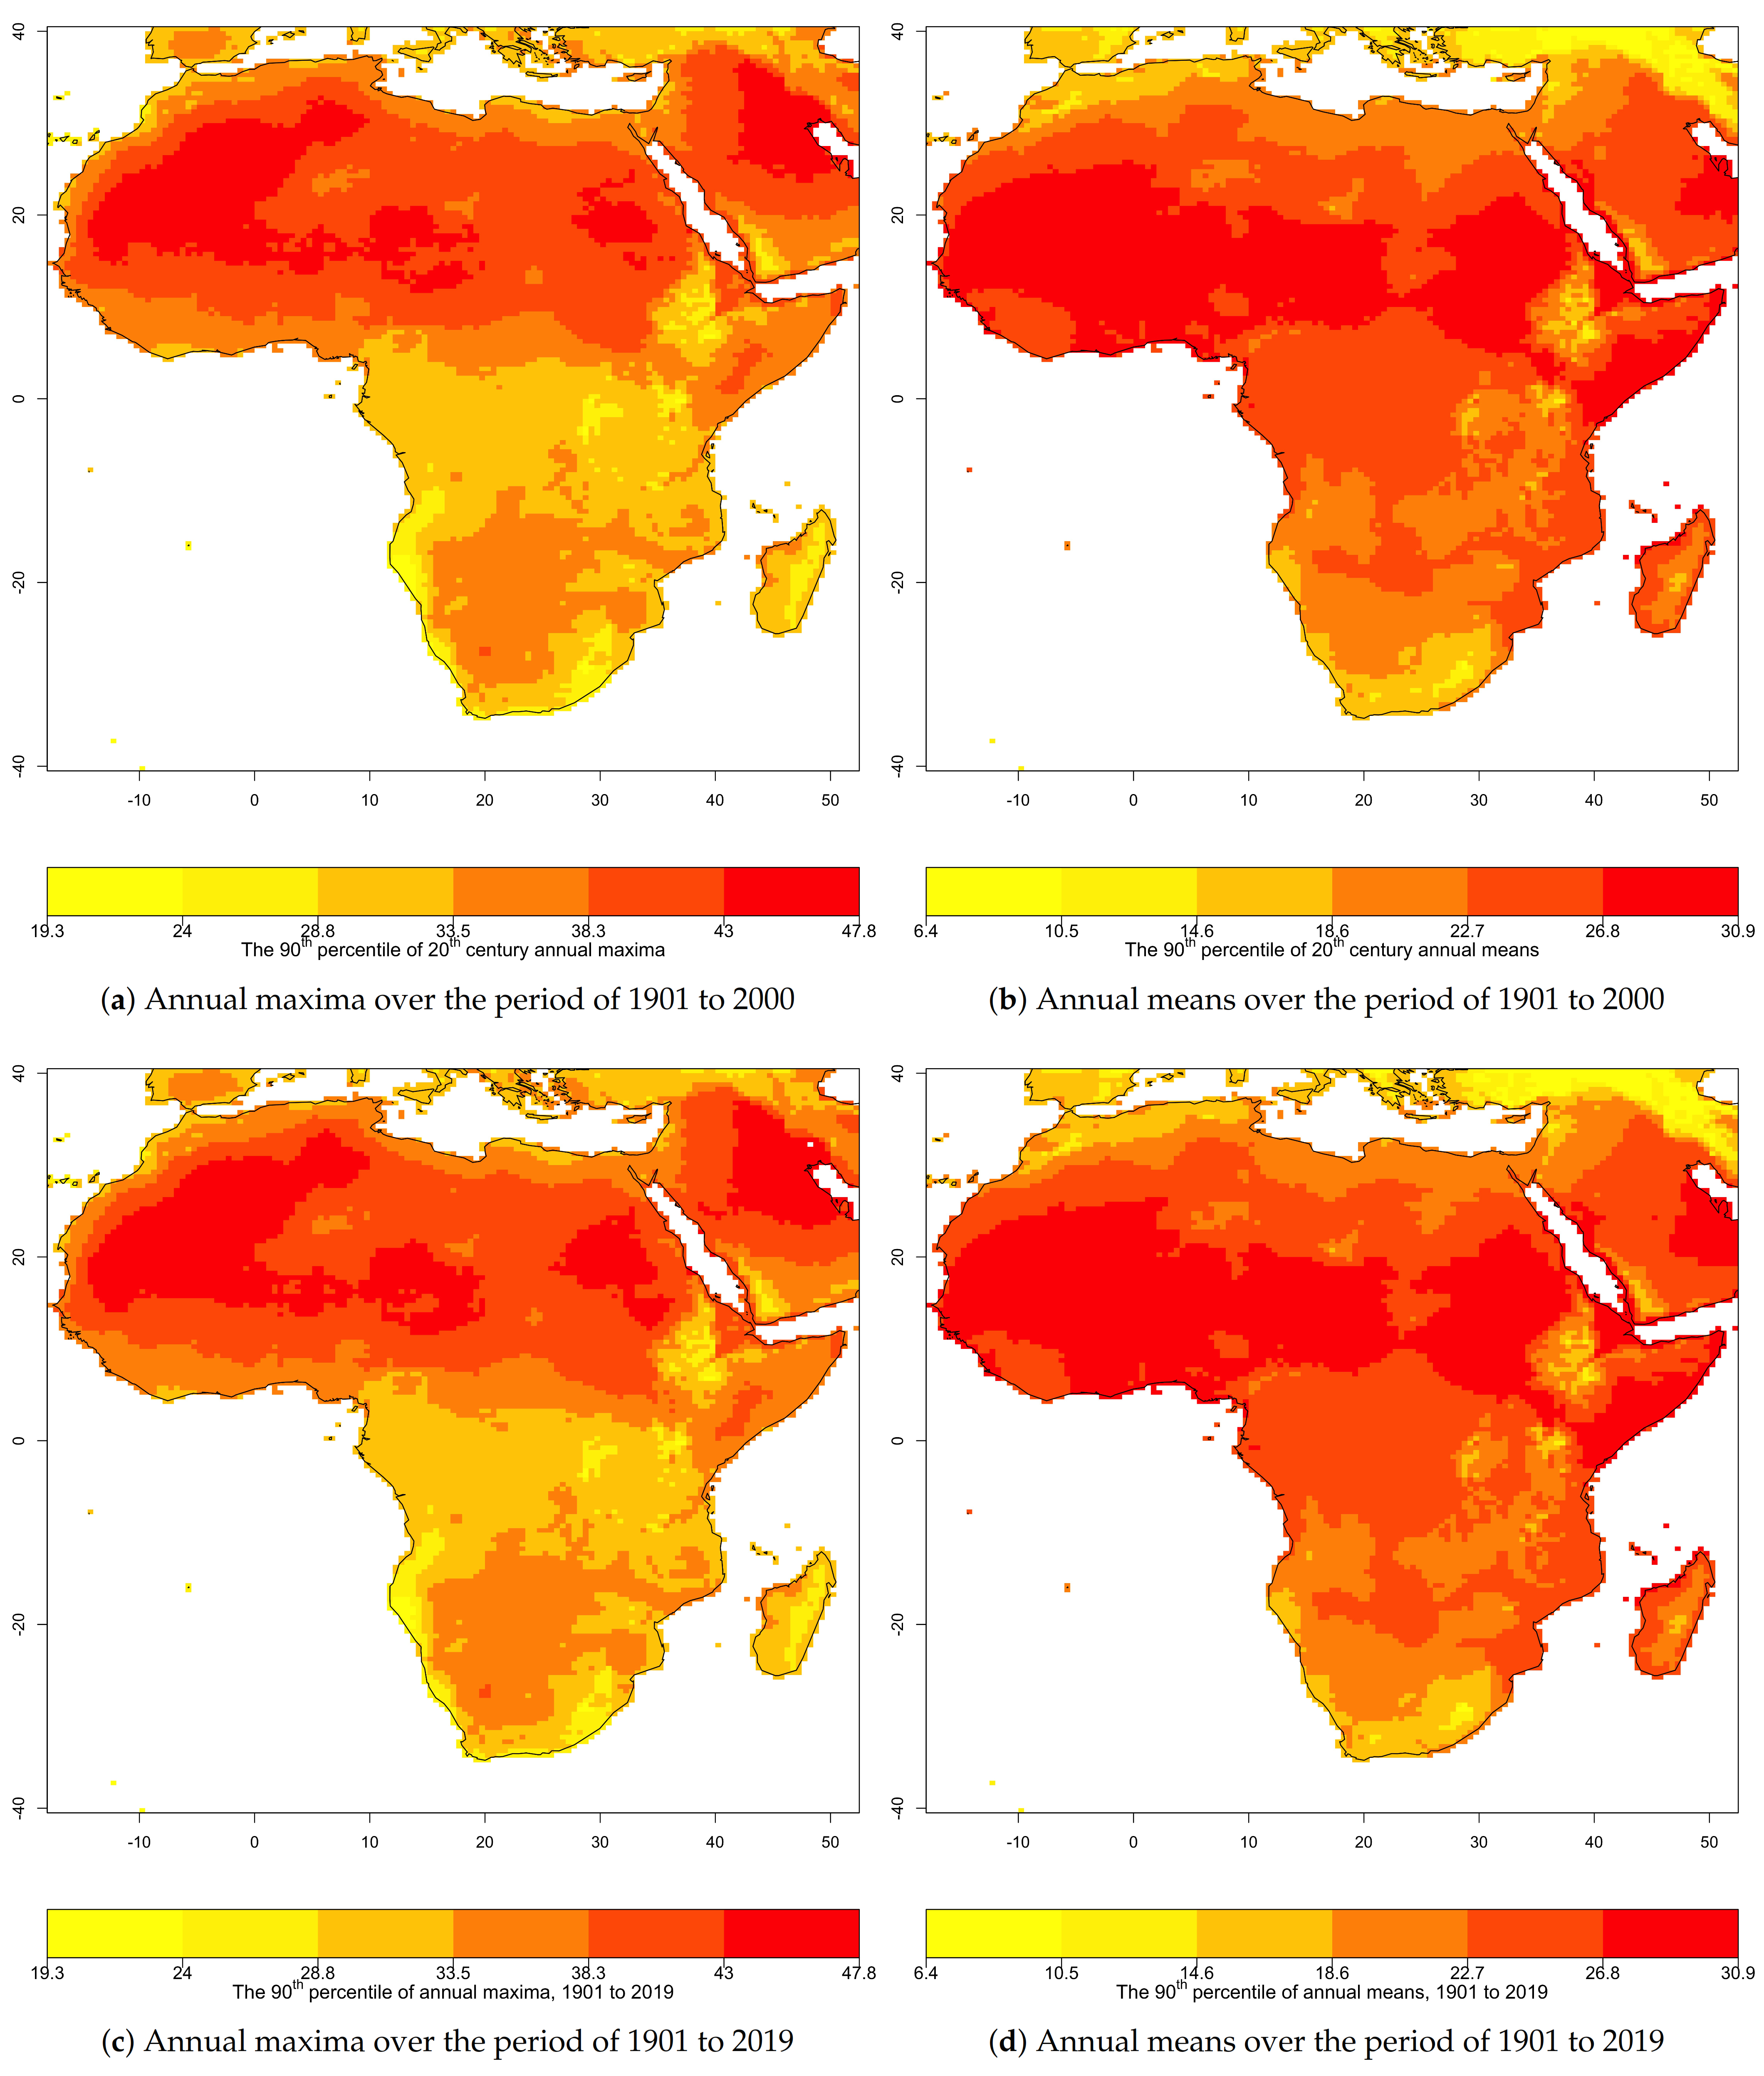
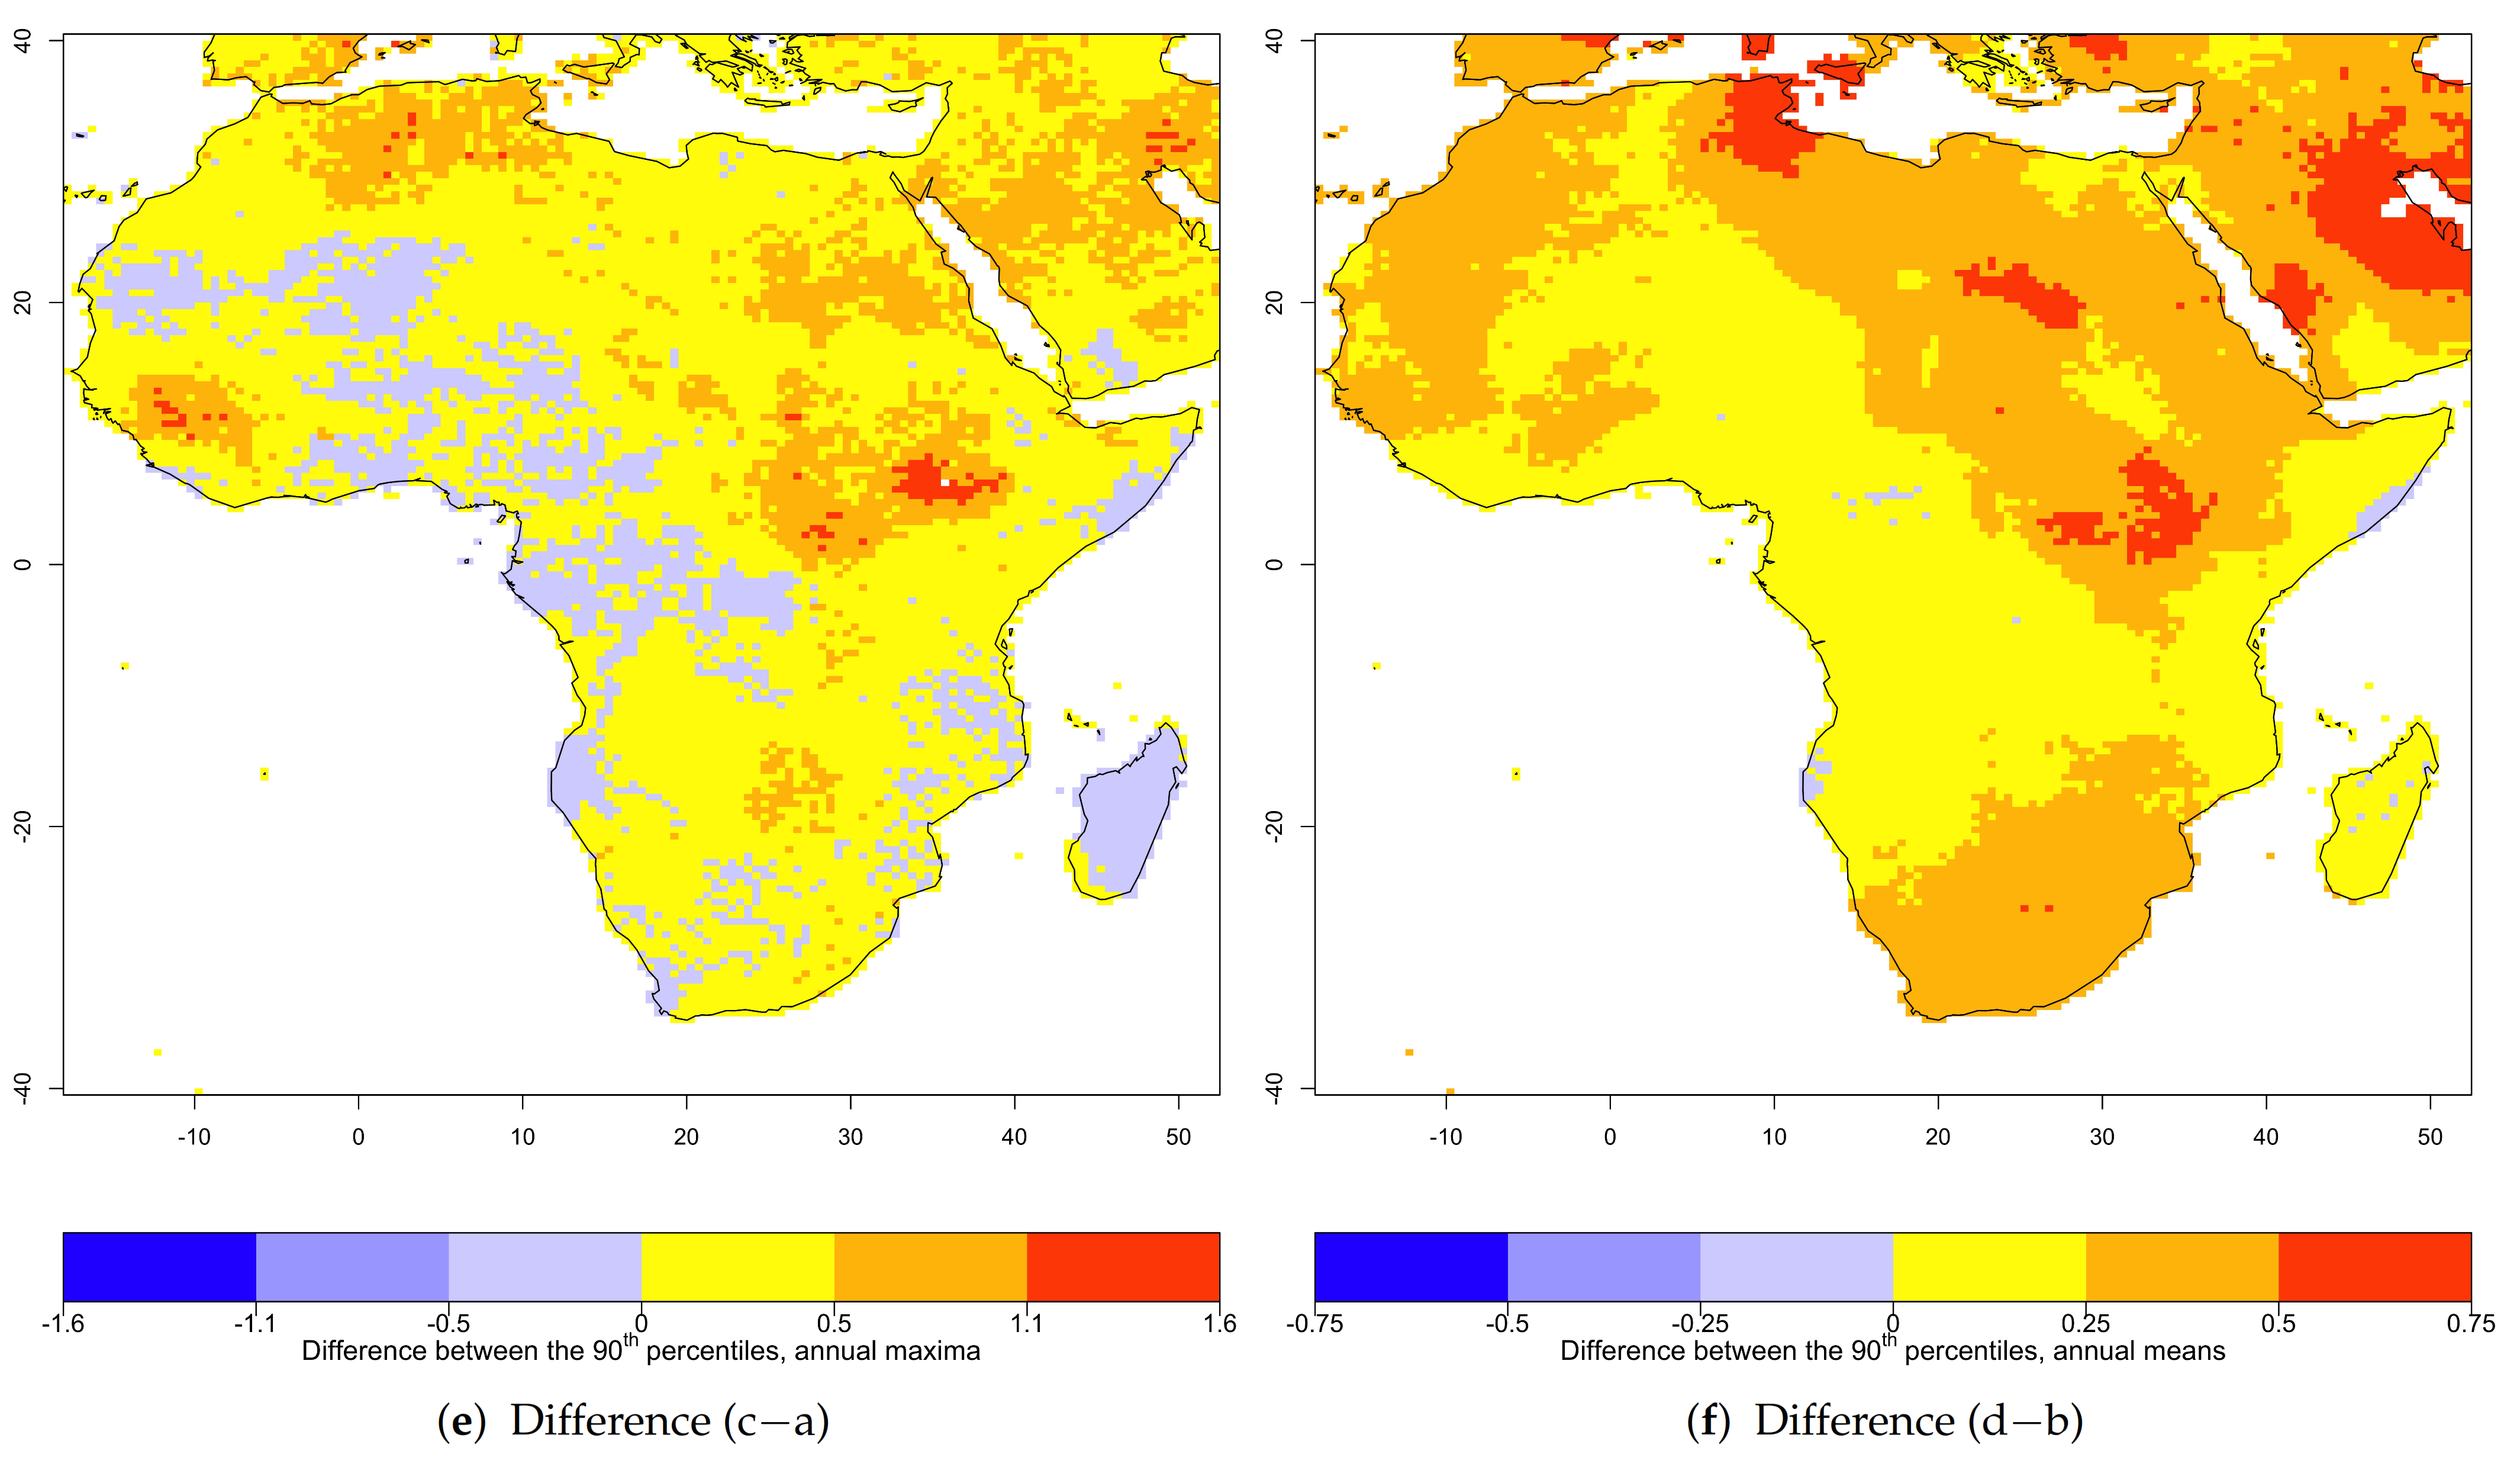
In this study, extreme event marker/threshold is the 90th percentile of the respective training data distribution. The 90th percentile of distribution is selected because a percentile smaller than 10 (and/or larger than 90) is commonly recommended for defining an extreme event [2,3]. The thresholds in each time series are determined separately for each gridpont. With the objective of assessing changes in exceedance probability with time, we consider two thresholds, namely the 90th percentile of data for 1901–2000 and the 90th percentile of data for 1901–2019 for both time series considered in this study (annual maxima and annual means). These thresholds are shown in Figure 2a–d for each gridpoint.
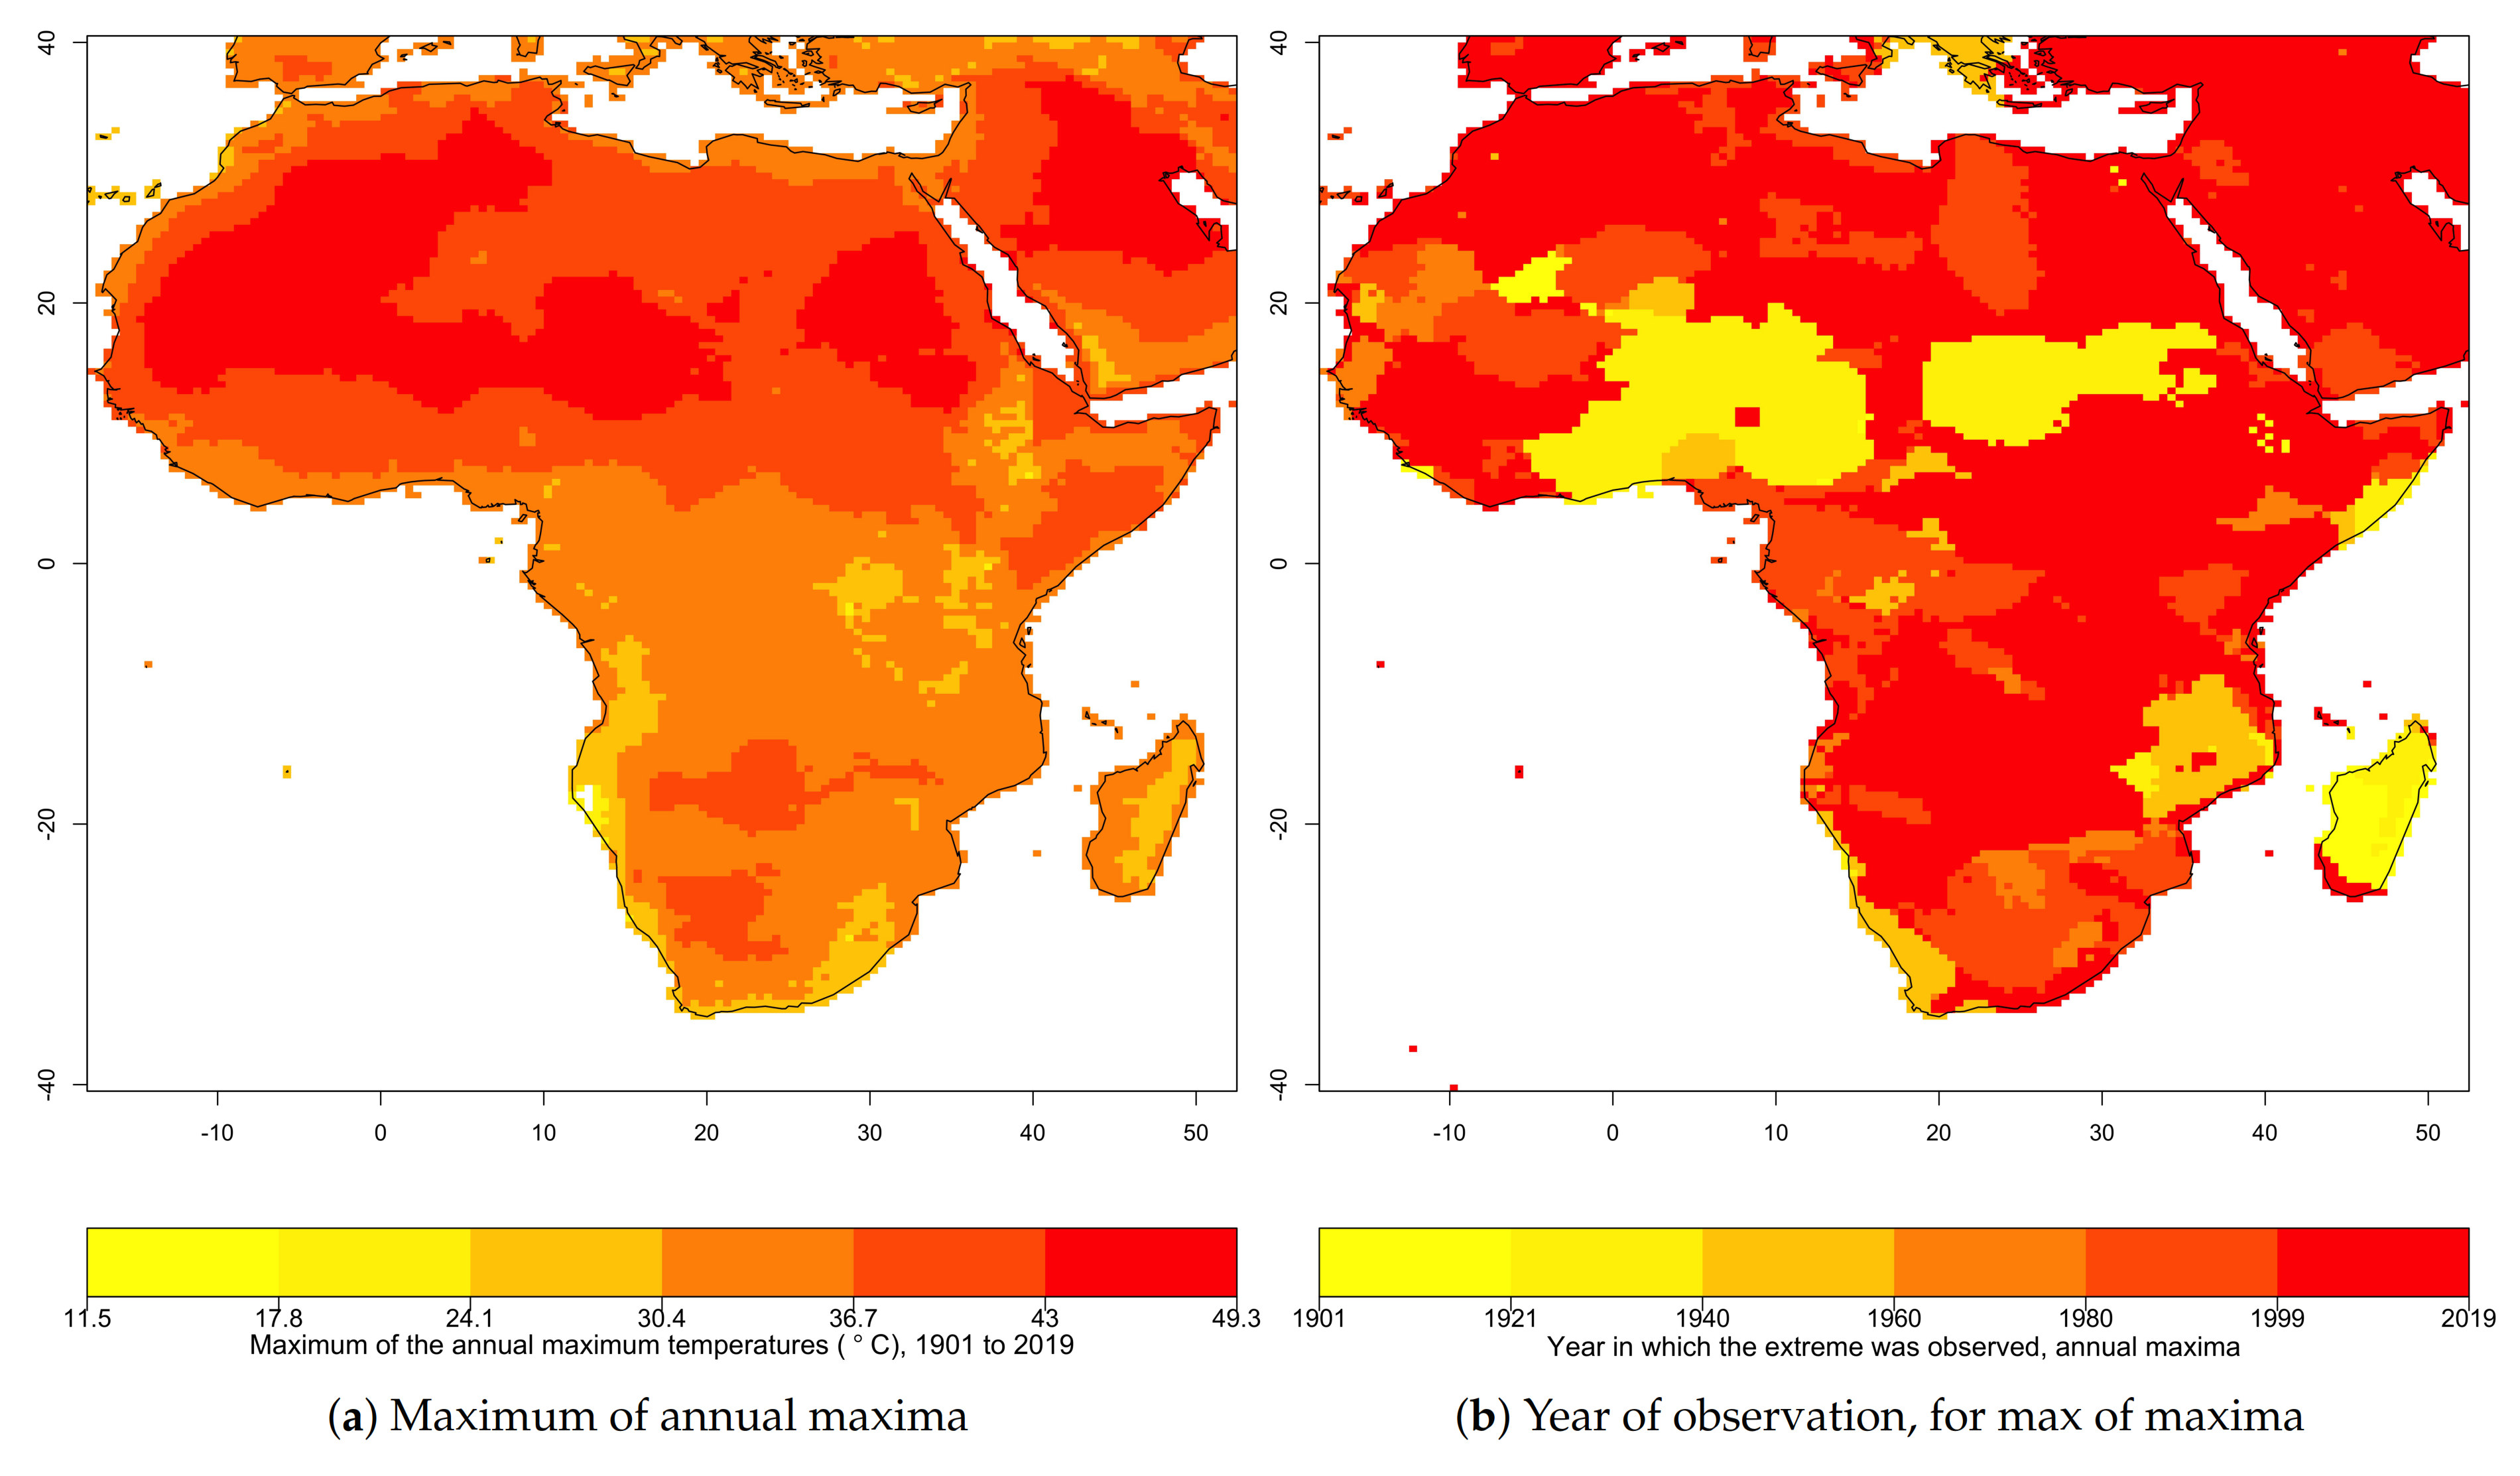
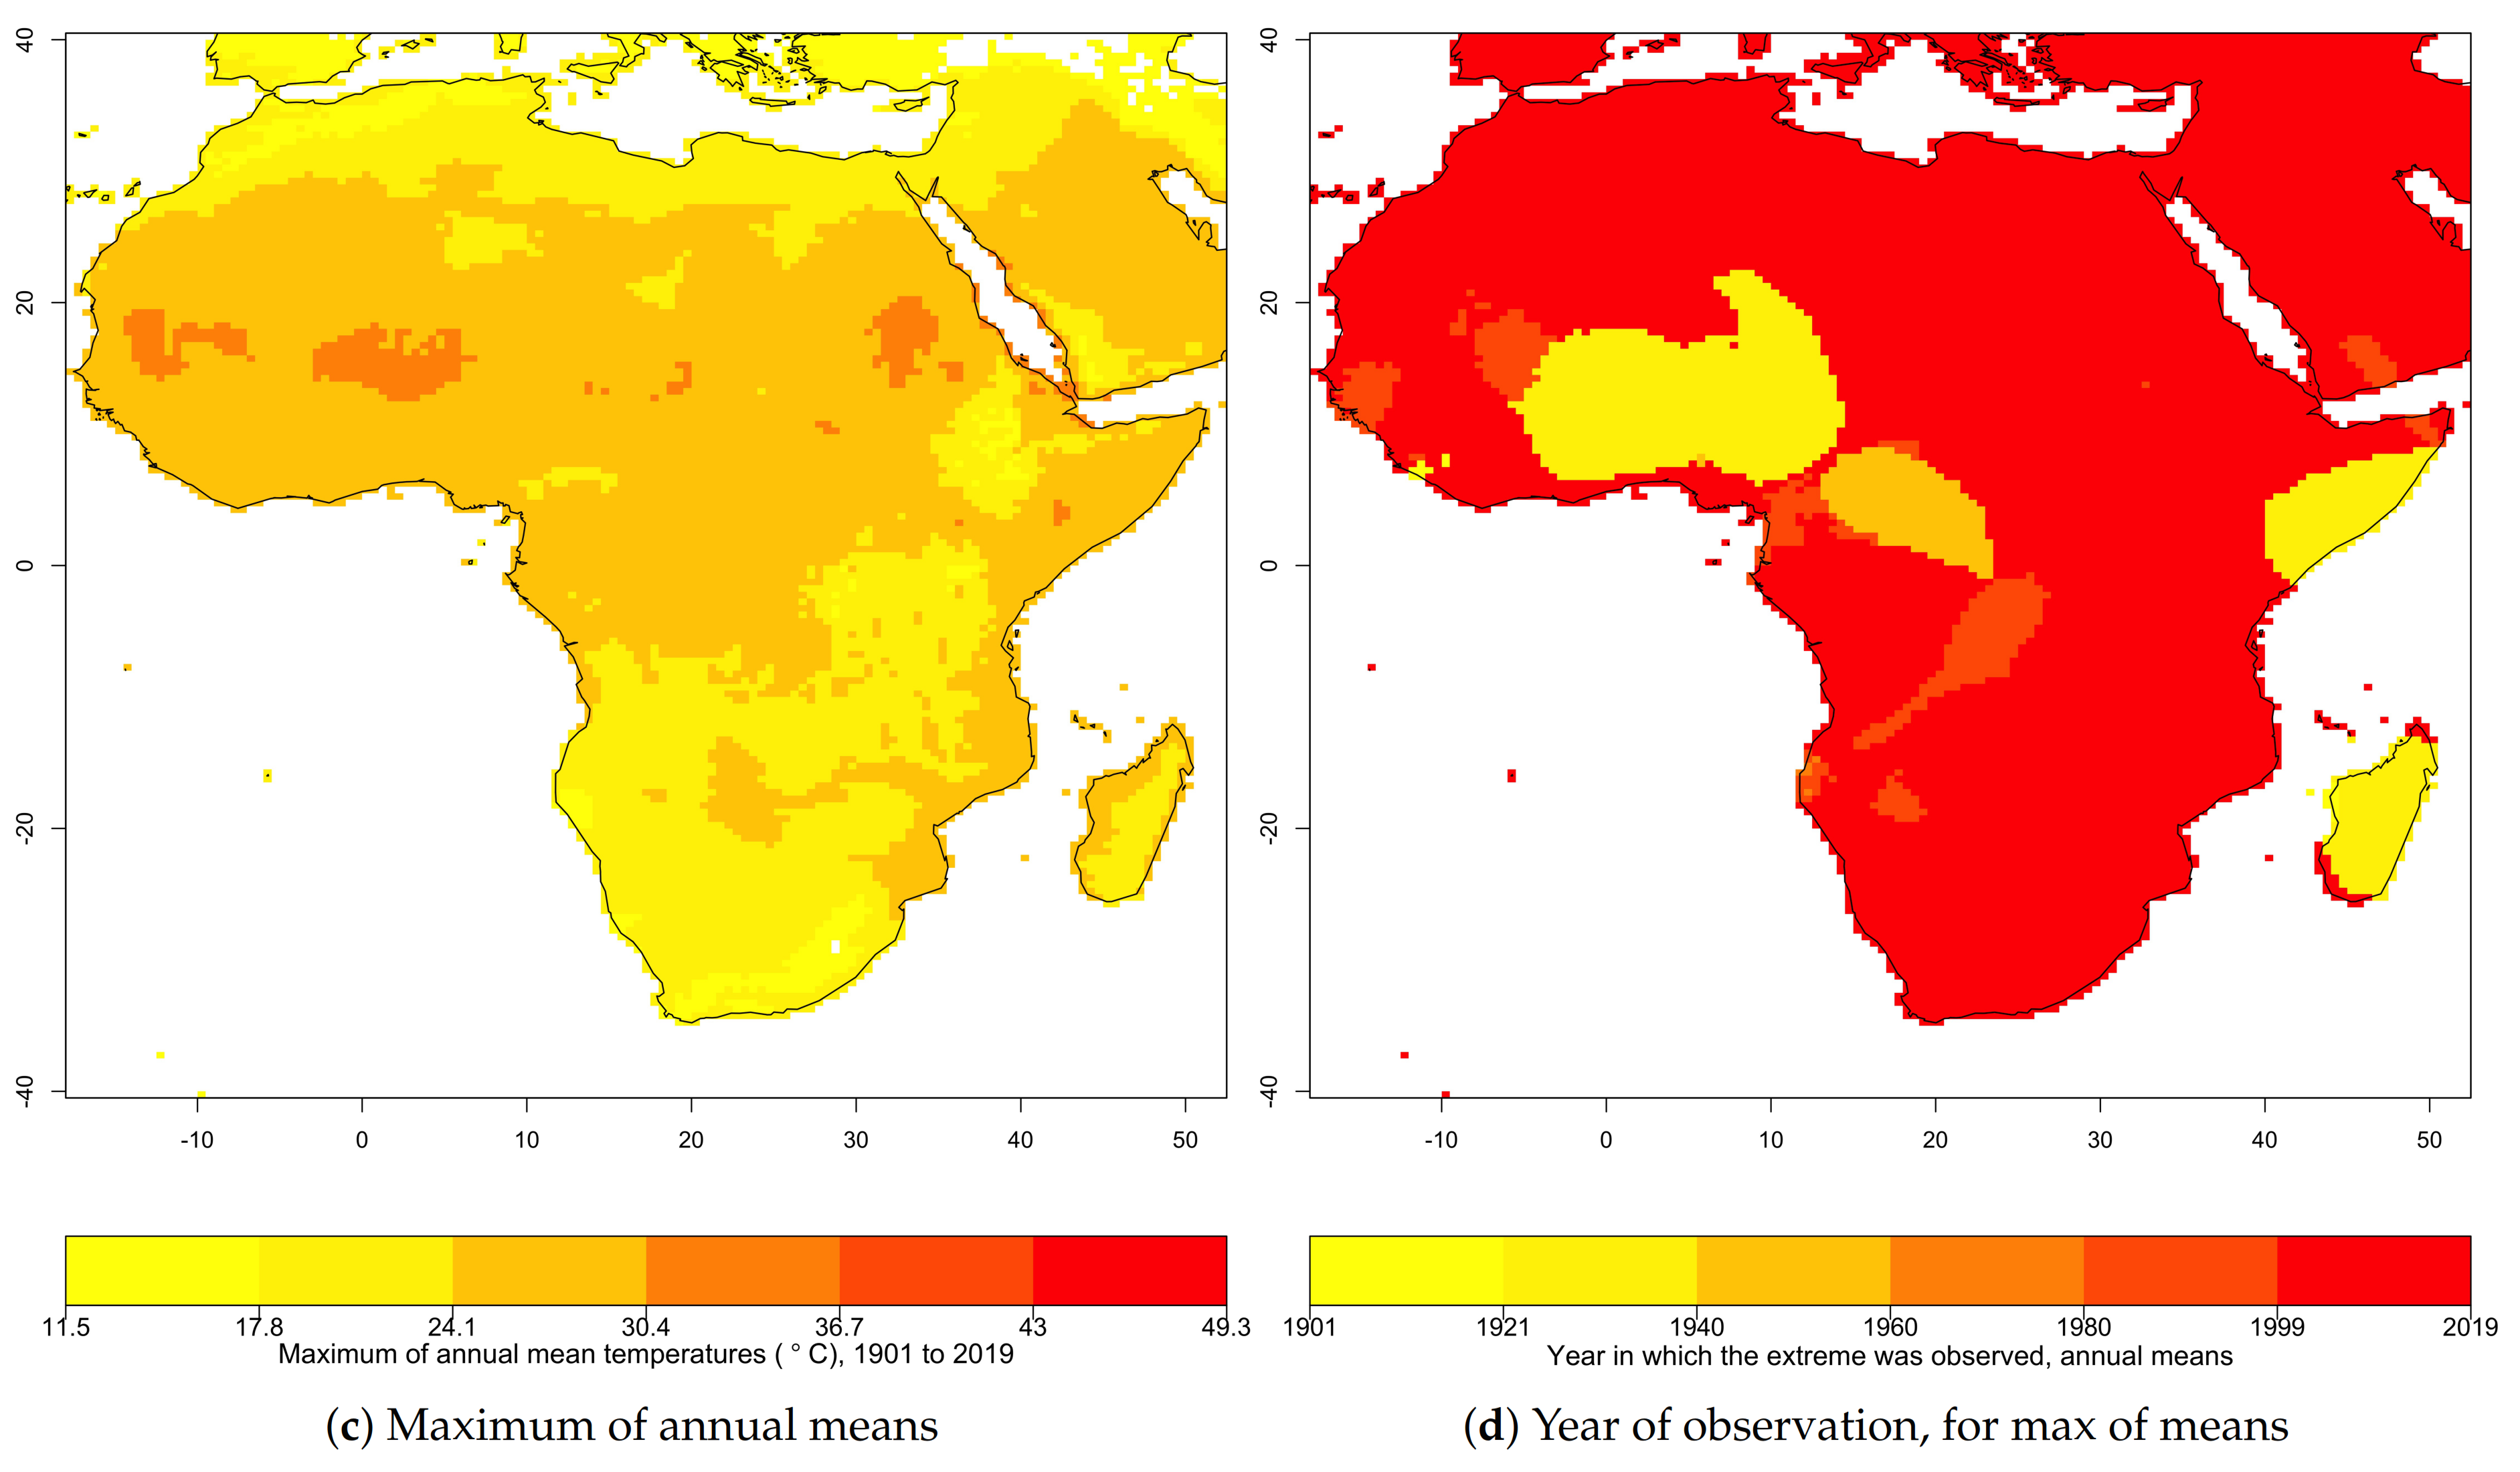
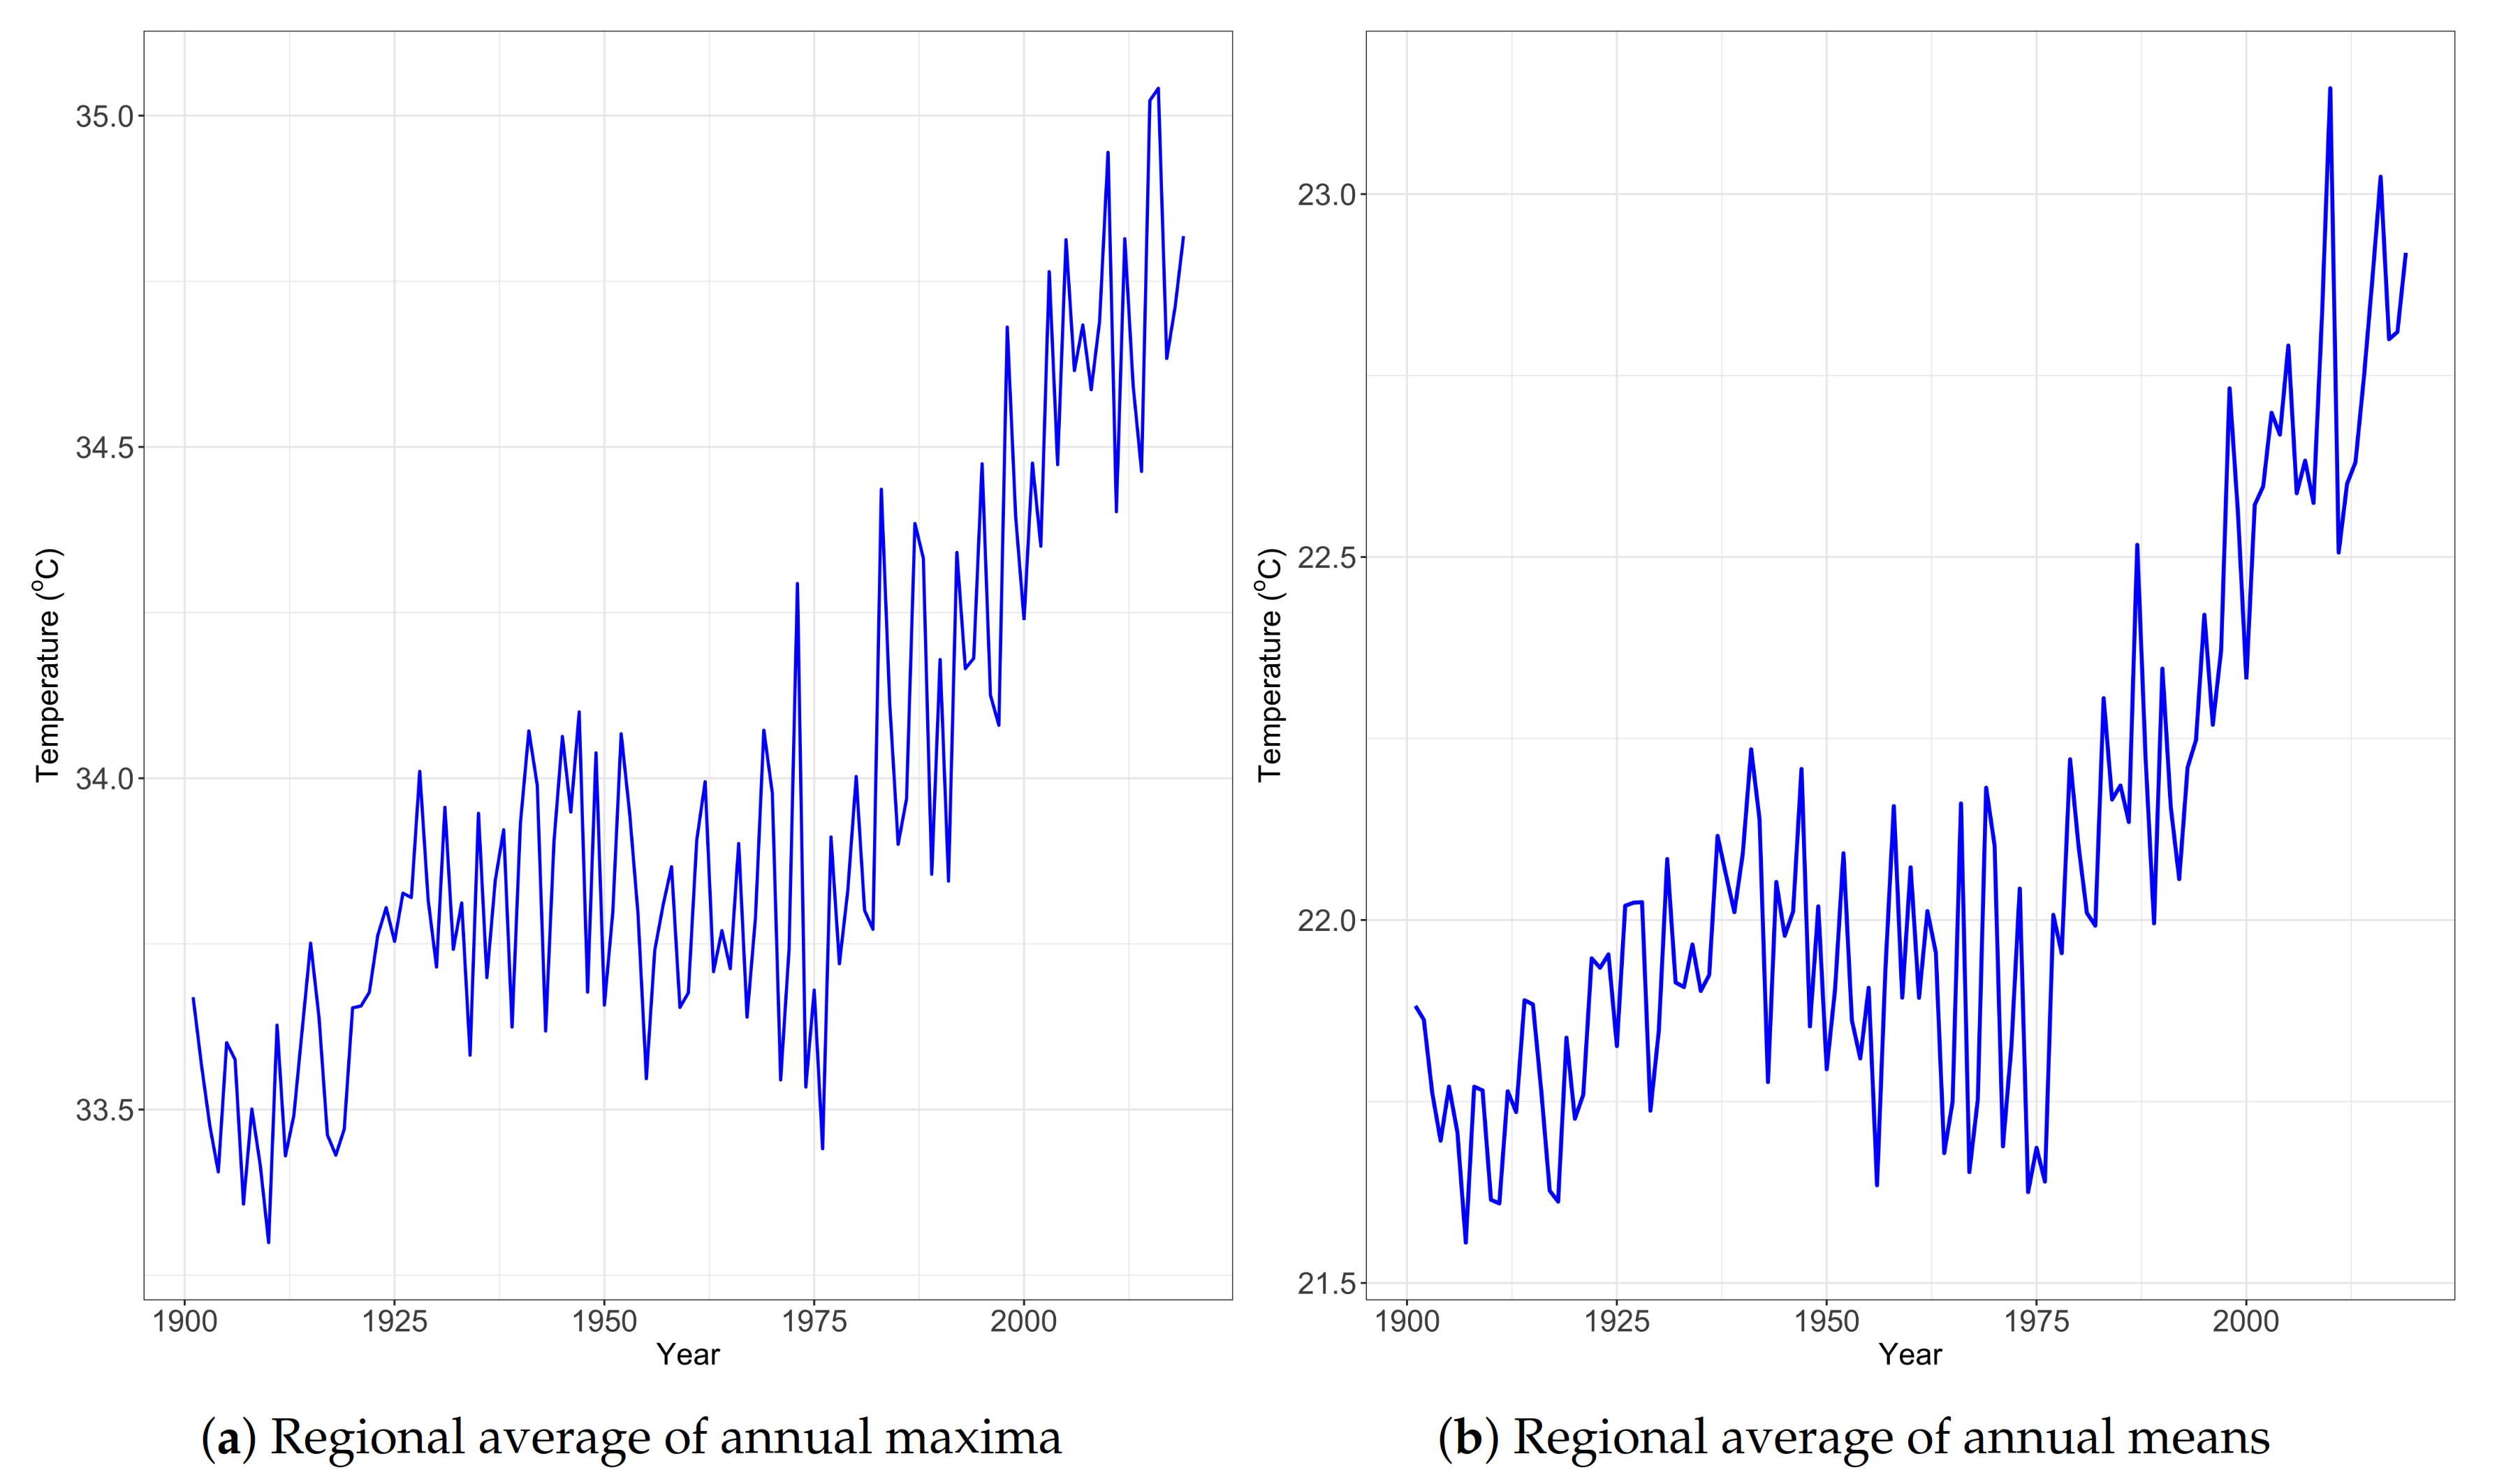
The maxima of the two series (the 100th percentiles) over the sample period of 1901–2019 are shown in Figure 3. The maxima in annual maximum temperatures varied from 22 °C to 50 °C across the region; and those in the annual mean temperatures varied from 12 °C to 32 °C. More importantly, the maxima in both series were observed in the recent 25 years (1995–2019) at most places in the region (see Figure 3b,d). This observed distribution of maxima is consistent with IPCC’s conclusions [14] of increased warming trend across the continent over the past 50 years, and the findings in [13]. The effect of this can also be seen in the time series of annual averages (averaged over this region) of the two series shown in Figure 4.
2.2. Exceedance Probability
According to [22], exceedances are values, in particular of a time series or spatial process, exceeding a specified threshold. To explain this in mathematical terms, consider we have N numerical observations, , which are with no ties and are thought to come from the same probability process. Let be the sequence of order statistics of the sample. A new observation is said to be an exceedance of the order statistic from the original record if . Probability of this happening in a predefined future time period is commonly known as exceedance probability. The exceedance probability plays an important role in risk management and predicting extreme events such as heatwave, floods, hurricanes and the like [23,24]. The variable of interest here, Y, being the annual maximum/mean temperature for different locations (gridpoints) in the African region, in this section, we discuss a robust data-driven method used to estimate exceedance probability in this study.
The standard density estimation techniques are usually criticized for being biased in estimating tail probabilities. Although the generalized Pareto family of probability distributions is commonly used to model threshold exceedances [25,26,27,28], they are true only asymptotically—they are limiting distributions. Moreover, very little to nothing is known about properly fitting probability distributions for climate variables such as annual maximum temperature. Therefore, a distribution-free (non-parametric) statistical method discussed in [4,5] was used to compute the estimated exceedance probability in this study. This method is called distribution-free because it does not depend on any theoretical probability distribution.
Let be a random sample of N independent identically distributed random variables satisfying with probability 1 whenever , i.e., no tie. Let be the order statistics from the N observations in the sample. For any , the probability that there are exactly k exceedances of in the next n new observations of the process is:
Although climate change is commonly considered as a change in mean temperature, changes in extreme temperatures also have a significant impact on environment and society. Therefore, frequency and return period of extremes, both in the annual maximum and the annual mean temperatures, were the main objective of this study.
2.3. Return Period
Suppose, in line with discussion in Section 2.2, an extreme event is a situation where the observed value of a random variable Y exceeds some fixed threshold . One of the important questions then may be how long would it take for that extreme event to occur again (i.e., the return period)? A return period is an average time (or an estimated average time) between events such as extreme temperatures [29,30].
The concept of return period is proposed to characterize the frequency of occurrence of a phenomenon [31]. To discuss this concept mathematically, let us consider the cumulative distribution function of Y at ,
where is density function of Y. The probability, p, of the random variate Y having a value greater than is then . To get the return period of extreme event, let us define a new random variable Z to be the number of trials/years until is exceeded. Here Z is a discrete random variable having geometric distribution with probability of success (exceedance) p. The probability that is first exceeded at trial z is then given by
since the event of exceedance has not occurred in the first Bernoulli trials.
Therefore, the expected (mean) number of trials until the return of the extreme temperature is
(e.g., see [32] (p. 97), and [33])—the number of trials being number of years in this study. Hence, the expected return period of extreme temperature is calculated using an empirical cumulative distribution function (ECDF) of the observed temperatures in (4). Because an ECDF is estimator of the underlying theoretical cumulative distribution function, , of Y. Then, using the ECDF, the return period (RP) is estimated as
for extremes in both annual mean and annual maximum temperatures.
If the climate is changing in the way many agree (warming), frequency of the once extreme event is expected to increase in recent times compared to the past. If so, this leads to a shorter return period of extremes in the recent/future times. To make such a comparative analysis, return periods of the 20th century threshold, are estimated based on two ECDFs, namely ECDF based on distribution of temperatures over 1901–2007 and ECDF based on distribution over 1901–2019.
For random variable Z defined earlier, it can be shown that its variance is given by
(e.g., see [34] (p. 83)) and, therefore, the standard deviation of Z at each gridpoint is estimated by . Using these results and the central limit theorem, which holds here since the sample size is large enough, the approximate large sample 95% confidence interval for mean return period is given by , where is sample size.
3. Results and Discussions
3.1. Exceedance Probability of Threshold Based on 1901–2000 Temperature Distribution
In this section, we use the threshold based on 1901–2000 temperature data to retrospectively estimate probability of its exceedance over the immediate “next” 19 years (2001–2019)—retrospective estimation. The parameters in Equation (1) depend on the length of training data, length of time period for which the exceedance probability is estimated for and the chosen number of exceedances. In this study, the values of N and m may vary from one gridpoint to another. Generally, N is the number of unique (without tie) `historical’ observations at a particular gridpoint, over 1901–2000 for analysis in this section and over 1901–2019 for analysis in Section 3.3. Therefore, the maximum value of N at a point should be 100 for analysis in this section and 119 for that in Section 3.3. On the other hand, m () refers to the position of the 90th percentile of historical observations without tie in each case (1901–2000 and 1901–2019) at each gidpoint. However, the values of k and n remain the same for analyses in this section and Section 3.3. In both cases, n refers to the respective “next” 19 years, 2001–2019 and 2020–2038, respectively. Hereafter, we call them the first 19 years and the second 19 years, respectively.
The threshold that defines extreme event (the 90th percentile of observed sample distribution over the 20th century) is calculated, see Figure 2a,b, for both (annual maxima and annual means) series by ranking the observations and removing ties (if any at all), using unique function in R, for each grid point. Estimates based on different values of n, k, and N were seen to have qualitatively similar patterns (leading to similar conclusions in the context of this study). For illustrations, throughout this paper, probability of 3 exceedances () of extremes over the immediate next 19 years period (for different segments of 19 years’ time) is presented and discussed.
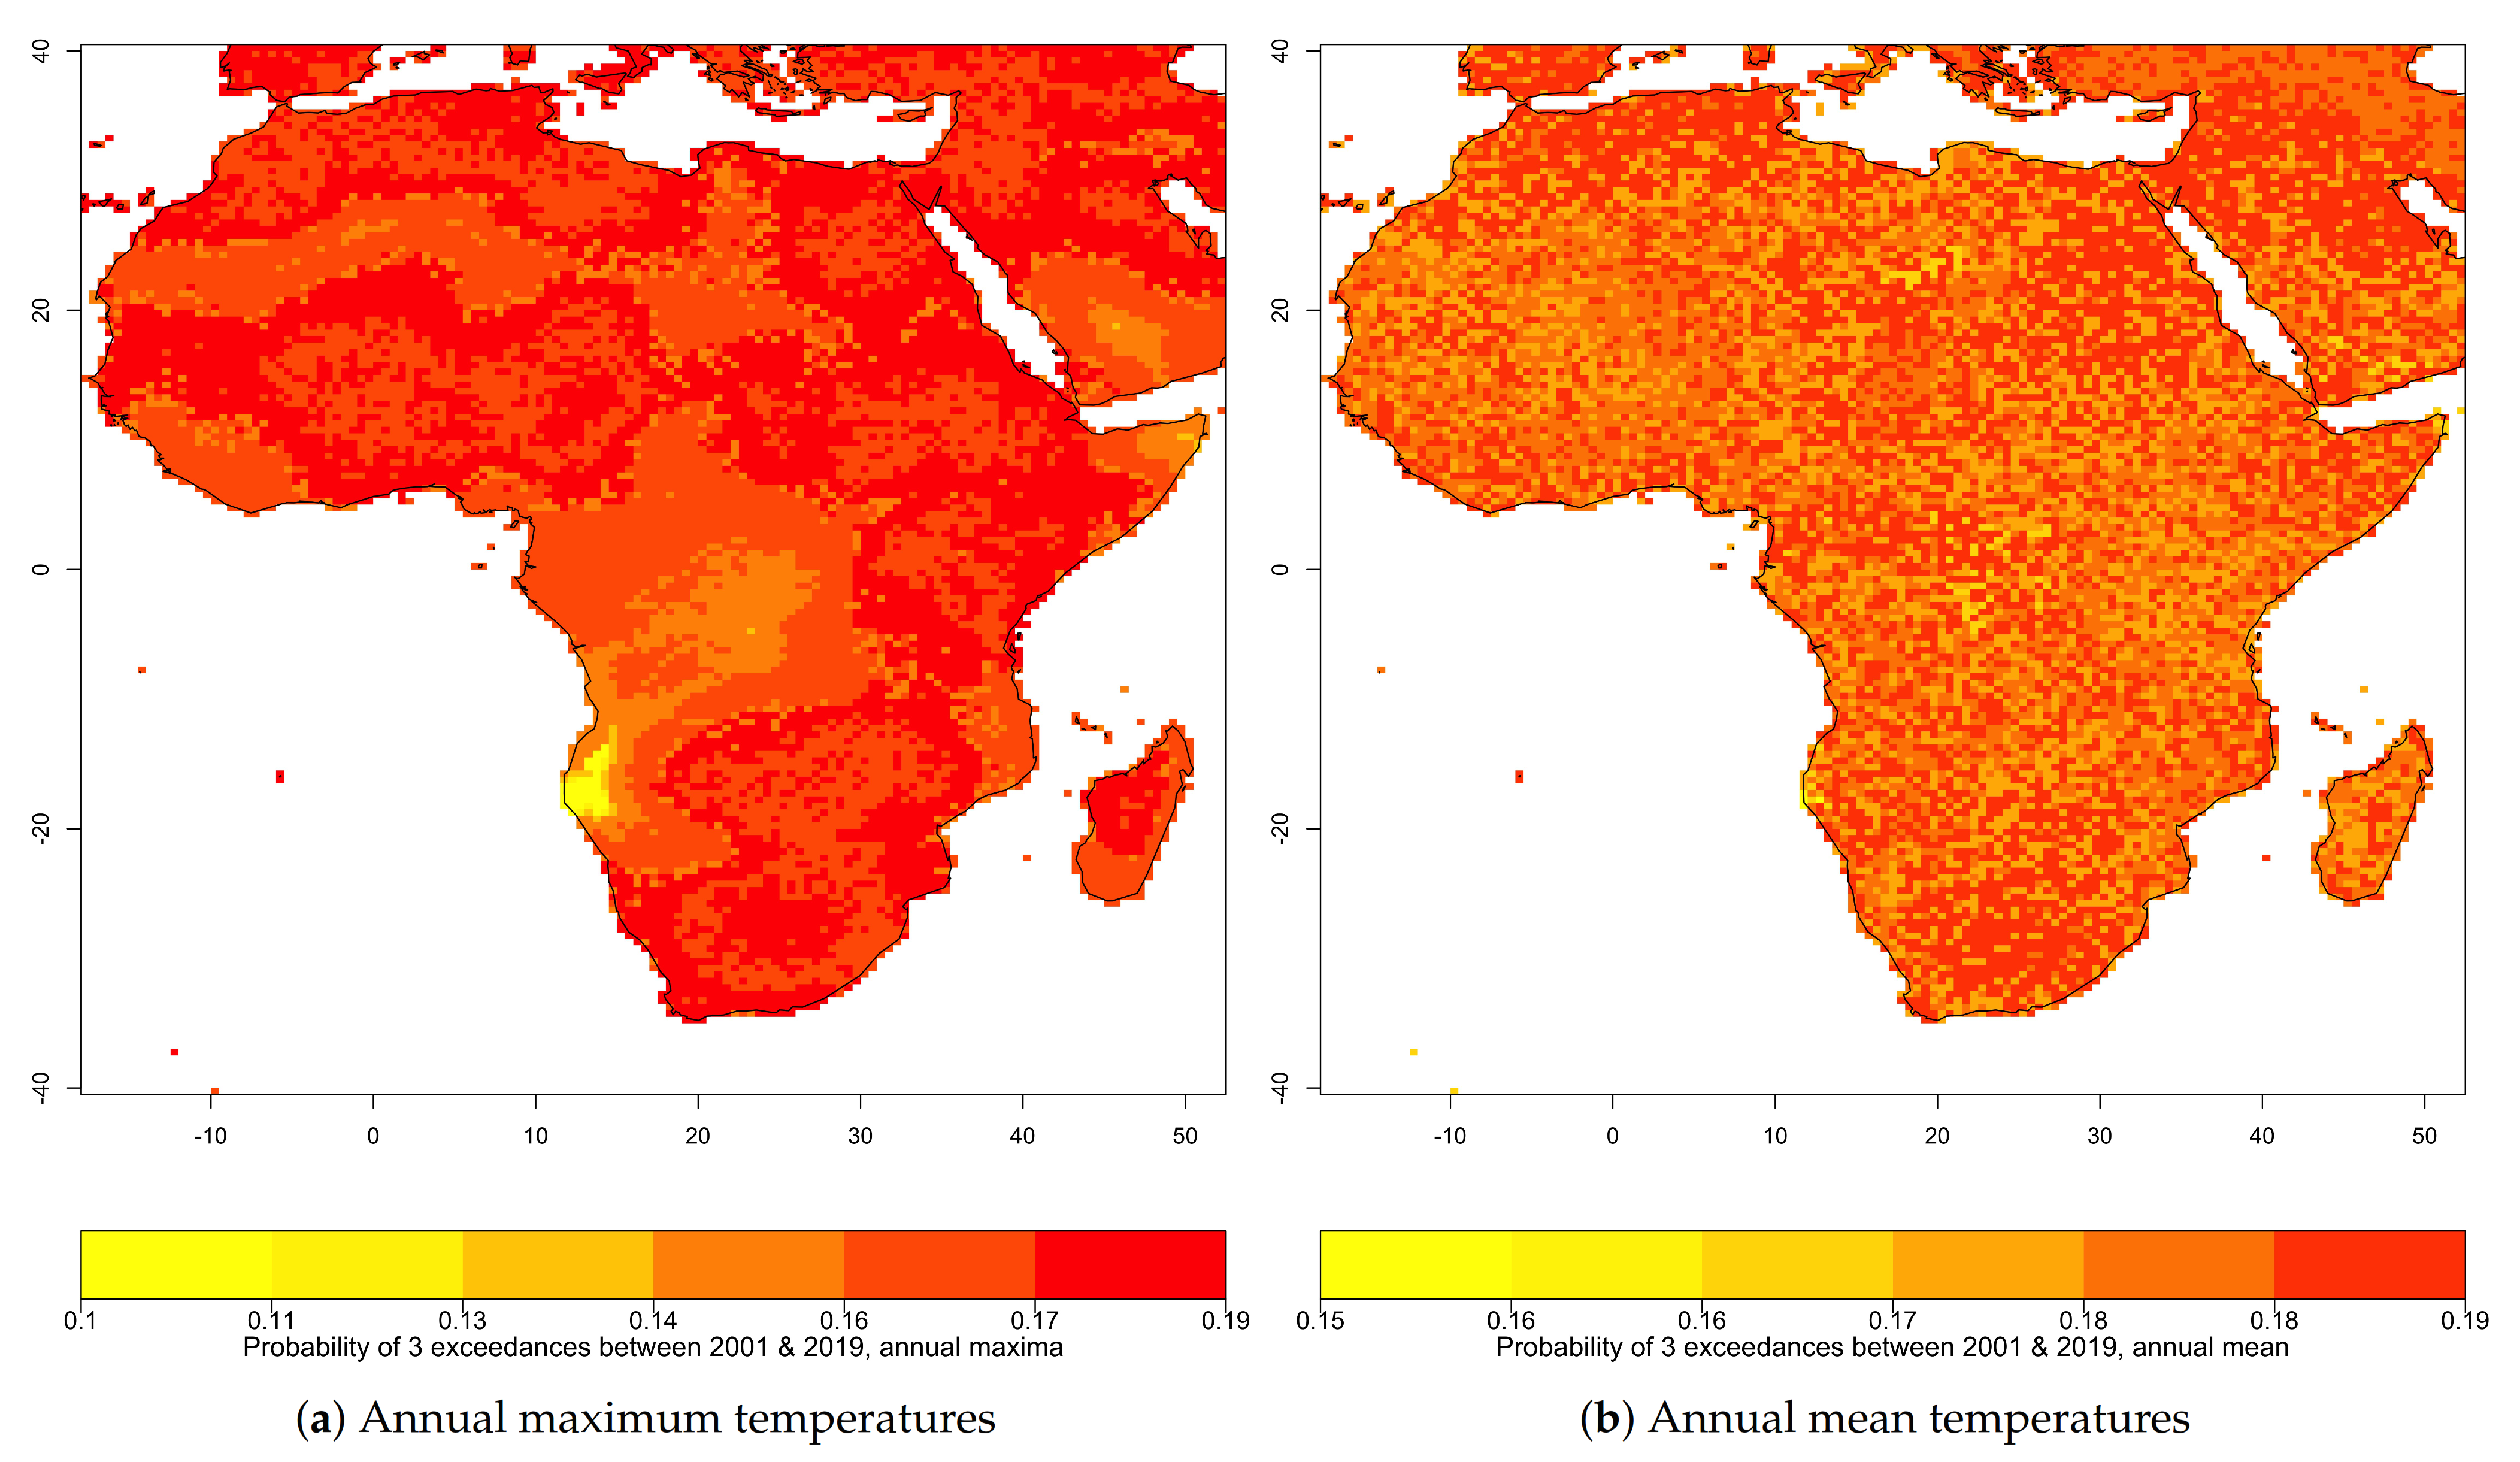
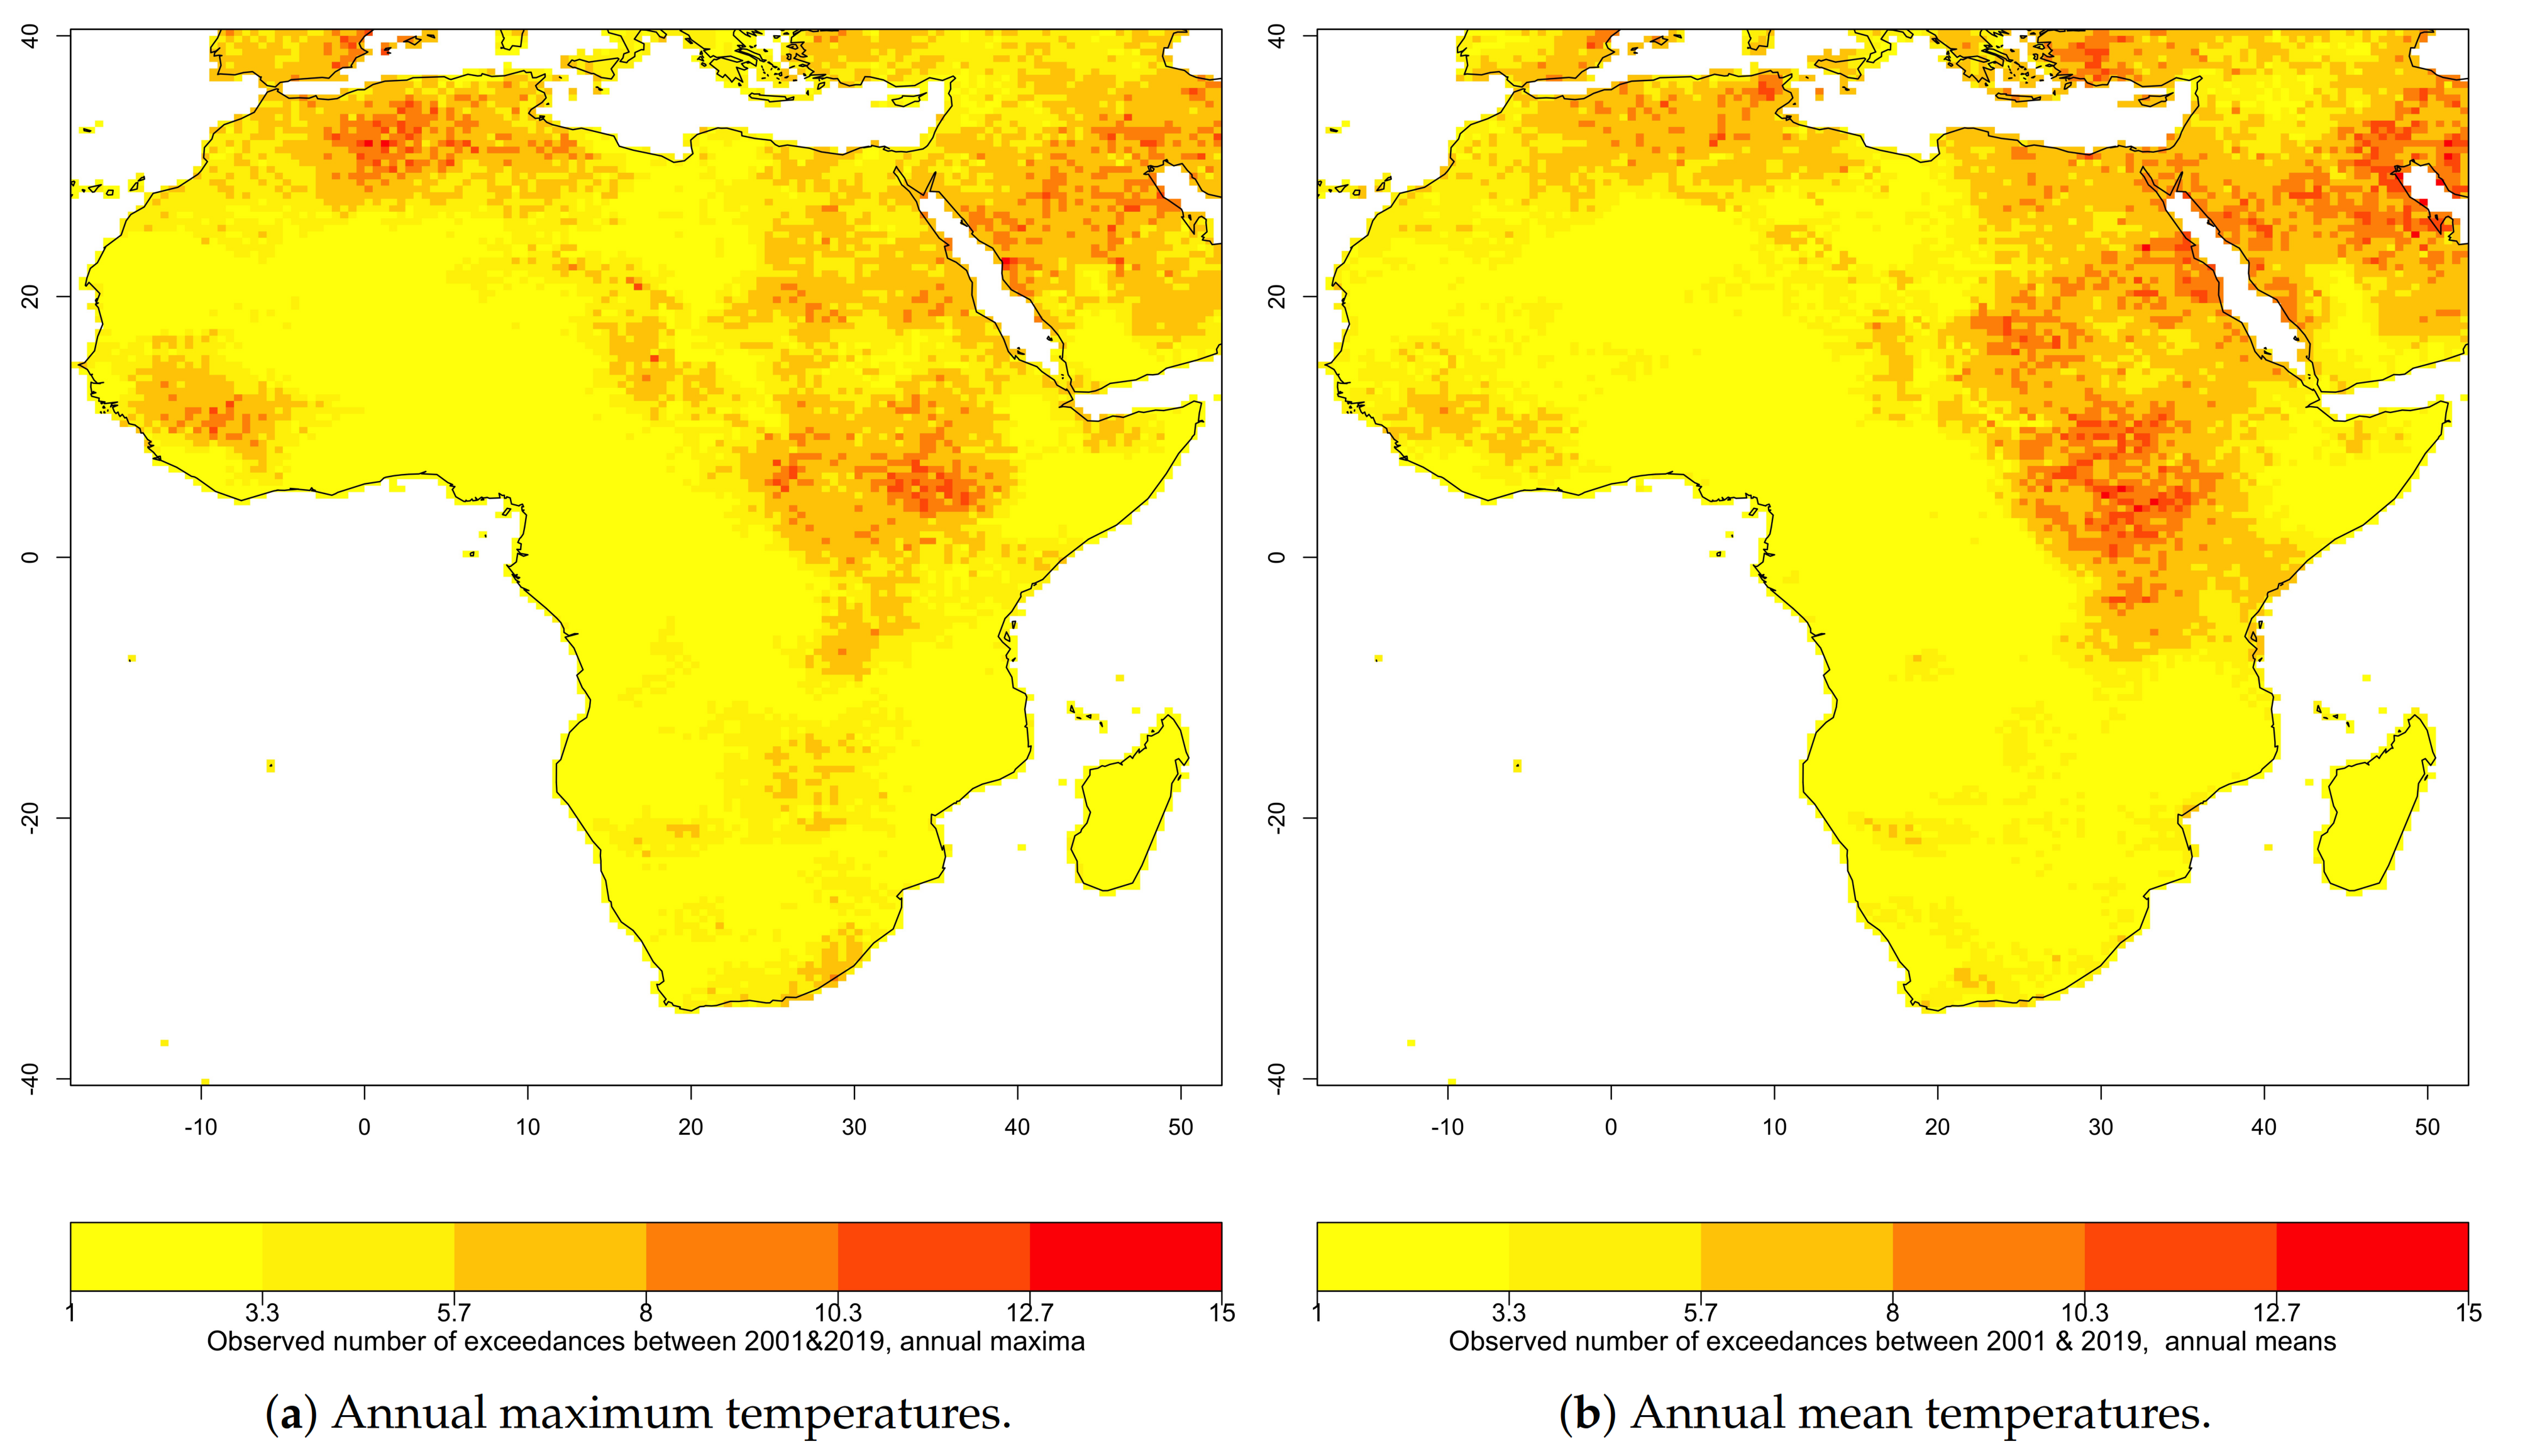
As can be seen from Figure 5, most places in the region had as high as 19% chances of having 3 exceedances of extremes in both annual maximum and annual mean temperatures over the first 19 years’ period. Nineteen percent probability of having 3 exceedances over just 19 years time seems to be considerably high and alarming. Very few number of places in the region have the minimum estimated probabilities, 10% and 15% respectively, of 3 exceedances in annual maximum and annual mean. That means any place in the African region has 10% or higher probability of 3 exceedances over the period of 2001–2019. These estimated probabilities are considerably large and worrying quantities for such an extreme event. This could mean there is high chance of frequent high-temperature incidences in the region. The observed climate between 2001 and 2019 is also in agreement with these estimates (see Figure 6). It was observed that most places in the region have been hit by extreme temperature at least twice over the period of 19 years. The higher the observed extremes, the larger the estimated exceedance probability should be over that same period of observation.
As studies have shown [35,36,37], high temperature and drought occur together in many regions. In this case, more frequent high temperature events may be accompanied by drought and the combined effect may put more stress on the already fragile food security in the region [38]. The results of this study indicated that reliable (data-driven) estimates can help planners and policy makers in the better management of high temperature events and their consequences.
3.2. Return Period of Extremes in Annual Maximum and Annual Mean Temperatures
Return periods of extremes in both variables, the annual maximum and annual mean temperatures, are estimated using Equation (5). As described in Section 2.3, we use empirical cumulative distribution function based on distributions over 1901–2007 and over 1901–2019 to examine if there is a change in length of return period. The estimations were based on large samples, 107 years and 119 years of data respectively, to ensure that estimation errors related to small sample sizes are minimal.
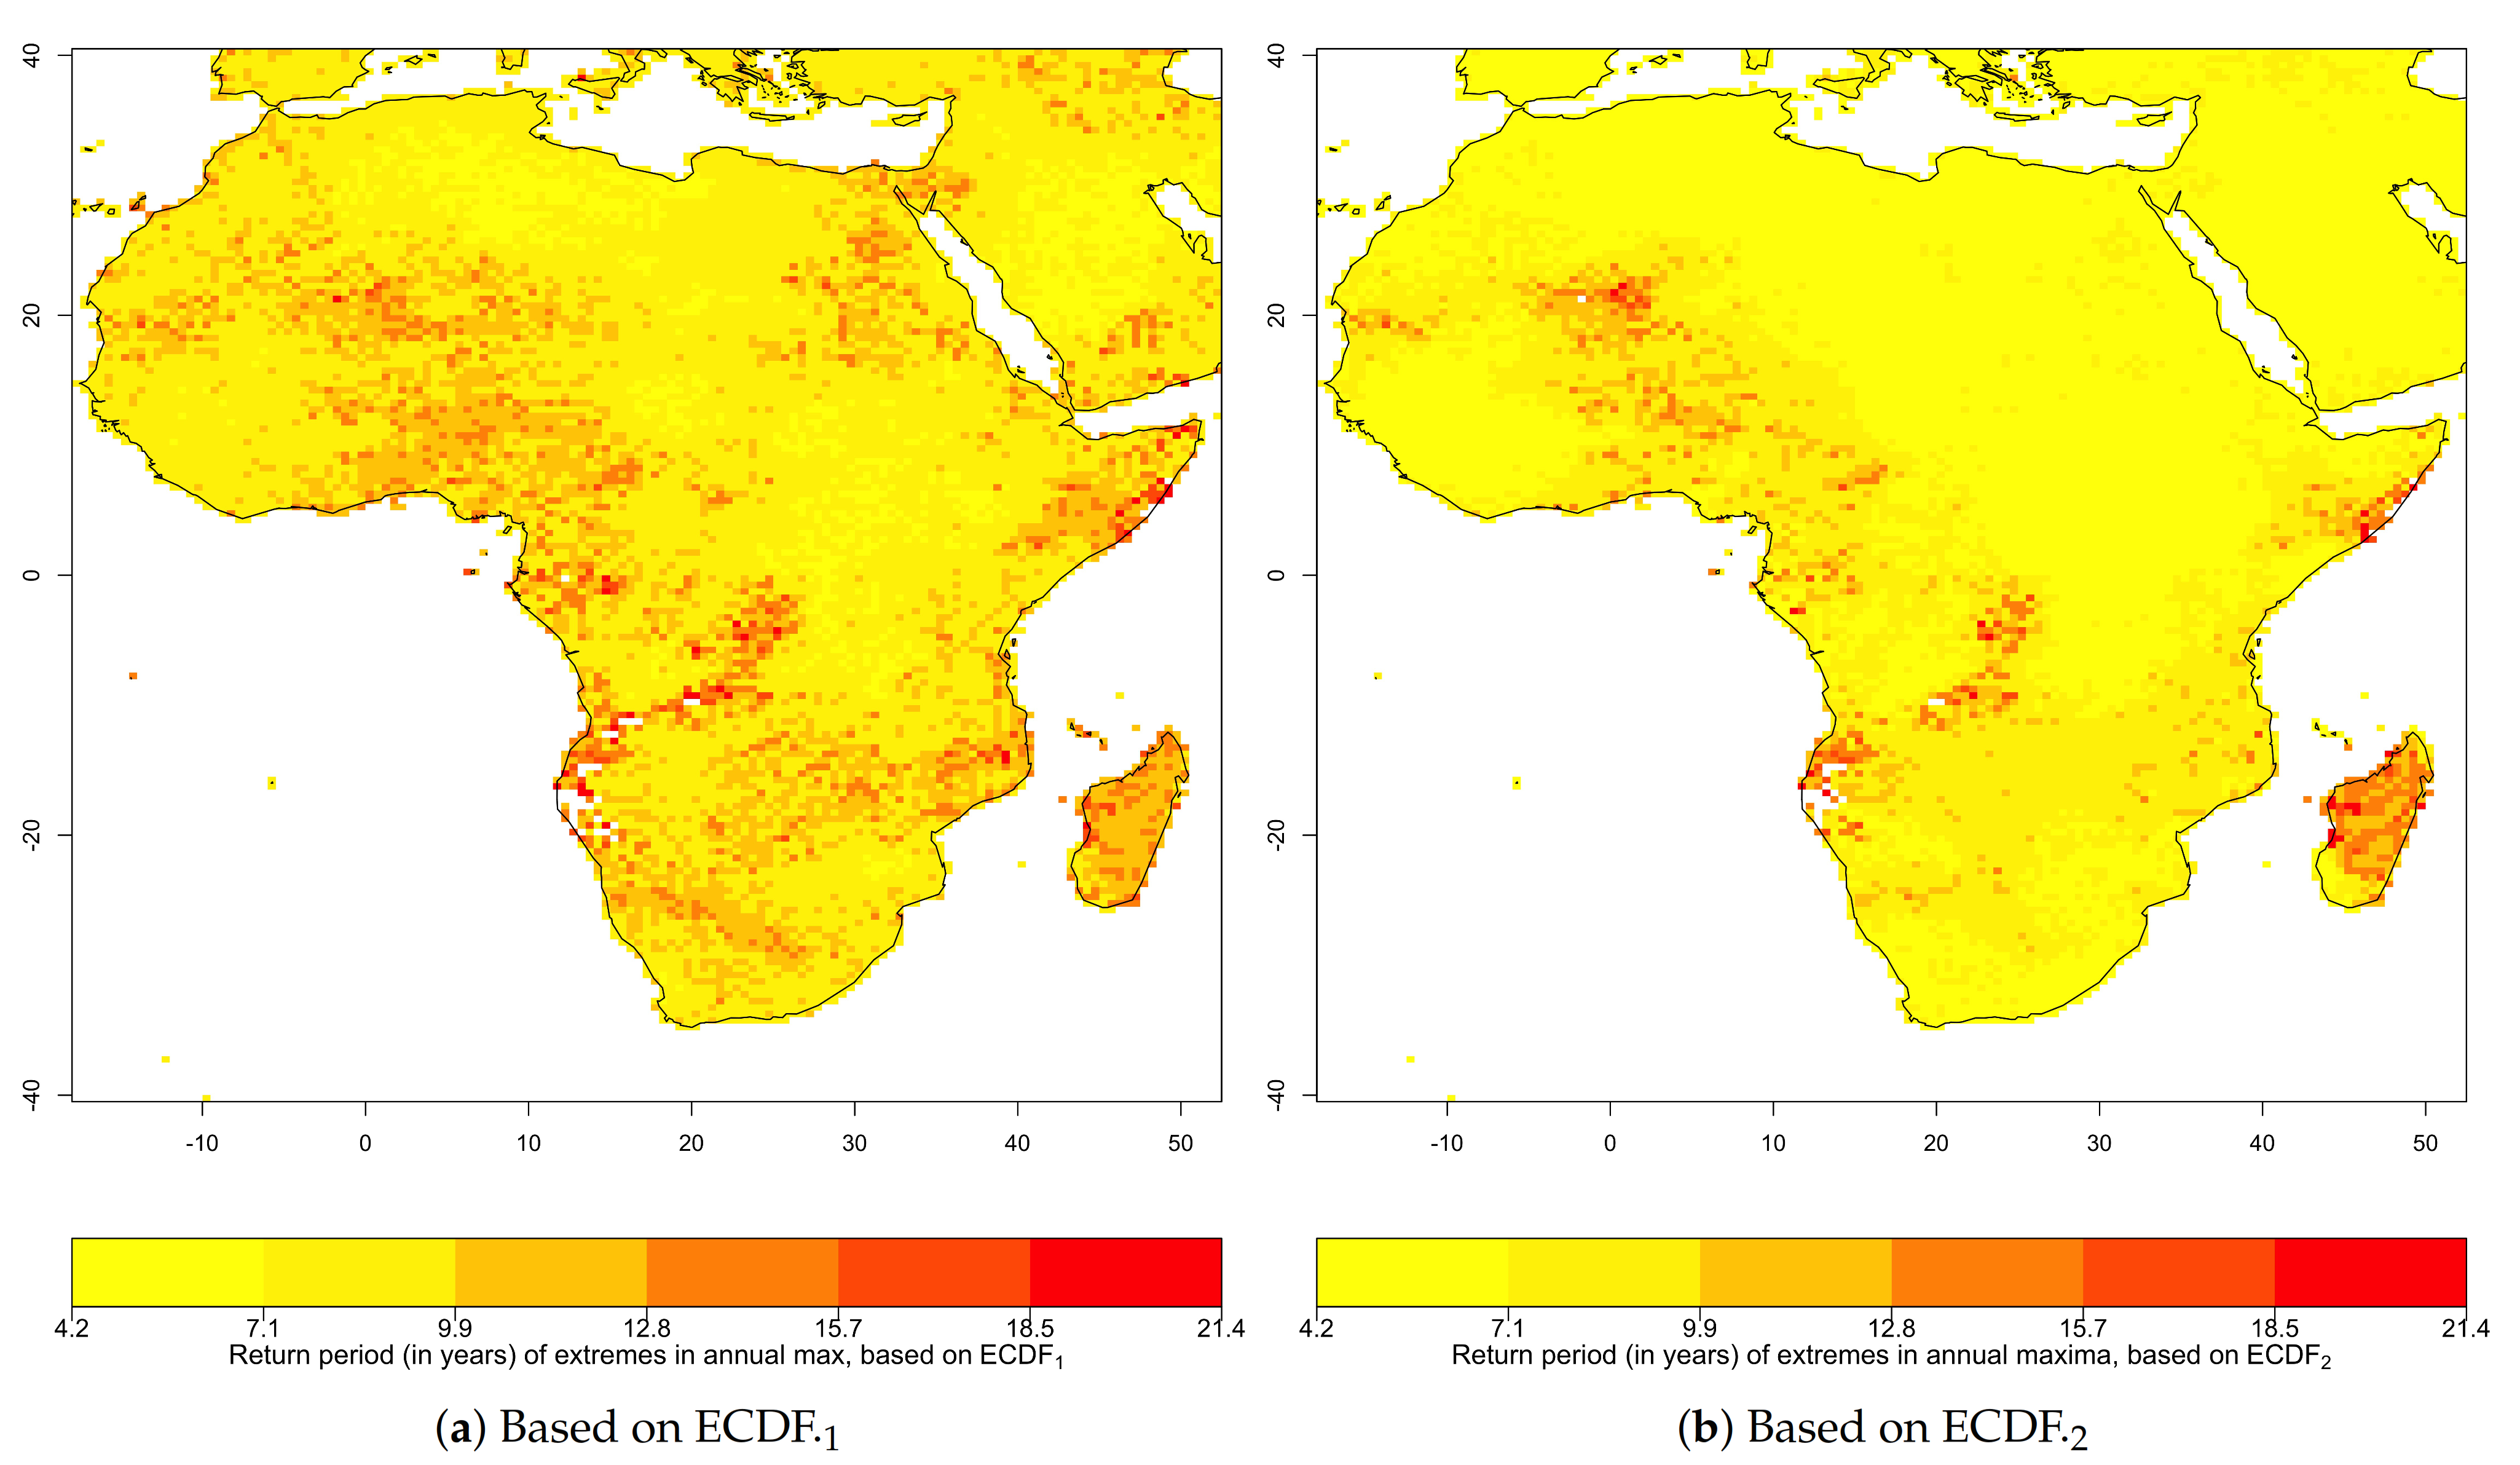
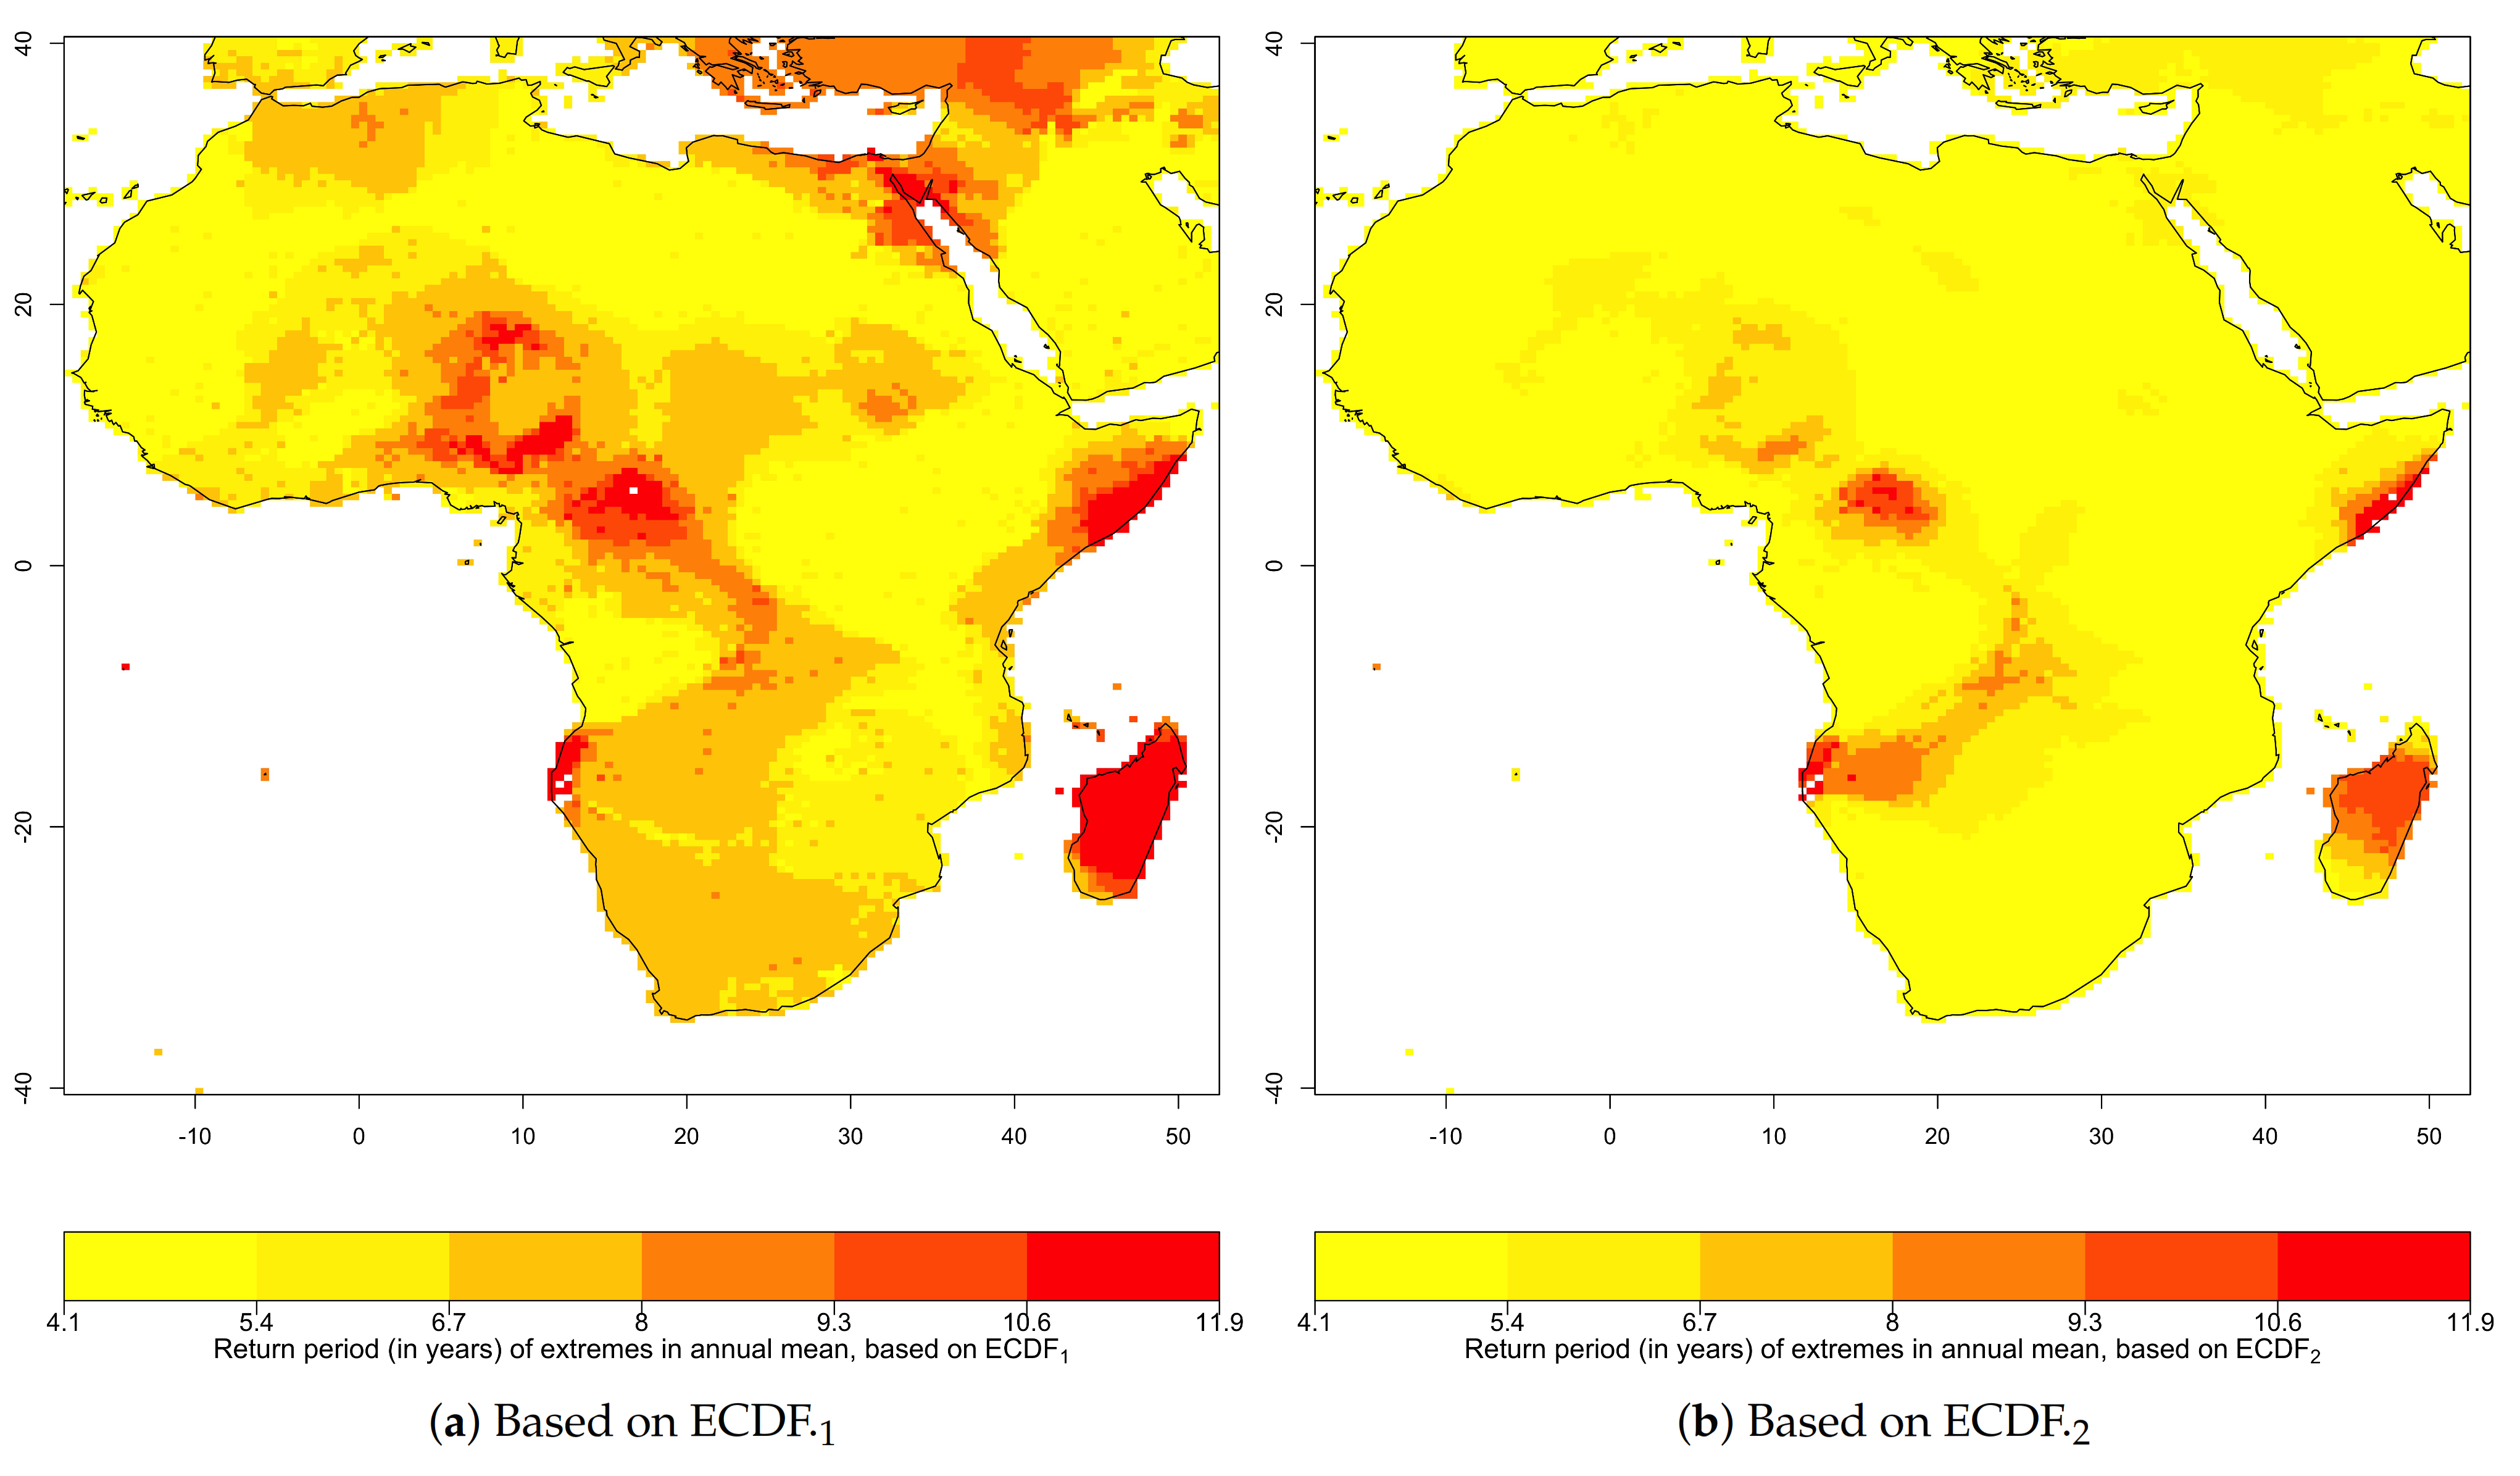
Figure 7 and Figure 8 show the estimated return periods of extremes in annual maximum and annual mean temperatures, respectively, for places in the region. For extremes in annual maximum temperatures, the expected return period based on ECDF is as short as only 4.2 years in many locations and that based on ECDF is as short as 6.3 years (see Figure 7a,b respectively). Similarly, return periods of extreme in annual mean temperatures are as short as 4.1 years based on ECDF and as short as 5.9 years based on ECDF at a considerable number of places (see Figure 8a,b). These results generally indicate that the return periods of extremes in both series are getting shorter with time, which in turn imply that the once extreme event is becoming common phenomena in recent/future times.
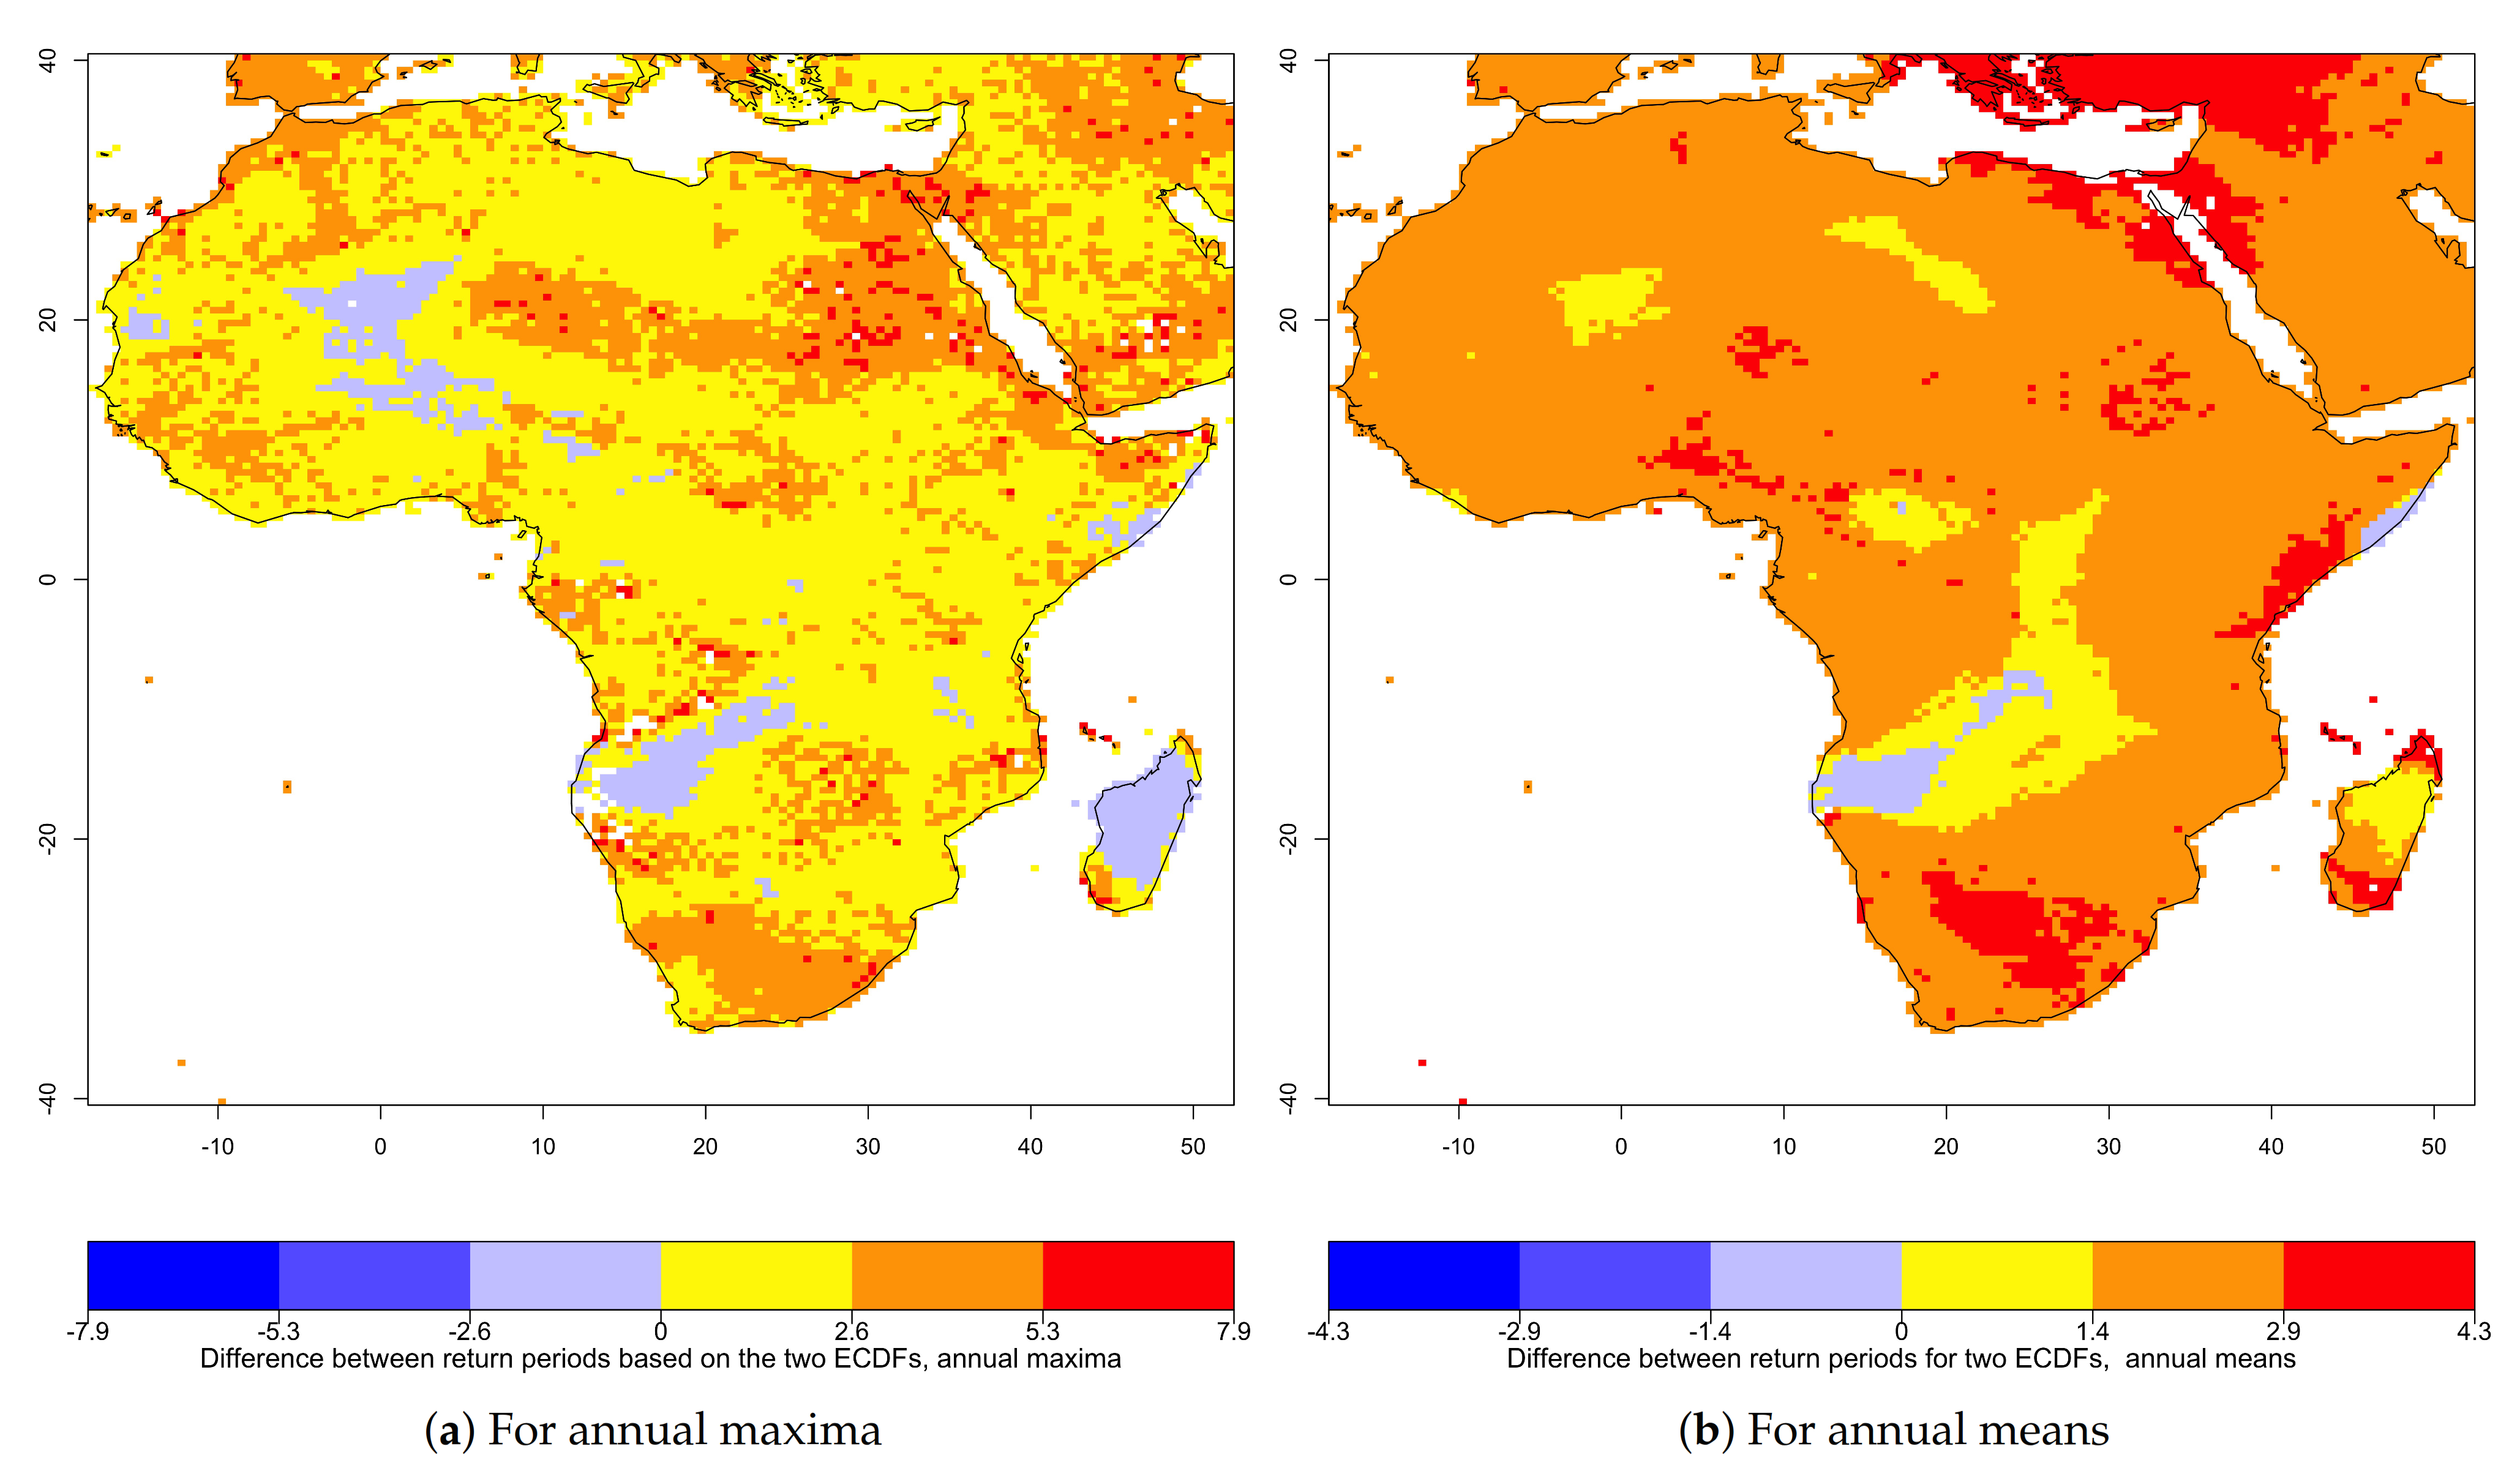
To assess these changes at each gridpoint, the difference between return periods based on the two ECDFs () is computed for both series and shown in Figure 9. These differences are positive at majority of the areas (more than 98% of areas for extremes in annual means and more than 94% of areas for extreme in annual maxima) in the region. This implies that the return period of extreme temperature is getting shorter in the African region. For a considerable number of places, return period based on ECDF is shorter than the one based on ECDF, on average by about 2 years for annual maxima and by 2.5 years for annual means. The effect of this change can easily translate into regional warming, supporting the claims about global and regional warming. Continuation of such change may lead to projections made by [16], which states “by the end of this century, under the most severe IPCC AR5 scenario, events of the same severity as that in Russia in the summer of 2010 will become the norm and are projected to occur as often as every 2 years for regions such as Africa”.
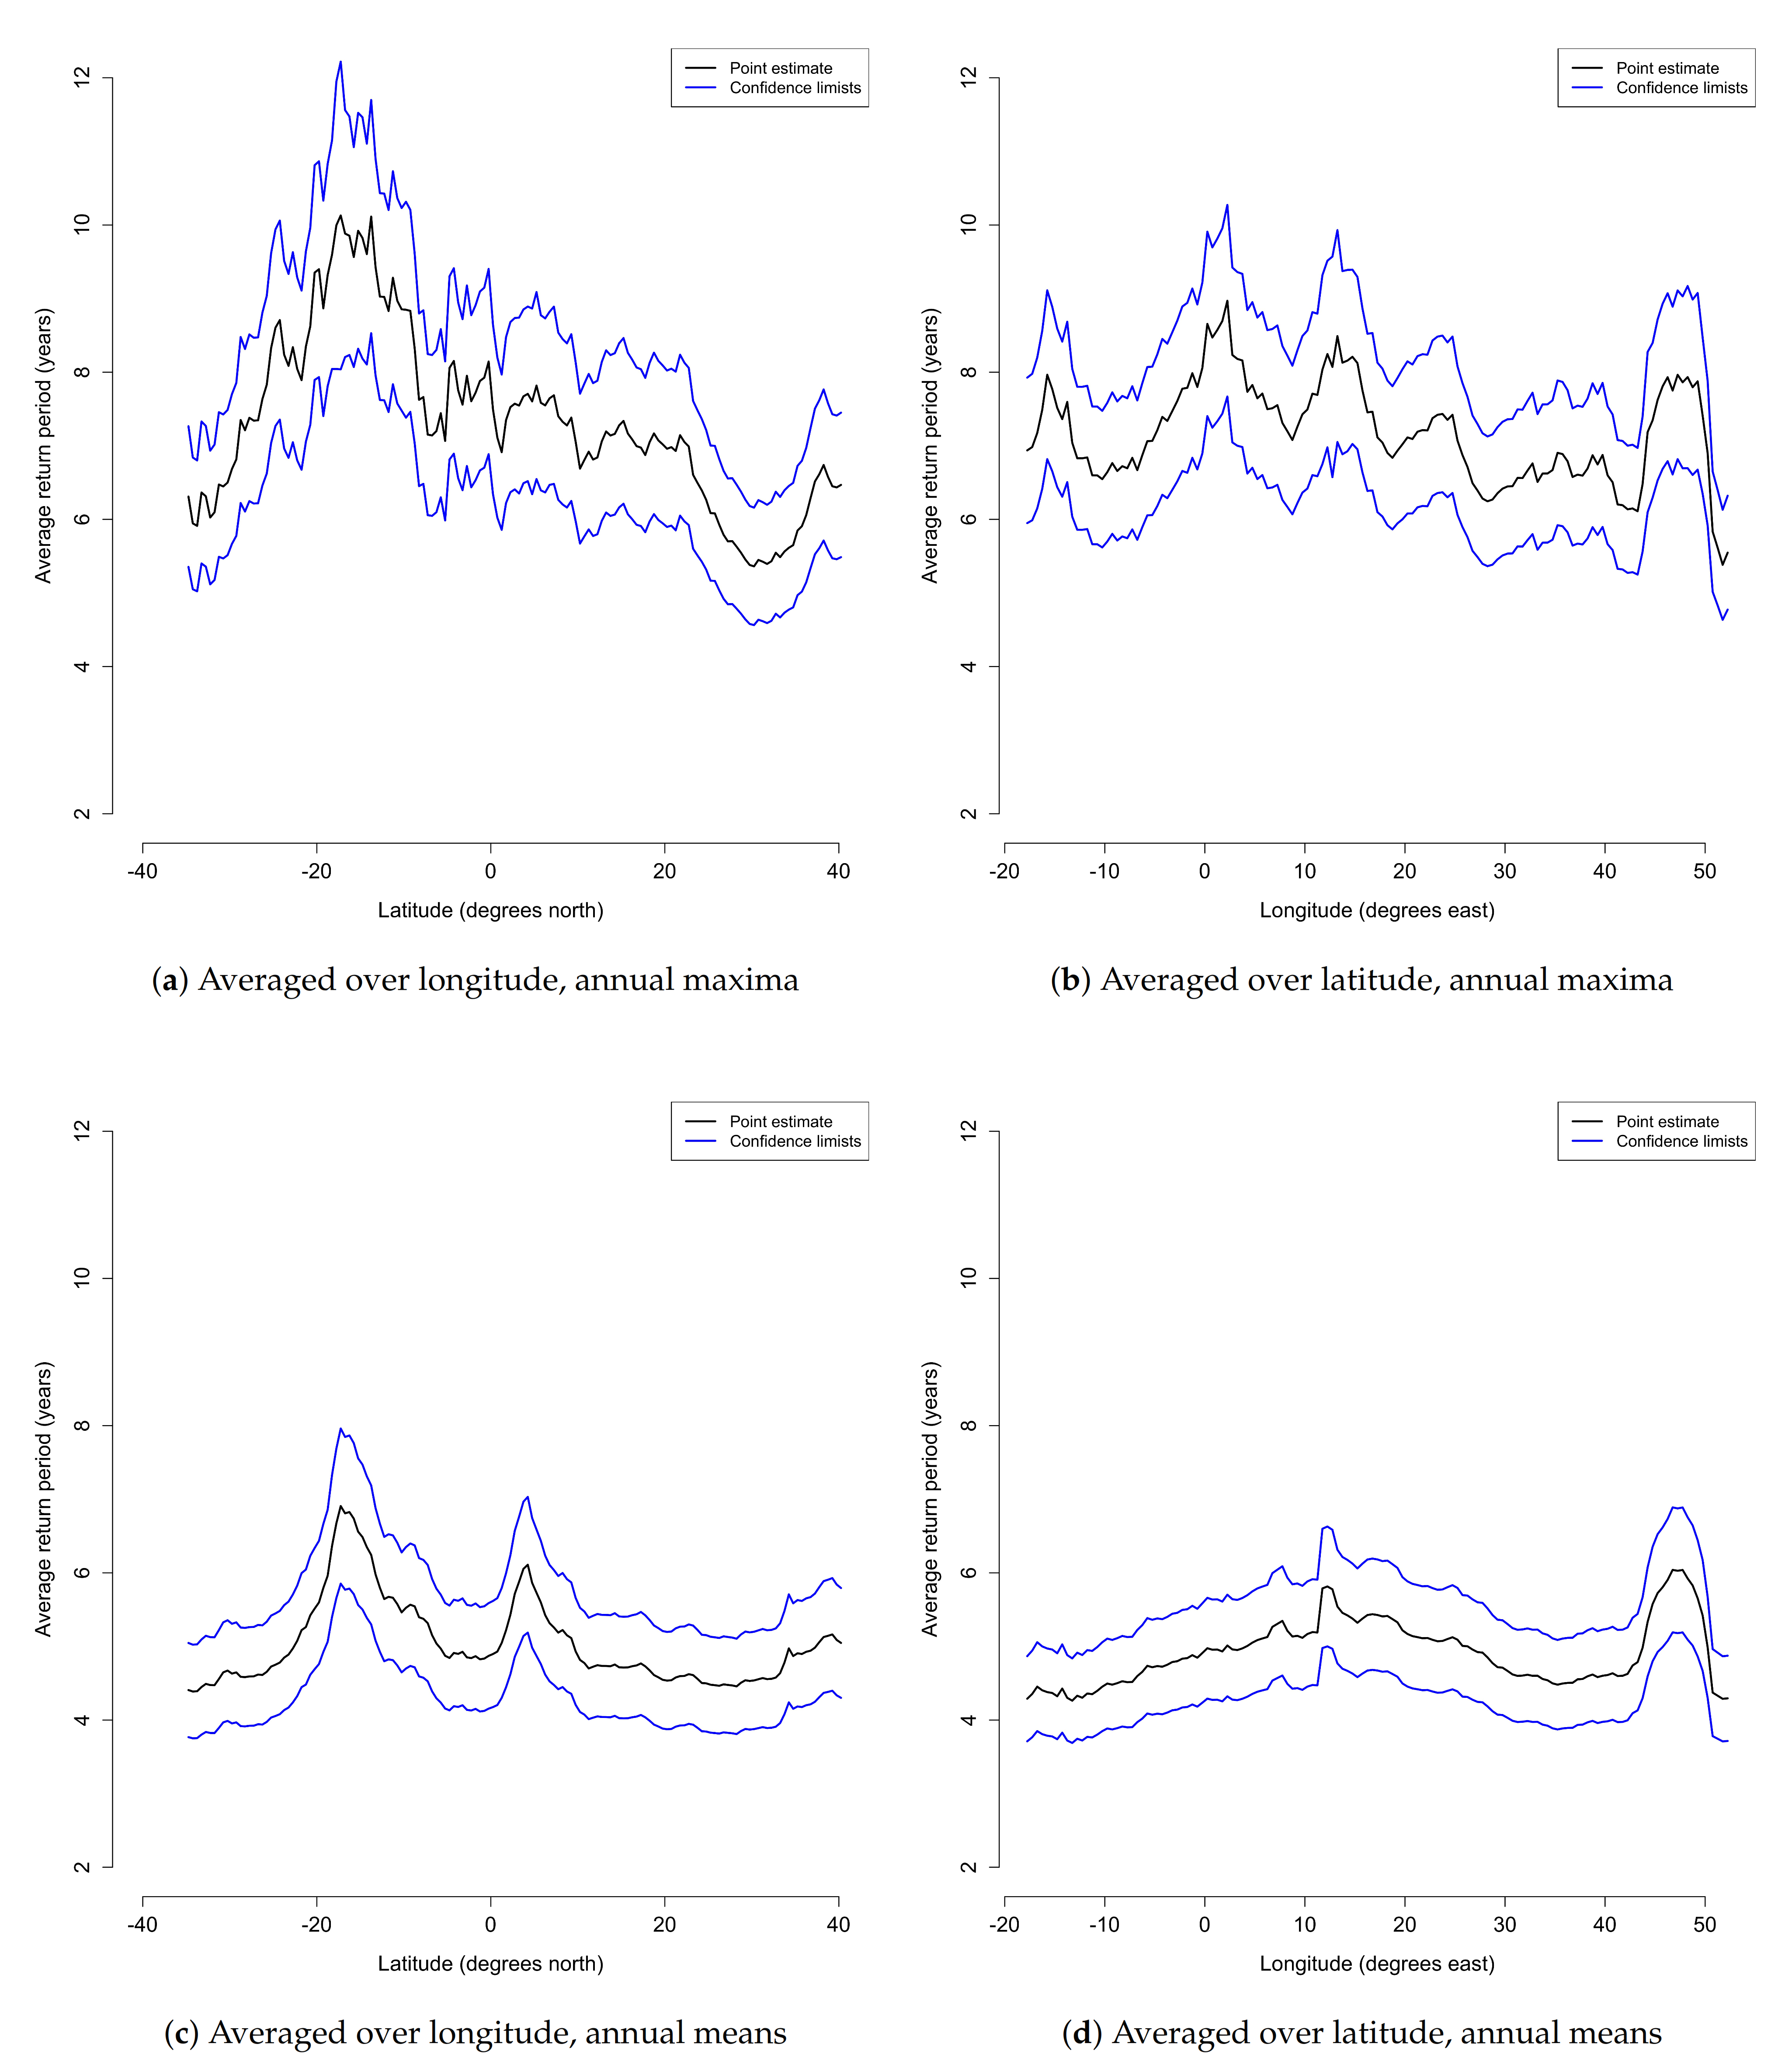
To illustrate the spacial pattern of average return periods in the region, regional averages (averaged over longitudes and/or over latitudes) and the corresponding confidence intervals of return periods based on are given in Figure 10. These averages are computed over areas with different climates. Therefore, they describe all those places together—not a single place. The aim of this analysis is to give an overall insight about how the average return period changes when we move along longitudes/latitudes, in addition to the gridpoint-specific results presented earlier (Figure 7 and Figure 8). The result showed that the average return period is relatively shorter in the southern Africa region (south of 20 south) and northern Africa region (between 20 and 35 north), particularly for extremes in annual mean (Figure 10a,c). The average return period as a function of longitude varied in the range of about 6 to 8 years for extremes in annual maximum and about 4 to 5 years for extremes in the annual mean temperature, at 95% confidence.
On the other hand, the average return period is shorter at west-central and east-central parts of the region for both series (Figure 10b,d). Specifically, the average return period is relatively shorter for places between 25 E and 40 E and between 5 W and 15 W. At these locations, the average return period is between 6 and 7 years for extreme in annual maximum and between 4 and 5 years for those in annual mean at 95% confidence.
These averages are, generally, shorter for extreme in annual mean than those in annual maximum. In other words, extremes in annual mean temperature are occurring, on average, faster than the extremes in annual maximum temperature. This also supports the projected warming trends across the region [39]. Because climate change is often described by change in means over longer time scales such as annual means, implication of the results of this study on extremes may be alarming to the region. This is because extreme in annual mean temperature refers to high temperature over extended period in a year, which may in turn be followed/accompanied by frequent drought [35,36].
3.3. Exceedance Probability of Threshold Based on 1901–2019 Temperature Distribution
One of the objectives of this study is to assess if there is a change in frequency and therefore exceedance probability of extremes with time. In Section 3.1, retrospective estimates of probability of 3 exceedances in the first 19 years period (2001–2019), using historical observations over 1901–2000 as training data, were presented. Similarly, this section discusses estimated exceedance probabilities over the second 19 years’ period (2020–2038) using 1901–2019 as sample period. The two estimation periods are chosen to be of equal length, 19 years, to make the comparison of exceedance probabilities more sensible.
Using techniques discussed in Section 2.2, Equation (1), probability of exceedance of a new threshold (the 90th percentile of distribution over 1901–2019) is estimated. We present probability of 3 exceedances as before. The values of n and k, therefore, remain the same as in Section 3.1. Here, the maximum value of N at a point would be 119, while m would be the position of the new threshold, anywhere between 1 and N. Size of the new threshold is higher than the one used in previous two sections over most parts of the region (see Figure 2e,f).
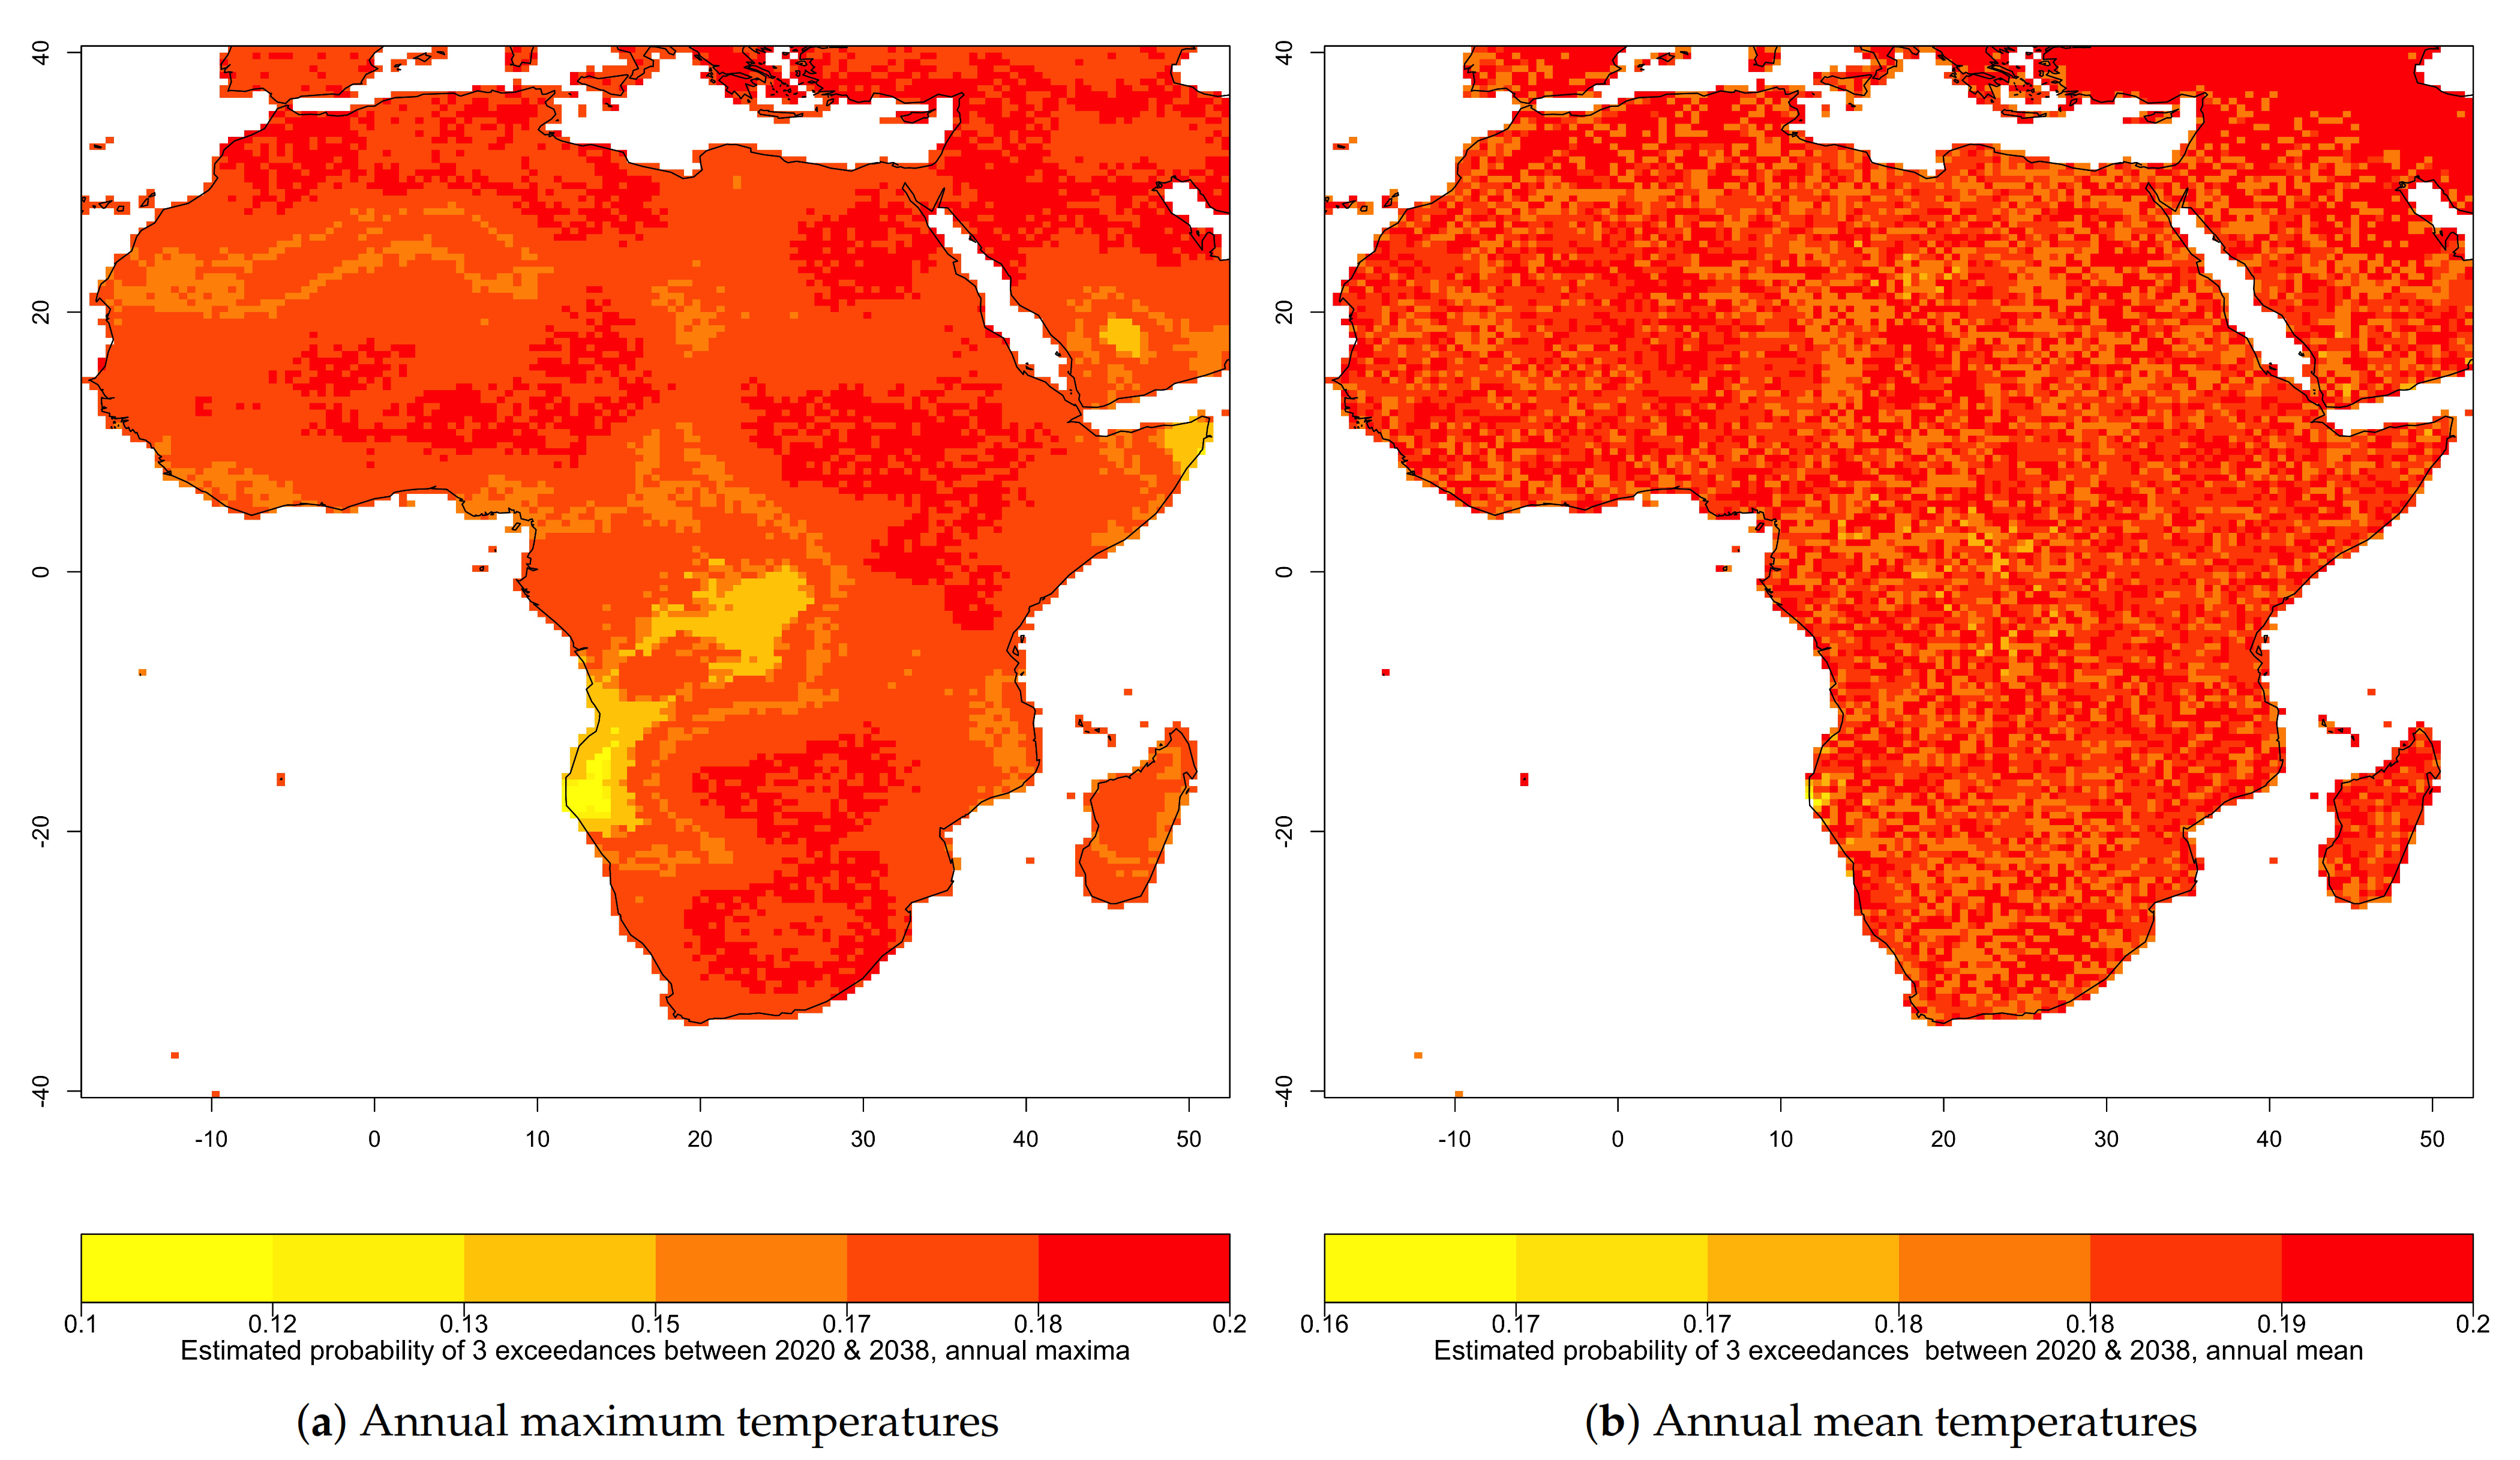
Figure 11a,b show the estimated probability of 3 exceedances of the new extreme in annual maximum and annual mean temperatures, respectively. It can be seen that there is a 10–19% chance of having 3 exceedances of extreme in annual maximum temperature and a 16–20% chance for those in annual mean temperature over the period of 2020–2038. A large proportion of gridpoints have more than 18% probability of having 3 exceedances in both series.
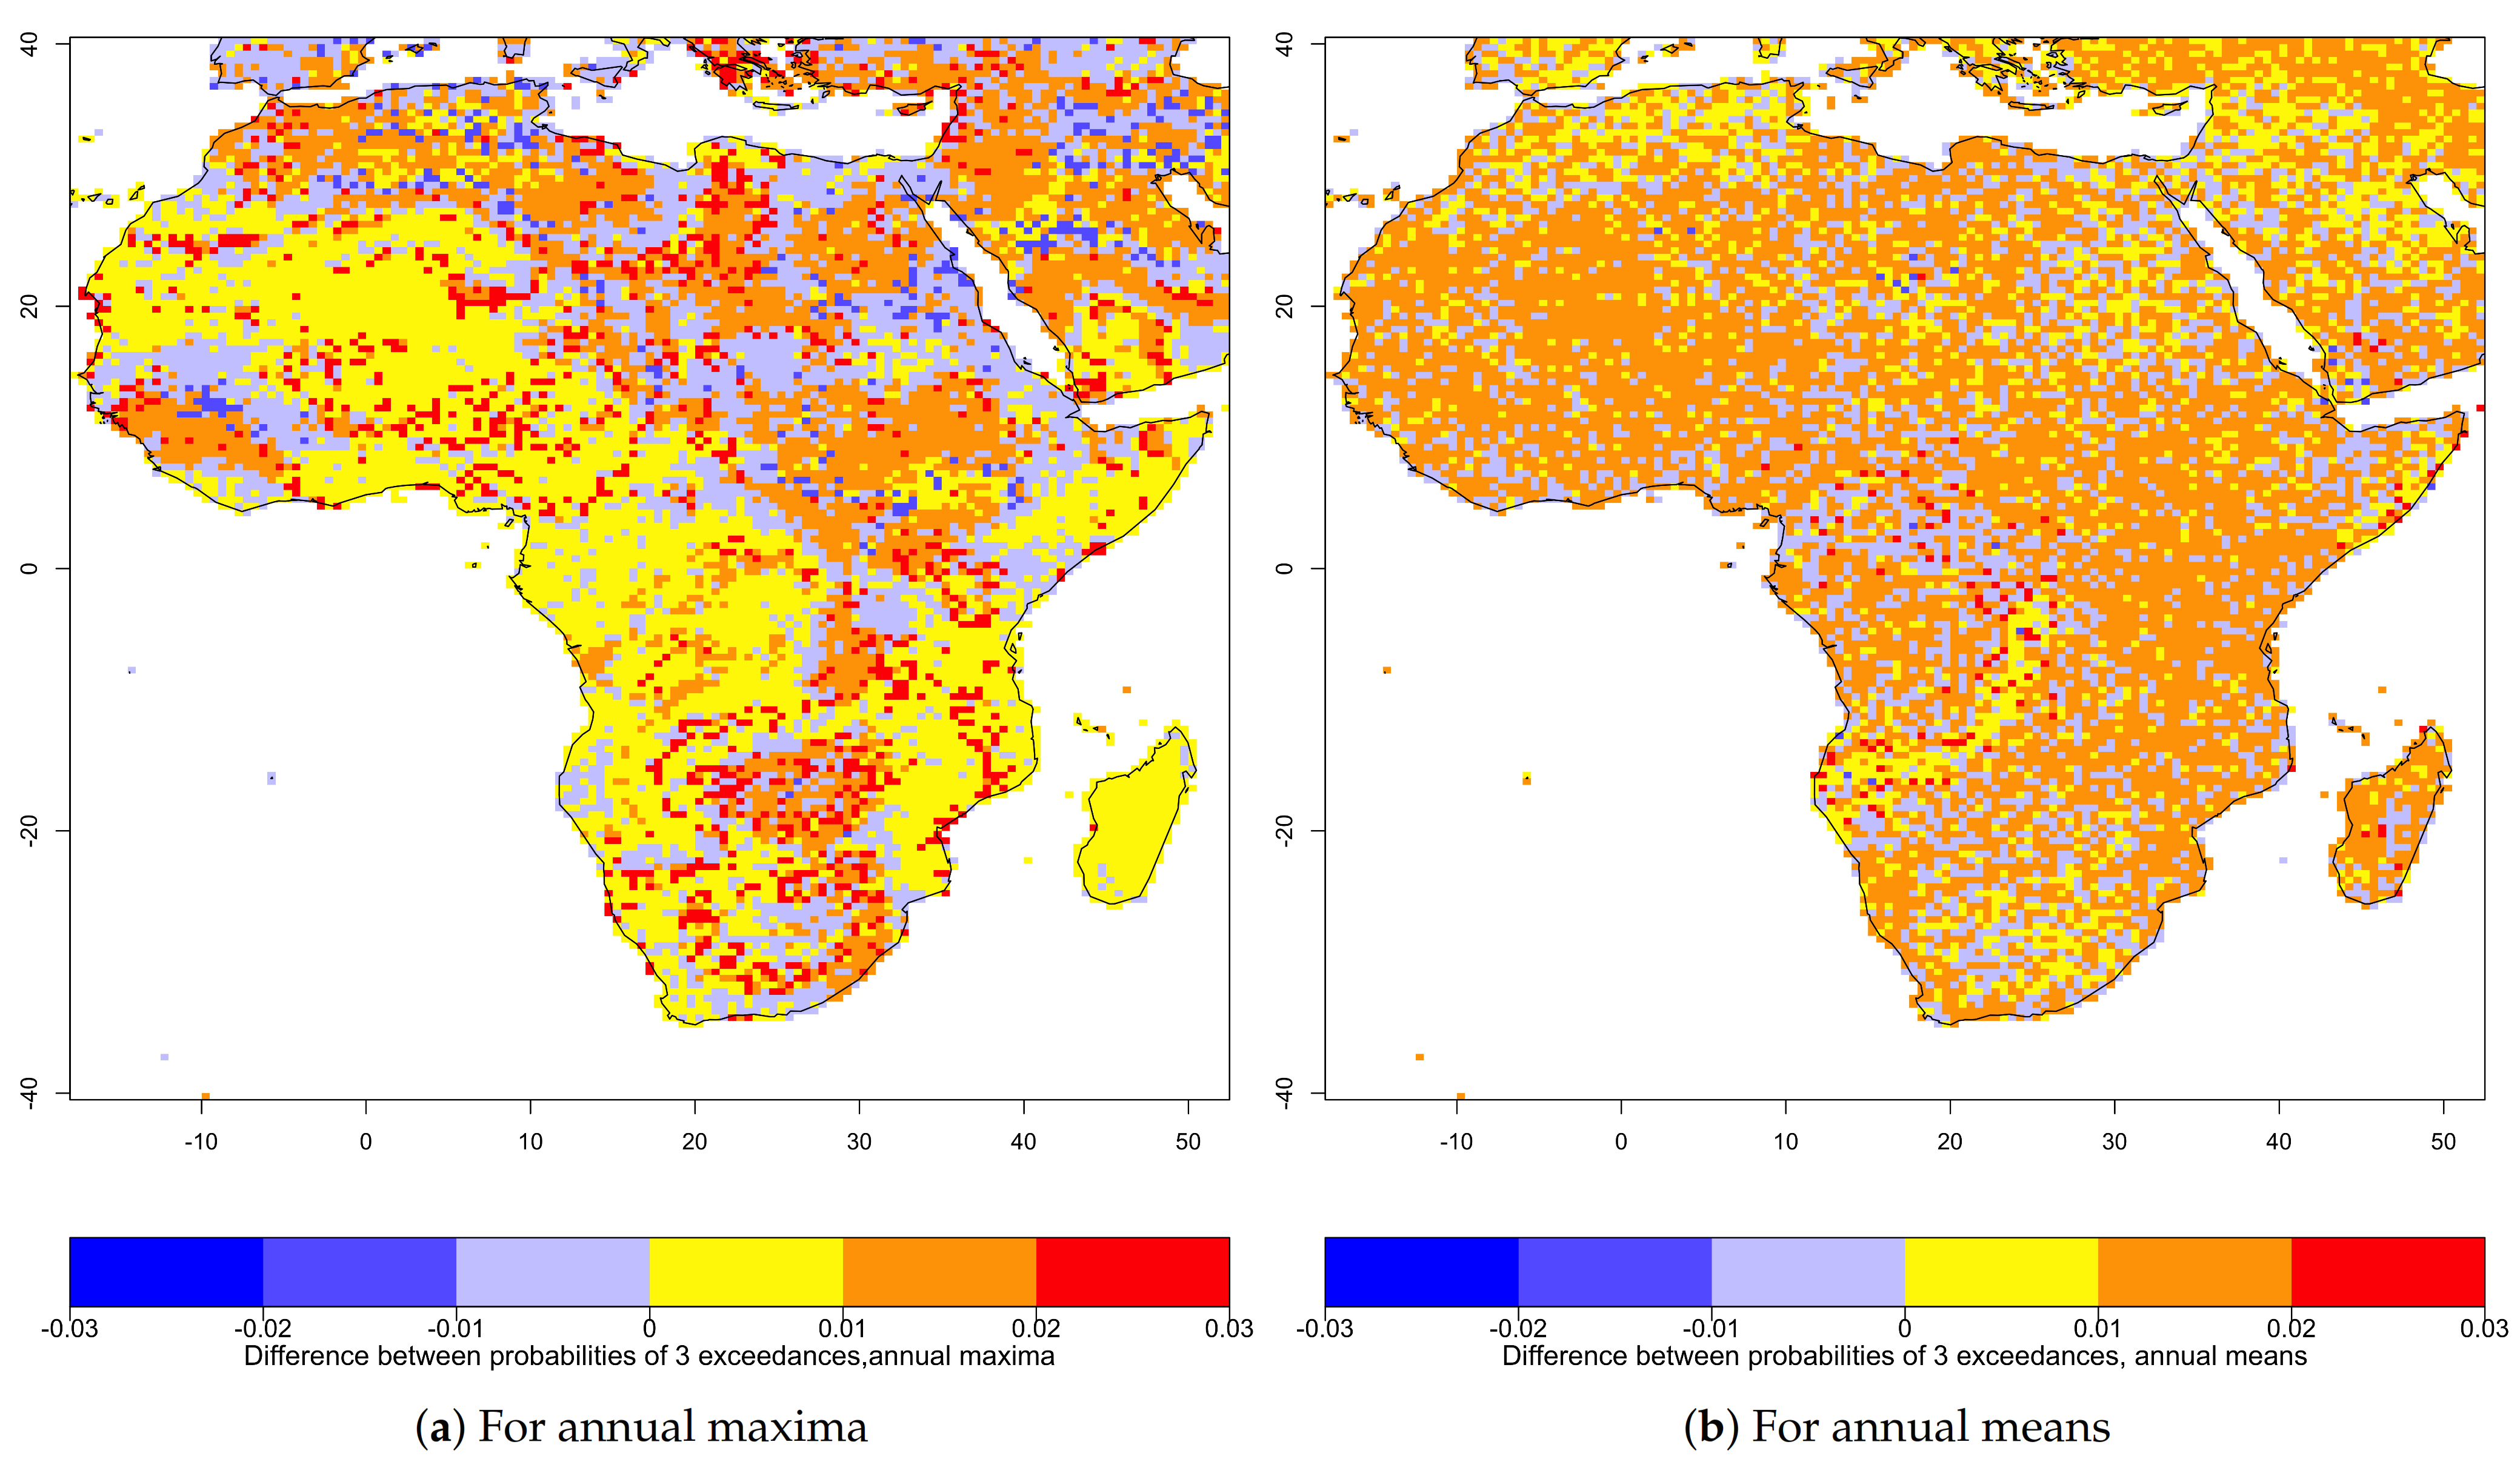
To strengthen evidence on possible change in frequency of extreme temperatures, difference between exceedance probabilities discussed in Section 3.1 and those discussed in this section are computed and shown in Figure 12. Probability of three exceedances over the period of 2020-2038 is higher, at most of the places in the region, than probability of three exceedances over the period of 2001–2019. Negative differences (blue colored) can also be seen in a fewer but still considerable number of places for extremes in annual maxima (see Figure 12a). This could, however, be partly attributed to the fact that the threshold used to estimate exceedance probability for the second 19 years period is relatively higher than the one used for the first 19 years period (see Figure 2e,f), which in turn may lower the probability of exceedance. If all other things (including climate) remain the same, exceeding a higher threshold is normally less likely compared to the one for lower threshold. Overall, these results are in agreement with those in Section 3.2. Because change in frequency of extreme temperature can also be described in terms of length of its return period. Therefore, results in this study do generally indicate that frequency of extreme temperature has a considerable tendency of increasing through time over the African region.
Probability of three exceedances of extremes over two different 19-year periods and return periods using ECDFs based on two distributions were used to illustrate results in this work. Estimates of these quantitative characteristics (exceedance probability and return period) have been seen to have, more or less, similar qualitative features for different number of exceedances over future periods of differing lengths. In other words, the presented changes in probability of exceedance and return periods hold the same for different values of N, k, n and a given value of threshold.
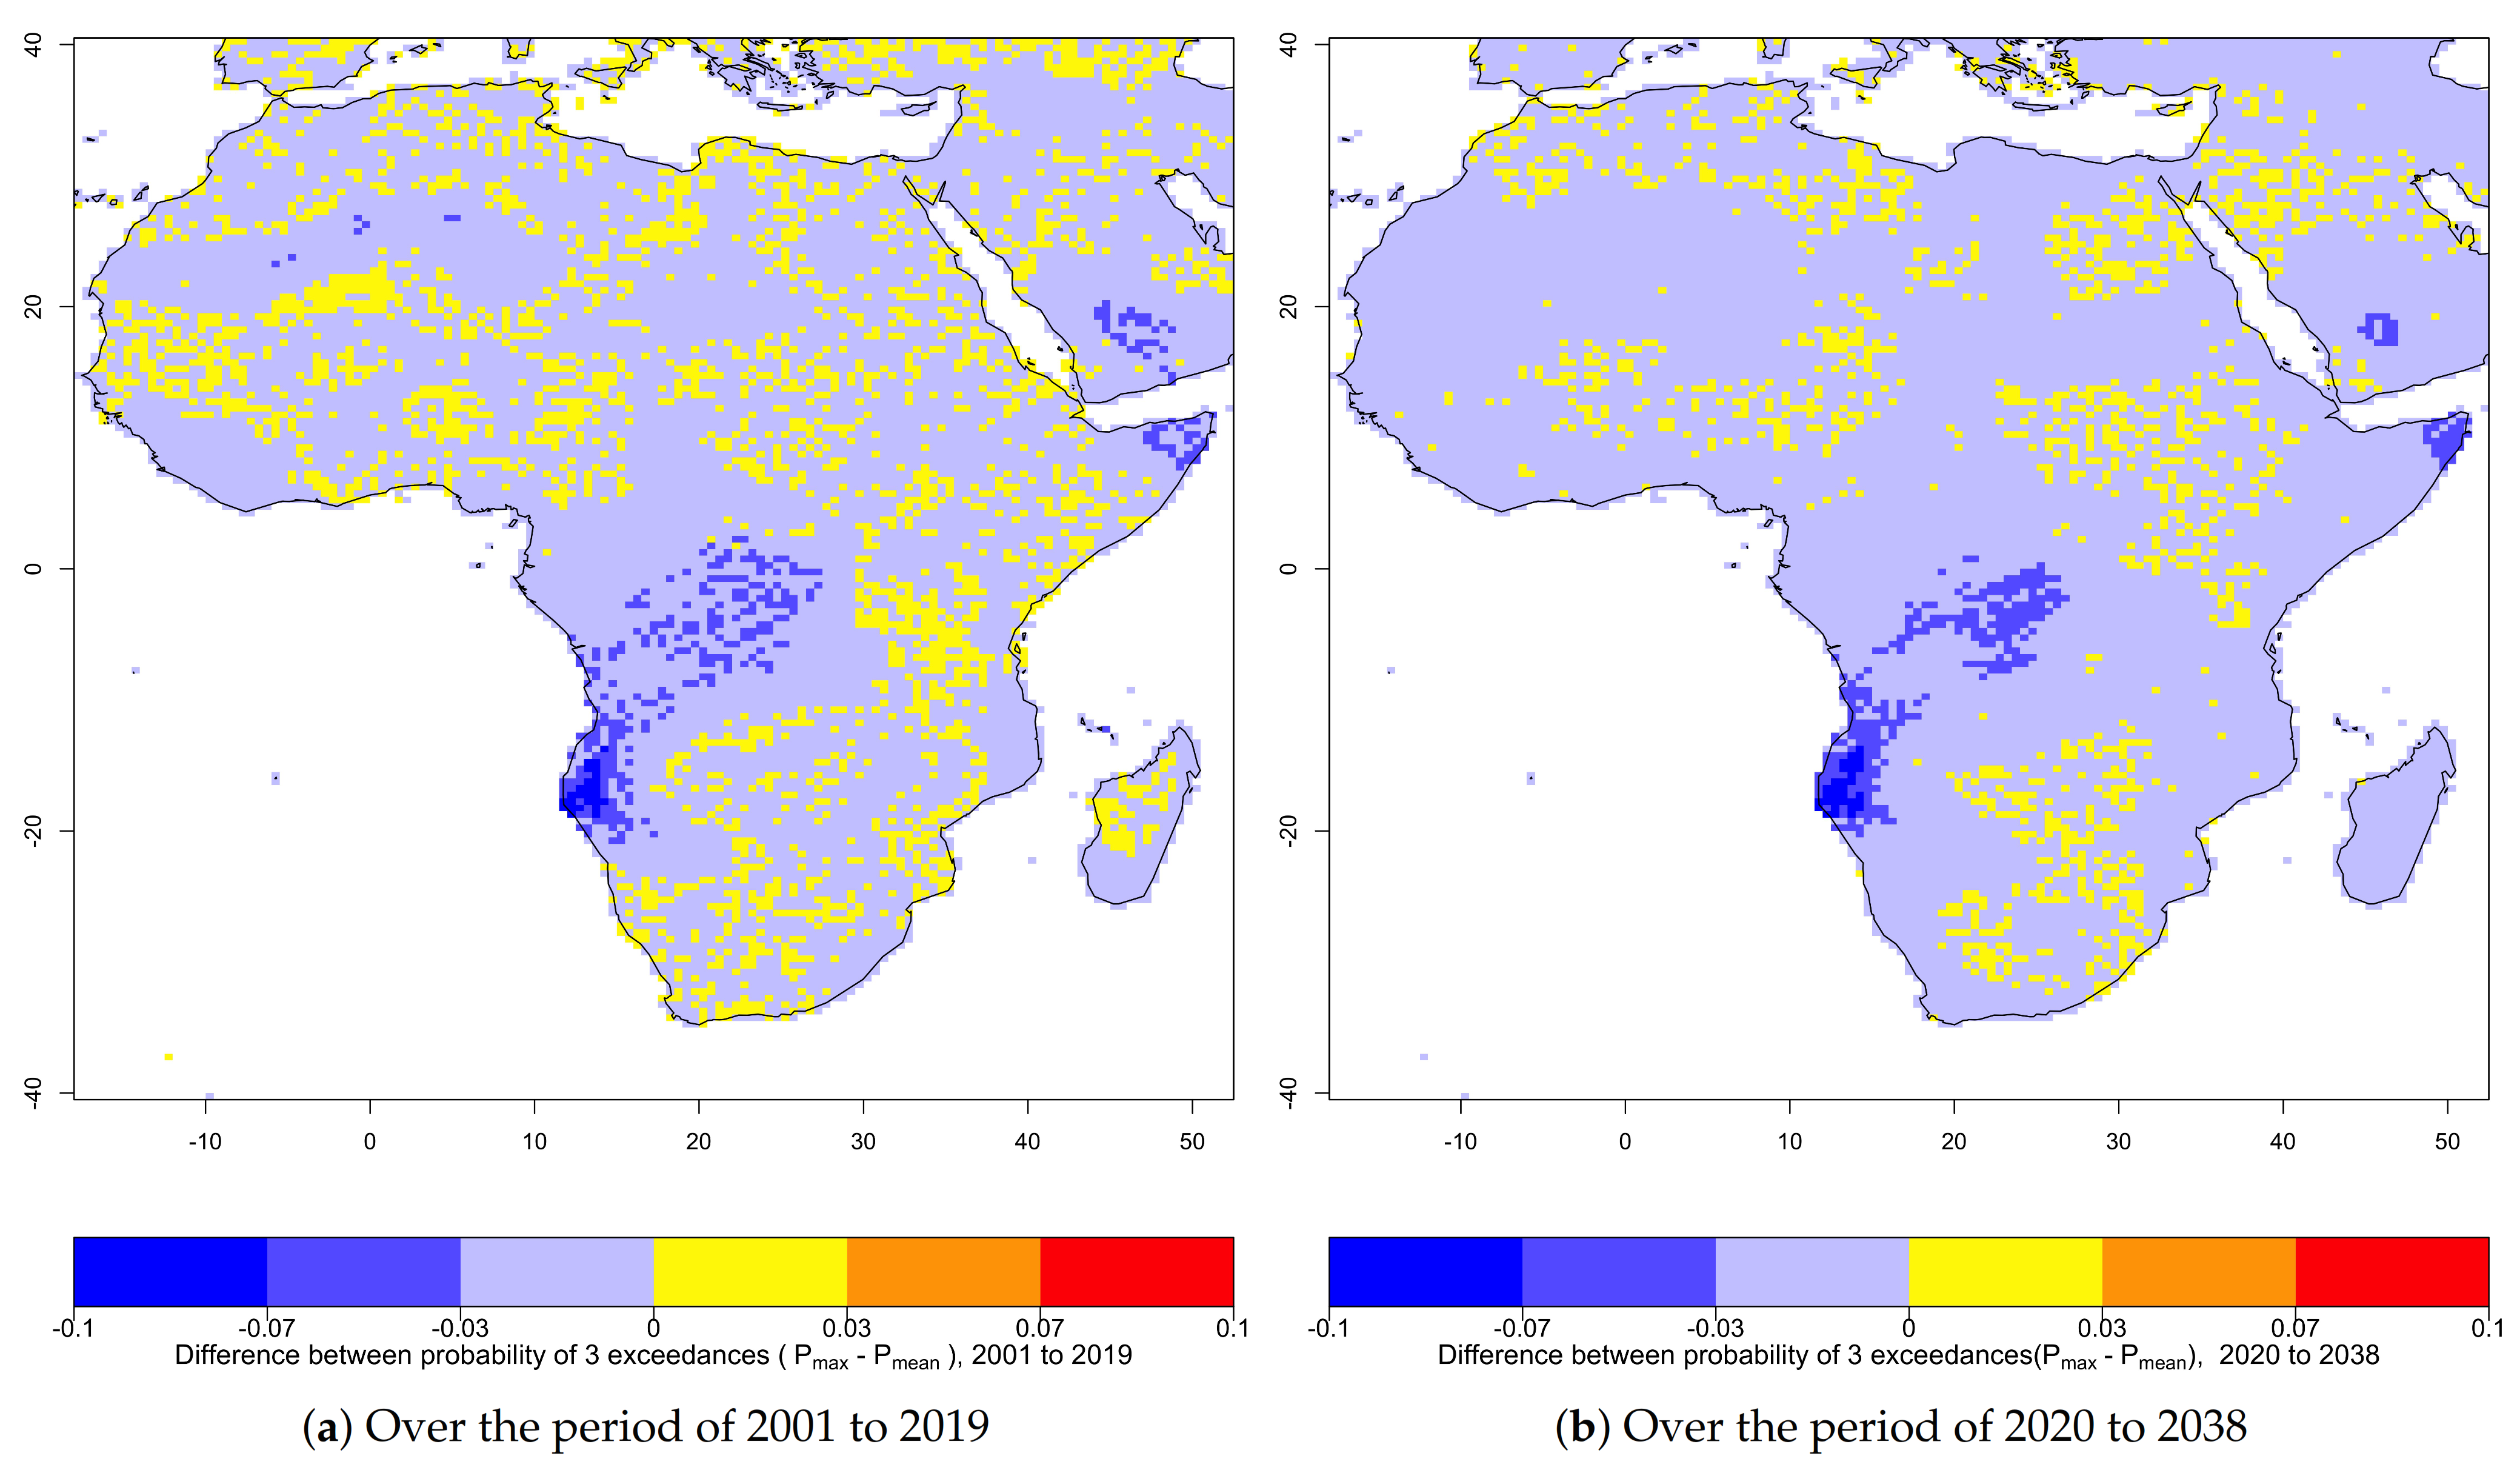
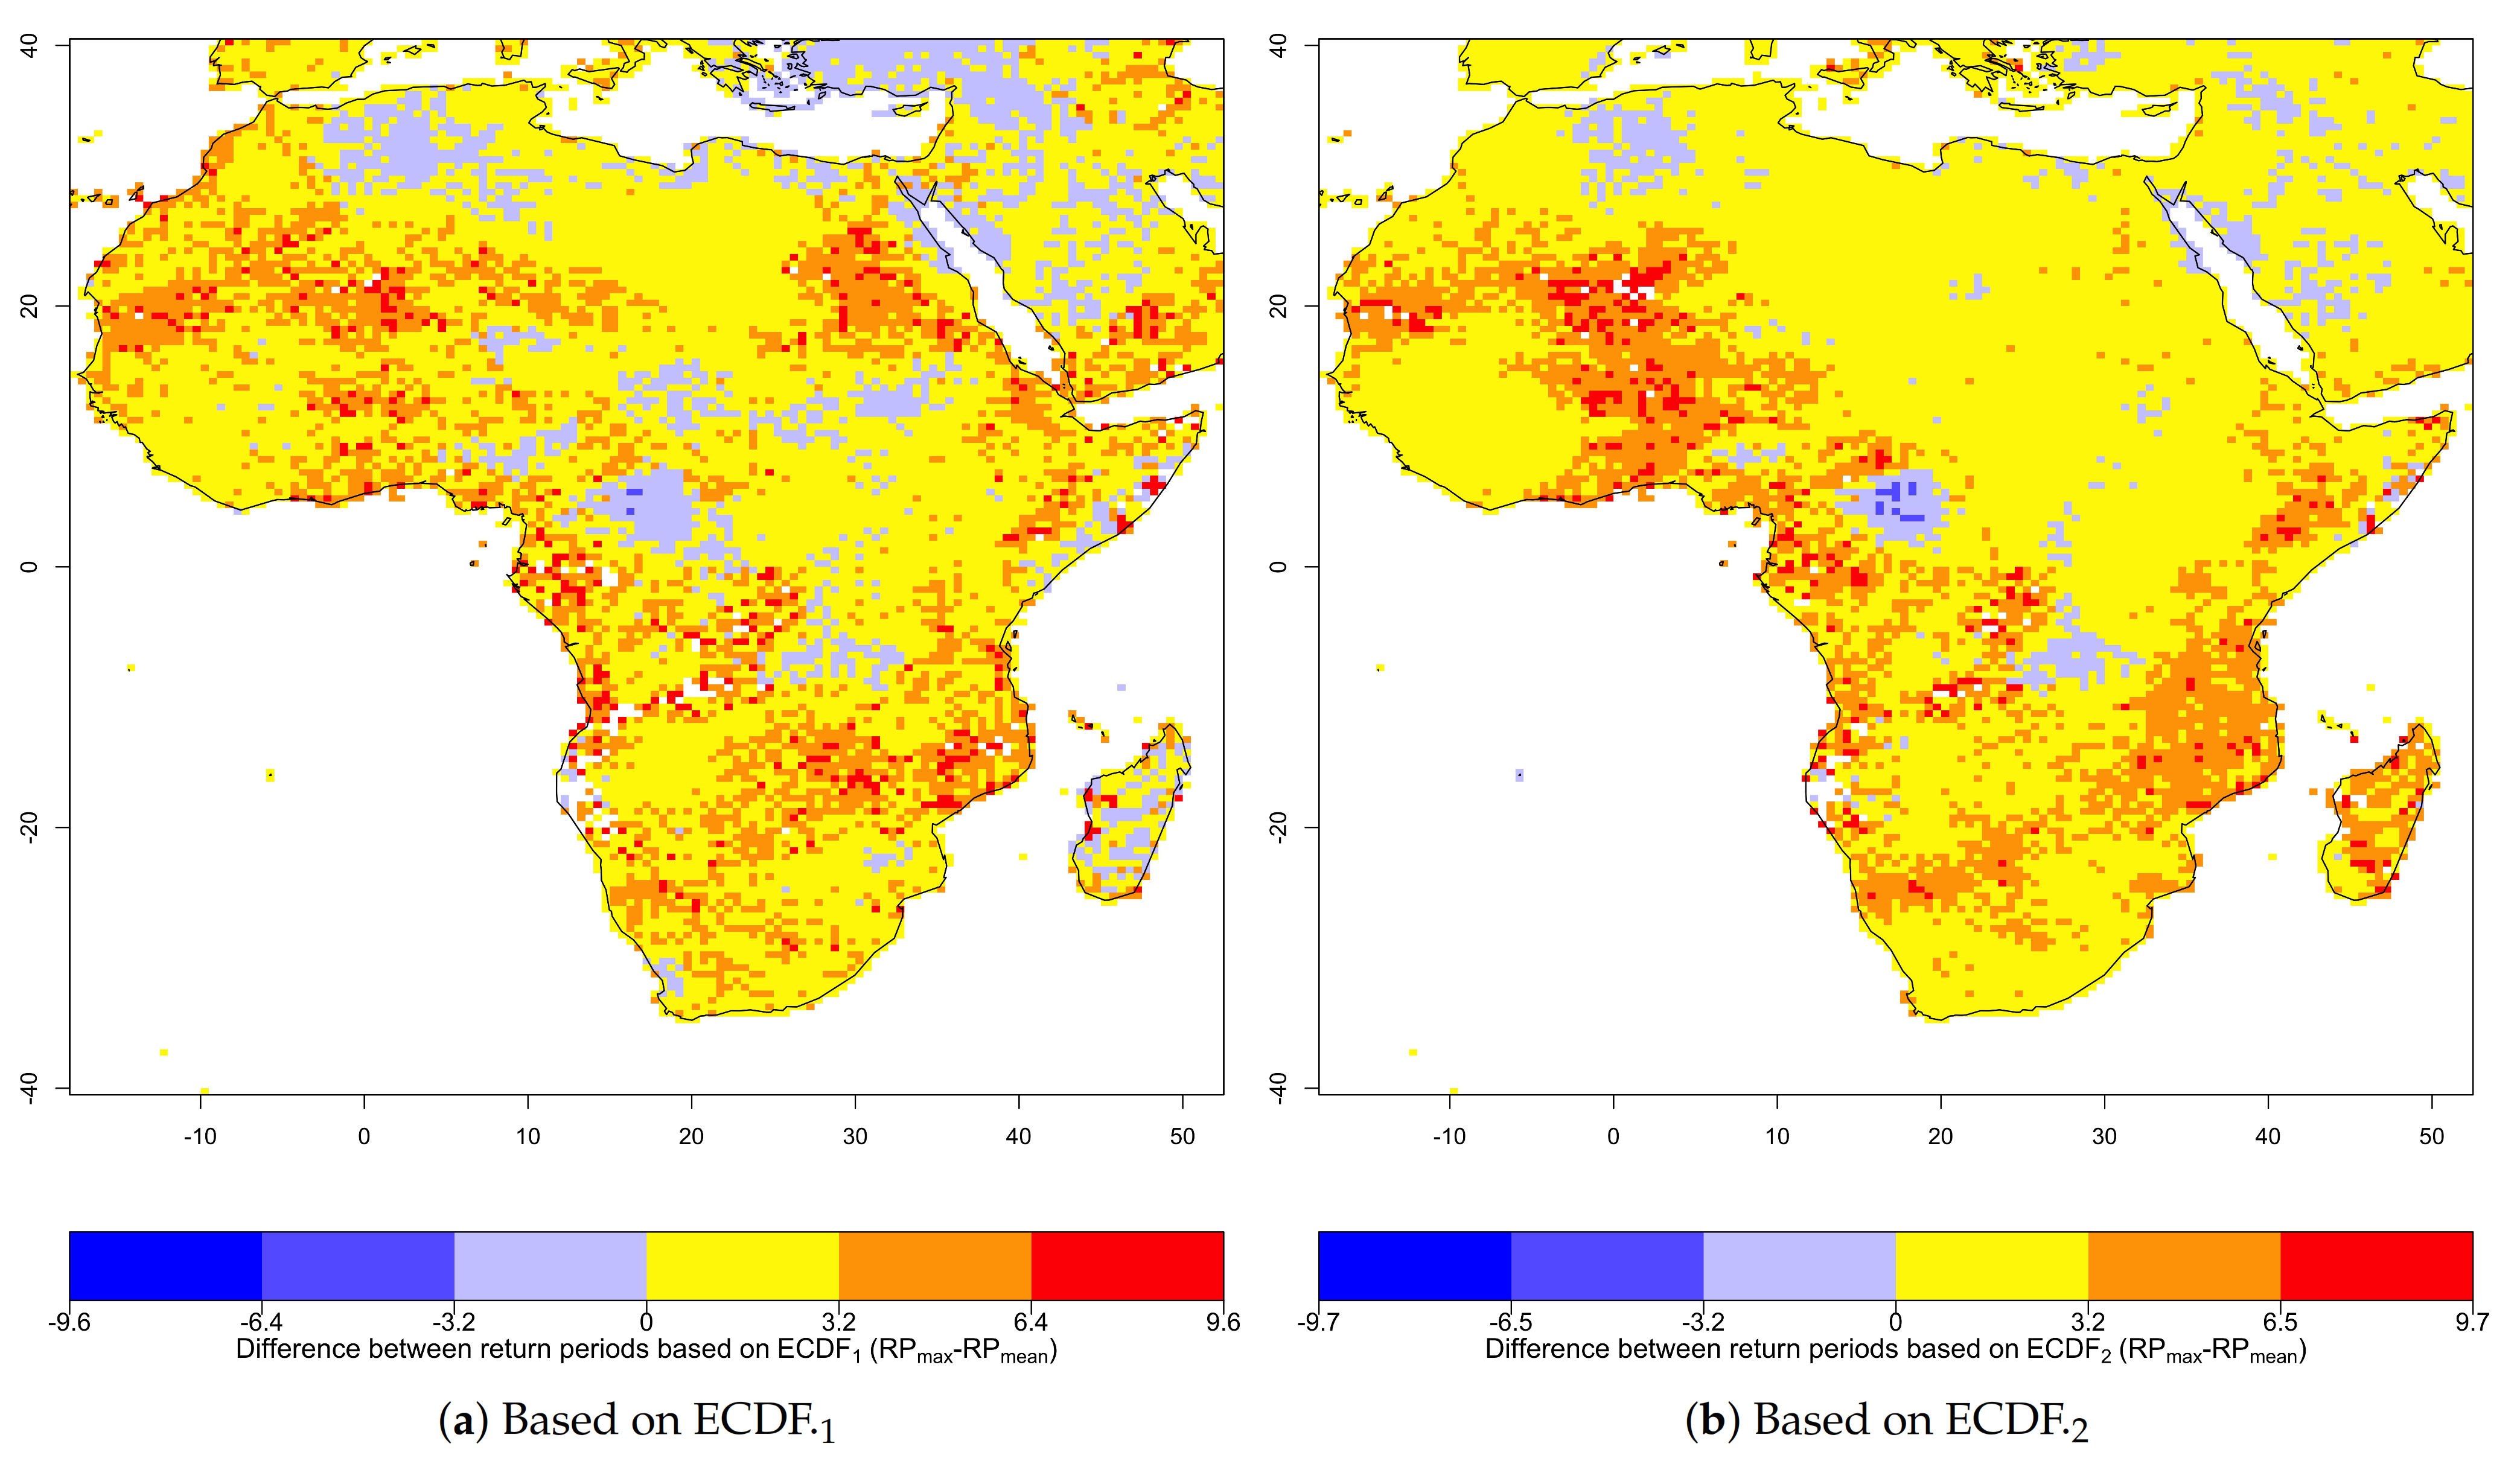
This study also showed that extremes in annual mean temperature have higher probability of exceedance and shorter return period as compared to extremes in annual maximums (see Figure 13 and Figure 14). This could have significant impact on the society because it implies high temperature over extended period of time (longer duration) with more frequency.
To evaluate and address the effect (if any) of non-stationarity on the estimates, we analyzed both differenced and undifferenced series and found no significant difference between the estimates. This may also be attributed to the estimation method employed (purely data-driven nonparametric method) and a very large training sample size used in this study.
4. Summary
The African region is one of the most affected regions by frequent droughts, which usually follows months of high temperature conditions [40]. The highest temperature, in most places of the region, was observed in the last 2–3 decades of the sample period (1901–2019). In this study, analyses based on numerical estimates of exceedance probability and return period of extreme temperatures over the region were conducted to examine potential changes in these quantities with time.
The results showed that the probability of 3 exceedances over the `next’ 19 years period are found to be 10–19% for extremes in annual maximum temperatures and 15–20% for extremes in annual mean temperatures. The return periods of these extremes, according to the latest distribution of temperatures, were estimated to be as short as 4.1 and 4.2 years, respectively, for extremes in annual mean temperature and annual maximum temperature at most of the gridpoints in the region (see Figure 7b and Figure 8b). In addition, the results indicated that the probability of exceedance of threshold temperature has an increasing trend with time. This was also supported by the results from the analysis of the return period. In other words, the analysis of the historical data showed that the return periods of the extremes are considerably shorter in the more recent years as compared to the earlier years, for both annual maxima and annual means. These results are also consistent with the IPCC’s projected rise in temperature and frequency of extremes [12,41]. In terms of cross-sectional comparison between the two series, the return period of extremes in annual mean is relatively shorter than the return period of extremes in annual maximum. This information could help in addressing the ever-increasing temperature extremes and potential impacts of climate change in the African region.
In addition to temporal change in return period, the results in this study also showed spacial variations in average return period within the study area. Average return period of extremes in both annual maximum and mean temperatures were found to be relatively shorter in southern and northern Africa.
Funding
This research received no external funding.
Data Availability Statement
The data used in this study are available at the KNMI Climate Explorer http://climexp.knmi.nl/start.cgi (accessed on 11 August 2020), Monthly observations. Temperature: CRU TS 4.04 (land) 0.5 and Tmax: CRU TS 4.04 (land) 0.5.
Conflicts of Interest
The author declare no conflict of interest.
References
- Field, C.B.; Barros, V.; Stocker, T.F.; Dahe, Q. Managing the Risks of Extreme Events and Disasters to Advance Climate Change Adaptation: Special Report of the IPCC; Cambridge University Press: Cambridge, UK, 2012. [Google Scholar]
- Alexander, L.; Zhang, X.; Peterson, T.; Caesar, J.; Gleason, B.; Klein Tank, A.; Haylock, M.; Collins, D.; Trewin, B.; Rahimzadeh, F.; et al. Global observed changes in daily climate extremes of temperature and precipitation. J. Geophys. Res. Atmos. 2006, 111. [Google Scholar] [CrossRef] [Green Version]
- Yan, Z.; Jones, P.; Davies, T.; Moberg, A.; Bergström, H.; Camuffo, D.; Cocheo, C.; Maugeri, M.; Demarée, G.; Verhoeve, T.; et al. Trends of Extreme Temperatures in Europe and China based on Daily Observations. In Improved Understanding of Past Climatic Variability from Early Daily European Instrumental Sources; Springer: New York, NY, USA, 2002; pp. 355–392. [Google Scholar]
- Kaper, H.; Engler, H. Mathematics & Climate; SIAM: Philadelphia, PA, USA, 2013. [Google Scholar]
- Abarbanel, H.; Koonin, S.; Levine, H.; MacDonald, G.; Rothaus, O. Statistics of Extreme Events with Application to Climate; Technical Report; DTIC Document: McLean, VA, USA, 1992. [Google Scholar]
- Kunkel, K.E.; Pielke Jr, R.A.; Changnon, S.A. Temporal fluctuations in weather and climate extremes that cause economic and human health impacts: A review. Bull. Am. Meteorol. Soc. 1999, 80, 1077–1098. [Google Scholar] [CrossRef] [Green Version]
- Yin, H.; Sun, Y.; Wan, H.; Zhang, X.; Lu, C. Detection of anthropogenic influence on the intensity of extreme temperatures in China. Int. J. Climatol. 2017, 37, 1229–1237. [Google Scholar] [CrossRef]
- Donat, M.G.; Sillmann, J.; Wild, S.; Alexander, L.V.; Lippmann, T.; Zwiers, F.W. Consistency of temperature and precipitation extremes across various global gridded in situ and reanalysis datasets. J. Clim. 2014, 27, 5019–5035. [Google Scholar] [CrossRef]
- Easterling, D.R.; Meehl, G.A.; Parmesan, C.; Changnon, S.A.; Karl, T.R.; Mearns, L.O. Climate extremes: Observations, modeling, and impacts. Science 2000, 289, 2068–2074. [Google Scholar] [CrossRef] [PubMed] [Green Version]
- Changnon, S.A.; Pielke, R.A., Jr.; Changnon, D.; Sylves, R.T.; Pulwarty, R. Human factors explain the increased losses from weather and climate extremes. Bull. Am. Meteorol. Soc. 2000, 81, 437–442. [Google Scholar] [CrossRef] [Green Version]
- Mirza, M.M.Q. Climate change and extreme weather events: Can developing countries adapt? Clim. Policy 2003, 3, 233–248. [Google Scholar] [CrossRef]
- Nangombe, S.; Zhou, T.; Zhang, W.; Wu, B.; Hu, S.; Zou, L.; Li, D. Record-breaking climate extremes in Africa under stabilized 1.5° C and 2° C global warming scenarios. Nat. Clim. Chang. 2018, 8, 375. [Google Scholar] [CrossRef]
- Russo, S.; Marchese, A.F.; Sillmann, J.; Immé, G. When will unusual heat waves become normal in a warming Africa? Environ. Res. Lett. 2016, 11, 054016. [Google Scholar] [CrossRef]
- Barros, V.; Field, C.; Dokke, D.; Mastrandrea, M.; Mach, K.; Bilir, T.E.; Chatterjee, M.; Ebi, K.; Estrada, Y.; Genova, R.; et al. Climate Change 2014: Impacts, Adaptation, and Vulnerability. Part B: Regional Aspects. Contribution of Working Group II to the Fifth Assessment Report of the Intergovernmental Panel on Climate Change; Cambridge University Press: Cambridge, UK, 2014; Chapter 22. [Google Scholar]
- McCarthy, J.J.; Canziani, O.F.; Leary, N.A.; Dokken, D.J.; White, K.S. Climate Change 2001: Impacts, Adaptation, and Vulnerability: Contribution of Working Group II to the Third Assessment Report of the Intergovernmental Panel on Climate Change; Cambridge University Press: Cambridge, UK, 2001. [Google Scholar]
- Russo, S.; Dosio, A.; Graversen, R.G.; Sillmann, J.; Carrao, H.; Dunbar, M.B.; Singleton, A.; Montagna, P.; Barbola, P.; Vogt, J.V. Magnitude of extreme heat waves in present climate and their projection in a warming world. J. Geophys. Res. Atmos. 2014, 119, 12–500. [Google Scholar] [CrossRef] [Green Version]
- New, M.; Hewitson, B.; Stephenson, D.B.; Tsiga, A.; Kruger, A.; Manhique, A.; Gomez, B.; Coelho, C.A.; Masisi, D.N.; Kululanga, E.; et al. Evidence of trends in daily climate extremes over southern and west Africa. J. Geophys. Res. Atmos. 2006, 111. [Google Scholar] [CrossRef]
- Sillmann, J.; Kharin, V.; Zhang, X.; Zwiers, F.; Bronaugh, D. Climate extremes indices in the CMIP5 multimodel ensemble: Part 1. Model evaluation in the present climate. J. Geophys. Res. Atmos. 2013, 118, 1716–1733. [Google Scholar] [CrossRef]
- Frich, P.; Alexander, L.V.; Della-Marta, P.; Gleason, B.; Haylock, M.; Tank, A.K.; Peterson, T. Observed coherent changes in climatic extremes during the second half of the twentieth century. Clim. Res. 2002, 19, 193–212. [Google Scholar] [CrossRef] [Green Version]
- Kruger, A.; Sekele, S. Trends in extreme temperature indices in South Africa: 1962–2009. Int. J. Climatol. 2013, 33, 661–676. [Google Scholar] [CrossRef]
- Harris, I.; Osborn, T.J.; Jones, P.; Lister, D. Version 4 of the CRU TS monthly high-resolution gridded multivariate climate dataset. Sci. Data 2020, 7, 1–18. [Google Scholar] [CrossRef] [PubMed] [Green Version]
- Dodge, Y. The Oxford Dictionary of Statistical Terms; Oxford University Press: Oxford, UK, 2006. [Google Scholar]
- Kunreuther, H. Risk analysis and risk management in an uncertain world 1. Risk Anal. Int. J. 2002, 22, 655–664. [Google Scholar] [CrossRef]
- Lambert, J.H.; Li, D.; Haimes, Y.Y. Risk of Extreme Flood Losses under Uncertain Physical Conditions. In Engineering Risk in Natural Resources Management; Springer: New York, NY, USA, 1994; pp. 321–329. [Google Scholar]
- Coles, S. An Introduction to Statistical Modeling of Extreme Values; Springer: New York, NY, USA, 2001. [Google Scholar]
- Morris, S.A.; Reich, B.J.; Thibaud, E.; Cooley, D. A space-time skew-t model for threshold exceedances. Biometrics 2017, 73, 749–758. [Google Scholar] [CrossRef] [PubMed] [Green Version]
- Davison, A.C.; Smith, R.L. Models for exceedances over high thresholds. J. R. Stat. Soc. Ser. B 1990, 52, 393–442. [Google Scholar] [CrossRef]
- Draghicescu, D.; Ignaccolo, R. Modeling threshold exceedance probabilities of spatially correlated time series. Electron. J. Stat. 2009, 3, 149–164. [Google Scholar] [CrossRef]
- Peres, D.J.; Cancelliere, A. Estimating return period of landslide triggering by Monte Carlo simulation. J. Hydrol. 2016, 541, 256–271. [Google Scholar] [CrossRef]
- Nabaei, S.; Sharafati, A.; Yaseen, Z.M.; Shahid, S. Copula based assessment of meteorological drought characteristics: Regional investigation of Iran. Agric. For. Meteorol. 2019, 276, 107611. [Google Scholar] [CrossRef]
- Eslamian, S. Handbook of Engineering Hydrology: Modeling, Climate Change, and Variability; CRC Press: Boca Raton, FL, USA, 2014. [Google Scholar]
- Gumbel, E.J. The return period of flood flows. Ann. Math. Stat. 1941, 12, 163–190. [Google Scholar] [CrossRef]
- Casella, G.; Berger, R.L. Statistical Inference, 2nd ed.; Duxbury Pacific Grove: Pacific Grove, CA, USA, 2002. [Google Scholar]
- Wilks, D.S. Statistical Methods in the Atmospheric Sciences, 3rd ed.; Academic Press: Oxford, UK, 2011. [Google Scholar]
- Machado, S.; Paulsen, G.M. Combined effects of drought and high temperature on water relations of wheat and sorghum. Plant Soil 2001, 233, 179–187. [Google Scholar] [CrossRef]
- Pradhan, G.P.; Prasad, P.V.; Fritz, A.K.; Kirkham, M.B.; Gill, B.S. Effects of drought and high temperature stress on synthetic hexaploid wheat. Funct. Plant Biol. 2012, 39, 190–198. [Google Scholar] [CrossRef]
- Barutcular, C.; El Sabagh, A.; Koc, M.; Ratnasekera, D. Relationships between grain yield and physiological traits of durum wheat varieties under drought and high temperature stress in Mediterranean conditions. Fresen. Environ. Bull. 2017, 26, 4282–4291. [Google Scholar]
- Collier, P.; Conway, G.; Venables, T. Climate change and Africa. Oxf. Rev. Econ. Policy 2008, 24, 337–353. [Google Scholar] [CrossRef]
- Collins, J.M. Temperature variability over Africa. J. Clim. 2011, 24, 3649–3666. [Google Scholar] [CrossRef] [Green Version]
- Hu, Q.; Willson, G.D. Effects of temperature anomalies on the Palmer Drought Severity Index in the central United States. Int. J. Climatol. A J. R. Meteorol. Soc. 2000, 20, 1899–1911. [Google Scholar] [CrossRef] [Green Version]
- Engelbrecht, F.; Adegoke, J.; Bopape, M.J.; Naidoo, M.; Garland, R.; Thatcher, M.; McGregor, J.; Katzfey, J.; Werner, M.; Ichoku, C.; et al. Projections of rapidly rising surface temperatures over Africa under low mitigation. Environ. Res. Lett. 2015, 10, 085004. [Google Scholar] [CrossRef]
Figure 1.
Map of the study area.

Figure 2.
The two thresholds that define extreme event in this study (90th percentiles of distributions over 1901 to 2000 and 1901 to 2019) for annual maxima and annual means; and difference between these: (a) the 90th percentile of annual maxima over 1901 to 2000, (b) the 90th percentile of annual means over 1901 to 2000, (c) the 90th percentile of annual maxima over 1901 to 2019, (d) the 90th percentile of annual means over 1901 to 2019, (e) difference between the 90th percentiles of annual maxima [c−a] and (f) difference between the 90th percentiles of annual means [d−b].


Figure 3.
Maps of maxima in annual maximum and annual mean temperatures ((a) in annual maxima and (c) in annual means), and the corresponding years in which these maxima did occur between 1901 and 2019 ((b) for annual maxima and (d) for annual means).
Figure 3.
Maps of maxima in annual maximum and annual mean temperatures ((a) in annual maxima and (c) in annual means), and the corresponding years in which these maxima did occur between 1901 and 2019 ((b) for annual maxima and (d) for annual means).


Figure 4.
Time series of the regional averages of annual maximum and annual mean temperatures for the African region over the period of 1901 to 2019: (a) Annual maxima, (b) Annual means.
Figure 4.
Time series of the regional averages of annual maximum and annual mean temperatures for the African region over the period of 1901 to 2019: (a) Annual maxima, (b) Annual means.

Figure 5.
Map of probability of 3 () exceedances, over the period of 2001 to 2019 (), of extremes in (a) annual maximum temperatures and (b) annual mean temperatures.
Figure 5.
Map of probability of 3 () exceedances, over the period of 2001 to 2019 (), of extremes in (a) annual maximum temperatures and (b) annual mean temperatures.

Figure 6.
Observed number of exceedances of the 20th century threshold, between 2001 and 2019, in (a) annual maximum temperatures and (b) annual mean temperatures.
Figure 6.
Observed number of exceedances of the 20th century threshold, between 2001 and 2019, in (a) annual maximum temperatures and (b) annual mean temperatures.

Figure 7.
Return period of extremes in annual maximum temperatures: (a) based on ECDF and (b) based on ECDF. Return period based on ECDF is shorter than that based on ECDF in most places.
Figure 7.
Return period of extremes in annual maximum temperatures: (a) based on ECDF and (b) based on ECDF. Return period based on ECDF is shorter than that based on ECDF in most places.

Figure 8.
Return period of extremes in annual mean temperatures: (a) based on ECDF and (b) based on ECDF. Return period based on ECDF is shorter than that based on ECDF at most places.
Figure 8.
Return period of extremes in annual mean temperatures: (a) based on ECDF and (b) based on ECDF. Return period based on ECDF is shorter than that based on ECDF at most places.

Figure 9.
Difference between return periods of extremes based on the two ECDFs (−) for: (a) annual maximum temperature and (b) annual mean temperature, where is the estimated return period based of ECDF for .
Figure 9.
Difference between return periods of extremes based on the two ECDFs (−) for: (a) annual maximum temperature and (b) annual mean temperature, where is the estimated return period based of ECDF for .

Figure 10.
The latitude cross–section (a,c) and the longitude cross-section (b,d) of average return periods (ARP) of extremes based on ECDF: (a) ARP of extremes in annual maximum temperatures, averaged over longitudes, (b) ARP of extremes in annual maximum temperatures, averaged over latitudes, (c) ARP of extremes in annual mean temperatures, averaged over longitudes and (d) ARP of extremes in annual mean temperatures, averaged over latitudes. The two blue curves represent the lower and upper confidence limits of the 95% confidence interval and the black curve represents point estimate of ARPs.

Figure 11.
Estimated probability of three exceedances of the new threshold over the next 19 years period (2020 to 2038): (a) annual maximum temperatures and (b) annual mean temperatures.
Figure 11.
Estimated probability of three exceedances of the new threshold over the next 19 years period (2020 to 2038): (a) annual maximum temperatures and (b) annual mean temperatures.

Figure 12.
Difference between probability of 3 exceedances over two different 19 years periods (2020 to 2038, and 2001 to 2019). for: (a) annual maximum temperatures and (b) annual mean temperatures.
Figure 12.
Difference between probability of 3 exceedances over two different 19 years periods (2020 to 2038, and 2001 to 2019). for: (a) annual maximum temperatures and (b) annual mean temperatures.

Figure 13.
Difference between probability of 3 exceedances of extremes in annual maxima and annual means () within each 19 year period: (a) over the period of 2001 to 2019 & (b) over the period of 2020 to 2038.
Figure 13.
Difference between probability of 3 exceedances of extremes in annual maxima and annual means () within each 19 year period: (a) over the period of 2001 to 2019 & (b) over the period of 2020 to 2038.

Figure 14.
Difference between return periods of extremes in annual maxima and annual means () based on the same ECDF: (a) based on ECDF and (b) based on ECDF.
Figure 14.
Difference between return periods of extremes in annual maxima and annual means () based on the same ECDF: (a) based on ECDF and (b) based on ECDF.

Publisher’s Note: MDPI stays neutral with regard to jurisdictional claims in published maps and institutional affiliations. |
© 2021 by the author. Licensee MDPI, Basel, Switzerland. This article is an open access article distributed under the terms and conditions of the Creative Commons Attribution (CC BY) license (https://creativecommons.org/licenses/by/4.0/).
Share and Cite
MDPI and ACS Style
Turasie, A.A. Exceedance and Return Period of High Temperature in the African Region. Climate 2021, 9, 53. https://0-doi-org.brum.beds.ac.uk/10.3390/cli9040053
AMA Style
Turasie AA. Exceedance and Return Period of High Temperature in the African Region. Climate. 2021; 9(4):53. https://0-doi-org.brum.beds.ac.uk/10.3390/cli9040053
Chicago/Turabian StyleTurasie, Alemtsehai A. 2021. "Exceedance and Return Period of High Temperature in the African Region" Climate 9, no. 4: 53. https://0-doi-org.brum.beds.ac.uk/10.3390/cli9040053
Note that from the first issue of 2016, this journal uses article numbers instead of page numbers. See further details here.