
Glacio-Nival Regime Creates Complex Relationships between Discharge and Climatic Trends of Zackenberg River, Greenland (1996–2019)


Abstract
:1. Introduction
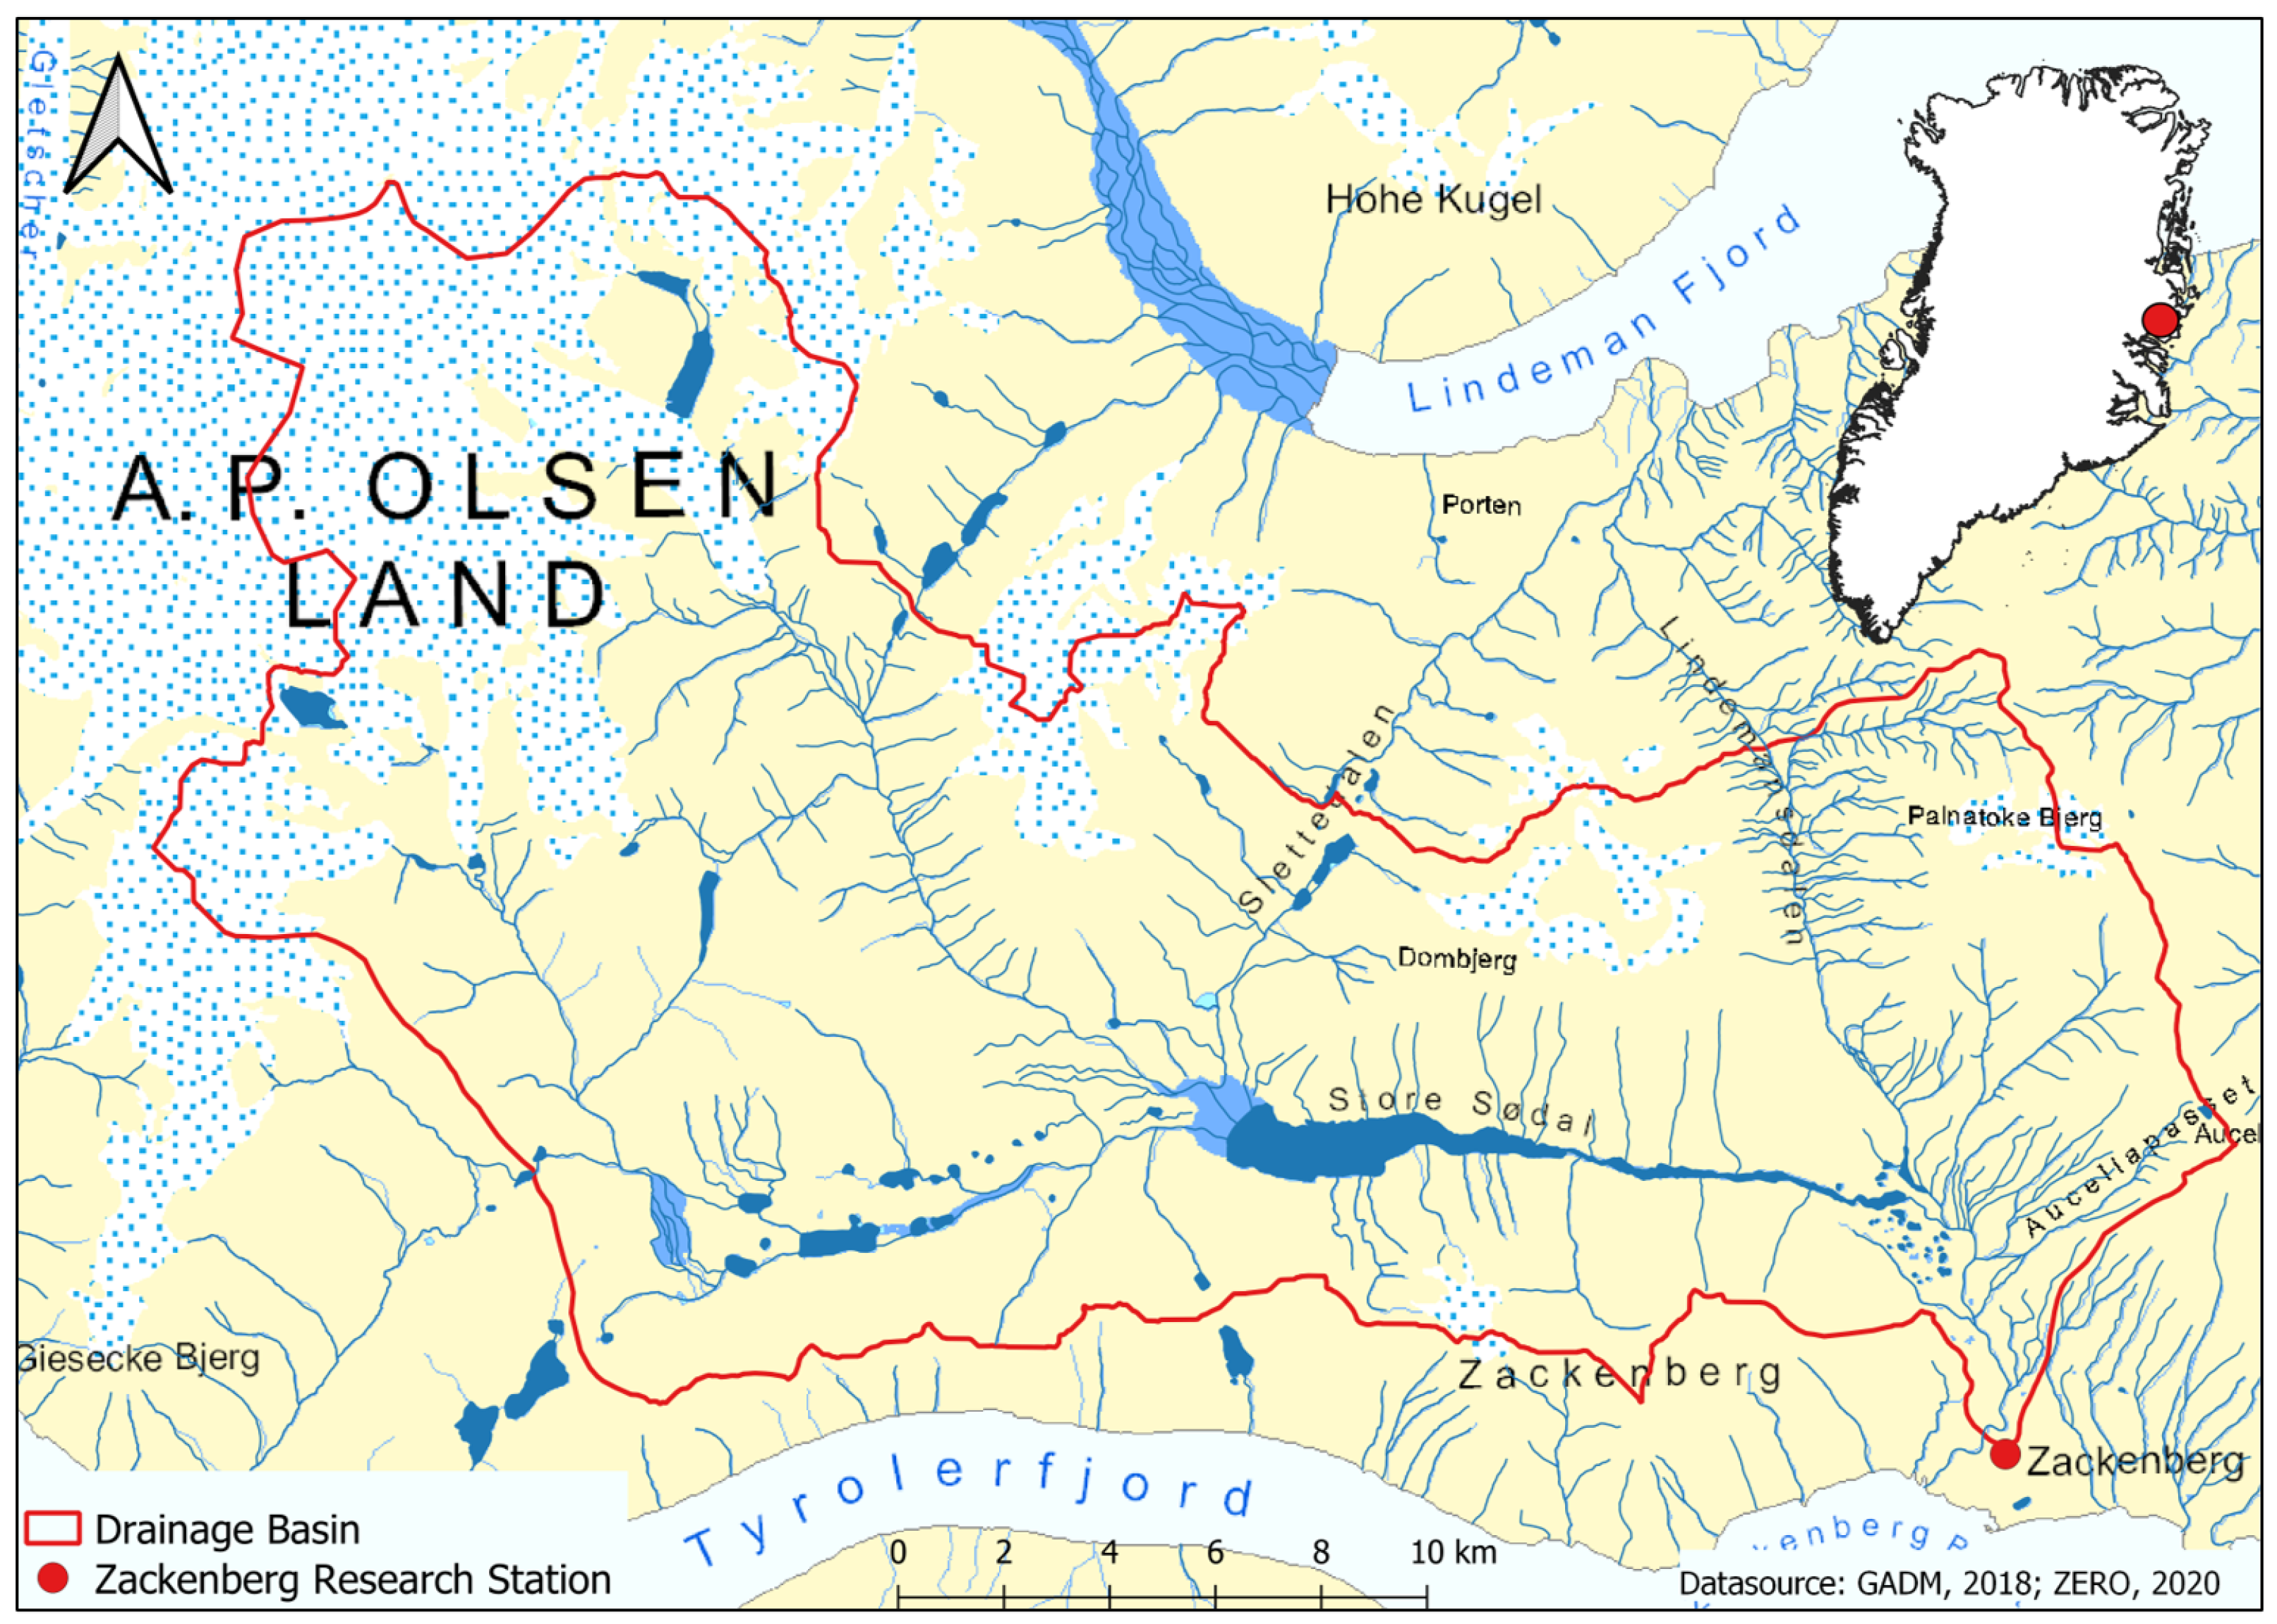
2. Study Area
3. Methods
3.1. Data Measurements
3.2. Data Analysis
4. Results
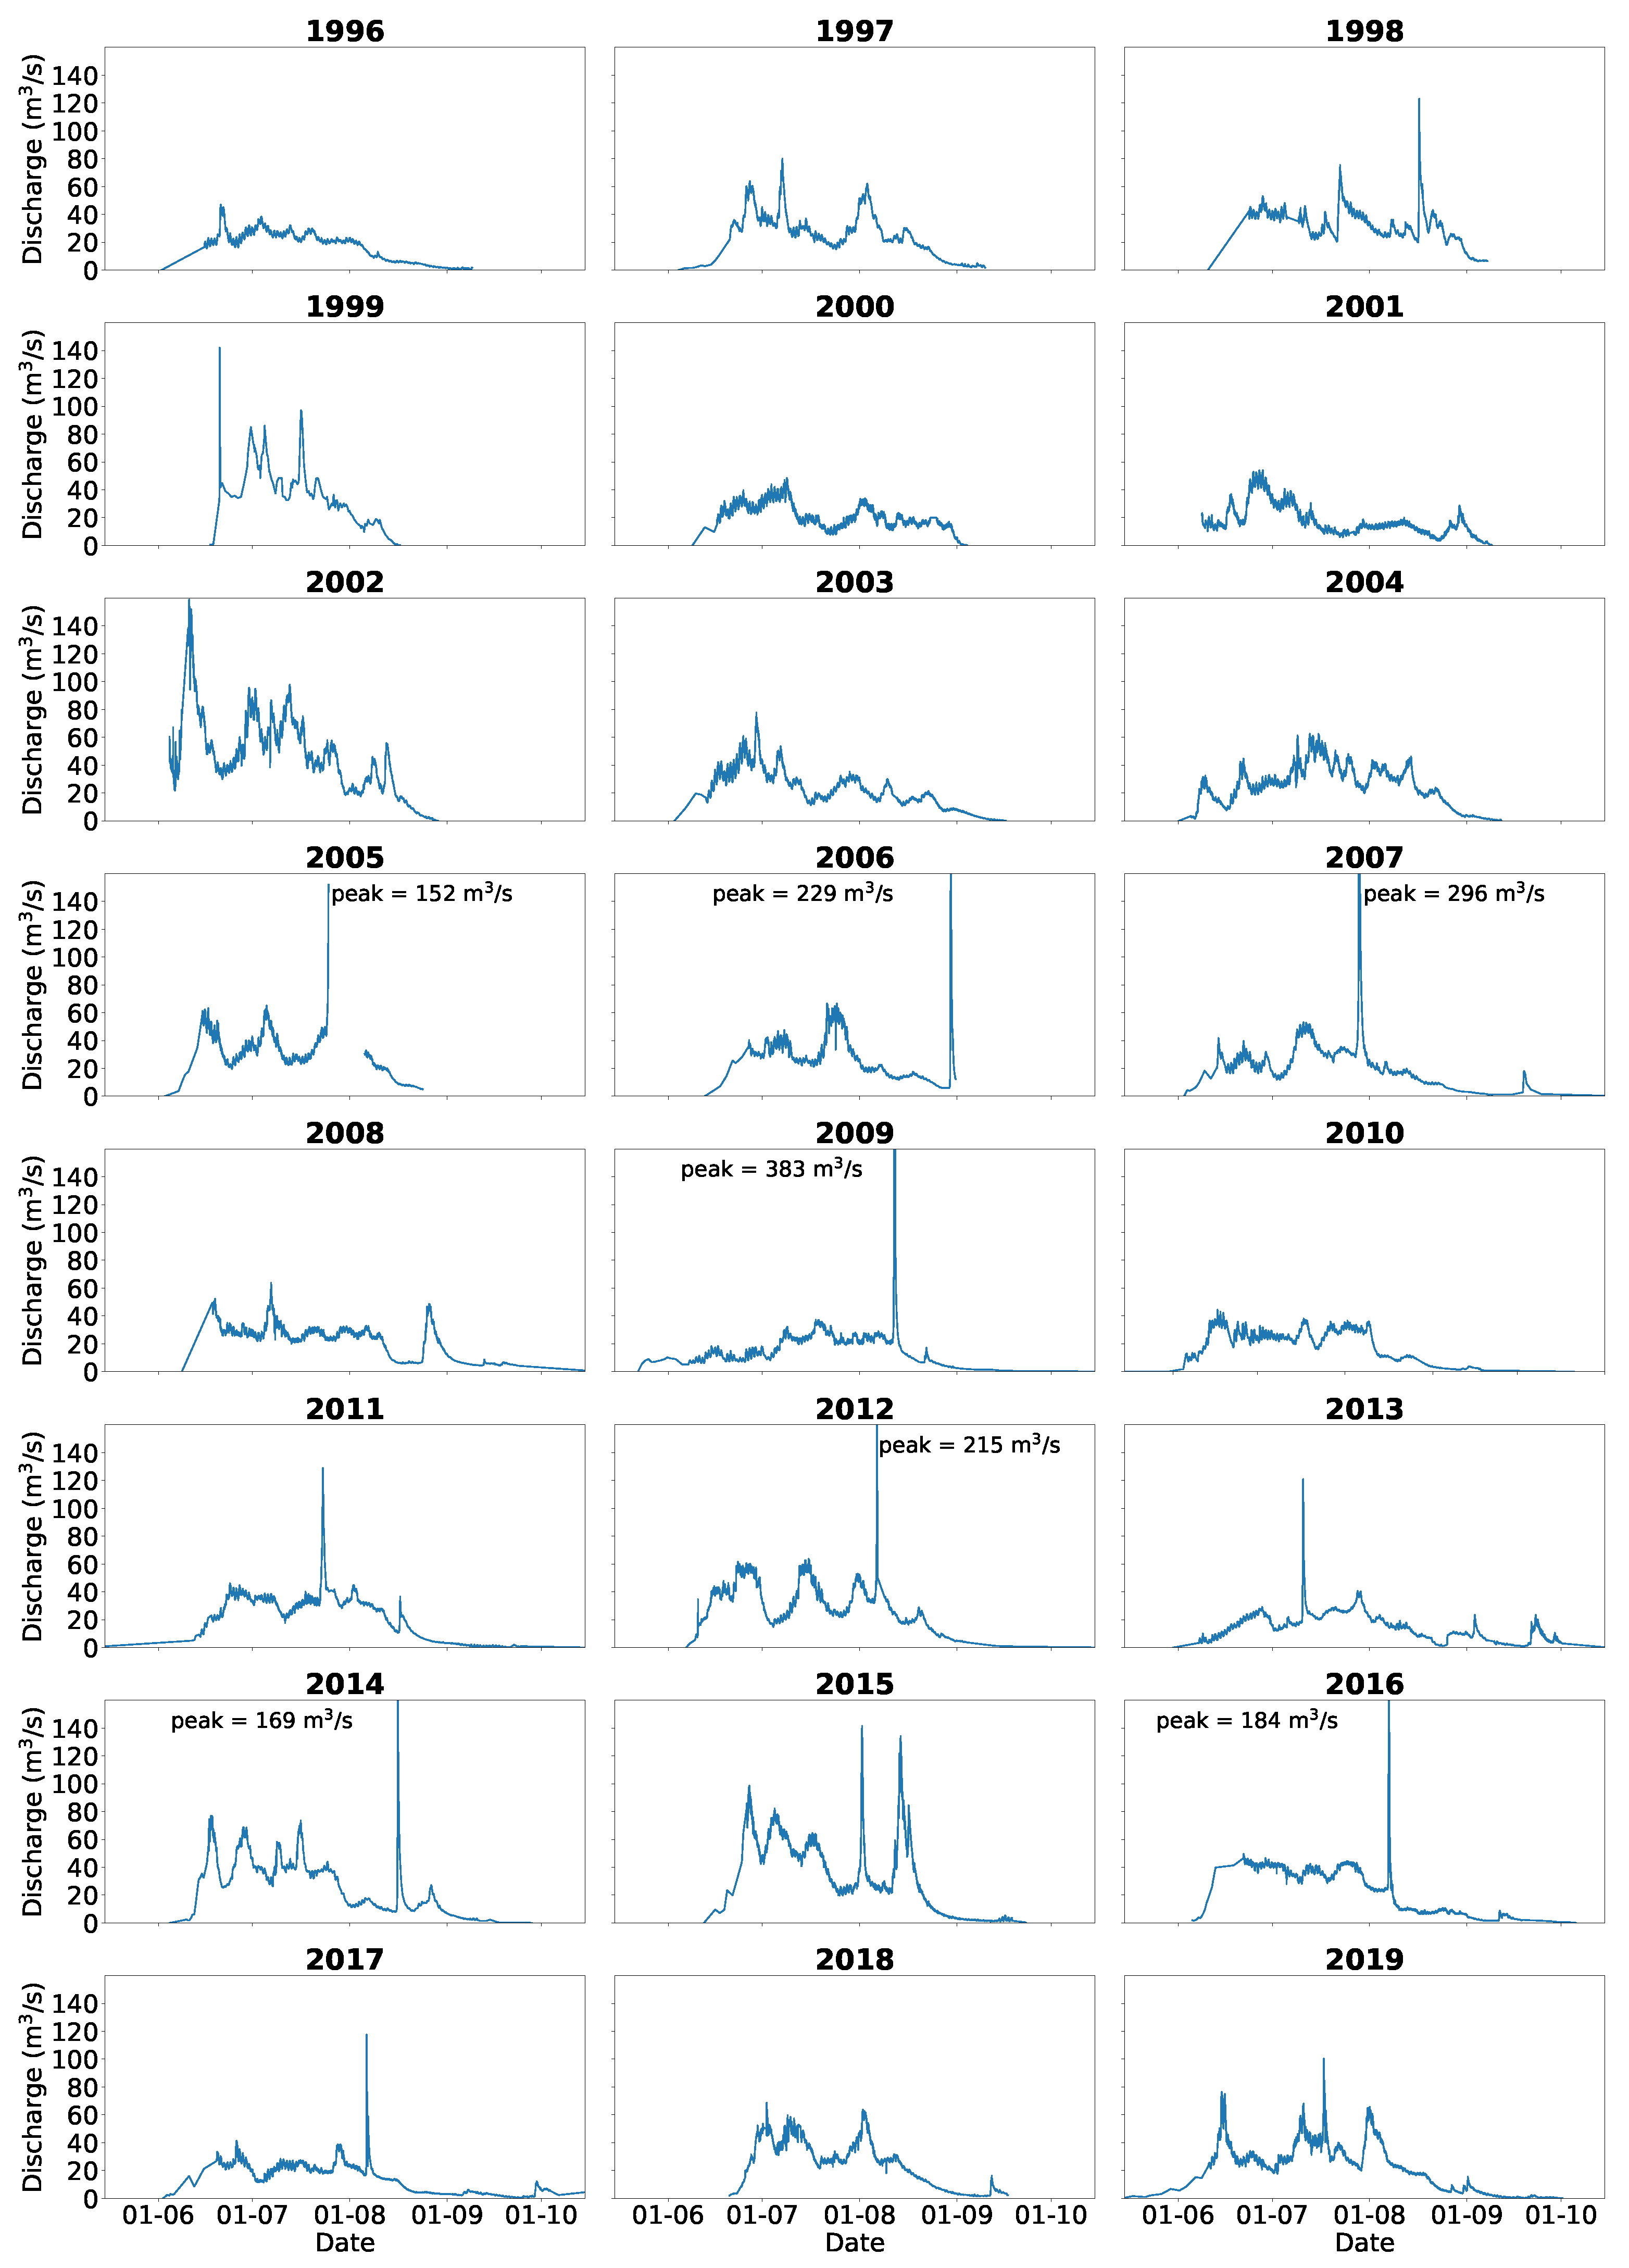
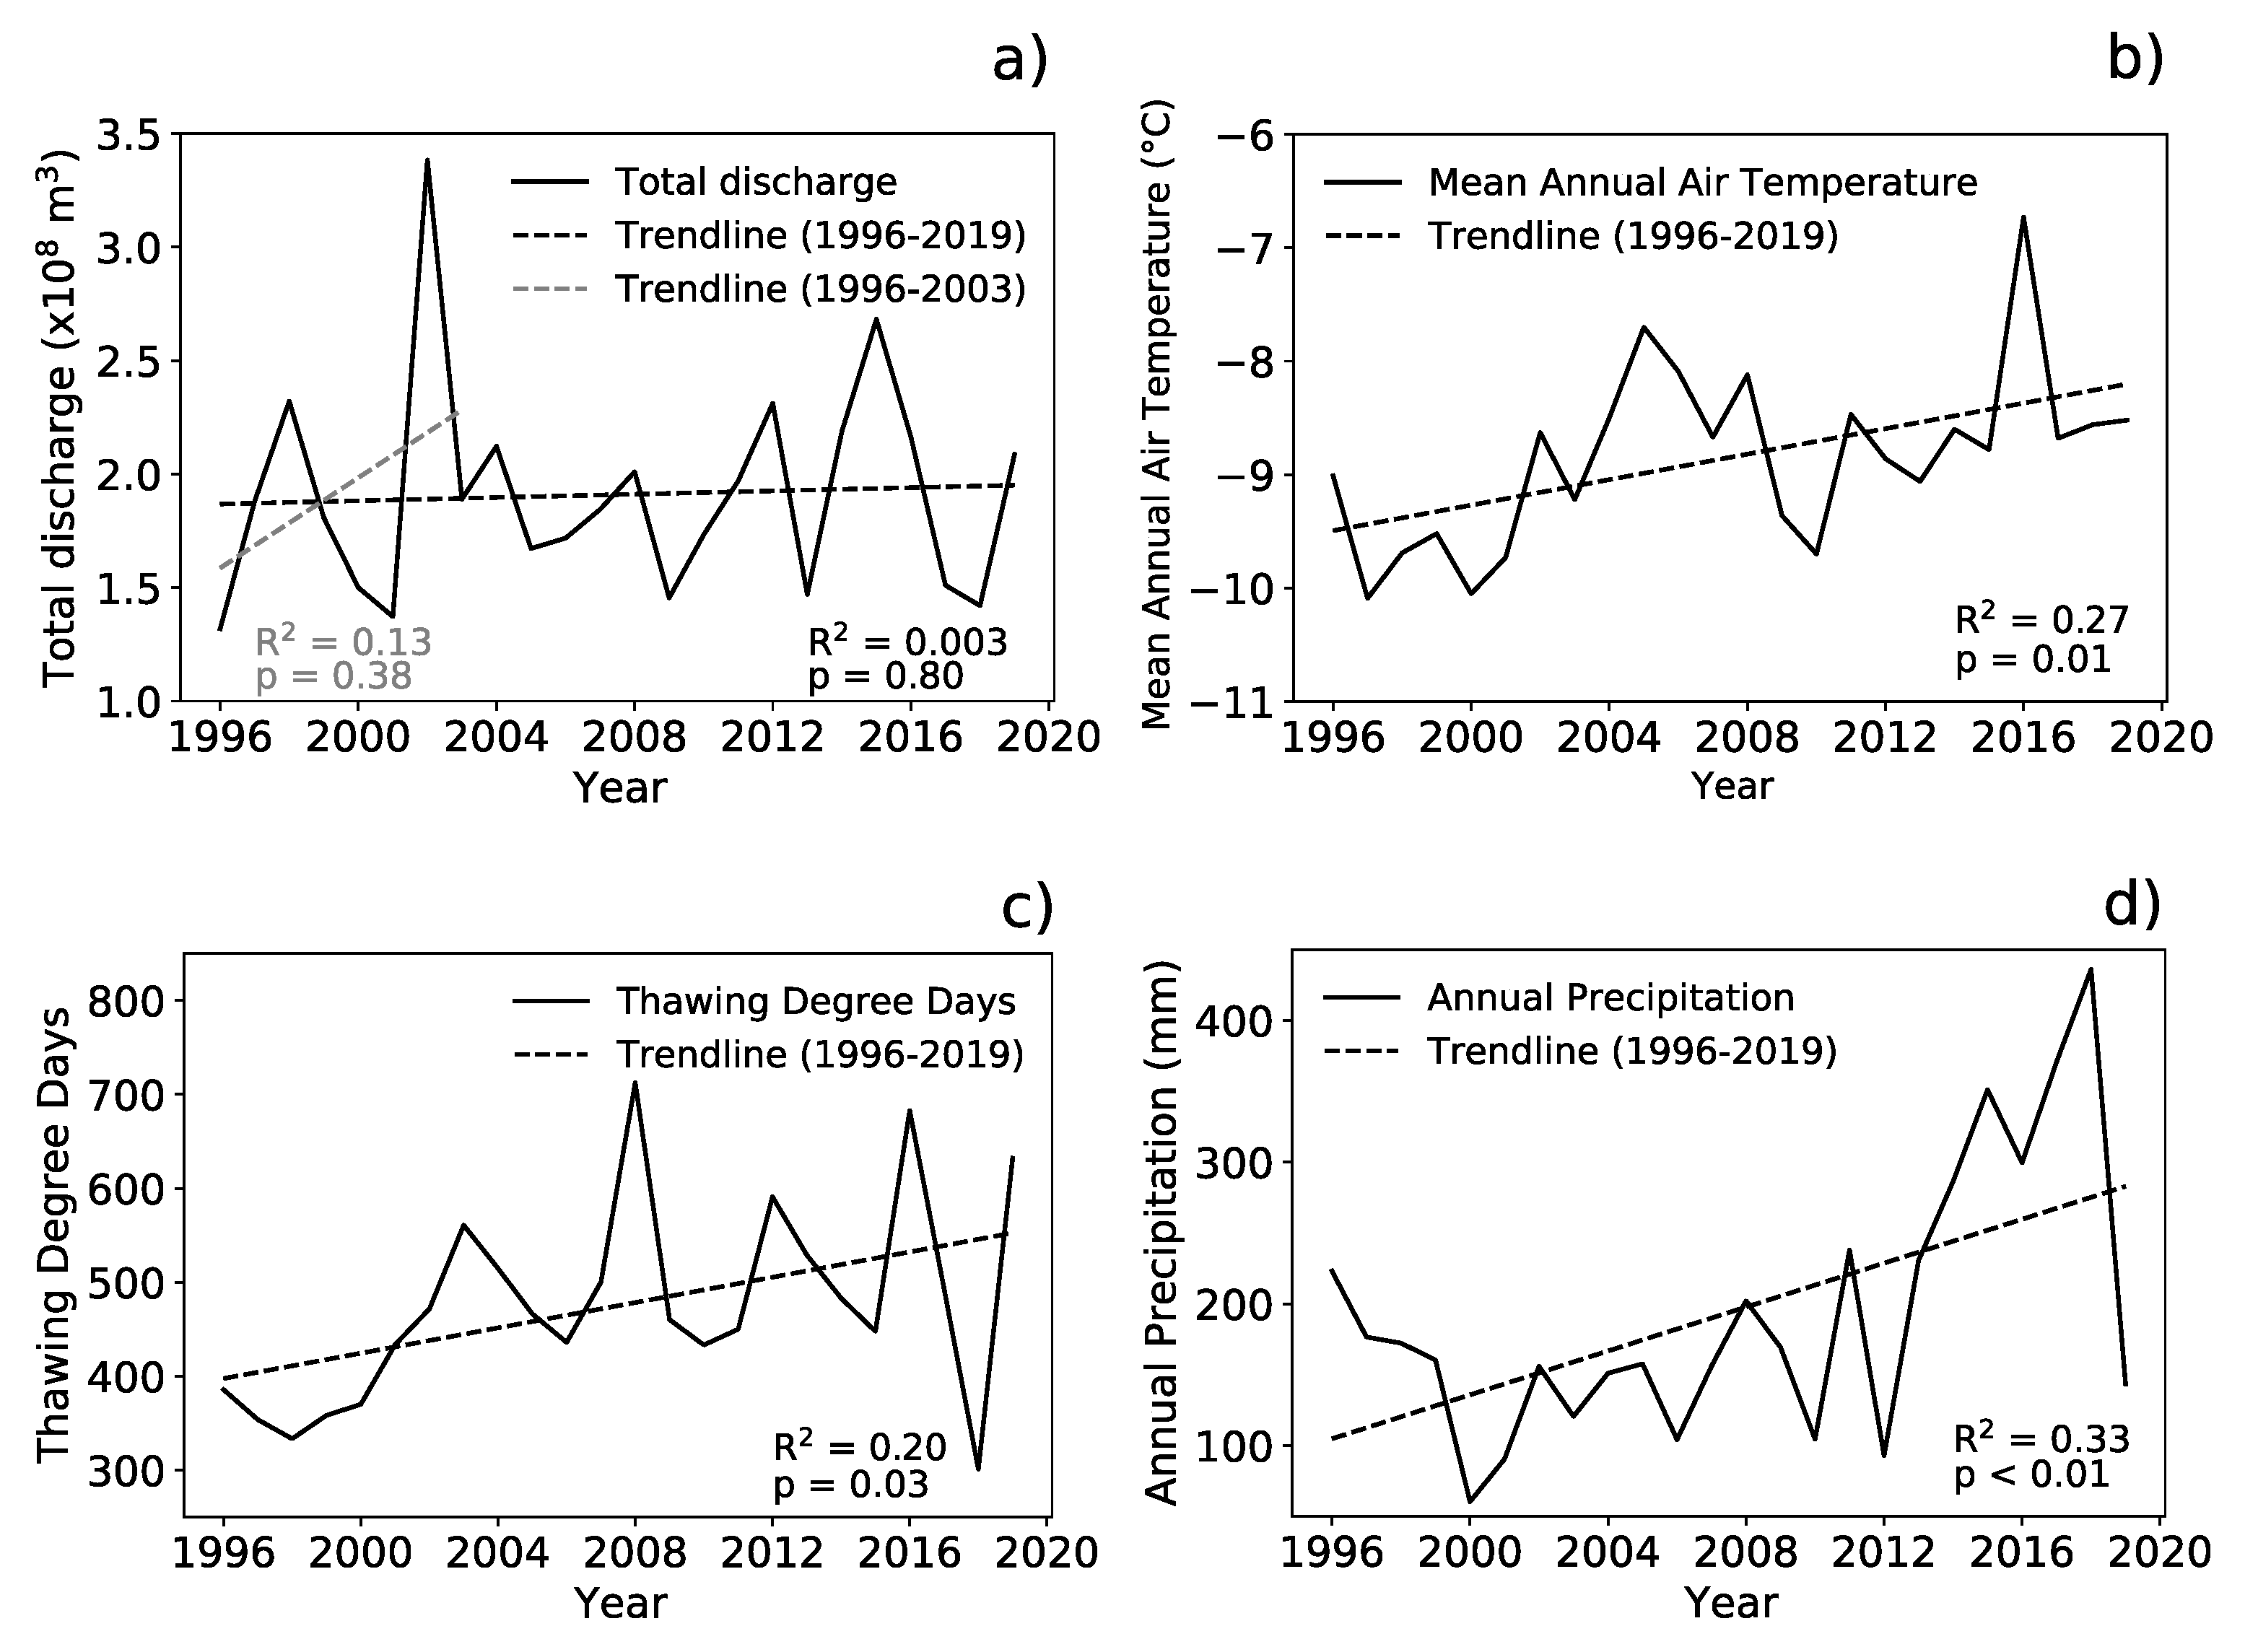
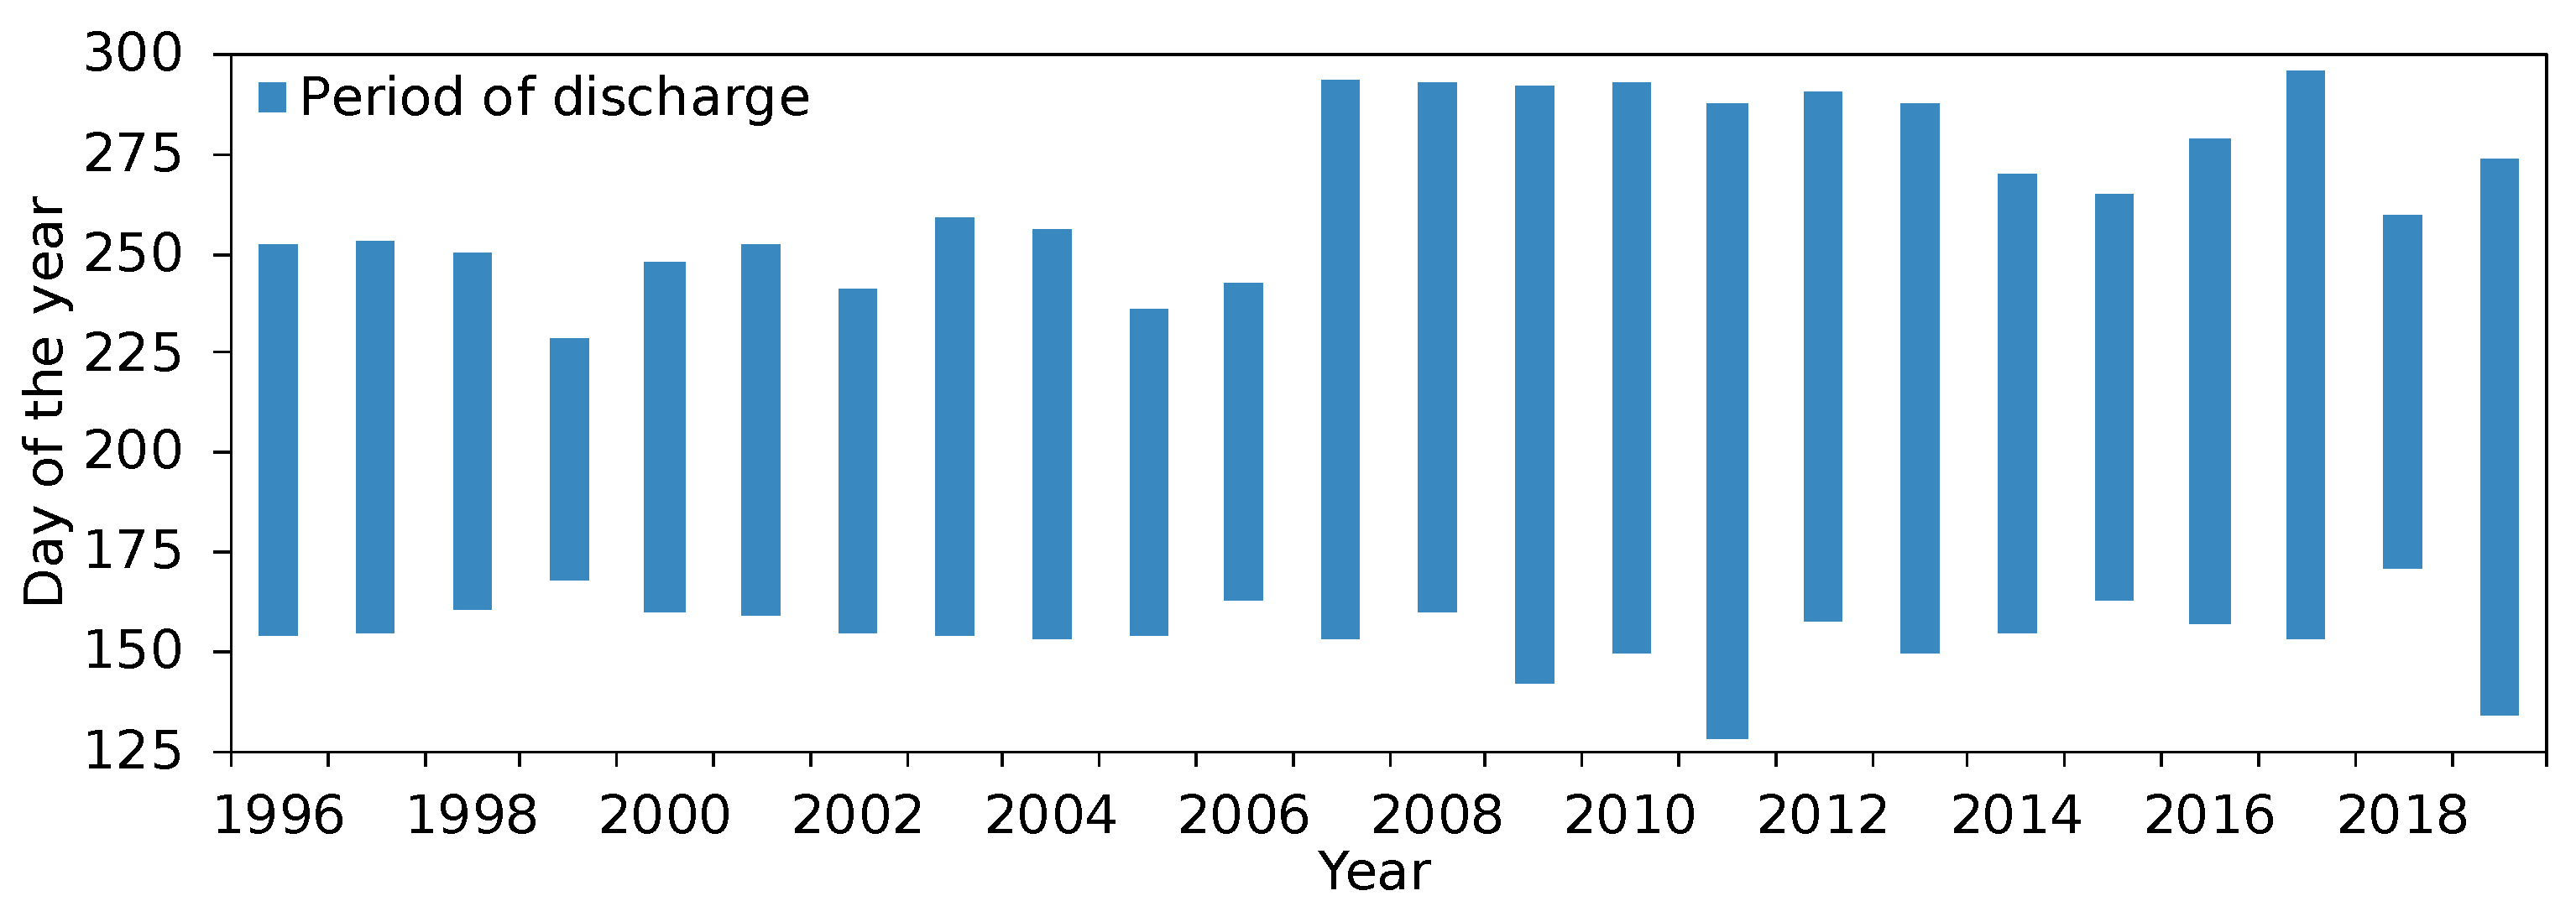
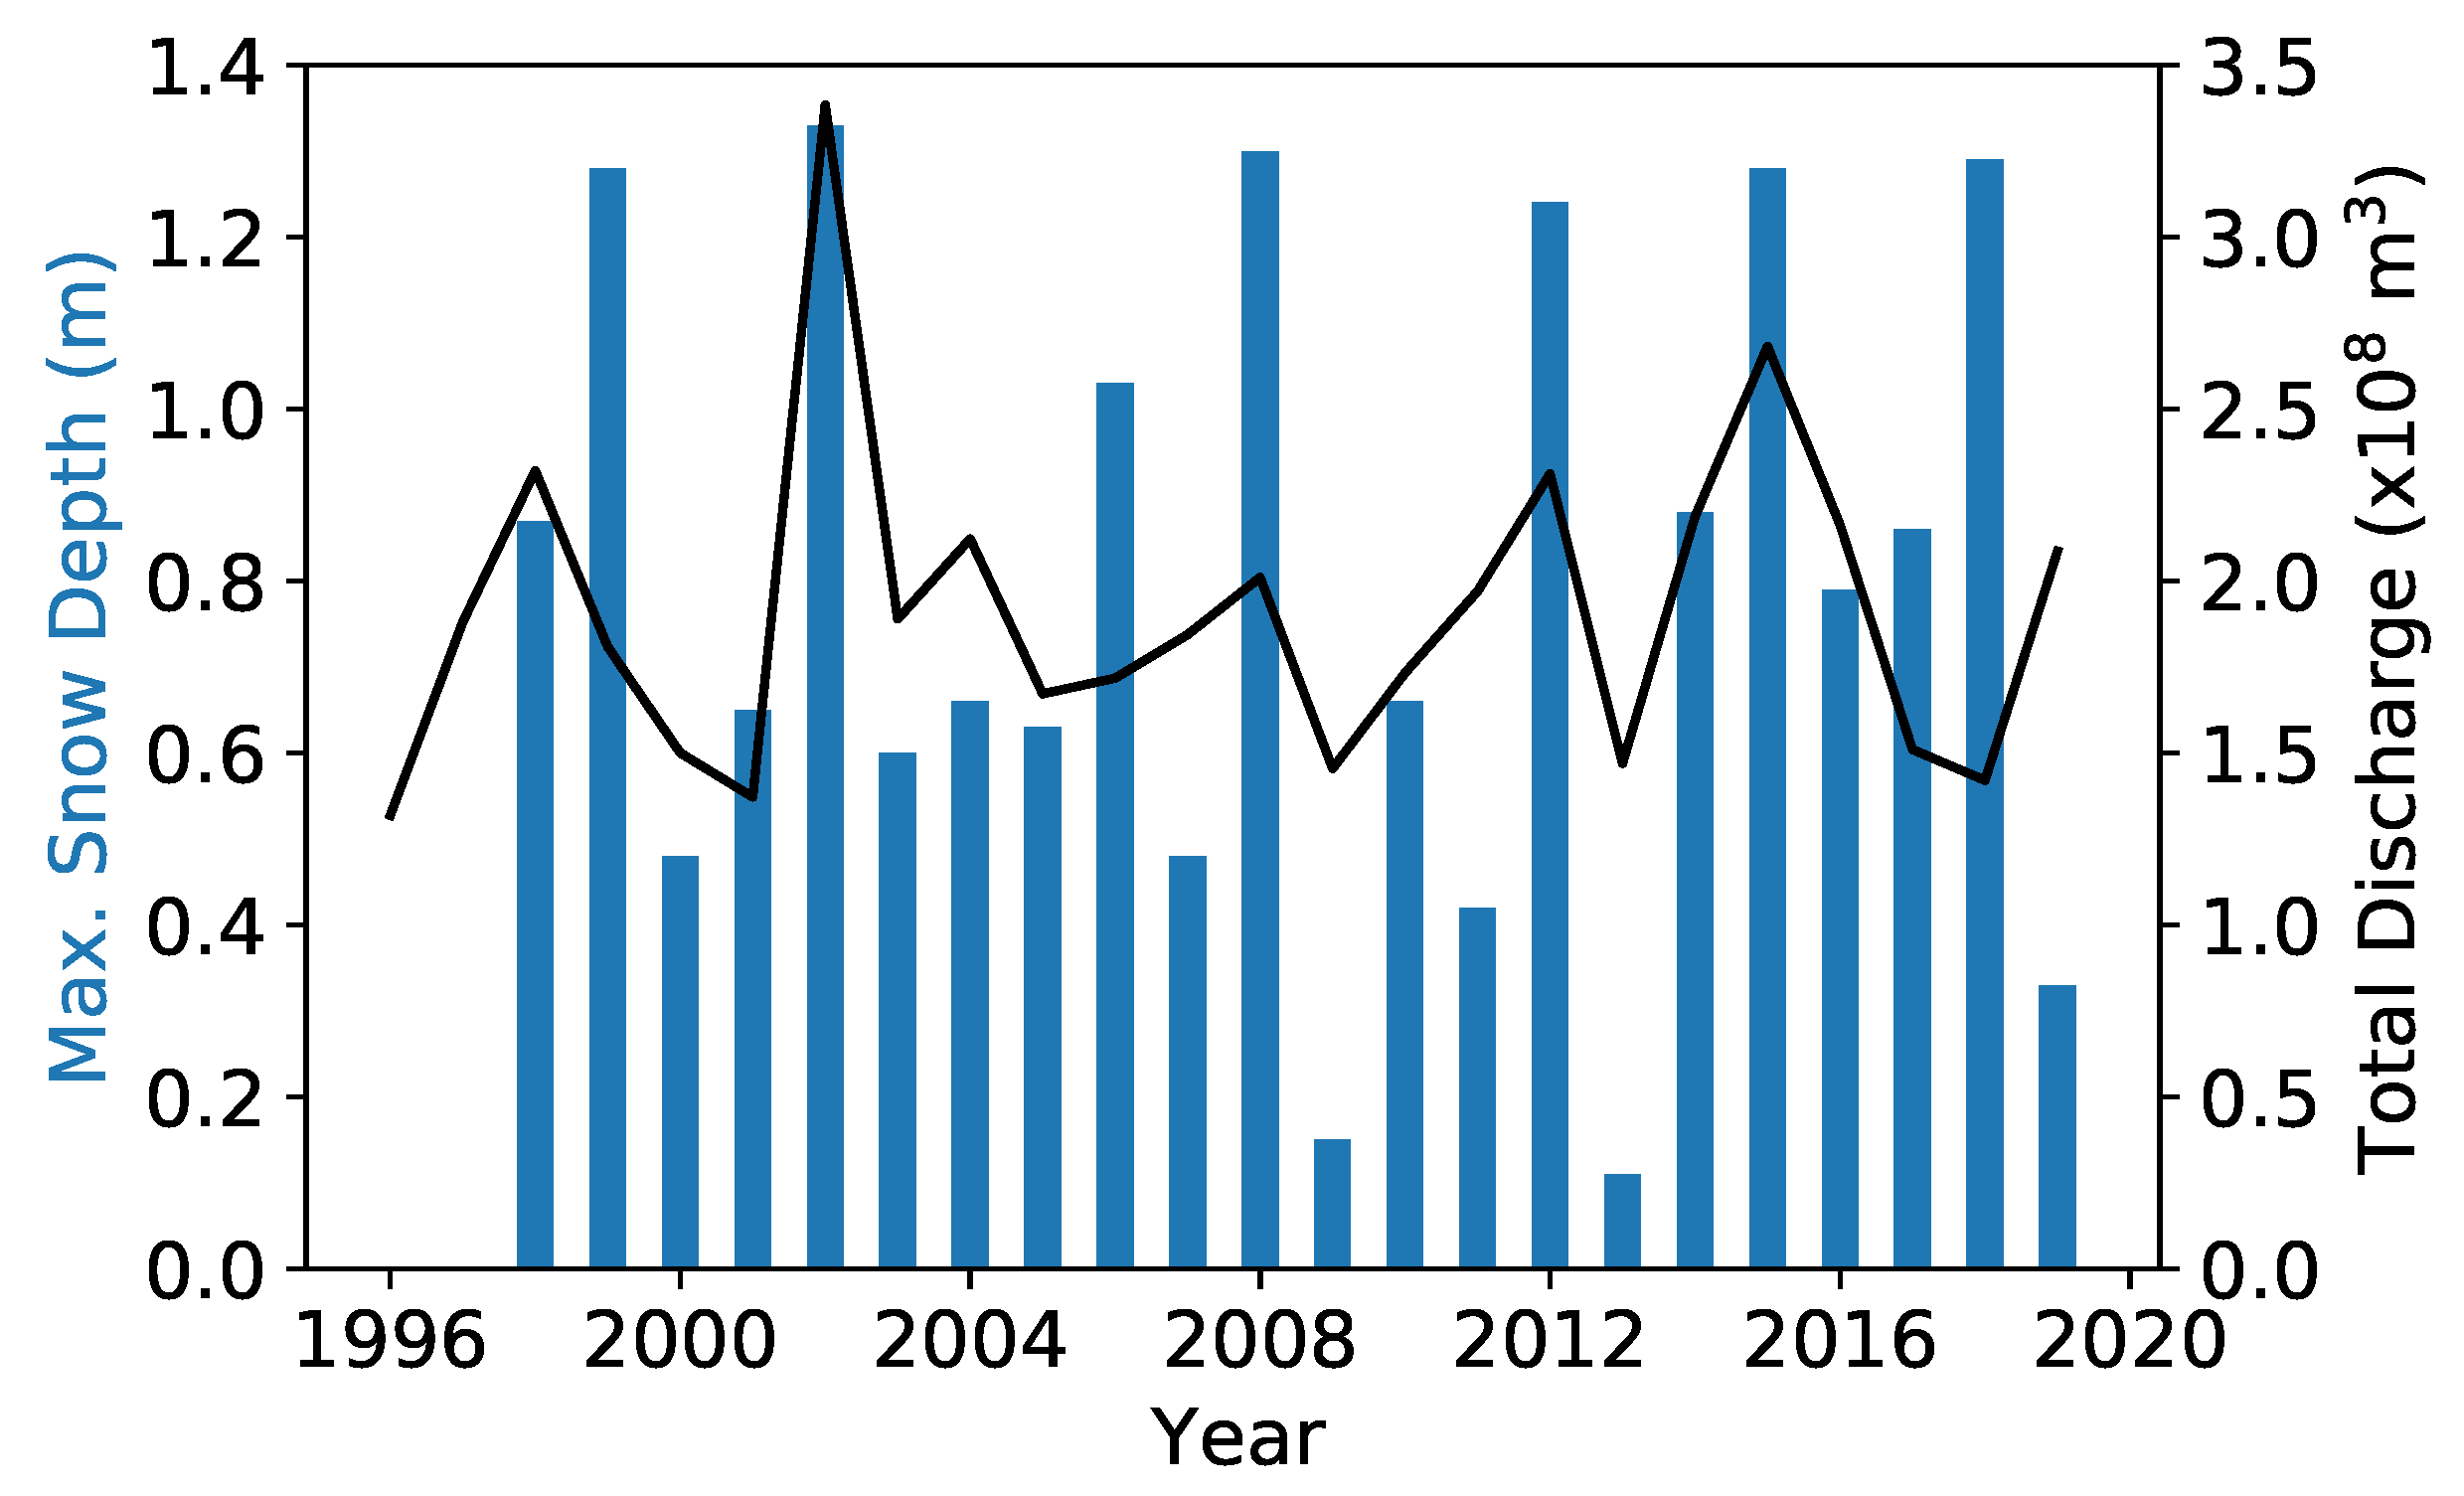
4.1. Hydrological Parameters
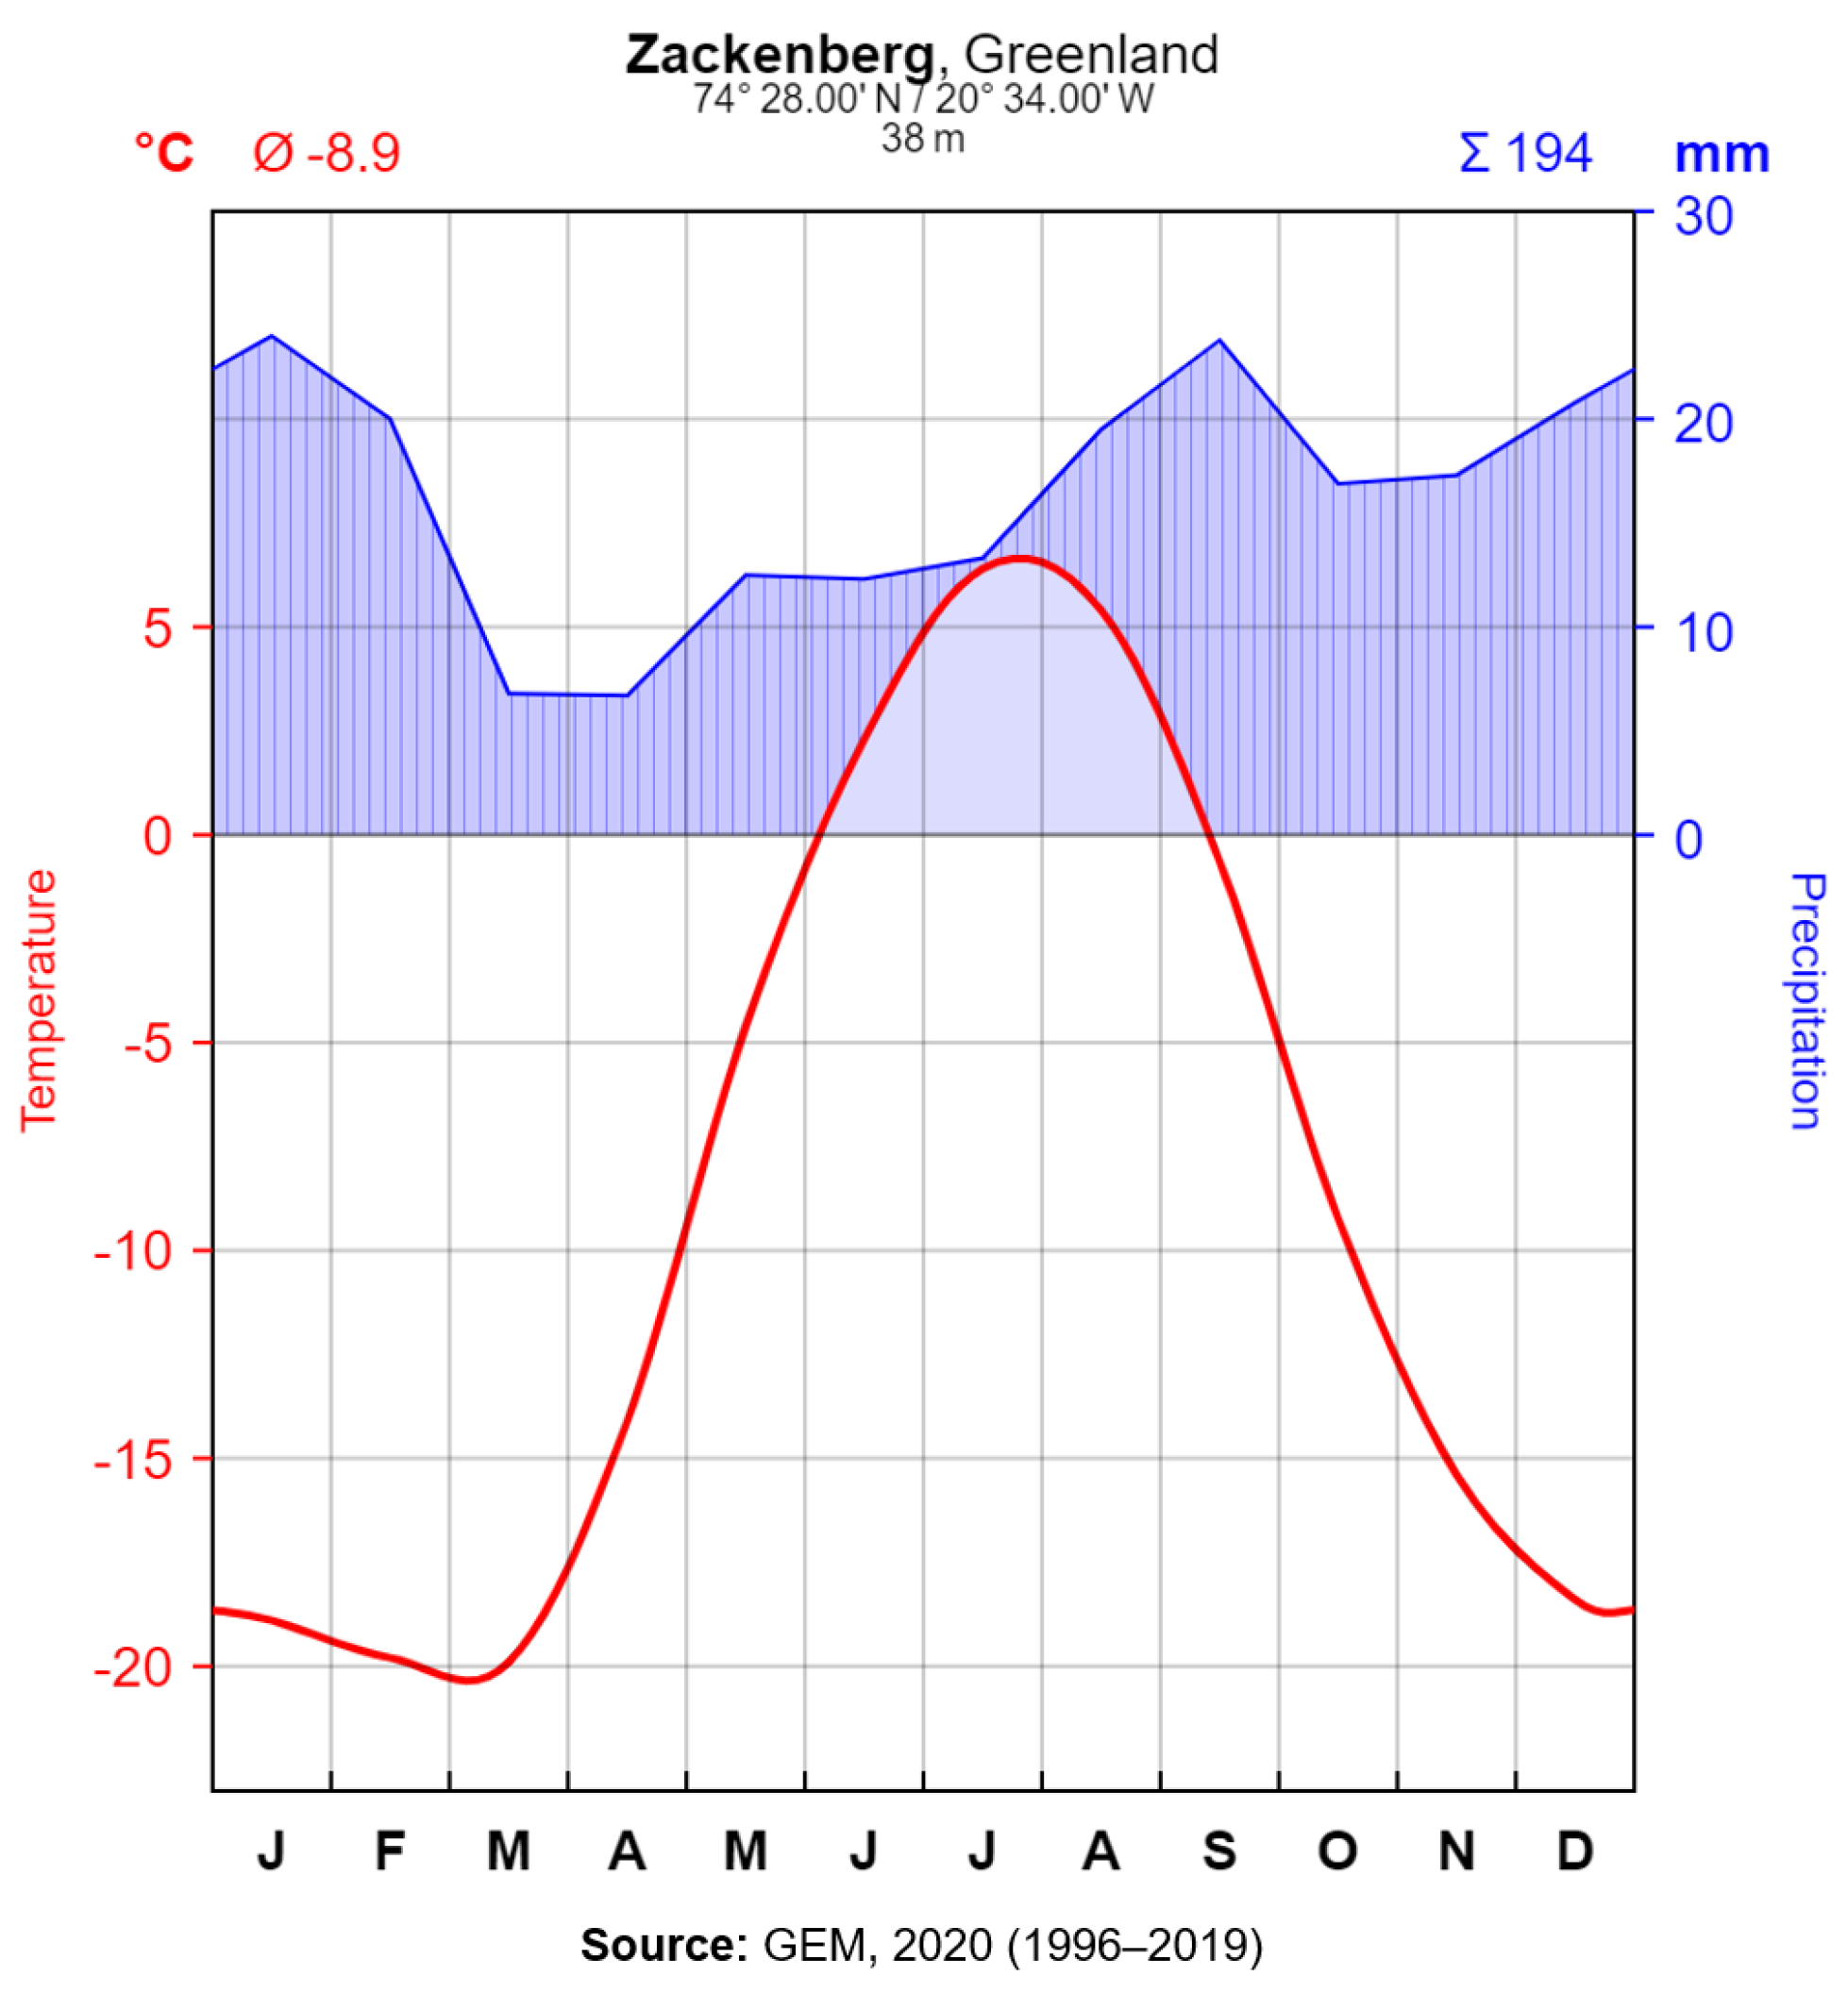
4.2. Meteorological Parameters
4.2.1. Air Temperature
4.2.2. Precipitation
4.2.3. Snow Cover and Depth
4.3. Correlations
5. Discussion
5.1. Trends in Discharge and Meteorological Parameters
5.2. Comparison to Other Studies
5.3. Future Research
6. Conclusions
Author Contributions
Funding
Data Availability Statement
Acknowledgments
Conflicts of Interest
Abbreviations
| GrIS | Greenland Ice Sheet |
| MAAT | Mean Annual Air Temperature |
| GEM | Greenland Ecosystem Monitoring |
| TD | Thawing Days |
| TDD | Thawing Degree Days |
| GLOF | Glacier Lake Outburst Flood |
References
- AMAP. AMAP Climate Change Update 2019: An Update to Key Findings of Snow, Water, Ice and Permafrost in the Arctic (SWIPA) 2017; Technical Report; AMAP: Oslo, Norway, 2019. [Google Scholar]
- Box, J.E.; Colgan, W.T.; Christensen, T.R.; Schmidt, N.M.; Lund, M.; Parmentier, F.J.W.; Brown, R.; Bhatt, U.S.; Euskirchen, E.S.; Romanovsky, V.E.; et al. Key Indicators of Arctic Climate Change: 1971–2017. Environ. Res. Lett. 2019, 14, 045010. [Google Scholar] [CrossRef]
- Holmes, R.M.; McClelland, J.W.; Peterson, B.J.; Tank, S.E.; Bulygina, E.; Eglinton, T.I.; Gordeev, V.V.; Gurtovaya, T.Y.; Raymond, P.A.; Repeta, D.J.; et al. Seasonal and Annual Fluxes of Nutrients and Organic Matter from Large Rivers to the Arctic Ocean and Surrounding Seas. Estuaries Coasts 2012, 35, 369–382. [Google Scholar] [CrossRef]
- Timmermans, M.L.; Marshall, J. Understanding Arctic Ocean Circulation: A Review of Ocean Dynamics in a Changing Climate. J. Geophys. Res. Ocean. 2020, 125, e2018JC014378. [Google Scholar] [CrossRef]
- Park, H.; Watanabe, E.; Kim, Y.; Polyakov, I.; Oshima, K.; Zhang, X.; Kimball, J.S.; Yang, D. Increasing Riverine Heat Influx Triggers Arctic Sea Ice Decline and Oceanic and Atmospheric Warming. Sci. Adv. 2020, 6, eabc4699. [Google Scholar] [CrossRef]
- McClelland, J.W.; Holmes, R.M.; Dunton, K.H.; Macdonald, R.W. The Arctic Ocean Estuary. Estuaries Coasts 2012, 35, 353–368. [Google Scholar] [CrossRef] [Green Version]
- Overeem, I.; Syvitski, J.P.M. Shifting Discharge Peaks in Arctic Rivers, 1977–2007. Geogr. Ann. Ser. A Phys. Geogr. 2010, 92, 285–296. [Google Scholar] [CrossRef]
- Ahmed, R.; Prowse, T.; Dibike, Y.; Bonsal, B.; O’Neil, H. Recent Trends in Freshwater Influx to the Arctic Ocean from Four Major Arctic-Draining Rivers. Water 2020, 12, 1189. [Google Scholar] [CrossRef] [Green Version]
- Rawlins, M.A.; Serreze, M.C.; Schroeder, R.; Zhang, X.; McDonald, K.C. Diagnosis of the Record Discharge of Arctic-Draining Eurasian Rivers in 2007. Environ. Res. Lett. 2009, 4, 045011. [Google Scholar] [CrossRef] [Green Version]
- Vihma, T.; Screen, J.; Tjernström, M.; Newton, B.; Zhang, X.; Popova, V.; Deser, C.; Holland, M.; Prowse, T. The Atmospheric Role in the Arctic Water Cycle: A Review on Processes, Past and Future Changes, and Their Impacts. J. Geophys. Res. Biogeosci. 2016, 121, 586–620. [Google Scholar] [CrossRef] [Green Version]
- Bliss, A.; Hock, R.; Radić, V. Global Response of Glacier Runoff to Twenty-First Century Climate Change. J. Geophys. Res. Earth Surf. 2014, 119, 717–730. [Google Scholar] [CrossRef]
- Walvoord, M.A.; Striegl, R.G. Increased Groundwater to Stream Discharge from Permafrost Thawing in the Yukon River Basin: Potential Impacts on Lateral Export of Carbon and Nitrogen. Geophys. Res. Lett. 2007, 34. [Google Scholar] [CrossRef] [Green Version]
- Lamontagne-Hallé, P.; McKenzie, J.M.; Kurylyk, B.L.; Zipper, S.C. Changing Groundwater Discharge Dynamics in Permafrost Regions. Environ. Res. Lett. 2018, 13, 084017. [Google Scholar] [CrossRef]
- Miller, J.D.; Immerzeel, W.W.; Rees, G. Climate Change Impacts on Glacier Hydrology and River Discharge in the Hindu Kush–Himalayas. Mt. Res. Dev. 2012, 32, 461–467. [Google Scholar] [CrossRef] [Green Version]
- Bard, A.; Renard, B.; Lang, M.; Giuntoli, I.; Korck, J.; Koboltschnig, G.; Janža, M.; d’Amico, M.; Volken, D. Trends in the Hydrologic Regime of Alpine Rivers. J. Hydrol. 2015, 529, 1823–1837. [Google Scholar] [CrossRef]
- Ayala, Á.; Farías-Barahona, D.; Huss, M.; Pellicciotti, F.; McPhee, J.; Farinotti, D. Glacier Runoff Variations since 1955 in the Maipo River Basin, in the Semiarid Andes of Central Chile. Cryosphere 2020, 14, 2005–2027. [Google Scholar] [CrossRef]
- Bring, A.; Fedorova, I.; Dibike, Y.; Hinzman, L.; Mård, J.; Mernild, S.H.; Prowse, T.; Semenova, O.; Stuefer, S.L.; Woo, M.K. Arctic Terrestrial Hydrology: A Synthesis of Processes, Regional Effects, and Research Challenges. J. Geophys. Res. Biogeosci. 2016, 121, 621–649. [Google Scholar] [CrossRef]
- Bintanja, R.; Andry, O. Towards a Rain-Dominated Arctic. Nat. Clim. Chang. 2017, 7, 263–267. [Google Scholar] [CrossRef]
- Tan, A.; Adam, J.C.; Lettenmaier, D.P. Change in Spring Snowmelt Timing in Eurasian Arctic Rivers. J. Geophys. Res. Atmos. 2011, 116. [Google Scholar] [CrossRef] [Green Version]
- Shiklomanov, A.; Déry, S.; Tretiakov, M.; Yang, D.; Magritsky, D.; Georgiadi, A.; Tang, W. River Freshwater Flux to the Arctic Ocean. In Arctic Hydrology, Permafrost and Ecosystems; Yang, D., Kane, D.L., Eds.; Springer International Publishing: Cham, Switzerland, 2021; pp. 703–738. [Google Scholar] [CrossRef]
- Bamber, J.; van den Broeke, M.; Ettema, J.; Lenaerts, J.; Rignot, E. Recent Large Increases in Freshwater Fluxes from Greenland into the North Atlantic. Geophys. Res. Lett. 2012, 39. [Google Scholar] [CrossRef] [Green Version]
- Smith, L.C.; Yang, K.; Pitcher, L.H.; Overstreet, B.T.; Chu, V.W.; Rennermalm, Å.K.; Ryan, J.C.; Cooper, M.G.; Gleason, C.J.; Tedesco, M.; et al. Direct Measurements of Meltwater Runoff on the Greenland Ice Sheet Surface. Proc. Natl. Acad. Sci. USA 2017, 114, E10622–E10631. [Google Scholar] [CrossRef] [PubMed] [Green Version]
- Lewis, S.M.; Smith, L.C. Hydrologic drainage of the Greenland Ice Sheet. Hydrol. Process. 2009, 23, 2004–2011. [Google Scholar] [CrossRef]
- Van As, D.; Hasholt, B.; Ahlstrøm, A.P.; Box, J.E.; Cappelen, J.; Colgan, W.; Fausto, R.S.; Mernild, S.H.; Mikkelsen, A.B.; Noël, B.P.; et al. Reconstructing Greenland Ice Sheet Meltwater Discharge through the Watson River (1949–2017). Arctic Antarct. Alp. Res. 2018, 50, S100010. [Google Scholar] [CrossRef] [Green Version]
- Hynek, B.; Hillerup Larsen, S.; Binder, D.; Weyss, G.; Citterio, M.; Schöner, W.; Ahlstrøm, A.P. In-Situ Glacier Monitoring in Zackenberg (NE Greenland): Freya Glacier and A.P. Olsen Ice Cap 2015, 17, 15477. [Google Scholar]
- Ye, B.B. Changes in Lena River Streamflow Hydrology: Human Impacts versus Natural Variations. Water Resour. Res. 2003, 39. [Google Scholar] [CrossRef]
- Mernild, S.H.; Sigsgaard, C.; Rasch, M.; Hasholt, B.; Hansen, B.U.; Stjernholm, M.; Petersen, D. Climate, River Discharge and Suspended Sediment Transport in the Zackenberg River Drainage Basin and Young Sound/Tyrolerfjord, Northeast Greenland, 1995–2003. Bioscience 2007, 58, 24–43. [Google Scholar]
- Zackenberg Research Station. Zackenberg Research Station—INTERACT. 2020. Available online: https://eu-interact.org/field-sites/zackenberg-research-station/ (accessed on 12 December 2020).
- Cable, S.; Christiansen, H.H.; Westergaard-Nielsen, A.; Kroon, A.; Elberling, B. Geomorphological and Cryostratigraphical Analyses of the Zackenberg Valley, NE Greenland and Significance of Holocene Alluvial Fans. Geomorphology 2018, 303, 504–523. [Google Scholar] [CrossRef]
- GADM. Administrative Area of Greenland [Map]. Database of Global Administrative Areas (GADM). 2018. Available online: www.gadm.org (accessed on 18 December 2020).
- ZERO. Zackenberg Maps and Tools. Zackenberg Ecological Research Operations (ZERO). 2020. Available online: https://g-e-m.dk/gem-localities/zackenberg/maps/ (accessed on 18 December 2020).
- Mernild, S.H.; Hasholt, B.; Liston, G.E. Climatic Control on River Discharge Simulations, Zackenberg River Drainage Basin, Northeast Greenland. Hydrol. Process. 2008, 22, 1932–1948. [Google Scholar] [CrossRef]
- Meltofte, H. (Ed.) 1st Annual Report, 1995; Danish Polar Center, Ministry of Research & Technology: Copenhagen, Denmark, 1996. [Google Scholar]
- Behm, M.; Walter, J.I.; Binder, D.; Cheng, F.; Citterio, M.; Kulessa, B.; Langley, K.; Limpach, P.; Mertl, S.; Schöner, W.; et al. Seismic Characterization of a Rapidly-Rising Jökulhlaup Cycle at the A.P. Olsen Ice Cap, NE-Greenland. J. Glaciol. 2020, 66, 329–347. [Google Scholar] [CrossRef] [Green Version]
- Søndergaard, J.; Tamstorf, M.; Elberling, B.; Larsen, M.M.; Mylius, M.R.; Lund, M.; Abermann, J.; Rigét, F. Mercury Exports from a High-Arctic River Basin in Northeast Greenland (74°N) Largely Controlled by Glacial Lake Outburst Floods. Sci. Total Environ. 2015, 514, 83–91. [Google Scholar] [CrossRef] [PubMed]
- Rasch, M.; Caning, K. Zackenberg Ecological Research Operations, 9th Annual Report, 2003; Technical Report; Danish Polar Center, Ministry of Research and Information Technology: Copenhagen, Denmark, 2004. [Google Scholar]
- Westermann, S.; Elberling, B.; Højlund Pedersen, S.; Stendel, M.; Hansen, B.U.; Liston, G.E. Future Permafrost Conditions along Environmental Gradients in Zackenberg, Greenland. Cryosphere 2015, 9, 719–735. [Google Scholar] [CrossRef] [Green Version]
- Meltofte, H.; Thing, H. Zackenberg Ecological Research Operations. 1st Annual Report 1995; Technical Report; Danish Polar Center, Ministry of Research and Information Technology: Copenhagen, Denmark, 1996. [Google Scholar]
- Christiansen, H.H.; Sigsgaard, C.; Humlum, O.; Rasch, M.; Hansen, B.U. Permafrost and Periglacial Geomorphology at Zackenberg. In Advances in Ecological Research; High-Arctic Ecosystem Dynamics in a Changing Climate; Academic Press: Oxford, UK, 2008; Volume 40, pp. 151–174. [Google Scholar] [CrossRef]
- GEM. ClimateBasis Zackenberg—Air Temperature—Air Temperature, 200cm—60min Average (°C) (Version 1.0) [Data Set]; Greenland Ecosystem Monitoring (GEM), Aarhus University: Roskilde, Denmark, 2020. [Google Scholar] [CrossRef]
- GEM. ClimateBasis Zackenberg—Precipitation—Precipitation Accumulated (mm) (Version 1.0) [Data Set]; Greenland Ecosystem Monitoring (GEM), Aarhus University: Roskilde, Denmark, 2020. [Google Scholar] [CrossRef]
- GEM. Greenland Ecosystem Monitoring. 2020. Available online: https://g-e-m.dk/ (accessed on 16 December 2020).
- GEM. ClimateBasis Zackenberg—Zackenberg River Hydrometric Data—Discharge at a Cross Section of the River, (M3/s) (Version 1.0) [Data Set]; Greenland Ecosystem Monitoring (GEM), Aarhus University: Roskilde, Denmark, 2020. [Google Scholar] [CrossRef]
- GEM. ClimateBasis Zackenberg—Precipitation—Snow Depth (m) (Version 1.0) [Data Set]; Greenland Ecosystem Monitoring (GEM), Aarhus University: Roskilde, Denmark, 2020. [Google Scholar] [CrossRef]
- Jensen, L.M.; Rasch, M. Zackenberg Ecological Research Operations, 15th Annual Report, 2009; Technical Report; National Environmental Research Institute, Aarhus University: Copenhagen, Denmark, 2010. [Google Scholar]
- Kandrup, N.; Iversen, K.M.; Thorsøe, K. Zackenberg Ecological Research Operation—ClimateBasis—Manual; Technical Report; Asiaq: Nuuk, Greenland, 2010. [Google Scholar]
- Skov, K.; Sigsgaard, C.; Mylius, M.R.; Lund, M. GeoBasis—Guidelines and Sampling Procedures for the Geographical Monitoring Programme of Zackenberg Basic; Department of Bioscience, Aarhus University: Aarhus C, Denmark; Department of Geosciences and Natural Resource Management, University of Copenhagen: Copenhagen, Denmark, 2020. [Google Scholar]
- Tumbush, M. Evaluation of OTT PLUVIO Precipitation Gage versus Belfort Universal Precipitation Gage 5–780 for the National Atmospheric Deposition Program; Technical Report; U.S. Geological Survey: Carson City, NV, USA, 2003. [CrossRef]
- Jensen, L.M.; Topp-Jørgensen, E.; Christensen, T.R.; Schmidt, N.M. Zackenberg Ecological Research Operations 20th Annual Report, 2014; Technical Report; Aarhus University, DCE—Danish Centre for Environment and Energy: Aarhus C, Denmark, 2016. [Google Scholar]
- Rasch, M.; Meltofte, H.; Polarcenter, D. Zackenberg Ecological Research Operations: 3th Annual Report, 1998; Danish Polar Center, Ministry of Research & Technology: Copenhagen, Denmark, 1998. [Google Scholar]
- IPCC. Summary for Policymakers. Climate Change 2013: The Physical Science Basis. Contribution of Working Group I to the Fifth Assessment Report of the Intergovernmental Panel on Climate Change; Technical Report; Cambridge University Press: Cambridge, UK; New York, NY, USA, 2013. [Google Scholar]
- Citterio, M.; Sejr, M.K.; Langen, P.L.; Mottram, R.H.; Abermann, J.; Hillerup Larsen, S.; Skov, K.; Lund, M. Towards Quantifying the Glacial Runoff Signal in the Freshwater Input to Tyrolerfjord–Young Sound, NE Greenland. Ambio 2017, 46, 146–159. [Google Scholar] [CrossRef] [Green Version]
- Tomczyk, A.M. Geomorphological Impacts of a Glacier Lake Outburst Flood in the High Arctic Zackenberg River, NE Greenland. J. Hydrol. 2020, 591, 125300. [Google Scholar] [CrossRef]
- Louie, P.; Metcalfe, J.; Goodison, B.E.; Sheppard, B.E. Automation of Precipitation Measurement in Cold Climates. In Proceedings of the 2nd International Conference on Experiences with Automatic Weather Stations (ICEAWS99), Toronto, ON, Canada, 27–29 September 1999; p. 13. [Google Scholar]
- Docherty, C.L.; Hannah, D.M.; Riis, T.; Leth, S.R.; Milner, A.M. Longitudinal Distribution of Macroinvertebrates in Snowmelt Streams in Northeast Greenland: Understanding Biophysical Controls. Polar Biol. 2018, 41, 1567–1580. [Google Scholar] [CrossRef] [PubMed] [Green Version]
- Berghuijs, W.R.; Woods, R.A.; Hrachowitz, M. A Precipitation Shift from Snow towards Rain Leads to a Decrease in Streamflow. Nat. Clim. Chang. 2014, 4, 583–586. [Google Scholar] [CrossRef] [Green Version]
- IPCC. Climate Change 2014: Synthesis Report. Contribution of Working Groups I, II and III to the Fifth Assessment Report of the Intergovernmental Panel on Climate Change; Technical Report; IPCC: Geneva, Switzerland, 2014. [Google Scholar]
- Overeem, I.; Hudson, B.; Welty, E.; Mikkelsen, A.; Bamber, J.; Petersen, D.; Lewinter, A.; Hasholt, B. River Inundation Suggests Ice-Sheet Runoff Retention. J. Glaciol. 2015, 61, 776–788. [Google Scholar] [CrossRef] [Green Version]
- Peterson, B.J.; Holmes, R.M.; McClelland, J.W.; Vörösmarty, C.J.; Lammers, R.B.; Shiklomanov, A.I.; Shiklomanov, I.A.; Rahmstorf, S. Increasing River Discharge to the Arctic Ocean. Science 2002, 298, 2171–2173. [Google Scholar] [CrossRef] [PubMed] [Green Version]
- Déry, S.J.; Stadnyk, T.A.; MacDonald, M.K.; Gauli-Sharma, B. Recent Trends and Variability in River Discharge across Northern Canada. Hydrol. Earth Syst. Sci. 2016, 20, 4801–4818. [Google Scholar] [CrossRef] [Green Version]
- Screen, J.A.; Simmonds, I.; Deser, C.; Tomas, R. The Atmospheric Response to Three Decades of Observed Arctic Sea Ice Loss. J. Clim. 2013, 26, 1230–1248. [Google Scholar] [CrossRef] [Green Version]
- Wegmann, M.; Orsolini, Y.; Vázquez, M.; Gimeno, L.; Nieto, R.; Bulygina, O.; Jaiser, R.; Handorf, D.; Rinke, A.; Dethloff, K.; et al. Arctic Moisture Source for Eurasian Snow Cover Variations in Autumn. Environ. Res. Lett. 2015, 10, 054015. [Google Scholar] [CrossRef] [Green Version]
- Kopec, B.G.; Feng, X.; Michel, F.A.; Posmentier, E.S. Influence of Sea Ice on Arctic Precipitation. Proc. Natl. Acad. Sci. USA 2016, 113, 46–51. [Google Scholar] [CrossRef] [Green Version]
- Hinkler, J.; Hansen, B.U.; Tamstorf, M.P.; Sigsgaard, C.; Petersen, D. Snow and Snow-Cover in Central Northeast Greenland. In Advances in Ecological Research; High-Arctic Ecosystem Dynamics in a Changing Climate; Academic Press: Cambridge, MA, USA, 2008; Volume 40, pp. 175–195. [Google Scholar] [CrossRef]
- Streletskiy, D.A.; Tananaev, N.I.; Opel, T.; Shiklomanov, N.I.; Nyland, K.E.; Streletskaya, I.D.; Tokarev, I.; Shiklomanov, A.I. Permafrost Hydrology in Changing Climatic Conditions: Seasonal Variability of Stable Isotope Composition in Rivers in Discontinuous Permafrost. Environ. Res. Lett. 2015, 10, 095003. [Google Scholar] [CrossRef]
- Lund, M.; Hansen, B.U.; Pedersen, S.H.; Stiegler, C.; Tamstorf, M.P. Characteristics of Summer-Time Energy Exchange in a High Arctic Tundra Heath 2000–2010. Tellus B Chem. Phys. Meteorol. 2014, 66, 21631. [Google Scholar] [CrossRef] [Green Version]
- Machguth, H.; Thomsen, H.H.; Weidick, A.; Ahlstrøm, A.P.; Abermann, J.; Andersen, M.L.; Andersen, S.B.; Bjørk, A.A.; Box, J.E.; Braithwaite, R.J.; et al. Greenland Surface Mass-Balance Observations from the Ice-Sheet Ablation Area and Local Glaciers. J. Glaciol. 2016, 62, 861–887. [Google Scholar] [CrossRef] [Green Version]
- Lutz, A.F.; Immerzeel, W.W.; Shrestha, A.B.; Bierkens, M.F.P. Consistent Increase in High Asia’s Runoff Due to Increasing Glacier Melt and Precipitation. Nat. Clim. Chang. 2014, 4, 587–592. [Google Scholar] [CrossRef] [Green Version]
- Bennett, K.E.; Cannon, A.J.; Hinzman, L. Historical Trends and Extremes in Boreal Alaska River Basins. J. Hydrol. 2015, 527, 590–607. [Google Scholar] [CrossRef]
- Fleming, S.W.; Moore, R.D.D.; Clarke, G.K.C. Glacier-Mediated Streamflow Teleconnections to the Arctic Oscillation. Int. J. Climatol. 2006, 26, 619–636. [Google Scholar] [CrossRef]
- Sugiura, K.; Ohata, T.; Yang, D.; Sato, T.; Sato, A. Application of a Snow Particle Counter to Solid Precipitation Measurements under Arctic Conditions. Cold Reg. Sci. Technol. 2009, 58, 77–83. [Google Scholar] [CrossRef]


| Discharge Variable | Climatic Variable | r | p-Value |
|---|---|---|---|
| Discharge period | TDD | 0.52 | <0.01 |
| Total annual discharge | Maximum snow depth | 0.48 | 0.02 |
| Daily average discharge | Daily average air temperature | −0.47 | <0.01 |
| Total annual discharge | TDD | 0.25 | 0.24 |
| Total annual discharge | MAAT | 0.22 | 0.29 |
| Daily average discharge | Daily precipitation sum | 0.02 | 0.10 |
| Total annual discharge | Annual precipitation sum | 0.00 | 0.99 |
Publisher’s Note: MDPI stays neutral with regard to jurisdictional claims in published maps and institutional affiliations. |
© 2021 by the authors. Licensee MDPI, Basel, Switzerland. This article is an open access article distributed under the terms and conditions of the Creative Commons Attribution (CC BY) license (https://creativecommons.org/licenses/by/4.0/).
Share and Cite
Ploeg, K.; Seemann, F.; Wild, A.-K.; Zhang, Q. Glacio-Nival Regime Creates Complex Relationships between Discharge and Climatic Trends of Zackenberg River, Greenland (1996–2019). Climate 2021, 9, 59. https://0-doi-org.brum.beds.ac.uk/10.3390/cli9040059
Ploeg K, Seemann F, Wild A-K, Zhang Q. Glacio-Nival Regime Creates Complex Relationships between Discharge and Climatic Trends of Zackenberg River, Greenland (1996–2019). Climate. 2021; 9(4):59. https://0-doi-org.brum.beds.ac.uk/10.3390/cli9040059
Chicago/Turabian StylePloeg, Karlijn, Fabian Seemann, Ann-Kathrin Wild, and Qiong Zhang. 2021. "Glacio-Nival Regime Creates Complex Relationships between Discharge and Climatic Trends of Zackenberg River, Greenland (1996–2019)" Climate 9, no. 4: 59. https://0-doi-org.brum.beds.ac.uk/10.3390/cli9040059