Article

The Role of Acoustic Similarity and Non-Native Categorisation in Predicting Non-Native Discrimination: Brazilian Portuguese Vowels by English vs. Spanish Listeners

1
Department of Linguistics, California State University, Fresno, CA 93740, USA
2
ARC Centre of Excellence for the Dynamics of Language, Australian National University, Canberra, ACT 0200, Australia
3
Linguistics Department, University of Potsdam, 14469 Potsdam, Germany
4
The MARCS Institute for Brain, Behaviour and Development, Western Sydney University, Sydney, NSW 2751, Australia
5
Department of Linguistics, Yale University, New Haven, CT 06520, USA
6
Haskins Laboratories, New Haven, CT 06520, USA
*
Author to whom correspondence should be addressed.
Submission received: 28 October 2020 / Revised: 13 February 2021 / Accepted: 18 February 2021 / Published: 5 March 2021

Abstract

:
This study tests whether Australian English (AusE) and European Spanish (ES) listeners differ in their categorisation and discrimination of Brazilian Portuguese (BP) vowels. In particular, we investigate two theoretically relevant measures of vowel category overlap (acoustic vs. perceptual categorisation) as predictors of non-native discrimination difficulty. We also investigate whether the individual listener’s own native vowel productions predict non-native vowel perception better than group averages. The results showed comparable performance for AusE and ES participants in their perception of the BP vowels. In particular, discrimination patterns were largely dependent on contrast-specific learning scenarios, which were similar across AusE and ES. We also found that acoustic similarity between individuals’ own native productions and the BP stimuli were largely consistent with the participants’ patterns of non-native categorisation. Furthermore, the results indicated that both acoustic and perceptual overlap successfully predict discrimination performance. However, accuracy in discrimination was better explained by perceptual similarity for ES listeners and by acoustic similarity for AusE listeners. Interestingly, we also found that for ES listeners, the group averages explained discrimination accuracy better than predictions based on individual production data, but that the AusE group showed no difference.

1. Introduction

It is well known that learning to perceive and produce the sounds of a new language can be a difficult task for many second language (L2) learners. Models of speech perception such as Flege’s Speech Learning Model (SLM; Flege 1995), Best’s Perceptual Assimilation Model (PAM, Best 1994, 1995), its extension to L2 acquisition PAM-L2 (Best and Tyler 2007) and the Second Language Linguistic Perception model (L2LP; Escudero 2005, 2009; van Leussen and Escudero 2015; Elvin and Escudero 2019; Yazawa et al. 2020) claim that both the phonological and articulatory-phonetic (PAM, PAM-L2), or acoustic-phonetic similarity (SLM, L2LP) between the native and target language are predictive of L2 discrimination patterns. This suggests that discrimination difficulties are not uniform across groups of L2 learners, at least at the initial stage of learning, as a result of their differing native (L1) phonemic inventories.
When non-native sounds are categorised according to native categories, this is known as a “learning scenario” in the L2LP theoretical framework, as “perceptual assimilation patterns” in PAM, and as “equivalence classification” in SLM. However, it is important to note that whereas L2LP and PAM explore these learning scenarios or assimilation patterns by investigating L2 or non-native phonemic contrasts, SLM focuses on the similarity or dissimilarity between individual L1 and L2 sound categories, rather than contrasts. Specifically, L2LP and PAM posit that contrasts which are present in the native language inventory may be easier to discriminate in the L2 than contrasts which are not present in the L1. This has been demonstrated in Spanish listeners’ difficulty to perceive and produce the English /i/–/ɪ/ contrast (Escudero and Boersma 2004; Escudero 2001, 2005; Flege et al. 1997; Morrison 2009). This may be attributed to the fact that the Spanish vowel inventory does not contain /ɪ/ and Spanish listeners often perceive both sounds in the English contrast as one native sound category. The Spanish listeners’ difficulty with the English /i/–/ɪ/ contrast can be considered an example of the NEW scenario in L2LP and single-category assimilation in PAM. That is, the two sounds in the non-native contrast are perceived as one single native category. Both models predict that this type of learning scenario (or assimilation pattern) will result in difficulties for listeners when discriminating these speech sounds. Specifically, according to the L2LP framework, the NEW learning scenario is predicted to be difficult because in order for listeners to acquire both sounds (the learning task), a learner must either create a new L2 category or split an existing L1 category (van Leussen and Escudero 2015; Elvin and Escudero 2019).
In contrast, German learners, who have a /i/–/ɪ/ contrast in their L1 vowel inventory, have fewer difficulties when perceiving the contrast in English than Spanish learners (Bohn and Flege 1990; Flege et al. 1997; Iverson and Evans 2007). It is likely that this is an example of the SIMILAR learning scenario in L2LP1, and PAM’s two-category assimilation, whereby the two non-native sounds in the contrast are mapped onto two separate native vowel categories. Both PAM and L2LP would predict that a scenario (or assimilation pattern) of this type would be less problematic for listeners to discriminate than a NEW scenario (or Single Category assimilation) as they can rely on their existing L1 categories to perceive the difference between the L2 phones. In the L2LP framework, the learning task is considered to be easier because learners simply need to replicate and adjust their L1 categories so that their boundaries match those of the L2 contrast (van Leussen and Escudero 2015; Elvin and Escudero 2019; Yazawa et al. 2020). A third scenario, known as the SUBSET scenario (i.e., multiple category assimilation) in L2LP, occurs when one or both sounds in the L2 contrast are perceived as two or more native L1 categories. This scenario may be comparable to focalised, clustered or dispersed uncategorised assimilation in PAM (Faris et al. 2016). While some studies suggest that this learning scenario is not problematic for L2 learners (e.g., Gordon 2008; Morrison 2009, 2003), other studies have shown the SUBSET scenario (or PAM’s uncategorised assimilation) to lead to difficulties in discrimination (Escudero and Boersma 2002), particularly when a perceptual or acoustic overlap between the two non-native sounds in the contrast and the perceived native categories occurs (Bohn et al. 2011; Elvin et al. 2014; Tyler et al. 2014; Vasiliev 2013). That is, the two vowels in the contrast are perceived as (or are acoustically similar to) the same multiple categories. For example, Elvin (2016) found that the Brazilian Portuguese vowels /i/ and /e/ were both acoustically similar to and perceived as the same multiple categories in Australian English, namely /iː/, /ɪ/, and /ɪə/. In the L2LP framework, this poses a difficult challenge for learners as they must first realise that certain features or sounds in the target language do not exist, that they cannot process them in the same manner as their L1, and must therefore proceed in a similar manner as with the learning task for the NEW scenario (Elvin and Escudero 2019). The SUBSET scenario can therefore be divided into two categories: SUBSET EASY (or uncategorised non-overlapping in PAM), when the two vowels in the L2 contrast are acoustically similar to and perceived as multiple L1 categories without any overlap, and SUBSET DIFFICULT (or uncategorised overlapping), where the two vowels in the L2 contrast are acoustically similar to and perceives as multiple categories with overlap. A diagram that shows examples of the L2LP scenarios can be seen in Figure 1.
As the above theoretical models claim, it is the similarity of L2 sounds to native categories that determines L2 discrimination accuracy. It could be the case that individuals whose L1 vowel inventory is larger and more complex than that of the L2 may be faced with relatively less difficulty discriminating L2 vowel contrasts simply because there are many native categories available onto which the L2 vowels can be mapped. Indeed, Iverson and Evans (2007, 2009) found that listeners with a larger vowel inventory (e.g., German and Norwegian) than the L2 were more accurate and had higher levels of improvement post-training at perceiving L2 vowels (e.g., English) than those with a smaller vowel inventory (e.g., Spanish). However, other studies have found that having a larger native vowel inventory than the L2 does not always provide an advantage in L2 discrimination. For instance, recent studies have shown that Australian English listeners do not discriminate Brazilian Portuguese (Elvin et al. 2014) or Dutch (Alispahic et al. 2014; Alispahic et al. 2017) vowels more accurately than Spanish listeners, despite the fact that the Australian English vowel inventory is larger than Brazilian Portuguese and approximately similar in size to that of Dutch, while the Spanish vowel inventory is smaller than those of both Brazilian Portuguese and Dutch. In fact, the findings in Elvin et al. (2014) indicate that Australian English and Spanish listeners found the same Brazilian Portuguese contrasts perceptually easy or difficult to discriminate despite their differing vowel inventory sizes, and that overall, Spanish listeners had higher discrimination accuracy scores than English listeners.
Thus, it seems that vowel inventory size was a good predictor of L2 discrimination performance for some of the aforementioned studies, but not all, which may suggest that this factor alone is not sufficient for predicting L2 discrimination performance. After all, theoretical models such as L2LP and PAM claim that the acoustic-phonetic or articulatory-phonetic similarity between the vowels in the native and target languages, rather than phonemic inventory per se, predict L2 discrimination performance. In fact, the L2LP model claims that individuals detect phonetic information in both the L1 and L2 by paying attention to specific acoustic cues (e.g., duration, voice onset time and formants frequencies) in the speech signal. As a result, any acoustic variation in native and target vowel production can influence speech perception (Williams and Escudero 2014). Specifically, the model proposes that the listener’s initial perception of the L2 vowels should closely match the acoustic properties of vowels as they are produced in the listener’s first language (Escudero and Boersma 2004; Escudero 2005; Escudero et al. 2014; Escudero and Williams 2012). In this way, the L2LP model proposes that both L2 and non-native categorisation patterns and discrimination difficulties can be predicted through a detailed comparison of the acoustic similarity between the sounds of the native and target languages.
This L2LP hypothesis is supported by a number of studies which show that acoustic similarity successfully predicts non-native and L2 categorisation and/or discrimination (e.g., Elvin et al. 2014; Escudero and Chládková 2010; Escudero and Williams 2011; Escudero et al. 2014; Escudero and Vasiliev 2011; Gilichinskaya and Strange 2010; Williams and Escudero 2014). For example, acoustic comparisons successfully predicted that Salento Italian and Peruvian Spanish listeners would categorise Standard Southern British English vowels differently, despite the fact that their vowel inventories contain vowels that are typically represented with the same IPA symbol. The difference was predicted because, despite those shared transcriptions, the acoustic realisations of the five vowels are not identical across the two languages (Escudero et al. 2014). Furthermore, as previously mentioned, Elvin et al. (2014) investigated Australian English and Iberian Spanish listeners’ discrimination accuracy for Brazilian Portuguese vowels and found that a comparison of the type and number of vowels in native and non-native phonemic inventories was not sufficient for predicting L2 discrimination difficulties, and that accurate predictions can be achieved if acoustic similarity is considered. Specifically, the L2LP model posits that for the most accurate predictions, the acoustic data should be collected from the same group of listeners intended for perceptual testing. It is this postulate that differentiates L2LP from both PAM/PAM-L2 and SLM, which is the reason we use L2LP as the framework for the current research.

The Present Study

The present study investigates the non-native categorisation and discrimination of Brazilian Portuguese (BP) vowels by Australian English (AusE) and European Spanish (ES) listeners. Similar to Elvin et al. (2014), these language groups were chosen on the basis of their differing inventory sizes. The AusE vowel inventory contains thirteen monophthongal vowels, namely /iː, ɪ, ɪə2, e, eː, ɜː, ɐ, ɐː, æ, oː, ɔ, ʊ and ʉː/, and is larger than BP, which has seven oral vowels, /i, e, ɛ, a, o, ɔ, u/, while ES has the smallest vowel inventory of the three languages, containing five vowels, /i, e, a, o, u/. Unlike Spanish and Portuguese vowels which are relatively stable in their production, AusE vowels are known to be more dynamic and this has been shown to affect discrimination of some AusE contrasts (see Williams et al. 2018 and Escudero et al. 2018). In this study, we use the L2LP theoretical framework to investigate (1) whether detailed acoustic comparisons using the AusE and ES participants’ own native production data successfully predict their non-native categorisation of BP vowels, (2) whether the L2LP learning scenarios identified in non-native categorisation subsequently predict their BP discrimination patterns, and (3) whether measures of acoustic and perceptual (categorisation) overlap are equally good predictors of discrimination accuracy at both group and individual levels (i.e., using individual overlap scores vs. group averages).
While most empirical research in L2 vowel perception investigates L2 development for groups of learners, the present study investigates non-native perception from a group versus an individual perspective. Studies typically focus on learner groups rather than individuals because speech communities have shared linguistic knowledge that allows them to understand each other. As a result, most researchers are particularly interested in how populations behave and how their shared L1 knowledge is relevant to L2 learning. Despite the fact that many researchers are aware that some variability does exist among individuals (Mayr and Escudero 2010; Smith and Hayes-Harb 2011), the group data obtained are generally sufficient for their purposes of demonstrating that shared knowledge of the sound patterns of the L1 influences L2 speech perception. Importantly, however, other studies (e.g., Díaz et al. 2012; Smith and Hayes-Harb 2011; Wanrooij et al. 2013) have shown that an investigation of individual differences can be important for understanding L2 development. For example, Smith and Hayes-Harb (2011) warn that researchers need to be careful in drawing general conclusions about typical performance patterns for L2 listeners based on group averages, as individual data may be crucial to interpreting group results, especially given the large variety of situations that influence L2 learning by individual learners.
Most of the studies that investigate individual differences in L2 speech perception focus predominately on factors such as age of acquisition, length of residence, language use or motivation (Escudero and Boersma 2004; Flege et al. 1995). In particular, much of the research conducted under the SLM theoretical framework (e.g., Flege et al. 1997, 1995) investigated the above extra-linguistic factors as a means of explaining the degree of foreign accent in an L2 learner. However, even when these factors are controlled, individual differences still seem to persist (Jin et al. 2014; Sebastián-Gallés and Díaz 2012). Furthermore, studies have shown that there are differences in how people hear phonetic cues despite having similar productions that may be related to their auditory processing or their auditory memory (see Wanrooij et al. 2013; Antoniou and Wong 2015). The fact that individual differences persist even when possible factors that influence such variations are controlled suggests that there are real cognitive differences amongst individuals, such as processing style, that influence second language learning. Therefore, language learners, even those at the initial stage (i.e., the onset of learning), may follow different developmental paths to successful acquisition of L2 speech based on their differing cognitive styles and exposure (for a review on recent literature relating to individual differences in processing, see Yu and Zellou 2019). While SLM investigates differences among L2 learners at the level of experiential factors such as age of acquisition and language exposure, the approach is to group learners according to these factors prior to comparing their performance (Colantoni et al. 2015). Studies investigating perception under the framework of PAM also acknowledge the existence of individual differences among listeners; however, few studies are yet to explain such differences. In fact, Tyler et al. (2014) found individual differences in assimilation of non-native vowel contrasts, and proposed that individual variation should be considered when predicting L2 difficulties, but did not examine the sources of the individual differences they had observed. This is where the L2LP model may be particularly relevant: it was specifically designed to account for individual variation among non-native speakers at all stages of learning and across different learning abilities (i.e., perception, word recognition and production). As a result, L2LP predictions can be made for individual learners based on detailed acoustic comparisons of their L1 categories and the categories of the specific target language variety (Colantoni et al. 2015, p. 44).
In our investigation of individual variation, we focus specifically on the fact that individuals from the same native language background may have different acoustic realisations of vowels and this factor may predict individual differences in perceptual performance. That is, the within-category variation in native production may influence non-native categorisation and discrimination. Very few studies (e.g., Levy and Law 2010) have collected vowel productions from the same listeners that they tested in perception, which, according to the L2LP model, is an essential ingredient for accurate predictions of L2 difficulty and for the identification of any individual variation that may be caused by individuals’ different acoustic realisations of their own native vowels. Thus, although representative acoustic measurements from the listener populations have successfully explained L2 perceptual difficulty, such comparisons may not account for individual variation among listeners.
The present study reports native acoustic production as well as non-native categorisation and discrimination data from the same participants across all tasks. Although we look at individual versus group data in this study, it is important to note that unlike most other studies of perception and production, the group data we use for perception and production are from the same individuals, which may make the group data more reliable than data for perception and production taken from different groups. Furthermore, the BP acoustic data that we use to measure acoustic similarity are the same recordings that we use as stimuli in the non-native categorisation and discrimination tasks. By doing so, we are able to make predictions relating to the actual stimuli that the participants were presented with, rather than averages taken from other speakers and for vowels in other phonetic contexts. We also control for variation within languages and speakers by ensuring that the participants in each BP-naïve listener group, as well as the speakers in our target BP dialect, were all of similar ages selected from a single urban area within each of their respective countries. By controlling for variation relating to language experience, age and native background, we are able to conduct a carefully controlled investigation of individual differences in non-native perception that may be explained by individual differences in L1 production.
We chose the /fVfe/ context as our target BP stimuli to ensure that our data were comparable to previous studies, specifically Elvin et al. (2014) and Vasiliev (2013). Vasiliev (2013) originally selected target vowels extracted from a voiceless fricative rather than stop context because the voiceless stops differ in VOT (voice onset time) and formant transitions among Spanish, Portuguese, and English. In Elvin et al. (2014), the Australian English acoustic predictions were based on the Cox (2006) corpus, which contained acoustic measurements of adolescent speakers from the Northern Beaches (north of Sydney in New South Wales), collected in the 1990s and extracted from an /hVd/ context. However, Elvin et al. (2016) found that vowel duration and formant trajectories varied depending on the consonantal context in which they were produced. Specifically, vowels produced in the /hVd/ context were acoustically the least similar to the vowels produced in all of the remaining consonantal consonants. Thus, /hVd/ may not be the most representative phonetic context for predicting L2 vowel perception difficulty; in this study, we instead formulated predictions based on native vowels produced in the same phonetic context used as stimuli in testing.
To measure acoustic similarity between vowels, Elvin et al. (2014) used Euclidean Distances between the reported F1 and F2 averages for each vowel. However, because native production data were available for the present study we instead used cross-language discriminant analyses as a method of measuring acoustic similarity, to use in predicting performance in the non-native categorisation and discrimination tasks. This should improve predictions of acoustic similarity over those from simple Euclidean Distance, as we are able to include more detailed acoustic information relevant for vowel perception as input parameters for each individual participant3.
Considering that patterns of non-native categorisation underlie discrimination difficulties, which according to the L2LP model is predictable based on acoustic properties, the inclusion of non-native categorisation data in the present study further allows for an investigation of whether or not listeners’ individual categorisation patterns do in fact predict difficulty in discrimination. The incorporation of a categorisation task also allows us to investigate whether the L2LP learning scenarios at the onset of learning (unfamiliar BP stimuli) are similar across the two listener groups of differing vowel inventories (ES and AusE).
It was essential that we replicated and extended the discrimination task reported in Elvin et al. (2014) with this new set of participants who also completed the native production and non-native categorisation tasks, in order to adequately test the individual difference assumptions of the L2LP model. The L2LP model explicitly states that different listeners have different developmental patterns and it is important to conduct all tasks on the same set of listeners. To this end, we selected naïve listeners in both non-native groups who represent the initial stage of language learning in the L2LP framework. Their inclusion provides a good opportunity for assessing differences in language learning ability that are not confounded by other factors that vary widely among actual L2 learners.
The discrimination task in the present study further differs from that reported in Elvin et al. (2014) in that the vowels are presented in a nonce word context rather than as vowels in isolation. We made this change because, outside of the laboratory, learners are faced with words rather than vowels in isolation. The L2LP model assumes continuity between lexical and perceptual development, specifically positing that perceptual learning is triggered when learners attempt to improve recognition by updating their lexical representations (van Leussen and Escudero 2015). Furthermore, if listeners do not interpret the stimuli as speech, which could potentially occur with isolated vowels (particularly synthesized rather than natural vowels), then language-specific L1 knowledge may play less of a role in their perception. That is, listeners from different L1 backgrounds may perceive non-speech in a similar manner but differ in how they perceive the vowels that they perceive to be speech. Given the fact that there were very few group differences in Elvin et al. (2014), it might be that the stimuli were not engaging native language phonology sufficiently reliably for all listeners. Thus, the presentation of vowels in the context of a nonce word not only reflects learning that is closer to a real world situation but also these more speech-like materials allow us to determine whether language-specific knowledge played less of a role in their discrimination of BP.
The present study is therefore, to our knowledge, one of the first to evaluate predictions about L2 perception (both non-native categorisation and discrimination) based on the listeners’ own native productions, thereby providing a novel test of one of L2LP’s core assumptions. In Section 2, native AusE and ES listeners’ native vowel productions are compared to the BP production data that are used as stimuli in the non-native categorisation task (Section 3) and the XAB discrimination task (Section 4). Results from the cross-language acoustic comparisons are used to predict the non-native categorisation patterns in Section 3 and the discrimination results in Section 4. As mentioned above, the participants in the cross-language acoustic comparisons were the same as the participants in the non-native categorisation and discrimination tasks. We do note that the results presented in the cross-language acoustic comparisons and the non-native categorisation tasks are descriptive as we use their categorisation patterns to predict discrimination results in Section 4. In regards to a power analysis of the sample size, for experiment designs with repeated measures analysed with mixed-effects models, Brysbaert and Stevens (2018) recommend a sample size of at least 1600 observations per condition. In our non-native discrimination task, each of the 40 participants completed 40 trials per BP contrast, therefore, this recommendation was met (40 participants × 40 trials = 1600 observations per BP contrast). We do acknowledge a loss of five participants in the non-native categorisation task and we address how this affects our power in our modelling analyses in Section 4.

2. Cross-Language Acoustic Comparisons

2.1. Participants

Twenty Australian English (AusE) monolingual listeners from Western Sydney and twenty European Spanish (ES) monolingual participants from Madrid participated in this study. All participants were Australian English or European Spanish listeners currently residing in Greater Western Sydney or Madrid, respectively, and aged between 18 and 30 years old. The AusE participants reported little to no knowledge of any foreign language. The ES participants reported little to intermediate knowledge of English and little to no knowledge of any other foreign language. AusE participants were recruited through the Western Sydney University psychology pool or from the Greater Western Sydney region, and received $40 AUD for their participation. ES participants were recruited from universities and institutes around the Universidad Nacional de Educación a Distancia and received €30 for their time. All participants were part of a larger-scale study that looked at the interrelations among non-native speech perception, spoken word recognition and non-native speech production. All participants provided informed consent in accordance with the ethical protocols in place at the Universidad Nacional de Educación a Distancia and the Western Sydney University Human Research Ethics Committee.

2.2. Stimuli and Procedure

AusE and ES participants completed a native production task in which they read pseudo-words containing one of the 13 Australian English monophthongs, namely, /iː, ɪ, ɪə, e, eː, ɜː, ɐ, ɐː, æ, oː, ɔ, ʊ and ʉː/, or one of five European Spanish vowels, /i, e, a, o, u/, in the /fVf/ (AusE) or /fVfo/ (ES) context. There were 10 repetitions of each vowel, presented in a randomised order, which provided a total of 130 tokens for AusE and 50 tokens for ES per participant. The tokens we used for the analysis of BP vowels were the same as those we used as stimuli in the non-native categorisation and non-native discrimination task. That is they were tokens presented in pseudo-words in the /fVfe/4 context, produced by five male and five female speakers from São Paulo, selected from the Escudero et al. (2009) corpus. There were a total of 70 BP vowel tokens (one repetition per vowel, per speaker). These BP pseudo-words were produced in isolation and within a carrier sentence e.g., “Fêfe. Em fêfe e fêfo temos ê” which translates to: “Fêfe. In fêfe and fêfo we have ê” Escudero et al. (2009). In our analyses, we selected the vowel in the first syllable of the isolated word which was always stressed and corresponded to one of the seven Portuguese vowels /i, e, ɛ, a, o, ɔ, u/. We used WebMaus (Kisler et al. 2012), an online tool used for automatically segmenting and labelling speech sounds, to segment vowels within each target word in each language (AusE, ES and BP). The automatically generated start and end boundaries were checked and manually adjusted to ensure that they corresponded to the onset/offset of voicing and vocalic formant structure. Vowel duration was measured as the time (ms) between these start and end boundaries. Formant measurements for each vowel token were extracted at three time points (25%, 50%, 75%) following the optimal ceiling method reported in Escudero et al. (2009), in order to ensure that our methods of formant extraction are comparable across both the target and native languages. In the optimal ceiling method, the “ceiling” for formant measurements is selected by vowel and by speaker to minimize variation for the first and second formant values. Formant ceilings ranged between 4500 and 6500 Hz for females and between 4000 and 6000 for males.

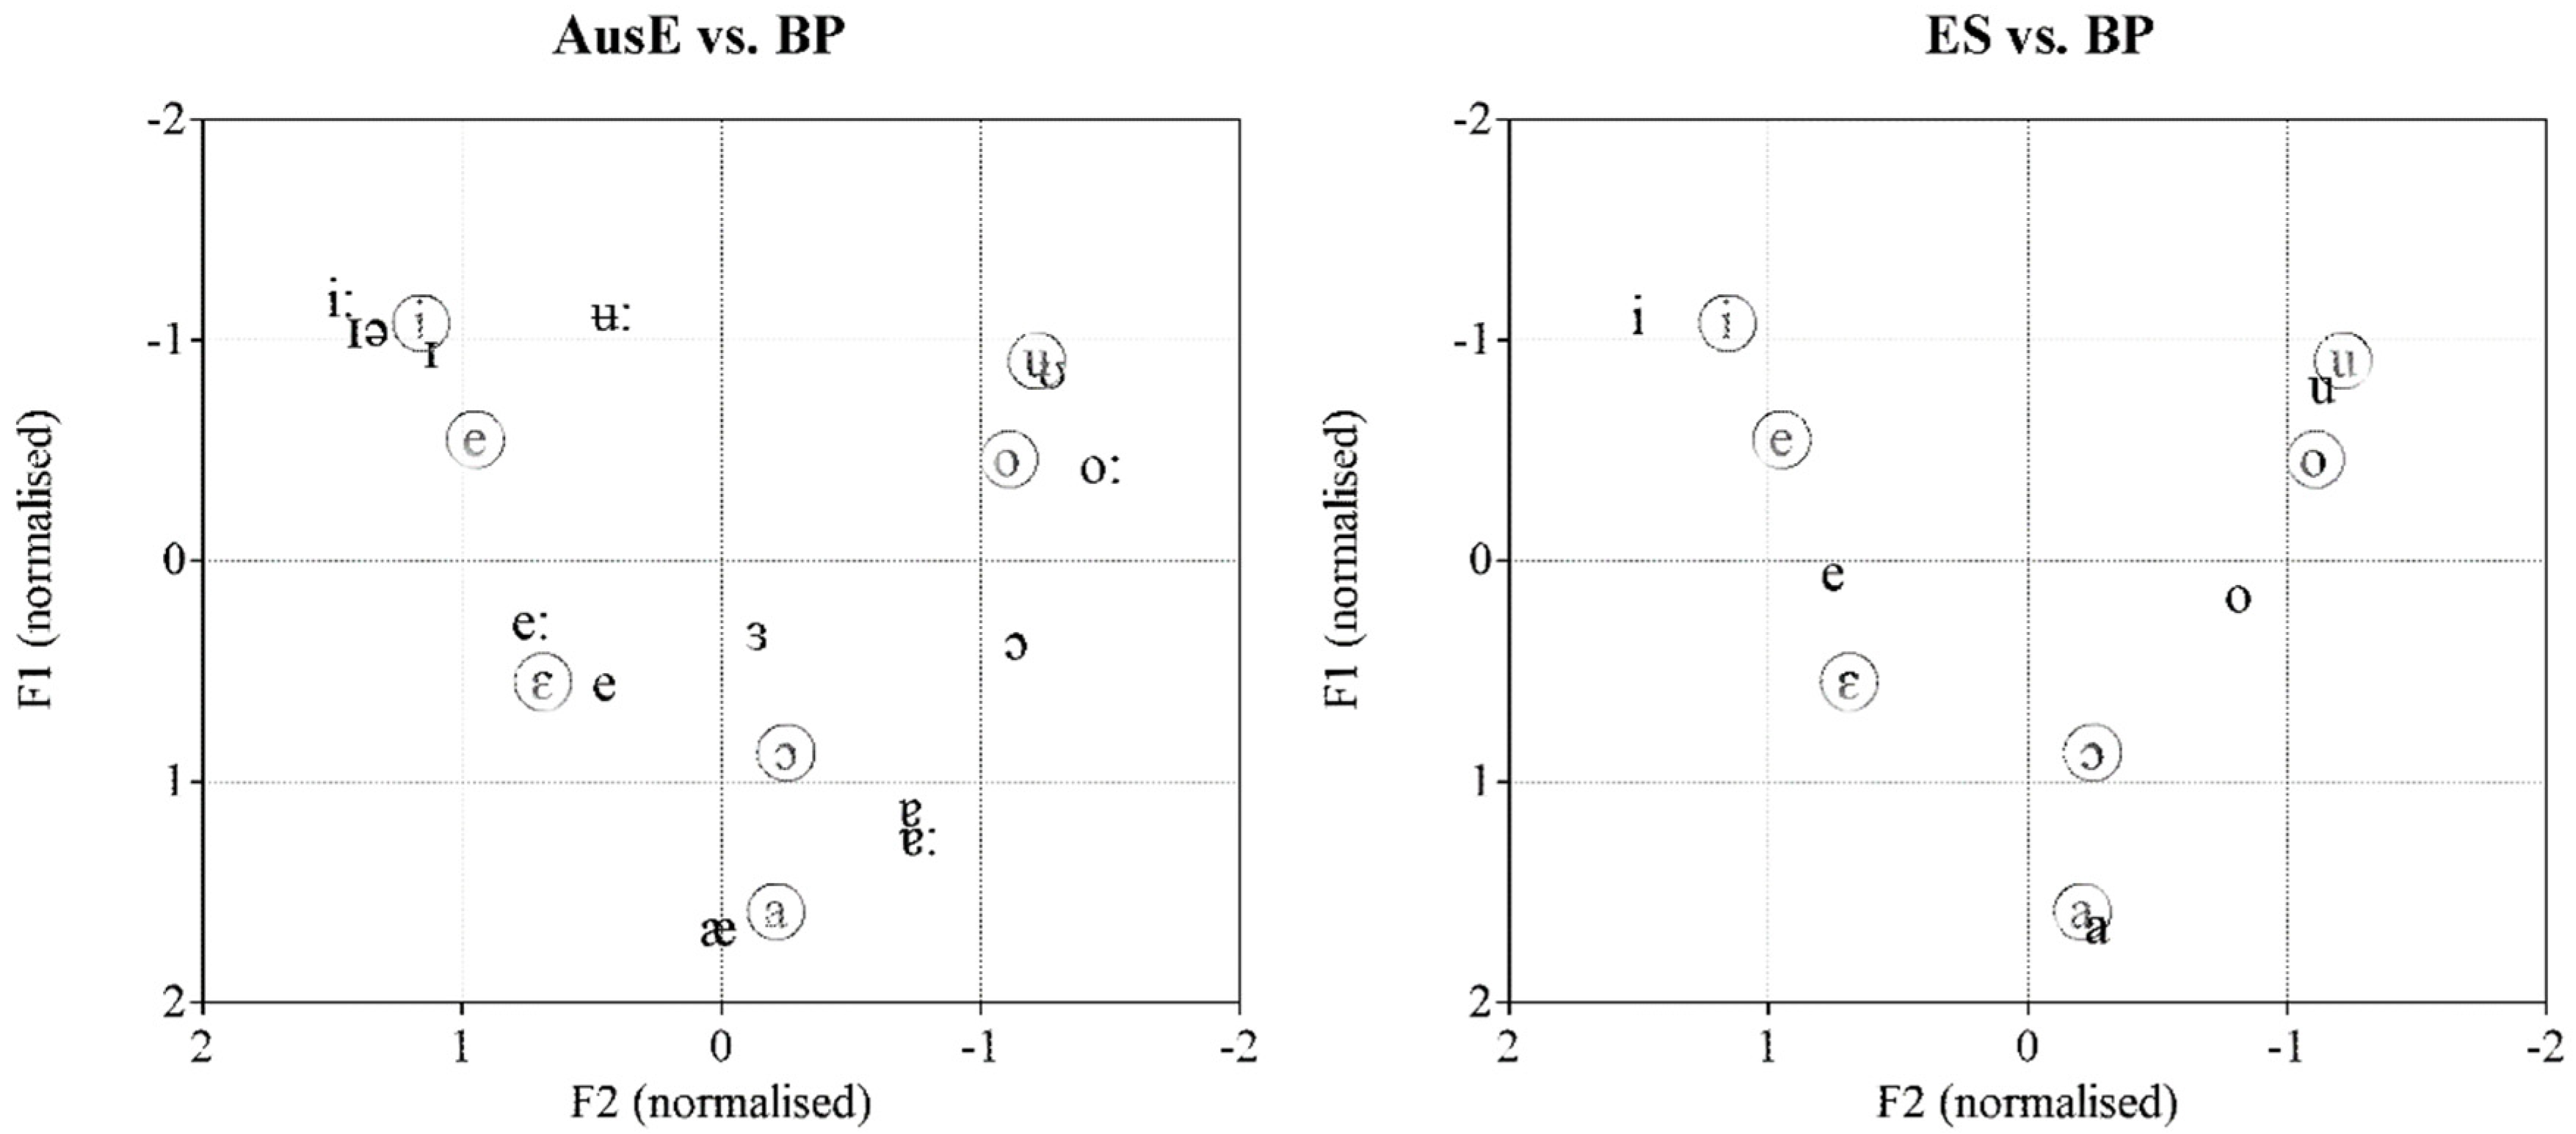
2.3. Results: Cross-Language Acoustic Comparisons

Figure 2 shows the average (of all speakers) midpoint F1 and F2 normalised values of the thirteen AusE (black) and five ES (blue) vowels, together with the average (of all speakers) midpoint F1 and F2 normalised values for the BP (purple, circled) vowels that were selected from Escudero et al. (2009) and used as stimuli in the present study. The Lobanov (1971) method was implemented to normalise vowels using the NORM suite (Thomas and Kendall 2007) in R. This specific normalisation method was chosen because it resulted in the best classification performance for the same Brazilian Portuguese vowels used in this study as shown by Escudero and Bion (2007).
Visual inspection of the plot reveals that although AusE has many more vowels in its native vowel inventory than ES, the vowels of both languages fall in and around similar locations along a rough inverted triangle within the acoustic space. Following Strange et al. (2004) and Escudero and Vasiliev (2011), we conducted a series of discriminant analyses as a quantitative measurement of acoustic similarity and used these analyses to predict listeners’ non-native categorisation patterns. Before comparing our target language’s acoustic similarity with Brazilian Portuguese, we first needed to determine how a trained AusE or ES discriminant analysis model would classify tokens from the same native language (known as a cross-validation method). To this end, we fit four separate linear discriminant analysis models: AusE females; AusE males; ES females; ES males. These analyses were conducted to determine the underlying acoustic parameters that predict the vowel categories for test tokens from the BP corpus. The input parameters were F1 and F2 (normalised) values measured at the vowel midpoint (i.e., 50%) as well as duration. We also ran discriminant analyses using F1, F2 and F3 (Bark, duration and formant trajectory as input parameters. We report the results for the discriminant analyses using normalised values as they were more accurate than the values in Bark for both languages. The ES model yielded 98% correct classifications for both males and females, and the AusE model yielded 91.2% (females) and 90.4% (males) correct classifications.
We then conducted a cross-language discriminant analysis, using F1 and F2 normalised values (measured at 50%) and duration as input parameters to determine how likely the BP vowel tokens would be categorised in terms of AusE and ES vowel categories. We fit one model for each individual AusE and ES listener for a total of 40 LDA models. For each individual model, the training data consisted of the 6 tokens of each AusE vowel produced by that same speaker that for which the model was being tested, resulting in a total of 78 native tokens. The test tokens were the same for each of the individual LDA models, that is, 70 male and female BP tokens which were also used as stimuli in the non-native categorisation and discrimination tasks.
In some previous work that has used a typical discriminant analysis, the vowels in the test corpus (in our case BP) are categorised with respect to linear combinations of acoustic variables established by the input corpus (Strange et al. 2004). In other words, the discriminant analysis tests how well the BP tokens can be classified into the vowel categories of the (AusE or ES) input corpus, providing a predicted probability that each vowel token will be categorised as one of the native vowel categories (Strange et al. 2004). Further, the discriminant analysis tests how well the BP tokens fit with centres of gravity of the input corpus tokens (AusE or ES), providing a predicted probability that each vowel will be categorised as one of the native vowel categories. The native vowel category that receives the highest probability for a given BP vowel indicates the native vowel that is acoustically closest to the non-native vowel.
Given the fact that we only have one token per vowel per BP speaker (5 male and 5 female), rather than reporting the overall percentage of times a BP vowel was categorised as a native vowel as is commonly reported (and is usually based on many more tokens), we instead report the probabilities of group membership averaged across the BP vowel tokens: For each individual BP vowel token, we report the predicted probability of it being categorised as any of the 13 native AusE or 5 native ES vowels and average these probabilities over all speakers’ tokens for that BP vowel. The benefit of reporting average probabilities across tokens in the present study is that it takes into account that some BP tokens may be acoustically close to more than one vowel, which can be masked by categorisation percentages. The predicted probabilities averaged across the BP tokens for an individual listener and then averaged across all listeners in the AusE and ES groups for AusE and ES are shown in Table 1 and Table 2, respectively.
We take the across-individual average probability of vowel group membership to correspond to the degree of acoustic similarity, i.e., a high probability indicates a high level of acoustic similarity. Table 1 shows the averaged probabilities of predicted group membership, which we interpret as being representative of the “average listener”. The table of averaged probability scores reveals that each BP vowel showed a strong similarity to a single AusE vowel. However, six of these also showed lower levels of above-chance similarity to one or more other AusE vowels. In the cases where a BP vowel is acoustically similar to two or more AusE vowels, the similarity is not equal across the vowel categories, with the probability scores indicating a greater likelihood of classification of one vowel over the other. An acoustic categorisation overlap can be observed for BP contrasts /i/–/e/ and /o/–/u/, where each vowel in the BP contrast is acoustically similar to the same native AusE vowel(s). In the case of BP /i/–/e/, there is a 0.71 probability that BP /i/ will be categorised as AusE /ɪ/ and a 0.59 probability that BP /e/ will also be categorised as AusE /ɪ/. There is also a 0.22 probability that BP /i/ will be categorised as AusE /iː/, and a probability of 0.13 that BP /e/ will be categorised as AusE /iː/. There is also a 0.11 probability that BP /e/ will be categorised as AusE /ɪə/ as well as a 0.10 probability that it could be categorised as AusE /ʉː/. For BP /o/–/u/ there is a 0.53 probability that BP /o/ will be categorised as AusE /ʊ/ and a 0.92 probability that BP /u/ will be categorised as AusE /ʊ/. We also observe a 0.20 probability that BP /o/ will also be categorised as AusE /oː/. Partial acoustic overlapping is also observed in the BP /o/–/ɔ/ contrast with a 0.26 probability for BP /o/ and a 0.25 probability for BP /ɔ/ to be categorised as AusE /ɔ/. There was also a 0.32 probability that BP /ɔ/ will be categorised as AusE /ɐ/ and we therefore observe a very minimal acoustic overlap with BP /a/. Although there is a 0.74 probability that BP /a/ will be categorised as AusE /æ/, we do see a 0.15 probability that BP /a/ will be categorised as AusE /ɐ/. Finally, we do not see any acoustic overlapping in the BP /a/–/ɛ/.
Table 2 shows the BP tokens tested on the ES model. The results indicate that BP /i/, /ɛ/, /a/ and /u/ are each acoustically similar to different single native categories, namely ES /i/, /e/, /a/, and /u/. while the remaining three BP vowel categories (/e/, /o/ and /ɔ/) show moderate (but much lower) acoustic similarity to a second ES vowel. Similar to the AusE categorisation above, when a BP vowel is acoustically similar to two ES vowels, the similarity is not equal across both categories, with the probability scores indicating a greater likelihood of classification of one vowel over the other. For example, there is a 0.77 probability that BP /e/ would be categorised as ES /e/ and a 0.23 probability of it being categorised as ES /i/. There is also a 0.78 probability that BP /o/ will be categorised as ES /u/ and only a 0.22 probability that it will be categorised as ES /o/. In the case of BP /ɔ/, there is a 0.64 probability that it will be categorised as ES /o/, a 0.27 probability that it would be categorised as ES /e/.
Cases of acoustic overlap can be identified in the ES predicted probabilities of categorisation for the BP contrasts /i/–/e/, /e/–/ɛ/, /o/–/u/ and /o/–/ɔ/. Specifically, in the case of BP /e/–/ɛ/, both vowels were acoustically closest to ES /e/, and in the case of BP /o/–/u/ both vowels were closest to ES /u/. Furthermore, there is a small amount of acoustic overlap in the BP contrasts /i/–/e/ and /o/–/ɔ/. In BP /i/–/e/, while the majority of /i/ tokens and the majority of /e/ tokens were acoustically similar to ES /i/ and /e/, respectively, a smaller percentage of the BP /i/ tokens were acoustically similar to ES /e/ and a smaller percentage of BP /e/ tokens were acoustically similar to ES /i/. A similar result is found with /o/–/ɔ/ as the majority of the BP /ɔ/ tokens were acoustically similar to ES /o/ and a smaller percentage of BP /o/ tokens were acoustically similar to ES /o/. Finally, we do not see any evidence of acoustic overlap for BP /a/–/ɛ/ and /a/–/ɔ/.

2.4. L2LP Predictions for Non-Native Categorisation

The acoustic similarity as determined by the probability scores from our discriminant analyses are used to predict perceived phonetic similarity in a categorisation task. For AusE, there are several cases where the two vowels in the BP contrast are acoustically similar to more than two native categories (in other words, there were predicted probabilities that the BP vowel tokens could be categorised as more than two native categories, with a predicted probability greater than chance). We therefore predict several cases of L2LP’s SUBSET EASY and SUBSET DIFFICULT scenarios. Based on the acoustic results averaged across participants, it is likely that all BP vowels will be categorised as more than one native category. For BP /a/–/ɛ/, there is no acoustic overlapping and thus, in non-native categorisation, we expect to find the SUBSET EASY scenario where each BP vowel in the contrast is perceived as more than one native category, but there is no overlapping between the response choices for the two vowels. Where acoustic overlapping occurs, we expect to find the SUBSET DIFFICULT learning scenarios in the non-native categorisation patterns. Specifically, we expect to find perceptual overlap in the non-native categorisation of the BP contrasts /i/–/e/ and /o/–/u/. Partial acoustic overlapping might also lead to instances of the SUBSET DIFFICULT scenario for BP /a/–/ɔ/ and /o/–/ɔ/.
For the ES listeners, we predict on the basis of the LDA results that most BP vowels should be categorised as one single native category. In particular, we expect that BP /i/, and /a/ will be categorised as /i/ and /a/, respectively. Furthermore, we expect to see cases of L2LP’s NEW and SIMILAR scenarios. Specifically, we expect to observe instances of the SIMILAR scenario for ES participants in the BP /i/–/e/ and /a/–/ɛ/ contrasts because both vowels in the BP contrast are acoustically similar to separate native categories, with predicted probabilities above 75%. Despite the fact that categorisation of BP /ɔ/ is spread across multiple response categories, we would still predict a case of the SIMILAR scenario for BP /a/–/ɔ/ given the fact that there is no acoustic overlap in the response categories. In contrast, examples of the NEW scenario are predicted for BP /e/–/ɛ/ and /o/–/u/ because both BP /e/ and /ɛ/ are acoustically similar to ES /e/, and both /o/ and /u/ are acoustically similar to ES /u/, with predicted probabilities above 75% It is likely that BP /o/ will be categorised to two native categories as there is a 0.78 probability that it will be categorised as ES /u/ and a 0.22 chance it will be categorised as ES /o/. Finally, BP /ɔ/ should predominately be categorised as ES /o/, but it might also be categorised as ES /e/.

2.5. L2LP Predictions for Non-Native Discrimination

The L2LP model claims that discrimination difficulty can be predicted by the acoustic similarity between native and target language vowel categories, unlike PAM which makes predictions based on articulatory-phonetic similarity and collects perceptual assimilation data and category-goodness ratings to test its predictions. Perhaps the reason that acoustic similarity can be used to predict discrimination difficulty is because acoustic properties and articulation relate to one another (Noiray et al. 2014; Blackwood et al. 2017; Whalen et al. 2018). For example, Noiray et al. (2014) have shown that variation in vowel formants correspond closely to variations in the vocal tract area function and even coarser grained articulatory measures such as height of the tongue body. Whalen et al. (2018) compared articulatory and acoustic variability using data from an x-ray microbeam database and found that contrary to popular belief, articulation was not more variable than acoustics, but that variability was consistent across vowels and that articulatory and acoustic variability were related for the vowels. Given this relationship it seems reasonable that acoustic similarity be equal to perceptual similarity in its ability to predict discrimination difficulty. As mentioned in the introduction, we are interested in whether or not acoustic similarity can predict discrimination accuracy and in particular, whether it is comparable to perceptual similarity. One way to measure acoustic and/or perceptual similarity is to calculate the amount of acoustic/perceptual overlap that can be found in a given BP contrast. When two vowels in BP are acoustically/perceptually similar to the same listener vowel category(ies), discrimination of the BP vowels is predicted to be difficult. In this section we use the LDA results to determine how much BP vowels overlap with our listener’s native vowel categories and a similar method will be used to measure the amount of perceptual similarity in the non-native categorisation task. We predict that the perceptually easy contrasts for both groups of listeners to discriminate would be those with little to no acoustic overlap (i.e., the two vowels in the BP contrast are acoustically similar to different native categories). The BP contrasts with a large amount of acoustic overlap (i.e., the two BP vowels in the contrast are acoustically similar to the same native category(ies)) should be difficult to discriminate.
To quantify acoustic overlap, we adopted Levy’s (2009) “cross language assimilation overlap” method. This method provides a quantitative score of overlap between the members of a non-native contrast and native categories. Although originally designed to compute perceptual overlap scores based on listeners’ perceptual assimilation patterns for testing predictions in PAM (which we do in fact apply to our categorisation data), we use our LDA results. Each overlap score was calculated by adding categorisation probabilities in cases where the two vowels in the BP contrast were categorised as the same native categories. This gives an aggregate probability of perceiving the two BP vowels as the same native category. For example, in the case of BP /i/–/e/, as observed in Table 1, there was a non-zero probability that both BP /i/ and BP /e/ would each be categorised as AusE /iː/, /ɪ/, /ɪə/ and /ʉː/. To calculate the overlap score for this contrast, we took the smaller proportion of when both BP vowels had a probability of being categorised as the same AusE vowel category for each native vowel and add those together. Thus, in the case of AusE /ɪ/ there was a 0.71 probability that BP /i/ would be categorised as this vowel and a 0.59 probability that BP /e/ would also be categorised as AusE /ɪ/. The smaller proportion in this case would be 0.59 for BP /e/, as well as AusE /iː/ (0.13), AusE /ɪə/ (0.05) and AusE /ʉː/ (0.02), which were included in the calculation of the acoustic overlap to obtain an acoustic overlap score of 0.79. Thus, summing together each of the smaller proportions, the calculation of acoustic overlap for BP /i/–/e/ was as follows: AusE /ɪ/0.59 + AusE /iː/0.13 + AusE /ɪə/0.05 + AusE /ʉː/0.02 = 0.79 acoustic overlap. Table 3 shows the acoustic overlap scores for each language.
Based on the acoustic overlap scores in Table 3, we would predict that the BP contrasts with little to no acoustic overlap would be perceptually easier to discriminate than those with higher overlap scores. In particular, both groups should find BP /o/–/u/ difficult to discriminate and BP /a/–/ɛ/ easy to discriminate. However, these acoustic comparisons do predict group differences: ES listeners should find BP /a/–/ɔ/ and /i/–/e/ easier to discriminate than AusE listeners, whereas BP /e/–/ɛ/ should be easier for AusE than ES listeners to discriminate.

3. Non-Native Categorisation

3.1. Participants

The participants in the non-native categorisation task were the same as those previously reported in the cross-language acoustic comparisons. However, the non-native categorisation results of five ES participants were excluded due to an error that occurred during testing.

3.2. Stimuli and Procedure

Participants were presented with the same BP pseudo-words that served as the test data for the discriminant analyses in the cross-language acoustic comparisons. There were a total of 70 /fVfe/ target words (7 vowels × 10 speakers), as well as three additional nonsense words by each speaker (/pipe/, /kuke/ and /sase/), included as filler words. Thus, in the non-native categorisation task we had a total of 100 BP word tokens (70 target and 30 fillers).
In keeping with Vasiliev (2013; see also, e.g., Tyler et al. 2014), this vowel categorisation task followed the discrimination task (reported in the next section) because we wanted to avoid any familiarisation with the natural stimuli in the discrimination task. We present the results of the categorisation task first because these results are used to make predictions about discrimination. In the categorisation task, participants categorised the stressed vowel sound of each target BP word (i.e., the target vowel) to one of their own 13 AusE or 5 ES vowel categories. Unlike Spanish, English is not orthographically transparent. Thus, while the ES listeners saw the 5 vowel categories (i, e, a, o, u) on the screen, the AusE vowels were presented in one of the 13 keywords, heed, hid, heared, head, haired, heard, hud, hard, had, hoard, hod, hood and who’d, which correspond to the AusE phonemes /iː, ɪ, ɪə, e, eː, ɜː, ɐ, ɐː, æ, oː, ɔ, ʊ, ʉː/, respectively. Participants heard each target and filler item once, and were required to choose one of their own native response options on each trial, even when unsure. The task did not move on to the next trial until a response had been chosen. All trials were presented in a randomised order. Participants received a short practice session before beginning the task and took approximately 10 minutes to complete it.

3.3. Results

Table 4 and Table 5 present the percentage of times each BP vowel was categorised by each group as a native AusE or a native ES vowel, respectively.
The categorisation percentages reported in Table 4 (AusE) and Table 5 (ES) are in line with our prediction based on acoustic similarity that most BP vowels would be categorised into more than two native categories by AusE listeners, and that most BP vowels would instead be categorised into one single native category by ES listeners.
Indeed, as predicted, all BP vowels were categorised as two or more native AusE categories, and there was some evidence of perceptual overlap between the expected pairs of BP vowels. In particular, we found examples of the SUBSET DIFFICULT scenario in the BP contrasts /i/–/e/, /e/–/ɛ/, /o/–/ɔ/ and /o/-u/, where both vowels in the contrast were categorised into two or more of the same native AusE vowels.
With respect to the BP /i/–/e/ contrast, BP /i/ was categorised as AusE /iː/ as well as AusE /ɪ/, 43% of the time for both vowels. This finding was predicted by acoustic similarity, however instead of there being a larger percentage of categorisation to AusE /ɪ/ as expected, categorisation was split equally across the two AusE categories. As for BP /e/, our discriminant analysis indicated it would be categorised across four native vowel categories, namely /iː/, /ɪ/, /ɪə/ and /ʉː/, with the largest classification percentage predicted to be to AusE /ɪ/. This prediction was largely consistent with AusE listeners’ non-native categorisation patterns, with /e/ being categorised as AusE /iː/ (23%), /ɪ/ (20%) and /ɪə/ (15%). Although the discriminant analysis prediction was that BP /e/ would be categorised as AusE /ʉː/ to a small extent (10%), this was not observed, and listeners instead rather substantially categorised the vowel to two unpredicted AusE vowels, /e/ (14%, i.e., as often as to /ɪə/) and /eː/ (23%, i.e., equal to the actual choices of the top acoustically predicted choice /i:/).
As for the BP contrast /e/–/ɛ/, BP /ɛ/ tokens were expected to be predominately categorised as AusE /e/ and /eː/, two of the AusE vowels to which BP /e/ was categorised. This was indeed the case as BP /ɛ/ was categorised as AusE to /eː/58% of the time and to /e/ 14% of the time.
For the BP /o/–/ɔ/ contrast, a large majority of BP /o/ tokens were acoustically predicted to be categorised as AusE /ʊ/, with a much lower probability that some would also be categorised as AusE /oː/ and /ɔ/. However, the listeners actually reversed the balance between the two AusE vowel categories: the large majority BP /o/ tokens were instead categorised as AusE /oː/ (53% of the time), and as AusE /ʊ/ only 23% of the time. Furthermore, our acoustic predictions suggested that BP /ɔ/ tokens would be categorised as a number of different AusE vowels, specifically AusE /ɐ/, /ɔ/ and /e/. However, the non-native categorisation patterns indicate that the great majority of BP /ɔ/ tokens were categorised as AusE /oː/ (58% of the time), with only 15% being categorised as /ɔ/ and 13% as /ɐː/, and none selected AusE /e/.
Finally, with respect to the BP /o/-u/ contrast, while our acoustic analysis successfully predicted the majority of BP /u/ tokens to be categorised as AusE /ʊ/ (65%), interestingly 12% of the tokens were categorised /ʉː/, which was not predicted to be a listener choice. Recall that the results of the discriminant analysis indicated a 10% probability that BP /e/ would be categorised as AusE /ʉː/ but this did not occur, yet conversely, here we see that BP /u/ was categorised as AusE /ʉː/12% of the time, although it was not predicted acoustically.
For the BP /a/–/ɛ/ and /a/–/ɔ/ contrasts, our results are partially consistent with the patterns of acoustic similarity. We found that BP /a/ was categorised as /æ/38% of the time. However, instead of the predicted moderate level of choice of AusE /æ/ (as in had) for BP /a/, the long AusE /ɐː/ (as in heart) was instead selected most frequently at 50% of the time. Given that no perceptual overlap is observed in BP /a/–/ɛ/, the categorisation pattern would correspond to a SUBSET EASY scenario. The same might also apply to BP /a/–/ɔ/. However, we do see a partial overlap, with 13% of the BP /ɔ/ perceived as AusE /ɐː/ (which was the most frequent response for BP /a/).
The minor discrepancies between the acoustic predictions and the categorisation results could be related to the fact that we selected the best fitting discriminant model that in this case did not include F3, which conveys information related to lip rounding. It may be that although in machine learning vowels can be categorised with high accuracy using duration and normalised F1 (height) and F2 (backness) values only, human listeners may not be able to help but pay attention to other aspects of the signal. Thus, human listeners may primarily use F3 when it cues rounding, an articulatory property, but ignore it (or give it unequal weight) in cases where rounding is not present. This therefore suggests that listeners seem to perceive rounding (as opposed to F3), and the likely reason they did not choose /ʉː/ in the categorisation of BP /e/ is that they did not detect the rounding that they may have detected when categorising BP /u/.
Turning to the categorisation results for ES presented in Table 5, we found that acoustic similarity was largely consistent in predicting ES listeners’ non-native categorisation patterns. As expected, BP /i/, /ɛ/, /a/ and /u/ were each categorised as the different single native ES vowel categories identified in acoustics, namely /i/, /e/, /a/ and /u/, respectively.
Also in accordance with our acoustic analyses, BP /e/, /o/ and /ɔ/ showed some degree of categorisation to more than one ES category. BP /e/ was categorised as ES /i/ and /e/ as expected. BP /o/ was categorised as both ES /o/ and /u/ as expected. However, the majority of tokens were categorised as ES /o/ instead of ES /u/, reversing the acoustic prediction. Finally, our discriminant analysis predicted a 64% probability that BP /ɔ/ would be categorised as ES /o/ and only a 27% probability that it would be categorised as ES /e/. However, the non-native categorisation task indicated that 97% of the /ɔ/ tokens were categorised by actual listeners as ES /o/. Thus, here we also see a case where our acoustic prediction regarding the categorisation of BP /ɔ/ to ES /e/ was not borne out. Again, it seems as though this discrepancy could be explained by the amount of rounding in the BP /ɔ/ and /o/vowels. Recall that the best fitting LDA for our data was the one that included normalised duration and F1 and F2 values only, thus it did not take into consideration F3, which as mentioned above usually corresponds to lip rounding. Although our acoustic analysis for ES indicated a potential categorisation of BP /ɔ/ to ES /e/, it is not surprising that this was not the case as BP /ɔ/ is a rounded vowel whereas ES /e/ is not. It seems likely that human listeners would weight rounding heavily in their categorisation of BP /ɔ/, i.e., hear it as ES /o/ rather than ES /e/. Furthermore, the results indicate that SIMILAR and NEW L2LP scenarios are represented in these non-native categorisation results. Non-native categorisation of BP /a/–/ɛ/ and /a/–/ɔ/ both show evidence of the SIMILAR scenario, as neither BP contrast yielded perceptual overlapping in the ES response categories. For the remaining contrasts, we see evidence of L2LP’s NEW scenario as the perceptual overlapping occurred over just one single response category.

3.4. Discussion

Based on the above findings, it appears that the non-native categorisation patterns for ES listeners were largely in line with predictions based on acoustic similarity between the target BP vowels and the listeners’ production of their native vowel categories reported in the cross-language acoustic comparisons.
For AusE listeners, however, there seemed to be more discrepancies between acoustic predictions and categorisation patterns. For example, there were some cases where the acoustic analyses indicated a small probability that AusE /ʉː/ would be a likely response category and it was not, or vice versa. We also observed that BP /a/ tokens were categorised more frequently as AusE /ɐː/ rather than AusE /æ/, which was acoustically predicted to be the most likely response category. These differences between predicted and actual categorisation could be related to cue weighting as well as to dynamic features in AusE vowels. The L2LP theoretical framework includes a strong emphasis on acoustic and auditory cue-weighting (the relative importance of acoustic cues in the learner’s native and target languages). Thus, it may be that listeners weight certain cues (e.g., lip rounding or duration) more than others, as has been shown in previous studies (e.g., Curtin et al. 2009).
Studies have also shown that AusE vowels are marked by dynamic formant features (Watson and Harrington 1999; Elvin et al. 2016; Escudero et al. 2018), thus it could be that listeners are searching for these dynamic features in order to categorise the target BP vowels. Future studies may consider improving the acoustic analyses by measuring the amount of spectral change in the native and target language and running discriminant analyses on those data. For example, Escudero et al. (2018) measured the amount of spectral change in three AusE vowels (/i/, /ɪ/ and /u:/) by extracting formant values at 30 equally spaced time points. Discrete cosine transform (DCT) coefficient values were obtained, which correspond to the vowel shape in the F1/F2 space (formant means, magnitude and direction). These DCT values were used in discriminant analyses, resulting in better overall categorisation of the AusE vowels than discriminant analyses run on F1, F2 and F3 values alone. Thus, using DCT values for the native and target language may provide more reliable acoustic predictions that correspond more closely to actual human performance in non-native categorisation.

Predictions for Discrimination Accuracy

In order to predict listeners’ performance in discrimination, we calculated perceptual overlap scores based on the amount of overlapping in the listeners’ non-native categorisation of the BP vowels. We computed the perceptual overlap scores following Levy (2009) for our categorisation data to determine how predictions of discrimination difficulty based on non-native categorisation would compare with our predictions based on our acoustic comparisons as described in the cross-language acoustic comparisons (see Table 3). To determine a perceptual overlap score based on the categorisation percentages reported in Table 4 and Table 5, we sum the smaller percentages of when both BP vowels in a given contrast are categorised as the same native vowel category. Table 6 presents the acoustic and perceptual overlap scores.
When comparing the predictions for discrimination difficulty based on perceptual overlap scores with those based on acoustic overlap, the predictions are rather similar for BP /a/–/ɛ/. That is, both acoustic similarity and non-native categorisation patterns predict that this contrast should be perceptually easy for both groups of listeners to discriminate. That is because this contrast appears to correspond to the L2LP SUBSET EASY learning scenario for AusE listeners and the SIMILAR learning scenario for Spanish listeners. Acoustic similarity and categorisation patterns indicate the same L2LP scenarios to apply to BP /a/–/ɔ/ in both languages, and so this contrast should also be perceptually easy to discriminate.
For the remaining four contrasts, predictions based on acoustics and non-native perceptual categorisation differ. Acoustic similarity predicts BP /i/–/e/ to be perceptually difficult for AusE listeners to discriminate, due to the L2LP SUBSET DIFFICULT, but the ES categorisation results suggest that this is also likely to be difficult for ES listeners to discriminate as there is evidence of the L2LP NEW scenario. Predictions based on acoustic similarity predict that both groups should find BP /o/–/u/ to be one of the most difficult contrasts to discriminate, whereas perceptual overlap scores suggest that /o/–/ɔ/ should be the most difficult to discriminate. Difficulties for both contrasts is predicted by the L2LP SUBSET DIFFICULT scenario for AusE listeners and the NEW scenario for ES listeners.
From these findings, two possible predicted patterns of difficulty can be identified. Predictions based on acoustic similarity would suggest the following order of difficulty for the two groups (ranging from the lowest acoustic overlap score to the highest):
AusE: /a/–/ɛ/>/a/–/ɔ/>/e/–/ɛ/>/o/–/ɔ/>/i/–/e/~/o/–/u/
(1)ES: /a/–/ɛ/~/a/–/ɔ/>/e/–/ɛ/>/o/–/ɔ/~/i/–/e/~/o/–/u/
On the other hand, non-native categorisation patterns, i.e., perceptual similarities, would predict that both AusE and ES listeners would share the same pattern of difficulty:
AusE and ES: /a/–/ɛ/>/a/–/ɔ/>/o/–/u/>/e/–/ɛ/>/i/–/e/>/o/–/ɔ/
In all cases, BP /a/–/ɛ/ is predicted to be the easiest to discriminate, with the order of difficulty differing among the rest of the contrasts for the acoustic and perceptual predictions. An examination of the pattern of difficulty in the results for discrimination accuracy will shed light on whether discrimination difficulty is in line with predictions based on acoustic similarity or those based on non-native categorisation patterns.

4. Non-Native Discrimination

4.1. Participants

Participants in this task were the same 20 AusE and 20 ES participants previously reported in the cross-language acoustic comparisons and non-native categorisation task6.

4.2. Stimuli and Procedure

Listeners were presented with the same 70 naturally produced BP /fVfe/ target words (7 vowels × 10 speakers), selected from Escudero et al.’s (2009) corpus, previously reported and analysed in the cross-language acoustic comparisons and the non-native categorisation task.
To test for discrimination accuracy, participants completed an auditory two-alternative forced choice (2AFC) task in the XAB format, similar to that of Escudero and Wanrooij (2010), Escudero and Williams (2012) and Elvin et al. (2014). The task was run on a laptop using the E-Prime 2.0 software program.
Three stimulus items were presented per trial. The second (A) and third (B) items were always from different BP vowel categories and the first item (X) was the target item about which a matching decision was required. In each trial, X was always one of the 70 target BP words, produced by the five male and five female speakers reported above. The A and B stimuli were always the seventh male and seventh female speaker from the Escudero et al. (2009) corpus to avoid any confusion of overlapping target stimuli and response categories. The gender of the A stimuli was always the same gender of the speaker of the B stimuli. This differs from the Elvin et al. (2014) study where the A and B stimuli were synthetic. Furthermore, the order of the A and B responses was counterbalanced (namely, XAB and XBA). On each trial, participants were instructed to listen to the three words using headphones and were required to make a decision as to whether the first word they heard sounded more like the second or the third.
For the first ten participants for each language group, testing consisted of six blocks of categorical discrimination tasks, with a short break permitted between blocks. Each block consisted of 40 trials with one of the six BP contrasts, namely /a/–/ɔ/, /a/–/ɛ/, /i/–/e/, /o/–/u/, /e/–/ɛ/ and /o/–/ɔ/, with the blocks presented in a randomised order. To determine whether discrimination accuracy differs when stimuli are blocked by contrast or randomised, the remaining 10 participants per group completed the same discrimination task, with the same breaks, but with the stimulus contrasts presented in random order, unblocked.

4.3. Results

We conducted a repeated-measures Analysis of Variance (ANOVA), with contrast as a within-subjects factor and condition (blocked, randomised) as a between-subjects factor, to evaluate whether blocking by BP contrast has an effect on overall performance. The results yielded no significant effect of condition on performance, [F (1, 38) = 1.905, p = 0.176, ηp2 = 0.048], suggesting that listeners had similar accuracy scores regardless of the condition (blocked vs. randomised). Thus, Figure 3 shows discrimination accuracy for the AusE and ES groups, including their variability, across the six BP vowel contrasts for both conditions pooled together.
The figure shows that the average accuracy scores are comparable across the two language groups. Both groups appear to have highest accuracy for /a/–/ɔ/ and /a/–/ɛ/ and lowest accuracy for /i/–/e/, /o/–/ɔ/ and /o/–/u/, with intermediate accuracy on /e/–/ɛ/.
In order to test for differences across the contrasts and between the two groups, a linear mixed-effects binary logistic model was conducted in SPSS with participant, X stimulus and trial included as random effects and BP contrast and language group included as fixed effects. Recall that for experiment designs with repeated measures analysed with mixed-effects models, Brysbaert and Stevens (2018) recommend a sample size of at least 1600 observations per condition. As each of the 40 participants completed 40 trials per BP contrast, this recommendation was met (40 participants × 40 trials = 1600 observations per BP contrast).
The model revealed a significant main effect of contrast [χ2 (5, N = 9599) = 646.212, p ≤ 0.001]. This significance is based on a comparison of nested models by the likelihood ratio test. There was no significant effect for language group [χ2 (1, N = 9599) = 0.880, p = 0.348]. However, the interaction of BP contrast*language group [χ2 (5, N = 9599) = 19.35, p = 0.002] was significant. This confirms that discrimination accuracy varies depending on the BP contrast and that although there are no reliable differences between AusE and ES in terms of overall accuracy, the two groups did differ in their performance on some of the BP contrasts. We ran Fisher’s LSD-corrected post-hoc pairwise comparisons to determine the group differences across the contrasts and found that the ES listeners had higher accuracy than AusE participants for discrimination of BP /a/–/ɔ/ (p = 0.035, 95% CI [−0.06, 0.00]), whereas the AusE participants performed better than the ES participants on BP /o/–/ɔ/ (p ≤ 001, 95% CI [0.05, 0.14]).
Fisher’s LSD-corrected post-hoc pairwise comparisons were also used to compare discrimination accuracy for each language group across the six BP contrasts. The results indicated that both groups found the same contrasts equally easy/difficult to discriminate. In particular, both groups had significantly higher accuracy scores for BP /a/–/ɛ/ than the remaining contrasts (AusE: all ps ≤ 0.013, ES: all ps ≤ 0.001), with the exception of the ES listeners’ performance on BP /a/–/ɔ/ which was comparable to BP /a/–/ɛ/ (p = 0.628). The results further indicated that both groups found BP /a/–/ɔ/ to be significantly easier to discriminate than the remaining four contrasts (/i/–/e/, /o/–/u/, /e/–/ɛ/ and /o/–/ɔ/) (AusE and ES: all ps ≤ 0.001). The AusE participants had significantly lower accuracy scores for BP /i/–/e/ and /o/–/u/ than the other four BP contrasts (all ps ≤ 0.018), but comparable levels of difficulty among the latter four contrasts (p = 0.339). Likewise, the ES participants had comparable levels of difficulty for BP /i/–/e/ and /o/–/u/, but also /o/–/ɔ/ (ps = 0.233–0.676), with significantly lower accuracy scores on these contrasts than the remaining three contrasts (all ps ≤ 0.001). The results indicate that there was no significant difference between BP /e/–/ɛ/ and BP /a/–/ɔ/or /a/–/ɛ/ for both AusE and ES listeners. However, BP /e/–/ɛ/ was significantly easier for both groups to discriminate than the remaining three contrasts (AusE and ES: all ps ≤ 0.001). Based on the results from the statistical analyses, the order of difficulty from least difficult to most difficult (where “~” means equal or comparable difficulty and “>” signifies higher accuracy) is as follows:
AusE /a/–/ɛ/>/a/–/ɔ/>/e/–/ɛ/>/o/–/ɔ/>/i/–/e/~/o/–/u/
(2)ES /a/–/ɛ/~/a/–/ɔ/>/e/–/ɛ/>/o/–/ɔ/~/i/–/e/~/o/–/u/

4.4. Acoustic vs. Perceptual Similarity as a Predictor of Non-Native Discrimination

Recall that we predicted two possible patterns of discrimination difficulty, depending on whether or not findings would be more consistent with predictions based on acoustic similarity or those based on non-native categorisation patterns as determined by the degree of perceptual overlap. As predicted by both acoustic similarity and perceptual overlap, BP /a/–/ɛ/ was indeed easiest for both groups to discriminate. We also find that in line with the acoustic and perceptual overlap predictions, the BP /a-ɔ/ contrast was indeed perceptually easy for ES listeners. However, it was also perceptually easy for AusE listeners. As predicted acoustically, BP /i/–/e/ was indeed difficult for AusE listeners and, in line with the perceptual overlap predictions, this contrast was also difficult for ES listeners. We also find that in line with our acoustic predictions, BP /o/–/u/ was difficult for both groups to discriminate. In comparison, the AusE listeners’ results for BP /e/–/ɛ/ and /o/–/ɔ/ were more in line with predictions based on the perceptual overlap scores of their non-native categorisation patterns.
To assess quantitatively how different measures of vowel category overlap (acoustic vs. perceptual) relate to discrimination, we fit mixed-effects binomial logistic regression models using the glmer function (binomial family) in R (3.5.1). Accuracy was the dependent variable (correct vs. incorrect) and either perceptual overlap or acoustic overlap was the predictor (fixed factor). Rather than use the raw values for the predictor, acoustic and perceptual overlap scores for each BP contrast were rank coded from least overlap (=1) to greatest overlap (=6) in light of Levy’s (2009) treatment of the overlap scores as ordinal and not as interval measures. For any instances of a tie, the average rank was assigned (as shown in Table 7). Subsequently, overlap was centred around the middle of the ranking scale, meaning that the models’ intercepts represent average accuracy between ranks 3 and 4 and that the fixed effect of overlap represents the average decrease in accuracy associated with a one-unit increase in overlap rank.
The random factors were Participant (with random slopes for either perceptual or acoustic overlap rank, as this factor was repeated across listeners), Item (the X Stimulus-Contrast combination with random slopes for either perceptual or acoustic overlap rank, as this factor was repeated across items) and Trial.
As five ES listeners lacked perceptual assimilation data, for these participants, we used the mean individual perceptual overlap values from the remaining ES listeners and ranked the six BP contrasts accordingly. For the ES model on individual perceptual overlap, we checked whether controlling for the subgroup of five ES listeners with imputed individual overlap scores would provide a closer model fit. To do so, a likelihood ratio test was conducted comparing a model not controlling for the subgroup and a model including an effect of subgroup (the five ES listeners versus the remaining ES listeners) and its interaction with individual perceptual overlap. This showed that the more complex model provided almost no improvement over the simpler model (χ2 (2) = 0.42, p = 0.81).
Before accepting the results of the mixed-effects models, we tested whether they were sufficiently powered to detect the smallest meaningful effect size of perceptual or acoustic overlap. This was because the models were run on the two groups’ data separately unlike the previous analysis examining discrimination accuracy with both groups together, meaning there were far fewer than the recommended 1600 observations per condition (Brysbaert and Stevens 2018). We defined the smallest meaningful effect size as one fewer correct response with each one-unit increase in overlap rank (equivalent to 2.5% of trials within each listener’s set of responses per BP contrast). For each model, using the SIMR package in R (Green and MacLeod 2016), 1000 Monte Carlo simulations were run where correct and incorrect responses were randomly generated such that the regression coefficient for the smallest meaningful effect of overlap rank remained the same. We deemed a model to have sufficient power if at least 80% of its simulations detected this smallest effect with a p-value less than 0.05. All models passed this test.
The results from the mixed models presented in Table 8 indicate that the level of acoustic overlap and perceptual overlap based on both individual and group calculations indeed influenced the participants’ discrimination accuracy. This means that these measures can be reliably used to predict discrimination difficulty. To examine whether one measure of overlap (acoustic vs. perceptual and group vs. individual) better explained our discrimination data, we conducted pairwise comparisons on the Bayesian Information Criterion (BIC) from each model. BIC is intended for model selection and takes into account the log-likelihood of a model and its complexity. To quantify the weight of evidence in favour of one model over an alternative model, Bayes Factors (BFs) can be computed based on each model’s BIC (Wagenmakers 2007). BFs < 3 provide weak evidence, BFs > 3 indicate positive support and BFs > 150 indicate very strong support for the alternative model (Wagenmakers 2007). For AusE listeners, the models containing group or individual acoustic overlap scores were very strongly supported over their counterpart models containing perceptual overlap scores (BFs > 150). For ES listeners, on the other hand, the opposite was the case, namely, the models containing group or individual perceptual overlap scores were very strongly supported over the counterpart models containing acoustic overlap scores (BFs > 150).
Next, we compared each group model, as reported in Table 8, with its counterpart individual model. For AusE listeners, the group acoustic overlap model provided modest positive support over the individual acoustic overlap model (BF = 9.97), whereas the group perceptual overlap model provided weak support over the individual perceptual overlap model (BF = 1.82). For ES listeners, both the group perceptual and acoustic overlap models provided very strong support over the individual models (BFs > 150). In summary, the pairwise model comparisons indicate that acoustic overlap scores better predict AusE listeners’ discrimination performance and perceptual overlap scores better predict ES listeners’ performance, and group overlap scores better predict ES listeners’ performance, whereas there is less strong evidence in favour of group overlap scores predicting AusE listeners’ discrimination performance.

5. General Discussion

The present study investigated whether Australian English (AusE) and European Spanish (ES) listeners differed in their categorisation and discrimination of Brazilian Portuguese (BP) vowels. Specifically, we were interested in whether acoustic similarity (based on individuals’ own native production data) predicted their non-native categorisation patterns, as predicted by L2LP (Escudero 2005, 2009; van Leussen and Escudero 2015; Elvin and Escudero 2019), as well as whether perceptual similarity also predicted discrimination accuracy to a better, worse or same degree as acoustics. We further investigated whether individual native vowel production and categorisation patterns better predicted non-native discrimination than production and/or perception averages. We conducted a comprehensive acoustic analysis of the cross-linguistic differences between the listeners own native vowel production and the target BP vowels in order to predict their non-native categorisation patterns from acoustic similarities, according to L2LP principles. We further calculated the amount of acoustic and perceptual overlap (i.e., where the two vowels in a BP contrast were acoustically similar to/perceived as the same native vowel category[ies]) in order to predict discrimination difficulty. We predicted that the greater the acoustic and/or perceptual overlap, the more difficult the BP contrast would be to discriminate.
Our results indicated that AusE and ES listeners’ patterns of non-native categorisation were partially consistent with L2LP predictions based on the cross-linguistic acoustic similarity between the listeners’ own native vowel productions and the target similarity. For AusE listeners, acoustic similarity successfully predicted cases of L2LP’s SUBSET scenario in that each BP vowel was categorised to multiple categories of L1 vowels, as expected. For ES listeners instances of L2LP’s NEW scenario, in which two L2 categories were mapped on to the same native category, were identified, also in line with acoustic predictions. Interestingly, the acoustic comparison also successfully predicted that BP /e/ and BP /o/ would be mapped to two native ES categories, which contributed to perceptual overlap.
We do find some discrepancies between our L2LP acoustic predictions and non-native categorisation patterns, particularly for the AusE listeners, in that some listener categorisation responses were not predicted by acoustic similarity. These differences are likely caused by the fact that our acoustic analysis only used F1, F2 and durational values, and did not include additional features of the vowel such as F3 (e.g., for lip rounding/vocal tract lengthening) and dynamic formant trajectories, which have been show to play an important role in AusE vowel perception and production (Elvin et al. 2016; Escudero et al. 2018; Williams et al. 2018). Another possible explanation for these differences could be the influence of orthographic labels (Escudero and Wanrooij 2010; Bassetti et al. 2015) in non-native vowel categorisation or the number of response options (Benders et al. 2012), both of which differed between the AusE and ES listeners. For instance, our acoustic analyses are not influenced by orthography, whereas listeners were presented with orthographic labels to represent each native vowel category in the non-native categorisation task. The influence of orthography on vowel perception has been demonstrated in Escudero and Wanrooij (2010) where Spanish learners of Dutch exhibited different patterns of vowel categorisation across an auditory only and auditory with orthography task (for a full review see: Escudero and Wanrooij 2010).
Turning to our results for non-native discrimination, in line with Elvin et al. (2014), the results from the present study indicate that both groups found some of the same BP contrasts easy versus difficult to discriminate. However, unlike that previous study, we found an interaction between language group and BP contrast and therefore the exact patterns and rankings of discrimination difficulty differed slightly across the two groups between these studies (see Table 9). In Elvin et al. (2014), both AusE and ES had comparable accuracy scores for BP /a/–/ɔ/, /e/–/ɛ/, /o/–/ɔ/. However, in the current study, the AusE participants found /a/–/ɔ/ to be easier than /e/–/ɛ/, which was easier than /o/–/ɔ/. For the ES listeners, BP /a/–/ɛ/ and /a/–/ɔ/ were equally the easiest to discriminate, followed by /e/–/ɛ/; and /o/–/ɔ/ was as difficult to discriminate as /i/–/e/ and /o/–/u/.
We also investigated acoustic and perceptual similarity as predictors of discrimination accuracy. The results from our generalised linear mixed models suggest that both measures are indeed reliable predictors of discrimination accuracy. Specifically, the higher the perceptual and/or acoustic similarity, the lower the accuracy scores. We ran further model comparisons in order to determine whether one measure of vowel category overlap better explained the discrimination accuracy scores for each group. Interestingly, we found that perceptual overlap scores were a better predictor of discrimination difficulty than acoustic similarity for the ES listeners. However, the opposite was true for AusE, that is, acoustic overlap scores better predicted discrimination accuracy.
The differing vowel inventory sizes could possibly explain why perceptual similarity was a better predictor of discrimination accuracy for the ES participants. Spanish has a five vowel inventory with transparent spelling, whereas Australian English has 13 vowels and opaque spelling. Therefore, in the non-native categorisation task, the ES participants are making a decision between fewer response categories than the AusE participants. Therefore, perhaps the fewer response options reduce the chance of labelling error in that task leading to strong results in the non-native categorisation task. Relatedly, data based on acoustic similarity may be better at predicting AusE discrimination accuracy because of potential labelling errors in the non-native categorisation task. In that task, AusE listeners have 13 vowels to choose from, and due to the opaque nature of English vowel spellings, the vowels were embedded in an orthographic context, which may have increased the demands and/or posed difficulties for the AusE participants. In a task with 13 response categories, there are many potential non-native categorisation patterns available, but also a greater chance of labelling errors. This may suggest that the AusE categorisation trends are not always especially strong or clear in terms of their response frequencies. This has been found in Shaw et al. (2018), where the experiment presented all English vowels with a grid of the 20 corresponding response options and AusE listeners show poor categorisation results for native Australian accented vowels. In the current study, the AusE listeners’ categorisation of BP /ɔ/ is a good example of this, where the most selected option had a 32% categorisation frequency. This issue of labelling errors is not applicable in acoustic data, which may be why the acoustic analysis yields a more consistent result. To determine whether or the number of response categories and/or the opaqueness/transparency of the language influenced perception results, future studies could compare languages that have the same number of vowels, but differ in terms of the degree of orthographic transparency.
We also investigated whether measures of acoustic and perceptual categorisation overlap are equally good predictors of discrimination accuracy at both group and individual levels (i.e., using individual overlap scores vs. group averages). This was made possible by our inclusion of native production data. The results from our analyses revealed that both measures do in fact predict discrimination accuracy. However, we found that the model based on group averages was a better predictor of discrimination accuracy than individual score averages for the ES group. Yet the evidence for group scores was not as strong for predicting the AusE listeners’ discrimination performance. This finding goes against the L2LP model claims as well as studies that show the importance of individual variation in predicting L2 perceptual development. It is possible that the group model provides a better estimate of individual behaviour because the averages across the individuals are less noisy than the individual averages. That is, population data are less affected by response errors/variability in responses when doing a non-native categorisation task, as it aggregates responses from many trials (compared to a single listener with fewer trials), weakening the influence of any “outlier” behaviour. Finally, the fact that there is not actually much difference between individual and group data for the AusE group suggests that assimilation/similarity patterns at individual and group level are not as reliable or are quite variable (because there are so many assimilation possibilities available). Further investigation into the effect of individual differences for L2 development is required.
In sum, our findings indicate that listeners’ non-native categorisation patterns are largely predicted by a detailed acoustic comparison of the native and target languages, with data collected from the same populations for both vowel productions and perceptual testing, mostly in keeping with L2LP predictions. Importantly, we find that AusE listeners do not have an advantage when perceiving non-native vowels despite their native language (English) having a larger and more complex vowel inventory than that of the ES listeners (Spanish). In fact, we find that listeners’ discrimination patterns are largely dependent on the L2LP learning scenario identified for each vowel contrast, which were similar across the two language groups. That is, contrasts which contained evidence of L2LP’s NEW or SUBSET scenarios (containing an acoustic or perceptual overlap where the two vowels in a given BP contrast are acoustically similar to, or categorised to, the same native category[s]) resulted in similar discrimination difficulties for ES and AusE listeners, as both scenarios resulted in a failure to detect a distinction between the non-native vowels. In addition, both of these learning scenarios are likely to be more difficult than contrasts where only the SIMILAR scenario is present. These findings are also consistent with previous studies (Bohn et al. 2011; Levy 2009; Tyler et al. 2014; Best et al. 2019) testing PAM’s theoretical predictions that a higher degree of perceived phonetic similarity (i.e., perceptual overlap) between members of a non-native contrast, as observed by perceptual assimilation patterns, is associated with a greater level of discrimination difficulty for that contrast.
We further found that performance in non-native discrimination can be predicted by measures of acoustic and perceptual similarity using both group and individual data, although we found that perceptual similarity was a better predictor for ES and acoustic similarity for AusE. We also found that group data better explained ES discrimination accuracy, but not as clearly so for AusE listeners. We suspect that these findings are related to vowel inventory size differences between their native languages, and the nature of the response categories in the non-native categorisation task. At this stage, it is difficult to do a direct comparison between the overlap measures (acoustic vs. perceptual and group vs. individual) because both predict the discrimination data. Further studies on acoustic predictions should include F3 and dynamic vowel measures in addition to F1 and F2 static and durational measures, in line with previous studies showing the importance of dynamic information for AusE vowels in particular (Elvin et al. 2016; Escudero et al. 2018; Williams et al. 2018). It seems that the nature of the non-native categorisation task and the differing language backgrounds complicate any conclusions that could be drawn in regards to which measure is better. For now, it is sufficient to state that both acoustic and perceptual similarity predict performance on discrimination and further investigation would be required to identify whether one measure is better than the other, or perhaps it is a case where different measures are more suited to different languages.
Finally, according to the L2LP model, perception is linked to spoken word recognition and production, thus future studies should compare data from the tasks of the present study with the same listeners’ spoken word recognition and non-native vowel production data. Indeed, some prior studies (e.g., Broersma 2002; Escudero et al. 2013; Escudero et al. 2008; Pallier et al. 2001; Weber and Cutler 2004) have shown that vowel contrasts that are difficult to perceive are also difficult in spoken word learning and word recognition tasks. Therefore, we would expect that these same listeners’ patterns of discrimination difficulty could be used to predict difficulty in a spoken word learning and word recognition task containing the same pseudo-words used in the present study. Furthermore, the findings from the present study could also apply to non-native speech production. In particular, the SLM and L2LP theoretical models claim that listeners’ production of non-native or L2 sounds is influenced by their perception of these sounds in the L1. However, to date, most studies (e.g., Diaz Granado 2011; Flege et al. 1999) have used the theoretical framework of SLM to test L2 production. Considering that the L2LP model posits a direct link between non-native and L2 production, it is perhaps surprising that very few studies have tested this claim (e.g., Rauber et al. 2005). Thus, acoustic analyses and in particular the acoustic and perceptual overlap scores could be used to predict the patterns in the same listeners’ non-native vowel productions. In conclusion, future research is required that adequately tests the L2LP model predictions for the role of perception in both word recognition and non-native production, and compares them to other models of non-native and L2 speech perception and production.

Author Contributions

J.E., P.E., J.A.S. and C.T.B. conceived and designed the experiments. J.E. ran all experiments. J.E. and D.W. conducted all the analyses. J.E. wrote the original draft. J.E., D.W., J.A.S., C.T.B., and P.E. reviewed and edited this manuscript. All authors have read and agreed to the published version of this manuscript.

Funding

This work was funded by an Australian Postgraduate Award, the MARCS Research Training Scheme and the Australian Research Council (ARC) Centre of Excellence for the Dynamics of Language (CE140100041). PE’s work was supported by an ARC Future Fellowship (FT160100514).

Institutional Review Board Statement

The study was conducted according to the guidelines of the National Ethics Application Form, and approved by the Human Research Ethics Committee) WESTERN SYDNEY UNIVERSITY (H10427 approved 01/11/2013).

Informed Consent Statement

Informed consent was obtained from all subjects involved in the study.

Data Availability Statement

The data presented in this study are available on request from the corresponding author.

Conflicts of Interest

The authors declare no conflict of interest.

References

  1. Alispahic, S., K. E. Mulak, and P. Escudero. 2017. Acoustic properties predict perception of unfamiliar Dutch vowels by adult Australian English and Peruvian Spanish listeners. Frontiers in Psychology 8: 52. [Google Scholar] [CrossRef] [Green Version]
  2. Alispahic, S., P. Escudero, and K. E. Mulak. 2014. Difficulty in discriminating non-native vowels: Are Dutch vowels easier for Australian English than Spanish listeners? Paper presented at Annual Conference of the International Speech Communication Association, INTERSPEECH, (SEPTEMBER), Singapore, September 14–18; pp. 1293–96. [Google Scholar] [CrossRef]
  3. Antoniou, M., and P. C. Wong. 2015. Poor phonetic perceivers are affected by cognitive load when resolving talker variability. The Journal of the Acoustical Society of America 138: 571–74. [Google Scholar] [CrossRef]
  4. Bassetti, B., P. Escudero, and R. Hayes-Harb. 2015. Second language phonology at the interface between acoustic and orthographic input. Applied Psycholinguistics 36: 1–6. [Google Scholar] [CrossRef] [Green Version]
  5. Benders, T., P. Escudero, and M. J. Sjerps. 2012. The interrelation between acoustic context effects and available response categories in speech sound categorisation. The Journal of the Acoustical Society of America 131: 3079–87. [Google Scholar] [CrossRef] [Green Version]
  6. Best, C. T. 1994. The Emergence of Native-Language Phonological Influences in Infants: A Perceptual Assimilation Model. The Development of Speech Perception: The Transition from Speech Sounds to Spoken Words 167: 167–224. [Google Scholar]
  7. Best, C. T. 1995. A direct realist perspective on cross-language speech perception. In Speech Perception and Linguistic Experience: Issues in Cross-Language Research. Edited by W. Strange. Timonium: York Press, pp. 171–204. [Google Scholar]
  8. Best, C. T., and M. D. Tyler. 2007. Non-native and second-language speech perception: Commonalities and complementarities. In Language Experience in Second-Language Speech Learning: In Honor of James Emil Flege. Edited by O. Bohn and M. J. Munro. Amsterdam: John Benjamins, pp. 13–34. [Google Scholar]
  9. Best, C. T., C. Avesani, M. D. Tyler, and M. Vayra. 2019. Perceiving non-native consonants that utilize articulators not employed contrastively in the native language: Revisiting PAM and the Articulatory Organ Hypothesis. In A Sound Approach to Language Matters: In Honor of Ocke-Schwen Bohn. Edited by A. M. Nyvad, M. Hejná, A. Højen, A. B. Jespersen and M. H. Sørensen. Aarhus: Aarhus University Press, pp. 13–40. [Google Scholar] [CrossRef]
  10. Blackwood Ximenes, A., J. A. Shaw, and C. Carignan. 2017. A comparison of acoustic and articulatory methods for analyzing vowel differences across dialects: Data from American and Australian English. The Journal of the Acoustical Society of America 142: 363–77. [Google Scholar] [CrossRef] [Green Version]
  11. Bohn, O. S., C. T. Best, C. Avesani, and M. Vayra. 2011. Perceiving through the lens of native phonetics: Italian and Danish listenerś perception of English consonant contrasts. Paper presented at XVII International Congress of Phonetic Sciences, Hong Kong, China, August 17–21; pp. 336–39. [Google Scholar]
  12. Bohn, O., and J. E. Flege. 1990. Interlingual identification and the role of foreign language experience in L2 vowel perception. Applied Psycholinguistics 11: 303–28. [Google Scholar] [CrossRef] [Green Version]
  13. Broersma, M. 2002. Comprehension of non-native speech: Inaccurate phoneme processing and activation of lexical competitors. Paper presented at the Seventh International Conference on Spoken Language Processing, Denver, CO, USA, September 16–20; pp. 261–64. [Google Scholar]
  14. Brysbaert, M., and M. Stevens. 2018. Power analysis and effect size in mixed effects models: A tutorial. Journal of Cognition 1: 9. [Google Scholar] [CrossRef] [Green Version]
  15. Chládková, Kateřina, and Paola Escudero. 2012. Comparing vowel perception and production in Spanish and Portuguese: European versus Latin American dialects. The Journal of the Acoustical Society of America 131: EL119–25. [Google Scholar] [CrossRef] [PubMed] [Green Version]
  16. Colantoni, L., J. Steele, and P. Escudero. 2015. Second Language Speech. Cambridge: Cambridge Univ Press. [Google Scholar]
  17. Cox, F. 2006. The Acoustic Characteristics of/hVd/Vowels in the Speech of some Australian Teenagers. Australian Journal of Linguistics 26: 147–79. [Google Scholar] [CrossRef]
  18. Curtin, S., C. Fennell, and P. Escudero. 2009. Weighting of vowel cues explains patterns of word—Object associative learning. Developmental Science 12: 725–31. [Google Scholar] [CrossRef]
  19. Diaz Granado, M. 2011. L2 and L3 Acquisition of the Portuguese Stressed Vowel Inventory by Native Speakers of English. Ph.D. disstertation, The University of Arizona, Tucson, AZ, USA. [Google Scholar]
  20. Díaz, B., H. Mitterer, M. Broersma, and N. Sebastian-Gallés. 2012. Individual differences in late bilinguals’ L2 phonological processes: From acoustic-phonetic analysis to lexical access. Learning and Individual Differences 22: 680–89. [Google Scholar] [CrossRef] [Green Version]
  21. Elvin, J. 2016. The Role of the Native Language in Non-Native Perception and Spoken Word Recognition: English vs. Spanish Learners of Portuguese. Ph.D. dissertation, Western Sydney University, Sydney, NSW, Australia. [Google Scholar]
  22. Elvin, J., and P. Escudero. 2019. Cross-Linguistic Influence in Second Language Speech: Implications for Learning and Teaching. In Cross-Linguistic Influence: From Empirical Evidence to Classroom Practice. Cham: Springer, pp. 1–20. [Google Scholar]
  23. Elvin, J., D. Williams, and P. Escudero. 2016. Dynamic acoustic properties of monophthongs and diphthongs in Western Sydney Australian English. The Journal of the Acoustical Society of America 140: 576–81. [Google Scholar] [CrossRef] [PubMed] [Green Version]
  24. Elvin, J., P. Escudero, and P. Vasiliev. 2014. Spanish is better than English for discriminating Portuguese vowels: Acoustic similarity versus vowel inventory. Frontiers in Psychology 5: 1–8. [Google Scholar] [CrossRef] [Green Version]
  25. Escudero, P. 2001. The role of the input in the development of L1 and L2 sound contrasts: Language-specific cue weighting for vowels. In Proceedings of the 25th Annual Boston University Conference on Language Development. Somerville: Cascadilla Press, pp. 250–61. [Google Scholar]
  26. Escudero, P. 2005. Linguistic Perception and Second Language Acquisition: Explaining the Attainment of Optimal Phonological Categorization. Amsterdam: Netherlands Graduate School of Linguistics. [Google Scholar]
  27. Escudero, P. 2009. The linguistic perception of similar L2 sounds. Phonology in Perception 15: 152–90. [Google Scholar]
  28. Escudero, P., and D. Williams. 2011. Perceptual assimilation of Dutch vowels by Peruvian Spanish listeners. The Journal of the Acoustical Society of America 129: EL1–7. [Google Scholar] [CrossRef]
  29. Escudero, P., and D. Williams. 2012. Native dialect influences second-language vowel perception: Peruvian versus Iberian Spanish learners of Dutch. The Journal of the Acoustical Society of America 131: EL406–12. [Google Scholar] [CrossRef]
  30. Escudero, P., and K. Chládková. 2010. Spanish listeners’ perception of American and Southern British English vowels. The Journal of the Acoustical Society of America 128: EL254–9. [Google Scholar] [CrossRef]
  31. Escudero, P., and K. Wanrooij. 2010. The Effect of L1 Orthography on Non-native Vowel Perception. Language and Speech 53: 343–65. [Google Scholar] [CrossRef]
  32. Escudero, P., and P. Boersma. 2002. The Subset Problem in L2 Perceptual Development: Multiple-Category Assimilation by Dutch Learners of Spanish. Paper presented at 26th annual Boston University conference on language development, Boston, MA, USA, November 5–7; pp. 208–19. [Google Scholar]
  33. Escudero, P., and P. Boersma. 2004. Bridging the gap between L2 speech perception research and phonological theory. Studies in Second Language Acquisition 26: 551–85. [Google Scholar] [CrossRef] [Green Version]
  34. Escudero, P., and P. Vasiliev. 2011. Cross-language acoustic similarity predicts perceptual assimilation of Canadian English and Canadian French vowels. The Journal of the Acoustical Society of America 130: EL277–83. [Google Scholar] [CrossRef]
  35. Escudero, P., and R. A. H. Bion. 2007. Modeling Vowel Normalization and Sound Perception as Sequential Processes. Available online: http://icphs2007.de/conference/Papers/1313/1313.pdf (accessed on 22 February 2021).
  36. Escudero, P., B. Sisinni, and M. Grimaldi. 2014. The effect of vowel inventory and acoustic properties in Salento Italian learners of Southern British English vowels. The Journal of the Acoustical Society of America 135: 1577–84. [Google Scholar] [CrossRef] [PubMed]
  37. Escudero, P., K. E. Mulak, J. Elvin, and N. M. Traynor. 2018. “Mummy, keep it steady”: Phonetic variation shapes word learning at 15 and 17 months. Developmental Science 21: e12640. [Google Scholar] [CrossRef]
  38. Escudero, P., M. Broersma, and E. Simon. 2013. Learning words in a third language: Effects of vowel inventory and language proficiency. Language and Cognitive Processes, 1–16. [Google Scholar] [CrossRef] [Green Version]
  39. Escudero, P., P. Boersma, A. S. Rauber, and H. R. Bion. 2009. A cross-dialect acoustic description of vowels: Brazilian and European Portuguese. The Journal of the Acoustical Society of America 126: 1379–93. [Google Scholar] [CrossRef] [PubMed] [Green Version]
  40. Escudero, P., R. Hayes-Harb, and H. Mitterer. 2008. Novel second-language words and asymmetric lexical access. Journal of Phonetics 36: 345–60. [Google Scholar] [CrossRef]
  41. Faris, M. M., C. T. Best, and M. D. Tyler. 2016. An examination of the different ways that non-native phones may be perceptually assimilated as uncategorized. The Journal of the Acoustical Society of America 139: 1–5. [Google Scholar] [CrossRef] [PubMed] [Green Version]
  42. Flege, J. E. 1995. Second language speech learning: Theory, findings, and problems. In Speech Perception and Linguistic Experience: Issues in Cross-Language Research. Timonium: York Press, pp. 233–76. [Google Scholar]
  43. Flege, J. E., I. R. A. Mackay, and D. Meador. 1999. Native Italian speakers ’ perception and production of English vowels. The Journal of the Acoustical Society of America 106: 2973–87. [Google Scholar] [CrossRef] [PubMed] [Green Version]
  44. Flege, J. E., M. J. Munro, and I. R. A. Mackay. 1995. Factors affecting strength of perceived foreign accent in a second language. The Journal of the Acoustical Society of America 97: 3125. [Google Scholar] [CrossRef] [PubMed]
  45. Flege, J. E., O.-S. Bohn, and S. Jang. 1997. Effects of experience on non-native speakers’ production and perception of English vowels. Journal of Phonetics 25: 437–70. [Google Scholar] [CrossRef] [Green Version]
  46. Gilichinskaya, Y. D., and W. Strange. 2010. Perceptual assimilation of American English vowels by inexperienced Russian listeners. The Journal of the Acoustical Society of America 128: EL80–5. [Google Scholar] [CrossRef] [PubMed] [Green Version]
  47. Gordon, L. S. 2008. Factors Affecting English Speakers’ Perception of L2 Vowels. ProQuest. Washington: Georgetown University. [Google Scholar]
  48. Green, P., and C. J. MacLeod. 2016. SIMR: An R package for power analysis of generalized linear mixed models by simulation. Methods in Ecology and Evolution 7: 493–98. [Google Scholar] [CrossRef]
  49. Iverson, P., and B. G. Evans. 2007. Learning English vowels with different first-language vowel systems: Perception of formant targets, formant movement, and duration. The Journal of the Acoustical Society of America 122: 2842–54. [Google Scholar] [CrossRef] [PubMed]
  50. Iverson, P., and B. G. Evans. 2009. Learning English vowels with different first-language vowel systems II: Auditory training for native Spanish and German speakers. The Journal of the Acoustical Society of America 126: 866–77. [Google Scholar] [CrossRef] [Green Version]
  51. Jin, Y., B. Díaz, M. Colomer, and N. Sebastián-Gallés. 2014. Oscillation encoding of individual differences in speech perception. PLoS ONE 9. [Google Scholar] [CrossRef] [PubMed]
  52. Kisler, T., F. Schiel, and H. Sloetjes. 2012. Signal processing via webservices: The use case WebMAUS. Paper presented at Digital Humanities, Hamburg, Germany, July 16–22; pp. 30–34. [Google Scholar]
  53. Levy, E. S. 2009. On the assimilation-discrimination relationship in American English adults’ French vowel learning. The Journal of the Acoustical Society of America 126: 2670–82. [Google Scholar] [CrossRef] [Green Version]
  54. Levy, E. S., and F. F. Law. 2010. Production of French vowels by American-English learners of French: Language experience, consonantal context, and the perception-production relationship. The Journal of the Acoustical Society of America 128: 1290–305. [Google Scholar] [CrossRef] [PubMed] [Green Version]
  55. Lobanov, B. M. 1971. Classification of Russian vowels spoken by different speakers. The Journal of the Acoustical Society of America 49: 606–8. [Google Scholar] [CrossRef]
  56. Mayr, R., and P. Escudero. 2010. Explaining individual variation in L2 perception: Rounded vowels in English learners of German. Bilingualism: Language and Cognition 13: 279–97. [Google Scholar] [CrossRef]
  57. Morrison, G. S. 2003. Perception and Production of Spanish Vowels by English Speakers. Paper presented at 15th International Congress of Phonetic Sciences, Barcelona, Spain, August 3–9; vol. 2003, pp. 1533–36. [Google Scholar]
  58. Morrison, G. S. 2009. L1-Spanish Speakers’ Acquisition of the English/i/--//Contrast II: Perception of Vowel Inherent Spectral Change1. Language and Speech 52: 437–62. [Google Scholar] [CrossRef] [Green Version]
  59. Noiray, A., K. Iskarous, and D. H. Whalen. 2014. Variability in English vowels is comparable in articulation and acoustics. Laboratory phonology 5: 271. [Google Scholar] [CrossRef] [PubMed]
  60. Pallier, C., A. Colomé, and N. Sebastiáń Gallés. 2001. The influence of native-language phonology on lexical access: Exemplar-based vs. abstract lexical entries. Pyschological Science 12: 445–49. [Google Scholar] [CrossRef] [PubMed]
  61. Rauber, A. S., P. Escudero, R. A. H. Bion, and B. O. Baptista. 2005. The Interrelation between the Perception and Production of English Vowels by Native Speakers of Brazilian Portuguese Graduate Program in Applied Linguistics. Interspeech 2: 2913–16. [Google Scholar]
  62. Sebastián-Gallés, N., and B. Díaz. 2012. First and Second Language Speech Perception: Graded Learning. Language Learning 62: 131–47. [Google Scholar] [CrossRef]
  63. Shaw, J. A., C. T. Best, G. Docherty, B. Evans, P. Foulkes, and J. Hay. 2018. Resilience of English vowel perception across regional accent variation. Laboratory Phonology 9: 11. [Google Scholar] [CrossRef] [Green Version]
  64. Smith, B. L., and R. Hayes-Harb. 2011. Individual differences in the perception of final consonant voicing among native and non-native speakers of English. Journal of Phonetics 39: 115–20. [Google Scholar] [CrossRef]
  65. Strange, W., O.-S. Bohn, S. Trent, and K. Nishi. 2004. Acoustic and perceptual similarity of North German and American English vowels. The Journal of the Acoustical Society of America 115: 1791. [Google Scholar] [CrossRef]
  66. Thomas, E. R., and T. Kendall. 2007. NORM: The Vowel Normalization and Plotting Suite: An Online Tool for Sociophonetic Vowel Normalization. Available online: http://lingtools.uoregon.edu/norm/ (accessed on 22 February 2021).
  67. Tyler, M. D., C. T. Best, A. Faber, and A. G. Levitt. 2014. Perceptual assimilation and discrimination of non-native vowel contrasts. Phonetica 71: 4–21. [Google Scholar] [CrossRef] [PubMed]
  68. van Leussen, J.-W., and P. Escudero. 2015. Learning to perceive and recognize a second language: The L2LP model revised. Frontiers in Psychology 6: 1–12. [Google Scholar] [CrossRef] [Green Version]
  69. Vasiliev, P. 2013. The Initial State for Californian English Learners of Spanish and Portuguese Vowels. Los Angeles: University of California. [Google Scholar]
  70. Wagenmakers, E.-J. 2007. A practical solution to the perverse problems of p-values. Psychonomic Bulletin and Review 14: 779–804. [Google Scholar] [CrossRef] [Green Version]
  71. Wanrooij, K., P. Escudero, and M. E. Raijmakers. 2013. What do listeners learn from exposure to a vowel distribution? An analysis of listening strategies in distributional learning. Journal of Phonetics 41: 307–19. [Google Scholar] [CrossRef]
  72. Watson, C. I., and J. Harrington. 1999. Acoustic evidence for dynamic formant trajectories in Australian English vowels. The Journal of the Acoustical Society of America 106: 458–68. [Google Scholar] [CrossRef] [PubMed] [Green Version]
  73. Weber, A., and A. Cutler. 2004. Lexical competition in non-native spoken-word recognition. Journal of Memory and Language 50: 1–25. [Google Scholar] [CrossRef] [Green Version]
  74. Whalen, D. H., W. R. Chen, M. K. Tiede, and H. Nam. 2018. Variability of articulator positions and formants across nine english vowels. Journal of phonetics 68: 1–14. [Google Scholar] [CrossRef]
  75. Williams, D., and P. Escudero. 2014. A cross-dialectal acoustic comparison of vowels in Northern and Southern British English. The Journal of the Acoustical Society of America 136: 2751–61. [Google Scholar] [CrossRef] [PubMed]
  76. Williams, D., P. Escudero, and A. Gafos. 2018. Spectral change and duration as cues in Australian English listeners’ front vowel categorisation. The Journal of the Acoustical Society of America 144: EL215–21. [Google Scholar] [CrossRef]
  77. Yazawa, K., J. Whang, M. Kondo, and P. Escudero. 2020. Language-dependent cue weighting: An investigation of perception modes in L2 learning. Second Language Research 36: 557–81. [Google Scholar] [CrossRef]
  78. Yu, A. C., and G. Zellou. 2019. Individual differences in language processing: Phonology. Annual Review of Linguistics 5: 131–50. [Google Scholar] [CrossRef] [Green Version]
1
The L2LP terms “NEW” and “SIMILAR” scenarios differ notably from SLM’s use of these terms, and should not be confused with them. The difference in terminology arises from the different foci of the two models: L2LP addresses phonemic contrasts, whereas SLM focuses on individual phones. SLM posits that when listeners are presented with an L2 phone that does not closely resemble any L1 phoneme they form a new phonetic category which should be easier to acquire than an L2 phone that is similar to an existing L1 phoneme, which should be more difficult to acquire despite the phonetic differences (Colantoni et al. 2015). In contrast, in L2LP a NEW scenario requires the listener to establish a new contrast in the L2, which does not exist in the L1, while a SIMILAR scenario reflects a contrast that is similar to one already existing in the L1. SIMILAR scenarios are therefore predicted to be much easier to acquire than NEW scenarios in L2LP.
2
The /ɪə/ vowel is traditionally considered a diphthong in Australian English. However, recent studies have shown that this vowel is produced as a monophthong when presented in a closed CVC context (see Elvin et al. 2016) as in this study.
3
We note, however, that there are reasons as to why a listener’s own productions might not be the best predictors of how they perceive other speakers. Part of a listener’s knowledge about vowels includes the ways that different members of their speech community vary (e.g., vocal tract anatomy and social factors). However, we do believe a good way to find symmetry between perception and production is to compare those in the same group of people as in Chládková and Escudero (2012).
4
Given the fact that the CVCV context is the most common word structure in Spanish, we specifically chose to analyse the /fVfo/ context in the ES native production task. This also prevented the ES participants from producing the target BP stimuli and thereby having an unfair advantage over the AusE participants. We do acknowledge, however, that the post-stressed /e/ in the second syllable of the BP target items is different to the post-stressed /o/ in the second syllable of the Spanish targets, which may have a minor impact on the stressed V acoustic parameters in BP as compared to ES.
5
See Elvin et al. (2016); Williams et al. (2018) and Escudero et al. (2018) for an overview and visualization of the AusE formant trajectories.
6
We note that the five participants missing from the non-native categorisation are included in our analyses of non-native discrimination. We do address the issue of the missing data from the categorisation task in our comparison of cross-linguistic acoustic similarity vs. perceptual similarity below.
Figure 1. Visual representation of the L2LP learning scenarios.
Languages 06 00044 g001
Figure 2. The left panel shows the averaged normalised F1 and F2 values (Hz) for the thirteen AusE5 (black), and seven BP (gray, circled) vowels. The right panel shows the averaged normalised F1 and F2 values (Hz) for the five ES (black) and seven BP (gray, circled) vowels.
Languages 06 00044 g002
Figure 3. Overall discrimination accuracy including variability for AusE and ES.
Languages 06 00044 g003
Table 1. Average probability scores of predicted group membership for male and female BP tokens tested on each individual AusE listener model. Probabilities are averaged across the individual discriminant analysis for each speaker. The native vowel category with the highest probability appears in a cell in bold, with no shading, probabilities above chance appear in cells shaded dark grey and probabilities below chance (i.e., 0.08) appear in cells shaded light grey.
AusE VowelsBP Vowels
ieɛaɔou
0.220.13
ɪ0.710.590.01
ɪə0.050.11
e 0.010.63 0.16
0.060.33 0.06
ɜː 0.020.050.06
ɐ 0.150.32
ɐː 0.060.06
æ 0.020.740.08
ɔ 0.250.260.04
0.200.04
ʊ 0.010.530.92
ʉː0.020.10
Table 2. Average probability scores of predicted ES vowel group membership for BP male and female tokens tested on the ES model. Probabilities are averaged across the individual discriminant analysis for each speaker. The native vowel category with the highest probability appears in a cell in bold, with no shading, probabilities above chance appear in cells shaded dark grey and probabilities below chance (i.e., 0.20) appear in cells shaded light grey.
ES VowelsBP Vowels
ieɛaoɔu
i0.890.23 0.01
e0.110.771.00 0.27
a 0.99 0.07
o 0.010.220.640.02
u 0.780.010.98
Table 3. Acoustic overlap scores for AusE and ES listeners.
GroupBP Vowel Contrast
/a/–/ɔ//a/–/ɛ//i/–/e//o/–/u//e/–/ɛ//o/–/ɔ/
AusE0.340.040.790.610.080.26
ES0.080.000.340.800.770.23
Table 4. Australian English listeners’ classification percentages. The native vowel category with the highest classification percentage appears in bold, classification percentages above chance appear in cells shaded dark grey and classification percentages below chance (i.e., 0.08) appear in cells shaded light grey.
AusE VowelsBP Vowels
ieɛaoɔu
0.430.230.05 0.01
ɪ0.430.200.02
ɪə0.060.150.060.02 0.010.01
e0.060.140.14
0.010.230.580.060.010.04
ɜː 0.010.010.080.050.03
æ0.010.030.070.38 0.01
ɐː0.010.020.080.50 0.13
ɐ 0.030.04 0.06
ɔ 0.090.150.07
0.020.010.020.530.580.06
ʊ 0.230.030.65
ʉː 0.040.020.12
Table 5. European Spanish listeners’ classification percentages. The native vowel category with the highest classification percentage appears in bold, classification percentages above chance appear in cells shaded dark grey and classification percentages below chance (i.e., 0.20) appear in cells shaded light grey.
ES VowelsBP Vowels
ieɛaoɔu
i1.00.560.01
e 0.440.94
a 0.051.00 0.02
o 0.690.970.01
u 0.310.010.99
Table 6. Acoustic and perceptual overlap scores for AusE and ES listeners expressed as proportions.
GroupOverlapBP Contrasts
/a/–/ɔ//a/–/ɛ//i/–/e//o/–/u//e/–/ɛ//o/–/ɔ/
AusEAcoustic0.340.040.790.610.080.26
Perceptual0.220.110.580.470.570.73
ESAcoustic0.080.000.340.800.770.23
Perceptual0.020.050.560.320.450.70
Table 7. Ranking of the 6 BP contrasts according to perceptual and acoustic overlap scores. Individual overlap rankings represent the mean rank across participants. In order to compare the overlap scores to the actual discrimination results, we provide the order of discrimination difficulty (bottom two rows) from the group discrimination results across the six BP contrasts reported from the previous page.
Perceptual Overlap RankAcoustic Overlap Rank
GroupIndividualGroupIndividual
BP ContrastAusEESAusEESAusEESAusEES
/a/–/ɔ/2.001.001.951.604.002.004.052.90
/a/–/ɛ/1.002.002.001.871.001.001.481.17
/i/–/e/5.005.004.334.406.004.005.404.03
/o/–/u/3.003.003.883.835.006.004.804.80
/e/–/ɛ/4.004.003.884.172.005.002.184.30
/o/–/ɔ/6.006.004.985.133.003.003.103.80
Order of Discrimination Difficulty
AusE/a/–/ɛ/>/a/–/ɔ/>/e/–/ɛ/>/o/–/ɔ/>/i/–/e/~/o/–/u/
ES/a/–/ɛ/~/a/–/ɔ/>/e/–/ɛ/>/o/–/ɔ/~/i/–/e/~/o/–/u/
Table 8. Results of the mixed models for acoustic and perceptual models for groups and for individuals.
AusEES
Est.SEzpEst.SEzp
Perceptual Overlap GroupIntercept1.550.1014.99<0.0011.490.1113.82<0.001
Effect–0.380.06–6.32<0.001–0.490.06–7.70<0.001
Perceptual Overlap IndividualIntercept1.590.1114.66<0.0011.430.1212.01<0.001
Effect–0.200.05–4.25<0.001–0.210.05–3.93<0.001
Acoustic Overlap GroupIntercept1.620.1114.70<0.0011.490.1212.26<0.001
Effect–0.360.07–5.28<0.001–0.300.06–4.92<0.001
Acoustic Overlap IndividualIntercept1.590.1213.36<0.0011.380.1211.85<0.001
Effect–0.190.06–2.980.003–0.110.04–2.850.004
Table 9. Reported patterns of discrimination accuracy in Elvin et al. (2014) and the present study beginning from perceptually easy to perceptually difficult.
Order of Discrimination Difficulty
Elvin et al. 2014AusE/ES: /a/–/ɛ/>/a/–/ɔ/~/e/–/ɛ/~/o/–/ɔ/>/i/–/e/~/o/–/u/
The present studyAusE: /a/–/ɛ/>/a/–/ɔ/>/e/–/ɛ/>/o/–/ɔ/>/i/–/e/~/o/–/u/
ES: /a/–/ɛ/~/a/–/ɔ/>/e/–/ɛ/>/o/–/ɔ/~/i/–/e/~/o/–/u/
Publisher’s Note: MDPI stays neutral with regard to jurisdictional claims in published maps and institutional affiliations.

