
Multi-Dimensional Variation in Adult Speech as a Function of Age

1
Laboratoire de Phonétique et Phonologie, UMR 7018, CNRS/Université Sorbonne-Nouvelle, 75005 Paris, France
2
Institut de Recherches en Sciences et Technologies du Langage, FNRS/Université de Mons, 7000 Mons, Belgium
*
Author to whom correspondence should be addressed.
Languages 2021, 6(4), 176; https://0-doi-org.brum.beds.ac.uk/10.3390/languages6040176
Submission received: 23 July 2021
/
Revised: 11 October 2021
/
Accepted: 14 October 2021
/
Published: 25 October 2021
(This article belongs to the Special Issue Aging- and Disease-related Changes in Speech Production)
Abstract
:We present a multidimensional acoustic report describing variation in speech productions on data collected from 500 francophone adult speakers (20 to 93 y.o.a.) as a function of age. In this cross-sectional study, chronological age is considered as a continuous variable while oral productions, in reading and speech-like tasks, are characterized via 22 descriptors related to voice quality, pitch, vowel articulation and vocalic system organization, time-related measures and temporal organization, as well as maximal performances in speech-like tasks. In a first analysis, we detail how each descriptor varies according to the age of the speaker, for male and female speakers separately. In a second analysis, we explore how chronological age is, in turn, predicted by the combination of all descriptors. Overall, results confirm that with increasing age, speakers show more voice instability, sex-dependent pitch changes, slower speech and articulation rates, slower repetition rates and less complexity effects in maximal performance tasks. A notable finding of this study is that some of these changes are continuous throughout adulthood while other appear either at old age or in early adulthood. Chronological age appears only moderately indexed in speech, mainly through speech rate parameters. We discuss these results in relation with the notion of attrition and with other possible factors at play, in an attempt to better capture the multidimensional nature of the notion of “age”.
1. Introduction
A better understanding of the evolution of speech throughout adulthood is critical for our general understanding of the complexity of variables affecting speech production, since age-related changes can originate from various sources (physiological, cognitive, social inter alia). Moreover, it is crucial both for clinical research where data have to be age-standardized, and also for any research on speech for which factors of variability across talkers and indexical properties associated with speaker identity need to be taken into account.
While many studies have documented changes during speech development over childhood, fewer studies have focused on adulthood, even though the topic of speech aging has received increased interest during these last years, as attested in this journal issue. Among those, few longitudinal studies have been carried out, such as the seminal description of Harrington (2006) on Queen Elizabeth II’s speech over 30 years, or the ongoing work of Gerstenberg and colleagues (Gerstenberg et al. 2018; Fuchs et al. 2021). Other studies compare speakers across different age groups in a synchronous manner, as we do in the present study. While longitudinal studies have the advantage of focusing on individual patterns of evolution over the span of a lifetime, the acquisition process is lengthy and data are often restricted to a limited number of individuals (e.g., four speakers in Harrington et al. 2007). Cross-sectional studies, on the other hand, have the disadvantage of comparing speakers of various generations and thus cannot disentangle the effects of age from the effects of diachronic changes in the language and of many other speaker-specific aspects.
Whatever the methodology chosen, a large array of research questions and methodological challenges come with the search of age-related changes in speech. We will review some of them.
The first question refers to the definition of age. Chronological age—defined relative to the date of birth—is only one piece of the giant puzzle of effects that can modify the speech of an individual throughout adulthood. Disentangling the various factors that interact naturally with chronological age is a challenging endeavor. Social, cognitive, biological aspects, life experience, health condition, medication intake, social and physical activity, among others, may evolve in the life of an individual and may also differ across speakers of different ages. In turn, all these aspects may affect speech, as shown by Ramig (1983) for instance, for physical condition. He compared speakers in three groups based on chronological age, each made up of eight speakers in good physical condition and eight speakers in poor physical condition. Speech and articulation rates were slower for the older group compared to the younger group regardless of physical condition, but this age effect was increased by poor physical condition. High inter-individual variability is often reported in studies using categories based on chronological age, and within-category heterogeneity increases for the older groups (for discussion see, for instance, Pierce et al. 2013).
In the present study, we have chosen to identify the speakers by their chronological age, i.e., to operationalize the notion of “age” as chronological age, including all the confounding factors cited above that may have an effect on speech. One of the aims of our research is to assess how age-related information is indexed in speech, among other indexical information carried by the speech signal (Foulkes and Docherty 2006; Foulkes et al. 2010; Eckert 2017).
Most studies concerning changes over adulthood are concerned with aging. However, if longitudinal studies allow the search for traits that change or else persist throughout a life span, comparisons of groups of individuals in cross-sectional studies have rather focused on the identification of signs of attrition or senescence in speech. As a consequence, the definition of age groups comes up against a recurrent methodological question linked to the definition of the notion of aging itself: At what age does one become old?
There are very different definitions of ‘young’ or ‘old’ adult groups in the literature. Some are based on a “Western” definition (see Pierce et al. 2013) of the elderly person, with a break related to retirement around the age of 65–70, others account for physiological changes (e.g., hormonal changes in women from age 50, reduction of nerve fibers from age 60) or neurological changes affecting motor control or cognitive functions. Yet, the groups compared in the literature are very different (e.g., Gahl and Baayen 2019). For instance, Wohlert and Smith (1998) compared a group of young speakers from 20 to 35 years of age to a group of old speakers from 76 to 83 y.o.a., while Fletcher et al. (2015), compared a group of ‘younger’ speakers ranging from 65 to 69 y.o.a. to a group of 85 to 89 y.o.a., and Ramig (1983) compared three groups (20 to 35, 45 to 55, and 65 to 75 y.o.a.). If the variability in the delimitation of the studied age groups comes from a fluctuant definition of stages in adulthood, it also relates to the need to establish large enough samples, and more generally to recruitment constraints. For instance, a stratified sampling method was used for the recruitment of speakers in the MonPaGe_HA database used in this study, according to sex, region and 5 age groups spanning 10 to 20 years. This allowed a large recruitment campaign, but these age strata had to be further merged in order to carry out comparisons on large enough cohorts for clinical purposes (see Laganaro et al. 2021, for instance).
As a consequence of methodological differences (various age spans, but also variable speech material and speech tasks), comparison of the results reported in the literature is not straightforward. Moreover, in previous studies speech is typically characterized along a limited number of dimensions (2 to 3 at most), providing a limited understanding of the age-related differences in speech productions. Nonetheless, some changes in speech over adulthood have been attested. Here is what we know about speech changes throughout adult life.
The most frequent age-related change in adult speech is a slowing down of the temporal aspects of speech organization. A reduction in articulation rate is attested in many cross-sectional studies (inter alia Ramig 1983; Linville 2001; Jacewicz et al. 2009). It comes with an increase in utterance length (Horton et al. 2010) and pause duration (Bourbon and Hermes 2020). However, in their longitudinal studies on natural speech, Gerstenberg et al. (2018) did not find a change in speech rate or pauses for their German and French speakers, nor did Quené (2013) in his study of the Dutch Queen Beatrix.
At the segmental level, longer acoustic duration of vowels (Liss et al. 1990; Fletcher et al. 2015) and consonants (Morris and Brown 1987; Weismer 1984), as well as longer tongue movements (Goozée et al. 2005; Mücke et al. 2021) have been reported. Hermes et al. (2018) showed in their comparison of five young (20 to 30 y.o.a.) and five old (70 to 80 y.o.a.) speakers, that it is at the level of the temporal unfolding of the tongue movement that the gestures are different—with lower peak velocities and shorter acceleration phases, followed by longer deceleration phases; tongue movements for the old speakers are more asymmetric. Intra- and inter-speaker variability is also increased in the older group. In the same vein, Sweeting and Ronald (1982) found that the VOT at consonantal release before vowels is also more variable at old age (while no effect of age on VOT is found in Benjamin (1982); Weismer and Fromm (1983)).
Regarding articulatory precision, several studies have reported changes in vowel formants, but results are difficult to compare since they focus on different sets of vowels and speaker groups (see the review of Eichhorn et al. (2018), illustrating quite inconsistent results). Yet, several studies suggest some centralization of vowels at old age. Albuquerque et al. (2019, 2020) and Oliveira et al. (2021) report changes towards vowel centralization for older male speakers and a lowering of F1 and F2 for older female speakers in a large database of European Portuguese speakers. In their preliminary ultrasound study, Albuquerque et al. (2021) suggest that this decrease in F1–F2 frequencies relate to a smaller articulatory space, as demonstrated by the older female speakers. Sex-dependent changes are also reported in Rastatter et al. (1997), who observe more changes in male than in female speakers. As for elderly women (>87 y.o.a.) studied in Liss et al. (1990), they exhibit vowel centralization for front vowels. In contrast, Gahl and Baayen (2019) have shown in a longitudinal study of 11 speakers from age 21 to 49, that vowels rather tend to be more peripheral in F1/F2 with increasing age.
Vocal aging has also been demonstrated in many studies (see Stathopoulos et al. 2011; Kreiman and Sidtis 2011; Baken 2005 for reviews), where indicators of voice quality have been shown to vary with age towards less regular vibration and decreased f0 control (inter alia Ramig and Ringel 1983; Linville 2001; Schötz 2007). Changes in pitch with age throughout adulthood are also well documented, with clearer trends for male speakers; f0 is described as being lower for both male and female speakers until middle age (50’s), then it increases for older male speakers (e.g., Torre and Barlow 2009; Nishio and Niimi 2008).
This short overview of the literature reveals that, while some speech aspects do change with the age of the speakers, we do not exactly know how and when these changes occur, especially when only two extreme age groups are compared. In the present study, we specifically address this question through the analysis of a large cohort of speakers (500 speakers from 20 to 93 y.o.a.), who are characterized on multiple speech dimensions, and without defining a priori age groups. Rather, we consider chronological age as a continuous variable in order to evaluate whether changes are gradual or step-wise over adulthood, and if so, which are the “hinge ages”.
The following two questions will be addressed in this study: (1) which speech aspects vary as a function of age in adult speech, and how do they change over time? (2) How is chronological age indexed in speech, i.e., to what extent does the combined information arising from these various speech aspects allow the prediction of the age of speakers?
Note that, independently of the research questions addressed here, the present study also aims to provide valuable reference values related to typical variation in speech across sex and age in modern French based on a multidimensional acoustic dataset.
2. Materials and Methods
2.1. Population
This study is based on acoustic recordings of 500 French-speaking neurotypical adults (235 female and 265 male speakers) aged 20 to 93, whose distribution is presented in Table 1 in terms of decade and sex.
The recordings originate from several databases collected over recent years in the context of different projects related to the creation of the MonPaGe protocol, which has been developed to meet the need for a comprehensive speech screening tool for Motor Speech Disorders adapted to the French language (Laganaro et al. 2021; Pernon et al. 2020). The largest part of the data comes from the MonPaGe_HA (for Healthy Adults) database of spoken French (404 speakers; Fougeron et al. 2018), which was collected in order to establish the reference values necessary for the standardization of MonPaGe (Laganaro et al. 2021). In a second step, the database has been augmented by the recording of 96 speakers used as control speakers for the Mospeedi and SpeechNCo projets.
Participants were recruited in 4 French-speaking locations: Mons, Belgium (N = 100, 20% of the total speakers); Montreal, Canada (N = 97, 19%); Geneva, Switzerland (N = 141, 28%); and Paris, France (N = 162, 32%). This international recruitment was meant to introduce regional diversity in the reference values created for MonPaGe. Inclusion of participants was not strictly focused on well-defined regional varieties in each location, however. For example, speakers recorded in Geneva originated mainly from the larger Lemanic area; speakers recorded in Paris originated mainly from diverse regions within the northern half of France. All participants spoke French as their primary language (mother tongue and currently used language).
Sociolectal diversity was also introduced by recruiting participants in the local community and among the relatives of the experimenters. All volunteer participants signed informed consent forms before participating in the study. Speakers in the oldest group (>75) were screened for language and cognitive deficits (with either the e-GeBAS, Chicherio et al. 2019 or MMSE, Folstein et al. 1975).
All participants were recorded individually in a quiet room at their home or in one of the participating research centers with various audio materials, in order to reflect the diversity in audio equipment found in clinical/SLT practices.
For the administration of the protocol, the computerized version of the MonPaGe protocol was used (Trouville et al. 2021). This software allows the prompting of the speech material/tasks in a set order, as well as the instant recordings of each production as a single audio file, indexed with the speaker’s reference code. Speakers were seated in front of the computer and a trained experimenter administrated the protocol. The protocol was administered without a time constraint and lasted for about 30 min.
2.2. Speech Material & Speech Descriptors
The MonPaGe protocol includes several speech and speech-like tasks targeting multiple aspects of speech production. It is organized into 8 modules, detailed descriptions of which can be found elsewhere (Fougeron et al. 2018; Pernon et al. 2020). Below we describe, per speech dimension, the tasks and speech material on which speech measures were performed and speech descriptors derived.
Twenty-two descriptors have been selected for this study among the many possible speech characteristics that could be explored. The rationale behind this selection was to capture aspects related to the main dimensions of speech: voice, pitch, articulation, and temporal organization of speech. Since the assessment of speech in clinical settings also relies on speech-like tasks targeting speech behavioral responses to pressure on the production system, and since these behaviors may also differ according to the age of the speakers, we also report on descriptors related to performances in maximal performance tasks. These indicators include highly popular and at the same time highly criticized descriptors such as jitter/shimmer, vowel space area or maximum phonation type, as well as more innovative ones such as the “SMRbdg-AMRde” complexity index of performance in repetition tasks (see description below). Ideally, the former will facilitate comparisons with previous works in the literature, while the latter will allow us to capture some specific, usually less-documented, aspects of the participants’ speech productions.
Table 2 summarizes the descriptors and provides descriptive statistics according to sex.
2.2.1. Voice
Voice-related descriptors are based on a sustained production for 2–3 s of the vowel /a/ at a comfortable height and loudness.
Standard indicators of voice quality are taken in the first 2 s of the sustained /a/ vowel. These include the two short-term (cycle-to-cycle) measures of vocal instability in terms of frequency and amplitude: jitter and shimmer, respectively. These are computed using Praat (Boersma and Weenink 2019) as the five-point Period Perturbation Quotient (Jitter) and the 11-point Amplitude Perturbation Quotient (Shimmer). Instability in vocal fold vibration is assessed using the standard deviation of the fundamental frequency, as measured every 10 ms over the whole 2 s /a/ window (SdF0). Presence of a noise component during the vowel is measured in terms of the harmonic-to-noise ratio (HNR), and voice quality is also assessed using the smoothed cepstral peak prominence measure (CPPs; Hillenbrand et al. 1994).
2.2.2. Pitch
Indicators related to pitch and pitch modulation are measured on a fully voiced sentence, “Mélanie vend du lilas” (Mélanie sells lilacs). On the f0 time series computed over the whole sentence, mean (PitchMean) and coefficient of variation (PitchVarco) are computed.
2.2.3. Articulation
Descriptors related to articulation are measured on the formants of seven peripheral oral French vowels /i, e, ɛ, a, ɔ, o, u/. They are produced in a bilabial context in a /pV/ pseudoword for all vowels except /ɛ, ɔ/, which are inserted into a /pVp/ pseudoword due to phonotactic reasons. Syllables are presented three times in row (e.g., /pe/, /pe/, /pe/; /pa/, /pa/, pa/), giving 3 tokens per vowel. Speakers are presented with these pseudowords (along with many others not used here) both in an audio and a written form, so they either repeat or read the forms at convenience.
F1 and F2 formants (in Bark) are measured over the whole duration of the vowel for each token using the Burg algorithm for Praat, with a 0.025 s window length and a maximum of 5 formants up to 5 KHz for male voices and to 5.5 KHz for female voices.
Different metrics have been developed to capture reduction in the F1/F2 acoustic space, conceived as the oral articulatory working space (Neel 2008; Fox and Jacewicz 2017; Caverlé and Vogel 2020, among many others). These measures are meant to capture either the overall size of the system, with differences in the number of ‘corner’ vowels used to define the system; or the distribution of the tokens relative to what could be considered as a proxy of an under-articulated system. The latter includes a measure of global centralization (how corner vowels are getting closer to the system centroid), of reduction in F1 or F2 ranges, or on different vowel-specific dimensions.
- Vowel space areas: tVSA represents the area of the triangle formed by the 3 peripheral vowels /i-a-u/, and hVSA capture the area of the heptagone formed by the 7 vowels /i, e, ɛ, a, ɔ, o, u/. Areas of the triangles are computed using the formula given below, and the heptagone area is obtained as the sum of the /ieu/, /euo/, /eɛo/, /ɛoɔ/ and /ɛaɔ/ triangles:with x = F1 et y = F2 (e.g., area(iau) = 0.5 × [F1i × (F2a − F2u)+F1a × (F2u − F2i) + F1u × (F2i − F2a)]Area(123) = 0.5 × [x1(y2 − y3) + x2(y3 − y1) + x3(y1 − y2)]
- Distance to the system centroid: In order to get a measure of acoustic dispersion of the vowel tokens relative to the center of the system, an F1–F2 grand mean (the system centroid) is computed over all vowel tokens (5 vowels × 3 repetitions) for each speaker to get the centroid of each speaker vowel space. Then, the Euclidian distances of each vowel token to this grand mean is computed. The degree of dispersion within the speaker’s acoustic space is then expressed as the mean of these individual distances to the centroid (Dist2center).
- Reduction in specific directions: Sapir et al. (2010) developed a series of measures to capture reduction that could occur in particular F1 and/or F2 dimensions according to the vowels. The FCR (formant centralization ratio) is expressed as (F2u + F2a + F1i + F1u)/(F2i + F1a) and rely on the hypothesis that hypoarticulation would result in an increase in the formant values included in the numerator of the fraction, while a decrease is predicted for the items of the denominator. In order to capture potential reduction in the mobility of the tongue, Sapir et al. (2007) also used a measure of reduction in the range of F2 values expressed as F2RR = F2i/F2u. Following the same idea, in Audibert and Fougeron (2012), we used a measure of reduction in the F1 dimension to capture reduction in oral opening, expressed as the F1 range ratio: F1RR = F1a/mean(F1i, F1u).
2.2.4. Temporal Organization
The temporal organization of speech is assessed on the reading of a custom-made 188-words story, split into 8 parts (8 groups of sentences), presented successively on the computer screen. An automatic segmentation of pauses and spoken intervals is performed on Praat using a customized version of the “Syllable Nuclei” Praat script (De Jong and Wempe 2009). The number of pauses (PauseN) and their mean duration (PauseDur) are computed. Measures of rate are estimated by dividing the number of syllables in the text (20 to 48 per part, for a total of 246 syllables) by the summed duration of the spoken intervals for the ArticRate descriptor, and by the summed duration of the spoken intervals and pauses for the SpeechRate descriptor. The ArticRateVarco descriptor is computed as the coefficient of variation of the articulation rate averaged over the 8 parts. It is meant to capture how stable speakers are in their speech rate over the whole text.
2.2.5. Performances in Speech-Like Tasks
As a standard measure of pneumo-phonatory control, an indicator of maximum phonation time (MPT) over a sustained vowel is computed. Participants are instructed to produce a sustained /a/ vowel as long as possible after taking a maximal inhalation, at a comfortable pitch and at their usual loudness. An audio example is provided to illustrate these instructions. The task is repeated as many times as needed and two productions are recorded. The duration of the sustained /a/ is measured for both trials and the best performance is selected as the maximum phonation time (MPT).
Maximum repetition rates in oral diadochokinetic (DDK) tasks are often used in clinical practice to test the ability to perform alternating articulatory movements in quick succession. Two repeated items, which vary in terms of complexity, are used here: the repetition of the same CV syllable /de/ or the repetition of a sequence of three different CV syllables /badego/. Participants are instructed to produce these sequences in a continuous manner for at least five seconds as fast and as accurately as possible. A window of 4 s of continuous repetition is selected from the onset of the speech waveform and is manually adjusted to the right in order not to cut the last syllable if needed. The number of syllables produced over this interval is then counted to provide an alternative motion rate (AMR_de) for the /de/ sequence and a sequential motion rate for the /badego/ sequence (SMR_bdg), as the number of syllables divided by window duration. Since the repetition of a single syllable doesn’t allow preparation for the upcoming syllable before the preceding syllable is completed, AMR in /dededede…/ is usually slower than SMR in /badegobadego…./ where the planning and programming of the successive different syllables can be anticipated. In order to capture these differences between the sequences, an index of complexity is expressed as the difference between the two rates: SMR−AMR = SMR_bdg− AMR_de.
2.3. Statistical Analysis
All analyses were conducted on male and female speakers separately. The rationale for this analysis by sex is twofold. First, most of the descriptors related to voice quality, pitch, and vowel formants are highly sex-specific and would have required undesirable normalization, and thus leveling of inter-speaker differences, to be merged in a single analysis. Secondly, different changes due to age have been reported for male and female speakers (e.g., for pitch as mentioned in the introduction). Understanding these trends is of crucial interest and adding sex as a factor would unnecessarily complicate the models—thus the separate “per sex” analysis.
In order to limit the impact of outliers in our analyses, we first proceeded to a winsorization for each descriptor by replacing the values below and above the 1% and 99% centile by the values at theses centiles, respectively, with the Winsorize function of the DescTools package (Signorell et al. 2021). Then, two analyses with Multivariate Adaptative Regression Splines (MARS) were performed using the earth package (Milborrow 2021) in R (R Core Team 2021).
MARS modeling is a non-parametric regression method that can be used to model both linear and non-linear relationships between variables. Unlike step functions, MARS does not include a priori predictions about the nature of non-linearity. Non-linear relationships are evaluated by the identification of cut points (knots) in the data that connect the piecewise curves. The model is built in two steps: The first goes forward in search for cutpoints or knots in the data, where a linear regression between the variables can be fitted with the smallest error—creating what is called a hinge function h(a − x) or h(x − a), where ‘a’ is the knot. The procedure continues with the construction of a very complex model to best fit the data. The second step goes backwards, in a pruning phase, to eliminate the knots that least contribute to predictive accuracy, in order to avoid overfitting. Moreover, it automatically performs variable selection, excluding variables with no explanatory power (in case of collinearity) and assessing variable importance. Variable importance measures the impact of the prediction error as more features are included (Friedman 1991; Boehmke and Greenwell 2020).
The first MARS analysis aims to understand the relationship between each of the 22 speech descriptors and chronological age, and to identify hinge age(s) at which chronological age shows a change in its relationship with the descriptor. Chronological age is modeled as a continuous variable and as the sole predictor for each of the 22 descriptors.
The second MARS analysis is meant to explore how chronological age is, in turn, predicted by the combined 22 speech descriptors. The model takes chronological age as the predicted variable and the acoustic descriptors as predictive ones. The relative importance of the predictors in the model is extracted using the evimp function of the earth package in R (Milborrow 2021).
As a complement, in order to explore the relationships between the speech descriptors and to reduce the dimensionality space, we performed a principal component analysis (PCA). The objective was to study how individual speakers are distributed in this principal component space according to their age. For this purpose, we used the prcomp function of the stats package (R Core Team 2021) and the Factoextra package (Kassambara and Mundt 2020) for visualization (with center = TRUE and scale = TRUE to transform all the continuous descriptors included in the correlation matrices into z-scores). PCA was performed from the 22 speech descriptors and we have thus obtained 22 dimensions. To determine the number of main components to be considered, we used the scree plot criterion, which consists in visualizing the eigenvalues (y-axis) for each principal component (x-axis) and identifying the “elbow” in the curve to keep only the components preceding it. The reported results focus on the first three principal components.
3. Results
3.1. Analysis #1: How Does Each Speech Descriptor Vary as a Function of Age?
In this section, we present the results of the first MARS analysis, showing how chronological age predicts each of the 22 speech descriptors separately. Results are summarized in Table 3 and general tendencies are described below.
Overall, and as expected, considering the large number of factors known to affect speech, chronological age alone contributed only moderately to explain the variance of each speech descriptor. Most of the R2 reported in Table 3 are lower than 0.10. Nonetheless, for both female and male speakers, a fairly large amount of variation was accounted for by age alone for the descriptors associated with rate (28 and 30% for articulation rate, 19 and 16% for speech rate, 15 and 19% for AMR, respectively). Noteworthy, among the voice descriptors, variance of the SdF0 descriptor for both sexes (13% and 14%) and variance of the CPPs for the male speakers (15%), were best predicted by age.
More interestingly, linear and non-linear relationships were accounted for by the models showing increases (positive coefficients) or decreases (negative coefficients) in the descriptor values as a function of age. Based on hinge functions (h(x − a) or h(a − x), where a is the cut-point value and x the predictive variable, i.e., the age), this method allowed us to identify “hinge” ages where the relationship changes between the predicted speech descriptor and chronological age.
Figures provided in Appendix A allow visualization of the relationships between each descriptor and age, as well as the hinge functions computed by the MARS models.
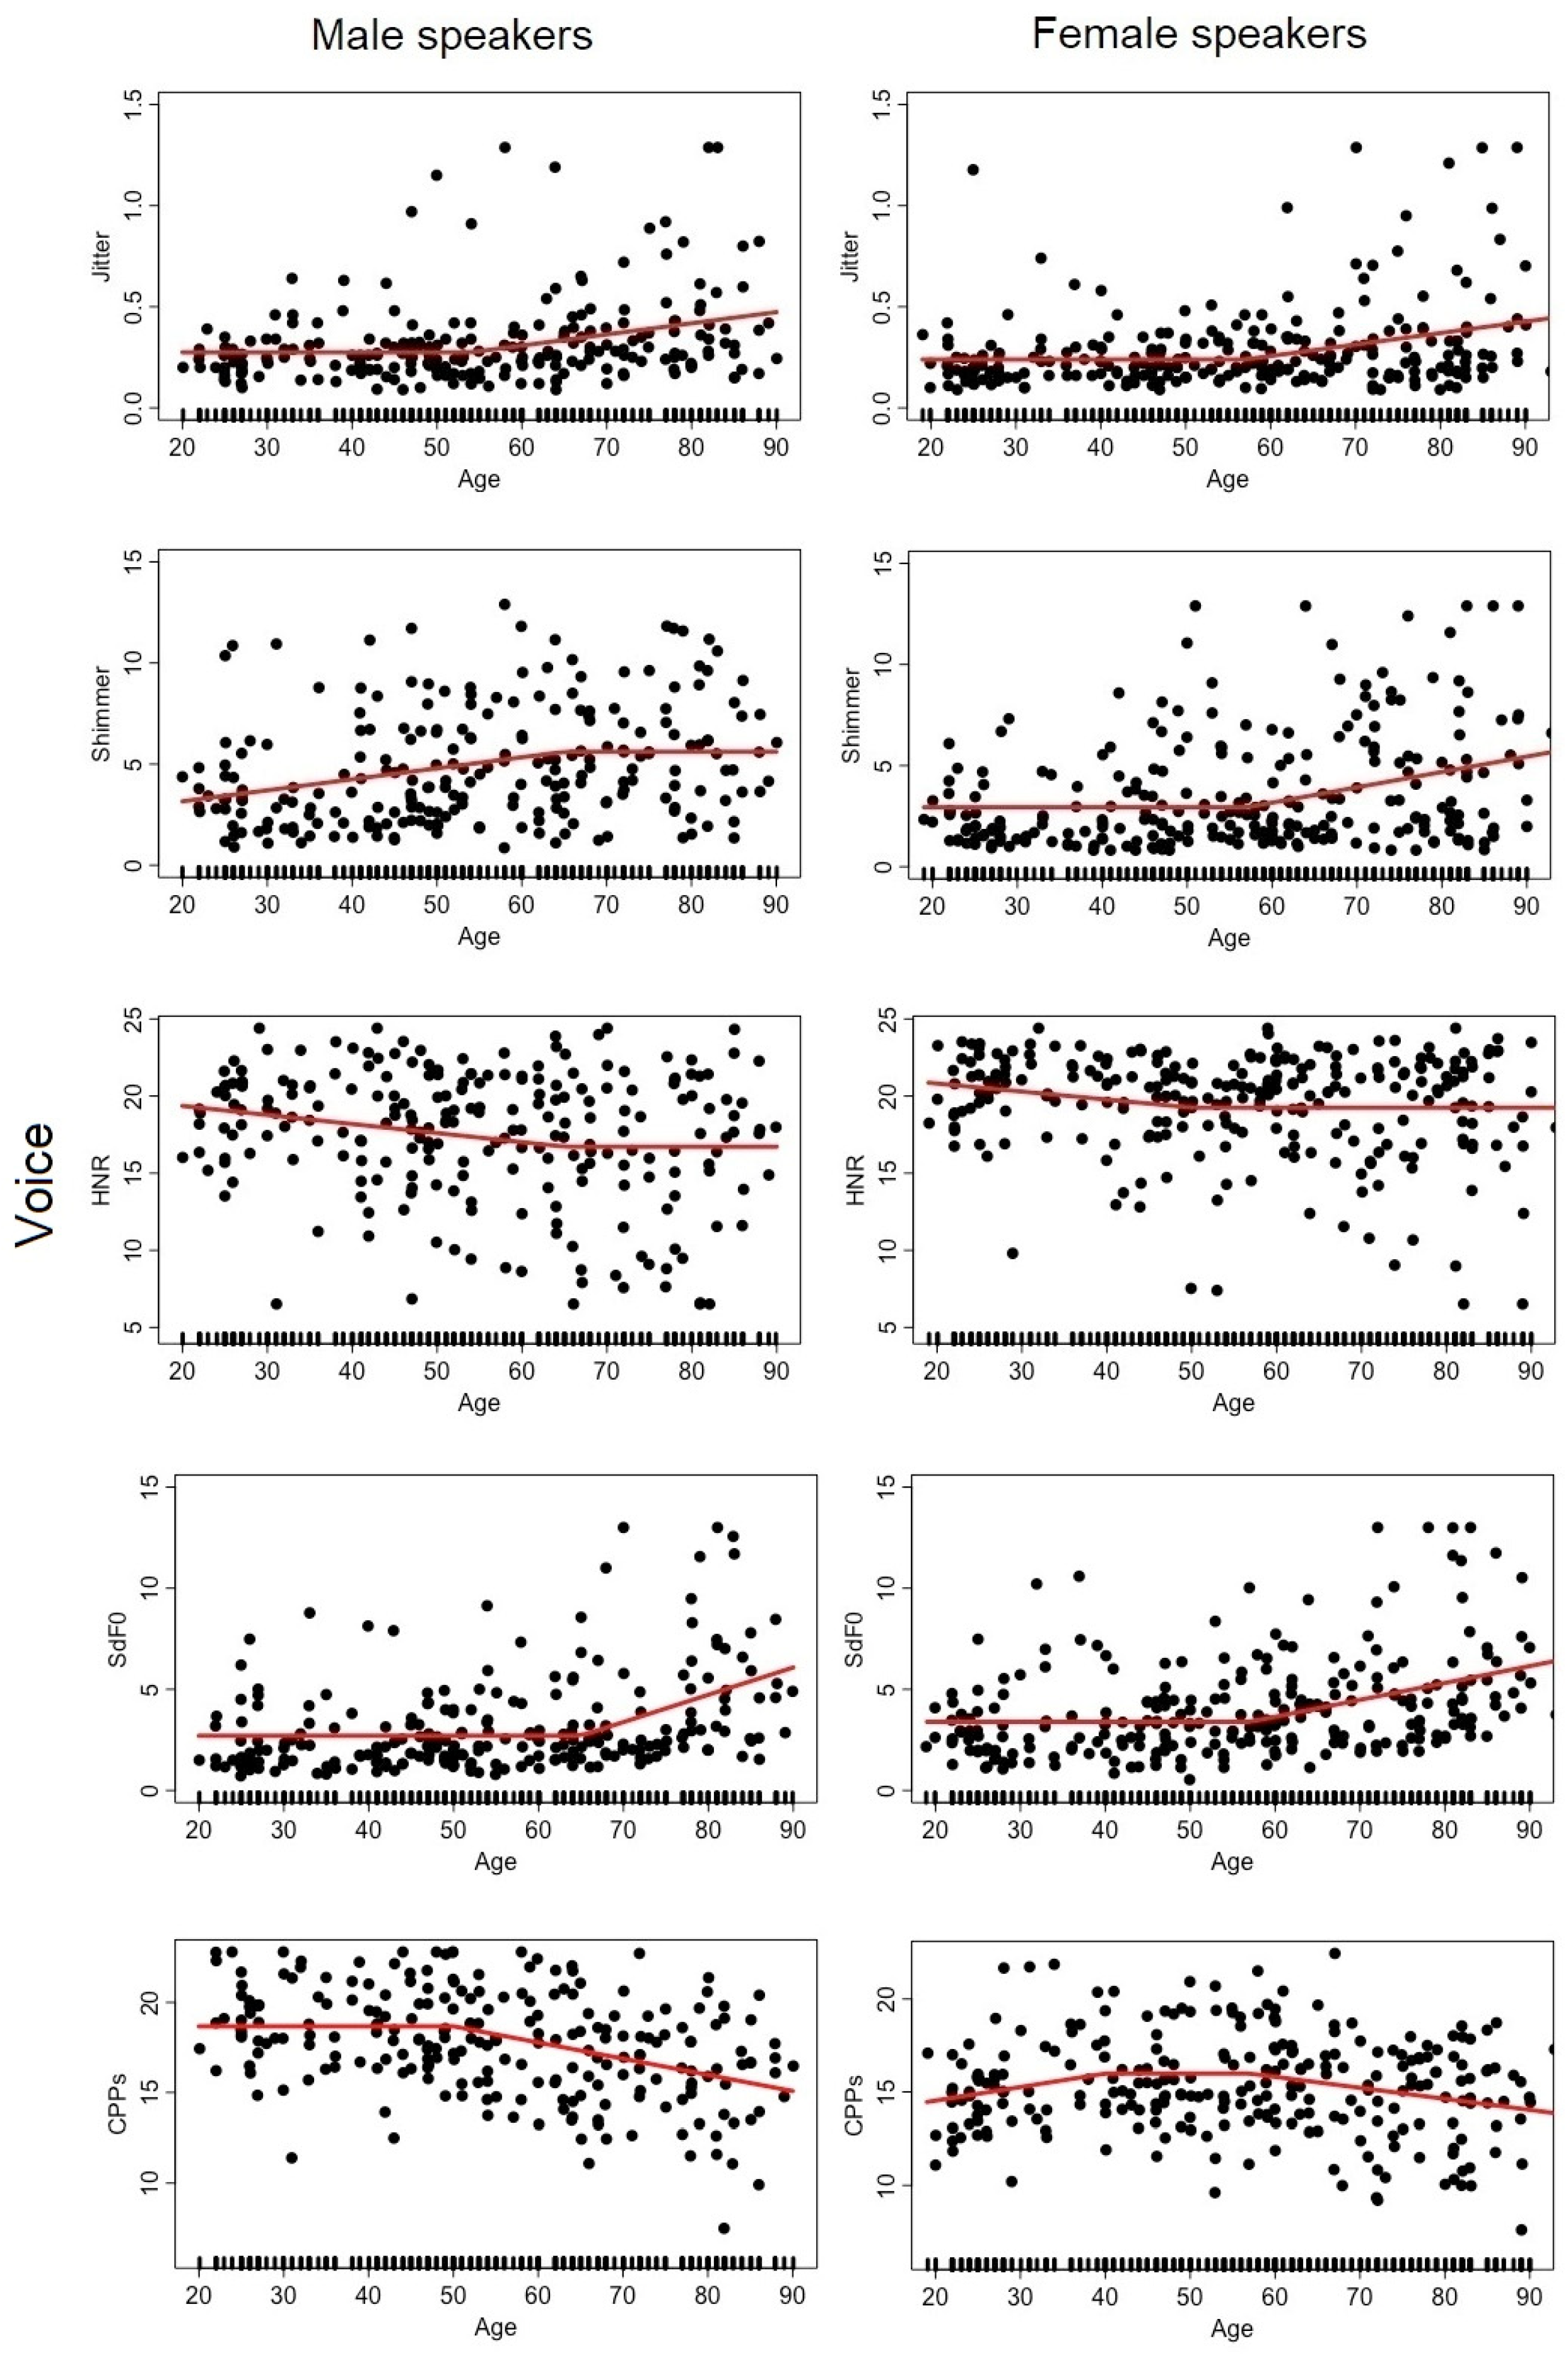
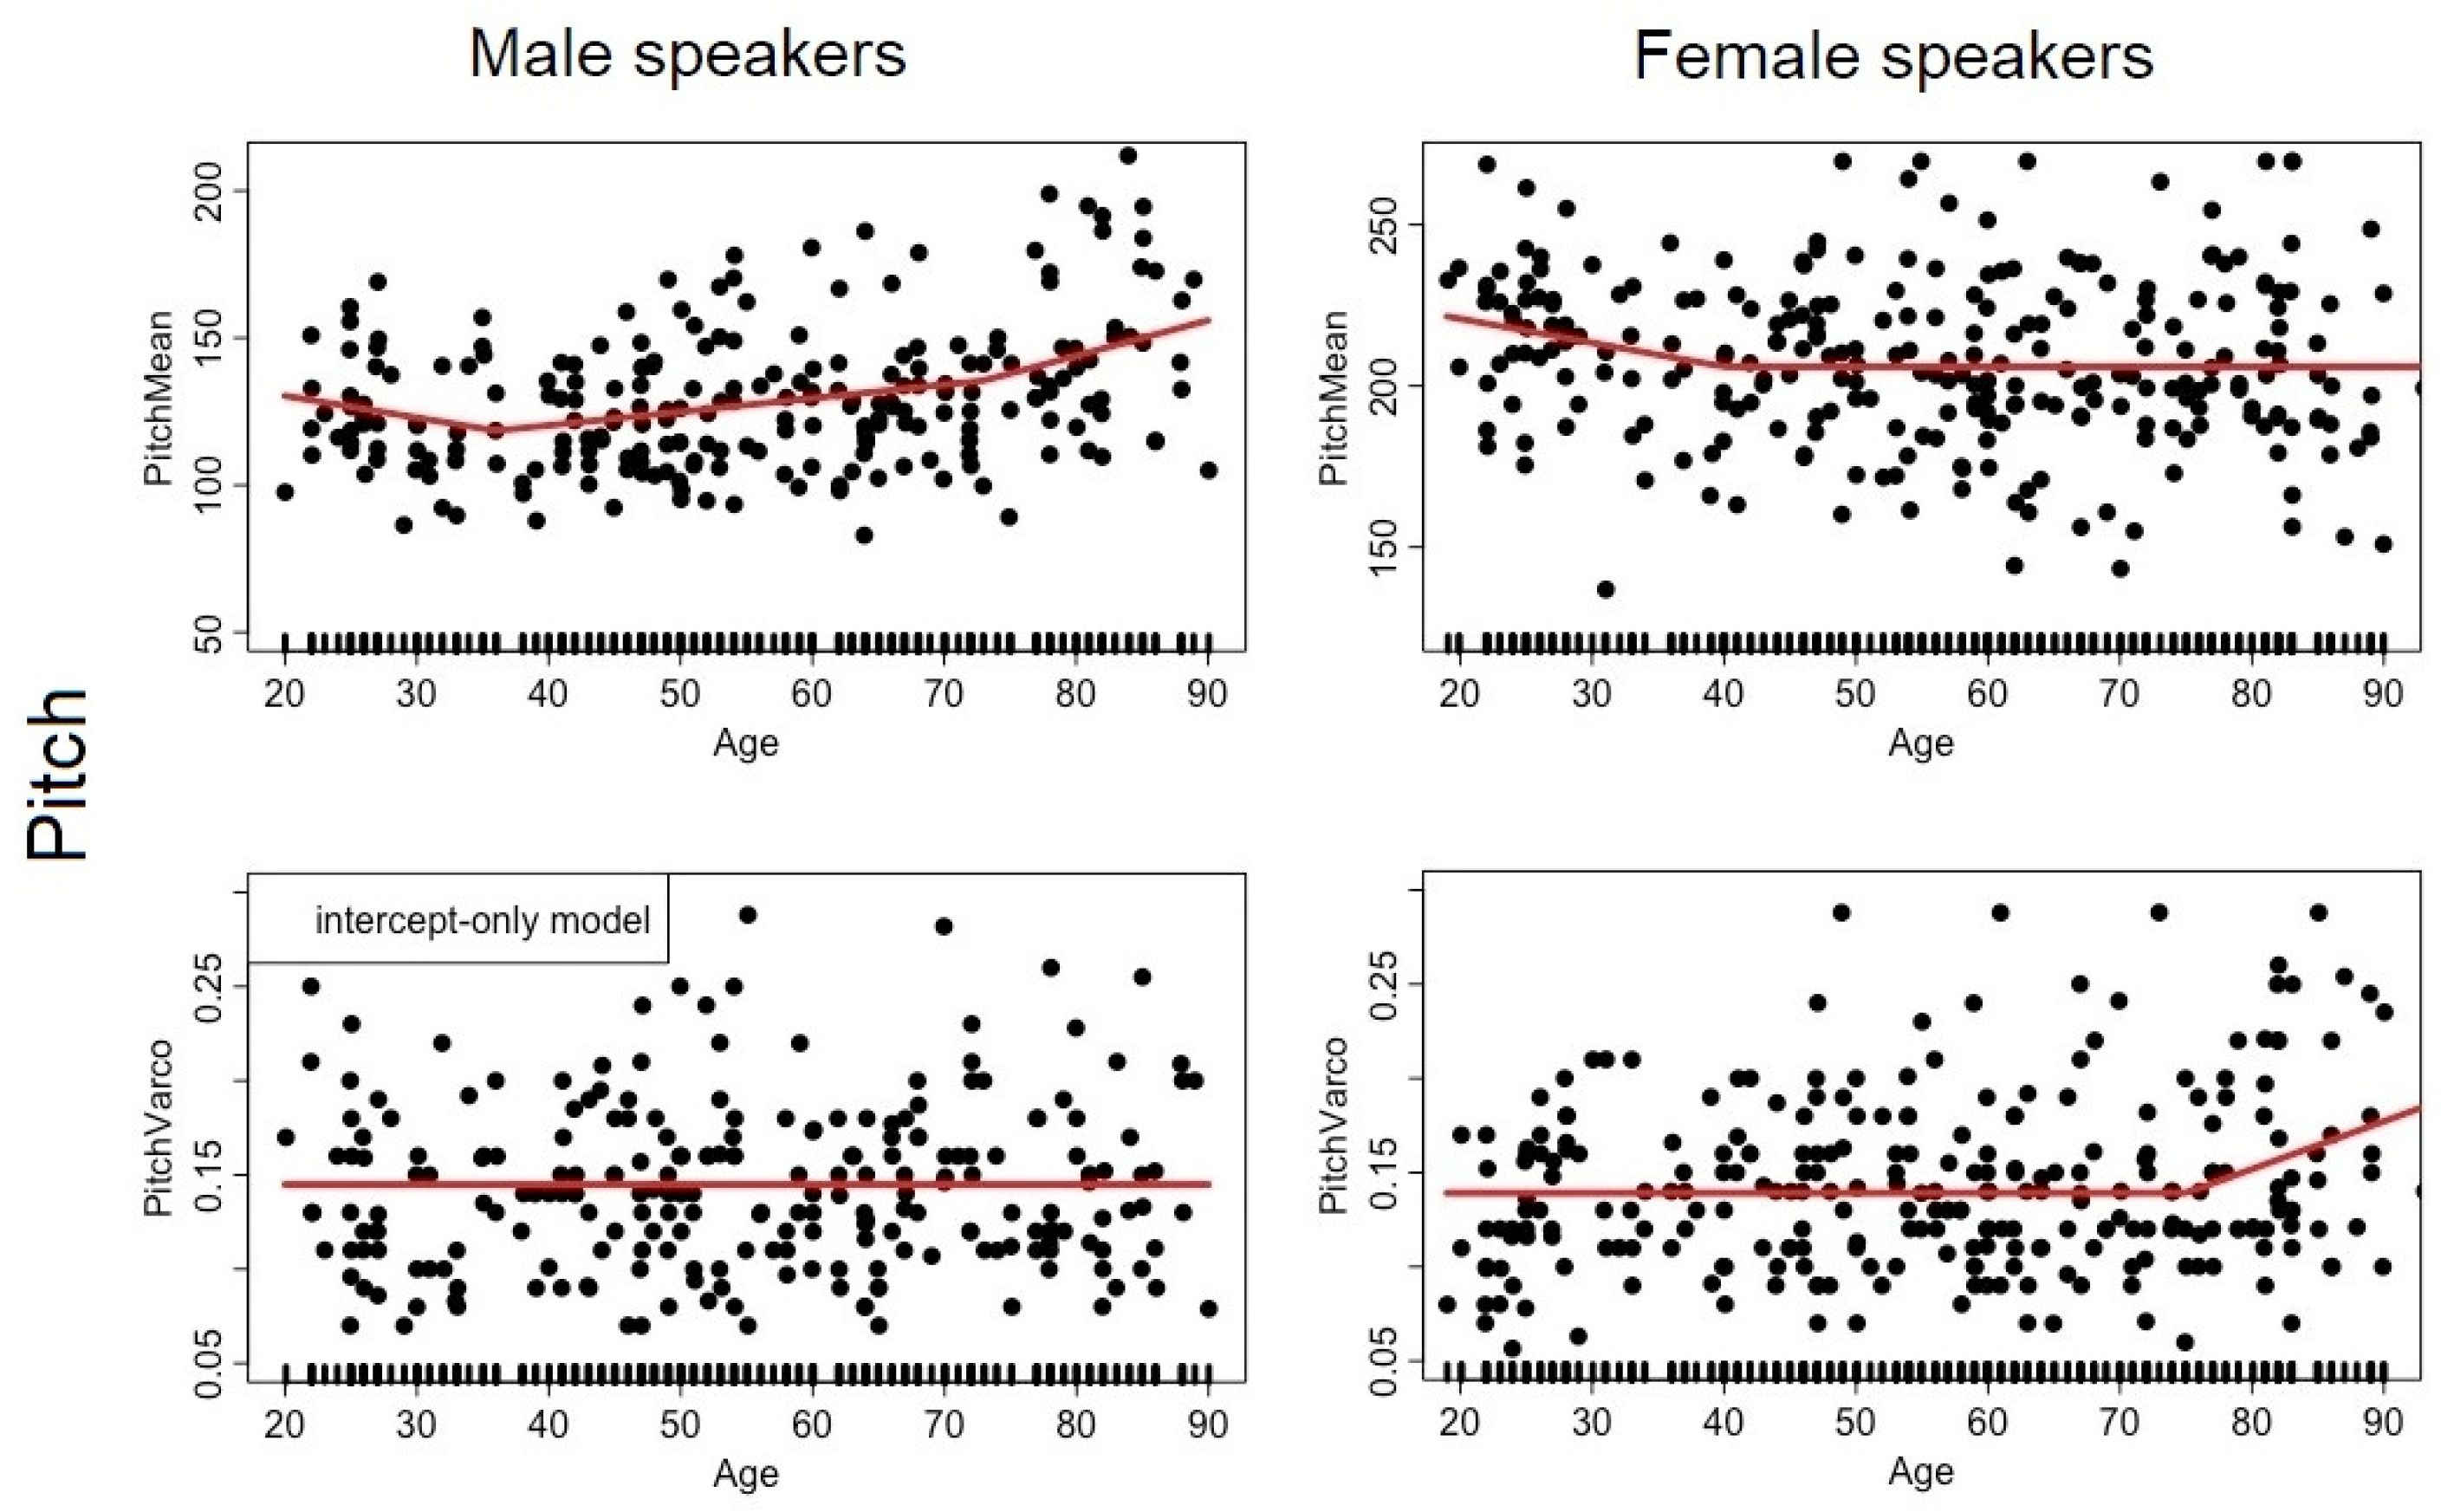
As far as the voice descriptors are concerned, we replicated the well-attested tendency towards a decline in voice quality with age, with an increase in voice instability indicators (jitter, shimmer, sdF0) starting in middle age. Interestingly, some voice descriptors presented changes at earlier stages of adulthood (HNR, CPPs). Concerning pitch, for both sexes there was a noticeable lowering of PitchMean from early to mid-adulthood (up to 36–40 y.o.a.) as illustrated in Figure 1 for male and female speakers, respectively. Then, for male speakers only, PitchMean took a lift after 75 y.o.a. As for older female speakers, we also observed a change for speakers older than 75 y.o.a., but in terms of PitchVarco; pitch appears to be more modulated in old age for female speakers.
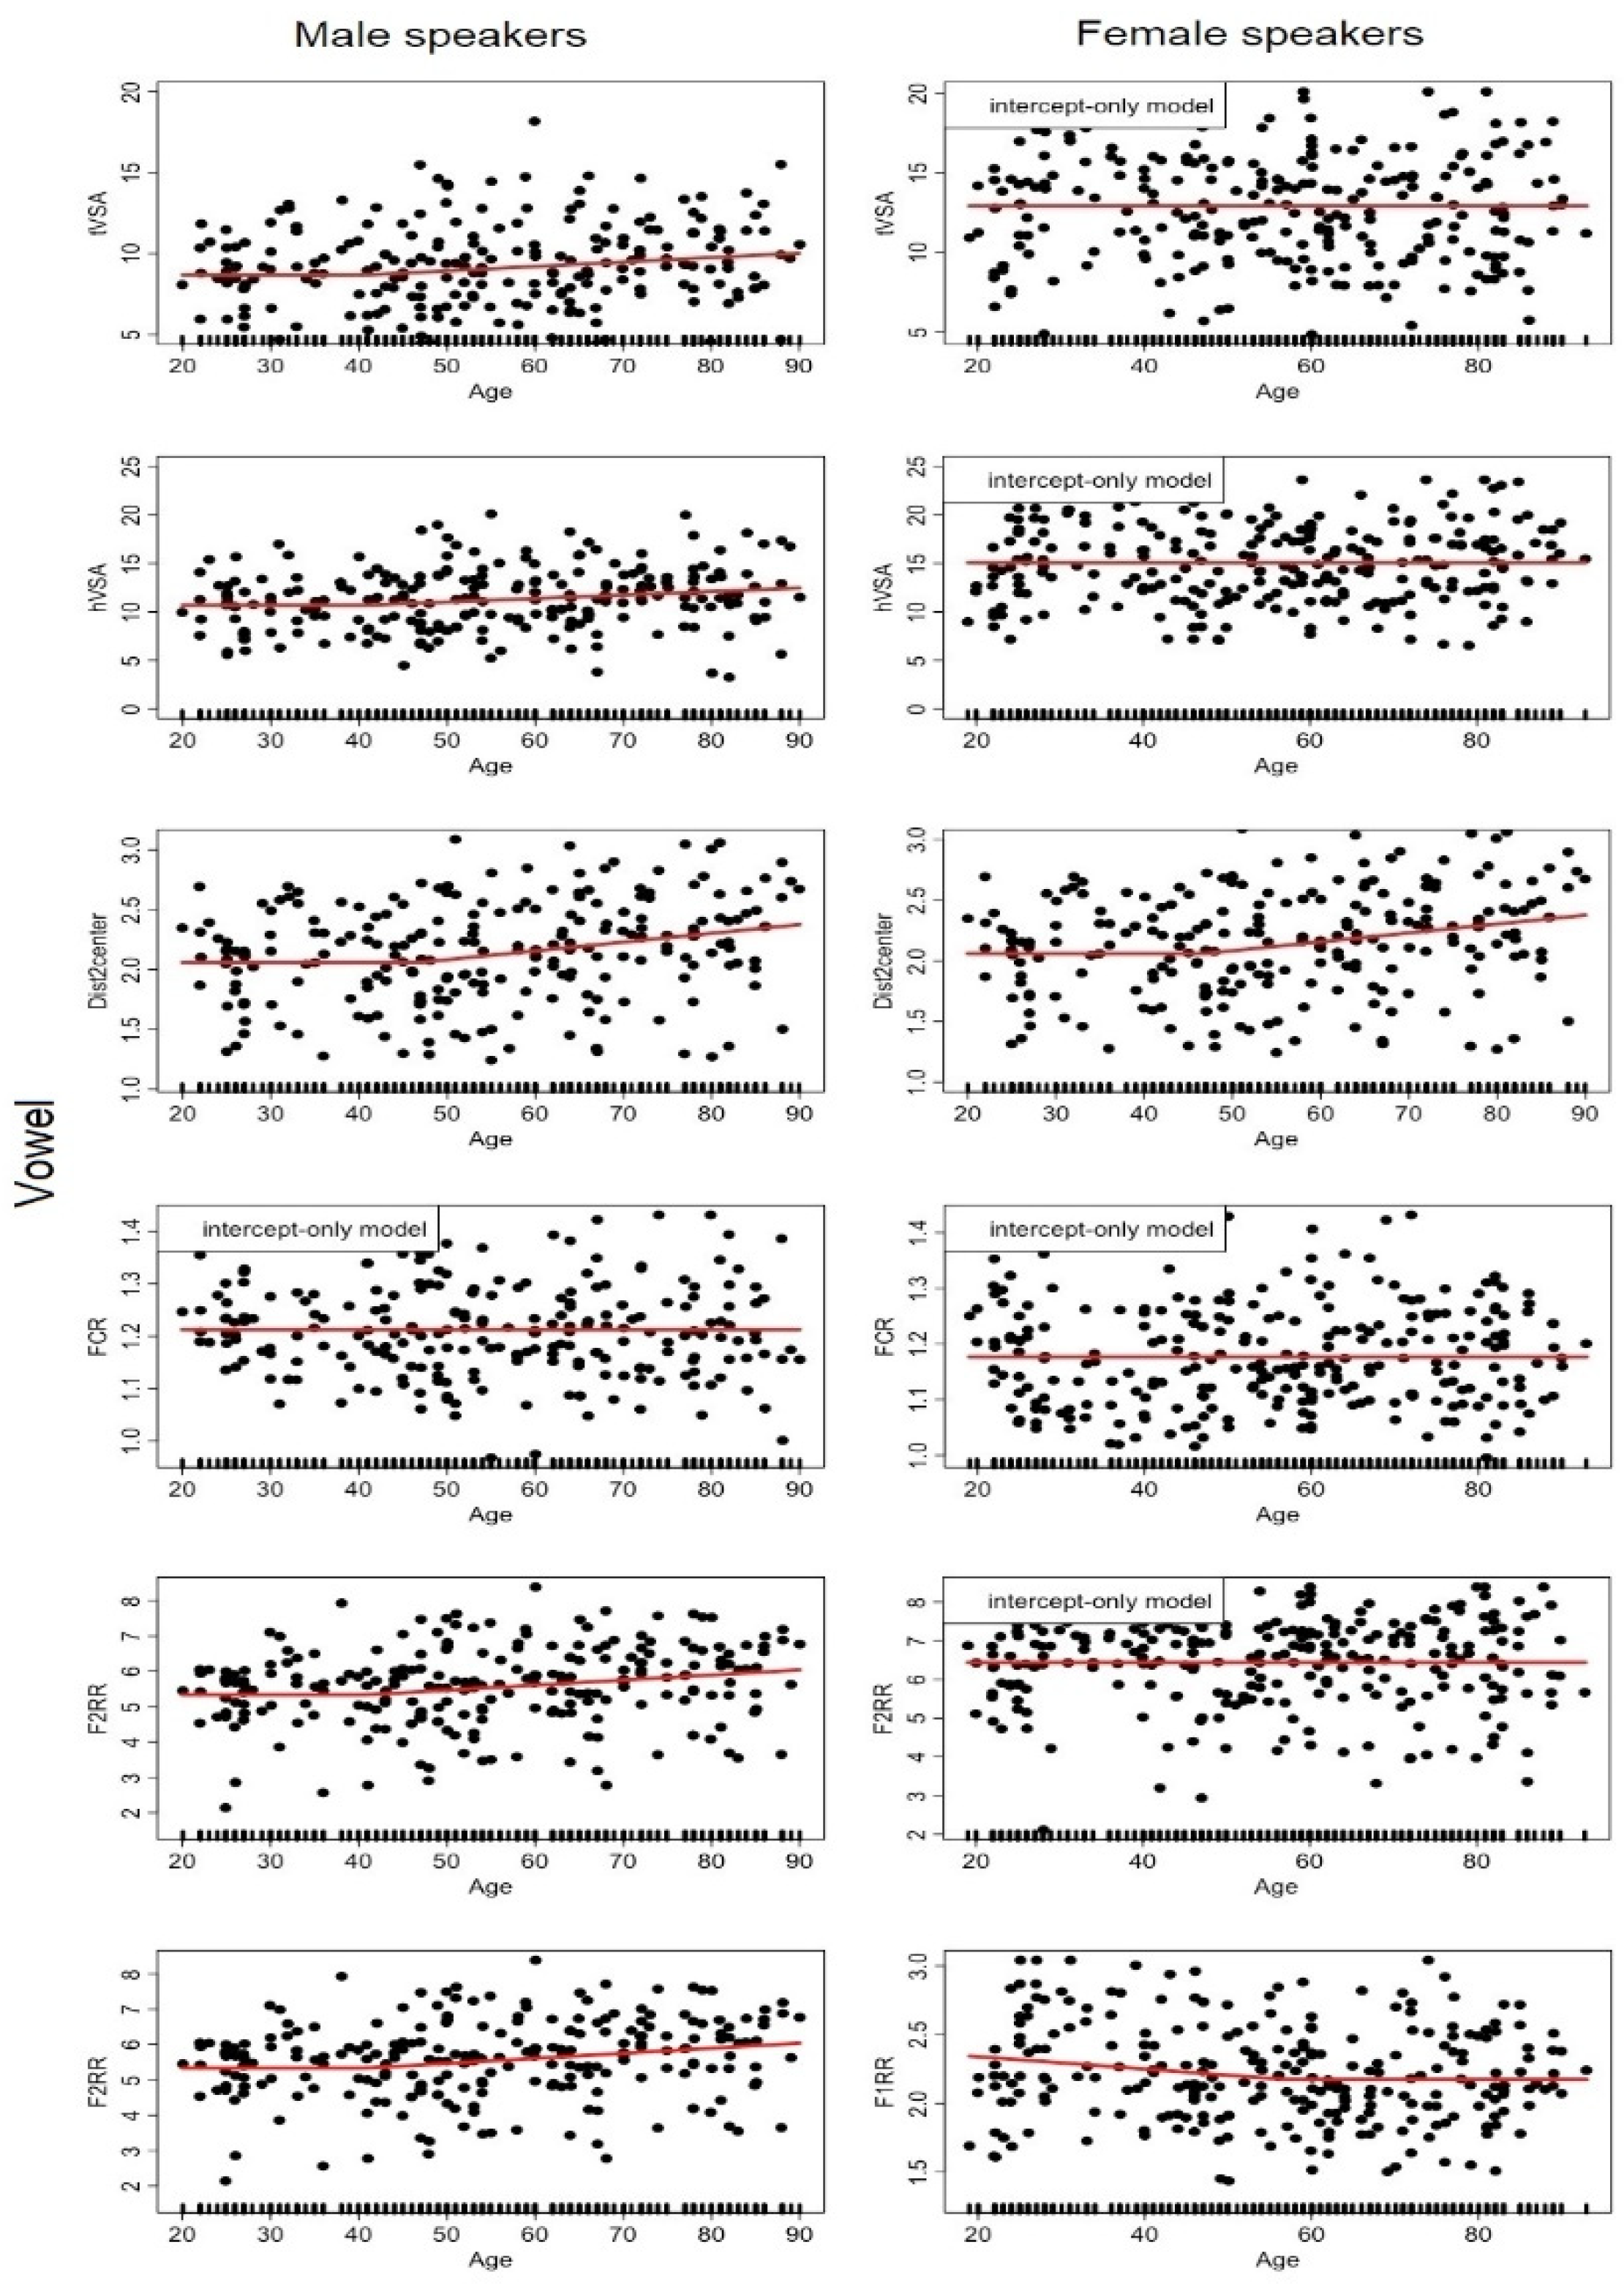
Regarding vowel articulation, the variance for the associated descriptors was overall not well accounted for by age alone; R2’s were quite low. For the male speakers, there was a moderate tendency to increase vowel dispersion (larger hVSA, tVSA, Dist2Center, F2RR) after their 40’s. For the female speakers, there was only a tendency toward a decrease in vowel dispersion up to 57 y.o.a., captured by the measure of F1RR.
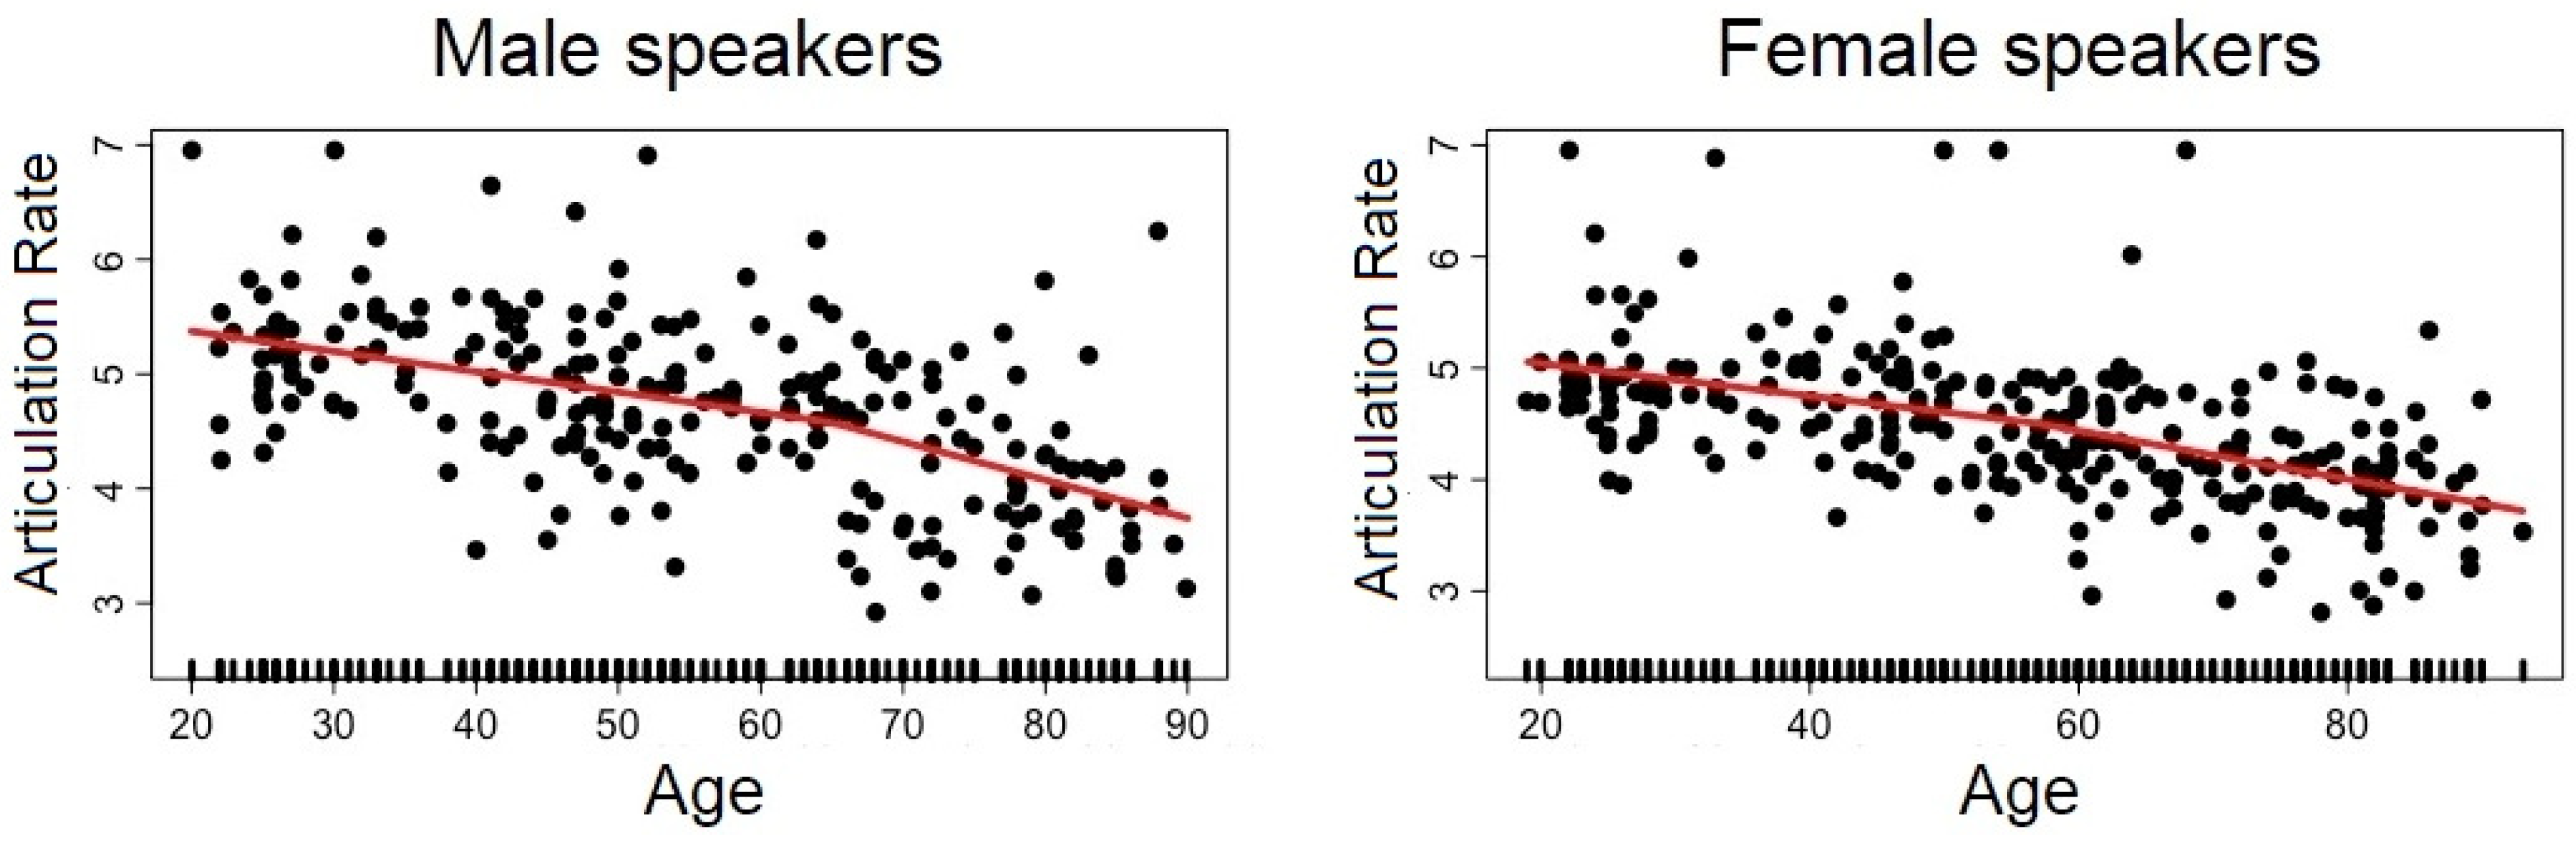
Typical changes reported in the temporal organization of speech at old age were replicated in the present study. More interestingly, we showed that this change was much more gradual over time than previously described. Indeed, both speech rate and articulation rate were found to gradually decrease throughout adulthood, as can be seen in Figure 2 for ArticRate. The large inflection observed in speech rate in late middle age probably resulted from the combined effect of an increase in articulation rate (both sexes), number of pauses (female speakers) and pause duration (male speakers). Finally, a decrease in performance for the two DDK tasks took place in early middle age for both male and female speakers (around 40–54 y.o.a.), followed by a final stabilization in performance. At a later age, AMR and SMR rates tended to equalize, because the facilitation on SMR was mitigated. As far as the maximum phonation time was concerned, we only found a decrease for the female speakers after 76 y.o.a.
3.2. Analysis #2: How Is Chronological Age Predicted by all Descriptors Combined?
Since all the speech dimensions measured by our descriptors co-occurred in the speech signal, we investigated how their combined effect could account for the chronological age of the speaker, i.e., their indexical properties.
As a first stage, we tested in a single MARS analysis how the 22 speech descriptors predicted the chronological age of the speakers. Again, the models were carried out separately for male and female speakers. Table 4 lists the hinge functions of the achieved MARS models and the corresponding estimate values (β). Variance of age was accounted for by 9 descriptors out of 22 for female speakers, against 7 for male speakers, with a slightly better explicative power of the model (55% for female vs. 47% for male speakers). These meaningful explanatory variables and their significance level (%) are presented by order of importance in Table 5.
Articulation rate was the best predictor for both sexes, i.e., the descriptor that contributes the most to explain variation in age. Age was explained next by voice-related predictors: SdF0 for the female speakers, and shimmer, SdF0 and HNR for the male speakers. Descriptors associated with vowel articulation and vowel space organization were also found to be moderate predictors for both sexes (distance to centroid and tVSA with equal importance for the female data and then hVSA; distance to centroid for the male data). The other descriptors contributed less (i.e., most of them were eliminated early during the pruning procedure).
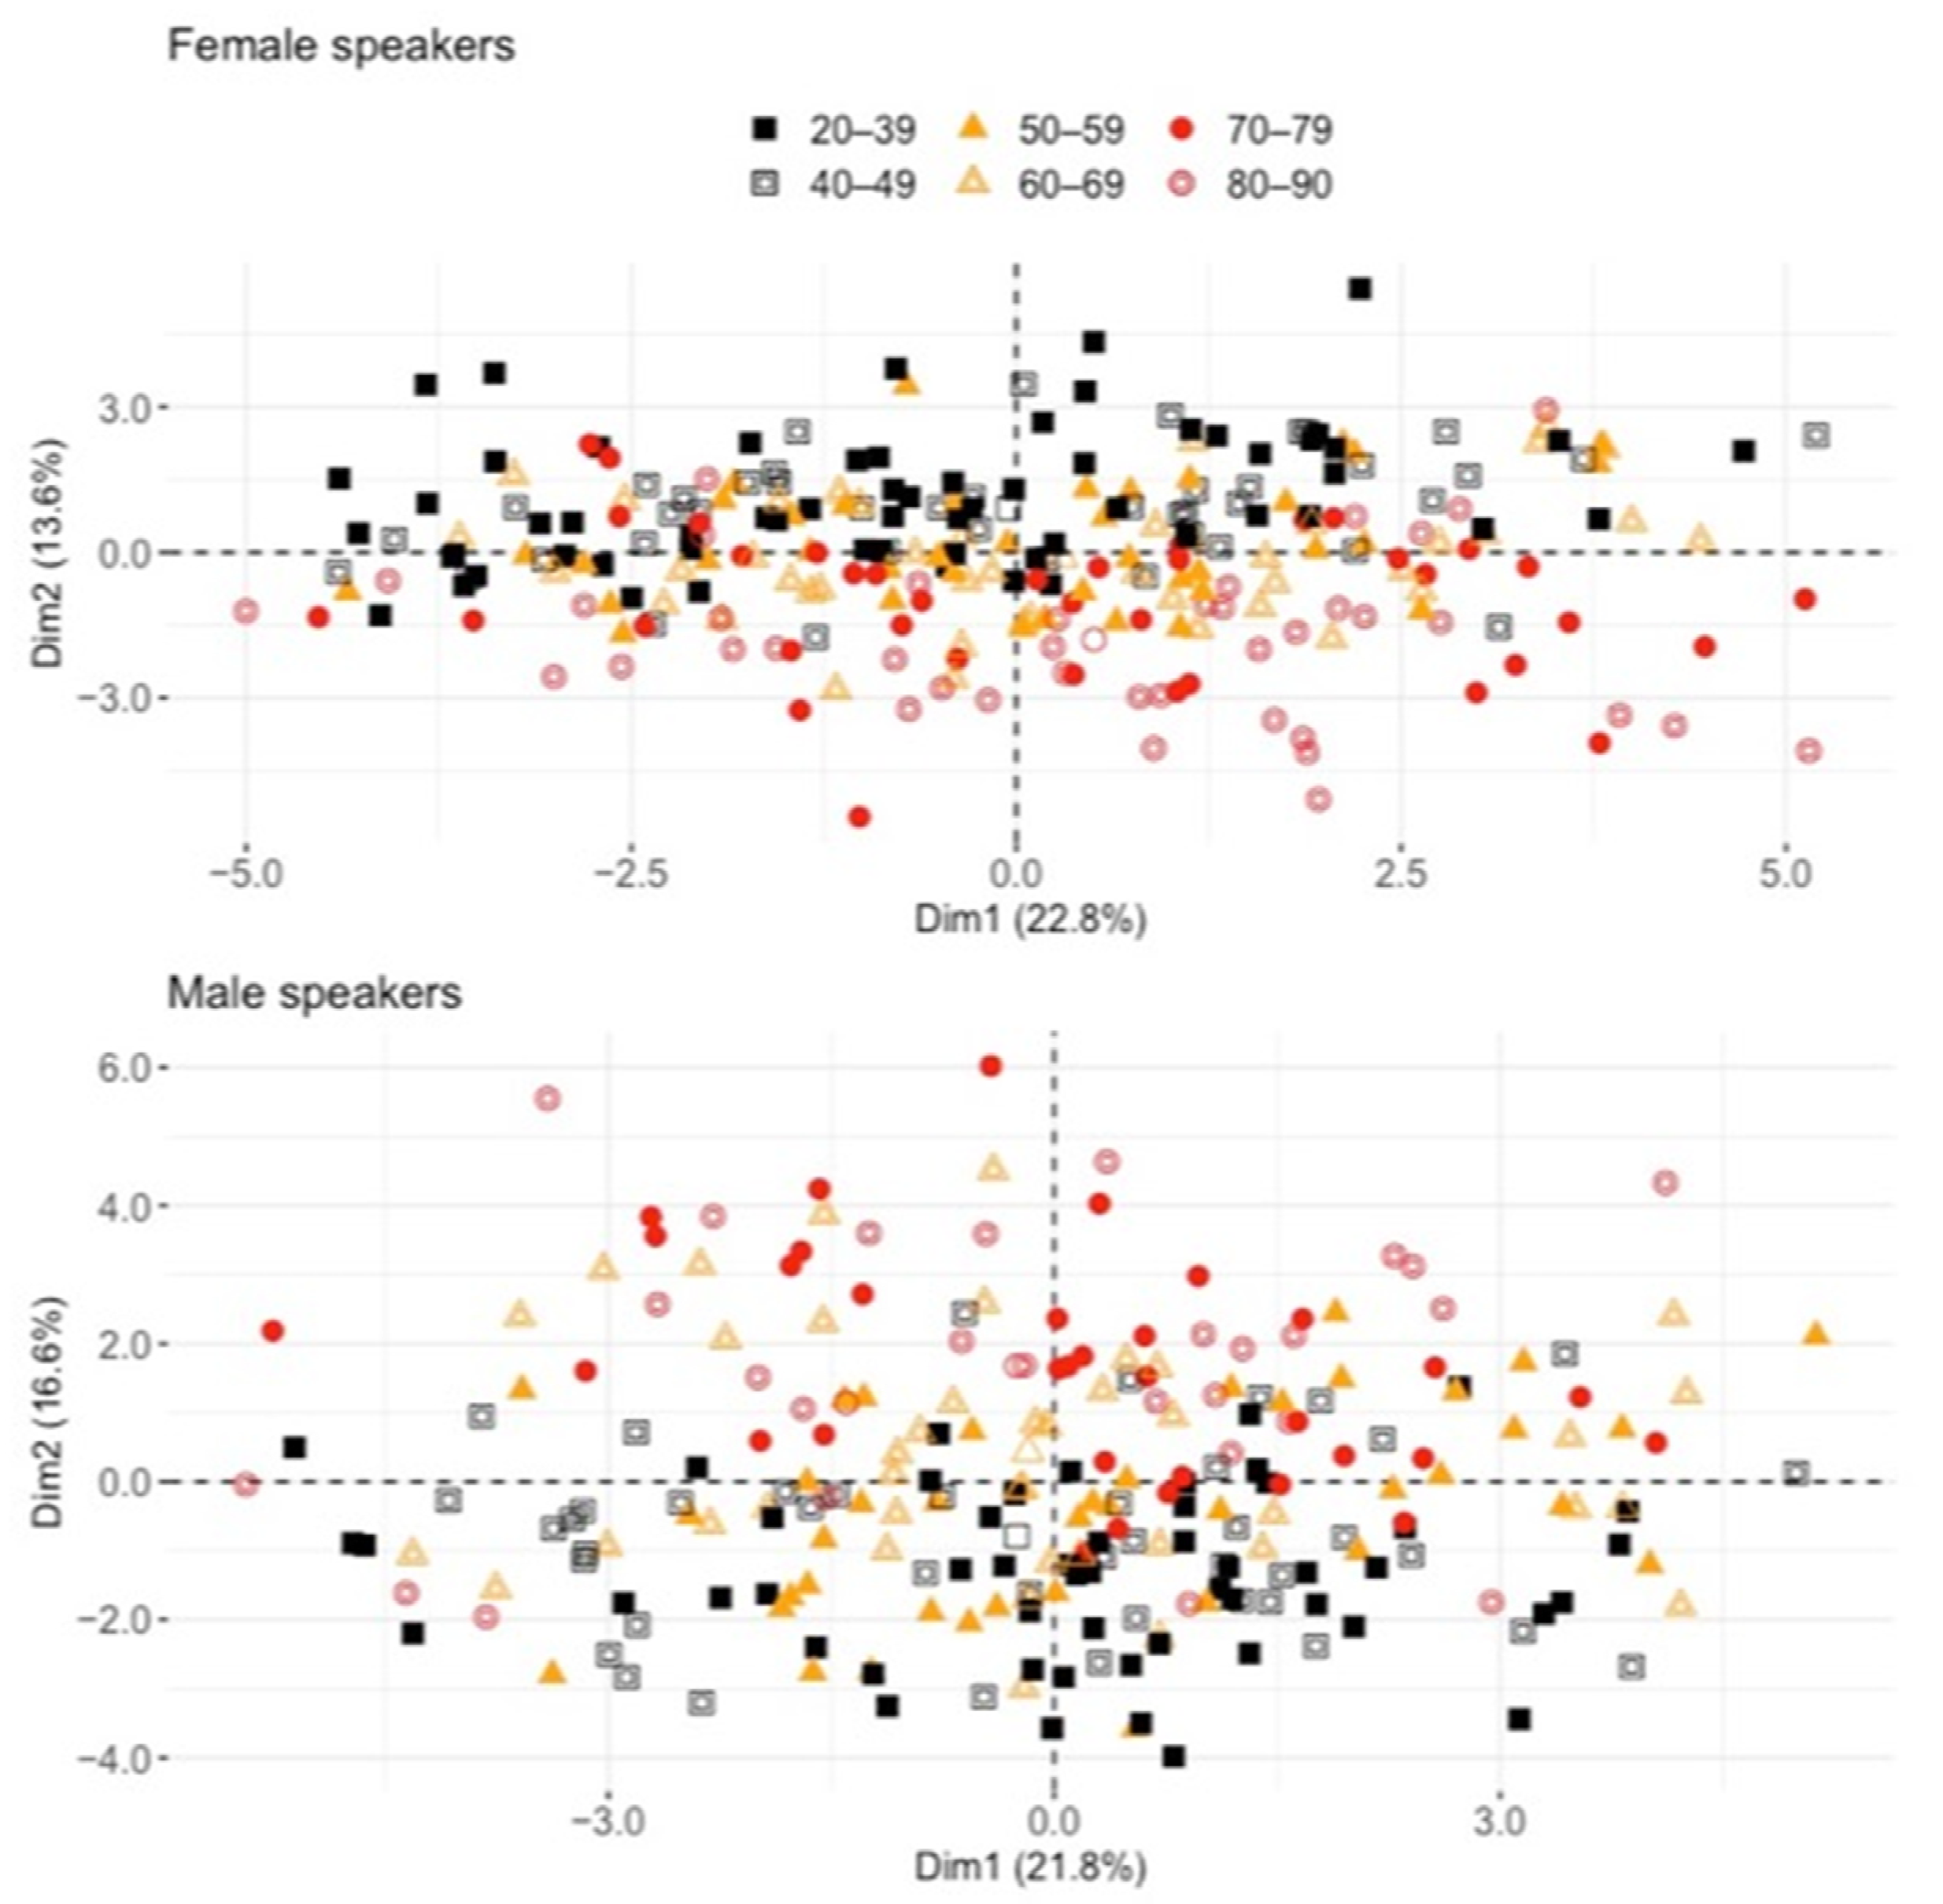
As a second step, we used PCA as a dimensionality reduction technique in order to explore the relationships between the descriptors and to evaluate whether the distribution of the individual speakers along the principal component dimensions reflected closeness between speakers of similar age. The first three principal components accounted for 46% of the cumulative variance for the female data and 48% for the male data (see Table 6).
Figure 3 displays the distribution of the individual speakers in the space defined by the first two components. Speakers were coded according to their “age group” (below 40 and then per decade for a total of 6 age groups, differentiated by symbol shape and color) in order to evaluate whether they clustered together in one or any other dimensions. While no specific patterns were observed along PC1, PC2 contributed to the distinction between younger and older speakers for both sexes. In the bottom part of Figure 3, the youngest female speakers (aged 20 to 39, and most of 40 to 49 speakers with filled and unfilled black squares) were clustered on the upper part of the graph, while the older female speakers (70 to 79 and 80 to 90 with filled and unfilled red circles) clustered on the upper part. For the male speakers, in the upper part of the figure, younger (filled and unfilled black squares) and older participants (filled and unfilled red circles) were also divided along the PC2 dimension. Note that the reverse picture along PC2 between the male and female speakers (younger under or above PC2 = 0) is not meaningful here (this reflects the way the variables were automatically selected for computing the correlations).
The PC2 dimension was well explained by descriptors associated with the temporal organization of speech, while PC1 was rather linked to vowel space size and organization (see Table A1 in Appendix A). Thus, while idiosyncratic properties of speakers such as vocal tract sizes and idiolects/regiolects traits appeared to contribute to the speaker distribution along PC1 independently of age, features related to temporal organization grouped speakers of similar ages together along PC2.
4. Discussion
The aim of the present study was to consider a wide array of descriptors characterizing multiple dimensions in the speech of a large population of francophone adult speakers and to document their variation according to the age of the speakers.
The results of the first analysis confirmed most of the documented changes said to occur across adulthood. Overall, increases in age were reflected in speech by an increase in voice instability, a decrease in speech rate and a decrease in performance in maximal performance tasks. Sex-dependent changes were observed along several dimensions, particularly in pitch, with an increase in pitch with increasing age for older male speakers only. More importantly, some changes across adulthood may be more gradual than previously assumed based on group comparisons, and the consideration of age as a continuous variable in this large cross-sectional study has revealed quite interesting features. Regarding the question of how chronological age is indexed in speech, results of the second analysis showed that the set of descriptors we have currently tested may allow the prediction of the age of the speakers, but only moderately. Besides, the indexical properties of the speech signal go far beyond the age (or the sex) of the speaker. This is confirmed by the results of the PCA showing that the first dimension was mostly related to the physical/anatomical/idiosyncratic properties of the speakers as indexed by vowel space indicators (and to a lesser degree, by some voice parameters), and that this dimension did not cluster individuals of similar age (as did temporal aspects in dimension 2).
We will first summarize the results on the 22 parameters, so as to determine which speech aspects underwent significant changes as a function of age, and when.
Concerning voice parameters, measured on the sustained /a/ production, increased irregularity of vocal fold vibration in later middle age was signaled by larger jitter, shimmer, and SdF0. A decline in voice quality, was also signaled by a decrease in CPPs for both male and female speakers. Although most voice-related descriptors underwent significant changes for speakers in late middle age, other changes occurred in early adulthood (HNR, CPPs). Note that individual voice descriptors were only moderately predicted by age, resulting in values of explained age variance ranging from 2% (HNR, female speakers) to at most 15% (CPPs, male speakers).
Regarding pitch, our observations were first consistent with a pattern in which speaking f0 decreases for both male and female speakers from young adulthood until middle age, except for the fact that the shoulder in this continuous decrease occurred at earlier ages in the present study (40 and 36 for male and female speakers, respectively) than typically reported in the literature, i.e., around ages 50–65 (Baken 2005; Bier et al. 2017; Cox and Selent 2015). Second, we replicated the rise in speaking fundamental frequency expected from male speakers over 60, typically associated with vocal fold atrophy and histological changes (Harnsberger et al. 2008; Torre and Barlow 2009; Dehqan and Scherer 2013), but not the fall for female speakers that—when observed—is associated with increased vocal fold mass due to edema, loss of muscle tone, ossification and/or hormonal changes (Kreiman and Sidtis 2011). Besides this, in our data, older women (after 75) exhibited more pitch modulation than younger ones, as captured by the coefficient of variation of the f0 measures over the spoken sentence (PitchVarco). This increase in modulation needs to be further investigated, since it could result from a decreased stability in the control of f0 (as for sdF0 on /a/), but also from a different prosodic organization of the sentence inducing more pitch accents.
As for the parameters we used to capture vowel acoustic space, they were generally poorly predicted by age alone (virtually not at all for female speakers). Only for male speakers could one observe a slight tendency towards larger vowel dispersion (higher hVSA, Dist2center and F2RR) in early middle age (around age 40–47). The literature on the effects of aging on formant frequencies does not provide clear tendencies, at most suggesting vowel-dependent trends; several authors have found instances of age-related formant lowering—especially F1 in low vowels (Harrington 2006; Reubold et al. 2010; Hawkins and Midgley 2005; Linville and Rens 2001)—while others have reported F1 rising (e.g., Fuchs et al. 2021 for /œ/). Note that if all formants lower—possibly due to lengthening of the vocal tract caused by an age-related lowering of the larynx, the tracheobronchial tree and the lungs—the size of the acoustic space could remain similar, while if only F1 in low vowel lowers, it would automatically result in a smaller VSA. Actually, some studies have indicated that VSA continuously decreases with age for men, but not for women, and that overall, the factor “age” is not statistically significant (Albuquerque et al. 2019). Opposite results have also been found in longitudinal studies; whereas Liss et al. (1990) and Watson and Munson (2007) observed a tendency toward vowel centralization in American English vowels, Gahl and Baayen (2019) found gradual changes in vowel production towards more peripherality between 21 to 49 y.o.a. Note that the descriptors selected in the present study to assess vowel space, although very frequently used in the relevant literature, are not among the most advanced ones. In particular, convex hull approaches (Karlsson and Doorn 2012; Story and Bunton 2017) could be used in future work in order to better delineate each individual’s vowel space based on a larger set of vowel tokens per participant.
Interestingly, when the approach was reversed and multiple acoustic parameters were used to predict chronological age (analysis #2 above), descriptors related to vowel acoustic space were among the largest contributors, for both male and female speakers. Our interpretation is that the overall size of the vowel acoustic space is poorly predicted by age alone (analysis #1) because it is highly dependent on other individual factors (e.g., physiology, idiosyncrasies in terms of speech styles or hyper/hypoarticulation in the various speech tasks, regional variation impacting specific phonetic variants, etc.). In contrast, taken in interaction with other related aspects such as rate, which could be linked to articulatory precision, descriptors related with vowel space are good predictors of chronological age. Further work is thus needed here to better characterize potential changes with age in articulatory precision (on vowels but also on consonants).
Finally, the present study replicated well-attested changes in the temporal organization of speech at older age, namely, a reduction in speech and articulation rate (e.g., among others, Ramig 1983; Linville 2001; Jacewicz et al. 2009; Horton et al. 2010), due to longer pauses (Bourbon and Hermes 2020), as well as longer segmental acoustic duration (Weismer 1984; Morris and Brown 1987; Liss et al. 1990; Fletcher et al. 2015) associated with longer and/or more asymmetric tongue movements (Goozée et al. 2005; Hermes et al. 2018; Mücke et al. 2021). Most importantly, we showed that these changes are much more gradual throughout adulthood than previously described.
Indeed, both speech rate and articulation rate were found to continuously decrease throughout adult life. At around 57 and 54 y.o.a., for the female and male speakers respectively, we observed a larger inflection in speech rate. Since speech rate depends on articulation rate, number of pauses and pause duration, it has to be interpreted with the other three descriptors. The larger inflection of speech rate at late middle age thus relates to the faster deceleration in articulation rate (after 57 and 65 y.o.a. for the female and male speakers, respectively), but is also likely associated with changes in the way male and female speakers organize their phrasing of the text. While male speakers (over 54) made longer pauses, women (over 57) paused more frequently.
In line with the relevant literature (e.g., Pierce et al. 2013; Knuijt et al. 2017; Sadagopan and Smith 2013), we also found an age-related decrease in performance (i.e., a slower repetition rate) for the two types of fast repetition DDK tasks. In the present study, this reduction in repetition rate occurred for male and female middle-aged adults (around 40–54 y.o.a.). Interestingly, female and male speakers above 57 and 70 y.o.a., respectively, responded differently to the task difficulty, as indexed by the SMR–AMR complexity measure. SMR and AMR rates tended to equalize, showing that the facilitation of SMR was mitigated for these speakers. Further exploration of the recordings will test whether the facilitation for the SMR /badego/ sequence is reduced in older speakers due to a reduction in anticipatory coarticulation, as suggested by d’Alessandro and Fougeron (this volume).
Lastly, maximum phonation time (MPT) was found to decrease for older female speakers only (above 76). An age effect on MPT has rarely been demonstrated in the literature (e.g., Maslan et al. 2011; Goy et al. 2013), which may be related to the fact that this performance is highly variable within and across studies (Speyer et al. 2010)—partly because it is very sensitive to how participants understand the instructions of “maximum” performance, as well as how they are engaged in the task. In our study, the 500 speakers all received the same instructions and examples.
The results summarized above show that changes in adult speech may occur on many aspects of speech productions. However, it has to be reinstated that the data analyzed in this paper reflects speech behaviors occurring in a limited range of speech and speech-like tasks: sustained vowel production, isolated word production, sentence reading, fast repetitions of nonsense sequences. Whether these results expand to spontaneous and communicative speech needs to be verified in follow-up studies.
We will turn now to possible interpretations of the observed age-related differences.
As stated earlier, one of the original contributions of this paper is the consideration of the age of the participants as a continuous factor, in order to avoid a split of the population into ad hoc age groups. Looking at age as a continuous variable throughout adulthood allows a better understanding of how speech parameters vary according to the age of the speakers. Previous accounts often give the impression that speech changes only at old age, partly because they typically compare two groups (younger vs. older adults). In contrast, our results suggest that some speech aspects evolve continuously during adulthood (e.g., speech and articulation rate), whereas others present more abrupt changes visible in speakers after a certain age (e.g., overall degradation of voice quality from over 50 to 65 y.o.a.). Among those, some changes are visible quite early in adult life (e.g., speaking f0, HNR), while others are only observed for the oldest participants (e.g., MPT, SMR–AMR). Therefore, not all changes in speech across adulthood need be considered as signs of attrition. For instance, the reduction of speech rate, which is usually taken as a sign of speech aging, is in fact present throughout adulthood (in our 20 to 93 sample) for both male and female speakers, but with a sharper deceleration after 60 y.o.a.
Speech changes occurring at old age can be relatively well explained by anatomical and physiological (including hormonal) changes in the speech organs, especially after menopause (e.g., diminished lung capacity, ossification and calcification of the laryngeal cartilages, vocal fold atrophy, loss of muscle tone, lowering of the larynx, the tracheobronchial tree and the lungs, etc.—for a review, see for example Kreiman and Sidtis 2011). These physical changes have consequences on the aerodynamics, articulation and acoustics of speech sounds and the processes underlying them; respiratory support for phonation alters, which may affect speech descriptors such as pitch, voice quality indicators, number and duration of pauses, maximum phonation time, etc. Muscle degeneration, together with a decrease in neuromuscular control, affects fine speech motor control throughout the respiratory, phonatory and articulatory system—affecting articulatory movement duration, articulatory precision, coarticulation patterns, speech tempo, etc. Among the various descriptors examined in the present study, only a few may be considered to vary primarily due to age-associated attrition: MPT, DDK-related predictors and most (but not all, see below) changes in voice-related parameters.
Nonetheless, aging is a long-evolving process for which restraining constraints can be actively, and strategically, met by individuals advancing in age. When interpreting the observed aged effects, it is difficult to assess whether they reflect the properties of an aged production system or they are the byproducts of the strategies used by older speakers to compensate for natural changes. For example, it is not clear whether slower articulation rates in older participants should be primarily associated with physical factors (slower articulatory movement, in the context of a general motor slowing in the aging system; Walker et al. 1997) or with a general strategy in which a slower tempo allows an individual to actually reach the intended articulatory targets. Similarly, the increase in pause (number or duration) could be primarily associated with a diminished lung capacity, or to a strategic way to adapt to the cognitive load of the text-reading task.
Considering the changes occurring in early adulthood, they are obviously not signs of attrition. We as speech scientists are used to considering the speech of our 20–30 year old student participants as a typical ‘mature adult’ model in phonetic/linguistic studies, but the results of the present study suggest that the speech system still evolves during adulthood. Kreiman and Sidtis (2011) report that the larynx continuously lowers throughout life and that its ossification takes place between the 20s and mid 60s (with the ossification of the thyroid and cricoid cartilages in the 20s, and of the arytenoids in the late 30s). While the consequences of these natural physiological changes on voice need to be further explored, we cannot exclude their impact on the decrease in pitch found for both male and female speakers between 20 and 40 y.o.a., or the increase in noise or aperiodicity in the voices of younger speakers (see the gradual decrease of HNR from early to middle adulthood, as well as the increase in CPPs, reflecting more aperiodicity or noise in the signal due to a less rich harmonic structure and/or higher fundamental frequency in the youngest female voices (Fraile and Godino-Llorente 2014)).
Observed changes in speech with age need not be all related to physiological changes. As mentioned in the introduction, the 500 speakers recorded in this study were characterized by their chronological age, but also differed in many other aspects potentially covarying with age. Of particular importance are variables which could impact the speakers’ behavior in speech(-like) tasks, such as reading skills, voice fatigue, willingness to be recorded/tested, familiarity with computers, etc. If life experience and usage of the voice in professional environments naturally evolve from early to late adulthood, other aspects are more socially determined, such as level of education (which indeed decreases with age for female speakers in our population). Along with potential differences in reading skills, differences in reading style may also covary with age. For instance, older women are often reading the text more expressively, and this could explain an increase in pitch modulation exhibited by women over 75 (PitchVarco).
Another aspect that we have chosen to ignore here (based on an earlier analysis of the data showing similar trends for all subgroups), is the varied regionalisms of the speakers. While we have verified that overall educational level by age is similar for the individuals recruited in the four French-speaking countries, we cannot exclude the fact that regional features are more salient in the speech of the older speakers—even though we do not find more inter-speaker variability at old age for most of the descriptors (see Figure 1 and Figure 2 and Figure A1, Figure A2, Figure A3, Figure A4 and Figure A5 in Appendix A). For instance, the effect of age on parameters linked to vowel space could be called into question by the fact that older speakers do not have the same phonetic realization of the seven vowels system compared to younger speakers (e.g., backer /a/, lower /ɛ/), either due to age-stratified regional variation or possible sound changes. However, for other descriptors, it is less straightforward to estimate how regional differences could explain the age-related trends found over the whole population.
In sum, while only age and sex (in the absence of more information on how the speakers stand with respect to gender identity) have been used to characterize the 500 speakers included in the study, it is obvious that other individual or group characteristics are included in these two operational variables. Introduction of regional, educational, and social diversity in the population was of particular importance in our recruitment strategy, especially for the older speaker group, for which we did not want to recruit only ‘super active seniors’. Changes in speech according to age needs to be regarded through the lens of the many other factors which interact naturally with chronological age in order to better understand their contribution.
5. Conclusions
In summary, we have presented a multi-dimensional account of changes in speech in a large population with speakers ranging from 20 to 93 y.o.a. This study is innovative in that age is considered to be a continuous variable, made possible by our large number of participants (500 speakers). Even if a cross-sectional study has its caveats—individual differences may be confounded with differences due to aging, generational traits may be confounded with aging effects—this design was preferable over a longitudinal study for feasibility reasons. Another original feature of this study is that the speech of the speakers was characterized on multiple aspects. In that respect, this study provides interesting results and some reference values related to typical variation in speech across sex and age in modern French based on a multidimensional acoustic dataset. Although the aim of the present study was to contribute to a better comprehension of variation in speech according to age throughout adulthood, the results discussed here are a long way from exhausting this complex and fascinating issue.
Author Contributions
Conceptualization, C.F. and V.D.; methodology, C.F., F.G.-I. and V.D.; writing—original draft preparation & review and editing, C.F., V.D. and F.G.-I. All authors have read and agreed to the published version of the manuscript.
Funding
This research was funded by the Swiss FNS Grant N. CRSII5_173711, the Fonds National de la Recherche Scientifique (Belgium) under Grant 33663575 (CDR UltraAeroSpeech), and the program “Investissements d’Avenir” ANR-10-LABX-0083 (Labex EFL).
Institutional Review Board Statement
The study was conducted according to the guidelines of the Declaration of Helsinki, and approved by the Ethics Committee of the institutions were the participants were recruited: CPP Sud Ouest et Outre Mer-protocol version 2.0 12/02/2020– n°ID-RCB: 2019-A02553-54) and Commission cantonale d’éthique de la recherche—2018-00212.
Informed Consent Statement
Informed consent was obtained from all subjects involved in the study.
Acknowledgments
This study would not have been feasible whithout the help of the colleagues involved in the creation of the participant database. We would like to thank our colleagues of the MonPaGe and SNC projects, and more particularly Laganaro M., Ménard L., Pernon M., Trouville R., Bourbon A., Crevier-Buchman L.
Conflicts of Interest
The authors declare no conflict of interest.
Appendix A
Figure A1.
Dot plot of each descriptor (y-axis) capturing aspects of the VOICE dimension as a function of age (x-axis) for the male (left) and female (right) speakers. The hinge function of the MARS model is represented by the red curve. Each dot corresponds to a speaker.
Figure A1.
Dot plot of each descriptor (y-axis) capturing aspects of the VOICE dimension as a function of age (x-axis) for the male (left) and female (right) speakers. The hinge function of the MARS model is represented by the red curve. Each dot corresponds to a speaker.

Figure A2.
Dot plot of each descriptor (y-axis) capturing aspects of the PITCH dimension as a function of age (x-axis) for the male (left) and female (right) speakers. The hinge function of the MARS model is represented by the red curve. Each dot corresponds to a speaker.
Figure A2.
Dot plot of each descriptor (y-axis) capturing aspects of the PITCH dimension as a function of age (x-axis) for the male (left) and female (right) speakers. The hinge function of the MARS model is represented by the red curve. Each dot corresponds to a speaker.

Figure A3.
Dot plot of each descriptor (y-axis) capturing aspects of the VOWEL ACOUSTICS dimension as a function of age (x-axis) for the male (left) and female (right) speakers. The hinge function of the MARS model is represented by the red curve. Each dot corresponds to a speaker.
Figure A3.
Dot plot of each descriptor (y-axis) capturing aspects of the VOWEL ACOUSTICS dimension as a function of age (x-axis) for the male (left) and female (right) speakers. The hinge function of the MARS model is represented by the red curve. Each dot corresponds to a speaker.

Figure A4.
Dot plot of each descriptor (y-axis) capturing aspects of the TEMPORAL dimension as a function of age (x-axis) for the male (left) and female (right) speakers. The hinge function of the MARS model is represented by the red curve. Each dot corresponds to a speaker.
Figure A4.
Dot plot of each descriptor (y-axis) capturing aspects of the TEMPORAL dimension as a function of age (x-axis) for the male (left) and female (right) speakers. The hinge function of the MARS model is represented by the red curve. Each dot corresponds to a speaker.

Figure A5.
Dot plot of each descriptor (y-axis) capturing aspects of the PERFORMANCE dimension as a function of age (x-axis) for the male (left) and female (right) speakers. The hinge function of the MARS model is represented by the red curve. Each dot corresponds to a speaker.
Figure A5.
Dot plot of each descriptor (y-axis) capturing aspects of the PERFORMANCE dimension as a function of age (x-axis) for the male (left) and female (right) speakers. The hinge function of the MARS model is represented by the red curve. Each dot corresponds to a speaker.


Table A1.
Principal components of the PCA analysis, for female speakers (left) and male speakers (right).
Table A1.
Principal components of the PCA analysis, for female speakers (left) and male speakers (right).
| Female Speakers | Male Speakers | |||||
|---|---|---|---|---|---|---|
| PC1 | PC2 | PC3 | PC1 | PC2 | PC3 | |
| Jitter | 0.08 (0.58) | −0.21 (4.24) | 0.40 (15.80) | −0.06 (0.21) | 0.24 (5.86) | −0.35 (12.45) |
| Shimmer | 0.29 (8.17) | −0.16 (2.56) | 0.26 (6.53) | −0.25 (6.14) | 0.23 (5.07) (6.85) | −0.28 (7.90) |
| HNR | −0.24 (5.51) | 0.16 (2.39) | −0.28 (8.07) | 0.21 (4.21) | −0.26 (6.85) | 0.36 (12.76) |
| SdF0 | 0.03 (0.11) | −0.28 (7.88) | 0.18 (3.12) | −0.01 (0.02) | 0.17 (2.76) | −0.03 (0.11) |
| CPPs | −0.18 (3.22) | 0.20 (0.04) | −0.31 (9.82) | 0.17 (3.02) | −0.24 (5.76) | 0.24 (5.79) |
| PitchMean | 0.02 (0.06) | 0.06 (0.35) | −0.16 (1.09) | −0.04 (0.16) | 0.16 (2.43) | 0.24 (5.84) |
| PitchVarco | 0.00 (0.00) | −0.09 (0.81) | −0.16 (2.48) | 0.04 (0.17) | −0.03 (0.00) | 0.29 (8.53) |
| MPT | −0.04 (0.16) | 0.09 (0.77) | −0.11 (1.18) | 0.07 (0.42) | −0.14 (1.98) | 0.02 (0.05) |
| SMR_bdg | −0.10 (1.09) | 0.35 (12.48) | −0.14 (1.99) | 0.14 (1.89) | −0.33 (11.31) | −0.09 (0.87) |
| AMR_de | −0.10 (0.92) | 0.36 (12.75) | −0.03 (0.12) | 0.11 (1.11) | −0.34 (11.33) | −0.03 (0.07) |
| SMR.AMR | −0.02 (0.07) | −0.21 (4.24) | −0.14 (2.01) | 0.09 (0.81) | −0.18 (3.18) | −0.14 (1.83) |
| PauseN | 0.02 (0.04) | −0.25 (6.12) | −0.33 (10.60) | −0.01 (0.00) | 0.13 (1.72) | 0.42 (17.71) |
| SpeechRate | −0.03 (0.09) | 0.43 (18.73) | 0.39 (15.47) | 0.04 (0.20) | −0.35 (12.38) | −0.38 (14.76) |
| PauseDur | −0.02 (0.03) | −0.10 (0.91) | −0.26 (6.69) | −0.00 (0.00) | 0.14 (1.90) | 0.01 (0.01) |
| Dist2center | −0.35 (12.5) | −0.12 (1.48) | 0.08 (0.70) | 0.37 (11.36) | 0.17 (2.86) | −0.07 (0.55) |
| tVSA | −0.40 (15.7) | −0.11 (1.23) | 0.13 (1.77) | 0.40 (16.15) | 0.18 (3.05) | −0.06 (0.34) |
| hVSA | −0.38 (14.7) | −0.14 (1.85) | 0.08 (0.57) | 0.35 (12.11) | 0.22 (4.78) | −0.09 (0.72) |
| F1RR | −0.31 (9.81) | −0.02 (0.05) | 0.17 (2.75) | 0.31 (9.59) | 0.06 (0.35) | −0.04 (0.17) |
| F2RR | −0.33 (10.76) | −0.13 (1.59) | 0.05 (0.23) | 0.36 (12.79) | 0.15 (2.09) | −0.08 (0.67) |
| FCR | 0.41 (16.38) | 0.08 (0.60) | −0.14 (2.08) | −0.41 (16.90) | −0.09 (0.87) | 0.08 (0.66) |
| ArticRate | −0.03 (0.09) | 0.44 (18.94) | 0.22 (4.80) | 0.05 (0.30) | −0.37 (11.35) | −0.21 (4.54) |
| ArticRateVarco | 0.02 (0.04) | 0.01 (0.05) | 0.15 (2.14) | −0.04 (0.14) | −0.00 (0.00) | −0.19 (3.67) |
References
- Albuquerque, Luciana, Ana Rita Valente, Fábio Barros, António Teixeira, Samuel Silva, Paula Martins, and Catarina Oliveira. 2021. The age effects on EP vowel production: An ultrasound pilot study. IberSPEECH, 245–49. [Google Scholar] [CrossRef]
- Albuquerque, Luciana, Catarina Oliveira, António Teixeira, Predo Sa-Couto, and Daniela Figueiredo. 2019. Age-related changes in European Portuguese vowel acoustics. Paper presented at INTERSPEECH, Graz, Styria, September 15–19. [Google Scholar]
- Albuquerque, Luciana, Catarina Oliveira, António Teixeira, Predo Sa-Couto, and Daniela Figueiredo. 2020. A comprehensive analysis of age and gender effects in European Portuguese oral vowels. Journal of Voice. [Google Scholar] [CrossRef]
- Audibert, Nicolas, and Cécile Fougeron. 2012. Distorsions de l’espace vocalique: Quelles mesures? Application à la dysarthrie. Actes des 29èmes Journées d’Etudes sur la Parole. Paper presented at JEP-TALN-RECITAL 2012, Grenoble, France, June 4–7; pp. 217–24. [Google Scholar]
- Baken, Ronald J. 2005. The aged voice: A new hypothesis. Journal of Voice 19: 317–25. [Google Scholar] [CrossRef]
- Benjamin, Barbaranne J. 1982. Phonological performance in gerontological speech. Journal of Psycholinguistic Research 11: 159–67. [Google Scholar]
- Bier, Stephen D., Catherine I. Watson, and Clare M. McCann. 2017. Dynamic measures of voice stability in young and old adults. Logopedics Phoniatrics Vocology 42: 51–61. [Google Scholar] [CrossRef]
- Boehmke, Brad, and Brandon Greenwell. 2020. Hands-On Machine Learning with R. Boca Raton: CRC Press, ISBN 13: 978-1138495685. [Google Scholar]
- Boersma, Paul, and David Weenink. 2019. Praat: Doing Phonetics by Computer. Version 6.1.02. Available online: http://www.praat.org/ (accessed on 20 October 2021).
- Bourbon, Angélina, and Anne Hermes. 2020. Have a break: Aging effects on sentence production and structuring in French. Paper presented at 12th International Seminar on Speech Production, New Haven, CT, USA, December 14–18. [Google Scholar]
- Caverlé, Maria W. J., and Adam P. Vogel. 2020. Stability, reliability, and sensitivity of acoustic measures of vowel space: A comparison of vowel space area, formant centralization ratio, and vowel articulation index. The Journal of the Acoustical Society of America 148: 1436–44. [Google Scholar] [CrossRef] [PubMed]
- Chicherio, C., T. Genoud-Prachex, F. Assal, and M. Laganaro. 2019. E-GeBAS: Electronic Geneva Bedside Aphasia Scale. Computer Program. Available online: https://www.unige.ch/fapse/logotools/fr/adultes (accessed on 20 October 2021).
- Cox, Violet O., and Mark Selent. 2015. Acoustic and respiratory measures as a function of age in the male voice. Journal of Phonetics and Audiology 1: 105. [Google Scholar] [CrossRef] [Green Version]
- De Jong, Nivja, and Ton Wempe. 2009. Praat script to detect syllable nuclei and measure speech rate automatically. Behavior Research Methods 41: 385–90. [Google Scholar] [CrossRef] [PubMed] [Green Version]
- Dehqan, Ali, and Ronald C. Scherer. 2013. Acoustic analysis of voice: Iranian teachers. Journal of Voice 27: 655. [Google Scholar] [CrossRef] [PubMed]
- Eckert, Penelope. 2017. Age as a sociolinguistic variable. In The Handbook of Sociolinguistics. Hoboken: Wiley, pp. 151–67. [Google Scholar] [CrossRef]
- Eichhorn, Julie T., Raymond D. Kent, Diane Austin, and Houri K. Vorperian. 2018. Effects of aging on vocal fundamental frequency and vowel formants in men and women. Journal of Voice 32: 644. [Google Scholar] [CrossRef]
- Fletcher, Annalise R., Megan J. McAuliffe, Kaitlin L. Lansford, and Julie M. Liss. 2015. The relationship between speech segment duration and vowel centralization in a group of older speakers. The Journal of the Acoustical Society of America 138: 2132–39. [Google Scholar] [CrossRef]
- Folstein, M. F., S. E. Folstein, and P. R. McHugh. 1975. “Mini-mental state”. A practical method for grading the cognitive state of patients for the clinician. Journal of Psychiatric Research 12: 189–98. [Google Scholar] [CrossRef]
- Fougeron, Cécile, Véronique Delvaux, Lucie Menard, and Marina Laganaro. 2018. The MonPaGe_HA database for the documentation of spoken French throughout adulthood. Paper presented at LREC 2018, Miyazaki, Japan, May 7–12; pp. 4301–6. [Google Scholar]
- Foulkes, Paul, and Gerard Docherty. 2006. The social life of phonetics and phonology. Journal of Phonetics 34: 409–38. [Google Scholar] [CrossRef]
- Foulkes, Paul, Gerard Docherty, Ghada Khattab, and Malcah Yaeger-Dror. 2010. Sound judgments: Perception of indexical features in children’s speech. In A Reader in Sociophonetics. New York: De Gruyter Mouton, pp. 327–56. [Google Scholar]
- Fox, Robert Allen, and Ewa Jacewicz. 2017. Reconceptualizing the vowel space in analyzing regional dialect variation and sound change in American English. The Journal of the Acoustical Society of America 142: 444–59. [Google Scholar] [CrossRef] [Green Version]
- Fraile, Rubén, and Juan Ignacio Godino-Llorente. 2014. Cepstral peak prominence: A comprehensive analysis. Biomedical Signal Processing and Control 14: 42–54. [Google Scholar] [CrossRef] [Green Version]
- Friedman, Jérome H. 1991. Multivariate Adaptive Regression Splines. The Annals of Statistics 19: 1–67. [Google Scholar] [CrossRef]
- Fuchs, Susanne, Annette Gerstenberg, and Laura Koening. 2021. Changes in phonetic detail as a matter of discourse and aging: Evidence from a longitudinal study on French. Paper presented at 2nd Workshop on Speech Perception and Production across the Lifespan (SPPL2020), London, UK, December 14–18. [Google Scholar]
- Gahl, Susanne, and R. Harald Baayen. 2019. Twenty-eight years of vowels: Tracking phonetic variation through young to middle age adulthood. Journal of Phonetics 74: 42–54. [Google Scholar] [CrossRef] [Green Version]
- Gerstenberg, Annette, Susanne Fuchs, Julie Marie Kairet, Johannes Schroeder, and Claudia Frankenberg. 2018. A cross-linguistic, longitudinal case study of pauses and interpausal units in spontaneous speech corpora of older speakers of German and French. Speech Prosody 9: 211–15. [Google Scholar]
- Goozée, Justine, Dayna Stephenson, Bruce Murdoch, Ross Darnell, and Leonard Lapointe. 2005. Lingual kinematic strategies used to increase speech rate: Comparison between younger and older adults. Clinical Linguistics & Phonetics 19: 319–34. [Google Scholar]
- Goy, Huiwen, Kathleen M. Pichora-Fuller, Pascal Van Lieshout, and Kathryn Arehart. 2013. Quality of older voices processed by hearing aids: Acoustic factors explaining inter-talker differences. Paper presented at Meetings on Acoustics ICA2013, Narbonne, France, September 18–20; vol. 19, p. 060133. [Google Scholar]
- Harnsberger, James D., Raoul Shrivastav, W. S. Brown Jr., Howard Rothman, and Harry Hollien. 2008. Speaking rate and fundamental frequency as speech cues to perceived age. Journal of Voice 22: 58–69. [Google Scholar] [CrossRef]
- Harrington, Jonathan. 2006. An acoustic analysis of ‘happy-tensing’ in the queen’s Christmas Broadcasts. Journal of Phonetics 34: 439–57. [Google Scholar] [CrossRef] [Green Version]
- Harrington, Jonathan, Sallyane Palethorpe, and Catherine I. Watson. 2007. Age related changes in fundamental frequency and formants: A longitudinal study of four speakers. Paper presented at Interspeech 2007, Antwerp, Belgium, August 27–31; pp. 2753–56. [Google Scholar] [CrossRef]
- Hawkins, Sarah, and Jonathan Midgley. 2005. Formant frequencies of RP monophthongs in four age groups of speakers. Journal of the International Phonetic Association 35: 183–99. [Google Scholar] [CrossRef] [Green Version]
- Hermes, Anne, Jane Mertens, and Doris Mücke. 2018. Age-related Effects on Sensorimotor Control of Speech Production. Paper presented at Interspeech, Hyderabad, India, September 2–6; pp. 1526–30. [Google Scholar]
- Hillenbrand, James, Ronald A. Cleveland, and Robert L. Erickson. 1994. Acoustic correlates of breathy vocal quality. Journal of Speech, Language, and Hearing Research 37: 769–78. [Google Scholar] [CrossRef]
- Horton, William S., Daniel H. Spieler, and Elizabeth Shriberg. 2010. A corpus analysis of patterns of age related change in conversational speech. Psychology and Aging 25: 708. [Google Scholar] [CrossRef] [PubMed] [Green Version]
- Jacewicz, Ewa, Robert A. Fox, Caitlin O’Neill, and Joseph Salmons. 2009. Articulation rate across dialect, age, and gender. Language Variation and Change 21: 233–56. [Google Scholar] [CrossRef] [PubMed] [Green Version]
- Karlsson, Fredrik, and Jan van Doorn. 2012. Vowel formant dispersion as a measure of articulation proficiency. The Journal of the Acoustical Society of America 132: 2633–41. [Google Scholar] [CrossRef] [Green Version]
- Kassambara, Albukadel, and Fabian Mundt. 2020. ‘factoextra’. Extract and Visualize the Results of Multivariate Data Analyses. Package v. 1.0.7. Available online: https://cran.r-project.org/web/packages/factoextra/index.html (accessed on 20 October 2021).
- Knuijt, Simone, Johanna G. Kalf, Baziel G. van Engelen, Bert J. M. de Swart, and Alexander C. H. Geurts. 2017. The Radboud dysarthria assessment: Development and clinimetric evaluation. Folia Phoniatrica et Logopaedica 69: 143–53. [Google Scholar] [CrossRef] [PubMed] [Green Version]
- Kreiman, Jody, and Diana Sidtis. 2011. Foundations of Voice Studies: An Interdisciplinary Approach to Voice Production and Perception. Hoboken: John Wiley & Sons. [Google Scholar]
- Laganaro, Marina, Cécile Fougeron, Michaela Pernon, Nathalie Levêque, Stéphanie Borel, Maryll Fournet, Sabina Catalano Chiuvé, Ursula Lopez, Roland Trouville, Lucie Ménard, and et al. 2021. Sensitivity and specificity of an acoustic- and perceptual-based tool for assessing motor speech disorders in French: The MonPaGe-screening protocol. Clinical Linguistics & Phonetics, 1–16. [Google Scholar] [CrossRef]
- Linville, Sue Ellen. 2001. Vocal Aging. San Diego: Singular Thomson Learning. [Google Scholar]
- Linville, Sue Ellen, and Jennifer Rens. 2001. Vocal tract resonance analysis of aging voice using long-term average spectra. Journal of Voice 15: 323–30. [Google Scholar] [CrossRef]
- Liss, Julie. M., Garry Weismer, and John C. Rosenbek. 1990. Selected acoustic characteristics of speech production in very old males. Journal of Gerontology 45: 35–45. [Google Scholar] [CrossRef] [PubMed]
- Maslan, Jonathan, Xiaoyan Leng, Catherine Rees, David Blalock, and Susan G. Butler. 2011. Maximum phonation time in healthy older adults. Journal of Voice 25: 709–13. [Google Scholar] [CrossRef] [PubMed] [Green Version]
- Milborrow, Stephen. 2021. Earth: Multivariate Adaptive Regression Splines. R Package version 5.3.1. Available online: https://cran.r-project.org/web/packages/earth/index.html (accessed on 20 October 2021).
- Morris, Richard J., and William S. Brown. 1987. Age-related voice measures among adult women. Journal of Voice 1: 38–43. [Google Scholar] [CrossRef]
- Mücke, Doris, Tabea Thies, Jane Mertens, and Anne Hermes. 2021. 2021 Age-related effects of prosodic prominence in vowel articulation. Paper presented at 12th International Seminar on Speech Production, New Haven, CT, USA, December 14–18. [Google Scholar]
- Neel, Amy T. 2008. Vowel space characteristics and vowel identification accuracy. Journal of Speech Language and Hearing Research 51: 574–85. [Google Scholar] [CrossRef]
- Nishio, Masaki, and Seiji Niimi. 2008. Changes in speaking fundamental frequency characteristics with aging. Folia Phoniatrica et Logopaedica 60: 120–27. [Google Scholar] [CrossRef]
- Oliveira, Caterina, Ana Rita Valente, Luciana Albuquerque, Fábio Barros, Paula Martins, Samuel Silva, and António Teixeira. 2021. The Vox Senes project: A study of segmental changes and rhythm variations on European Portuguese aging voice. IberSPEECH, 135–38. [Google Scholar] [CrossRef]
- Pernon, Michaela, Nathalie Levêque, Véronique Delvaux, Fréderic Assal, Stéphanie Borel, Cécile Fougeron, Roland Trouville, and Marina Laganaro. 2020. MonPaGe, un outil de screening francophone informatise d’évaluation perceptive et acoustique des troubles moteurs de la parole (dysarthries, apraxie de la parole). Rééducation Orthophonique 281: 171–97. [Google Scholar]
- Pierce, John. E., Susan Cotton, and Alison Perry. 2013. Alternating and sequential motion rates in older adults. International Journal of Language & Communication Disorders 48: 257–64. [Google Scholar]
- Quené, Hugo. 2013. Longitudinal trends in speech tempo: The case of Queen Beatrix. The Journal of the Acoustical Society of America 133: EL452–EL457. [Google Scholar] [CrossRef] [Green Version]
- R Core Team. 2021. R: A Language and Environment for Statistical Computing. Vienna: R Foundation for Statistical Computing, ISBN 3-900051-07-0. Available online: https://www.R-project.org/ (accessed on 20 October 2021).
- Ramig, Lorraine A. 1983. Effects of physiological aging on speaking and reading rates. Journal of Communication Disorders 16: 217–26. [Google Scholar] [CrossRef]
- Ramig, Lorraine A., and Robert L. Ringel. 1983. Effects of physiological aging on selected acoustic characteristics of voice. Journal of Speech Language and Hearing Research 26: 22–30. [Google Scholar] [CrossRef]
- Rastatter, Michael P., Richard A. McGuire, Joseph Kalinowski, and A. Stuart. 1997. Formant frequency characteristics of elderly speakers in contextual speech. Folia Phoniatrica et Logopaedica 49: 1–8. [Google Scholar] [CrossRef] [PubMed]
- Reubold, Ulrich, Jonathan Harrington, and Felicitas Kleber. 2010. Vocal aging effects on F0 and the first formant: A longitudinal analysis in adult speakers. Speech Communication 52: 638–51. [Google Scholar] [CrossRef] [Green Version]
- Sadagopan, Neeraja, and Anne Smith. 2013. Age differences in speech motor performance on a novel speech task. Journal of Speech, Language, and Hearing Research 56: 1552–66. [Google Scholar] [CrossRef]
- Sapir, Shimon, Jennifer L. Spielman, Lorraine O. Ramig, Brad Story, and Cynthia Fox. 2007. Effects of intensive voice treatment (the Lee SilvermanVoice Treatment [LSVT]) on vowel articulation in dysarthric individuals with idiopathic Parkinsondisease: Acoustic and perceptual findings. Journal of Speech-Language and Hearing Research 50: 899–912. [Google Scholar] [CrossRef]
- Sapir, Shimon, Lorraine O. Ramig, Jennifer L. Spielman, and Cynthia Fox. 2010. Formant centralization ratio: A proposal for a new acoustic measure of dysarthric speech. Journal of Speech Language and Hearing Research 53: 114–25. [Google Scholar] [CrossRef]
- Schötz, Susanne. 2007. Acoustic analysis of adult speaker age. In Speaker Classification I. Berlin/Heidelberg: Springer, pp. 88–107. [Google Scholar]
- Signorell, Andri, Ken Aho, Andreas Alfons, Nanina Anderegg, Tomas Aragon, Chandima Arachchige, Antti Arppe, Adrian Baddeley, Kamil Barton, Ben Bolker, and et al. 2021. DescTools: Tools for Descriptive Statistics. R Package Version 0.99.42. Available online: https://cran.r-project.org/package=DescTools (accessed on 20 October 2021).
- Speyer, Renée, Hans Bogaardt, Valéria Lima Passos, Nel Roodenburg, Anne Zumach, Mariëlle Heijnen, Laura Baijens, Stijn Fleskens, and Jan Brunings. 2010. Maximum Phonation Time: Variability and Reliability. Journal of Voice 24: 281–84. [Google Scholar] [CrossRef]
- Stathopoulos, Elaine T., Jessica E. Huber, and Joan E. Sussman. 2011. Changes in acoustic characteristics of the voice across the life span: Measures from individuals 4–93 years of age. Journal of Speech, Language, and Hearing Research 54: 1011–21. [Google Scholar] [CrossRef]
- Story, Brad H., and Kate Bunton. 2017. Vowel space density as an indicator of speech performance. The Journal of the Acoustical Society of America 141: EL458. [Google Scholar] [CrossRef] [Green Version]
- Sweeting, Patricia M., and Ronald J. Baken Ronald. 1982. Voice onset time in a normal-aged population. Journal of Speech Language and Hearing Research 25: 129–34. [Google Scholar] [CrossRef]
- Torre, Peter III, and Jessica A. Barlow. 2009. Age-related changes in acoustic characteristics of adult speech. Journal of Communication Disorders 42: 324–33. [Google Scholar] [CrossRef] [PubMed]
- Trouville, Roland, Véronique Delvaux, Cécile Fougeron, and Marina Laganaro. 2021. Logiciel D’évaluation de la Parole (Version Screening) MonPaGe-2.0.s. Computer Program. Available online: https://lpp.in2p3.fr/monpage/ (accessed on 20 October 2021).
- Walker, Neff, David A. Philbin, and Arthur D. Fisk. 1997. Age-related differences in movement control: Adjusting submovement structure to optimize performance. The Journals of Gerontology Series B: Psychological Sciences and Social Sciences 52: 40–53. [Google Scholar] [CrossRef] [PubMed] [Green Version]
- Watson, Peter J., and Benjamin Munson. 2007. A comparison of vowel acoustics between older and younger adults. Paper presented at 16th International Congress of Phonetic Sciences, Saarbrücken, Germany, August 6–10; pp. 561–64. [Google Scholar]
- Weismer, Gary. 1984. Acoustic descriptions of dysarthric speech: Perceptual correlates and physiological inferences. Seminars in Speech and Language 5: 293–314. [Google Scholar] [CrossRef]
- Weismer, Gary, and Davida Fromm. 1983. Acoustic analysis of geriatric utterances: Segmental and non-segmental characteristics which relate to laryngeal function. In Vocal Fold Physiology: Contemporary Research and Clinical Issues. Edited by Diane M. Bless and James H. Abbs. San Diego: College-Hill, pp. 317–32. [Google Scholar]
- Wohlert, Amy B., and Anne Smith. 1998. Spatiotemporal stability of lip movements in older adult speakers. Journal of Speech Language and Hearing Research 41: 41–50. [Google Scholar] [CrossRef] [PubMed]
Figure 1.
PitchMean (y-axis) as a function of age (x-axis) in speakers with the hinge function (red curve) of the MARS model for Male (left) and Female (right) speakers.
Figure 1.
PitchMean (y-axis) as a function of age (x-axis) in speakers with the hinge function (red curve) of the MARS model for Male (left) and Female (right) speakers.

Figure 2.
ArticRate (y-axis) as a function of age (x-axis) in speakers with the hinge function (red curve) of MARS models for Male (left) and Female (right) speakers.
Figure 2.
ArticRate (y-axis) as a function of age (x-axis) in speakers with the hinge function (red curve) of MARS models for Male (left) and Female (right) speakers.

Figure 3.
Distribution of individuals over the space defined by the first two components (PC1 = Dim1 in x-axis and PC2 = Dim2 in y-axis) for the male (top) and female (bottom) speakers. In order to see whether speakers are clustered by age along these dimensions, each speaker has been coded (colored shapes) according to its age: below 40 y.o.a., then by decades. Younger (filled and unfilled black squares) and older participants (filled and unfilled red circles) are divided along Dim2. The fact that Dim2 appears in a reverse order for the male and female speakers is not meaningful here.

Table 1.
Distribution of the population according to sex and chronological age (mean (standard deviation)). The speakers are grouped here in decades but are not grouped in the analyses.
Table 1.
Distribution of the population according to sex and chronological age (mean (standard deviation)). The speakers are grouped here in decades but are not grouped in the analyses.
| Decade | N | Chronological Age | ||
|---|---|---|---|---|
| Female | Male | Female | Male | |
| [20–29] | 41 | 30 | 24.8 (2.6) | 25.4 (2.2) |
| [30–39] | 20 | 22 | 34.5 (2.8) | 34 (2.9) |
| [40–49] | 43 | 43 | 44.7 (2.9) | 45 (2.9) |
| [50–59] | 40 | 39 | 54.9 (3) | 53.7 (2.9) |
| [60–69] | 44 | 41 | 63.6 (3) | 64.4 (2.7) |
| [70–79] | 37 | 32 | 74.5 (2.8) | 74.6 (3.1) |
| [80–93] | 40 | 28 | 84.3 (3.3) | 84.3 (3.3) |
| total | 265 | 235 | 55.7 (19.9) | 55 (18.6) |
Table 2.
Summary of the 22 speech descriptors and descriptive statistics per sex (mean (standard deviation)); 25th percentile (P25); median = 50th percentile (P50) and 75th percentile (P75).
Table 2.
Summary of the 22 speech descriptors and descriptive statistics per sex (mean (standard deviation)); 25th percentile (P25); median = 50th percentile (P50) and 75th percentile (P75).
| Descriptor | Task | Female Speakers | Male Speakers | |||
|---|---|---|---|---|---|---|
| Mean (stdev) | P25–P50–P75 | Mean (stdev) | P25–P50–P75 | |||
| Voice | Jitter (%) | Sustained /a/ (2 s.) | 0.28 (0.20) | 0.17–0.22–0.33 | 0.32 (0.21) | 0.20–0.26–0.36 |
| Shimmer (%) | Sustained /a/ (2 s.) | 3.52 (2.75) | 1.51–2.44–4.83 | 4.86 (2.79) | 2.67–4.2–6.57 | |
| HNR (dB) (Harmonic to Noise Ratio) | Sustained /a/ (2 s.) | 19.56 (3.34) | 18–20.42–21.91 | 17.53 (4.21) | 15.41–18.25–20.72 | |
| SdF0 (Hz) (f0 Standard deviation) | Sustained /a/ (2 s.) | 4.04 (2.4) | 2.4–3.43–4.83 | 3.20 (2.36) | 1.64–2.44–4 | |
| CPPs (dB) smoothed Cepstral Peak Prominence | Sustained /a/ (2 s.) | 15.33 (2.61) | 13.69–15.29–16.99 | 17.73 (2.87) | 15.94–17.92–19.92 | |
| Pitch | PitchMean (Hz) | Read sentence | 208 (25.97) | 190.7–206.8–226.5 | 130.25 (25.67) | 111.77–126.54–141.65 |
| PitchVarco (Pitch Coefficient of Variation) | Read sentence | 0.14 (0.05) | 0.11–0.14–0.17 | 0.15 (0.05) | 0.11–0.14–0.17 | |
| Vowel articulation | tVSA (Bark2) (triangular /iau/ Vowel Space Area) | Read/repeated pseudoword | 12.89 (3.48) | 10.34–12.89–15.38 | 9.14 (2.72) | 7.47–9.09–10.86 |
| hVSA (Bark2) (heptagonal /ieɛaɔou/) Vowel Space Area) | Read/repeated pseudoword | 15.07 (4.01) | 12.16–14.87–18.06 | 11.29 (3.18) | 9.09–11.27–13.34 | |
| Dist2center (Bark) (Distance to centroid) | Read/repeated pseudoword | 2.60 (0.77) | 2.32–2.61–2.86 | 2.15 (0.42) | 1.88–2.17–2.45 | |
| FCR (Bark) (Formant Centralization Ratio) | Read/repeated pseudoword | 1.18 (0.09) | 1.11–1.17–1.24 | 1.21 (0.09) | 1.15–1.21–1.27 | |
| F2RR (Bark) (F2 Range Ratio) | Read/repeated pseudoword | 6.44 (1.13) | 5.77–6.65–7.25 | 5.56 (1.11) | 4.89–5.67–6.31 | |
| F1RR (Bark) (F1 Range Ratio) | Read/repeated pseudoword | 2.21 (0.35) | 1.98–2.18–2.47 | 2.21 (0.29) | 1.91–2.08–2.25 | |
| Temporal | PauseN (Number of Pauses) | Read text | 29.08 (9.79) | 22–29–36 | 29.45 (10.32) | 22–30–37 |
| PauseDur (s) (Duration of Pauses) | Read text | 0.90 (0.22) | 0.75–0.87–1.01 | 0.93 (0.22) | 0.79–0.9–1.04 | |
| SpeechRate (syll/s) | Read text | 2.9 (0.49) | 2.57–2.94–3.25 | 2.95 (0.52) | 2.59–2.94–3.31 | |
| ArticRate (syll/s) (Articulation Rate) | Read text | 4.47 (0.67) | 4.06–4.45–4.85 | 4.7 (0.76) | 4.22–4.73–5.18 | |
| ArticRateVarco (Articiulation Rate Coefficient of Variation) | Read text | 0.11 (0.32) | 0.09–0.11–0.12 | 0.11 (0.04) | 0.09–0.11–0.13 | |
| Max performances | MPT (s) (Maximum Phonation Time) | Sustained /a/ (max) | 14.80 (6.37) | 10.48–14.12–18.04 | 17.41 (7.36) | 11.95–16.14–21.39 |
| AMR_de (syll/s) (Alternative Motion Rate) | Fast repetition task | 10.08 (2.28) | 8.55–10.42–11.57 | 10.69 (2.46) | 9.31–10.84–12.37 | |
| SMR_bdg (syll/s) (Sequencial Motion Rate) | Fast repetition task | 11.25 (2.63) | 9.47–11.50–13 | 11.74 (2.86) | 9.45–12.02–13.56 | |
| SMR-AMR (syll/s) | Fast repetition task | 1.14 (1.71) | −0.01–1.06–2.11 | 1.25 (1.60) | 0.24–1.34–2.28 | |
Table 3.
Summary of the 44 (22 × 2) MARS models of analysis 1, testing how each of the 22 variables is modeled by age, for female (left panel) and male (right panel) speakers separately. Each model and associated hinge function(s) are described in terms of: R2 values (as a measure of the explicative power of the model); hinge function (hinge fun, h(x − a) or h(a − x), where a is the cut-point value or knot and x is age) *; the intercept of the model; the slope estimate (β) of the functions.
| Descriptor | Female Speakers | Male Speakers | |||||||
|---|---|---|---|---|---|---|---|---|---|
| R2 | Hinge Fun | Intercept | β | R2 | Hinge Fun | Intercept | β | ||
| voice | Jitter | 0.08 | h(x − 57) | 0.24 | 0.006 | 0.08 | h(x − 54) | 0.28 | 0.005 |
| Shimmer | 0.08 | h(x − 57) | 2.94 | 0.08 | 0.08 | h(65 − x) | 5.61 | −0.05 | |
| HNR | 0.02 | h(50 − x) | 19.25 | 0.05 | 0.04 | h(65 − x) | 16.72 | 0.06 | |
| SdF0 | 0.13 | h(x − 57) | 3.39 | 0.08 | 0.15 | h(x − 65) | 2.71 | 0.14 | |
| CPPs | 0.05 | h(40 − x) h(x − 57) | 15.99 | −0.07 −0.06 | 0.15 | h(x − 50) | 18.67 | −0.09 | |
| Pitch | PitchMean | 0.03 | h(40 − x) | 205.93 | 0.75 | 0.12 | h(73 − x) h(x − 36) | 90.97 | 0.74 1.20 |
| PitchVarco | 0.04 | h(75 − x) | 0.14 | 0.00 | 0.00 | - | 0.15 | - | |
| Vowel articulation | tVSA | 0.00 | - | 12.90 | - | 0.02 | h(x − 41) | 8.69 | 0.03 |
| hVSA | 0.00 | - | 15.09 | - | 0.03 | h(x − 41) | 10.69 | 0.04 | |
| Dist2center | 0.00 | - | 2.60 | - | 0.06 | h(x − 47) | 2.06 | 0.007 | |
| FCR | 0.00 | - | 1.18 | 0.00 | - | 1.21 | - | ||
| F2RR | 0.00 | - | 6.44 | - | 0.04 | h(x − 41) | 5.34 | 0.01 | |
| F1RR | 0.02 | h(57 − x) | 2.17 | 0.004 | 0.00 | - | 2.10 | - | |
| temporal | PauseN | 0.02 | h(x − 57) | 27.94 | 0.15 | 0.00 | - | 29.45 | - |
| PauseDur | 0.00 | - | 0.90 | - | 0.02 | h(x − 54) | 0.90 | 0.00 | |
| SpeechRate | 0.19 | h(x − 57) h(57 − x) | 2.96 | −0.02 0.01 | 0.16 | h(x − 54) h(54 − x) | 3.01 | −0.01 0.01 | |
| ArticRate | 0.28 | h(x − 57) h(57 − x) | 4.50 | −0.02 0.02 | 0.30 | h(x − 65) h(65 − x) | 4.58 | −0.03 0.02 | |
| ArticRateVarco | 0.02 | h(x − 57) | 0.11 | 0.00 | 0.00 | - | 0.12 | - | |
| performances | MPT | 0.04 | h(x − 76) | 15.32 | −0.40 | 0.00 | - | 17.41 | - |
| AMR_de | 0.15 | h(x − 46) | 10.96 | −0.06 | 0.19 | h(x − 41) | 11.86 | −0.07 | |
| SMR_bdg | 0.14 | h(x − 40) | 12.36 | −0.06 | 0.09 | hx − 54) | 12.39 | −0.08 | |
| SMR-AMR | 0.05 | h(x − 57) | 0.86 | 0.03 | 0.01 | h(x − 70) | 1.35 | −0.04 | |
* The hinge function is equal to zero on a part of its range. When the function is in the format h(x − a), it means that it applies to x-values larger than a (e.g., after age 50 for h(x − 50)). Conversely, a function of the type h(a − x) will only concern values of x less than a (before age 50 for (h(50 − x)). The intercept is raised (positive β) or lowered (negative β) by the value of the slope estimate from the cut-point. For example, for the female speakers illustrated on the right of Figure 2, ArticRate is continuously decreasing, but up to the cut-point at 57 there is a slight slowing down with a loss of 0.02 syll/s. between age-consecutive speakers, and from 57 y.o.a., the slowing down becomes more important, with an additional loss of 0.02 syll/s.
Table 4.
Summary of analysis 2, testing how age is modelled by the 22 speech descriptors, for female (left panel), and for male (right panel) speakers: hinge functions and corresponding slope estimate values (β).
Table 4.
Summary of analysis 2, testing how age is modelled by the 22 speech descriptors, for female (left panel), and for male (right panel) speakers: hinge functions and corresponding slope estimate values (β).
| Female Speakers (R2 = 0.55|Intercept = 55.31) | Male Speakers (R2 = 0.47|Intercept = 51.4) | ||||
|---|---|---|---|---|---|
| Fun Nb | Hinge Functions | β | Fun Nb | hinge functions | β |
| 1 | h(ArticRate-5.08) | 25.20 | 1 | h(ArticRate-4.73) | −7.99 |
| 2 | h(4.63-SdF0) | −3.39 | 2 | h(4.73-ArticRate) | 16.18 |
| 3 | h(14.35-SMR_bdg) | 1.25 | 3 | h(2.43-SdF0) | −6.00 |
| 4 | h(Dist2center-2.95) | 31.71 | 4 | PauseN*h(0.11-ArticRateVarco) | −5.63 |
| 5 | h(tVSA-16.90) | −9/82 | 5 | h(Shimmer-4.2)*SdF0 | 0.36 |
| 6 | h(16.90-tVSA) | 1.82 | 6 | HNR*h(Dist2center-2.17) | 1.07 |
| 7 | h(hVSA-21.24) | 7.95 | |||
| 8 | h(21.24-hVSA) | −1.46 | |||
| 9 | h(Shimmer-1.46) | 1.58 | |||
| 10 | h(MPT-13.01 | 0.39 | |||
| 11 | h(13.01-MPT) | 1.21 | |||
| 12 | h(ArticRate-4.13) | −22.19 | |||
| 13 | h(F2RR-5.23) | 3.29 | |||
Table 5.
Single MARS models (age modelled by all descriptors); one for female (left panel), one for male (right panel) speakers—significance level of meaningful explanatory variables, by order of importance.
Table 5.
Single MARS models (age modelled by all descriptors); one for female (left panel), one for male (right panel) speakers—significance level of meaningful explanatory variables, by order of importance.
| Female Speakers | Male Speakers | ||
|---|---|---|---|
| Meaningful Descriptor | Significance (%) | Meaningful Descriptor | Significance (%) |
| ArticRate | 100 | ArticRate | 100 |
| SdF0 | 62.2 | Shimmer | 62.1 |
| SMR_bdg | 50.9 | SdF0 | 62.1 |
| Dist2center | 49.8 | HNR | 53.2 |
| tVSA | 49.8 | Dist2center | 53.2 |
| hVSA | 39.3 | PauseN | 30.7 |
| Shimmer | 34.6 | ArticRateVarco | 30.7 |
| F2RR | 21.9 | ||
| MPT | 17.5 | ||
Table 6.
Eigenvalues for the first three dimensions of the PCA analysis for female speakers (F, upper panel) and male speakers (M, bottom panel).
Table 6.
Eigenvalues for the first three dimensions of the PCA analysis for female speakers (F, upper panel) and male speakers (M, bottom panel).
| PC 1 | PC 2 | PC 3 | ||
|---|---|---|---|---|
| F | Variance | 2.24 | 1.73 | 1.43 |
| Variance (%) | 22.76 | 13.56 | 9.24 | |
| Cumulative Variance (%) | 22.76 | 36.33 | 45.57 | |
| M | Variance | 2.19 | 1.91 | 1.43 |
| Variance (%) | 21.83 | 16.67 | 9.26 | |
| Cumulative Variance (%) | 21.83 | 38.48 | 47.74 |
Publisher’s Note: MDPI stays neutral with regard to jurisdictional claims in published maps and institutional affiliations. |
© 2021 by the authors. Licensee MDPI, Basel, Switzerland. This article is an open access article distributed under the terms and conditions of the Creative Commons Attribution (CC BY) license (https://creativecommons.org/licenses/by/4.0/).
Share and Cite
MDPI and ACS Style
Fougeron, C.; Guitard-Ivent, F.; Delvaux, V. Multi-Dimensional Variation in Adult Speech as a Function of Age. Languages 2021, 6, 176. https://0-doi-org.brum.beds.ac.uk/10.3390/languages6040176
AMA Style
Fougeron C, Guitard-Ivent F, Delvaux V. Multi-Dimensional Variation in Adult Speech as a Function of Age. Languages. 2021; 6(4):176. https://0-doi-org.brum.beds.ac.uk/10.3390/languages6040176
Chicago/Turabian StyleFougeron, Cécile, Fanny Guitard-Ivent, and Véronique Delvaux. 2021. "Multi-Dimensional Variation in Adult Speech as a Function of Age" Languages 6, no. 4: 176. https://0-doi-org.brum.beds.ac.uk/10.3390/languages6040176