Article

Do Rare Earths and Energy Commodities Drive Volatility Transmission in Sustainable Financial Markets? Evidence from China, Australia, and the US

1
Business School, Liaoning University, Shenyang 110036, China
2
Department of Management Sciences, Gift University, Gujranwala 52250, Pakistan
3
Department of Mechanical Engineering Technology, College of Industrial Technology, King Mongkut’s University of Technology North Bangkok, Wongsawang, Bangsue, Bangkok 10800, Thailand
4
Faculty of Business Administration, Southeast Asia University, 19/1 Petchkasem Road, Nong Khaem, Bangkok 10160, Thailand
5
Department of Applied Finance, Macquarie Business School, Macquarie University, Sydney 2109, Australia
6
Educational Administration, Southeast Asia University, Bangkok 10160, Thailand
7
Department of Social Science, Faculty of Applied Arts, King Mongkut’s University of Technology North Bangkok (KMUTNB), Bangkok 10800, Thailand
*
Author to whom correspondence should be addressed.
Int. J. Financial Stud. 2022, 10(3), 76; https://0-doi-org.brum.beds.ac.uk/10.3390/ijfs10030076
Submission received: 13 July 2022 / Revised: 27 August 2022 / Accepted: 28 August 2022 / Published: 6 September 2022
(This article belongs to the Special Issue Financial Contagion)

Abstract

:
The high volatility and energy usage of rare earths have raised sustainable and financial concerns for environmentalists and sustainable investors. Therefore, this paper aims to investigate time-varying volatility transmission among rare earths elements, energy commodities, and sustainable financial markets. The sample covers global and major financial markets, i.e., US, China, and Australia. Using daily log returns from 2018 to 2022, the paper considers the dynamic Time Varying Parameter-Vector Autoregression (TVP-VAR) connectedness approach to gauge the time-varying features of volatility spillovers. The findings of total spillovers index reveal weak connectedness among markets during the sampled period. US and China rare earth markets were net volatility transmitters, whereas the Dow Jones Australia Sustainability Index (ASI), China Sustainability Index (CSI), Dow Jones Sustainability World Index (SWI), and MVIS Global Rare Earth Index (MVISGREI) were net recipients. Moreover, energy commodities i.e., WTI Crude Oil, Gasoline, and Natural Gas were net volatility transmitters, while ASI, CSI, and SWI were major volatility recipients. The weak financial contagion effect and connectedness across financial markets uncovers possible diversification opportunities. However, the US sustainable financial market is persistently not affected by these volatility spillovers. Policymakers need to establish strict regulations to protect sustainable financial markets in China and Australia.

1. Introduction

Environmental sustainability is one of the most critical global economic concerns. Massive energy demands are fulfilled by dominating energy commodities i.e., crude oil, natural gas, and gasoline. Meanwhile, rare earths elements are important elements for electric vehicles (Haq et al. 2022), information technology firms (Fishman et al. 2018), and magnet production (Reboredo and Ugolini 2020). However, the energy consumption of rare earths results in severe climate change, carbon footprints, and air pollution issues (Balaram 2019; Dudley 2018; Kihombo et al. 2022). Noticeably, the majority of REEs extraction methods from primary or secondary resources involve dirty and energy-intensive extraction processes which cause environmental issues. In the 2019 International Energy Agency, carbon dioxide (CO2) was the most significant component of greenhouse gas emissions, which soared by 1.7 percent in 2018 (Newell and Raimi 2020), signifying a record level of 33.1 Gt. Due to escalating effects of energy consumption and rare earths exploration on climate change and global warming, it is crucial to study the connectedness between rare earths, energy, and sustainable financial markets. In this way, economies can support the 2015 Paris Agreement and Sustainable Development Goals of the United Nations to mitigate CO2 climate change and global warming and reform their economies to promote climate resilient global economy (Gaustad et al. 2021; Schulze and Buchert 2016). Additionally, Gaustad et al. (2021) noted that it is important to consider both environmental or social and economic or financial perspectives for investors and practitioners.
Rare earths, energy consumption, and sustainability have become major drivers of sustainable and green economic growth in the current era (Haq et al. 2021b, 2022; Zhou et al. 2022), which motivates this research to answer following two questions. First, is there a time-varying volatility connectedness between rare earths, energy, and sustainable financial markets in a normal period? Second, is there a time-varying volatility transmission between rare earths, energy, and sustainable financial markets during a fragile period, i.e., COVID-19?
Since that time, it has become critical for the global economy to transform its traditional energy resources into low-carbon resilient economies while maintaining environmental sustainability (Murshed 2018). As a result, scholars and environmentalists have been increasingly concerned about global climate change and carbon footprints (Singh and Dhadse 2021). Several studies have found that primary REEs extraction activities have degraded environmental quality and posed human health risks due to increased inorganic pollutant concentrations (Usman et al. 2020). While other studies have concluded that it is essential to restrict unregulated rare earth elements mining and that its extraction process effect on human health and the ecosystem should be reduced (Liang et al. 2014; Packey and Kingsnorth 2016). Due to the severe environmental effects and high energy requirements of the processes used to extract REE, environmental sustainability has now emerged as a crucial economic criterion. Thus, this study largely focuses on exploring the financial and environmental perspective of rare earth markets and energy commodities.
Evidently, before China’s mining boom, the US held the monopoly on the global REE elements market for several decades through Mountain Pass production in 1965 (Barakos and Mischo 2017). Unfortunately, mining activities halted in 1998, due to Chinese REE market competition and environmental issues in the mountain pass region (Mancheri et al. 2019). As a result, the US economy has shifted its attention to REE recycling and imports a considerable quantity from several other countries (Marques et al. 2021). Meanwhile, other countries are also focusing on recycling REE materials and restricting their mining activities through primary resources to lessen environmental effects and improve energy efficiency (Brahim et al. 2022). These circumstances placed academics and environmentalists under immense pressure to investigate other REE sources and enhance extraction technology.
In prior research, Beylot et al. (2019) argued that significant investments are called for in the coming decades to achieve the objective of resilient economies with low carbon emissions. Additionally, impeding challenges including peak oil prices (Akhtaruzzaman et al. 2021c), economic vulnerability, and geopolitical issues have already prompted the need to diversify energy portfolios to achieve a global sustainable system (Balali and Stegen 2021). Therefore, increasing magnet use, rising global economic growth, and technological advancement are key drivers boosting demand for REEs. Global Market Insights Inc.’s 2020 research predicts that the annual growth rate of REE would be increased by 10.8% from 2022 to 2026, providing fund managers and investors throughout the world with a wide range of investment possibilities. So far, worldwide governments should undertake significant REE production plans and technology advances in REE’s mining and recycling process as expansion in REE’s market has piqued the interests of market participants. Moreover, the worsening impact of REEs on environmental quality and escalating climate challenges have spurred a global consensus to integrate global growth plans with concurrent environmental protection.
Therefore, the primary aim of our study is to reveal the dynamic volatility transmission across markets. In addition to exploring portfolio diversification or hedging opportunities across rare earths, energy, and sustainable financial markets. Generally, most portfolio managers and investors prefer higher returns at a given level of risk in their portfolios, which allows them to diversify their portfolio risk by integrating negatively or weakly correlated securities in their portfolio to obtain optimal portfolio performance (Evans and Archer 1968). Understanding volatility transmissions allows investors to better understand dynamic risk patterns during normal and adverse market conditions.
A strand of literature has investigated the information transmission among financial markets (Haq et al. 2022; Pantos et al. 2019; Papathanasiou et al. 2022b; Samitas and Kampouris 2019; Samitas et al. 2022b, 2022c). Energy commodities and rare earths have varying impacts across different financial markets (Haq et al. 2021b, 2022; Hau et al. 2022; Zhou et al. 2022). Hence, rare earths and energy commodities inherit varying hedging or diversification properties across time and frequency and may differ across multiple financial markets and energy commodities. In overview, our research is grounded on the theoretical standing of Markowitz’s portfolio theory (Sharpe 1964). The idea of portfolio theory suggests that investors can design a portfolio of assets considering the negative correlation patterns or moderate positively correlated assets. In addition, an investor can earn and minimize the expected volatility at a given level of risk.
This study has a potential contribution to the existing literature (Bouri et al. 2021a; Chen et al. 2021; Haq et al. 2021b, 2022; Hau et al. 2022; Reboredo and Ugolini 2020; Shin et al. 2019; Song et al. 2021; Zheng et al. 2021, 2022; Zhou et al. 2022) in several ways. First, this study adds to the spillover and hedging literature (Haq et al. 2022; Pantos et al. 2019; Papathanasiou et al. 2022b; Reboredo and Ugolini 2020; Samitas and Kampouris 2019; Samitas et al. 2022b, 2022c) that rare earth elements and energy commodities, i.e., Gas, Natural Gas, and Crude Oil show heterogeneous volatility transmission toward financial markets in normal and fragile periods. Second, this research contributes to the recent body of literature (Haq et al. 2022; Samitas et al. 2022b, 2022d; Zhang et al. 2021), as no recent considered the dynamic volatility spillovers among these financial markets. Due to this, the sample set covers the impact of several financially and economically fragile periods, i.e., the COVID-19 episode (Haq and Awan 2020; Huynh et al. 2021). Finally, we uncover the dynamic volatility spillover in major economies, i.e., China, the USA, and Australia, which are largest consumers of energy commodities, i.e., crude oil, and possess 80% the world’s REE reserves as reported in 
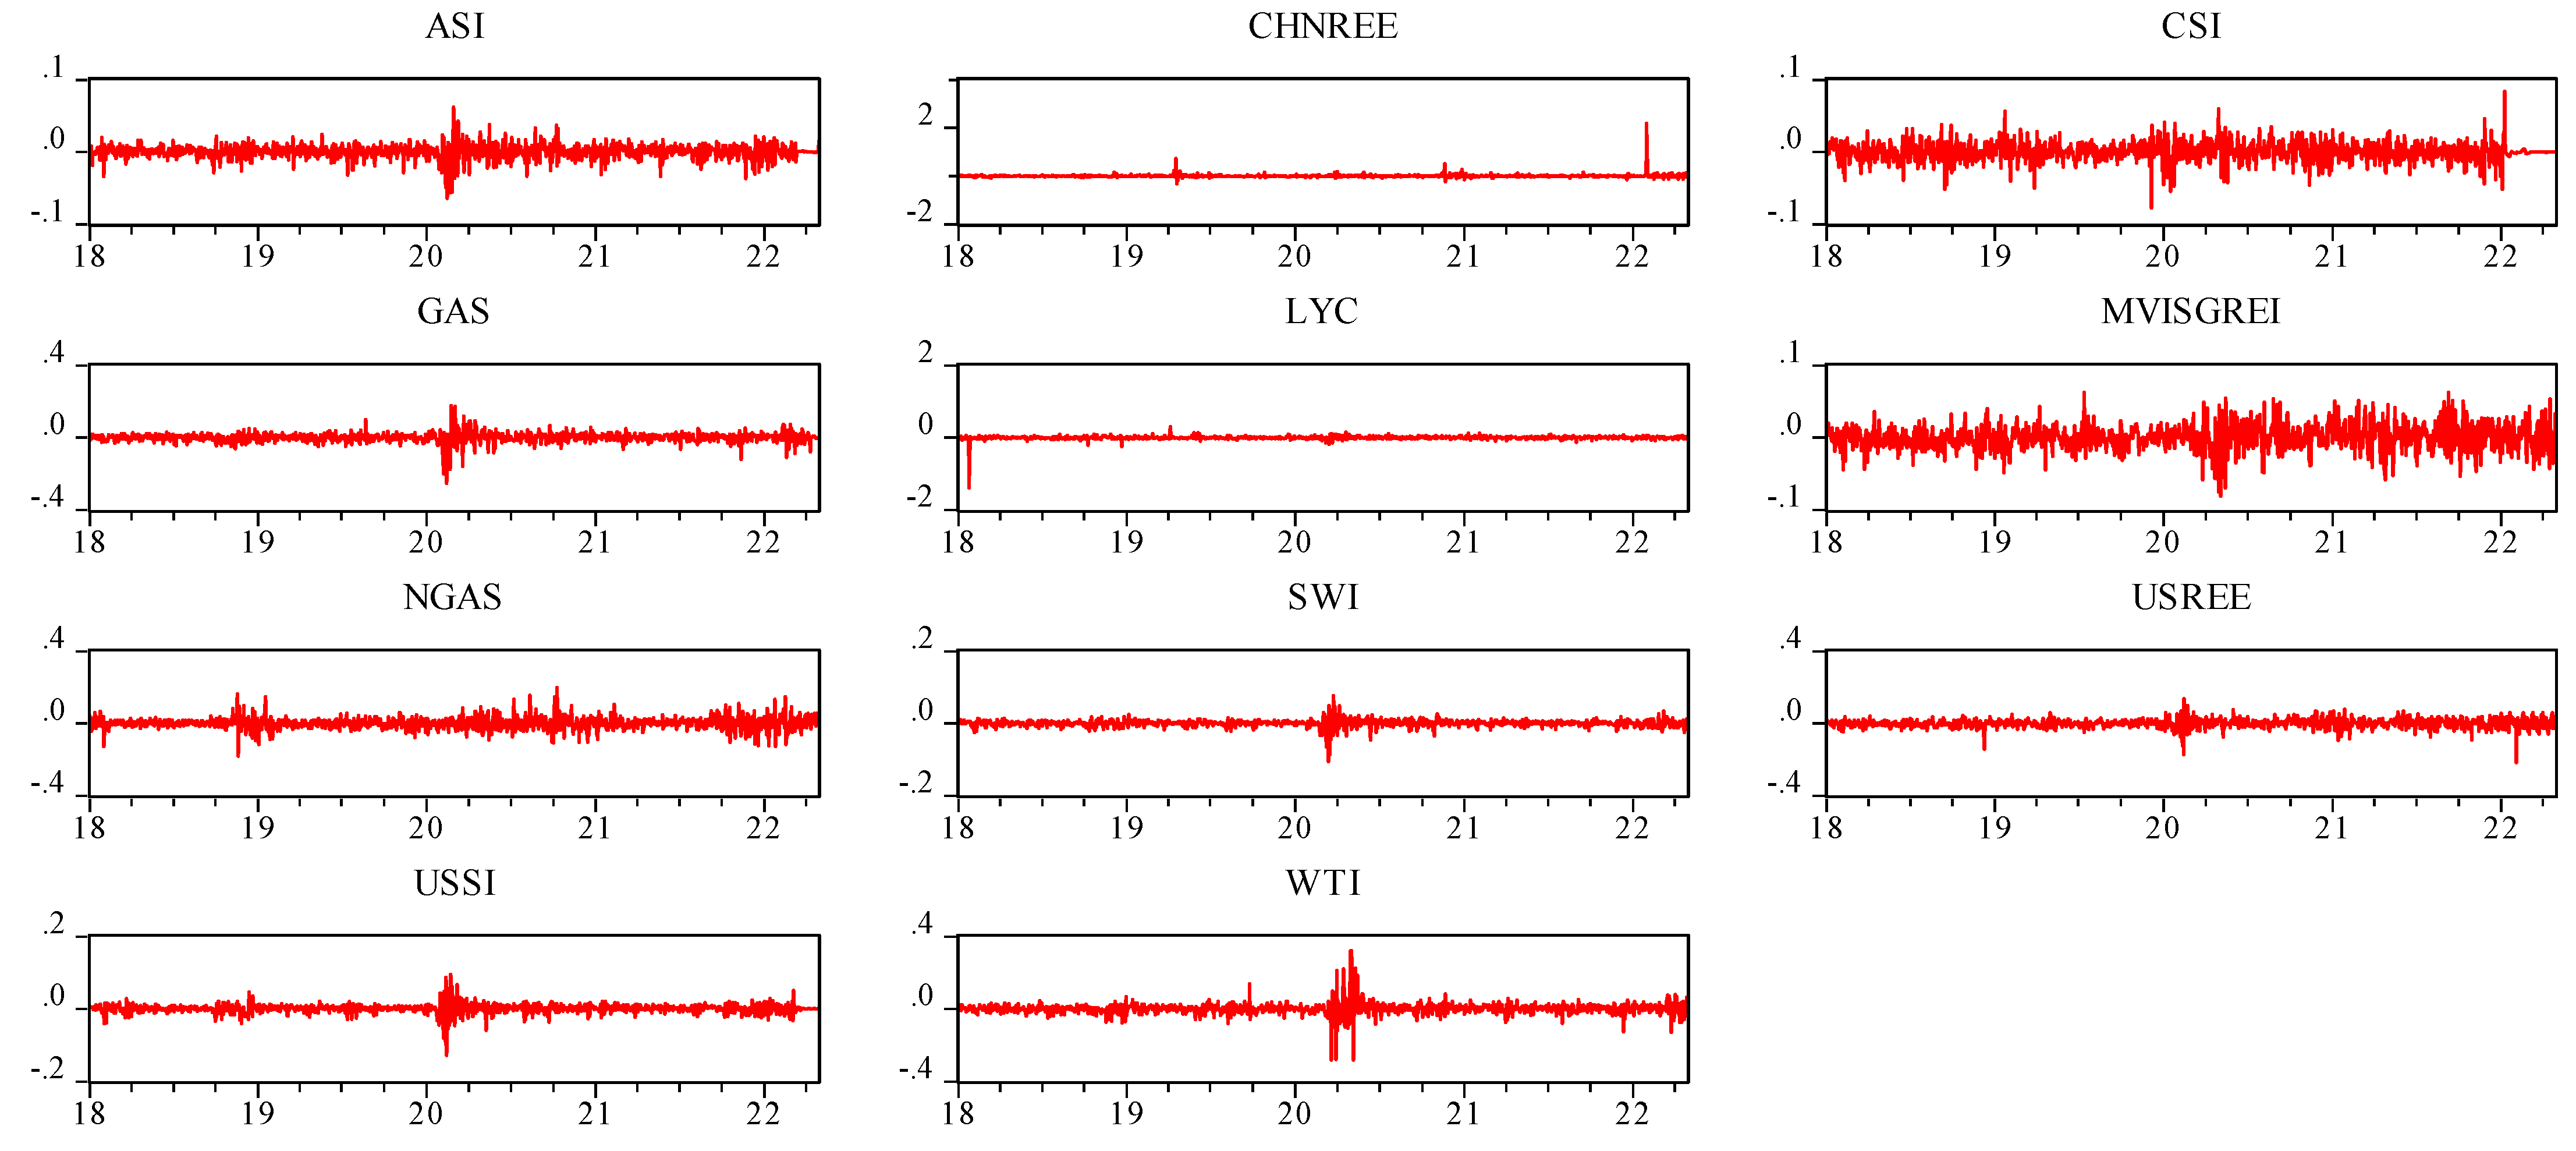
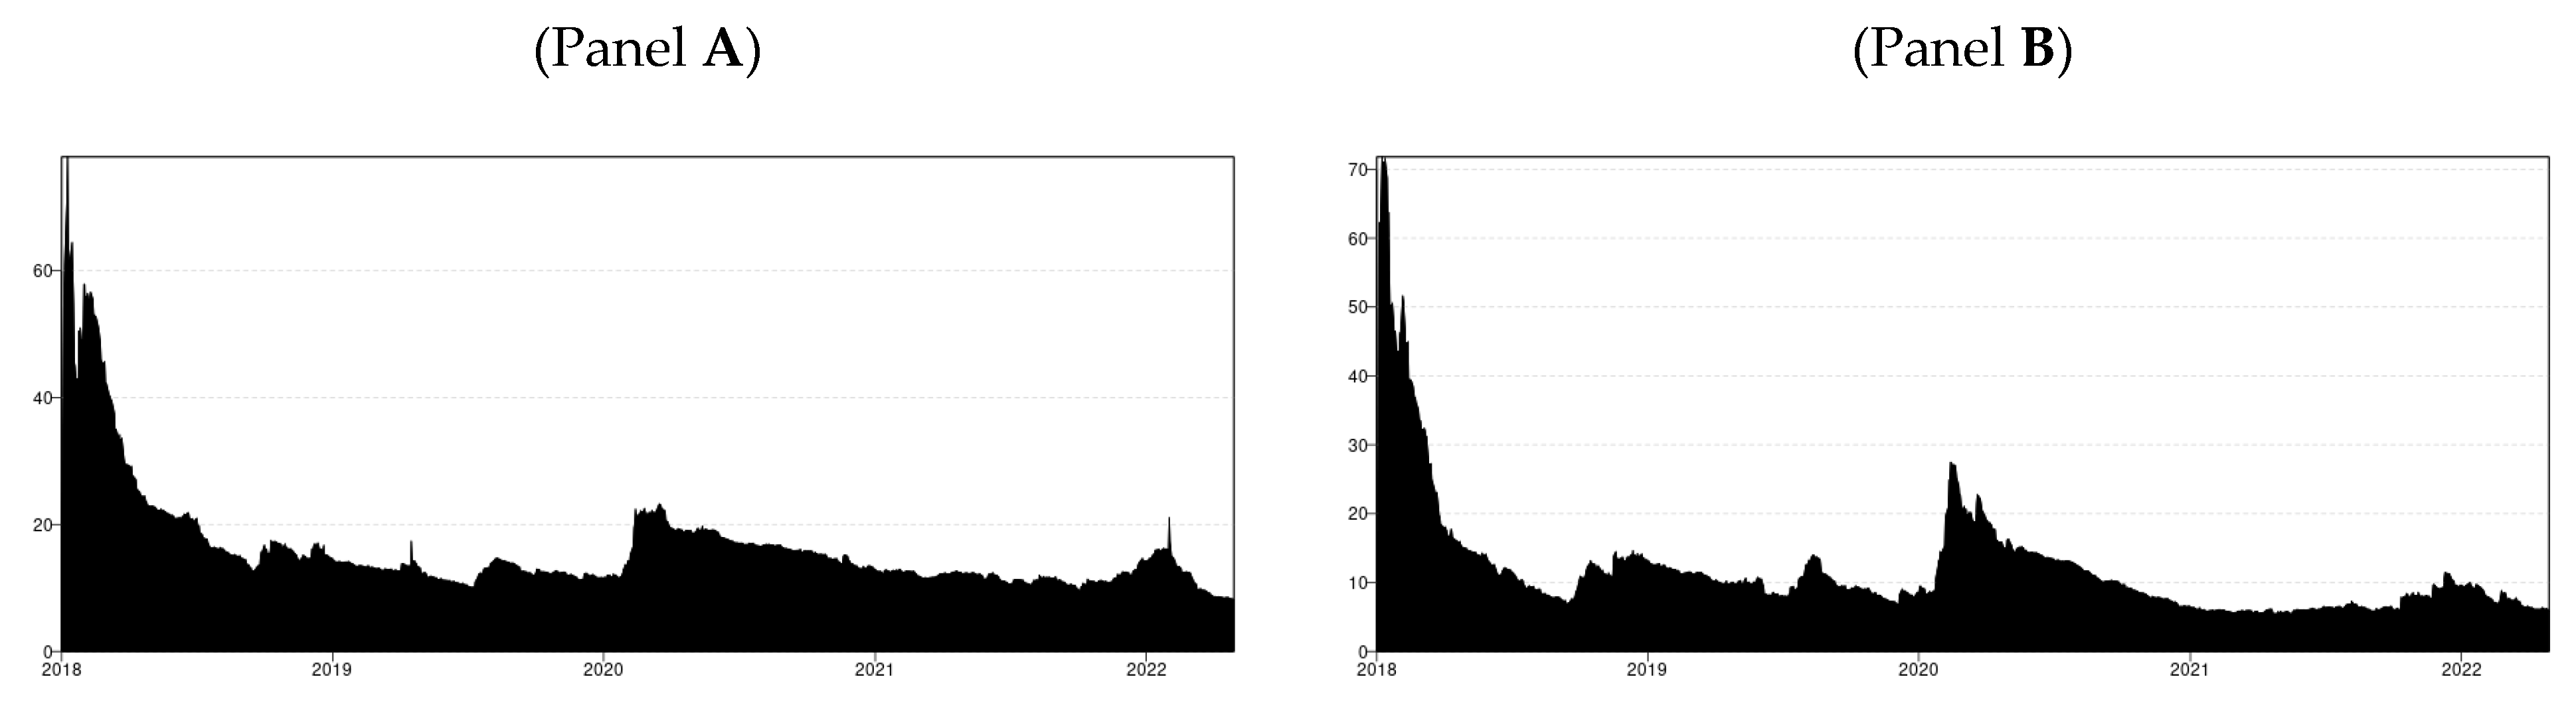
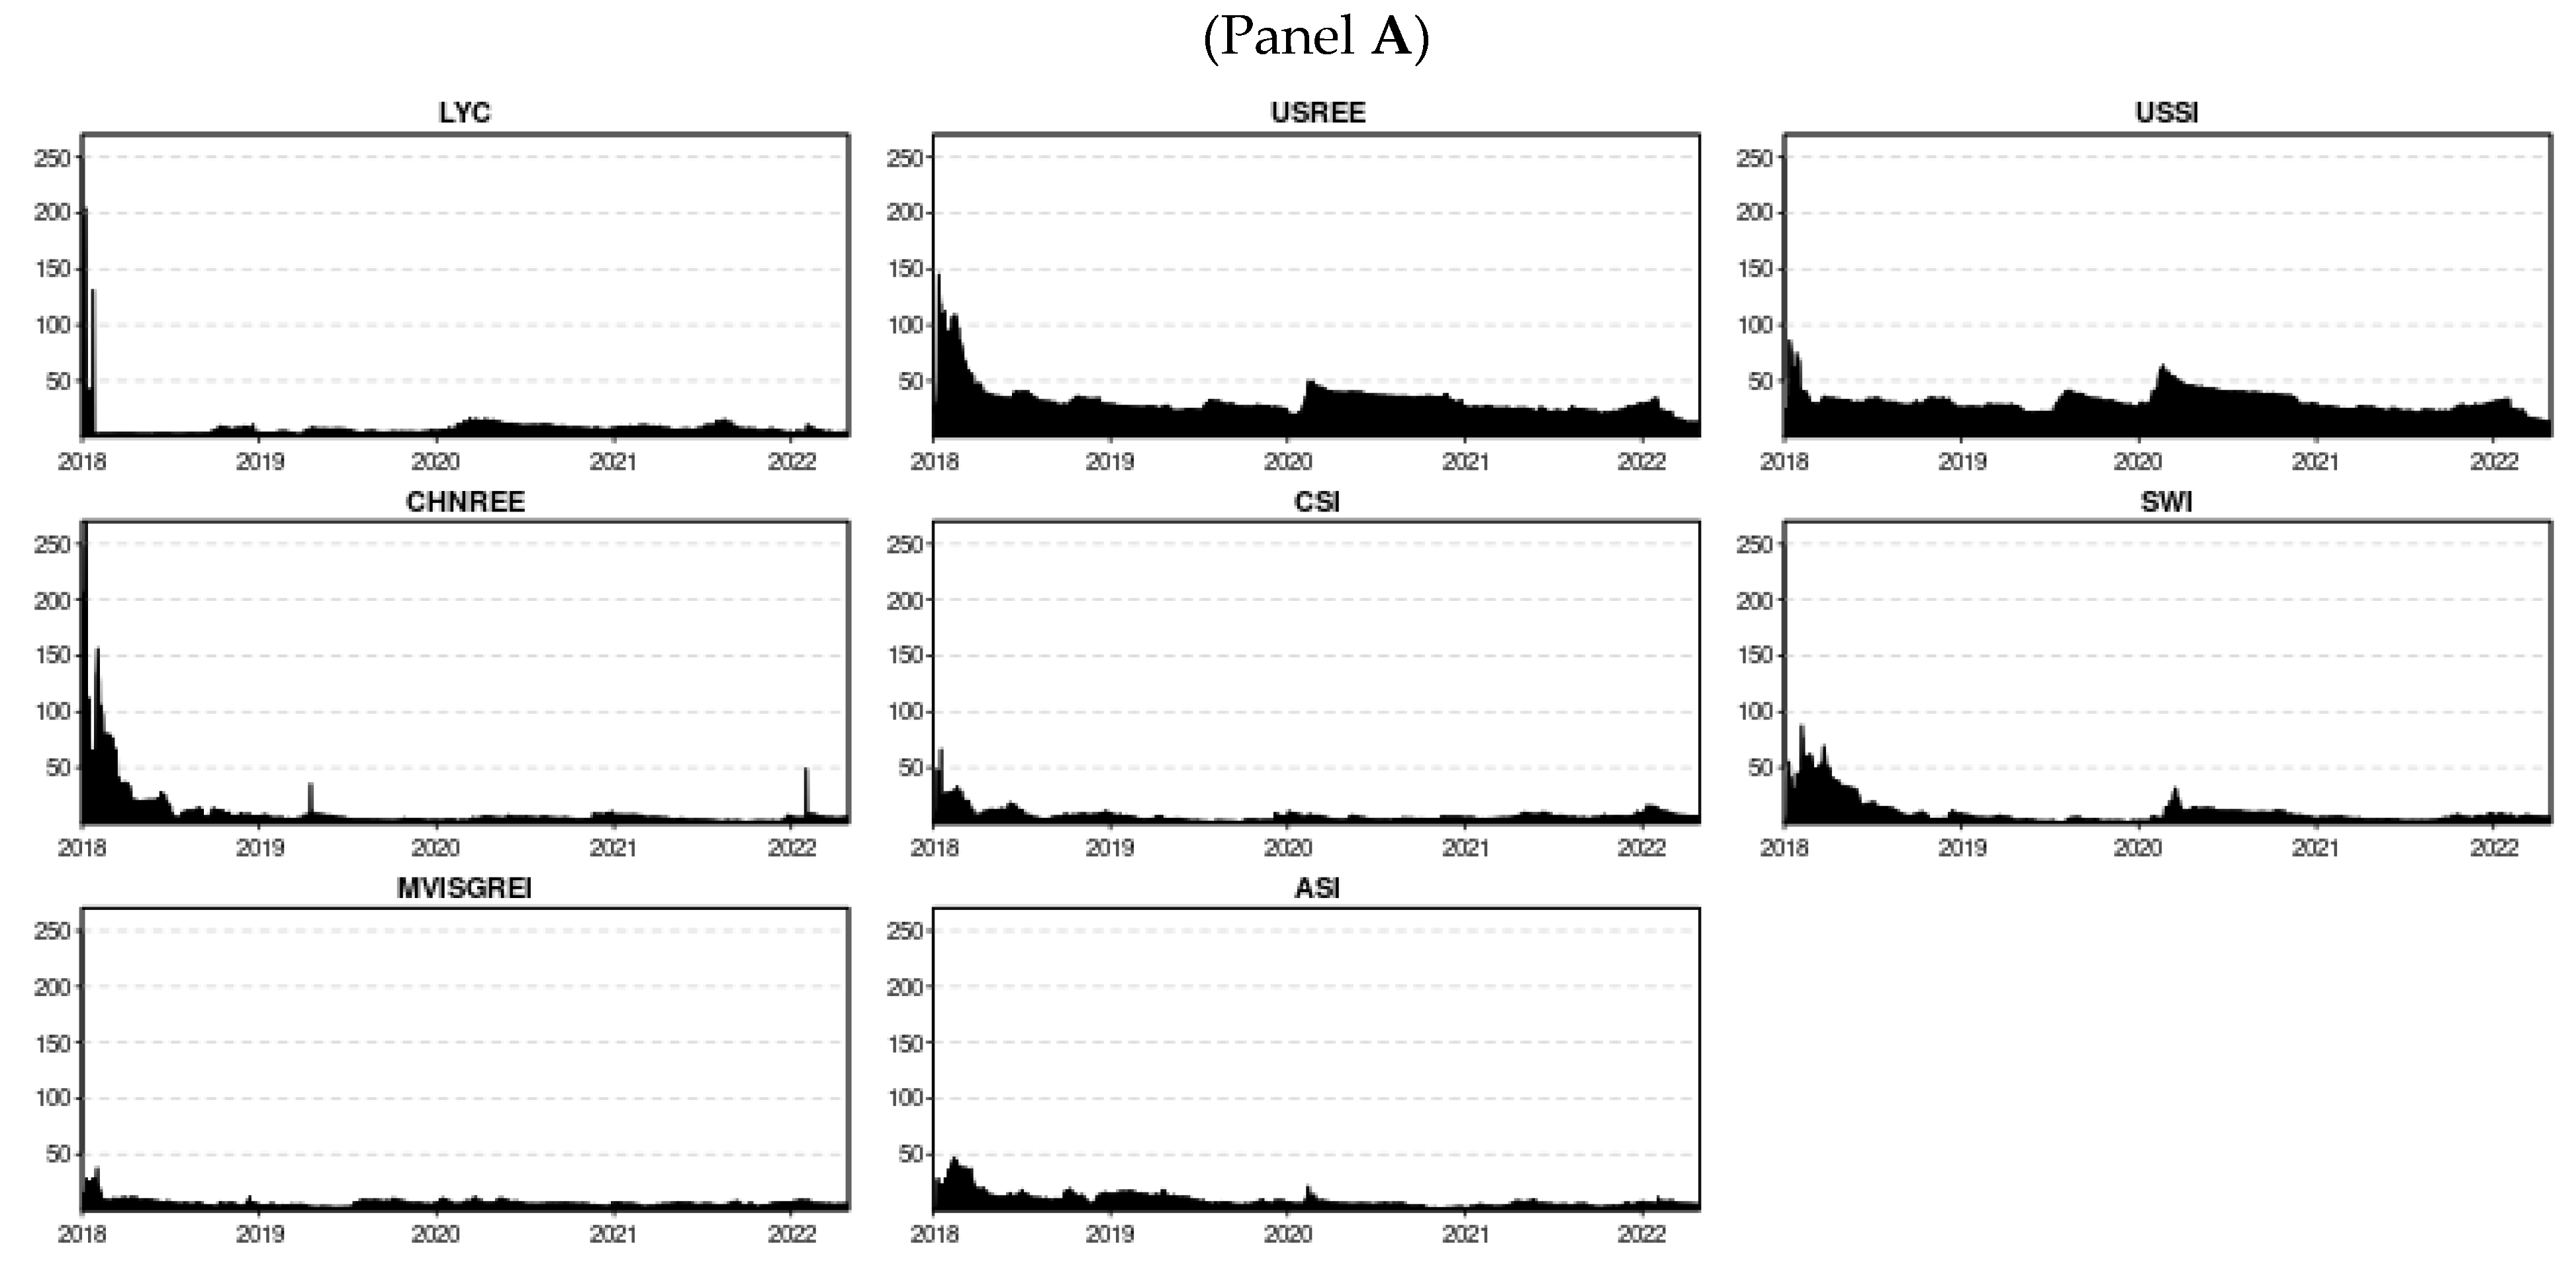
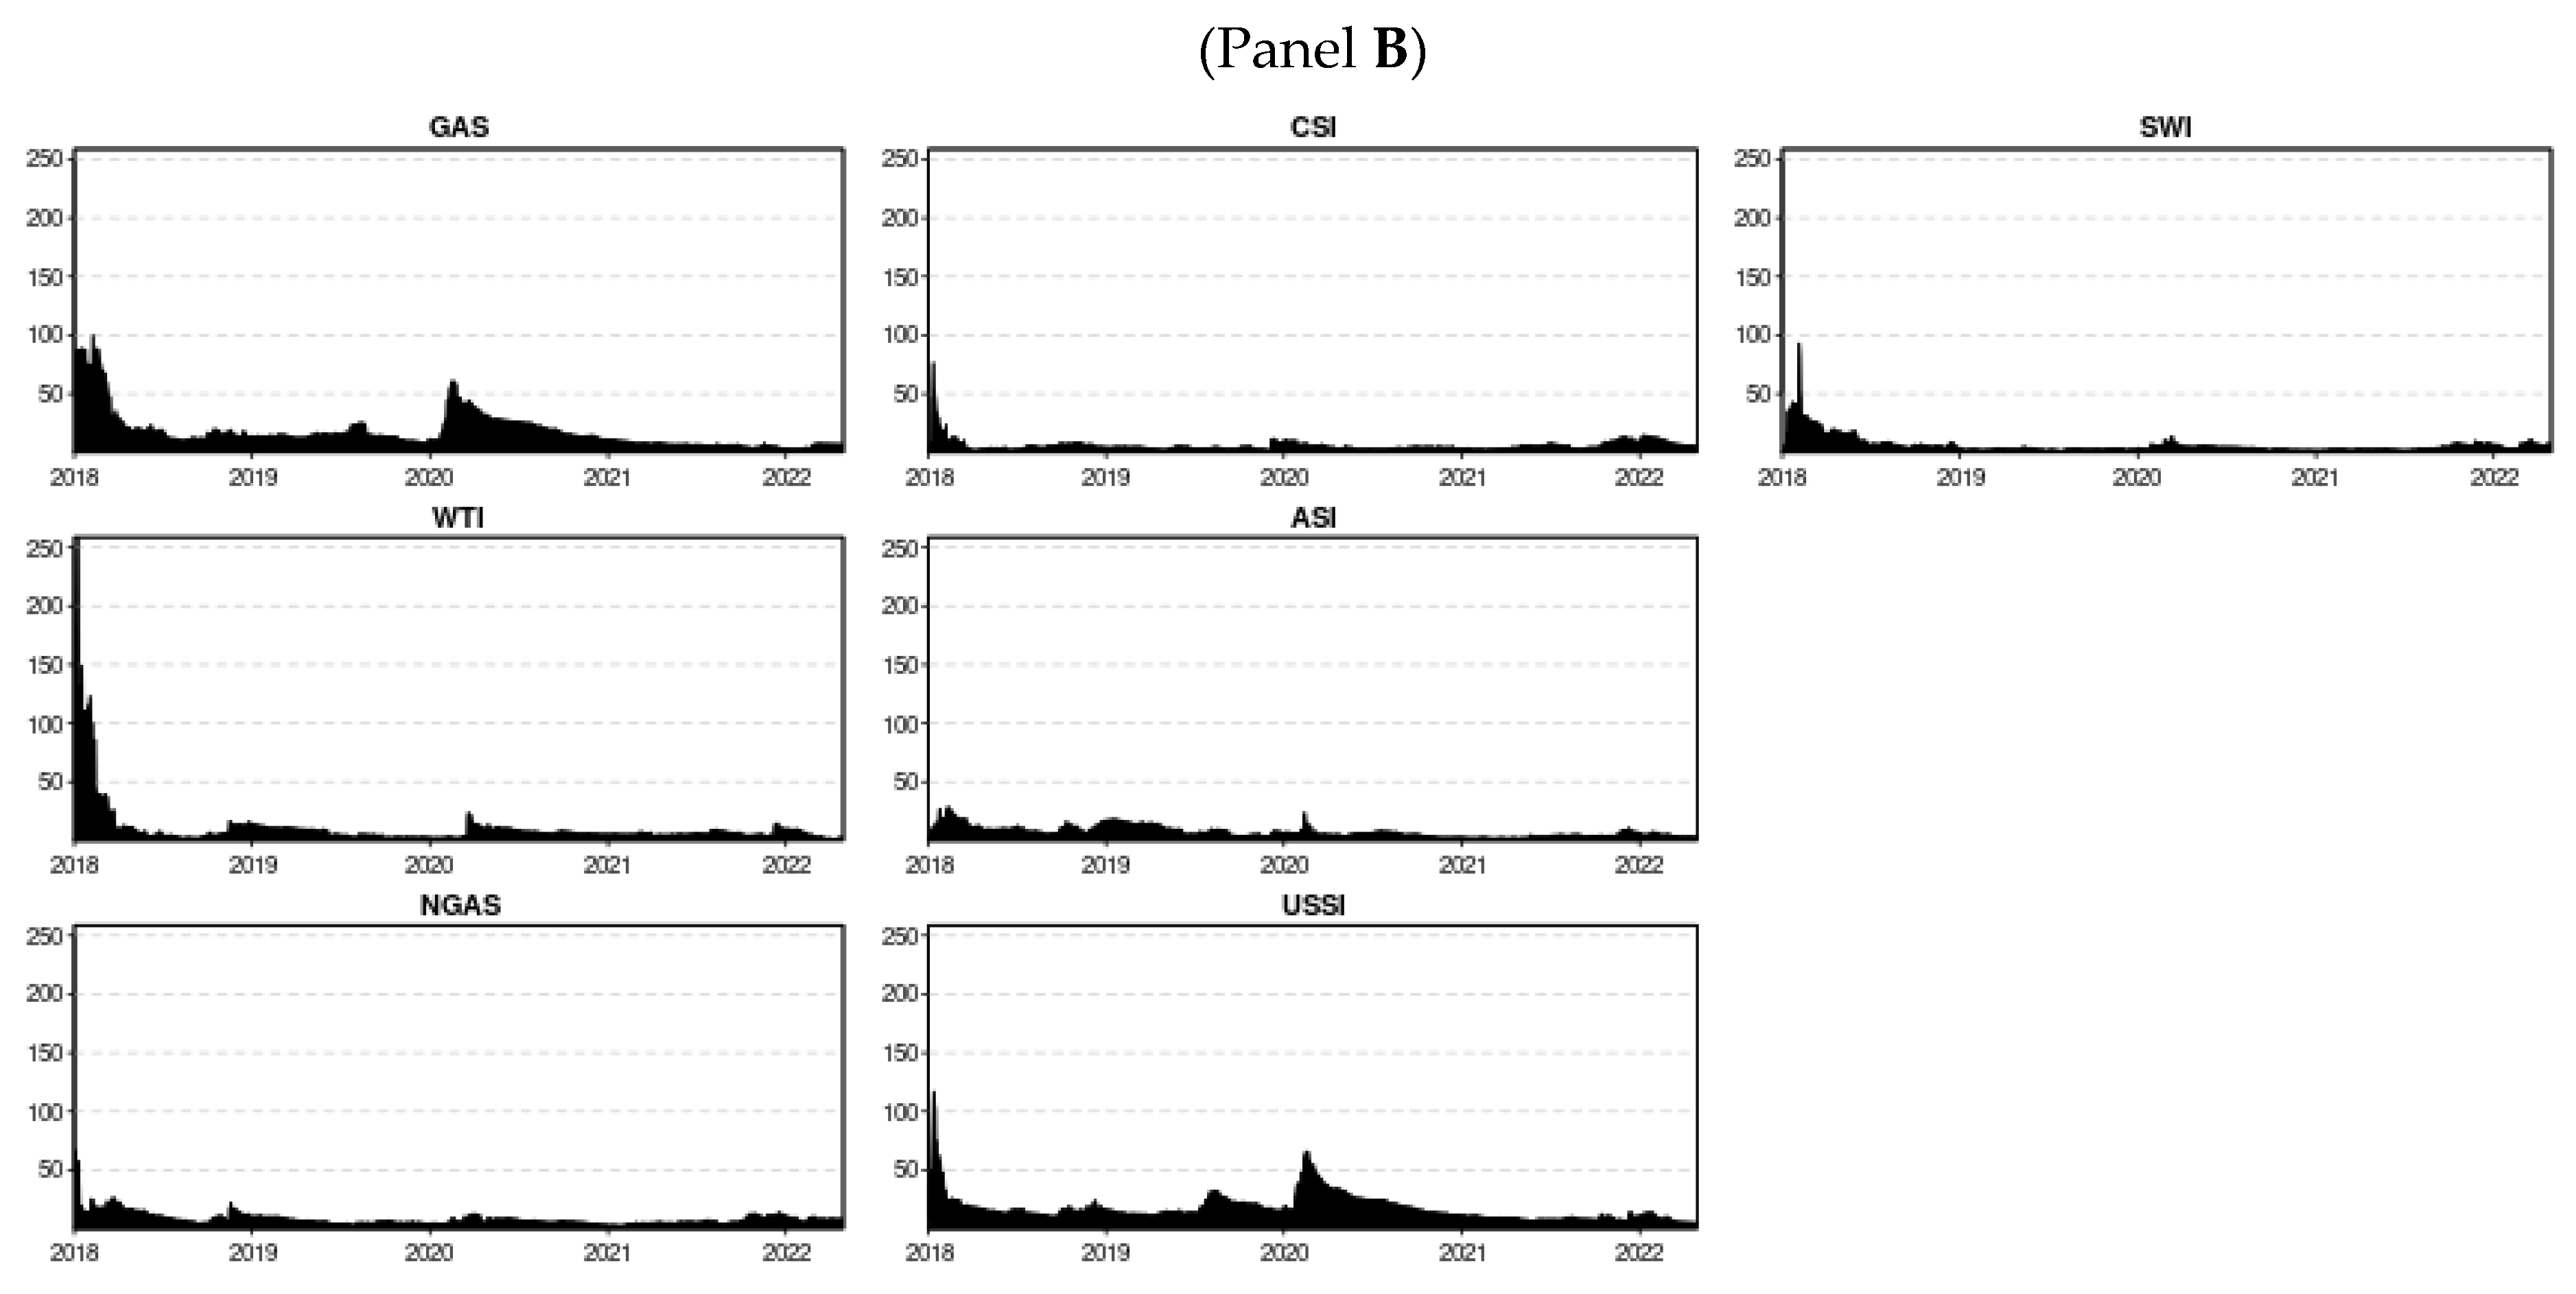
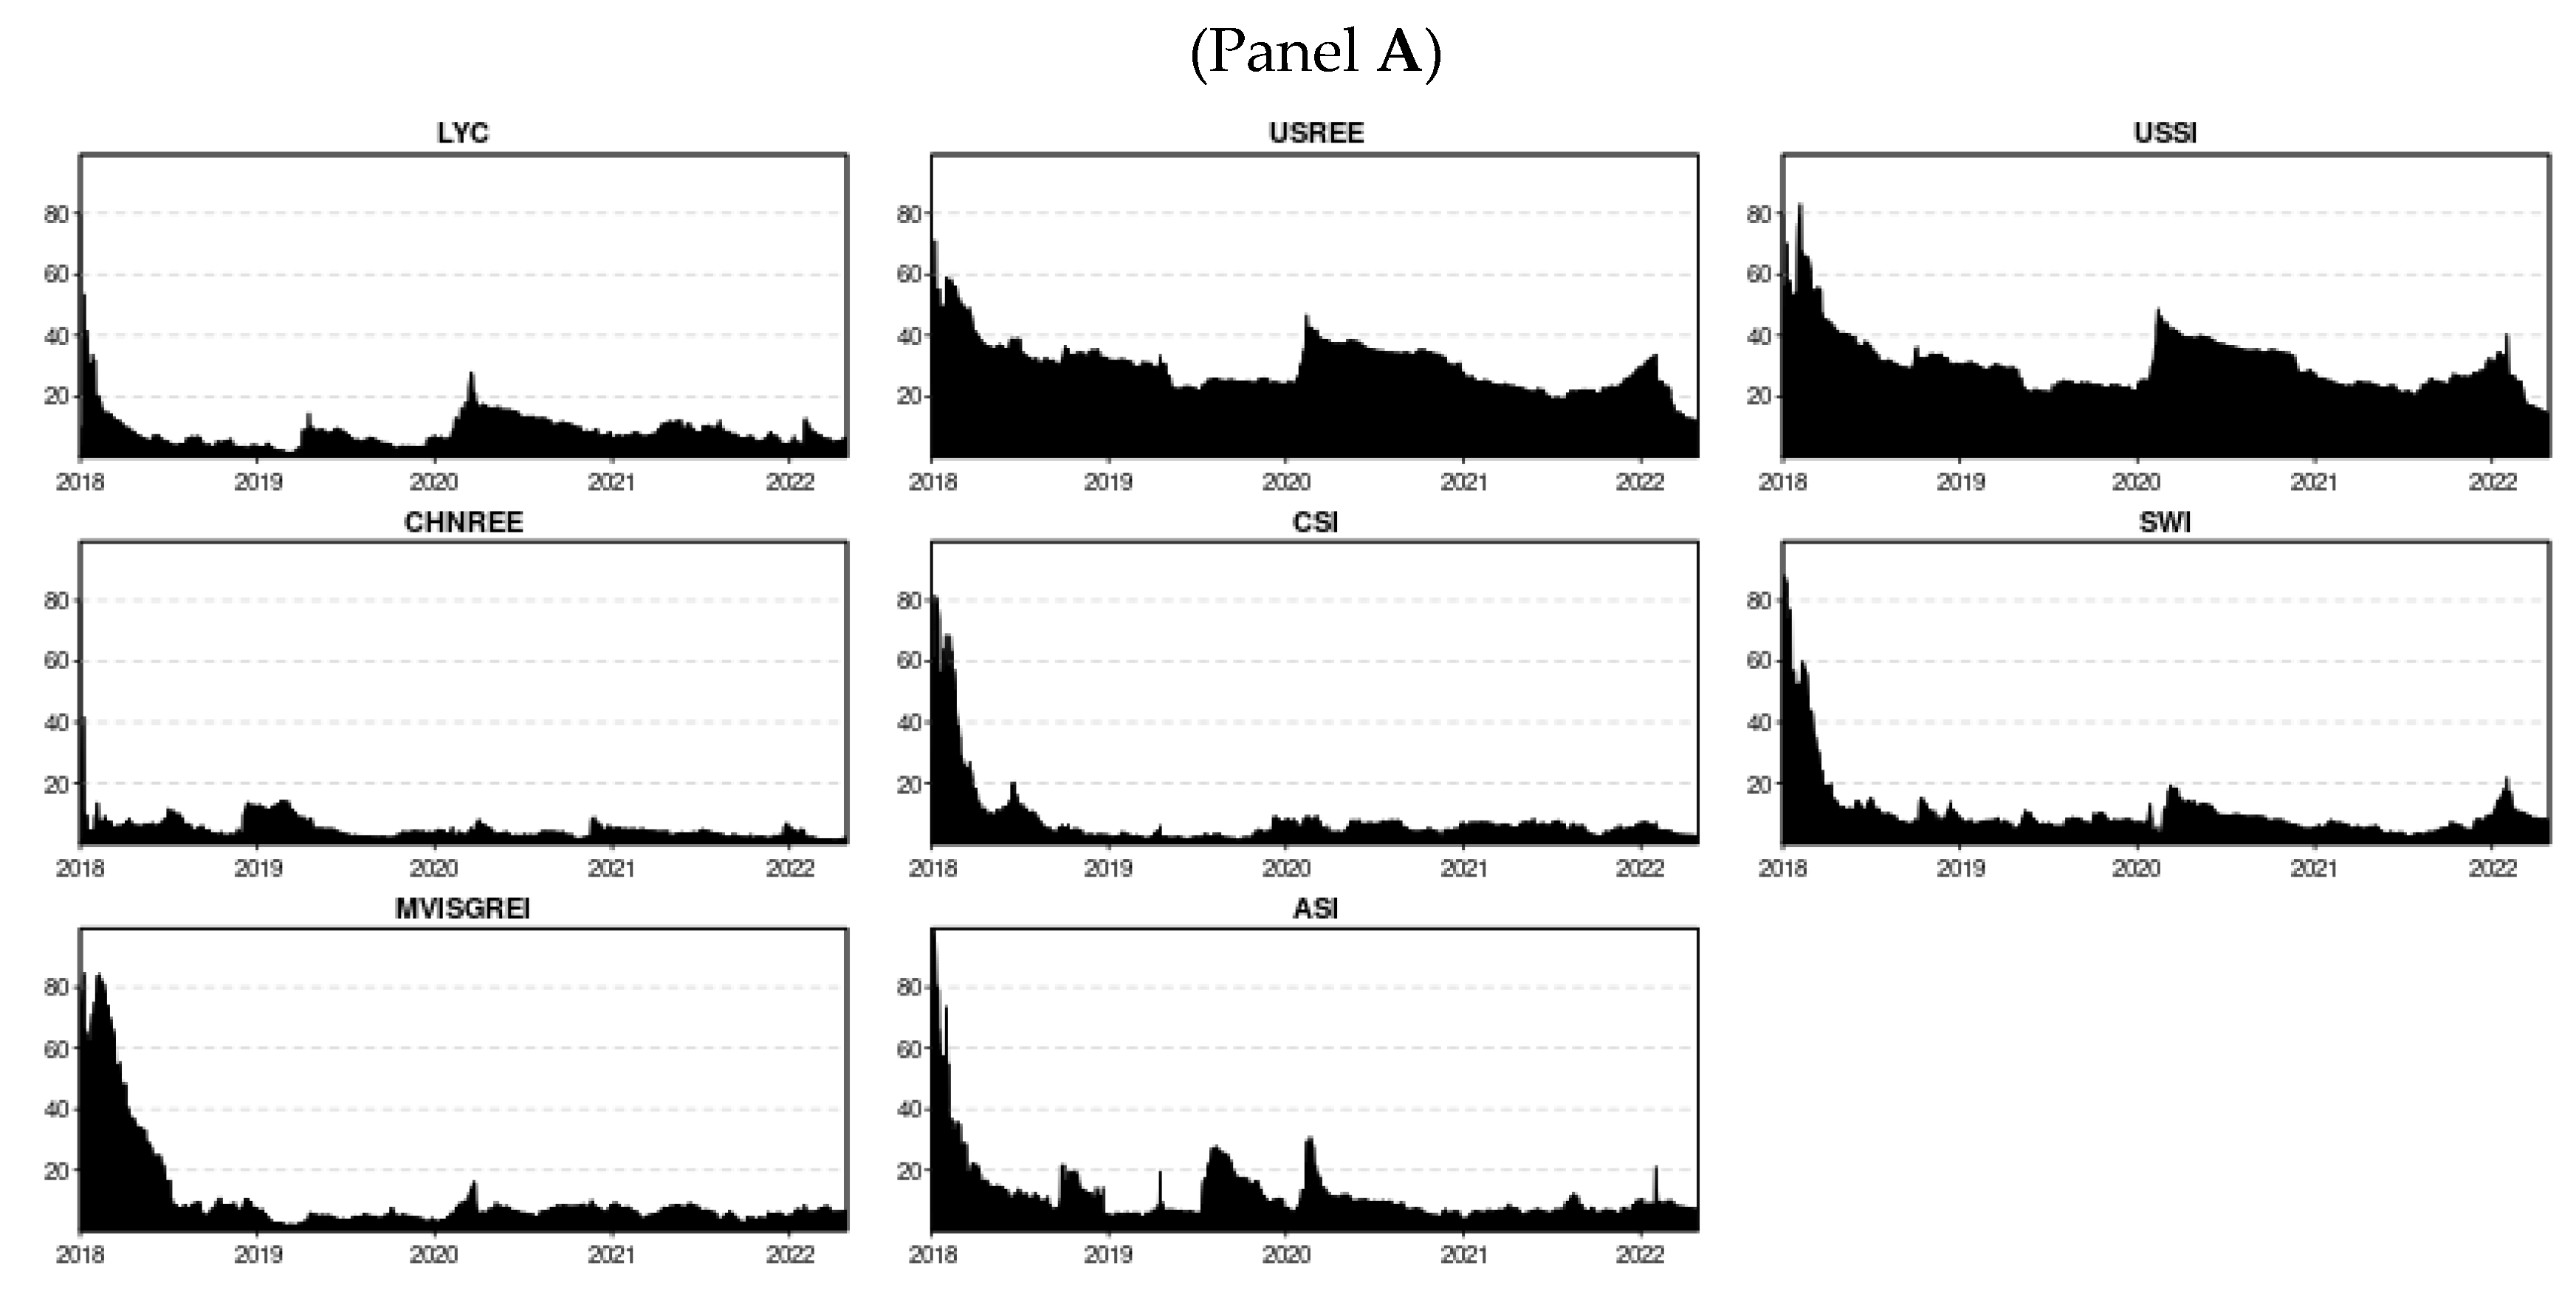
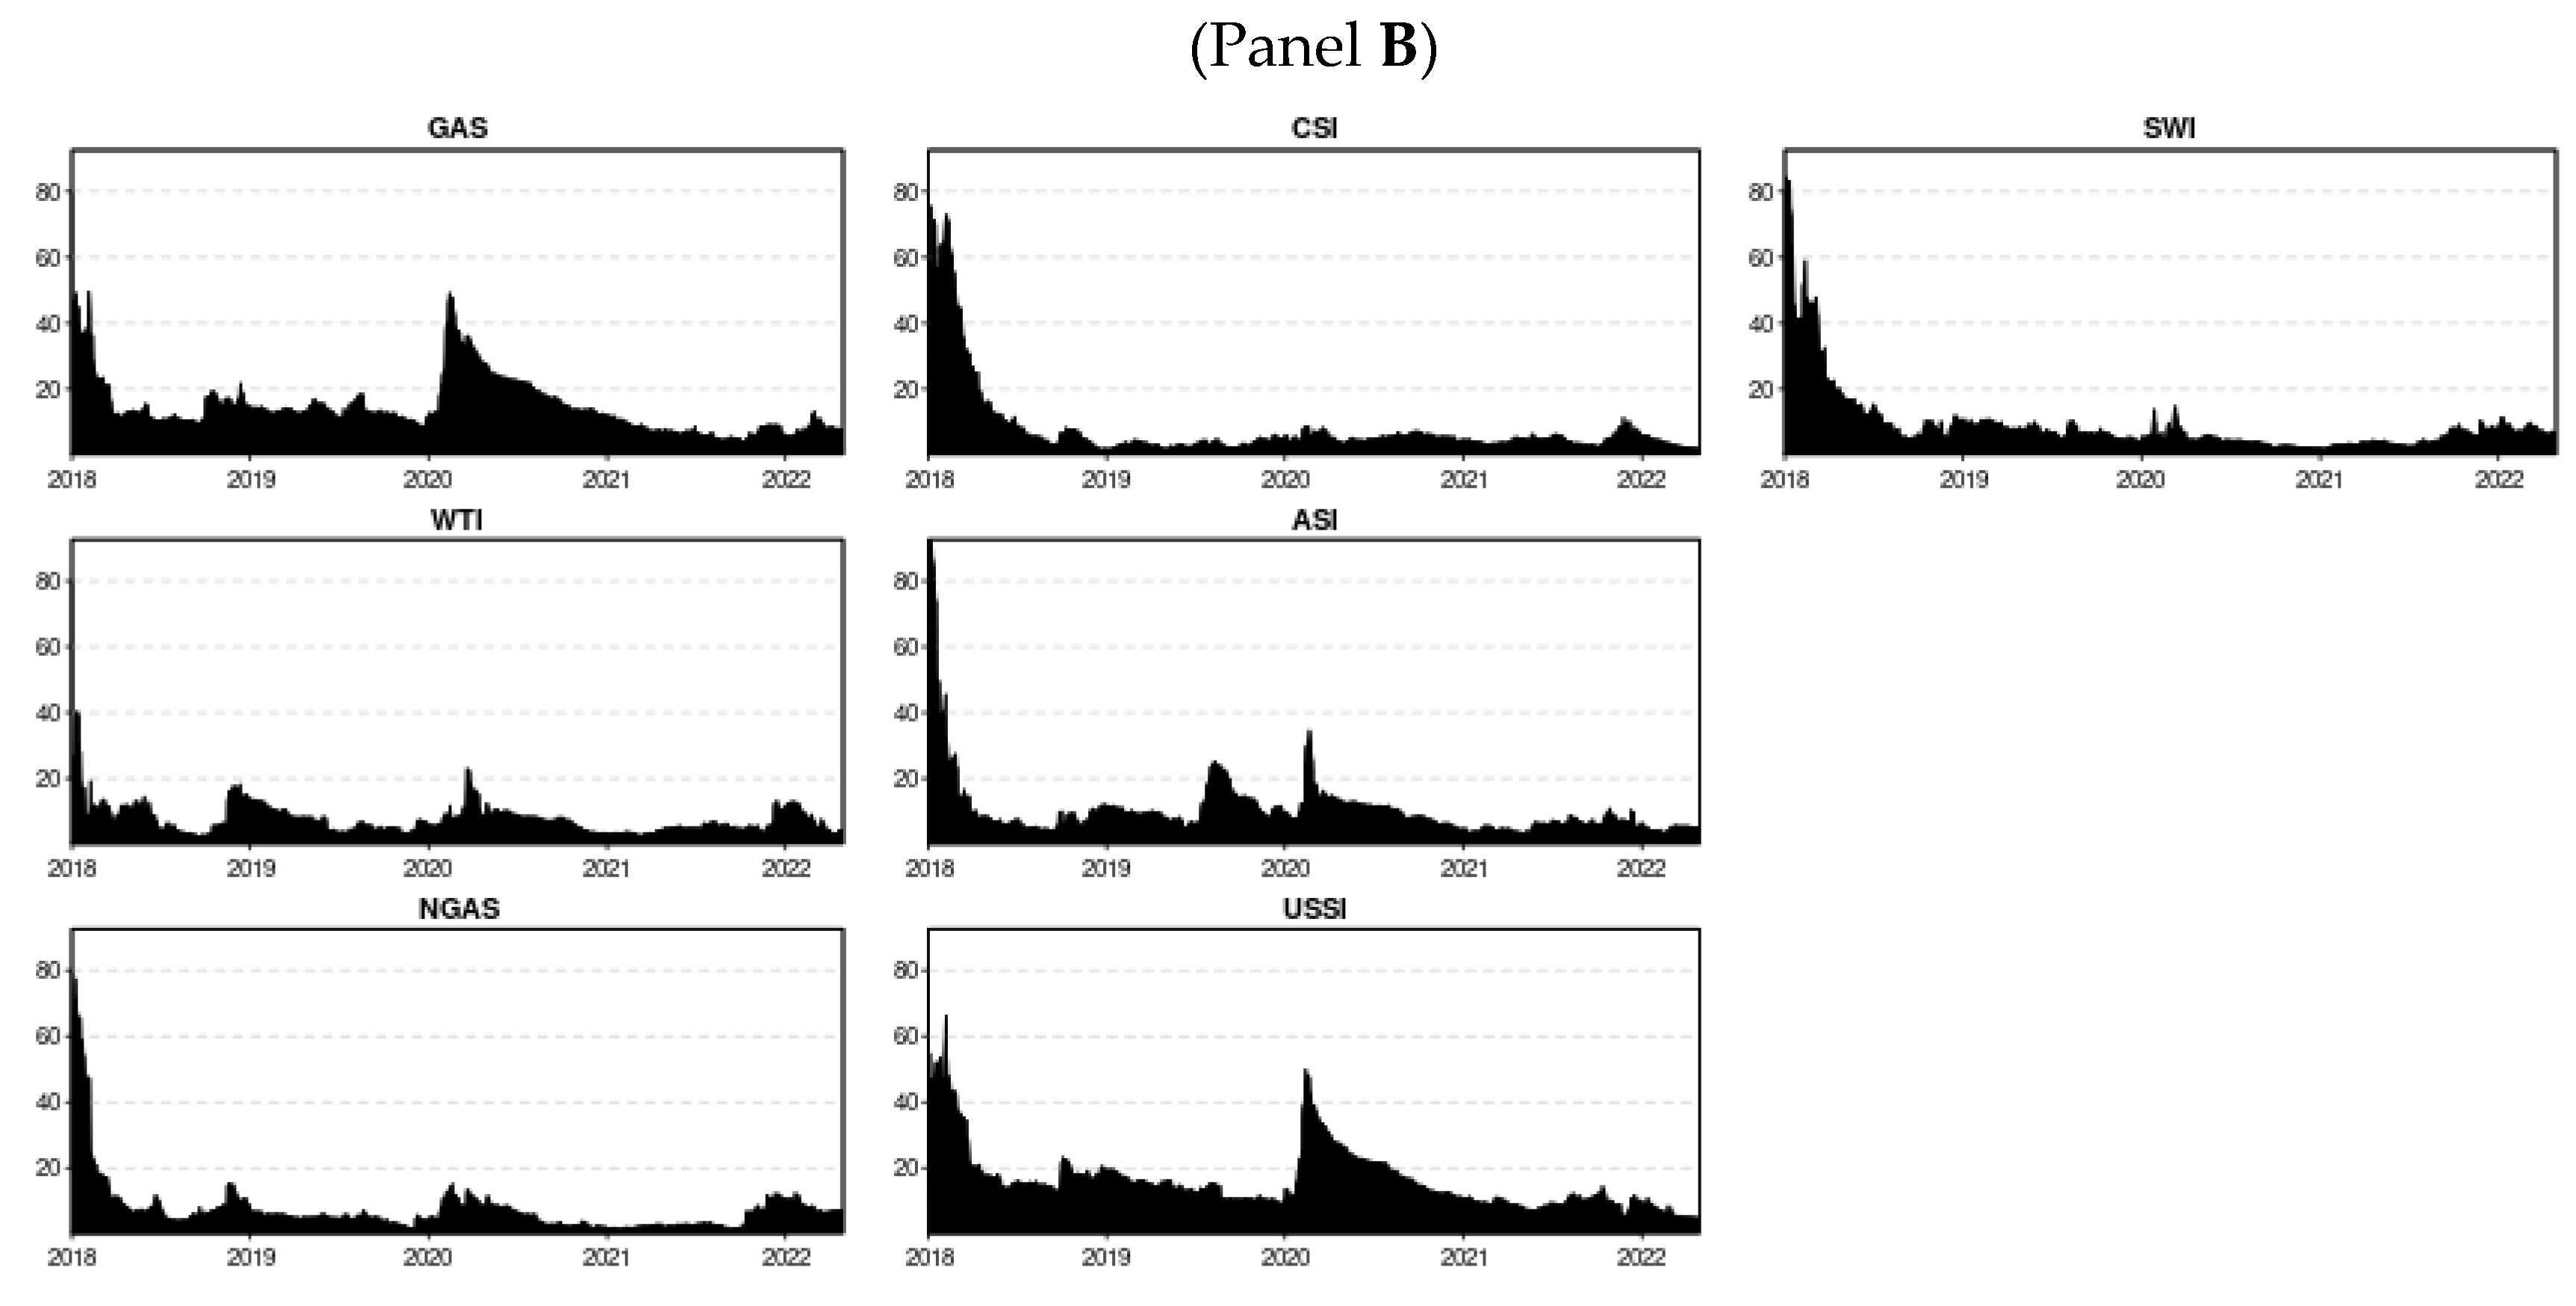
Table 1. Our empirical findings show heterogeneous volatility spillovers over time and that connectedness follows a random course over time. The volatility spillover has experienced a surge during the intense economic period, i.e., COVID-19. Total volatility spillovers present a spike around the COVID-19 outbreak, suggesting higher volatility transmission among financial markets during turbulent and crisis periods. Rare earth markets (the US and China) are net volatility transmitters and the Dow Jones Australia Sustainability Index (ASI), China Sustainability Index (CSI), Dow Jones Sustainability World Index (SWI), and MVIS Global Rare Earth Index (MVISGREI) are net recipients. Further analysis revealed that energy commodities (Crude Oil, Gasoline, and Natural Gas) are net volatility transmitters whereas ASI, CSI, and SWI are the main volatility recipients. Notably, rare earths or energy commodities failed to transmit volatility to the US sustainable financial market.
The remaining research structure of our paper is as follows: Section 2 discusses previous literature in the current strand. Section 3 describes the data and methodology used to analyze time-varying connectedness. Section 4 reports results and interpretation. Finally, Section 5 concludes our paper with policy implications.

2. Related Studies

Earlier research has studied the theoretical perspective of rare earth elements which demonstrates that previous economic literature on the financial contagion effect of REEs is scarce. The role of financial contagion effect and volatility transmission has been well-developed in finance literature, i.e., in financial markets, (Haq et al. 2022; Pantos et al. 2019; Papathanasiou et al. 2022b; Samitas and Kampouris 2019; Samitas et al. 2022b, 2022c), cryptocurrency market (Samitas et al. 2020; Ul Haq et al. 2022) and energy and metal markets (Haq et al. 2021b; Mensi et al. 2020). However, rare studies have investigated the financial contagion effects of rare earth and the energy market toward major green financial markets. This research attempts to fill this literature gap by examining the time-varying volatility spillovers using the TVP-VAR model.
The economic importance of rare earth elements (REEs) has thrived in the last decade. For instance, REEs have been identified as a crucial element in various environmentally sustainable technologies due to their exceptional conductive and magnetic properties (Zhou et al. 2017). The global trend of low-carbon resilient economies has been irresistible in recent years. In addition, it has arisen in conjunction with emerging sustainable technology in which rare earth elements play a vital role and have no other substitute in the global market (Zhao et al. 2017). Moreover, environmentally friendly technology manufacturing is largely based on REEs as these elements are essential components for manufacturing (De Koning et al. 2018). Inherited volatility and rising demand for sustainable technologies are damaging environmental and sustainable concerns around the globe (Haq et al. 2022; Reboredo and Ugolini 2020) due to unsustainable extraction and mining processes of REEs (Khorasanipour and Jafari 2018). Likewise, Balaram (2019); Mancheri et al. (2019) documented the influence of REEs occurrence, exploration, and recycling on environmental sustainability and revealed that policymakers should prioritize recycling of REE waste since it has a less severe environmental impact. Therefore, to overcome such economic and sustainable challenges, the rare earth elements industry should focus on long-run socially sustainable goals by promoting the United Nations sustainable development goals (SDGs) (Dushyantha et al. 2020).
On the other hand, CO2 emissions have grown due to increased energy consumption, they have also emerged as the biggest threat to sustainable development (Nathaniel and Iheonu 2019) due to energy commodities. Unfortunately, human activities always remain the major driver of these global emissions (Du et al. 2019). So far, an extensive set of countries have worked together under the United Nations Climate Change Conference in Paris 2015 to make their economies carbon resilient by promoting sustainable consumption (Cai et al. 2020; Sadiq et al. 2022). Furthermore, the Sustainable Development Goals (SDGs) emphasize that countries should reduce carbon emissions, increase energy efficiency, transition to a sustainable energy system, and ensure the supply of sustainable energy. The SDGs also emphasize the protection of biodiversity, maintenance of the ecosystem, and mitigation of environmental degradation to promote equitable human and economic growth.
The relationship between rare earths and financial markets has not yet been developed in the same way as other financial concepts. Some recent studies have examined the volatility connectedness between rare earths and financial markets. For example, Reboredo and Ugolini (2020) revealed that price fluctuations in the REE’s market and supply interruptions had a detrimental impact on sustainable industries, especially when REE prices increase. Further, Song et al. (2021) examined the connectedness of REE with financial markets by using the TVP-VAR model to uncover dynamic connectedness during the COVID-19 pandemic. The findings of the study showed that the volatile REEs market has a strong interdependence with crude oil and the clean energy market. However, Bouri et al. (2021a) extended this framework by using a quantile based connectedness technique to explore both tail-based and average connectedness where they revealed that interdependence of these markets varies considerably at upper and lower quantiles. Moreover, they concluded that US–China trade has little effect on return and volatility dynamics. In a similar domain, Haq et al. (2021b) explored the dynamic association between global rare earths and sustainable markets by employing the DCC-MGARCH model to assess the time-varying co-movements. The findings of this study showed that global rare earths exhibited safe-haven properties against economic policy uncertainty (EPU). More specifically, focusing on the impact of the 2015 Paris Agreement on sustainability, Zhou et al. (2022) noticed the extreme spillover effects between sustainable energy and metal markets by employing a spillover index and quantile approach. Further, the study indicated an asymmetric spillover effect among markets due to certain differences, especially in extremely negative and positive situations. Precedingly, Zheng et al. (2022) investigated time–frequency movements among REEs and energy markets by using the wavelet and BEKK–GARCH model. They found that REEs have a significant impact on advanced technology and sustainable energy markets and highlight potential portfolio and risk management strategies (Haq et al. 2022). In overview, the above discussion of the literature revealed rare earths markets are a strong source of financial contagion effect toward conventional and sustainable financial markets as economies are becoming more deliberate in regard to environmental protection and carbon resilience.
The association between energy commodities and financial markets has developed in finance literature. Previous research is segregated into two parts. In the first part, researchers examined the causal effects of technological, social, and economic activities on energy consumption (Danish and Ahmad 2018; Shahbaz et al. 2017). The findings of these studies demonstrated that the casual association between technological, social, and economic activities and CO2 emissions caused by drastic energy consumption varies across counties due to differences in their institutional, economic, geographical, technological, and political conditions (Rahman and Kashem 2017). In the second part, scholars extended their analysis by adding the indicators of environmental deterioration which fostered the vulnerability of environmental sustainability, such as CO2 emissions (Cetin et al. 2018; Ehigiamusoe and Lean 2019; Pablo-Romero and De Jesús 2016). The findings showed that pollution caused by CO2 emissions has a detrimental effect on human health and contributes to mortality (Khan et al. 2019). To combat this threat, previous literature urges various countries to turn their attention to sustainable energy sources since they are clean, have low carbon emissions, and encourage environmental sustainability (Shezan et al. 2017).
A strand of the literature concluded that energy commodities harm the environment due to their excessive consumption patterns, i.e., crude oil, natural gas, and gasoline throughout the world. Initially, Managi and Okimoto (2013) documented that increases in crude oil prices have a positive impact on other potential sustainable energy firms because escalating energy crises have driven the global economy to seek alternative energy sources. Nathaniel et al. (2019) explored energy consumption by applying the ARDL estimation approach and their findings reveal that economic growth and financial development have a devastating impact on the environment in the short run. Similarly (Maghyereh et al. 2019), documented that in the last decade, the main reason for fluctuations in oil prices was environmental sustainability, as crude oil is not only a primary energy resource but also has a wide range of environmental impacts due to carbon emissions during the combustion process, which results in increased global warming. Thus, fluctuations in crude oil prices have always been a major concern for portfolio managers, global investors, and policymakers during various energy crises. As dynamic fluctuations in crude oil have a substantial impact on investor’s decisions regarding production plans, assets allocation, and implementation of regulations, it has an overall influential impact on the global economy (Aslam et al. 2022; Inshakov et al. 2019; Sorknæs et al. 2020).
More specifically, a range of studies have explored volatility spillovers using the TVP-VAR approach among financial markets during the pandemic period. For instance, Samitas et al. (2022a) recently found instant financial contagion due to the COVID-19 financial market using network analysis. Likewise, identical spillover patterns from the fine wine market to global financial markets were uncovered (Samitas et al. 2022d). Focusing on the COVID-19 period, Zhang et al. (2021) highlighted that COVID-19 has a significant impact on the financial contagion effect and that volatility connectedness heightened during the stress period. Similarly, using the TVP-VAR model, Haq (2022) revealed escalating volatility spillover of cryptocurrency environmental attention toward sustainable financial markets during the COVID-19 pandemic period. However, no study to date has examined the volatility spillovers of rare earths markets and energy commodities to sustainable financial markets considering pandemic episodes.
From the above discussion, we infer two observations. First, the dynamic connectedness between financial markets has been extensively developed; with heterogenous transmission patterns revealed over time. However, earlier research is inclusive and ignores empirical evidence on the volatility spillovers of rare earths, energy, and sustainable financial markets. Second, several recent studies investigated whether the dynamic connectedness and financial contagion effect of rare earths, energy commodities, and sustainable financial markets is underdeveloped, considering the COVID-19 health crisis. However, the earlier research neglected to study the dynamic connectedness between these financial markets considering the COVID-19 episode.

3. Material and Methods

3.1. Data

We considered daily first-differenced returns1 encompassing from 1 January 2018 to 20 June 2022. Since the country-wide rare earth data is not available for more years, the data set data was used according to the rare earth indices. Our dataset covers eleven series, which include rare earth markets, sustainable markets, and energy commodities. First, it composes four sustainable financial market indices, namely Dow Jones Australia Sustainability Index (ASI), China Sustainability Index (CSI), US Sustainability Index (USSI), and Dow Jones Sustainability World Index (SWI) as proxies for the global sustainable financial market and country-wide sustainable financial markets for Australia, China, and the USA. Second, it combines four rare earth market indices, namely, the China Rare Earth Element Index (CHNREE), Lynas Rare Earth Australia Index (LYC), US Rare Earth Index (USREE), and MVIS Global Rare Earth Index (MVISGREI) as proxies for global rare earth market and country-wide rare earth markets for Australia, China, and the USA. In the end, it comprises three energy commodities, namely WTI Crude oil price index (WTI), NYSE Gasoline Funds (GAS), and Natural Gas NYMEX, (NGAS) as proxies for energy commodity markets. The data were sourced from Bloomberg. This data sample reveals the financial contagion during the COVID-19 pandemic in Australia China and USA.

3.2. TVP-VAR Approach

A multivariate time series time-varying parameter—vector autoregression model (TVP-VAR) model was initially established by (Primiceri 2005). We employed one of the widely accepted and effective connectedness models, Antonakakis and Gabauer (2017) Dynamic TVP-VAR connectedness approach. The dynamic connectedness approach is considered in recent studies (Bouri et al. 2021b; Hadi et al. 2022; Karim and Naeem 2022; Liu 2020) to explore time-varying connectedness and volatility spillovers. This approach has several key benefits. The model has the distinct feature of incorporating nonlinear time-varying relationships between economic variables by allowing time variations for both coefficients and variance–covariance matrix (He et al. 2019; Nakajima 2011; Samitas et al. 2021; Samitas et al. 2022d). In other words, it can adjust immediately to the events, hence incorporating the scholastic volatility element (Antonakakis and Gabauer 2017). TVP-VAR model has a strong ability to capture structural breaks (Hadi et al. 2022). Therefore, it provides important reasons to understand the connectedness among rare earth elements, energy commodities, and sustainability indices. In sum, the TVP-VAR dynamic connectedness approach identifies whether the large fluctuations have come from small fluctuations or the impact of financial contagion or volatility spillover. Overall, the TVP-VAR model uncovers direct output in terms of net recipient or transmitter, TO-Others, and FROM-others which enable to identify of volatility spillover and financial contagion effect (Balcilar et al. 2021; Bouri et al. 2021c; Haq 2022; Haq et al. 2022).
According to Antonakakis et al. (2020); Antonakakis and Gabauer (2017); Haq (2022); Nakajima (2011) standard TVP-VAR model can be described as follows:
y t = α t + B 1 , t y t 1 + B 2 , t y t 2 + + B n , t y t n + A t 1 t ε t  
In the above-mentioned equation y t is indicating k × 1 vector of observed variables; where   B 1 , t , B 2 , t , …,   B n , t representing k × k coefficient matrices, ε t captured disturbance term, whereas A t is a lower triangular matrix as expressed in Equation (2)
A t = ( 1 0 0 a 21 , t 0 a k 1 , t a k k 1 , t 1 )
t stands for diagonal matrix in Equation (3)
t = [ σ 1 , t 0 0 0 0 0 0 σ n , t ]
In Equation (3) σ i , t is the standard deviation of structural variations and I = 1,2, …, n.
Following, (Degiannakis et al. 2018; Jebabli et al. 2014; Toparlı et al. 2019), this model can be extended in such a way:
y t = X t β t + A t 1 t ε t    t = s + 1 , , n
Here, β t ,   A t ,     and     t all are time-varying parameters, we consider α t as a stacked vector of lower triangular elements in A t , h t = ( h 1 t ,   h 2 t ,   ,   h n t ) ,   where   h k t = log σ k t 2 and k = 1,2, …, n and t = s + 1, …, n. Therefore, we suppose that parameters in Equation (4) are determined by the random walk process described in y following equations.
β t + 1 = β t + φ β t
α t + 1 = α t + φ α t
h t + 1 = h t + φ h t
β s + 1 ~   N ( φ β o , β o )
α s + 1 ~   N ( φ α o , α o )
h s + 1 ~   N ( φ h o , h o )
The random walk process assumption enables both permanent and temporary variations in the coefficients (Zhou et al. 2020). In this way, we can capture both the factors of structural breaks and gradual changes. The model innovation in the variance-covariance matrix is a block diagonal as represented in the below-mentioned equation:
( ε t φ β t φ α t φ h t ) ~ N ( 0 , ( 1 0 0 0 0 β 0 0 0 0 α 0 0 0 0 h ) )
Using stochastic volatility, each parameter must be set following maximum likelihood estimation. In this way, sampling was simulated by using Markov chain Monte Carlo estimation based on Bayesian inference (Chen et al. 2022; Huang et al. 2022; Liu et al. 2020).

4. Empirical Results

The paper investigates the dynamic connectedness of rare earth elements and energy commodities with major sustainability indices, i.e., Dow Jones World Sustainability Index (SWI), USA Sustainability Index (USSI), China Sustainability Index (CSI), and Dow Jones Australia Sustainability Index (ASI). The study considered TVP-VAR time-varying approach from 2018 to 2022.

4.1. Preliminary Statistics

The preliminary statistics reported in Table 2, involve the estimation of mean, standard deviation, skewness, kurtosis, Jerque–Bera Test, and stationarity test of Augmented Dicky–Fuller. The mean values for all return series are positive and near zero, indicating positive access returns. The China-REE showed the highest standard deviation (0.082) and SWI and ASI demonstrated the lowest standard deviation (0.010) for each. Indicating that rare earth assets are more volatile however sustainable or green finances are stable with less exposure. Returns showed a mixed distribution trend across different asset classes where Chin-REE, NGAS, and WTI are positively skewed and negatively skewed for the rest of the assets, and leptokurtic with fat tails indicates stationarity among time series over time. The fat tails, non-normal distribution, and stationarity among all return series can be observed in Figure 1. Interestingly, noticeable large fluctuations can be observed near the end of 2019 and the beginning of 2020, which indicated the spillover effect of the global uncertainty event of the COVID-19 outbreak. These findings also corroborate earlier research where studies have supported the idea that COVID-19 has fostered financial and economic uncertainty across the globe (Haq 2022; Haq et al. 2021b; Mensi et al. 2022; Tiwari et al. 2022).
The output of the Jerque–Bera test satisfied the condition of non-normality, where the null hypothesis of the normal distribution is rejected, hence all return series are non-normally distributed. In addition, to confirm the stationarity among returns series, the paper considered the Augmented Dicky–Fuller (ADF) test of stationarity. It is among the commonly used statistical measure to estimate stationarity. The output of ADF tests confirmed that all returns series are stationary over time, hence the null hypothesis of non-stationarity was rejected with a 0.001% significance level.
Table 3 reports the unconditional correlation for all returns series. Generally, the correlation between sustainability indices and energy commodities is moderate/weak positive and negative. On the other hand, the magnitude of the correlation between rare earth elements and substantiality indices was slightly higher than positive, and rare negative signs were found. These findings validate strong diversification and hedging opportunities across these financial assets. In comparison, energy commodities showed more negative signs, indicating the hedging ability of energy commodities for sustainability indices.

4.2. Evidence from Dynamic TVP-VAR Approach

Table 4 reports the output of dynamic connectedness (TVP-VAR) for rare earth elements and sustainability indices from 2018 to 2022. There are three elements in total connectedness tables, i.e., “TO”, “FROM”, and “NET”. The value of “TO” is the aggregate of each column indicating the contribution of each financial asset/market to the others. In contrast, the “FROM” value is the sum of each row suggesting the level of contribution of each financial asset/market to the overall system. In the last, “NET” is the difference between these two (“TO” and “FROM”). Generally, the “NET” value identifies the “transmitter” and “recipient” roles. More specifically, the positive “NET” value indicates the transmitter role, and the negative “NET” value shows the recipient role of system-wide volatility spillover. The total connectedness index (TCI) or total system-wide connectedness between rare earth elements and energy commodities is reported at 14.17%, where CHNREE is the leading transmitter of volatility spillover among other financial asset/markets followed by USREE and USSI. In contrast, MVISGREI and ASI are major recipients of volatility transmitters, having net connectedness values of 5.88%, and 2.57%, respectively. LYC, CSI, and SWI are least connected; however, they are transmitters in the system of various financial assets/markets. Overall, CHNREE and USREE are the major net contributors to volatility transmission, and MVISGREI, ASI, LYC, CSI, and SWI are net receivers or receipts of volatility spillovers. Generally, the connectedness and spillover from rare earth elements to sustainable financial markets are lower and weak, suggesting that rare earth elements are potential instruments for diversification in line with Haq et al. (2021b). In addition, these findings corroborate with Reboredo and Ugolini (2020) who documented that rare earth stocks are weakly connected with commodity and financial markets. Finally, current findings are concurrent with the idea of Zheng et al. (2021) who emphasized that the development of the rare earth market is beneficial in risk management against financial market uncertainty.
Table 5 presents the findings of the TVP-VAR model for energy commodities and sustainability indices. The total connectedness index (TCI) is reported at 10.09% where GAS is the leading contributor of volatility spillover among other financial markets 2.97%, followed by WTI and NGAS. On the other hand, SWI is the leading receipt with 2.88% of volatility transmission from other financial assets/markets. In addition, ASI and CSI are also major volatility recipients after SWI. Therefore, GAS, WTI, and NGAS are volatility net transmitters whereas SWI, CSI, and ASI are net receivers or recipients of volatility spillovers. Generally, the total connectedness between energy commodities (GAS, WTI, and NGAS) and sustainability indices (SWI, CSI, ASI, and USSI) is weak. These results are consistent with earlier research where energy commodities presented the least volatility spillover effect to the green bond market (Tsagkanos et al. 2022). In addition, energy commodities are negatively correlated with clean energy stocks, suggesting the hedging potential of energy commodities (Tang and Aruga 2021).

4.3. Time-Varying Total Connectedness

Figure 2 represents the total connectedness with the time-variant feature of rare earth elements (CHREE, USREE, LYC, and MVISGREI) and energy commodities (GAS, WTI, NGAS) with sustainability indices (SWI, CSI, USSI, ASI) from 2018 to 2022. Plots for dynamic total connectedness uncover two key findings. Firstly, the connectedness in both panels (Panel A and Panel B) is heterogenous and dynamic over time, hence supporting the idea of scholastic volatility in financial assets/markets. This finding corroborates with earlier studies (Bouri et al. 2021a; Fernandez 2017; Hau et al. 2022; Reboredo and Ugolini 2020; Song et al. 2021; Zheng et al. 2021) where the connectedness between financial markets followed heterogenous pattern across time. Noticeably, it supports the idea that markets are not efficient, hence following a random course over time (Kang et al. 2022; Shahzad et al. 2020). In addition, dynamic REE markets require effective hedging strategies due inherently risky nature (Song et al. 2021), and no such option is available to act as a hedge or safe haven for REE volatility (Proelss et al. 2020). More specifically it relates to Haq et al. (2021b), who found a dynamic conditional correlation between rare earth elements, clean energy stocks, and green bonds using the DCC-GARCH model. Secondly, the connectedness or volatility transmission sparks during the crisis period or economically stressed period and several normalized circumstances of financial markets. It supports the notion that the volatility spillover fosters during the global uncertainty or COVID-19 period (Ajmi et al. 2021; Hazgui et al. 2021; Maghyereh and Abdoh 2022; Rubbaniy et al. 2022). More specifically, concurrent with recent studies, several studies (Dai and Zhu 2022; Hau et al. 2022; Song et al. 2021; Zhou et al. 2022) documented a similar volatility transmission hike during the COVID-19 pandemic episode, indicating the higher financial market integration in the turbulent COVID-19 days (Haq et al. 2021a). In overview, dynamic connectedness over time (Panel A and Panel B) indicates that global financial markets are sensitive to crisis periods, i.e., COVID-19 in our case and market volatility is driven by turbulent periods. In this way, the volatility connectedness and spillover become high during abnormal market conditions and the market becomes stable when markets return to the new normal.
Figure 3 (Panel A) presents the dynamic net connectedness of rare earth elements and sustainability indices (Panel A) and energy commodities and sustainability indices (Panel B). Considering Panel A, where results recall the net contribution of CHREE and USREE during the sample period. The net transmitter role of CHREE corroborates with the findings of Reboredo and Ugolini (2020), who suggest China has the largest rare earth resources and monopolistic control over them. Therefore, China’s rare earth index is a major contributor to volatility transmission to other markets. In addition, USREE is the second contributor of volatility transmission to sustainability indices. Because, the US is a major importer of rare earth metals or elements due to the huge consumption of information technology (Kennedy 2019) and clean energy applications (Song et al. 2021), i.e., hybrid vehicles. Additionally, the US is among one key producer of rare earth elements. This is a major reason, why USREE transmits system-wide volatility. Meanwhile, our findings are consistent with those (Reboredo and Ugolini 2020; Zhou et al. 2022).
Alternatively, MVISGREI, LYC, ASI, CSI, and SWI show negative spillover in general, suggesting that these assets/markets are net receivers of volatility spillovers. MVISGREI, as a NET receiver of volatility spillovers, contradicts Özdurak and Ulusoy (2020) and Haq et al. (2021b) where MVISHREI showed positive connectedness with financial markets, i.e., green bond and clean energy markets. Generally, sustainability indices are volatility recipients because rare earth elements adversely affect sustainable features pinned with sustainable financial assets/markets concurrent with Klinger (2018) where rare earth production needs to be revised for better and sustainable output to promote sustainability and green concerns. In addition, current findings corroborate with Reboredo and Ugolini (2020), where rare earths are weakly connected with sustainable investment, i.e., clean energy.
Meanwhile, Figure 3 (Panel B) demonstrates time-varying NET connectedness among energy commodities and sustainability indices. Time-varying NET showed that all considered energy commodities such as GAS, NGAS, and WTI are a net contributor to volatility transmission to China, Australia’s sustainable markets, and world sustainability. The net transmitter spillover effect of GAS, WTI, and NGAS, concurrent with earlier findings where marginal volatility spillover was found from energy commodities to financial markets (Aziz et al. 2020). Volatility transmission was more pronounced during the turmoil period among energy commodities (Zhang et al. 2020). Energy commodities and the energy sector were found to be a source of volatility spillover to subsectors (Ameur et al. 2021) and significant spillover exists from energy commodities to agriculture commodities (Ji et al. 2018). Likewise, energy commodities showed strong connectedness with Chinese stock markets during normal and financial turbulent periods (COVID-19) (Dai and Zhu 2022). On the other hand, the time-varying connectedness for sustainability indices i.e., CSI, SAI, and SWI indicate negative spillover, suggesting that they are net receivers of spillovers. Sustainability indices (China, Australia, world) are NET recipients of spillover from energy commodities, corroborates with energy commodities adversely affect sustainability and environment, so do the same for sustainable financial assets or markets. Likewise, these findings are consistent with Haq (2022) where SAI and SWI are consistent recipients of volatility from cryptocurrency-related environmental attention (Wang et al. 2022). Additionally, our results are consistent with Mensi et al. (2017). Figure A1 and Figure A2 represent the total directional volatility connectedness “TO others” and “FROM” others, respectively, for each panel (Panel A and Panel B). These findings are consistent with total connectedness in Table 4 and Table 5, where the value of “TO” is the aggregate of each column indicating the contribution of each financial asset/market to the others. In contrast, the “FROM” value is the sum of each row suggesting the level of contribution of each financial asset/market to the overall system. These findings are in line with total connectedness in Table 4 and Table 5 (see the first row and last column of Table 4 and Table 5, respectively).
Figure 4 present the bivariate network connectedness for Panel A and Panel B. In network plots, the blue node indicates the transmitter role of volatility spillover whereas the yellow nodes signify the receipt role of volatility spillover. The size of the node determines the strength or weakness of the spillover magnitude where the fatter the node the stronger the volatility transmission and wise versa. Additionally, yellow (blue) circles indicate the respective market is recipients (transmitter). Generally, these results of network connectedness are consistent with Table 4 and Table 5 where results for the total connectedness index are reported. More specifically, CHREE and USREE are major contributors to volatility transmission and sustainability indices are volatility receivers. On the other hand, GAS, WTI, and NGAS are volatility transmitters, and a majority of sustainability indices are receivers. These results indicate that the inherent high volatility feature of rare earth markets (China, USA, and Australia) fosters volatility among green financial assets, i.e., USSI, CSI ASI, and SWI. In this way, REE’s volatility might dampen the aim of sustainable or green investments in China, the USA, Australia, and global sustainability. These findings are concurrent with those (Klinger 2018) who emphasized that sustainability is a key issue in current rare earth production models. In addition, the increasing volatility in crude oil prices (Papathanasiou et al. 2022a, 2022c) might negatively impact major financial markets (Awan et al. 2021).

5. Conclusions and Policy Implications

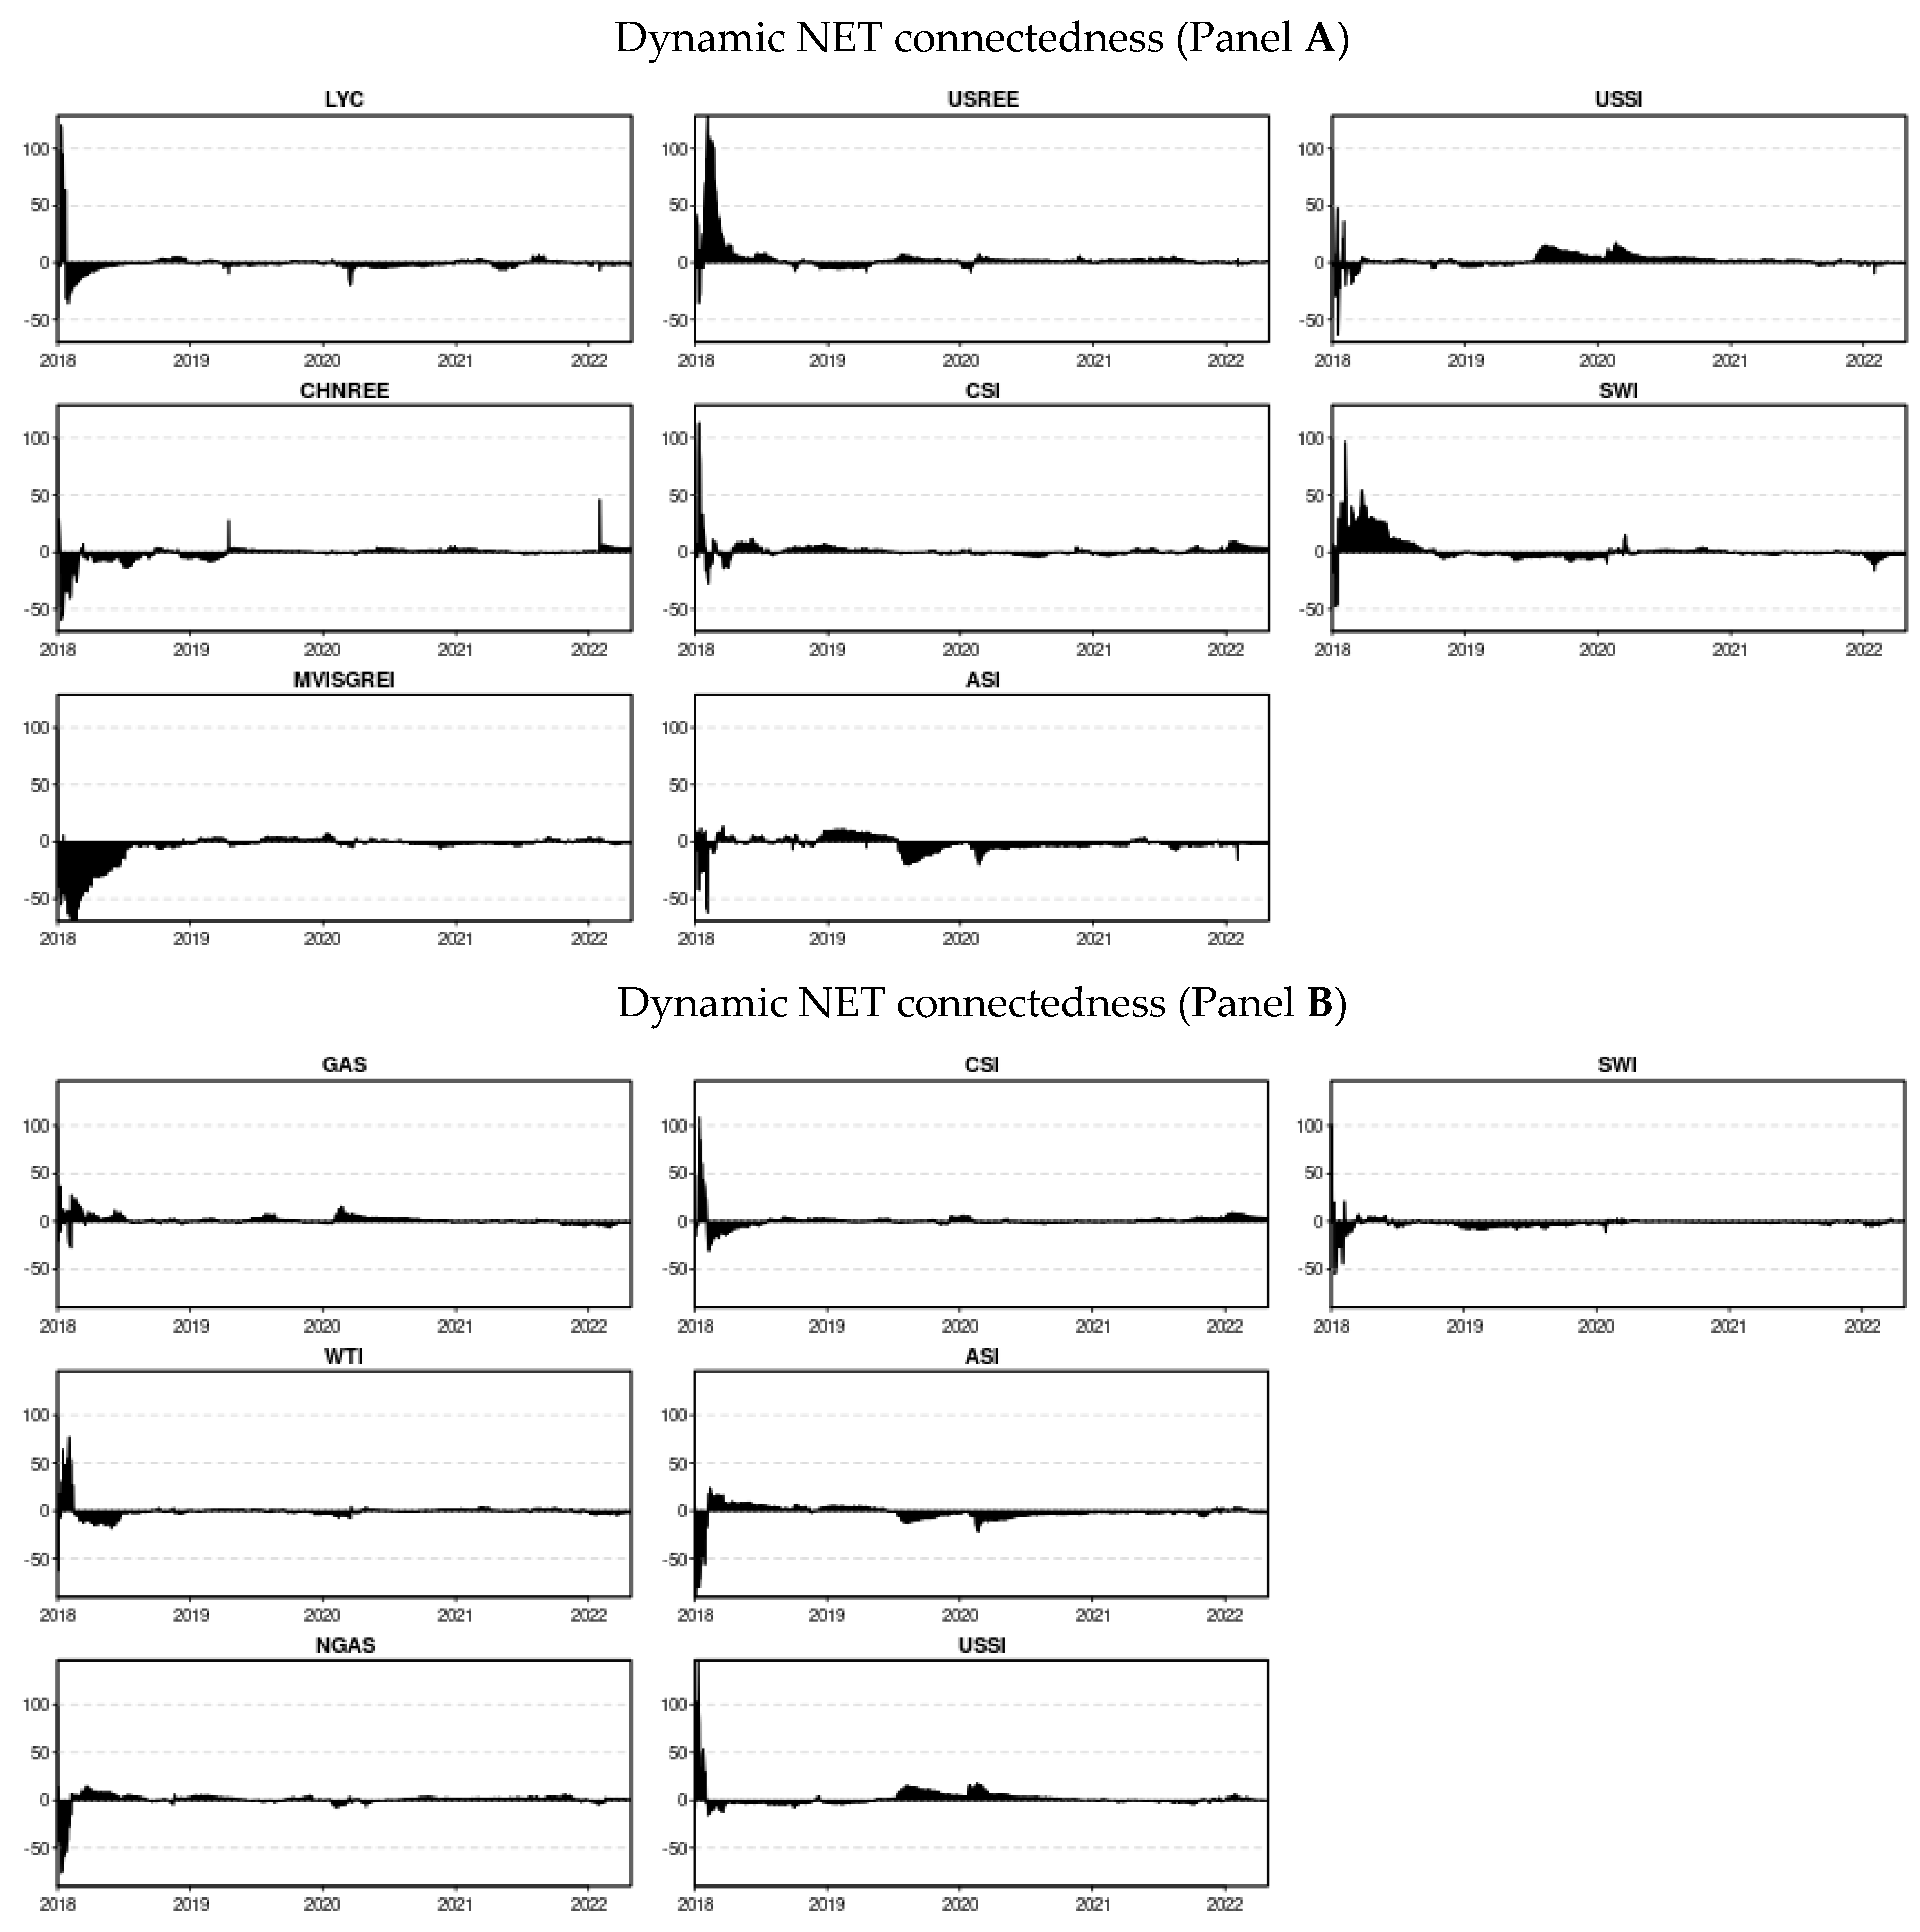
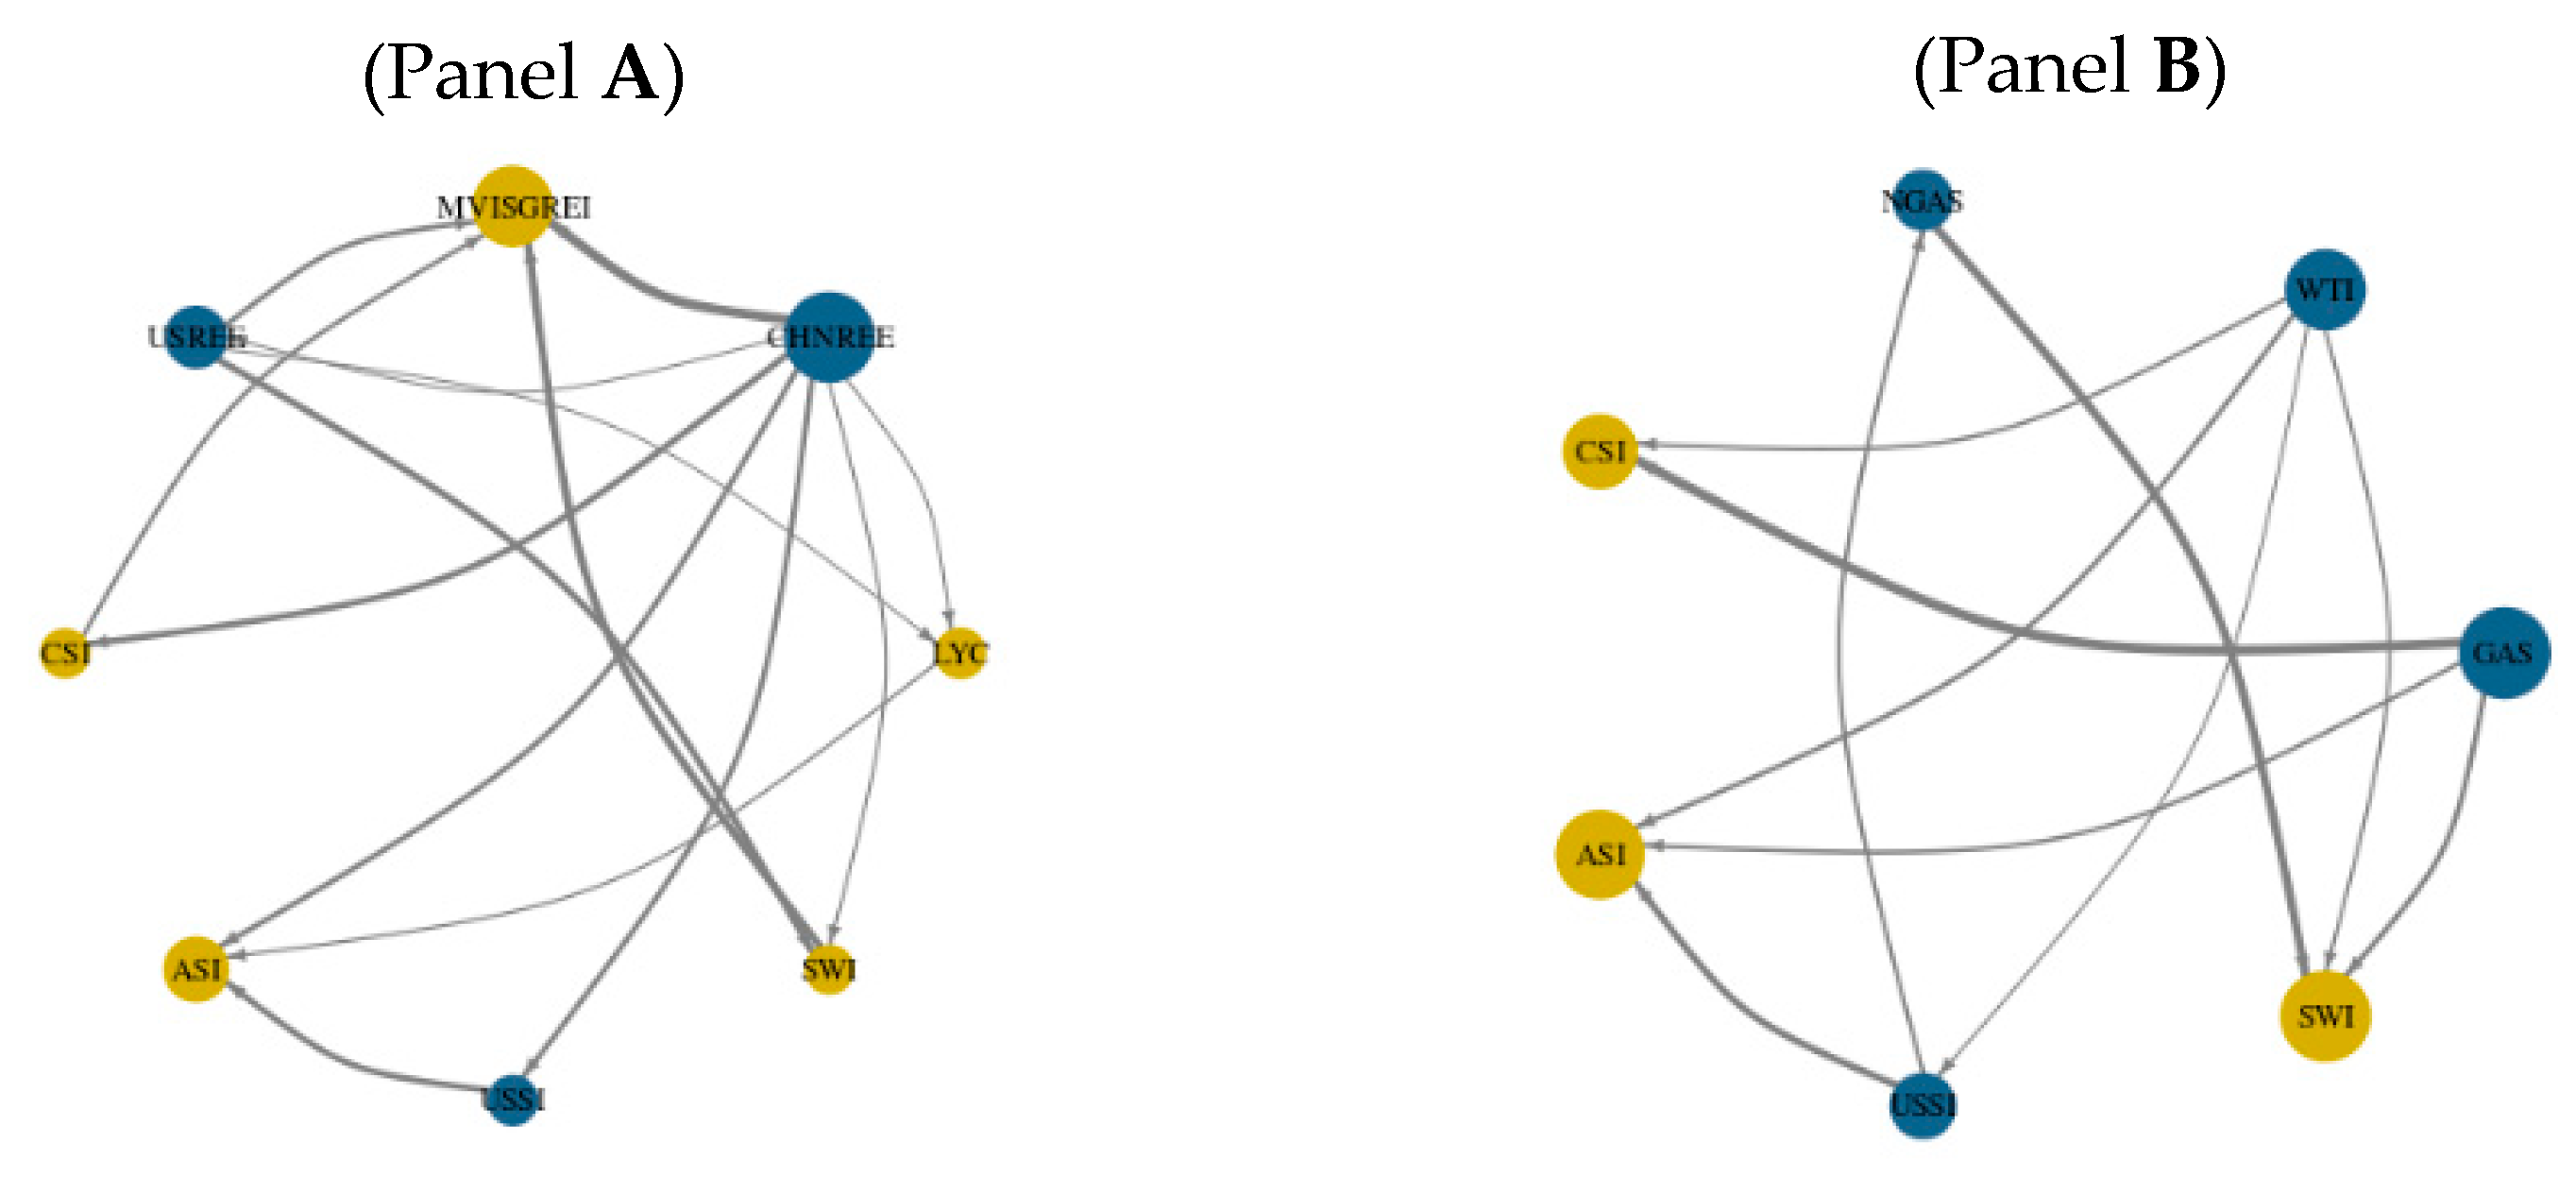
Our study provides evidence of the dynamic connectedness of rare earth elements (US, China, Australia), energy commodities (Gas, Crude oil, and Natural gas), and major sustainability indices (US, China, Australia) using the TVP-VAR connectedness approach from 2018 to 2022. We further investigated the role of global rare earth elements on world sustainability. Our findings uncover that CHREE and USREE are major transmitters of volatility spillovers whereas MVISGREI, ASI, CSI, SWI, and LYC are net recipients of spillovers. Besides, Gas, WTI, and NGAS (energy commodities) are net contributors to volatility transmission, and CSI, ASI, and SWI are net receivers of volatility spillovers. The time-varying connectedness presented a spillover spike around the outbreak of the COVID-19 pandemic. The NET connectedness reiterated that CHREE and USREE are NET volatility transmitters whereas the remaining markets are presented as NET recipients. In addition, GAS, WTI, and NGAS are NET volatility transmitters however, recent the markets are demonstrated as NET recipients. In addition, MVISGREI and DJSWI are receivers of volatility from other markets. The findings stipulate intriguing implications for investors, portfolio managers, financial market participants, and policymakers. The total connectedness index suggests weak connectedness in both cases, suggesting that sustainable investments are potential sources of hedging the inherent high volatility of rare earths (Song et al. 2021) among Australian and Chinese sustainable markets. In general, the majority of spillover of energy commodities and rare earth elements to the sustainable market is weak, suggesting the diversification opportunities of energy commodities and rare earth elements for Australia, China, and the global sustainable market. In this way, investors (institutional and individual) and portfolio managers can choose markets with greater diversification potential. The connectedness between energy commodities and sustainable markets is considerably weaker than between rare earths and sustainable financial markets. Due to this, there exist significant diversification and risk management opportunities for conventional and sustainable investors. However, energy commodities show stronger diversification potential than rare earth elements for sustainable financial assets. On the other hand, energy commodities and rare earths markets are sources of worsening sustainability and increasing volatility for the Australia sustainability index, China sustainability index, and Dow Jones sustainability world index. More specifically, global, Chinese, and Australian sustainable financial markets are most sensitive and vulnerable to carbon emissions, climate change, and circumventing environmental disasters. Hence, policymakers and regulators need to design policies and regulations to restrain the negative impact of rare earths and energy markets on the global sustainable economy and sustainable development goals. Moreover, enhancement of governance can substantially decrease the vulnerability of carbon risk (Tran et al. 2022). The current need is encouragement of green and sustainable investments to dampen the devasting role of rare earths and energy commodities.
Our findings are basically based on the time-varying method, i.e., TVP-VAR model which can only measure volatility connectedness across time. However, conventional and sustainable investors have a diverse range of investment objectives across investment horizons, i.e., short, medium, and long (Ul Haq et al. 2022). Therefore, future research should consider a wavelet coherence approach to examine the co-movement across both time and frequency settings. Our study explored the financial contagion effect of rare earths and energy commodities on major sustainable financial markets; however, future research could extend the sample and add clean energy stocks and green bonds (Haq et al. 2021b), considering the COVID-19 crisis (Akhtaruzzaman et al. 2021a). Studying the hedge or safe-haven role of gold (Akhtaruzzaman et al. 2021b) for rare earth markets could be another possible extension of the topic.

Author Contributions

Conceptualization, I.U.H., N.H. and H.N.; methodology, I.U.H. and A.M.; software, A.M. and S.S.; validation, T.K., W.W. and S.S.; formal analysis, I.U.H.; investigation, A.M. and T.K.; resources, W.W.; data curation, H.N. and N.H.; writing—original draft preparation, I.U.H. and H.N.; writing—review and editing, I.U.H. and N.H.; visualization, A.M.; supervision, I.U.H.; project administration, I.U.H.; funding acquisition, S.S., T.K. and W.W. All authors have read and agreed to the published version of the manuscript.

Funding

This research received no external funding.

Institutional Review Board Statement

Not applicable.

Informed Consent Statement

Not applicable.

Data Availability Statement

The data are available upon request from first author.

Conflicts of Interest

The authors declare no conflict of interest.

Appendix A

Figure A1. Total directional connectedness TO Others. Note: (Panel A) represents the Total directional connectedness TO Others among rare earth elements and sustainability indices, and (Panel B) represents the Total directional connectedness TO Others among energy commodities and sustainability indices.
Ijfs 10 00076 g0a1aIjfs 10 00076 g0a1b
Figure A2. Total directional connectedness FROM Others (Panel B). Note: (Panel A) represents the Total directional connectedness FROM Others among rare earth elements and sustainability indices, and (Panel B) represents the Total directional connectedness FROM Others among energy commodities and sustainability indices.
Ijfs 10 00076 g0a2aIjfs 10 00076 g0a2b

Note

1
R i , t = ( ln ( P i , t ) ln ( P i , t 1 ) ) .

References

  1. Ajmi, Hechem, Nadia Arfaoui, and Karima Saci. 2021. Volatility transmission across international markets amid COVID 19 pandemic. Studies in Economics and Finance 38: 926–45. [Google Scholar]
  2. Akhtaruzzaman, Md, Sabri Boubaker, and Ahmet Sensoy. 2021a. Financial contagion during COVID–19 crisis. Finance Research Letters 38: 101604. [Google Scholar] [CrossRef] [PubMed]
  3. Akhtaruzzaman, Md, Sabri Boubaker, Brian M. Lucey, and Ahmet Sensoy. 2021b. Is gold a hedge or a safe-haven asset in the COVID–19 crisis? Economic Modelling 102: 105588. [Google Scholar]
  4. Akhtaruzzaman, Md, Sabri Boubaker, Mardy Chiah, and Angel Zhong. 2021c. COVID-19 and oil price risk exposure. Finance Research Letters 42: 101882. [Google Scholar]
  5. Ameur, Hachmi Ben, Zied Ftiti, and Waël Louhichi. 2021. Intraday spillover between commodity markets. Resources Policy 74: 102278. [Google Scholar] [CrossRef]
  6. Antonakakis, Nikolaos, and David Gabauer. 2017. Refined measures of dynamic connectedness based on TVP-VAR. Available online: https://mpra.ub.uni-muenchen.de/id/eprint/78282 (accessed on 12 July 2022).
  7. Antonakakis, Nikolaos, Ioannis Chatziantoniou, and David Gabauer. 2020. Refined measures of dynamic connectedness based on time-varying parameter vector autoregressions. Journal of Risk and Financial Management 13: 84. [Google Scholar] [CrossRef]
  8. Aslam, Faheem, Paulo Ferreira, Haider Ali, and Ana Ercília José. 2022. Application of Multifractal Analysis in Estimating the Reaction of Energy Markets to Geopolitical Acts and Threats. Sustainability 14: 5828. [Google Scholar]
  9. Awan, Tahir Mumtaz, Muhammad Shoaib Khan, Inzamam Ul Haq, and Sarwat Kazmi. 2021. Oil and stock markets volatility during pandemic times: A review of G7 countries. Green Finance 3: 15–27. [Google Scholar]
  10. Aziz, Tariq, Ranjeeta Sadhwani, Ume Habibah, and Mazin AM Al Janabi. 2020. Volatility spillover among equity and commodity markets. SAGE Open 10: 2158244020924418. [Google Scholar] [CrossRef]
  11. Balali, Yasaman, and Sascha Stegen. 2021. Review of energy storage systems for vehicles based on technology, environmental impacts, and costs. Renewable and Sustainable Energy Reviews 135: 110185. [Google Scholar]
  12. Balaram, V. 2019. Rare earth elements: A review of applications, occurrence, exploration, analysis, recycling, and environmental impact. Geoscience Frontiers 10: 1285–303. [Google Scholar]
  13. Balcilar, Mehmet, David Gabauer, and Zaghum Umar. 2021. Crude Oil futures contracts and commodity markets: New evidence from a TVP-VAR extended joint connectedness approach. Resources Policy 73: 102219. [Google Scholar]
  14. Barakos, G., and H. Mischo. 2017. A review of misleading methods and biased practices in evaluating the feasibility of rare earth mining projects. Paper presented at the 28th SOMP Annual Meeting & Conference, Torino, Italy, July 3. [Google Scholar]
  15. Beylot, Antoine, Dominique Guyonnet, Stéphanie Muller, Stéphane Vaxelaire, and Jacques Villeneuve. 2019. Mineral raw material requirements and associated climate-change impacts of the French energy transition by 2050. Journal of Cleaner Production 208: 1198–205. [Google Scholar]
  16. Bouri, Elie, Kakali Kanjilal, Sajal Ghosh, David Roubaud, and Tareq Saeed. 2021a. Rare earth and allied sectors in stock markets: Extreme dependence of return and volatility. Applied Economics 53: 5710–30. [Google Scholar]
  17. Bouri, Elie, Oguzhan Cepni, David Gabauer, and Rangan Gupta. 2021b. Return connectedness across asset classes around the COVID-19 outbreak. International Review of Financial Analysis 73: 101646. [Google Scholar]
  18. Bouri, Elie, Xiaojie Lei, Naji Jalkh, Yahua Xu, and Hongwei Zhang. 2021c. Spillovers in higher moments and jumps across US stock and strategic commodity markets. Resources Policy 72: 102060. [Google Scholar]
  19. Brahim, Jamal Ait, Sara Ait Hak, Brahim Achiou, Rachid Boulif, Redouane Beniazza, and Rachid Benhida. 2022. Kinetics and mechanisms of leaching of rare earth elements from secondary resources. Minerals Engineering 177: 107351. [Google Scholar]
  20. Cai, Xiang, Bangzhu Zhu, Haijing Zhang, Liang Li, and Meiying Xie. 2020. Can direct environmental regulation promote green technology innovation in heavily polluting industries? Evidence from Chinese listed companies. Science of the Total Environment 746: 140810. [Google Scholar] [PubMed]
  21. Cetin, Murat, Eyyup Ecevit, and Ali Gokhan Yucel. 2018. The impact of economic growth, energy consumption, trade openness, and financial development on carbon emissions: Empirical evidence from Turkey. Environmental Science and Pollution Research 25: 36589–603. [Google Scholar] [PubMed]
  22. Chen, Ruoyu, Najaf Iqbal, Muhammad Irfan, Farrukh Shahzad, and Zeeshan Fareed. 2022. Does financial stress wreak havoc on banking, insurance, oil, and gold markets? New empirics from the extended joint connectedness of TVP-VAR model. Resources Policy 77: 102718. [Google Scholar]
  23. Chen, Zhe, Zhongzhong Hu, and Kai Li. 2021. The spillover effect of trade policy along the value Chain: Evidence from China’s rare earth-related sectors. The World Economy 44: 3550–82. [Google Scholar] [CrossRef]
  24. Dai, Zhifeng, and Haoyang Zhu. 2022. Time-varying spillover effects and investment strategies between WTI crude oil, natural gas and Chinese stock markets related to belt and road initiative. Energy Economics 108: 105883. [Google Scholar] [CrossRef]
  25. Danish, Mohammed, and Tanweer Ahmad. 2018. A review on utilization of wood biomass as a sustainable precursor for activated carbon production and application. Renewable and Sustainable Energy Reviews 87: 1–21. [Google Scholar] [CrossRef]
  26. De Koning, Arjan, René Kleijn, Gjalt Huppes, Benjamin Sprecher, Guus Van Engelen, and Arnold Tukker. 2018. Metal supply constraints for a low-carbon economy? Resources, Conservation and Recycling 129: 202–8. [Google Scholar] [CrossRef]
  27. Degiannakis, Stavros, George Filis, and Vipin Arora. 2018. Oil prices and stock markets: A review of the theory and empirical evidence. The Energy Journal 39: 85–130. [Google Scholar] [CrossRef]
  28. Du, Kerui, Pengzhen Li, and Zheming Yan. 2019. Do green technology innovations contribute to carbon dioxide emission reduction? Empirical evidence from patent data. Technological Forecasting and Social Change 146: 297–303. [Google Scholar] [CrossRef]
  29. Dudley, Bob. 2018. BP statistical review of world energy. BP Statistical Review 6: 00116. [Google Scholar]
  30. Dushyantha, Nimila, Nadeera Batapola, I. M. S. K. Ilankoon, Sudath Rohitha, Ranjith Premasiri, Bandara Abeysinghe, Nalin Ratnayake, and Kithsiri Dissanayake. 2020. The story of rare earth elements (REEs): Occurrences, global distribution, genesis, geology, mineralogy and global production. Ore Geology Reviews 122: 103521. [Google Scholar] [CrossRef]
  31. Ehigiamusoe, Kizito Uyi, and Hooi Hooi Lean. 2019. Effects of energy consumption, economic growth, and financial development on carbon emissions: Evidence from heterogeneous income groups. Environmental Science and Pollution Research 26: 22611–24. [Google Scholar] [CrossRef]
  32. Evans, John L., and Stephen H. Archer. 1968. Diversification and the reduction of dispersion: An empirical analysis. The Journal of Finance 23: 761–67. [Google Scholar]
  33. Fernandez, Viviana. 2017. Rare-earth elements market: A historical and financial perspective. Resources Policy 53: 26–45. [Google Scholar]
  34. Fishman, Tomer, Rupert J. Myers, Orlando Rios, and T. E. Graedel. 2018. Implications of emerging vehicle technologies on rare earth supply and demand in the United States. Resources 7: 9. [Google Scholar] [CrossRef]
  35. Gaustad, Gabrielle, Eric Williams, and Alexandra Leader. 2021. Rare earth metals from secondary sources: Review of potential supply from waste and byproducts. Resources, Conservation and Recycling 167: 105213. [Google Scholar]
  36. Hadi, Dlawar Mahdi, Muhammad Abubakr Naeem, and Sitara Karim. 2022. The exposure of the US tourism subsector stocks to global volatility and uncertainty factors. Current Issues in Tourism, 1–14. [Google Scholar] [CrossRef]
  37. Haq, Inzamam Ul. 2022. Cryptocurrency Environmental Attention, Green Financial Assets, and InformationTransmission: Evidence from COVID-19 Pandemic. Energy Research Letters 3. early view. [Google Scholar]
  38. Haq, Inzamam Ul, and Tahir Mumtaz Awan. 2020. Impact of e-banking service quality on e-loyalty in pandemic times through interplay of e-satisfaction. Vilakshan-XIMB Journal of Management 17: 39–55. [Google Scholar]
  39. Haq, Inzamam Ul, Apichit Maneengam, Supat Chupradit, Wanich Suksatan, and Chunhui Huo. 2021a. Economic policy uncertainty and cryptocurrency market as a risk management avenue: A systematic review. Risks 9: 163. [Google Scholar]
  40. Haq, Inzamam Ul, Paulo Ferreira, Apichit Maneengam, and Worakamol Wisetsri. 2022. Rare Earth Market, Electric Vehicles and Future Mobility Index: A Time–frequency Analysis with Portfolio Implications. Risks 10: 137. [Google Scholar]
  41. Haq, Inzamam Ul, Supat Chupradit, and Chunhui Huo. 2021b. Do Green Bonds Act as a Hedge or a Safe Haven against Economic Policy Uncertainty? Evidence from the USA and China. International Journal of Financial Studies 9: 40. [Google Scholar]
  42. Hau, Liya, Huiming Zhu, Yang Yu, and Dongwei Yu. 2022. Time–frequency coherence and quantile causality between trade policy uncertainty and rare earth prices: Evidence from China and the US. Resources Policy 75: 102529. [Google Scholar]
  43. Hazgui, Samah, Saber Sebai, and Walid Mensi. 2021. Dynamic frequency relationships between bitcoin, oil, gold and economic policy uncertainty index. Studies in Economics and Finance 39: 419–43. [Google Scholar] [CrossRef]
  44. He, Zhifang, Fangzhao Zhou, Xiaohua Xia, Fenghua Wen, and Yiyuan Huang. 2019. Interaction between oil price and investor sentiment: Nonlinear causality, time-varying influence, and asymmetric effect. Emerging Markets Finance and Trade 55: 2756–73. [Google Scholar] [CrossRef]
  45. Huang, Jianbai, Xuesong Dong, Jinyu Chen, and Meirui Zhong. 2022. Do oil prices and economic policy uncertainty matter for precious metal returns? New insights from a TVP-VAR framework. International Review of Economics & Finance 78: 433–45. [Google Scholar]
  46. Huynh, Nhan, Anh Dao, and Dat Nguyen. 2021. Openness, economic uncertainty, government responses, and international financial market performance during the coronavirus pandemic. Journal of Behavioral and Experimental Finance 31: 100536. [Google Scholar] [CrossRef]
  47. Inshakov, Oleg V., Lyudmila Y. Bogachkova, and Elena G. Popkova. 2019. The transformation of the global energy markets and the problem of ensuring the sustainability of their development. In Energy Sector: A Systemic Analysis of Economy, Foreign Trade and Legal Regulations. New York: Springer, pp. 135–48. [Google Scholar]
  48. Jebabli, Ikram, Mohamed Arouri, and Frédéric Teulon. 2014. On the effects of world stock market and oil price shocks on food prices: An empirical investigation based on TVP-VAR models with stochastic volatility. Energy Economics 45: 66–98. [Google Scholar] [CrossRef]
  49. Ji, Qiang, Elie Bouri, David Roubaud, and Syed Jawad Hussain Shahzad. 2018. Risk spillover between energy and agricultural commodity markets: A dependence-switching CoVaR-copula model. Energy Economics 75: 14–27. [Google Scholar] [CrossRef]
  50. Kang, Ho-Jun, Sang-Gun Lee, and Soo-Yong Park. 2022. Information efficiency in the cryptocurrency market: The efficient-market hypothesis. Journal of Computer Information Systems 62: 622–31. [Google Scholar] [CrossRef]
  51. Karim, Sitara, and Muhammad Abubakr Naeem. 2022. Do global factors drive the interconnectedness among green, Islamic and conventional financial markets? International Journal of Managerial Finance 18: 639–60. [Google Scholar] [CrossRef]
  52. Kennedy, James. 2019. China solidifies dominance in rare earth processing. National Defense 103: 17–19. [Google Scholar]
  53. Khan, Muhammad Kamran, Jian-Zhou Teng, Muhammad Imran Khan, and Muhammad Owais Khan. 2019. Impact of globalization, economic factors and energy consumption on CO2 emissions in Pakistan. Science of the Total Environment 688: 424–36. [Google Scholar] [CrossRef]
  54. Khorasanipour, Mehdi, and Zahra Jafari. 2018. Environmental geochemistry of rare earth elements in Cu-porphyry mine tailings in the semiarid climate conditions of Sarcheshmeh mine in southeastern Iran. Chemical Geology 477: 58–72. [Google Scholar] [CrossRef]
  55. Kihombo, Shauku, Arif I. Vaseer, Zahoor Ahmed, Songsheng Chen, Dervis Kirikkaleli, and Tomiwa Sunday Adebayo. 2022. Is there a tradeoff between financial globalization, economic growth, and environmental sustainability? An advanced panel analysis. Environmental Science and Pollution Research 29: 3983–93. [Google Scholar] [CrossRef] [PubMed]
  56. Klinger, Julie Michelle. 2018. Rare earth elements: Development, sustainability and policy issues. The Extractive Industries and Society 5: 1–7. [Google Scholar] [CrossRef]
  57. Liang, Tao, Kexin Li, and Lingqing Wang. 2014. State of rare earth elements in different environmental components in mining areas of China. Environmental Monitoring and Assessment 186: 1499–513. [Google Scholar] [CrossRef]
  58. Liu, Jingshan. 2020. Impact of uncertainty on foreign exchange market stability: Based on the LT-TVP-VAR model. China Finance Review International 11: 53–72. [Google Scholar] [CrossRef]
  59. Liu, Lu, En-Ze Wang, and Chien-Chiang Lee. 2020. Impact of the COVID-19 pandemic on the crude oil and stock markets in the US: A time-varying analysis. Energy Research Letters 1: 13154. [Google Scholar] [CrossRef]
  60. Maghyereh, Aktham I., Basel Awartani, and Hussein Abdoh. 2019. The co-movement between oil and clean energy stocks: A wavelet-based analysis of horizon associations. Energy 169: 895–913. [Google Scholar] [CrossRef]
  61. Maghyereh, Aktham, and Hussein Abdoh. 2022. Bubble contagion effect between the main precious metals. Studies in Economics and Finance. [Google Scholar] [CrossRef]
  62. Managi, Shunsuke, and Tatsuyoshi Okimoto. 2013. Does the price of oil interact with clean energy prices in the stock market? Japan and the World Economy 27: 1–9. [Google Scholar] [CrossRef]
  63. Mancheri, Nabeel A., Benjamin Sprecher, Gwendolyn Bailey, Jianping Ge, and Arnold Tukker. 2019. Effect of Chinese policies on rare earth supply chain resilience. Resources, Conservation and Recycling 142: 101–12. [Google Scholar] [CrossRef]
  64. Marques, Rosa, Maria I. Prudêncio, and Dulce Russo. 2021. Rare earths and other chemical elements determined by neutron activation analysis in new reference USGS materials: Carbonatite, nephelinite, syenite, granite, stream sediment and marine shale. Journal of Radioanalytical and Nuclear Chemistry 327: 1229–36. [Google Scholar] [CrossRef]
  65. Mensi, Walid, Mobeen Ur Rehman, and Xuan Vinh Vo. 2020. Spillovers and co-movements between precious metals and energy markets: Implications on portfolio management. Resources Policy 69: 101836. [Google Scholar] [CrossRef]
  66. Mensi, Walid, Mobeen Ur Rehman, and Xuan Vinh Vo. 2022. Impacts of COVID-19 outbreak, macroeconomic and financial stress factors on price spillovers among green bond. International Review of Financial Analysis 81: 102125. [Google Scholar] [CrossRef]
  67. Mensi, Walid, Shawkat Hammoudeh, Idries Mohammad Wanas Al-Jarrah, Ahmet Sensoy, and Sang Hoon Kang. 2017. Dynamic risk spillovers between gold, oil prices and conventional, sustainability and Islamic equity aggregates and sectors with portfolio implications. Energy Economics 67: 454–75. [Google Scholar] [CrossRef]
  68. Murshed, Muntasir. 2018. Does improvement in trade openness facilitate renewable energy transition? Evidence from selected South Asian economies. South Asia Economic Journal 19: 151–70. [Google Scholar] [CrossRef]
  69. Nakajima, Jouchi. 2011. Time-Varying Parameter VAR Model with Stochastic Volatility: An Overview of Methodology and Empirical Applications. Available online: https://www.imes.boj.or.jp/research/papers/english/me29-6.pdf (accessed on 12 July 2022).
  70. Nathaniel, Solomon, Ozoemena Nwodo, Abdulrauf Adediran, Gagan Sharma, Muhammad Shah, and Ngozi Adeleye. 2019. Ecological footprint, urbanization, and energy consumption in South Africa: Including the excluded. Environmental Science and Pollution Research 26: 27168–79. [Google Scholar] [CrossRef]
  71. Nathaniel, Solomon Prince, and Chimere Okechukwu Iheonu. 2019. Carbon dioxide abatement in Africa: The role of renewable and non-renewable energy consumption. Science of the Total Environment 679: 337–45. [Google Scholar] [CrossRef]
  72. Newell, Richard G., and Daniel Raimi. 2020. Global Energy Outlook Comparison Methods: 2020 Update. Resources for the Future. Available online: https://www.rff.org/documents/2456/Global_Energy_Outlook_Comparison_Methods_2020.pdf (accessed on 12 July 2022).
  73. Özdurak, Caner, and Veysel Ulusoy. 2020. Spillovers from the Slowdown in China on Financial and Energy Markets: An Application of VAR–VECH–TARCH Models. International Journal of Financial Studies 8: 52. [Google Scholar] [CrossRef]
  74. Pablo-Romero, Maria del P., and Josué De Jesús. 2016. Economic growth and energy consumption: The energy-environmental Kuznets curve for Latin America and the Caribbean. Renewable and Sustainable Energy Reviews 60: 1343–50. [Google Scholar] [CrossRef]
  75. Packey, Daniel J., and Dudley Kingsnorth. 2016. The impact of unregulated ionic clay rare earth mining in China. Resources Policy 48: 112–16. [Google Scholar] [CrossRef]
  76. Pantos, Themistoclis, Efstathios Polyzos, Angelos Armenatzoglou, and Elias Kampouris. 2019. Volatility spillovers in electricity markets: Evidence from the United States. International Journal of Energy Economics and Policy 9: 131–43. [Google Scholar] [CrossRef]
  77. Papathanasiou, Spyros, Dimitrios Vasiliou, Anastasios Magoutas, and Drosos Koutsokostas. 2022a. Do hedge and merger arbitrage funds actually hedge? A time-varying volatility spillover approach. Finance Research Letters 44: 102088. [Google Scholar] [CrossRef]
  78. Papathanasiou, Spyros, Drosos Koutsokostas, and Georgios Pergeris. 2022b. Novel alternative assets within a transmission mechanism of volatility spillovers: The role of SPACs. Finance Research Letters 47: 102602. [Google Scholar] [CrossRef]
  79. Papathanasiou, Spyros, Ioannis Dokas, and Drosos Koutsokostas. 2022c. Value investing versus other investment strategies: A volatility spillover approach and portfolio hedging strategies for investors. The North American Journal of Economics and Finance 62: 101764. [Google Scholar] [CrossRef]
  80. Primiceri, Giorgio E. 2005. Time varying structural vector autoregressions and monetary policy. The Review of Economic Studies 72: 821–52. [Google Scholar] [CrossRef]
  81. Proelss, Juliane, Denis Schweizer, and Volker Seiler. 2020. The economic importance of rare earth elements volatility forecasts. International Review of Financial Analysis 71: 101316. [Google Scholar] [CrossRef]
  82. Rahman, Mohammad Mafizur, and Mohammad Abul Kashem. 2017. Carbon emissions, energy consumption and industrial growth in Bangladesh: Empirical evidence from ARDL cointegration and Granger causality analysis. Energy Policy 110: 600–8. [Google Scholar] [CrossRef]
  83. Reboredo, Juan C., and Andrea Ugolini. 2020. Price spillovers between rare earth stocks and financial markets. Resources Policy 66: 101647. [Google Scholar] [CrossRef]
  84. Rubbaniy, Ghulame, Ali Awais Khalid, Abiot Tessema, and Abdelrahman Baqrain. 2022. Do stock market fear and economic policy uncertainty co-move with COVID-19 fear? Evidence from the US and UK. Studies in Economics and Finance. ahead-of-print. [Google Scholar] [CrossRef]
  85. Sadiq, Muhammad, Riazullah Shinwari, Muhammad Usman, Ilhan Ozturk, and Aktham Issa Maghyereh. 2022. Linking nuclear energy, human development and carbon emission in BRICS region: Do external debt and financial globalization protect the environment? Nuclear Engineering and Technology. in press. [Google Scholar] [CrossRef]
  86. Samitas, Aristeidis, and Elias Kampouris. 2019. Financial illness and political virus: The case of contagious crises in the Eurozone. International Review of Applied Economics 33: 209–27. [Google Scholar] [CrossRef]
  87. Samitas, Aristeidis, Elias Kampouris, and Stathis Polyzos. 2022a. Covid-19 pandemic and spillover effects in stock markets: A financial network approach. International Review of Financial Analysis 80: 102005. [Google Scholar] [CrossRef]
  88. Samitas, Aristeidis, Elias Kampouris, and Zaghum Umar. 2022b. Financial contagion in real economy: The key role of policy uncertainty. International Journal of Finance and Economics 27: 1633–82. [Google Scholar] [CrossRef]
  89. Samitas, Aristeidis, Elias Kampouris, Stathis Polyzos, and Anastasia Spyridou. 2020. Spillover effects between greece and cyprus: A DCC model on the interdependence of small economies. Investment Management and Financial Innovations 17: 121–35. [Google Scholar] [CrossRef]
  90. Samitas, Aristeidis, Spyros Papathanasiou, and Drosos Koutsokostas. 2021. The connectedness between Sukuk and conventional bond markets and the implications for investors. International Journal of Islamic and Middle Eastern Finance and Management 14: 928–49. [Google Scholar] [CrossRef]
  91. Samitas, Aristeidis, Spyros Papathanasiou, Drosos Koutsokostas, and Elias Kampouris. 2022c. Are timber and water investments safe-havens? A volatility spillover approach and portfolio hedging strategies for investors. Finance Research Letters 47: 102657. [Google Scholar] [CrossRef]
  92. Samitas, Aristeidis, Spyros Papathanasiou, Drosos Koutsokostas, and Elias Kampouris. 2022d. Volatility spillovers between fine wine and major global markets during COVID-19: A portfolio hedging strategy for investors. International Review of Economics & Finance 78: 629–42. [Google Scholar]
  93. Schulze, Rita, and Matthias Buchert. 2016. Estimates of global REE recycling potentials from NdFeB magnet material. Resources, Conservation and Recycling 113: 12–27. [Google Scholar] [CrossRef]
  94. Shahbaz, Muhammad, Thi Hong Van Hoang, Mantu Kumar Mahalik, and David Roubaud. 2017. Energy consumption, financial development and economic growth in India: New evidence from a nonlinear and asymmetric analysis. Energy Economics 63: 199–212. [Google Scholar] [CrossRef]
  95. Shahzad, Syed Jawad Hussain, Elie Bouri, Ghulam Mujtaba Kayani, Rana Muhammad Nasir, and Ladislav Kristoufek. 2020. Are clean energy stocks efficient? Asymmetric multifractal scaling behaviour. Physica A: Statistical Mechanics and Its Applications 550: 124519. [Google Scholar] [CrossRef]
  96. Sharpe, William F. 1964. Capital asset prices: A theory of market equilibrium under conditions of risk. The Journal of Finance 19: 425–42. [Google Scholar]
  97. Shezan, S. K. A., Narottam Das, and Hasan Mahmudul. 2017. Techno-economic analysis of a smart-grid hybrid renewable energy system for Brisbane of Australia. Energy Procedia 110: 340–45. [Google Scholar]
  98. Shin, Seo-Ho, Hyun-Ock Kim, and Kyung-Taek Rim. 2019. Worker safety in the rare earth elements recycling process from the review of toxicity and issues. Safety and Health at Work 10: 409–19. [Google Scholar] [PubMed]
  99. Singh, Ajit Pratap, and Kunal Dhadse. 2021. Economic evaluation of crop production in the Ganges region under climate change: A sustainable policy framework. Journal of Cleaner Production 278: 123413. [Google Scholar]
  100. Song, Ying, Elie Bouri, Sajal Ghosh, and Kakali Kanjilal. 2021. Rare earth and financial markets: Dynamics of return and volatility connectedness around the COVID-19 outbreak. Resources Policy 74: 102379. [Google Scholar]
  101. Sorknæs, Peter, Henrik Lund, I. R. Skov, Søren Djørup, Klaus Skytte, Poul Erik Morthorst, and Felipe Fausto. 2020. Smart Energy Markets-Future electricity, gas and heating markets. Renewable and Sustainable Energy Reviews 119: 109655. [Google Scholar]
  102. Tang, Chaofeng, and Kentaka Aruga. 2021. Relationships among the fossil fuel and financial markets during the COVID-19 pandemic: Evidence from bayesian DCC-MGARCH models. Sustainability 14: 51. [Google Scholar]
  103. Tiwari, Aviral Kumar, Emmanuel Joel Aikins Abakah, David Gabauer, and Richard Adjei Dwumfour. 2022. Dynamic spillover effects among green bond, renewable energy stocks and carbon markets during COVID-19 pandemic: Implications for hedging and investments strategies. Global Finance Journal 51: 100692. [Google Scholar]
  104. Toparlı, Elif Akay, Abdurrahman Nazif Çatık, and Mehmet Balcılar. 2019. The impact of oil prices on the stock returns in Turkey: A TVP-VAR approach. Physica A: Statistical Mechanics and Its Applications 535: 122392. [Google Scholar]
  105. Tran, Quang Thien, Nhan Huynh, and Nhu An Huynh. 2022. Trading-Off between Being Contaminated or Stimulated: Are Emerging Countries Doing Good Jobs in Hosting Foreign Resources? Available online: https://ssrn.com/abstract=4112396 (accessed on 12 July 2022).
  106. Tsagkanos, Athanasios, Aarzoo Sharma, and Bikramaditya Ghosh. 2022. Green Bonds and Commodities: A New Asymmetric Sustainable Relationship. Sustainability 14: 6852. [Google Scholar]
  107. Ul Haq, Inzamam, Apichit Maneengam, Supat Chupradit, and Chunhui Huo. 2022. Are green bonds and sustainable cryptocurrencies truly sustainable? Evidence from a wavelet coherence analysis. Economic Research-Ekonomska Istraživanja, 1–20. [Google Scholar] [CrossRef]
  108. Usman, Ahmed, Sana Ullah, Ilhan Ozturk, Muhammad Zubair Chishti, and Syeda Maria Zafar. 2020. Analysis of asymmetries in the nexus among clean energy and environmental quality in Pakistan. Environmental Science and Pollution Research 27: 20736–47. [Google Scholar] [CrossRef] [PubMed]
  109. Wang, Yizhi, Brian M. Lucey, Samuel Vigne, and Larisa Yarovaya. 2022. An index of cryptocurrency environmental attention (ICEA). China Finance Review International 12: 378–414. [Google Scholar] [CrossRef]
  110. Zhang, Hua, Jinyu Chen, and Liuguo Shao. 2021. Dynamic spillovers between energy and stock markets and their implications in the context of COVID-19. International Review of Financial Analysis 77: 101828. [Google Scholar] [CrossRef]
  111. Zhang, Wenting, Xie He, Tadahiro Nakajima, and Shigeyuki Hamori. 2020. How does the spillover among natural gas, crude oil, and electricity utility stocks change over time? Evidence from North America and Europe. Energies 13: 727. [Google Scholar] [CrossRef]
  112. Zhao, Zhexuan, Zhaofu Qiu, Ji Yang, Shuguang Lu, Limei Cao, Wei Zhang, and Yongye Xu. 2017. Recovery of rare earth elements from spent fluid catalytic cracking catalysts using leaching and solvent extraction techniques. Hydrometallurgy 167: 183–88. [Google Scholar] [CrossRef]
  113. Zheng, Biao, Yuquan W. Zhang, Fang Qu, Yong Geng, and Haishan Yu. 2022. Do rare earths drive volatility spillover in crude oil, renewable energy, and high-technology markets?—A wavelet-based BEKK–GARCH-X approach. Energy 251: 123951. [Google Scholar] [CrossRef]
  114. Zheng, Biao, Yuquan Zhang, and Yufeng Chen. 2021. Asymmetric connectedness and dynamic spillovers between renewable energy and rare earth markets in China: Evidence from firms’ high-frequency data. Resources Policy 71: 101996. [Google Scholar] [CrossRef]
  115. Zhou, Baolu, Zhongxue Li, and Congcong Chen. 2017. Global potential of rare earth resources and rare earth demand from clean technologies. Minerals 7: 203. [Google Scholar] [CrossRef]
  116. Zhou, Mei-Jing, Jian-Bai Huang, and Jin-Yu Chen. 2020. The effects of geopolitical risks on the stock dynamics of China’s rare metals: A TVP-VAR analysis. Resources Policy 68: 101784. [Google Scholar] [CrossRef]
  117. Zhou, Mei-Jing, Jian-Bai Huang, and Jin-Yu Chen. 2022. Time and frequency spillovers between political risk and the stock returns of China’s rare earths. Resources Policy 75: 102464. [Google Scholar] [CrossRef]
Figure 1. Daily Return plots.
Ijfs 10 00076 g001
Figure 2. Total dynamic connectedness. Note: (Panel A) represents the total volatility spillovers among rare earth elements and sustainability indices, and (Panel B) represents the total volatility spillovers among energy commodities and sustainability indices.
Ijfs 10 00076 g002
Figure 3. Dynamic NET connectedness. Note: (Panel A) represents the Dynamic NET connectedness among rare earth elements and sustainability indices, and (Panel B) represents the Dynamic NET connectedness among energy commodities and sustainability indices.
Ijfs 10 00076 g003
Figure 4. Pairwise network connectedness. Note: (Panel A) represents the pairwise network connectedness among rare earth elements and sustainability indices, and (Panel B) represents the pairwise network connectedness among energy commodities and sustainability indices.
Ijfs 10 00076 g004
Table 1. World reserves of REE by principal countries.
CountryReserves in Tones (in Terms of REO)% Share
Australia3,400,0002.56
Brazil22,000,00016.67
Canada830,0000.63
China44,000,00033.33
Greenland1,500,0001.14
India6,900,0005.23
Malaysia30,0000.02
Malawi140,0000.11
Russia18,000,00013.64
South Africa860,0000.65
Vietnam22,000,00016.67
USA1,400,0001.06
Note: This table reports the country-wide reserves of REEs. Source: U.S. Geological Survey, 2020.
Table 2. Descriptive statistics of return series.
MMaxMinSDSkewKurtJBADFObs.
ASI0.0000.062−0.0640.010−0.6348.3351415.900 *−36.2261130
CHNREE0.0012.183−0.3180.08217.293442.1309,135,629.000 *−34.6451130
CSI0.0000.084−0.0780.014−0.1426.297515.500 *−33.2591130
GAS0.0010.180−0.2530.028−1.39420.06414,075.300 *−32.3431130
LYC0.0000.300−1.3900.055−14.168362.0276,106,863.000 *−33.7421130
MVISGREI0.0000.063−0.0810.018−0.1204.23274.100 *−28.8141130
NGAS0.0010.198−0.1810.0350.1747.033771.600 *−34.6101130
SWI0.0000.077−0.1060.010−1.46423.76920,712.600 *−35.2491130
USREE0.0000.137−0.2160.026−0.87710.8353035.400 *−34.8161130
USSI0.0010.095−0.1290.014−0.89418.79311,893.700 *−40.9831130
WTI0.0020.320−0.2820.0371.21131.84439,449.600 *−28.6051130
Note: This table reports summary of descriptive statistics and stationarity of return series. M = Mean, Max = Maximum, Min = Minimum, SD = Standard Deviation, Skew = Skewness, Kurt = Kurtosis, JB = Jerque-Bera, ADF = Augmented Dicky-Fuller, Obs. = Observations. The first column shows the variables in an alphabetic manner where, ASI = Dow Jones Australia Sustainability Index, CHNREE = China Rare Earth Element Index, CSI = China Sustainability Index, GAS = GAS, LYC = Lynas Rare Earth Australia Index, MVISGREI = MVIS Global Rare Earth Index, NGAS = Natural GAS, SWI Dow Jones Sustainability World Index, USREE = US Rare Earth Index, USSI = US Sustainability Index, WTI = Crude oil price index. “*” indicates results are statistically significant at a 1% or 0.001 significance level.
Table 3. Correlation Matrix.
ASICHNREECSIGASLYCMVISGREINGASSWIUSREEUSSIWTI
ASI1.000−0.009−0.0090.0800.015−0.0170.0050.0560.036−0.001−0.072
CHNREE−0.0091.0000.005−0.014−0.028−0.007−0.0250.015−0.0490.0040.008
CSI−0.0090.0051.000−0.0370.0390.031−0.009−0.0100.0120.0050.025
GAS0.080−0.014−0.0371.000−0.0200.0540.022−0.0150.2480.3260.055
LYC0.015−0.0280.039−0.0201.000−0.015−0.034−0.001−0.017−0.026−0.035
MVISGREI−0.017−0.0070.0310.054−0.0151.000−0.0200.0340.0070.040−0.017
NGAS0.005−0.025−0.0090.022−0.034−0.0201.0000.0070.0650.042−0.041
SWI0.0560.015−0.010−0.015−0.0010.0340.0071.000−0.029−0.0910.004
USREE0.036−0.0490.0120.248−0.0170.0070.065−0.0291.0000.5510.034
USSI−0.0010.0040.0050.326−0.0260.0400.042−0.0910.5511.0000.041
WTI−0.0720.0080.0250.055−0.035−0.017−0.0410.0040.0340.0411.000
Note: This table reports unconditional correlation matrix where off-diagonal values indicate correlation coefficients. The first column shows the variables in an alphabetic manner where, ASI = Dow Jones Australia Sustainability Index, CHNREE = China Rare Earth Element Index, CSI = China Sustainability Index, GAS = GAS, LYC = Lynas Rare Earth Australia Index, MVISGREI = MVIS Global Rare Earth Index, NGAS = Natural GAS, SWI Dow Jones Sustainability World Index, USREE = US Rare Earth Index, USSI = US Sustainability Index, WTI = Crude oil price index. All results are statistically significant at 1% or 0.001 significance level.
Table 4. Total Connectedness Index.
LYCCHNREEMVISGREIUSREECSIASIUSSISWIFROM
LYC91.8901.1500.8701.1300.7701.6800.7101.8008.110
CHNREE0.71095.2600.6100.8600.5800.6500.7600.5804.740
MVISGREI0.9502.21089.0701.7201.7300.7400.8902.69010.930
USREE0.7301.2900.86070.3200.8301.49023.6500.83029.680
CSI0.6601.6700.9901.11092.6400.9100.7601.2607.360
ASI2.1901.5600.8401.7800.83088.3802.9501.46011.620
USSI0.5201.6800.81023.3500.9101.91069.4901.34030.510
SWI1.6901.0601.3901.9701.2001.6701.45089.57010.430
TO7.43010.6206.37031.9306.8509.05031.1709.970113.390
NET−0.6805.880−4.5602.250−0.510−2.5700.660−0.460TCI = 14.17%
Note: This table presents total volatility spillovers or total connectedness index of rare earths and sustainable financial markets between 1 January 2018 to 20 June 2022. The first column shows the variables where, ASI = Dow Jones Australia Sustainability Index, CHNREE = China Rare Earth Element Index, CSI = China Sustainability Index, LYC = Lynas Rare Earth Australia Index, MVISGREI = MVIS Global Rare Earth Index, SWI Dow Jones Sustainability World Index, USREE = US Rare Earth Index, USSI = US Sustainability Index.
Table 5. Total Connectedness Index.
GASWTINGASCSIASIUSSISWIFROM
GAS85.7801.3800.9201.0701.0309.1300.69014.220
WTI1.18092.6202.1100.6401.5300.9001.0207.380
NGAS1.1801.83092.9801.0400.6701.7500.5607.020
CSI2.5601.2501.07092.5500.7500.8101.0007.450
ASI1.6902.2800.9400.87090.0203.0101.1909.980
USSI9.0701.3301.1000.8901.94084.2301.44015.770
SWI1.5101.5701.8501.1001.2701.49091.2208.780
TO17.1909.6307.9905.6107.20017.0905.90070.600
NET2.9702.2500.970−1.840−2.7901.310−2.880TCI = 10.09%
Note: This table presents total volatility spillovers or total connectedness index of major energy commodities and sustainable financial markets from 1 January 2018 to 20 June 2022. The first column shows the variables where, ASI = Dow Jones Australia Sustainability Index, CSI = China Sustainability Index, SWI Dow Jones Sustainability World Index, USSI = US Sustainability Index, LYC = Lynas Rare Earth, NGAS = Natural GAS and WTI = Crude oil price index.
Publisher’s Note: MDPI stays neutral with regard to jurisdictional claims in published maps and institutional affiliations.

