The Effects of Government Bonds on Liquidity Risk and Bank Profitability in Cape Verde


1
CAIXA Económica de Cabo Verde, Departamento de Gestão de Risco, C.P. 199 Praia, Cabo Verde
2
CEFAGE-UE, IIFA, Universidade de Évora, 7000-809 Évora, Portugal
3
Departamento de Economia, Universidade de Évora, 7000-809 Évora, Portugal
4
VALORIZA—Research Center for Endogenous Resource Valorization, 7300-555 Portalegre, Portugal
5
Instituto Politécnico de Portalegre, 7300-110 Portalegre, Portugal
*
Author to whom correspondence should be addressed.
Int. J. Financial Stud. 2021, 9(1), 2; https://0-doi-org.brum.beds.ac.uk/10.3390/ijfs9010002
Submission received: 11 November 2020
/
Revised: 22 December 2020
/
Accepted: 24 December 2020
/
Published: 2 January 2021
(This article belongs to the Special Issue Banks and Profitability of Banks)
Abstract
:To analyze the effects of government debt securities on the liquidity risk and profitability of banks in Cape Verde, this research employs an unbalanced panel dataset from 2000 to 2017 on the activity of all commercial banks operating at the end of 2017 (seven in total). The study employs models with lagged regressors, estimated by the ordinary least squares estimation method. The results show that government debt securities have no effect on bank liquidity risks, but they have an effect on bank profitability, with government debt securities having a positive impact on assets’ profitability, in the long run. When government debt securities include Consolidated Securities of Financial Mobilization, the effects on profitability are negative both in the short and the long run. The study concludes that banks’ strategy to hold the more conventional government debt securities as safe assets and risk-free alternative for the domestic application of liquidity surpluses is appropriate and a viable way to gain profitability in the long run. These results show the negative effect of government debt securities when the Consolidated Securities of Financial Mobilization are included, which helps to explain the low average profitability rates of Cape Verde’s banks, when compared to other similar sub-Saharan African countries, like Mauritius or Seychelles.
JEL Classification:
E43; G21; H631. Introduction
Cape Verde is a small insular country with poor natural resources and whose economy depends essentially on the tourism sector. In order to develop the country, the various governments have successively generated large public deficits, which have resulted in an enormous accumulation of public debt. The strong growth in public external debt, mostly constituted by concessional loans (Brito 2014), is justified by the need to develop the country’s infrastructure and modernization projects (the construction of roads, ports, airports, dams and the building of social housing). Regarding the internal public debt, this is used mainly to supply the government’s cash needs and to subsidize the operation of some public companies with considerable losses. We could highlight Imobiliária, Fundiária e Habitat, S.A. (IFH), Transportes Aéreos de Cabo Verde (TACV) and Electra, S.A. (state water and electricity company). These last two companies have presented problems of technical efficiency for decades (with non-rational and inappropriate use of production factors), causing production losses and great damage to the government’s treasury and worsening the country’s public debt. Data from Fitch Ratings (2019) point to the high risk of public debt due to the excessive responsibilities of the State regarding these three companies (which represented 31% of GDP in June 2018).
These state-owned companies have been accumulating substantial liabilities, estimated at around 20% of GDP in 2016, and represent significant and even unsustainable fiscal costs for the country (African Economic Outlook 2017). In this connection, Christie and Rioja (2014) stated that Cape Verde faces potential challenges due to the increase in public debt (considered one of the highest in the world, reaching 133.16% of GDP in 2017, when including Consolidated Financial Mobilization Bonds (CFMB)), which could lead the country to a default situation. CFMB are credit securities issued by the State of Cape Verde, through the Treasury, and representative of a fund—the “International Support for Cabo Verde Stabilization Trust Fund” (Law nº 64/V/98). The Fund is managed by Banco de Portugal and the investment policy of the Fund is defined by a representative of the Government of Cape Verde, together with the management entity, with the objective of valuing its assets and being guided by safety and security criteria. On the other hand, there are those who consider it sustainable, as the State of Cape Verde has always fulfilled its debt obligations (Brito 2014; Ncube and Brixiová 2015).
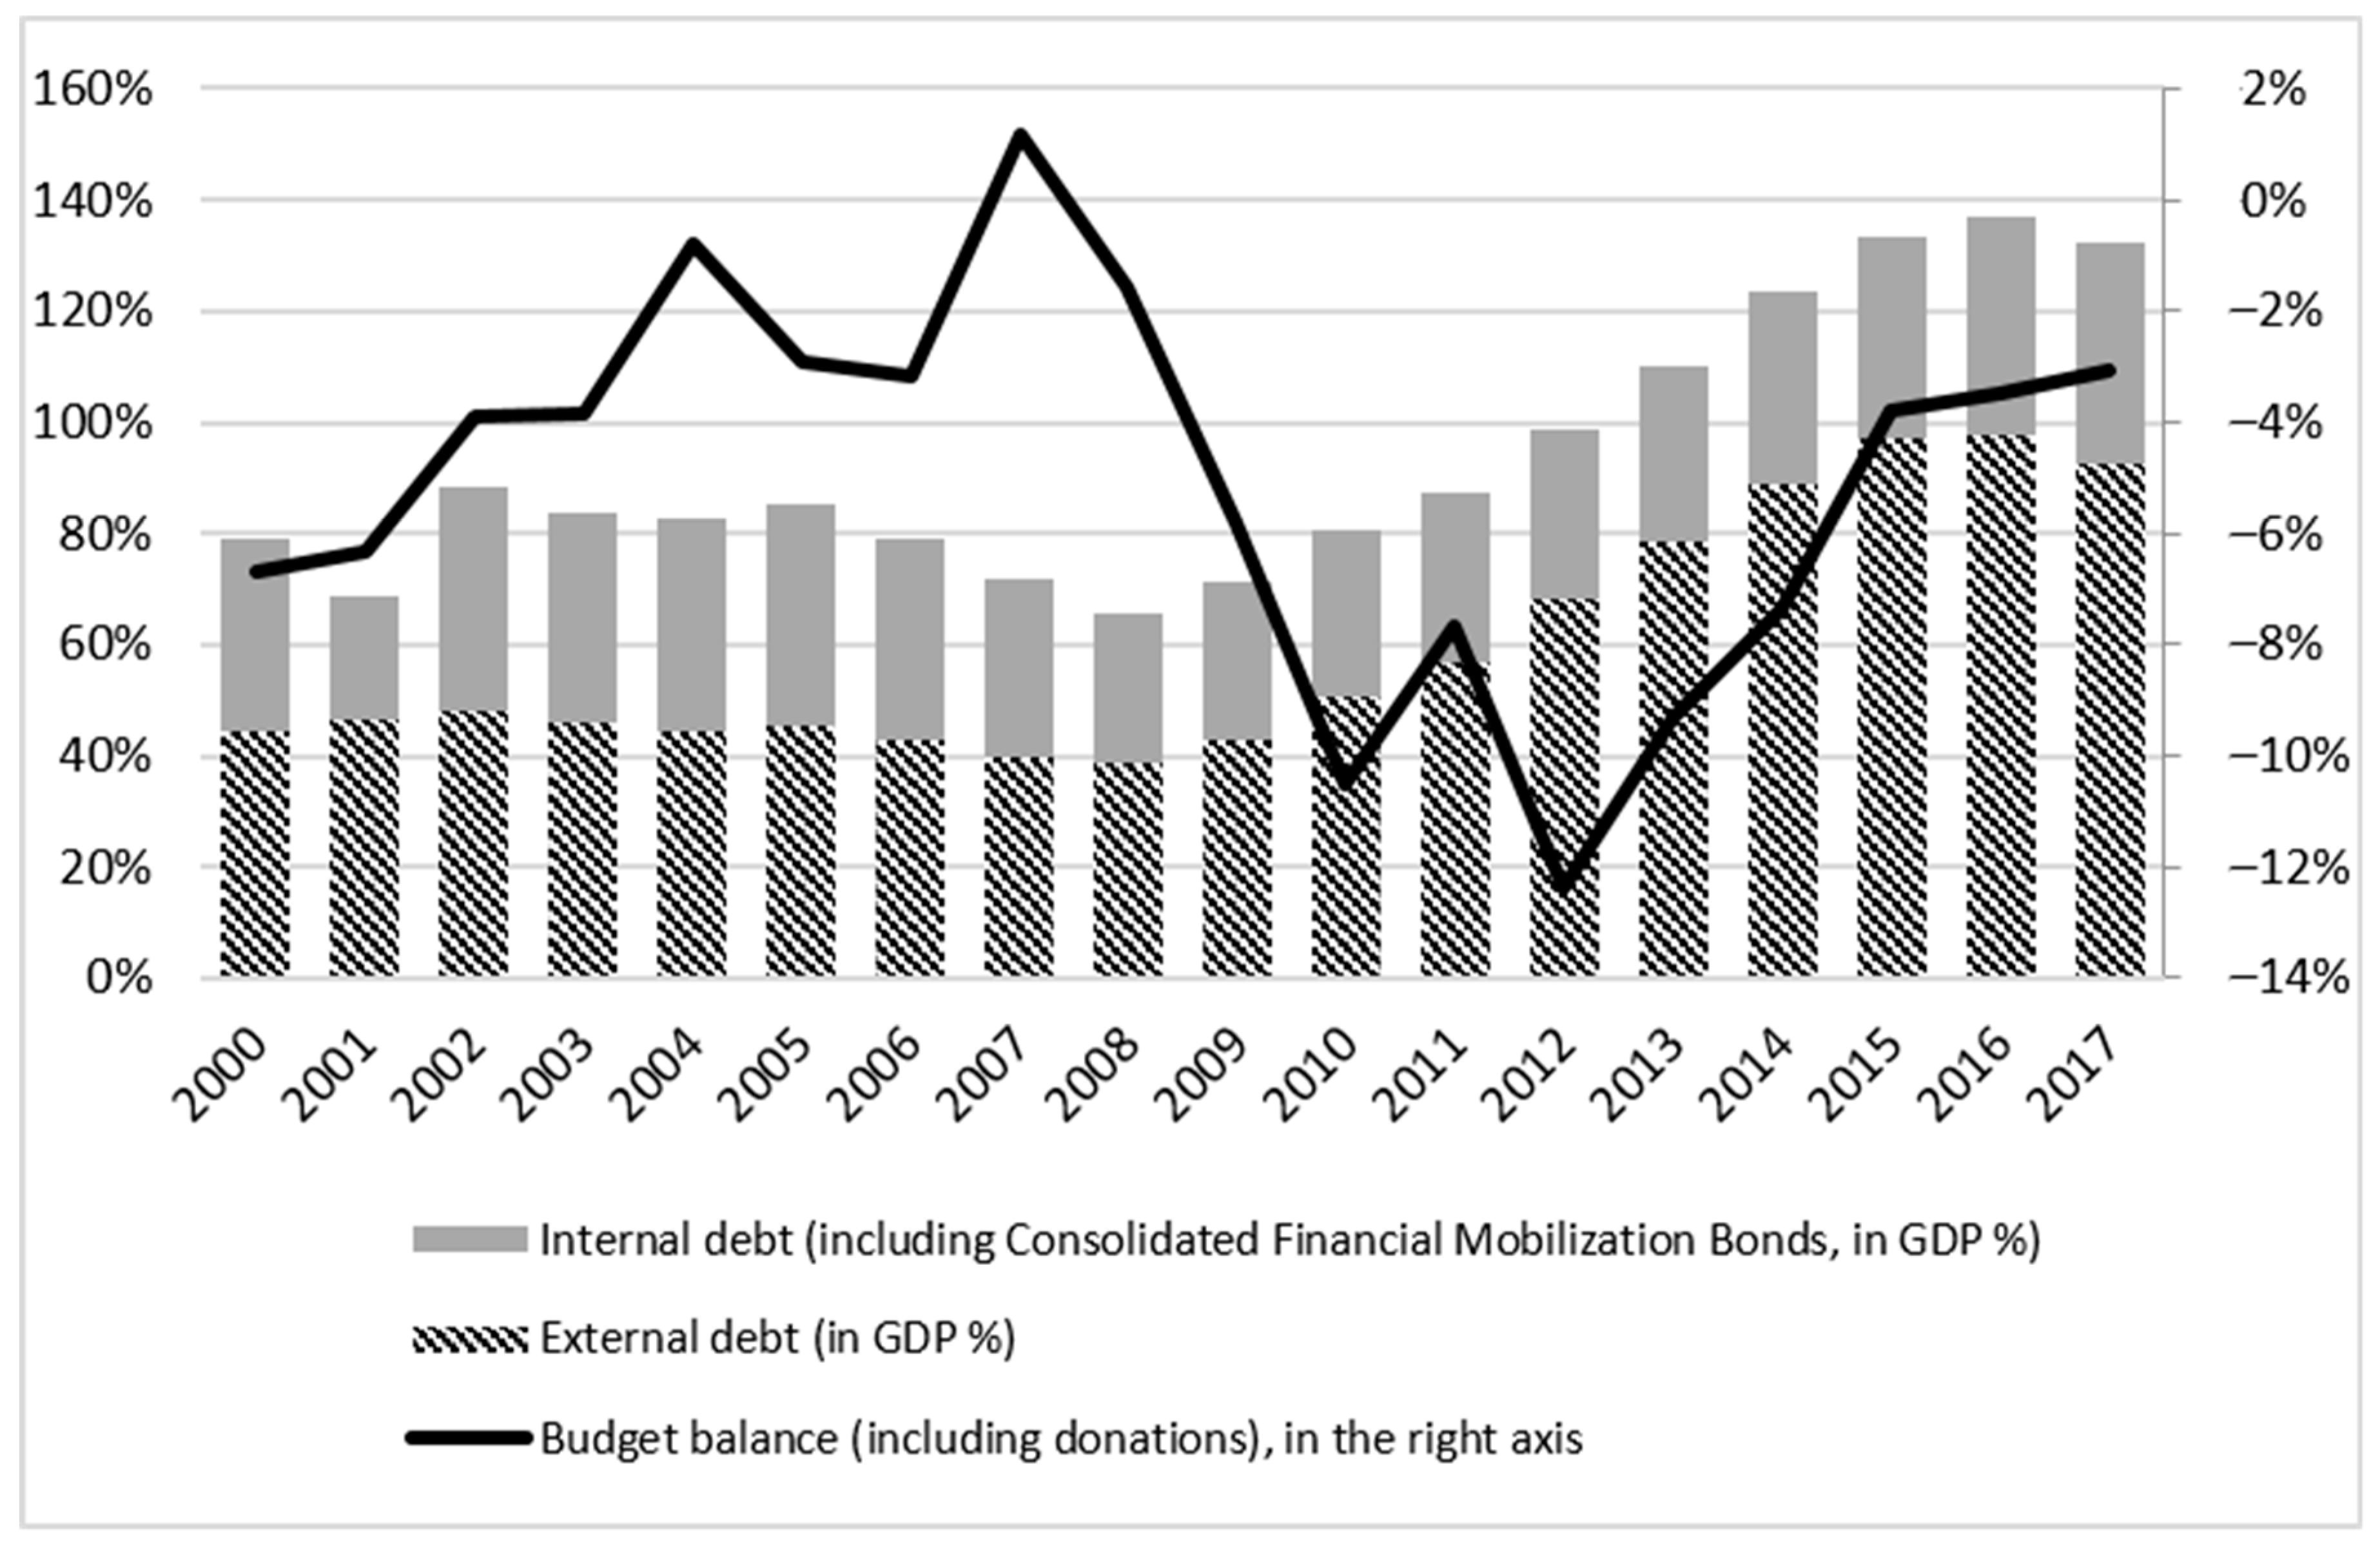
As Figure 1 shows, Cape Verde’s public debt problems started mainly after the start of the financial crisis (2008) and with the widening of the deficit. Before that, debt levels were relatively stable at around 80% of GDP, even with a downward trend in the pre-crisis years (2002 to 2008). An increasing trend can be seen mainly in external debt, which went from 38.54% of GDP in 2008 to 96.83% in 2016 (a strong and significant growth of 58.29 percentage points in just eight years). At the domestic level, there was an increase in debt caused mainly by the issue of government bonds. Domestic debt (including CFMB) went from 27.09% of GDP in 2008 to 39.39% of GDP in 2016. Excluding CFMB (part of domestic debt that remained fixed in absolute terms throughout this period), effective growth is evident from 13.78 percentage points in the stock of domestic debt (from 18.64% of GDP in 2008 to 32.42% of GDP in 2016).
It is important to analyze, separately, the evolution and the different effects of domestic and foreign debt. In many developing countries, the weight of domestic debt in total public debt has increased considerably, for some countries due to difficulties in accessing financing in international markets (mainly due to the decrease in multilateral and concessional loans), and for others due to the simple strategy of governments to reduce external dependency (Panizza 2008). Although reducing macroeconomic risks, the rapid increase in the share of domestic credit absorbed by the public sector in many developing countries (such as Cape Verde) raises questions about the consequences for the development of the financial sector (Panizza 2008; Hauner 2009) such as conceding inefficient credit to the private sector and precarious financial development (Altayligil and Akkay 2013).
On the other hand, the high exposure of banks in Cape Verde to public debt implies some risks, as the country has a national banking system that feeds the central government’s deficit. According to data from the Cape Verde Ministry of Finance, at the end of 2017 the stock of domestic debt (including CFMB) represented 30.03% of total public debt (which, in turn, represented 39.98% of GDP). According to Gorton and Huang (2004), if the government is not efficient in its economic and fiscal political options, this will lead to an inefficient banking sector, challenging the entire banking system.
Great importance is given to the banking sector in the financial system and in economic development (Gorton and Winton 2002; Levine 1997; Demirguc-Kunt et al. 2013). For Gorton and Winton (2002), the process of saving and investing in capitalist economies is organized around financial intermediation, thus making banks a central institution in the process of economic growth. Empirical evidence has clearly demonstrated that a sound financial system is a basic condition for sustainable economic growth (Levine 1997; Demirguc-Kunt et al. 2013). For Demirguc-Kunt et al. (2013), a good financial system must be formed of robust institutions, provided with liquidity, capitalization and profitability.
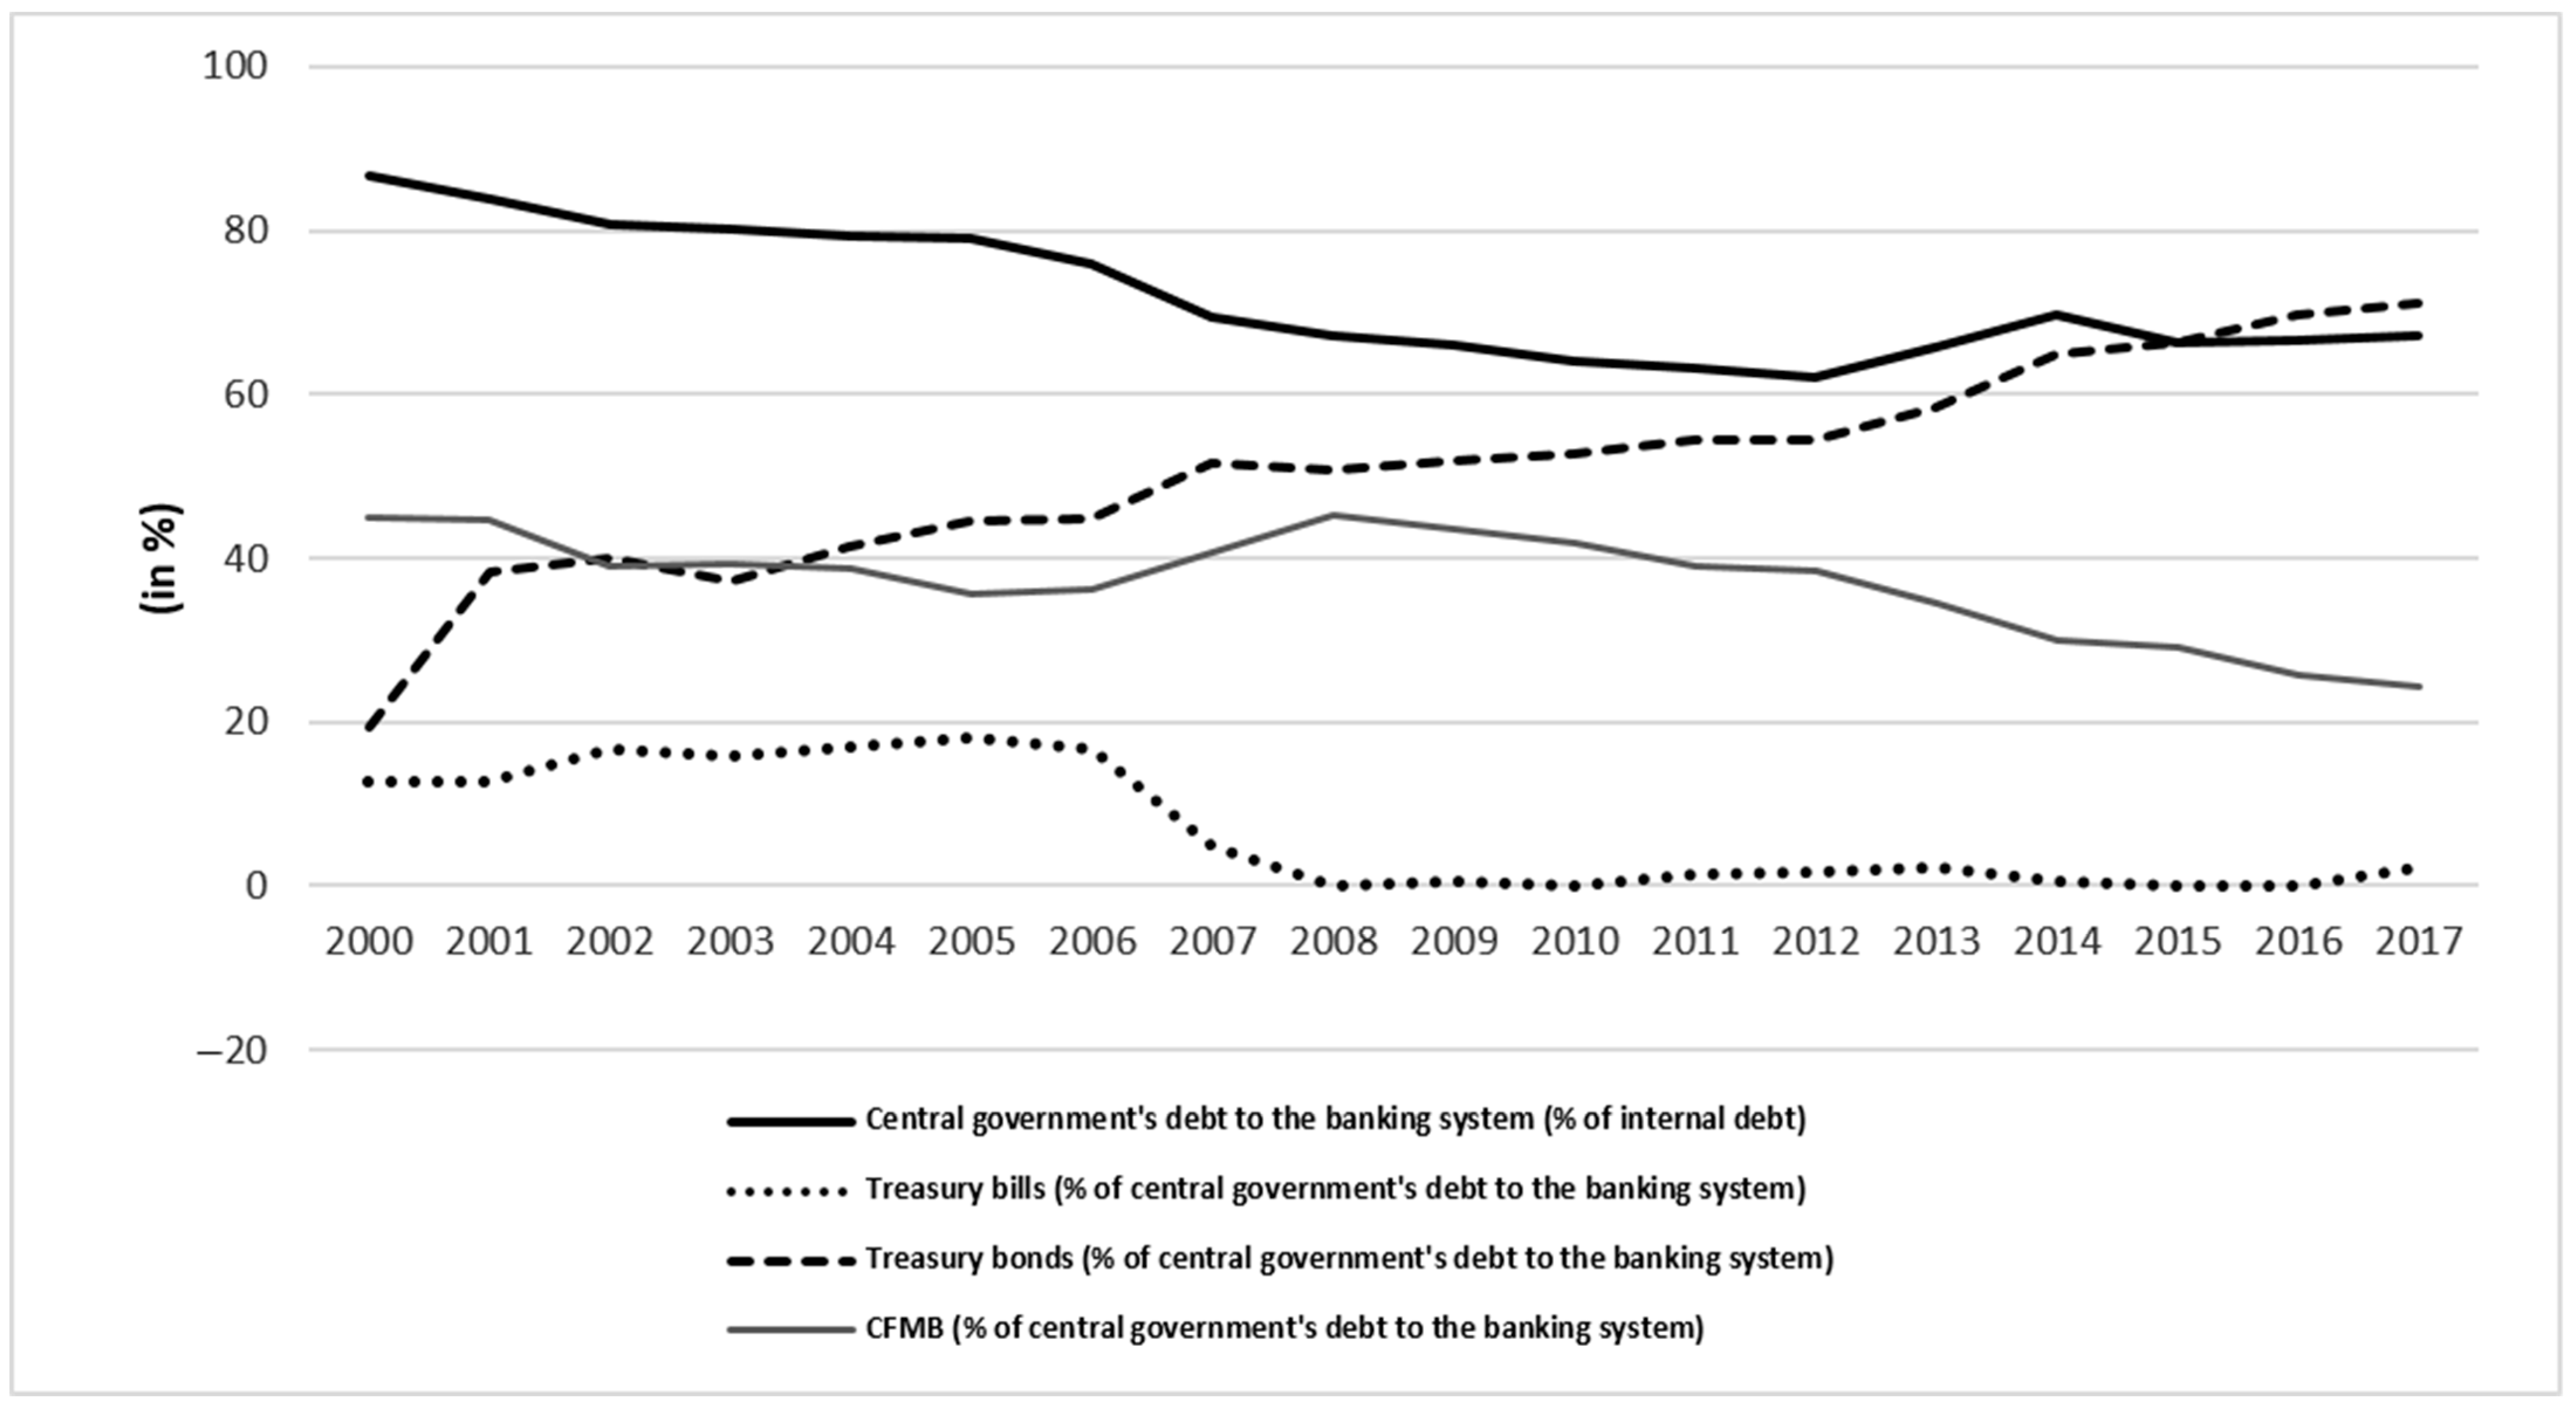
In Cape Verde, within the scope of prudential rules and limits, there is a law that requires banks to buy government bonds Notice no. 10/98 of 28 December of the Banco de Cabo Verde, under article 37 of Law no. 3/V/96 of 1st of July, has the following quote in its no. 1: “Credit institutions are obliged to include in their assets public debt securities, the global value of which, determined according to the respective acquisition prices, cannot be less than 5% of the total liabilities for deposits in national or foreign currency”. According to Figure 2, in 2017 the central government’s debt to the banking system (including CFMB) represented 67.19% of the internal debt, of which treasury bills and treasury bonds represent 2.14% and 71.08%, respectively. CFMB represented 24.16% of the central government’s debt to the banking system (held only by one bank, Banco Comercial do Atlântico (BCA)). The remaining 2.62% are conventional credits granted to the government. However, the weight of central government debt in the banking system has been decreasing, from 86.62% in 2000 to 67.19% in 2017.
Thus, given the level of public debt and commercial banks’ exposure to domestic debt, it is crucial to analyze the relationship between public debt and the performance of the banking system, particularly the effects produced by the stock of public debt securities on the liquidity risk and profitability of the banking sector.
Given its nature and the possibility of easy conversion into money, when compared to credit applications, the increased investment in public debt securities gives banks greater liquidity (Alzoubi 2017), thus reducing liquidity risk. On the other hand, more investment in government bonds means an increase in the weight of these bonds in the banks’ asset portfolio. Moreover, as stated by Ozkan et al. (2010), higher degrees of competitiveness and liquidity of the banking sectors are related to better conditions in the public securities market. However, since these securities are of low yield (compared to credits, for example), the increase in the stock of government bonds, as a specific factor for banks, is expected to have a negative effect on the profitability of banks’ assets in Cape Verde.
Following this introduction, this article is structured as follows: Section 2 presents a review of the literature on the subject under study, with emphasis on the determinants of banks’ liquidity risk and profitability; in Section 3, the data and methodology are described; Section 4 presents the data analysis and empirical results; and finally, Section 5 presents the conclusion of the study.
2. Literature Review
2.1. The Effects of Government Bonds on Banks
The sustainability and impact of public debt has been the subject of several studies because of countries’ high and growing debt and its effects on the real economy. Reinhart and Sbrancia (2011) state that periods of high debt in countries have been associated with an increasing incidence of bad loans or with the restructuring of public and private debt. These authors consider that loans granted to the government are a form of financial repression, a situation that occurs when the government limits the free financial flow of markets and which causes a crowding-out effect. Hauner (2009) studied the role of public debt in financial development, more specifically in the banking sector, and considers that “banking sectors that lend mainly to the public sector may develop more slowly, because it could make banks profitable but inefficient” (Hauner 2009, p. 171).
Concerning the effects of government bonds on bank activity in particular, several studies can be identified, such as Baskaya and Kalemli-Ozcan (2016) and Gennaioli et al. (2018). Baskaya and Kalemli-Ozcan (2016) investigated the effect of the country’s risk (exposure of banks to government bonds) on credit supply in Turkey, using the August 1999 earthquake as an exogenous shock that led to an increase in the bad credit risk. Using data from all operating banks between 1997 and 2012, the results show that banks with higher ex-ante exposure to treasury bills suffered greater shocks and decreased their ex-post loans. Gennaioli et al. (2018) analyzed the effects of sovereign debt securities on 20,060 banks in 191 countries, including 20 episodes of sovereign default between 1998 and 2012. The study found two relevant facts: First, banks hold government bonds in a higher percentage than average (9% of assets) in normal times, especially banks that grant fewer loans and operate in less financially developed countries; second, during the bad credit years, banks with average exposure to government bonds exhibit a lower loan growth rate than banks without bonds (seven percentage points below). These results are consistent with the view of “lazy banks” defended by Hauner (2009).
2.2. Determinants of Liquidity Risk and Bank Profitability
Liquidity and profitability are the most commonly used indicators to assess financial performance and efficiency in bank management (Chinoda 2014; Noman et al. 2015; Rahman et al. 2015; Islam and Nishiyama 2016). Liquidity can be defined as banks’ ability to finance the increase in their assets and to meet their obligations, without incurring unexpected losses (Vodová 2011). As Singh and Sharma (2016) indicate, banks that have an adequate level of liquidity guarantee fulfilment of their financial commitments and obligations towards depositors and thereby ensure greater public confidence. Determining the optimum level of liquidity is critical for banks’ management: Excess liquidity can cause banks’ profitability to decline, while a shortage of liquidity will make it difficult to meet their obligations (Vodová 2011; Singh and Sharma 2016). Profitability is the bank’s ability to make a profit from its business by investing its assets. This is an indicator that also measures the efficiency of management and the bank’s competitive position in the market, from the point of view of both assets and equity (Petria et al. 2015).
Numerous empirical studies in the economic literature investigate variables affecting banks’ liquidity and profitability, and most of them emphasize the importance of macroeconomic factors in the models estimated (Chinoda 2014; Moussa 2015; Petria et al. 2015; Chen et al. 2018; Sahyouni and Wang 2018). Some studies are country-specific, while others focus on a panel of countries (Petria et al. 2015).
Studies on determinants of bank liquidity were carried out by: Delechat et al. (2014) in Central America, Panama and the Dominican Republic; Vodová (2011) and Cucinelli (2013) in the euro area; Moussa (2015) in Africa, specifically, in Tunisia; and Singh and Sharma (2016) in Asia. Delechat et al. (2014) found that the demand for liquidity, in a preventive manner, is associated with measures such as banks’ size, profitability, capitalization and financial development and that greater liquidity is also associated with the dollarization of deposits. Vodová (2011) concluded, for Czech banks, that their liquidity is higher when capital adequacy and loan interest rates are higher. Additionally, liquidity measures identify a positive relationship with capitalization and the size of the bank. For the Eurozone, Cucinelli (2013) showed that larger banks have greater exposure to liquidity risk, while banks with higher capitalization have better liquidity in the long run. Moussa (2015) showed that financial performance, total assets, operating costs, GDP growth rate, inflation rate and lagged liquidity have a significant impact on bank liquidity. On the other hand, loan dimension, financial costs and total deposits do not have an impact on bank liquidity. Singh and Sharma (2016) found that the bank’s specific (except the cost of financing) and macroeconomic (except unemployment) factors significantly affect its liquidity, including the variables of margins, deposits, profitability, capital adequacy, GDP and inflation. Additionally, bank size and GDP have a negative effect on bank liquidity.
Regarding the determinants of bank profitability, studies carried out include, for example: In the euro area, Athanasoglou et al. (2006) and Petria et al. (2015); in the United States of America Chronopoulos et al. (2015); in Asia, Al-Jafari and Alchami (2014), Noman et al. (2015), Rahman et al. (2015), Islam and Nishiyama (2016), Mehta and Bhavani (2017) and Gharaibeh (2018); in Africa, Chinoda (2014); and at a multinational level, (Bourke 1989; Molyneux and Thornton 1992; Sahyouni and Wang 2018). Athanasoglou et al. (2006) and Petria et al. (2015) evaluated the main determinants of bank profitability in Europe. Using unbalanced panel data for the period 1998–2002, Athanasoglou et al. (2006) conclude that with the exception of liquidity, all of a bank’s specific determinants significantly affect its profitability. Regarding macroeconomic variables, inflation affects profitability positively and significantly and real GDP per capita has no significant effect. Petria et al. (2015) showed that credit and liquidity risk, management efficiency, business diversification, market concentration/competition and economic growth influence banks’ profitability in the period 2004–2011. In the US, Chronopoulos et al. (2015) analyzed banks from 1984 to 2010. The results showed that the competitive process reduces profitability, although not immediately. The financial crisis of 2007–2010 seems to have resulted in an increase in the persistence of banks’ profitability. Ting (2017) investigated the effects of financial development and government involvement on bank profitability, during the 2008 financial crisis. The results show that a positive effect of improved financial development is stronger on banks with weak government involvement than on banks with strong government involvement. In another context, Batrancea et al. (2009, 2013) showed that the global financial crisis was related to problems in regulating the banking system, which were solved by injecting liquidity into the system. It is relevant to take this into account to solve or avoid possible crises in the future.
In the Middle East, Al-Jafari and Alchami (2014) investigated the Syrian banking sector, using the generalized method of moments covering the period from 2004 to 2011, showing that banks’ specific determinants (liquidity risk, credit risk, bank size and administrative efficiency) significantly affect their profitability, as well as macroeconomic variables (inflation rate and real GDP growth rate). Noman et al. (2015) indicated that credit risk, cost efficiency, GPD growth and the real interest rate affect profitability negatively, while capital adequacy, liquidity, size, inflation and profitability of the stock market have a positive impact. Rahman et al. (2015), demonstrated that capital adequacy, bank size and loan intensity have positive and significant impacts on profitability, while inflation, the cost-to-income ratio and off-balance sheet have negative and significant impacts on banks’ profitability. Islam and Nishiyama (2016) showed a low level of persistence of profitability and a late impact of the global financial crisis on the banking sector in several Asian countries. Moreover, the authors found that financial solvency, management excellence, and interest and inflation rates have a positive influence on profitability while the cost of funding, liquidity, the financing gap, the term structure of the interest rate and economic growth have a negative influence. Mehta and Bhavani (2017) found evidence that cost efficiency, complementary margin and asset quality are the bank’s most significant specific variables for measuring profitability. GDP has a positive influence on the return on assets and return on equity, while the inflation rate does not affect profitability. Gharaibeh (2018) studied banks in Bahrain, finding that the capital adequacy ratio, the 2008 global financial crisis, the strength of capital, interest rate, the debt ratio and type of bank are the main determinants of commercial banks’ profitability.
In Africa, Chinoda (2014) identified that internal factors are the main determinants of banks’ profitability, while inflation reduces credit expansion, contributing to higher margins of net interest. Sahyouni and Wang (2018) investigated a wide range of banks in 11 developed and emerging countries during the period between 2011 and 2015, concluding that banks that create more liquidity are associated with lower profitability. Additionally, asset management, bank size and capital ratio are positively correlated with banks’ profitability. On the other hand, credit quality and operational efficiency affect banks’ profitability negatively. Moreover, the effects of inflation and GDP growth on bank profitability are statistically significant in developed countries, while inflation does not significantly affect the profitability of banks’ assets in emerging countries.
The empirical results of studies on the determinants, both of liquidity risk and bank profitability, differ significantly from country to country. However, most studies focus on common factors that significantly influence both liquidity risk and bank profitability. The literature generally divides them into two groups: Internal factors, specific to banks, and external factors, specific to the sector and to macroeconomics (Petria et al. 2015). In the case of internal factors, we can highlight factors such as bank size, credit risk, liquidity, efficiency of management, capital adequacy and concentration of the banking system, while in the case of external factors we have, for example, inflation rate and economic growth rate, real interest rate, unemployment rate and GDP per capita.
It is still necessary to highlight the difference between the functional philosophy of Islamic banks in relation to Western banks (Moussa 2015; Alzoubi 2017; Mehta and Bhavani 2017; Gharaibeh 2018). For example, studies on determinants of bank profitability in Bangladesh by Noman et al. (2015) and by Rahman et al. (2015) in similar periods, but applying different methodologies, reached the same conclusions in the following aspects: The size of the bank and capital adequacy affect banks’ profitability positively, while the cost-to-income ratio has negative effects on their profitability. However, differences stand out: Credit risk, GDP growth and the real interest rate affect banks’ profitability negatively in the study by Noman et al. (2015) and positively in the study by Rahman et al. (2015).
Regarding the use of panel data, possible with both balanced and unbalanced data, we find different studies. The studies by Chinoda (2014), Delechat et al. (2014), Singh and Sharma (2016), Mehta and Bhavani (2017) and Gharaibeh (2018) used balanced panels. Regarding unbalanced panels, studies include those of Athanasoglou et al. (2006), Vodová (2011), Cucinelli (2013), Islam and Nishiyama (2016) and Chen et al. (2018).
As for the methodology used, regarding panel data, the most commonly used is regression-based models using ordinary least squares with fixed and random effects (the studies by Cucinelli 2013; Singh and Sharma 2016; Chen et al. 2018). Generalized method of moments (GMM), Granger causality analysis or vector error correction models are applied. Regression using ordinary least squares (OLS), fixed effects and random effects is found in Cucinelli (2013), Kanwal and Nadeem (2013), Singh and Sharma (2016) and Chen et al. (2018) while GMM is used by Al-Jafari and Alchami (2014), Noman et al. (2015) and Islam and Nishiyama (2016).
In Europe, but considering only transition countries, Bonin et al. (2005) also used an unbalanced panel of a wide set of banks. With the objective of analyzing the differences in banks’ performance, regarding their ownership, the authors find that foreign-owned banks perform better.
The relationship between liquidity and profitability depends on banks’ business models and on the possible risks when granting credit. Maintaining liquid assets will make banks more resistant to liquidity shocks, thus reducing the negative influence from outside. However, at the same time, maintaining many liquid assets can influence negatively the level of profitability generated (Bordeleau and Graham 2010), because banks lose the opportunity to benefit from a higher return on the use of those assets. Bordeleau and Graham (2010) found empirical evidence of the relationship between liquid assets and bank profitability, applying panel data from 1997 to 2009 for a sample of large North American and Canadian banks. The results of the study showed non-linearity in the relationship: Profitability increases in banks that maintain liquid assets but there is a point where maintaining a higher level of net assets decreases profitability. In addition, empirical evidence also suggests that the relationship varies depending on the bank’s business model and the state of the economy.
Profitability and liquidity also play an important role in a bank’s development, depending on the time horizon considered. Banks’ short run survival depends on liquid assets (liquidity), while in the long run their survival, growth and expansion depend on their profitability (Diamond and Rajan 2001).
3. Data, Variables and Methodology
3.1. Sample and Data Sources
Our sample consists of all commercial banks operating in Cape Verde at the end of 2017 (7 in total, as per Appendix A Table A1), comprising annual observations for 18 years (2000 to 2017). A bank was created in 2014 with the mission of combating social exclusion (Novo Banco SA, CV) but it was dissolved in March 2017 due to successive negative results, so it was not included in the sample. The explanatory variables were divided into two groups: Those internal to banks (related to own indicators) and external ones (consisting of macroeconomic variables). Data for bank-specific variables were obtained from banks’ own annual reports and accounts, while data for macroeconomic variables were obtained from macroeconomic indicators and financial stability reports released by Banco de Cabo Verde.
As some variables do not present observations for every year, we organized them in an unbalanced panel in order to use as much information as possible.
3.2. Variables
In this section we present the dependent and independent variables used in this study.
3.2.1. Dependent Variables
This paper uses bank indicators associated with the dimensions of banking stability and efficiency, namely the liquidity risk (lrisk) and cash and deposits at the central bank (cash), as proxies for liquidity, and return on assets (ROA) and return on equity (ROE), as proxies for bank profitability.
lrisk is the transformation ratio and represents the percentage of deposits transformed into credits (Menicucci and Paolucci 2016). Cash and deposits in central banks (cash) is a measure of liquidity representing bank reserves and is computed as a percentage of banks’ net assets (Abbas and Espinoza 2016; Molyneux and Thornton 1992). Liquidity is required by banks to carry out daily transactions (Delechat et al. 2014). This facilitates the availability of funds in case of expected or unexpected withdrawals by customers (Singh and Sharma 2016). A bank with an adequate level of liquidity will have less difficulty in honoring its short run liabilities, even in difficult or extreme situations, such as bank runs (Petria et al. 2015). According to Orji et al. (2016), a high transformation ratio (above 70%) indicates a low liquidity position, increasing banks’ liquidity risk.
The ROA is one of the most commonly used indicators of financial performance and efficiency in banks’ management, and demonstrates banking efficiency in how they use their assets to generate profits (Chinoda 2014; Rahman et al. 2015; Islam and Nishiyama 2016). It is calculated by dividing net results by the total value of net banking assets (Athanasoglou et al. 2006; Petria et al. 2015; Singh and Sharma 2016; and Sahyouni and Wang 2018). Despite presenting disadvantages due to the existence of off-balance sheet assets, this is still the main index to evaluate bank profitability (Petria et al. 2015). ROE is a measure of bank profitability in proportion to equity and is measured by the ratio between net income and equity (Petria et al. 2015; Ting 2017).
3.2.2. Independent Variables
We consider two groups of independent variables: Bank-specific and macroeconomic variables, as described below:
Bank size (size): Refers to the size of the bank, usually measured by the natural logarithm of its total assets (Rahman et al. 2015; Singh and Sharma 2016). Several studies identify bank size as an internal factor that influences their performance (Petria et al. 2015). Delechat et al. (2014) found that liquidity levels were positively affected by size. For Singh and Sharma (2016), larger banks are able to generate more liquidity, but also have more liquidity needs.
Solvency ratio (capital): Defined by Bank of Cape Verde’s Notice 4/2007 as the adequacy between own funds and bank assets, weighted by market, operational and credit risks. This ratio shows the bank’s financial structure and reveals how assets are being financed and its ability to absorb losses (Petria et al. 2015; Singh and Sharma 2016). Higher solvency levels can have a positive effect on performance, as it reduces the risks assumed by the bank (Athanasoglou et al. 2006). Berger and Bouwman (2009) claimed that high levels of capital facilitate the creation of liquidity, reducing the liquidity risk but also the profitability of assets.
Credit to customers (credit): Represents the amount of financial resources granted by banks to their customers. The ratio is calculated by dividing total credit by net assets. According to Athanasoglou et al. (2006), banks with the highest ratios are the most profitable. An increase in credit to customers increases the liquidity risk and also increases banks’ profitability.
Deposits (deposit): Are the main source of funds for banks. However, banks are required to keep adequate liquidity to meet customer demands. Deposits are calculated as the percentage of net assets and, in general, researchers point out that high levels of deposits are associated with higher levels of liquidity (Singh and Sharma 2016) and with positive effects on asset profitability.
Government debt securities (bonds): Bonds or treasury bills are composed of short run treasury bills and medium/long run treasury bonds that represent government loans. This indicator is measured by the stock of government bonds in relation to total net assets (nominal values at the end of each economic year). When banks hold more government bonds, they can use those bonds as a substitute for their reserves in times of liquidity shortages, in order to reduce the liquidity risk (Rodrigues 1993; Alzoubi 2017). This variable is used in the study with or without the inclusion of Consolidated Financial Mobilization Bonds in order to compare the differences in estimates between the two scenarios. CFMBs resulted from the conversion of Cape Verde’s Treasury Bonds that were due in 1998 and have since remained fixed (it was a way that the government at the time found, with Portugal’s help, to artificially lower the debt or extend it, projecting for the future with a repurchase commitment), holders (only national institutions with liquidity at the time) having received the income from the fund that manages them. Law No. 70/V/98, of August 17, defines the main characteristics of these securities. Of the 7 banks in our sample and the current banking system, only BCA hold these securities.
Operational efficiency (efficiency): Represents efficiency in bank management and is measured by the cost-to-income ratio (operating costs divided by operating income). This indicator is widely used to measure bank profitability and is given by the weight of operating costs in the banking product (Mehta and Bhavani 2017). Rahman et al. (2015) found that the cost-to-income ratio has a negative impact on banks’ profitability.
Dummy variable for the 2008 financial crisis (fcrisis): Is a dummy variable that captures the permanent effects of the 2008 financial crisis on banks. According to Ting (2017, p. 371), the “2008 financial crisis exerted an unprecedented negative effect on the global banking system”. Chronopoulos et al. (2015) and Gharaibeh (2018) also considered the effect of the 2008 global financial crisis in their studies of banks’ profitability (as an alternative, we tried to split the sample into two sub-samples, for the pre- and post-crisis periods, but this alternative was not methodologically feasible given the very short time period in each sub-sample).
Real interest rate (interest): This is the credit interest rate that has been adjusted for inflation, reflecting the real cost of resources for the borrower and the real income for the creditor. The data source is World Bank Development Indicators. There is no unanimity regarding the effects of the interest rate on profitability, although the vast majority of studies point to a positive relationship between these two variables, since a higher interest rate increases the banks’ income from interest, thus increasing their profitability (Molyneux and Thornton 1992; Chinoda 2014; Islam and Nishiyama 2016; Gharaibeh 2018). Regarding liquidity, Vodová (2011) identifies a positive relationship between interest rates and liquidity.
Inflation (infl): Is the rate of change in the general price level of goods and services indicating the change in the currency’s purchasing power. Vodová (2011) and Moussa (2015) argue that banks reduce liquidity in periods of high inflation, due to the uncertainty but also because it has an associated cost, and increase it in the opposite situation because it helps to maintain the stability of the economy and the liquidity flow in the system. Several authors have found a positive relationship between inflation and profitability (Bourke 1989; Molyneux and Thornton 1992; Petria et al. 2015). The inflation rate decreases the value of the currency, which forces greater withdrawals by customers and increases banks’ vulnerability, as it affects the value of loans granted to customers (Singh and Sharma 2016).
Economic growth (gdp): Economic growth, expressed by the real GDP growth rate, has multiple consequences for banks’ liquidity and profitability. An increase in economic growth is usually reflected in an increase in deposits and credit to the economy (Bikker and Gerritsen 2018), with a negative impact on liquidity risk and a positive impact on banks’ profitability. On the other hand, when economic activity decreases, the demand for loans and deposits decreases and this affects liquidity and profit margins (Petria et al. 2015; Singh and Sharma 2016; Sahyouni and Wang 2018).
The data for the variables described above correspond to the values at the end of each financial year. Their respective calculation formulas, as well as the expected signs for the hypotheses raised are presented in Table 1.
3.3. Econometric Models’ Specifications
In order to analyze the effects of public debt securities on the liquidity and profitability of banks in Cape Verde, eight regression models were estimated for panel data using the method of OLS, in an approximation to the models proposed by Singh and Sharma (2016) and Sahyouni and Wang (2018), corrected for problems of endogeneity, heteroscedasticity and autocorrelation. For this purpose, we estimate several models using lags for the independent variables. The fixed effects model was employed in all regressions to control banks’ heterogeneity. Although the Hausman test (Hausman 1978) can help decide between random and fixed effects, Singh and Sharma (2016) argue that fixed effects estimates are generally preferred over random effects estimates because the former produce consistent results and are more robust. Moreover, it is argued that when the problem is the availability of data, implying unbalanced panel data, the fixed effects model is more appropriate (see, for example, Athanasoglou et al. 2006). In addition, fixed effects allow a greater number of coefficients to be integrated into the models, when compared with random effects (in this case limited by the small number of units under analysis). Thus, four models were estimated to determine the effects of public bonds on banks’ liquidity and cash. Models (1) and (3), described below, represent the effects on lrisk and on cash without including CFMB in the bonds variable, while models (2) and (4) are similar, but including CFMB in those variables
Model (1):
Model (3):
Similarly, for the dependent variables ROA and ROE, two fixed effects models were estimated. Models (5) and (7) are presented below, with models (6) and (8) being similar but including CFMB in the public bonds variables. Note that the variables are not the same in models (5) and (6) and in models (6) and (7), since we always present the best models, after correcting for autocorrelation and endogeneity.
Model (5):
Model (7)
where Δlriskit denotes the variation in liquidity risk, cashit represents cash and deposits at the central bank, ROAitis the return on bank i’s assets at time t and ROEit is the return on equity of bank i’s at time t (these are the dependent variables). The explanatory variables for each bank are: Variation in liquidity risk at time t−1(Δlriskit−1), cash at time t − 1 (cashit−1), return on assets at time t, t − 1 and t − 2 (ROAit, ROAit−1 and ROAit−2), variation in return on equity at time t − 1 and t − 2 (ΔROEit−1 and ΔROEit−2), bank’s dimension at time t, t − 1 and t − 2 (sizeit, sizeit−1 and sizeit−2), solvability ratio at time t, t − 1 and t − 2 (capitalit, capitalit−1 and capitalit−2),credit to customers at time t, t − 1 and t − 2 (creditit, creditit−1 and creditit−2), variation of customer deposits at time t, t − 1 and t − 2 (Δdepositit, Δdepositit−2 and Δdepositit−2), public debt securities (except Consolidated Financial Mobilization Securities) at time t, t − 1 and t − 2 (bondsit, bondsit−2 and bondsit−2), public debt securities including Consolidated Financial Mobilization Securities at time t, t − 1 and t − 2 (bonds_cfmbit, bonds_cfmbit−2 and bonds_cfmbit−2), variation on bank operational efficiency at time t, t−1 and t−2 (Δefficiencyit, Δefficiencyit−1 and Δefficiencyit−2), dummy variable for the 2008 global financial crisis at time t (fcrisisit), real interest rate at time t, t − 1 and t − 2 (interestt, interestt−1 and interestt−2), inflation rate at time t, t − 1 and t − 2 (inflt, inflt−1 and inflt−2) and real growth rate at time t, t − 1 and t − 2 (gdpt, gdpt−1 and gdpt−2). The term ai is the fixed component of the error and µit is the random error—both making up the regression error (εit).
4. Data and Results
4.1. Preliminary Data Analysis: Descriptive Statistics
As shown in Table 2, the average lrisk is 70.23% (a level slightly above 70%, a threshold considered by Orji et al. 2016, as indicating low liquidity and a higher liquidity risk for banks), with a standard deviation of 30.42%, ranging from 17.76% to 187.84%. After the 2008 financial crisis (more specifically, between 2008 and 2013), the banking sector in Cape Verde experienced a period of greater liquidity risk, with an average above 70% (reaching its maximum in 2010 of 107.76%). Cash and deposits at the central bank (bank reserves), measured as a percentage of net assets, initially averaged 20% between 2000 and 2004 (considerably above the average of 12.77% in the whole period under review). Due to the 2008 financial crisis, a period when banks faced greater liquidity risks, there was a drastic drop in these banks’ reserves, which did not return to pre-crisis levels. The two largest banks in the banking system (Caixa Económica de Cabo Verde and Banco Comercial do Atlântico), which concentrate two thirds of the market, managed to have more reserve capacities. The remaining banks did not reach 10% (with the exception of Ecobank Cabo Verde). The average return on assets is 0.08%, with a minimum of -9.88% and a maximum of 2.17%, and with a standard deviation of 2.05%. The average ROE is 6.01%. From 2008, both ROA and ROE fell drastically. The annual average observed in ROA and ROE in Cape Verde is low, when compared with the average values in similar countries of Sub-Saharan Africa, like Mauritius and Seychelles. For example, from 2010 to 2015, the average ROA for Cape Verde (which is part of Group 2—low average income countries classified by the World Bank) was 0.58% when the average for Sub-Saharan Africa was 1.96%, in a sample of 47 countries (even for Group 1 countries—low income, which had an average ROA higher than that of Cape Verde, equal to 1.97%).
In the post-crisis period (between 2009 and 2017), the average ROA of 0.61% in Cape Verde was below the values observed in Mauritius (1.47%) and Seychelles (2.59%) (data from the World Bank’s Global Financial Development Indicators). During this period, the average ROE of banks in Cape Verde was also lower (9.12%, compared to 10.2% in Mauritius and 27.05% in Seychelles). According to the World Bank Group (2019, p. 11), Cape Verde’s banking sector “in general is still limited by low profitability and high operating costs.”. This is because net results did not accompany the rapid growth of the system’s assets. Assets grew considerably, due to the growth of investment in credits and public debt securities. On the other hand, the high growth in operating expenses and the increase in impairments due to the increase in bad loans eroded the intermediation margins, lowering the sector’s net results (Baptista 2006). Concerning the independent variables, the average capital is 17.67% with a minimum value of 10.25%, slightly above the 10% minimum legal limit established for onshore banks. On average, in the last 18 years, the size of the banking sector (measured by the logarithm of net assets) stood at 9.64, and the value of bank deposits, measured as a percentage of net assets, stood at 75.63%. Loans to customers averaged 50.57% of net assets. Banks’ operational efficiency, measured by the cost-to-income ratio, averages 88.83% (well above the average obtained by the banks in Mauritius and Seychelles). For example, in the post-crisis period (2009–2017), according to the World Bank’s Global Financial Development Indicators, Cape Verde had an average ROE of 71.03%, above the average for Mauritius and Seychelles, which recorded 44.08% and 36.58%, respectively. This demonstrates the inefficiency of banks in Cape Verde.
Regarding public debt securities (bonds), their average is 11.22% without the inclusion of CFMBs, a value well above the 5% minimum required by law—which demonstrates not only the obligation but also banks’ preference for public bonds. When CFMBs are included (held only by Banco Comercial do Atlântico), the average increases to 13.53%.
According to data from the Banco de Cabo Verde for the period 2000–2017, the average rate of real economic growth in Cape Verde (4.05%) was higher than the observed average rate of inflation (1.65%). Comparing with other similar countries, the World Bank’s Global Development Indicators show that Cape Verde had an average growth of 4.94%, higher than the average in Sub-Saharan African countries (4.59%) and the average of similar economies such as Mauritius and Seychelles (4.15% and 3.15%, respectively). In addition, the average inflation rate was low (1.66%) when compared to Mauritius (4.75%), Seychelles (6.28%) and sub-Saharan African countries (5.60%) and close to that of the euro area countries. The real interest rate stood at an average of 10.09% between 2000 and 2017 (data from the Bank of Cape Verde), Cape Verde having a higher average real interest rate (8.02% in the period 2006–2017), compared for example with 7.47% in Mauritius and 4.77% in Seychelles (World Bank data). Two main factors are responsible for the higher real interest rate: Low inflation and high nominal interest rates, driven by a low savings rate, high risk credit to the private sector and the considerable participation of banks in public debt. In the last five years, the average interest rate on credit with a maturity between 91 and 180 days was fixed at 10.4% and bank overdrafts were fixed at an average of 17.0% (BCV 2018).
4.2. Panel Unit Root Test
Unit root analysis is useful to determine variables’ degree of integration, being an indispensable analysis for good data modelling (Ilgun 2016). To check the stationarity of the variables, the first-generation individual unit root test for panels was applied, namely the augmented Dickey-Fuller, Fisher type (ADF-Fisher), considered suitable for unbalanced panels (Maddala and Wu 1999; Firat 2016). Taking into account the fact that the ADF-Fisher test may lose power when including a trend, and even more so in moderate samples (Dejong and Whiteman 1991), it was decided to perform the test without trend. Thus, the type of random walk chosen was with drift (individual intercept) and the selection of the number of lags was automatic, using the Schwarz criterion. The null hypothesis of the presence of a unit root was rejected in levels for most variables at a significance of 1% (with the exception of ROA which is significant at the level of 10%). According to Table 3, the lrisk, ROE, deposit and efficiency variables proved to be integrated of order 1, I (1), stationary in first difference with 1% significance.
4.3. Correlation Matrix
As in regression analysis, correlation with non-stationary variables can be a spurious correlation, as there is no cause-effect relationship. Thus, based on the stationarity of the variables, Appendix B contains information on the degree of correlation and the level of significance of the relationships between the variables (especially the explanatory variables). Between the dependent variables there is no significant relationship, except for the relationship between cash and ROA (r = −0.3937, p < 0.01), although the magnitude is weak.
The variables denoting the public debt securities, represented by bonds and government debt securities ratio (including CFMB) (bonds_cfmb), have significant relationships with gdp, capital, size, cash and ROE. The relationship is positive with GDP (r = 0.2420 and r = 0.2637, respectively, for p < 0.05), size (r = 0.3542, p < 0.01 for bonds_cfmb only), cash (r = 0.2658 and r = 0.3017, respectively, for p < 0.05) and ROE (r = 0.2869, p < 0.01 for bonds only). The relationship with capital is negative (r = −0.3176 and r = −0.3933, respectively, for p < 0.01). This means that when banks increase their stocks of government bonds as a percentage of their assets, on the one hand it increases economic growth (GDP) and, on the other hand, it decreases the bank’s solvency (capital) in relation to the increase in assets from increased investment in securities (compared to the bank’s own funds). Banks’ size, measured in natural logarithms, is only positively correlated with public securities when they include the CFMB (r = 0.3541, p < 0.01). However, this relationship is difficult to explain, as only one bank owns them (BCA). Despite the prudential question, in which banks in Cape Verde are required to invest at least 5% of deposits in government bonds and government-guaranteed bonds, it was not possible to show any relationship between changes in deposits and the stock of public bonds, measured as a percentage of assets.
The dummy variable for the 2008 financial crisis has a statistically significant negative correlation with lrisk, cash, ROA, bonds, bonds_cfmb and GDP and is positively correlated with capital and credit.
The correlation matrix (Appendix B Table A2) shows that, in general, with the majority presenting statistical significance at the 1% level. The analysis shows the non-existence of multicollinearity problems, since correlations do not exceed 0.80 (Studenmund 2005), except between bonds and bonds_cfmb, where r = 0.8264, not a problem since these two explanatory variables were used separately.
4.4. Results of Panel Diagnostic Tests
Since our panel is unbalanced, auxiliary regressions were used to confirm that the models do not suffer from problems of endogeneity and autocorrelation. Endogeneity was tested using an auxiliary regression where the residuals are the dependent variables (Wooldridge 2012). All models confirmed exogeneity of the regressors.
As for heteroscedasticity, considering the data structure, first it is necessary to proceed with the normality test of the residuals. The Jarque and Bera (1987) statistics confirm the normality of the regression residuals with a p-value above 0.05 for all models. Thus, under the null hypothesis of equal variances, tests were performed to verify the presence of heteroscedasticity in the models, employing the Bartlett (once models have normal residuals). Under the normality of the residuals, the Bartlett test results showed a p-value of X2(k−1) > 0.05 for all estimated models, meaning that all variances are equal (homoscedasticity).
Since all regressors are exogenous and the residuals are homoscedastic, the least squares method (OLS) is efficient, and the fixed effects model is more appropriate for the panel structure under analysis. Similarly, the results of the models do not show the presence of autocorrelation between residuals over time (p-value above 0.05 for all models). All models are corrected for autocorrelation of 1, except models (5) and (6), which were corrected for autocorrelation of order 2. For these models, we tested the joint significance of the lagged residual coefficients (test F), whose p-value of the tests (p > 0.05) confirmed the absence of autocorrelation.
4.5. Results
Table 4 and Table 5 show the estimated effects of public debt securities on liquidity and profitability of banks in Cape Verde. The estimations were made considering the bonds variable with and without the inclusion of Consolidated Financial Mobilization Bonds. Banco Comercial do Atlântico was the only commercial bank subscribing to Consolidated Financial Mobilization Securities, with a nominal value of 6.4 thousand million ECV (Escudo Cabo-Verdiano). The subscription to CFMB by BCA was an imposition made on the bank in the conversion of the debt, since the bank was one of the State’s creditors at the time. The replacement of the debt of the State of Cape Verde by these securities was at a lower rate of return than that practiced in the market. In the beginning, interest rates were 4% (with around 10% market rates), but it has been decreasing over the years. The sale of these bonds was a possibility allowed by law. However, if the BCA did not sell them and kept them until maturity, it was because no one was interested in buying them, not even the Central Bank, because of their low rate of return. These bonds were indexed to the yield on European bonds (German, French and UK government bonds) at low interest rates. The reason for the low profitability of these securities is because the fund manager (Banco de Portugal) has always been concerned about safeguarding the capital (not overexposing to the fund’s investment risk) and hence investing in securities from low-risk countries.
Beginning with the static models, we found that those models suffered from autocorrelation, requiring distributed lag models. The results show that government bonds (bonds) have no effect on the variation of liquidity risk or on cash and deposits at the central bank (Table 4). However, the results show that government bonds (bonds) affect bank profitability in Cape Verde, although just in the profitability of assets (Table 5). In the short run, government bonds (bonds) have negative effects on the profitability of banks’ assets only when government debt securities include the Consolidated Securities of Financial Mobilization. When lagged one period for model (5) and two periods for model (6), the results of the t-statistic (through the Wald test) suggest that the bonds variable has no individual significance (p > 0.05) for all these moments. Together, it seems that bonds is statistically significant at time t, t − 1 and t − 2. It can be concluded that the variable is relevant when considering all the moments (Appendix C Table A3), even though its contemporary impact is not significant on the return on assets when government debt securities do not include Consolidated Securities of Financial Mobilization. Although they are low-yielding assets (with rates usually about half those charged in bank loans), the option of investing in government bonds is a safe alternative for bank liquidity when compared to loans (whose default rates are high). According to the results, this option is not favorable to banks’ profitability in the short run, because bonds have negative effects on the profitability of assets. Higher investment in government bonds contributes to decreasing banks’ liquidity in the short run (which could be invested in profitable assets), thus reducing bank profitability in the short run. Therefore, in the long-run, the research results show positive impacts (statistically significant at a 5% level) of government debt securities on ROA of 0.038 for model (5) and a negative impact on ROA of 0.0115 for model (6). It should also be noted that the impact is greater when the bonds variable does not include CFMB (model (5)). It can be concluded that, in long run, if government debt securities increase by 1 percentage point in the total of banks’ net assets, the return on assets will increase by 0.038 percentage points in model (5) and decrease by 0.0115 in model (6). The results of the effects on ROE (models (7) and (8)) are not statistically significant, suggesting that the reduced profitability of government debt securities only influences the profitability of assets.
Analyzing the significance of the lags in relation to the equation models, as the value of the F statistic for the eight models was greater than the critical value (2.37), the null hypothesis is rejected, so the models with lags are jointly significant. Hence, models with lagged variables are better than the static model for estimating these relationships.
The results of the F-statistic tests show that, for all models estimated under fixed effects (Table 4 and Table 5), the null hypothesis that the independent variables do not explain the dependent variables can be rejected at a 1% level of significance. As the models are significant at a 99 percent confidence level, it can be concluded that the independent variables explain both the liquidity risk and the profitability of bank in Cape Verde.
Analyzing the explanatory power of the models (5) and (6) from the behavior of the bonds variable on the profitability of assets, in Appendix C it is noted that the models are slightly better when the bonds variable include the CFMB. In this case, model (6) whose adjusted R2 is 0.6588, is better than model (5), with an adjusted R2 equal to 0.6546. The contrary happens with models which consider ROE as the dependent variable.
According to the economic literature (Chinoda 2014; Noman et al. 2015; Rahman et al. 2015; Islam and Nishiyama 2016), both profitability and liquidity play an important role in a bank’s development. In this regard, Diamond and Rajan (2001) claim that a bank’s survival in the short run depends on its liquidity level, while in the medium and long run it depends on its profitability. In any case, the literature is clear with regard to these two indicators, with the empirical results of research on their determinants differing significantly from country to country (depending on the context and economic characteristics of each country or region).
5. Conclusions
This paper analyzed empirically the effects of government bonds on changes in liquidity risk, cash and deposits at the central bank and on the profitability of banks’ assets and equity in Cape Verde. A sample comprising all commercial banks operating in the country at the end of 2017 was analyzed, organized in unbalanced panel data for the period from 2000 to 2017. In this period, banks had on average 11.22% of their net assets in public bonds (not considering the Consolidated Financial Mobilization Securities).
As our panel is unbalanced, the fixed effects model is considered a more appropriate estimation methodology. Tests of the statistical significance of the lags in the equation models confirmed that the models with lagged independent variables are better suited than the static models to estimate the effects of government bonds on banks’ liquidity risk and profitability.
The results obtained show that government bonds have no significant effect on changes in liquidity risk and cash and deposits at the central bank. Public debt securities, measured as a percentage of net assets, have a significant effect on bank profitability, but only when considering the return on assets. When the bonds variable includes Consolidated Financial Mobilization Securities, the model can better explain the effects of government bonds on the return on assets. Thus, the empirical results show that if public debt securities (including Consolidated Financial Mobilization Securities), as a percentage of assets, increase by 1 percentage point, the return on assets will decrease by 0.06653 percentage points in the short run and 0.015 percentage points in the long run. Without the inclusion of Consolidated Financial Mobilization Securities, an increase of 1 percentage point in government bonds increases by 0.038 percentage points the return on assets in the long run.
The study concludes that public bonds, being low-yielding assets, are expected to have negative effects on banks’ profitability. However, being an alternative to credit for the application of excess liquidity in a banking sector where the volume of non-performing loans has increased, the banks’ strategy of holding public debt securities seems adequate to gain profitability in the long run. Although with lower profitability, public debt securities are risk-free assets, hence involving fewer bank resources in their management.
However, as long as the interest rates on loans remain very high (even despite the higher risk involved), the low rates of return on public bonds will continue to influence banks’ profitability negatively in the short run, particularly when public bonds include the Consolidated Securities of Financial Mobilization (high opportunity cost). This may be one of the reasons for the low profitability rates of banks in Cape Verde when compared to other sub-Saharan African countries in similar contexts, such as Mauritius and Seychelles. Another reason may be related to the participation of Aeroporto e Segurança Aéreas (ASA) and Instituto Nacional de Previdência Social (INPS) in public debt auctions. These are two public institutions with high liquidity levels and are authorized by the Central Bank of Cape Verde to participate in the primary domestic public debt market. This situation results in less liquidity for banks and the interest rates of public debt from the offer at auctions can be influenced by the liquidity of ASA and INPS, with possible effects on banks’ profitability. This is a structural problem in the Cape Verdean economy, in addition to the concentration of savings from workers in an institution (INPS) that does not assume market risk. In competition with banks, it prefers to invest in risk-free assets and directly in the primary market, conditioning interest rates in the financial market.
The focus on a single-country sample could be considered a limitation, but it allows us to approach the research problem as a kind of case study, considering in more depth the idiosyncrasies of the economy of Cape Verde. It would however be of interest, in future research, to incorporate data from banks in similar countries (small island developing states) and compare the characteristics of the banking sectors and the results obtained in the estimated models.
Author Contributions
Conceptualization, J.C.T., C.V. and P.F.; methodology, J.C.T., C.V. and P.F.; formal analysis, J.C.T., C.V. and P.F.; writing—original draft preparation, J.C.T., C.V. and P.F.; writing—review and editing, J.C.T., C.V. and P.F. All authors have read and agreed to the published version of the manuscript.
Funding
Paulo Ferreira acknowledges the financial support of Fundação para a Ciência e a Tecnologia (grants UIDB/05064/2020 and UIDB/04007/2020). Carlos Vieira acknowledges financial support from Fundação para a Ciência e a Tecnologia (UIDB/04007/2020).
Institutional Review Board Statement
Not applicable.
Informed Consent Statement
Not applicable.
Data Availability Statement
The data presented in this study are available on request from the corresponding author.
Conflicts of Interest
The authors declare no conflict of interest.
Appendix A

Table A1.
Sample units.
| Commercial Banks | Notes |
|---|---|
| BCA—Banco Comercial do Atlântico, S.A. | Founded 1993 |
| CXE—Caixa Económica de Cabo Verde, S.A. | Founded 1928 |
| BIA—Banco Interatlântico, S.A. | Founded 1998 |
| BCN—Banco Cabo-verdiano de Negócios, S.A. | Created in February 2005, starting activities during that year. |
| BAI—Banco BAI Cabo Verde, S.A. | Started its activities in the last quarter of 2008. |
| BIC—Banco Internacional de Cabo Verde, S.A. | Formerly known as Banco Espírito Santo de Cabo Verde, since 2006 an offshore bank (IFI)—BES SFE Cabo Verde. As of July 6, 2010, it became Banco Espírito Santo Cabo Verde (BESCV) and on October 31, 2014 it adopted the name Banco Internacional de Cabo Verde, S.A. |
| ECO—Ecobank Cabo Verde, S.A. | Formerly Ecobank Cabo Verde, Serviços Financeiros, Agência de Câmbio, S.A. As of June 1, 2010, it became a commercial bank, with the license of Banco de Cabo Verde. |
Appendix B
Table A2.
Correlation matrix.
| Variables | Δ(lrisk) | Cash | ROA | Δ(ROE) | Size | Capital | Credit | Δ(Deposit) | Bonds | bonds_cfmb | Δ(Efficiency) | Fcrisis | Interest | Infl | Gdp |
|---|---|---|---|---|---|---|---|---|---|---|---|---|---|---|---|
| Δ(lrisk) | 1 | ||||||||||||||
| cash | 0.0244 | 1 | |||||||||||||
| ROA | −0.1731 | 0.3937 *** | 1 | ||||||||||||
| Δ(ROE) | 0.0508 | −0.0131 | 0.1296 | 1 | |||||||||||
| size | −0.0815 | −0.0131 | 0.2873 *** | 0.2849 *** | 1 | ||||||||||
| capital | −0.0989 | 0.2148 * | −0.3625 *** | 0.1080 | −0.4912 *** | 1 | |||||||||
| credit | 0.1838 * | −0.0209 | 0.1800 | −0.1786 | 0.3203 *** | −0.5382 *** | 1 | ||||||||
| Δ(deposit) | −0.6037 *** | 0.0190 | −0.0296 | −0.0312 | −0.1409 | 0.3790 *** | −0.2002 * | 1 | |||||||
| bonds | −0.1003 | 0.2685 ** | 0.1248 | 0.2869 *** | 0.0486 | −0.3176 *** | −0.0593 | −0.0342 | 1 | ||||||
| bonds_cfmb | −0.0633 | 0.3017 *** | 0.1662 | 0.1781 | 0.3542 *** | −0.3933 *** | −0.1274 | −0.0612 | 0.8264 *** | 1 | |||||
| Δ(efficiency) | −0.2391 ** | 0.1745 | 0.2862 *** | −0.4439 *** | 0.2785 ** | −0.1594 | 0.0640 | 0.0679 | −0.0853 | −0.0132 | 1 | ||||
| fcrisis | −0.0907 | −0.06156 *** | −0.3135 *** | −0.1662 | 0.1336 | 0.2167 ** | 0.2130 * | 0.0824 | −0.3790 *** | −0.4435 *** | −0.0500 | 1 | |||
| interest | −0.0736 | 0.1694 | −0.0513 | −0.0977 | −0.0686 | 0.1077 | −0.1297 | 0.0200 | 0.1361 | 0.1334 | 0.1054 | −0.0628 | 1 | ||
| infl | 0.1309 | 0.0328 | 0.0932 | 0.0835 | 0.0073 | −0.2369 ** | 0.1674 | −0.0364 | −0.1132 | −0.0507 | −0.1188 | −0.1363 | −0.6982 *** | 1 | |
| gdp | 0.1321 | 0.4402 *** | 0.2449 ** | 0.1986 * | −0.0634 | −0.1787 | −0.1501 | −0.0973 | 0.2420 ** | 0.2637 ** | 0.0269 | −0.6984 *** | −0.2968 *** | 0.4759 *** | 1 |
Obs: Level of statistical significance: *** significant at 1%; ** significant at 5%; e * significant at 10%.
Appendix C
Table A3.
Results of the hypothesis test for long run propensity (t test).
| Effects on Liquidity Risk | Effects on Profitability | |||||||
|---|---|---|---|---|---|---|---|---|
| Variables | (1) | (2) | (3) | (4) | (5) | (6) | (7) | (8) |
| (Contemporary and Lagged) | Impact | Impact | Impact | Impact | Impact | Impact | Impact | Impact |
| Bank-specific factors (internal) | ||||||||
| size | 2.8799 ** | 2.3808 ** | −0.1602 *** | 11.5586 ** | 11.7723 *** | |||
| capital | −0.6828 ** | −0.7146 ** | −0.0513 | −0.0498 | −0.0926 *** | −0.0044 | 1.2500 *** | 1.2436 *** |
| credit | −0.2368*** | −0.2233 *** | −0.1198 | −0.1094 | −0.0139 ** | 0.1704 | 0.1072 * | |
| Δ(deposit) | −1.1904 *** | −1.1925 *** | 0.0498 *** | 0.0435 ** | ||||
| bonds | −0.2578 | −0.1857 | 0.0574 | 0.1159 | 0.0380 *** | −0.0115 *** | 0.0307 | −0.0429 |
| Δ(lrisk) | −0.0697 | |||||||
| ROA | ||||||||
| Δ(efficiency) | 0.1776 | 1.1772 | 0.0355 | 0.0329 | 0.0163 *** | 0.0042 | −0.2975 *** | −0.2487 *** |
| fcrisis | ||||||||
| Macroeconomic factors (external | ||||||||
| interest | 1.2412 * | 1.2195 * | 0.2141 | 0.2032 | ||||
| infl | 0.9307 | 0.7588 | ||||||
| gdp | −0.3281 | −0.6243 | ||||||
*** significant at 1%; ** significant at 5%; and e * significant at 10%. Obs: (a) models under study: (1) model Δ(lrisk) without including CFMB; (2) model Δ(lrisk) including CFMB; (3) model cash without including CFMB; (4) model cash including CFMB; (5) model ROA without including CFMB; (6) model ROA including CFMB; (7) model Δ(ROE) without including CFMB; and (8) model Δ(ROE) including CFMB; and (b) level of statistical significance: *** significant at 1%; ** significant at 5%; and e * significant at 10%. (a) the dependent variables are lagged one period for models (1) to (4) and two periods for models (5) to (8) (according to the regression models in Table 4 and Table 5).
References
- Abbas, Syed, and Raphael Espinoza. 2016. Why Do Banks in Developing Countries Hold Government Securities? UCL SSEES Economics and Business. Working Paper Series 2016/1; London: UCL School of Slavonic and East European Studies (SSEES). [Google Scholar]
- African Economic Outlook. 2017. Cabo Verde: African Economic Outlook 2017. Available online: www.africaneconomicoutlook.org (accessed on 10 November 2020).
- Al-Jafari, Mohamed, and Mohammad Alchami. 2014. Determinants of bank profitability: Evidence from Syria. Journal of Applied Finance and Banking 4: 17–45. [Google Scholar]
- Altayligil, Yadin, and Resat Akkay. 2013. The effect of the domestic debt on the financial development: A case study for Turkey. International Journal of Economics and Finance 5: 64–74. [Google Scholar] [CrossRef]
- Alzoubi, Tariq. 2017. Determinants of liquidity risk in Islamic banks. Banks and Bank Systems 12: 142–48. [Google Scholar] [CrossRef] [Green Version]
- Athanasoglou, Panayiotis, Matthaios Delis, and Christos Staikouras. 2006. Determinants of bank profitability in the south eastern European region. Bank of Greece Working Paper 47. Available online: https://www.bankofgreece.gr/Publications/Paper200647.pdf (accessed on 10 November 2020).
- Baptista, José. 2006. O Custo de Intermediação Financeira em Cabo Verde—Factores Condicionantes. Cadernos do Banco de Cabo Verde, Série Working Papers 01. Praia: Banco de Cabo Verde. [Google Scholar]
- Baskaya, Yusuf, and Sebnem Kalemli-Ozcan. 2016. Sovereign Risk and Bank Lending: Evidence from 1999 Turkish Earthquake. NBER Working Paper 22335. Cambridge: NBER. [Google Scholar]
- Batrancea, Ioan, Andrei Moscviciov, Catalin Sabau, and Larissa-Margareta Batrancea. 2013. Banking crisis: Causes, characteristic and solutions. Proceedings of the DIEM 1: 16–29. [Google Scholar]
- Batrancea, Larissa-Margareta, Ioan Batrancea, and Andrei Moscviciov. 2009. The roots of the world financial crisis. Annals of the Faculty of Economics 3: 57–62. [Google Scholar]
- Berger, Allen, and Christa Bouwman. 2009. Bank liquidity creation. Review of Financial Studies 22: 3779–837. [Google Scholar] [CrossRef] [Green Version]
- Bikker, Jacob, and Dirk Gerritsen. 2018. Determinants of Interest Rates on Time Deposits and Savings Accounts: Macro Factors, Bank Risk, and Account Features. International Review of Finance 18: 169–216. [Google Scholar] [CrossRef] [Green Version]
- Bonin, John, Iftekhar Hasan, and Paul Wachtel. 2005. Bank performance, efficiency and ownership in transition countries. Journal of Banking and Finance 29: 31–53. [Google Scholar] [CrossRef] [Green Version]
- Bordeleau, Éttiene, and Christopher Graham. 2010. The Impact of Liquidity on Bank Profitability. Working Paper 38. Ottawa: Bank of Canada. [Google Scholar]
- Bourke, Philip. 1989. Concentration and other determinants of bank profitability in Europe, North America and Australia. Journal of Banking and Finance 13: 65–79. [Google Scholar] [CrossRef]
- Brito, Joao. 2014. Growth Diagnostic of Cape Verdean Economy. MPRA Paper 63407. Munich Personal RePEc Archive, Munich, Germany. [Google Scholar]
- Chen, Yi-Kai, Chung-Hua Shen, Lanfeng Kao, and Chuan-Yi Yeh. 2018. Bank Liquidity Risk and Performance. Review of Pacific Basin Financial Markets and Policies 21: 1–40. [Google Scholar] [CrossRef]
- Chinoda, Tough. 2014. The Determinants of Commercial Banks Profitability in Zimbabwe (2009–2014). Journal of Economics and Finance 5: 69–80. [Google Scholar] [CrossRef]
- Christie, Tamoya, and Felix Rioja. 2014. Government Expenditures, Financing, and Economic Growth in Cape Verde. Journal of Economics and Development Studies 2: 1–19. [Google Scholar] [CrossRef] [Green Version]
- Chronopoulos, Dimitris, Hong Liu, Fiona McMillan, and John Wilson. 2015. The dynamics of US bank profitability. The European Journal of Finance 21: 426–43. [Google Scholar] [CrossRef]
- Cucinelli, Doriana. 2013. The Determinants of Bank Liquidity Risk within the Context of Euro Area. Interdisciplinary Journal of Research in Business 2: 51–64. [Google Scholar]
- Dejong, David, and Charles Whiteman. 1991. Reconsidering trends and random walks in macroeconomic time series. Journal of Monetary Economics 28: 221–54. [Google Scholar] [CrossRef]
- Delechat, Corinne, Camila Arbelaez, Priscilla Muthoora, and Svetlana Vtyurina. 2014. The Determinants of Banks’ Liquidity Buffers in Central America. Monetaria—Centro de Estudios Monetarios Latinoamericanos (CEMLA) 1: 83–129. [Google Scholar] [CrossRef] [Green Version]
- Demirguc-Kunt, Asli, Eik Feyen, and Ross Levine. 2013. The Evolving Importance of Banks and Securities Markets. World Bank Economic Review 27: 476–90. [Google Scholar] [CrossRef] [Green Version]
- Diamond, Douglas, and Raghuram Rajan. 2001. Liquidity Risk, Liquidity Creation and Financial Fragility: A Theory of Banking. Journal of Political Economy 109: 287–327. [Google Scholar] [CrossRef]
- Firat, Hanifi. 2016. Is real GDP stationary? Evidence from some unit root tests for the advanced economies. Journal of Social and Economic Statistics 5: 60–80. [Google Scholar]
- Fitch Ratings. 2019. Rating Navigator—Cabo Verde. Available online: https://app.fitchconnect.com/search/research/article/RPT_10059918 (accessed on 10 November 2020).
- Gennaioli, Nicola, Alberto Martin, and Stefano Rossi. 2018. Banks, government Bonds, and Default: What do the data Say? Journal of Monetary Economics 98: 98–113. [Google Scholar] [CrossRef]
- Gharaibeh, Ahmad. 2018. Empirical Evidence of the Determinants of Commercial Banks Profitability in Bahrain. Journal of Emerging Trends in Economics and Management Sciences 6: 299–314. [Google Scholar]
- Gorton, Gary, and Andrew Winton. 2002. Financial Intermediation. NBER Working Paper 8928. Cambridge: NBER. [Google Scholar]
- Gorton, Gary, and Lixin Huang. 2004. Liquidity, Efficiency and Bank Bailouts. American Economic Review 94: 455–83. [Google Scholar] [CrossRef] [Green Version]
- Hauner, David. 2009. Public debt and financial development. Journal of Development Economics 88: 171–83. [Google Scholar] [CrossRef]
- Hausman, Jerry. 1978. Specification tests in econometrics. Econometrica: Journal of the Econometric Society 46: 1251–71. [Google Scholar] [CrossRef] [Green Version]
- Ilgun, Mirac. 2016. Financial development and domestic public debt in emerging economies: A panel cointegration analysis. Journal of Applied Economics and Business Research 6: 284–96. [Google Scholar]
- Islam, Shahidul, and Shin-Ichi Nishiyama. 2016. The Determinants of Bank Profitability: Dynamic Panel Evidence from South Asian Countries. Journal of Applied Finance and Banking 6: 77–97. [Google Scholar]
- Jarque, Carlos, and Anil Bera. 1987. A test for normality of observations and regression residuals. International Statistical Review 55: 163–72. [Google Scholar] [CrossRef]
- Kanwal, Sara, and Muhammad Nadeem. 2013. The Impact of Macroeconomic Variables on the Profitability of Listed Commercial Banks in Pakistan. European Journal of Business and Social Sciences 2: 186–201. [Google Scholar]
- Levine, Ross. 1997. Financial development and economic growth: View and agenda. Journal of Economic Literature 35: 688–726. [Google Scholar]
- Maddala, Gangadharrao, and Shaoen Wu. 1999. A comparative study of unit root tests with panel data a new simple test. Oxford Bulletin of Economics and Statistics 61: 631–52. [Google Scholar] [CrossRef]
- Mehta, Anupam, and Ganga Bhavani. 2017. What Determines Banks’ Profitability? Evidence from Emerging Markets—The Case of the UAE. Banking Sector Accounting and Finance Research 6: 77–88. [Google Scholar] [CrossRef] [Green Version]
- Menicucci, Elisa, and Guido Paolucci. 2016. The determinants of bank profitability: Empirical evidence from European banking sector. Journal of Financial Reporting and Accounting 14: 86–115. [Google Scholar] [CrossRef]
- Molyneux, Philip, and John Thornton. 1992. Determinants of European bank profitability: A note. Journal of Banking and Finance 16: 1173–78. [Google Scholar] [CrossRef]
- Moussa, Mohamed. 2015. The determinants of bank liquidity: Case of Tunisia. International Journal of Economics and Financial Issues 5: 249–59. [Google Scholar]
- Ncube, Mthuli, and Zuzana Brixiová. 2015. Public Debt Sustainability in Africa: Building Resilience and Challenges Ahead. Working Paper Series 227; Abidjan: Development Research Department/African Development Bank. [Google Scholar]
- Noman, Abu, Mustafa Chowdhury, Najneen Chowdhury, Mohammad Kabir, and Sajeda Pervin. 2015. The Effect of Bank Specific and Macroeconomic Determinants of Banking Profitability: A Study on Bangladesh. International Journal of Business and Management 10: 287–97. [Google Scholar] [CrossRef] [Green Version]
- Orji, Marcus, Sunday Omale, Chima Kate, and Jeresa Solomon. 2016. The Role of Liquidity and Profitability as a Tool for Effective Cash Management in Nigerian Commercial Banks. American Journal of Theoretical and Applied Business 2: 38–45. [Google Scholar]
- Ozkan, Fatma, Ahmet Kipici, and Mustafa Ismihan. 2010. The banking sector, government bonds, and financial intermediation: The case of emerging market countries. Emerging Markets Finance & Trade 46: 55–70. [Google Scholar]
- Panizza, Ugo. 2008. Domestic and external public debt in developing countries. United Nations Conference on Trade and Development (UNCTAD). Discussion Papers 188. Available online: https://papers.ssrn.com/sol3/papers.cfm?abstract_id=1147669 (accessed on 19 June 2008).
- Petria, Nicolae, Bogdan Capraru, and Iulian Ihnatov. 2015. Determinants of banks’ profitability: Evidence from EU 27 banking Systems. Procedia Economics and Finance 20: 518–24. [Google Scholar] [CrossRef] [Green Version]
- Rahman, Mphammad, Kowsar Hamid, and Abdul Khan. 2015. Determinants of Bank Profitability: Empirical Evidence from Bangladesh. International Journal of Business and Management 10: 135–50. [Google Scholar] [CrossRef] [Green Version]
- Reinhart, Carmen, and Maria Belen Sbrancia. 2011. The Liquidation of Government Debt. NBER Working Paper 16893. Cambridge: NBER. [Google Scholar]
- Rodrigues, Anthony. 1993. Government securities investments of commercial banks. Quarterly Review of the Federal Reserve Bank of New York 18: 39–53. [Google Scholar]
- Sahyouni, Ahmad, and Man Wang. 2018. The determinants of Bank Profitability: Does Liquidity Creation matter? Journal of Economics and Financial Analysis 2: 61–85. [Google Scholar] [CrossRef]
- Singh, Anamika, and Anil Sharma. 2016. An empirical analysis of macroeconomic and bank-specific factors affecting liquidity of Indian banks. Future Business Journal 2: 40–53. [Google Scholar] [CrossRef] [Green Version]
- Studenmund, Woody. 2005. Using Econometrics: A Practical Guide, 5th ed. Boston: Addison-Wesley. [Google Scholar]
- Ting, Hsiu. 2017. Financial development, role of government, and bank profitability: Evidence from the 2008 financial crisis. Journal of Economics and Finance 41: 370–91. [Google Scholar] [CrossRef]
- Vodová, Pavla. 2011. Liquidity of Czech commercial banks and its determinants. International Journal of Mathematical Models and Methods in Applied Sciences 5: 1060–67. [Google Scholar]
- Wooldridge, Jeffrey. 2012. Introductory Econometrics: A Modern Approach, 5th ed. Mason: South-Western Cengage Learning. [Google Scholar]
- World Bank Group. 2019. Cabo Verde—Country Partnership Framework for the Period FY20-25. Washington: World Bank Group. (In Portuguese) [Google Scholar]
Figure 1.
Evolution of Cape Verde’s public debt (in % of GDP) (including Consolidated Financial Mobilization Bonds (CFMB)), from 2000 to 2017. Source: Ministry of Finance and Bank of Cape Verde.
Figure 1.
Evolution of Cape Verde’s public debt (in % of GDP) (including Consolidated Financial Mobilization Bonds (CFMB)), from 2000 to 2017. Source: Ministry of Finance and Bank of Cape Verde.

Figure 2.
Treasury debt to the banking system in Cape Verde (2000–2017) Source: Ministry of Finance and Bank of Cape Verde.
Figure 2.
Treasury debt to the banking system in Cape Verde (2000–2017) Source: Ministry of Finance and Bank of Cape Verde.

Table 1.
Variables.
| Symbol | Variable | Explanation | Unit | Expected Signals | |
|---|---|---|---|---|---|
| lrisk | ROA | ||||
| dependent variables | |||||
| lrisk | Liquidity risk | Credits/Deposits | % | ||
| Cash | Cash and deposits at the central bank | Cash and deposits at the central bank/Net assets | % | ||
| ROA | Return on assets | Net return/Net assets | % | ||
| ROE | Return on equity | Net return/Equity | % | ||
| independent variables | |||||
| Bank-specific factors (internal) | |||||
| size | Bank size | Net assets | log | - | + |
| capital | Solvency ratio | Own funds/Weighted assets | % | - | - |
| credit | Credit to customer | Credit/Net assets | % | + | + |
| deposit | Customer deposits | Deposits/Net assets | % | - | + |
| bonds | Government debt securities ratio | Stock of government bonds/net assets | % | - | - |
| bonds_cfmb | Government debt securities ratio (including CFMB) | Stock of government bonds (including CFMB)/Net assets | % | - | - |
| efficiency | Operational efficiency | Cost-to-income ratio (operating costs/operating income) | % | - | + |
| fcrisis | Dummy variable for 2008 financial crisis | 1 = effects of financial crisis (2008–2017) | (0,1) | + | - |
| Macroeconomic factors (external) | |||||
| interest | Real interest rate | Real interest rate (annual) | % | +/- | + |
| infl | Inflation | Average annual inflation | % | +/- | +/- |
| gdp | Economic growth | Real GDP growth rate | % | +/- | + |
Table 2.
Descriptive statistics.
| Variables | Symbol | Average | Minimum | Maximum | St. Dev. | Obs. |
|---|---|---|---|---|---|---|
| Liquidity risk | lrisk | 70.23 | 17.76 | 187.84 | 30.42 | 91 |
| Cash and deposits at the central bank | Cash | 12.77 | 2.97 | 40.12 | 5.99 | 93 |
| Return on assets | ROA | 0.08 | −9.88 | 2.17 | 2.05 | 93 |
| Return on equity | ROE | 6.01 | −38.08 | 37.19 | 12.72 | 93 |
| Bank size | size | 9.64 | 6.29 | 11.40 | 1.12 | 93 |
| Solvency ratio | capital | 17.67 | 10.00 | 70.00 | 10.25 | 87 |
| Credit to customers | credit | 50.57 | 0.00 | 87.42 | 20.60 | 93 |
| Customer deposits | deposit | 75.63 | 10.29 | 92.74 | 19.25 | 93 |
| Government debt securities ratio | bonds | 11.22 | 0.78 | 48.88 | 7.98 | 93 |
| Government debt securities ratio (including CFMB) | bonds_cfmb | 13.53 | 0.78 | 48.88 | 9.56 | 93 |
| Efficiency | efficiency | 88.83 | 40.71 | 632.02 | 75.86 | 93 |
| Real interest rate | interest | 10.09 | 1.65 | 21.54 | 4.80 | 126 |
| Inflation | infl | 1.65 | −2.40 | 6.80 | 2.42 | 126 |
| Economic growth | gdp | 4.05 | −1.27 | 9.37 | 2.89 | 126 |
Source: Bank reports.
Table 3.
Panel unit root test (Augmented Dickey-Fuller – ADF – test for individual process).
| Variables | Random Walk with a Drift | Conclusion | |||
|---|---|---|---|---|---|
| Levels | First Differences | ||||
| chi2 Statistic | Lags | chi2 Statistic | Lags | ||
| Δ(lrisk) | 20.8733 | 1 | 55.4312 *** | 0 | I(1) |
| cash | 30.3803 *** | 1 | I(0) | ||
| ROA | 21.4712 * | 1 | I(0) | ||
| Δ(ROE) | 15.0151 | 1 | 58.7718 *** | 1 | I(1) |
| size | 30.5544 *** | 1 | I(0) | ||
| capital | 54.2505 *** | 2 | I(0) | ||
| credit | 32.9045 *** | 1 | I(0) | ||
| Δ(deposit) | 15.1297 | 1 | 60.9219 *** | 1 | I(1) |
| bonds | 31.3358 *** | 3 | I(0) | ||
| bonds_cfmb | 31.6441 *** | 3 | I(0) | ||
| Δ(efficiency) | 17.6411 | 1 | 50.9153 *** | 2 | I(1) |
| interest | 79.8735 *** | 0 | I(0) | ||
| infl | 47.0170 *** | 0 | I(0) | ||
| gdp | 22.8001 *** | 0 | I(0) | ||
*** and * indicate that the null hypothesis is rejected at the, respectively, 1% and 10% levels of statistical significance.
Table 4.
Estimation results for liquidity risk.
| Effects on Liquidity Risk | ||||
|---|---|---|---|---|
| Dependent Variables | Δ(Lrisk) | Cash | ||
| Bonds Effects without CFMB | Bonds Effects including CFMB | Bonds Effects without CFMB | Bonds Effects including CFMB | |
| Models | (1) | (2) | (3) | (4) |
| Coefficient | Coefficient | Coefficient | Coefficient | |
| Bank-specific factors (internal) | ||||
| C | −18.45058 | −14.07908 | 19.31561 *** | 17.60460 *** |
| size | −13.62205 | −14.22099 * | ||
| size(−1) | 30.71408 *** | 30.61534 *** | ||
| size(−2) | −14.21211 ** | −14.01359 ** | ||
| capital | −0.921887 ** | −0.921635 ** | −0.041282 | −0.045706 |
| capital(−1) | 0.071899 | 0.047942 | −0.010028 | −0.004116 |
| capital(−2) | 0.167140 | 0.159089 | ||
| credit | 1.195446 *** | 1.197504 *** | −0.000650 | 0.003224 |
| credit(−1) | −1.242967 *** | −1.242322 *** | −0.119112 * | −0.112599 |
| credit(−2) | −0.189316 * | −0.178521 | ||
| Δ(deposit) | −1.213497 *** | −1.213330 *** | ||
| Δ(deposit(−1)) | 0.113465 | 0.108391 | ||
| Δ(deposit(−2)) | −0.090347 | −0.087576 | ||
| bonds | −0.421362 | −0.380233 | −0.055344 | −0.035626 |
| bonds(−1) | −0.154010 | −0.141588 | 0.112774 | 0.151528 |
| bonds(−2) | 0.317602 | 0.336136 | ||
| Δ(efficiency) | 0.026633 | 0.026702 | 0.021705 | 0.020892 |
| Δ(efficiency(−1)) | 0.078566 * | 0.079521 * | 0.013798 | 0.012046 |
| Δ(efficiency(−2)) | 0.072448 | 0.070939 | ||
| fcrisis | 6.150883 | 6.376018 | −3.207868 * | −2.827688 |
| Macroeconomic factors (external) | ||||
| interest | 0.357503 * | 0.360248 * | 0.250730 * | 0.240507 * |
| interest(−1) | 0.514877 * | 0.501579 * | −0.036601 | −0.037345 |
| interest(−2) | 0.368833 | 0.357712 | ||
| R2 | 0.9521 | 0.9520 | 0.5771 | 0.5857 |
| Ajusted R2 | 0.9185 | 0.9184 | 0.4532 | 0.4643 |
| F-statistic (Prob.): | 28.3749 (0.0000) | 28.3186 (0.0000) | 4.6559 (0.0000) | 4.8233 (0.0000) |
| Nr of observations: | 69 | 69 | 76 | 76 |
Obs: (a) models under study: (1) Δ(lrisk) without CFMB; (2) Δ(lrisk) including CFMB; (3) cash without CFMB; and (4) cash including CFMB; and (b) level of statistical significance: *** significant at 1%; ** significant at 5%; and e * significant at 10%.
Table 5.
Estimation results for profitability.
| Effects on Profitability | ||||
|---|---|---|---|---|
| Dependent Variables | ROA | Δ(ROE) | ||
| Bonds Effects without CFMB | Bonds Effects including CFMB | Bonds Effects without CFMB | Bonds Effects including CFMB | |
| Models | (5) | (6) | (7) | (8) |
| Coefficient | Coefficient | Coefficient | Coefficient | |
| Bank-specific factors (internal) | ||||
| C | 2.965127 | 1.526276 ** | −133.5444 ** | −130.0658 ** |
| size | 1.550275 *** | 19.36905 ** | 18.02303 * | |
| size(−1) | −1.710458 *** | −26.36773 ** | −25.32428 ** | |
| size(−2) | 18.55731 *** | 19.07354 *** | ||
| capital | 0.001894 | −0.049782 * | 1.167798 *** | 0.979027 ** |
| capital(−1) | −0.094517 *** | 0.025109 | −0.642013 | −0.549923 |
| capital(−2) | 0.020308 * | 0.724251 *** | 0.814455 *** | |
| credit | 0.008622 | 0.234648 | 0.474122 ** | |
| credit(−1) | −0.006051 | −0.340720 ** | −0.662283 *** | |
| credit(−2) | −0.016454 ** | 0.276482 ** | 0.295410 | |
| Δ(deposit) | 0.019675 * | 0.025953 ** | ||
| Δ(deposit(−1)) | 0.030107 *** | 0.016170 * | ||
| Δ(deposit(−2)) | 0.001339 | |||
| bonds | −0.031067 | −0.066525 *** | −0.246273 | −0.419258 |
| bonds(−1) | 0.069022 *** | 0.037830 * | 0.036335 | 0.125647 |
| bonds(−2) | 0.017153 | 0.240647 | 0.250707 | |
| Δ(lrisk) | −0.156093 | |||
| Δ(lrisk(−1)) | 0.045231 | |||
| Δ(lrisk(−2)) | 0.041153 | |||
| Δ(efficiency) | 0.002367 | −0.000990 | −0.089944 *** | −0.078435 ** |
| Δ(efficiency(−1)) | 0.013948 *** | 0.001573 | −0.024984 | −0.009085 |
| Δ(efficiency(−2)) | 0.003657 | −0.182548 *** | −0.161160 *** | |
| fcrisis | 0.074756 | 0.020109 | −14.77690 ** | −14.55563 ** |
| Macroeconomic factors (external) | ||||
| infl | 1.668917 ** | 1.782603 ** | ||
| infl(−1) | −0.121291 | −0.330780 | ||
| infl(−2) | −0.616952 | −0.693010 | ||
| gdp | −0.460169 | −0.585118 | ||
| gdp(−1) | −0.726796 | −0.786513 | ||
| gdp(−2) | 0.858825 | 0.747375 | ||
| R2 | 0.7329 | 0.7692 | 0.7200 | 0.7472 |
| Ajusted R2 | 0.6546 | 0.6588 | 0.5240 | 0.5353 |
| F-statistic (Prob.): | 9.3624 (0.0000) | 6.9685 (0.0000) | 3.6732 (0.0000) | 3.5271 (0.0000) |
| Nr of observations: | 76 | 69 | 69 | 69 |
Obs: (a) models under study: (5) ROA without CFMB; (6) ROA including CFMB; (7) Δ(ROE) without CFMB; and (8) Δ(ROE) including CFMB; and (b) level of statistical significance: *** significant at 1%; ** significant at 5%; and e * significant at 10%.
Publisher’s Note: MDPI stays neutral with regard to jurisdictional claims in published maps and institutional affiliations. |
© 2021 by the authors. Licensee MDPI, Basel, Switzerland. This article is an open access article distributed under the terms and conditions of the Creative Commons Attribution (CC BY) license (http://creativecommons.org/licenses/by/4.0/).
Share and Cite
MDPI and ACS Style
Teixeira, J.C.; Vieira, C.; Ferreira, P. The Effects of Government Bonds on Liquidity Risk and Bank Profitability in Cape Verde. Int. J. Financial Stud. 2021, 9, 2. https://0-doi-org.brum.beds.ac.uk/10.3390/ijfs9010002
AMA Style
Teixeira JC, Vieira C, Ferreira P. The Effects of Government Bonds on Liquidity Risk and Bank Profitability in Cape Verde. International Journal of Financial Studies. 2021; 9(1):2. https://0-doi-org.brum.beds.ac.uk/10.3390/ijfs9010002
Chicago/Turabian StyleTeixeira, José Carlos, Carlos Vieira, and Paulo Ferreira. 2021. "The Effects of Government Bonds on Liquidity Risk and Bank Profitability in Cape Verde" International Journal of Financial Studies 9, no. 1: 2. https://0-doi-org.brum.beds.ac.uk/10.3390/ijfs9010002
Note that from the first issue of 2016, this journal uses article numbers instead of page numbers. See further details here.