
Public Expenses in Education and Youth Unemployment Rates—A Vector Error Correction Model Approach

1
Faculty of Economics, University “Luigj Gurakuqi”, 4001 Shkoder, Albania
2
Department of Public Administration, Mediterranean University of Albania, 1023 Tirana, Albania
*
Author to whom correspondence should be addressed.
Economies 2022, 10(12), 293; https://0-doi-org.brum.beds.ac.uk/10.3390/economies10120293
Submission received: 22 September 2022
/
Revised: 30 October 2022
/
Accepted: 9 November 2022
/
Published: 23 November 2022
(This article belongs to the Special Issue Emerging Economies and Sustainable Growth)
Abstract
:In the last decade, much of the attention of public expenditures in education has been focused on improving the offer to the labor market to minimize unemployment rates among young people. Since education directly affects human capital, investing in higher education is considered a benefit to future employment. Therefore, it is the purpose of this paper to investigate whether the government-allocated share of funds to total public expenditures in education affects the unemployment rates of youth in Albania. A quantitative analysis of total public expenses in education and of the country’s economic growth rates is used to investigate their effects on youth unemployment rates in the country. This is followed by another deeper investigation of public expenses in higher education and the country’s economic growth rates analysis on the youth unemployment rates of tertiary education graduates in Albania. Time series data are used in a set of econometric analyses such as the Augmented Dickey–Fuller test, Johansen test, and vector error correction (VEC) model to test for short-run dynamics and long-run causalities among the variables. The study results reveal that there is a short-term causality between the real economic growth rate and the youth unemployment rate, while there is a long-term causality between total public expenditures in education and the youth unemployment rate. If total public expenditures in education increase by 1%, the youth unemployment rate would decrease by 10.81%. Similarly, but not so strong, there is a long-term causality between public expenditures in higher education and the graduated youth unemployment rate. If public expenditures in higher education increase by 1%, the graduated youth unemployment rate would decrease by 5.85%. The speed of adjustment from the short-run to long-run equilibrium, in a quarter time, of the youth unemployment rate is 22%, while of the graduated youth unemployment rate is 53%—showing a faster convergence.
JEL Classification:
O01; O011; O0151. Introduction
Education is a critical and influential factor in the development of human capital and is considered the driving engine of progress in the economy (Castells 1994). Education helps in the application of new technology skills, which improve efficiency at work and facilitate the acquisition, transfer, and dissemination of the knowledge needed to understand work processes. Education has a significant impact on employment prospects. It is a well-known fact that education is associated with lower levels of unemployment, especially for individuals with graduate degrees who have historically enjoyed higher employment rates compare to counterparts with lower levels of education (OECD 2000). Nickell (1979) was among the first scholars to propose a theoretical framework supporting the lower incidence of unemployment among graduates. The relationship between tertiary education, or higher education, and the economic growth rate has been the focus of study of many researchers over the last decades in many countries. A country that encourages investment in higher education facilitates the knowledge of the future labor force and supports its economic growth.
Government spending in education is considered a path for solving significant economic challenges such as economic recessions, poverty, or unemployment (Haupt 2012). Government spending at all education levels is considered as spending in human capital investment. It contributes to the increase of the number of potential workers and helps meet the requirements for skilled and semi-skilled workers in different economic sectors (Dissou et al. 2016). Therefore, public expenditure in education have significant short-term and long-term effects in facilitating the employment capabilities of workers in the labor market. Based on the rationale of these approaches, the issue at hand is to determine how much of an effect education has on labor force unemployment, especially in the youth age group category 15–29 years, in Albania.
Albania, a small country in southeastern Europe’s Balkan Peninsula, has been transformed from one of the poorest countries in Europe to an upper-middle-income country. The country has been implementing important reforms to revitalize growth and job creation while advancing the European Union integration agenda. Private investment and government public spending drove growth, while public debt remained high (World Bank 2022). The unemployment rate in Albania in 2021 was 11.82%, with a 1.51% decline from 2020, while Albania’s youth unemployment rate, age group 15–29 years, was 27.84% in 2021, with a 2.48% decline from 2020 (Macrotrends 2022).
Based on the importance of the unemployment matter, especially on the youth age category, the Albanian government’s public expenditures in education have increased over the last two decades. Therefore, it is the main objective of this paper to investigate the short-term and long-term relationships among public expenditure in education, economic growth rate, and youth unemployment rate, using an Albanian case study. Therefore, using a vector error correction quantitative analysis, two research questions are explored in two econometric models:
- (i)
- Do total public expenditures in education and the country’s real economic growth rate affect the country’s youth unemployment rates in the short and long run?
- (ii)
- Do public expenditures in higher education and the country’s real economic growth rate affect the unemployment rates of youth graduated from tertiary education in the short and long run?
To answer these questions, the above variables are analyzed for both long-run causalities and short-run dynamics in the vector error correction model using the quarterly data spanning the period of 2001–2020 in the first model; and of 2009–2020 in the second model. Diagnostic tests are presented to confirm the robustness of the models. The data sources are retrieved from the Institute of Statistics website, and the R statistical software is used to generate the results.
The paper is organized into the following sections: a panorama of total public expenditures, public expenditure in higher education, real economic growth rates, and youth unemployment rate dynamics in the labor market, is presented for the country. This is followed by the literature review that presents the main findings of the area. The methodology and model’s results present the research outcomes, followed by conclusions and recommendations.
2. A Panorama of Education and Youth Unemployment Rates in Albania
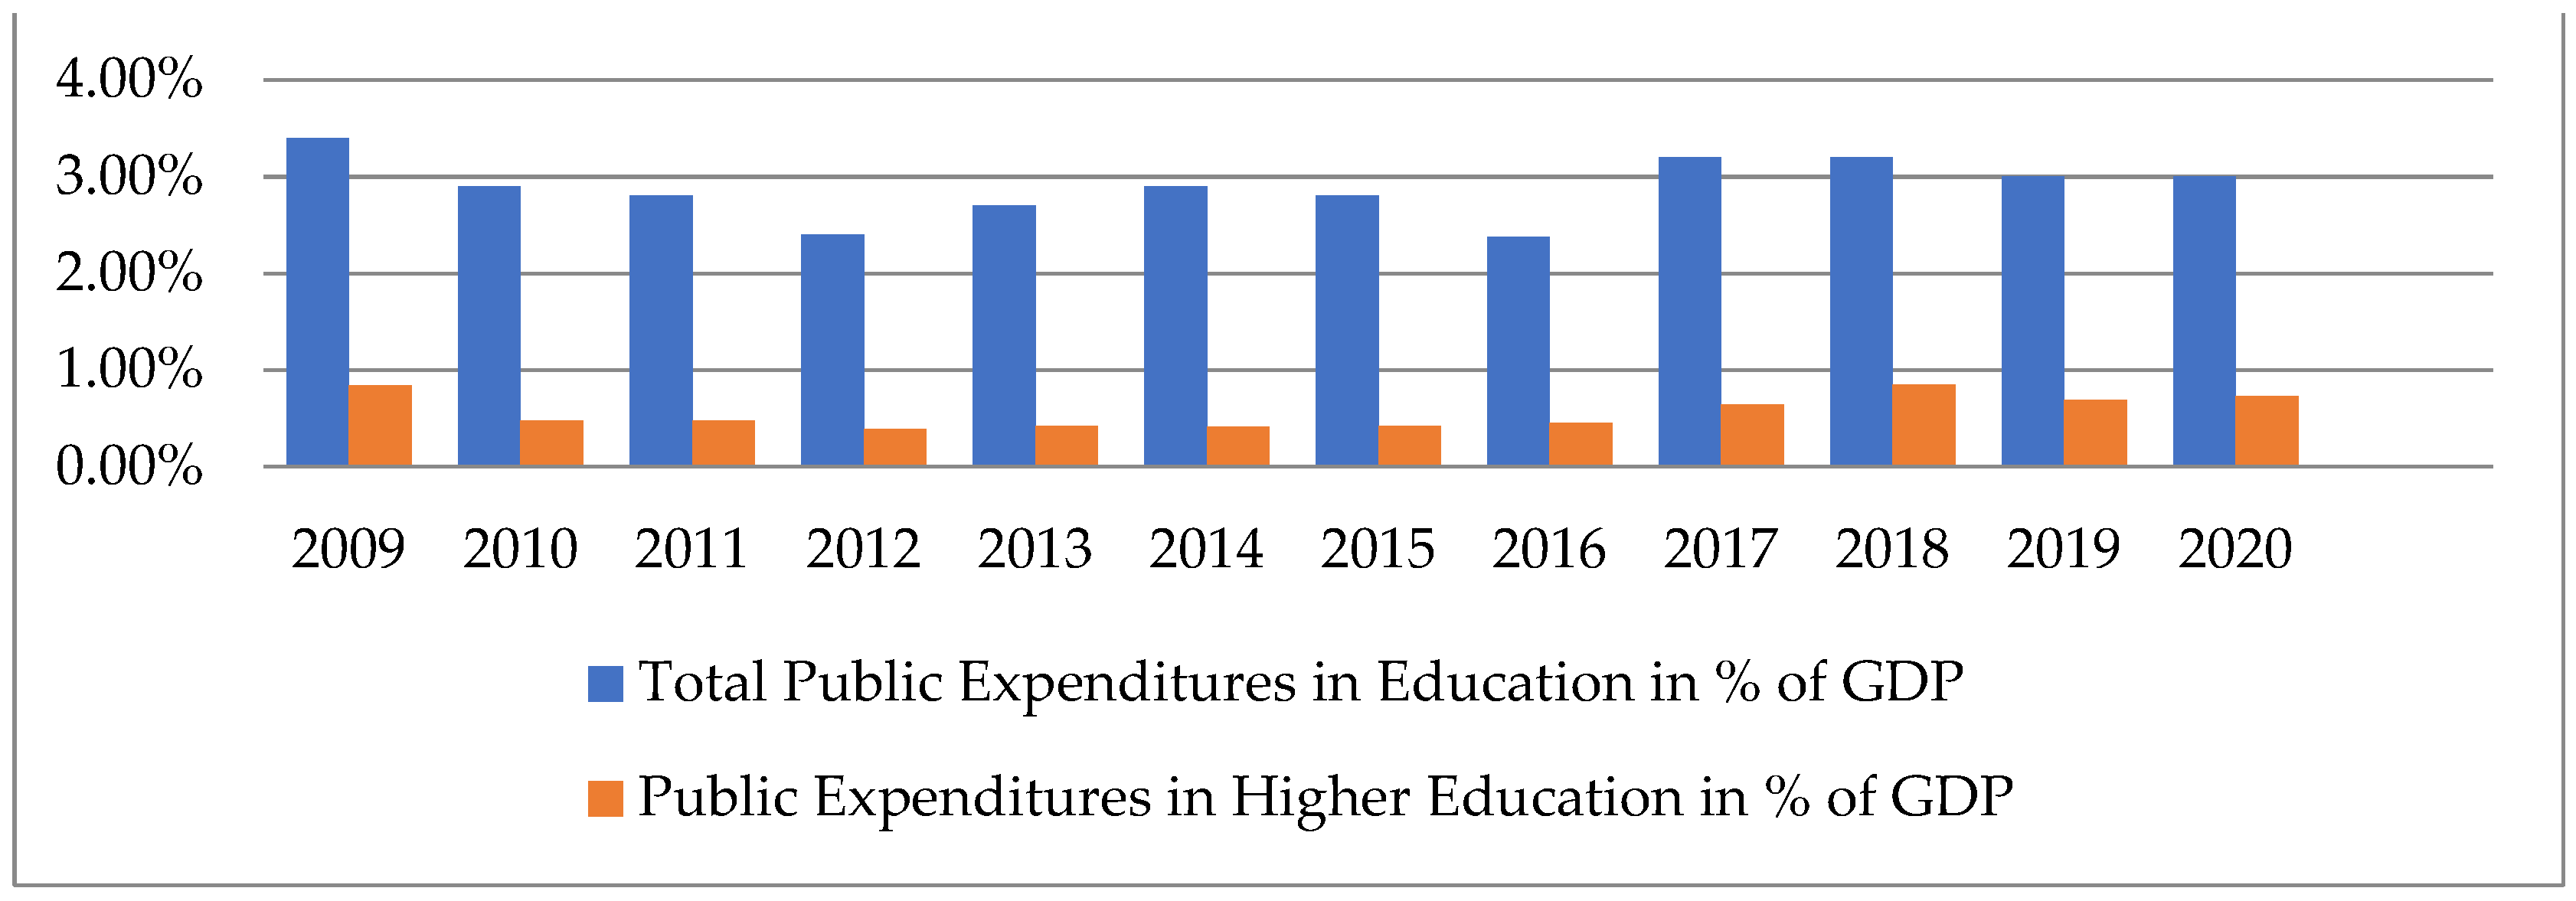
The education system in Albania is characterized by low levels of public funds allocated to the education system. In the last decade, total public expenditure allocated to the education system have been 2.3% to 3.3% of gross domestic product (GDP), see Figure 1.
While over the years, significant changes have occurred in tertiary or higher education system in Albania. In 2003, the Bologna education system was adopted, confirming the update and orientation of the country’s institutions in higher education towards the European’s higher education system. During the last two decades, the demand for higher education has seen an increase. New academic programs were implemented in public and private universities in the country. The increasing demand of young people to pursue university programs was significantly higher than what was available at the public-state universities. Consequently, many private tertiary education institutions emerged after 2003. However, in the following years, their number decreased due to operating inappropriateness and incorrect academic procedures. Despite the challenges in higher education over the years, the government funding allocated to the higher education system has been relatively low with modest variations. According to the Ministry of Education, Sport, and Youth, consisting to only 22.8% of total public expenditure in education in 2020 (Ministry of Education, Sport and Youth (MESY) 2021a).
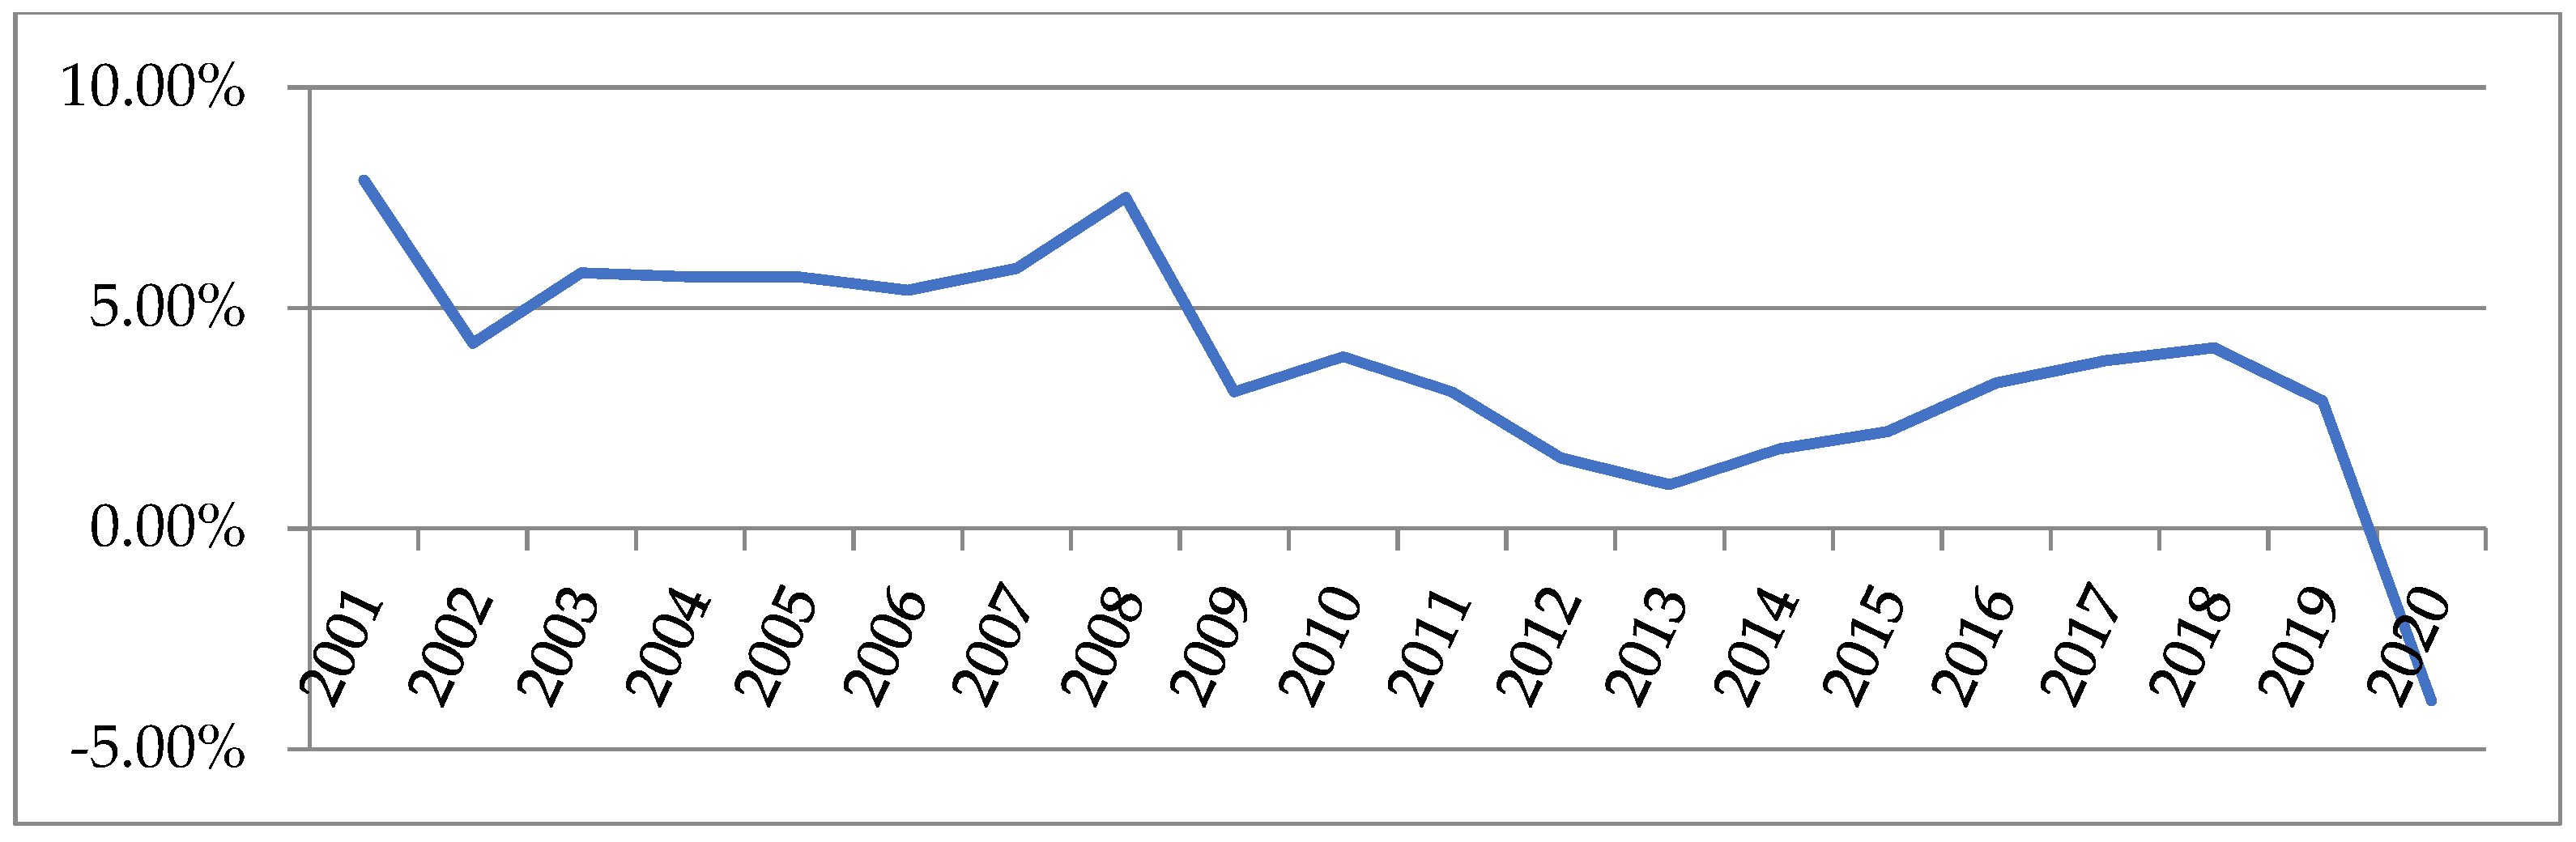
During the last two decades, Albania has had relatively high rates of economic growth. However, in the last two years the country’s real economic growth rate has been in decline due to challenges directly related to the limited level of socio-economic development, the powerful earthquake of November 2019, and the COVID-19 pandemic (see Figure 2).
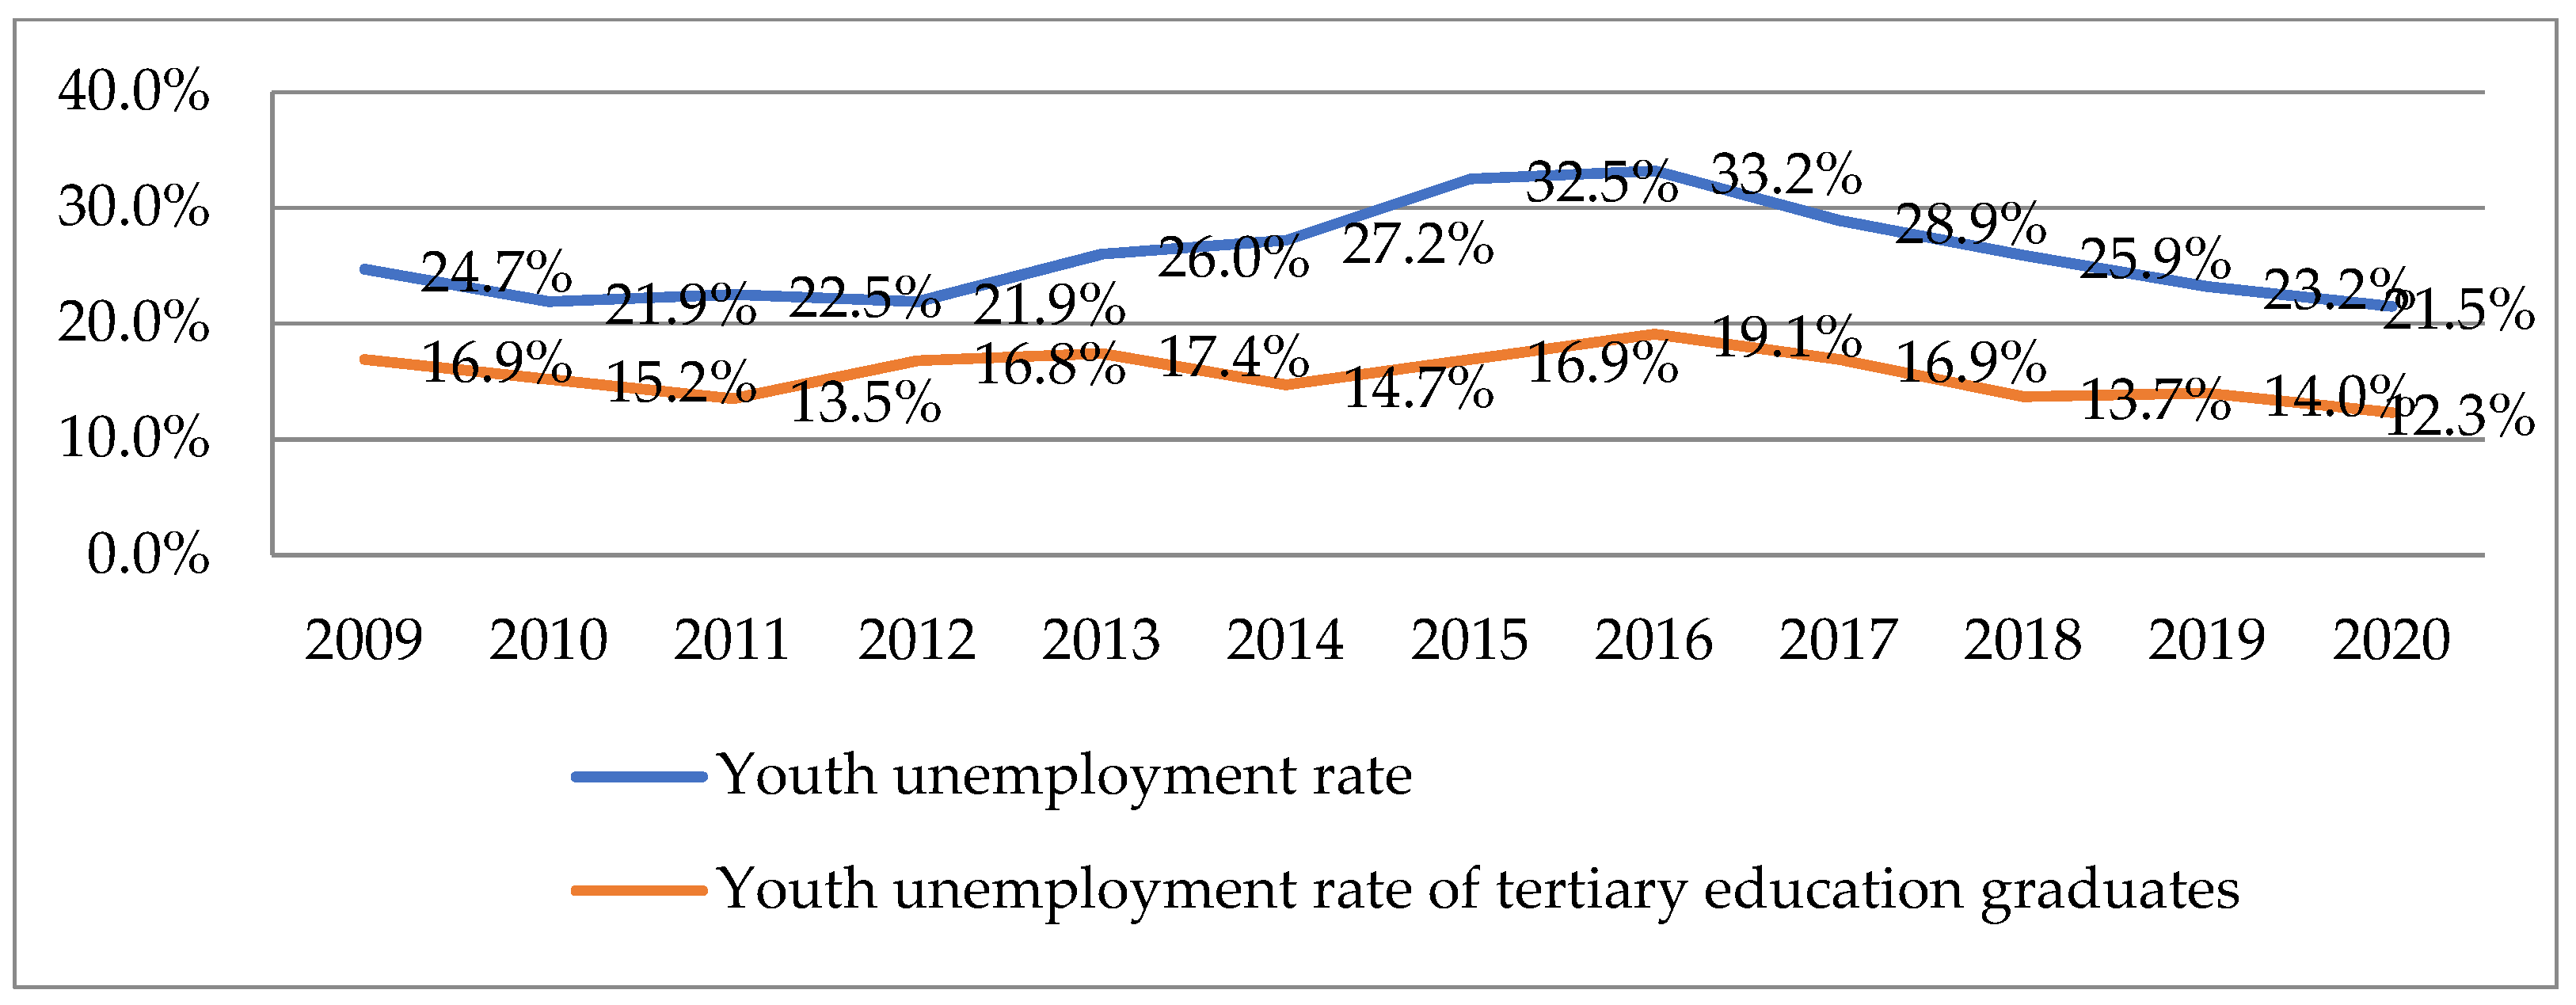
Albania is characterized by a young population, which presents an advantage compared to the population of Western European countries. During the last decade, in the labor market, the number of graduate students has been increasing, being reflected also in high unemployment rates among them. Statistics of the country show that during the last decade, the youth unemployment rate was at its highest level at 33.2% in 2016, while the trend has been decreasing in the subsequent years (see Figure 3). Similarly, the graduated youth unemployment rate was at its highest value of 19.1% in 2016, followed by a decline in the following years. While educational achievement has been more valuable in the employment process, a bachelor’s GPA represents an advantage in the employment selection process. Graduated youth with higher bachelor’s GPAs tend to have higher employment opportunities compared to their counterparts (Mehmetaj and Alili 2021).
According to data from the Institute of Statistics, the lowest unemployment rates are shown among people with tertiary education.
3. Literature Review
The relationship between human capital and economic growth has long been studied by many authors (Schultz 1961; Kiefer 1985; Barro 2001; Teulings 2005; St. Aubyn et al. 2009, etc.) and there are numerous research studies on this topic, showing the long-held expectation that human capital formation plays a significant role in a country’s economic development (IIASA 2008). Education is often analyzed in terms of the quantitative years and its consequences are investigated on the economic growth rate of countries and the per capita incomes. Various studies have shown that the quantity of education, evaluated by the average years of school, dramatically affects the process of economic development of a country. According to Schultz (1961), professional training and education are the main elements of improving human capital. Investments in human capital are all expenditures made for the purpose of obtaining higher returns in the future. Investing in the education system is considered a key element in the economic development process of a country. Schultz (1989) argues that human capital is the factor most likely to limit economic growth in countries. He claims that the returns to human capital are larger even compared to the returns to most types of physical capital. He appeals that the innovations in institutional requirements for investment in schooling in less-developed countries, should receive high priority. He claims for increased endowments and contributions by international donors for investment in primary schooling in the low-income countries.
“Education is a leading determinant of economic growth, employment, and earnings. Ignoring the economic dimension of education would endanger the prosperity of future generations, with widespread repercussions for poverty, social exclusion, and sustainability of social security systems.”
Education increases the collective ability of the workforce to carry out existing tasks more quickly. In addition, secondary and tertiary education facilitates the transfer of knowledge of new information, products, and technologies created by others (Barro and Lee 1997). Further education increases creativity and boosts a country’s capacity to create new knowledge, products, and technologies (Grant 2017). According to an OECD (2014) study, in the long run, an additional year of secondary education boosts the economic development of the country. This is associated with a decrease in unemployment rates and a reduction in economic social transfers involved with the unemployment process.
The role of education is analyzed by the quantity of years of education achieved (Barro 2001; Hanushek and Wößmann 2007; Osipian 2008). According to Barro (2001), economic growth is insignificantly associated with years of school achievement of females and is significantly associated with years of school achievement of males at the secondary and higher levels. Osipian (2008), in a study in Ukraine and in the Russian Federation indicated that there was no significant impact of educational attainment on economic growth. While the econometric results showed that an increase of college-educated specialists led to positive results to the per capita GDP growth in the long term, and to sustainable economic growth. According to Becker (1993), the many forms of investments in human capital include schooling, the-job training, etc. These investments improve knowledge and skills, and thereby influence the size of returns as earnings and consumption. Regressions results are presented for fifty states of USA where about one-third of the differences in inequality between states is directly explained by schooling differences. Further analysis for several countries as: United States, Canada, Mexico, Israel, and Puerto Rico, showed similar results of a strong tendency for areas with greater schooling inequality to have higher rates of return and with greater income inequality.
Further studies have demonstrated the importance of the worker’s education years to the country’s macroeconomic variables such as unemployment rates, productivity, and economic growth. The performed analysis has included diverse affecting variables, and the model’s outcomes have shown ambivalent and inconclusive results (Barro and Lee 1997; Sachs and Warner 1995; Ullah 2014; Barrel et al. 2010). Barro and Lee (1997) concluded that higher education has an insignificant effect on a country’s economic growth. Sachs and Warner (1995) also found an insignificant effect of secondary school enrollment ratio in education on the country’s economic growth. Similarly, Ullah (2014), in a study over the period of 1981–2010 in Pakistan presented a negative relationship between the level of education and the unemployment rate. While Barrel et al. (2010) based on growth accounting analysis, found out that, skills improvements, and capital deepening as well as financial services represent a small component of the increase in productivity performance in unit of time.
Other authors performed and presented other significative positive related results. Tilak (2003) considered tertiary education as the higher and specialized outlay in human capital. In conditions of dynamic and complex job markets, new employees adjust easier when they graduated to tertiary education. The connections between economic growth and human development form very important relationships. Where choice between the two variables is necessary then to human development should be given sequencing priority (Ranis et al. 2000). Moreau and Leathwood (2006) analyzed the relationship between higher education and the unemployment rate of young graduates across European countries. Their study showed that as the number of graduate students increased, the unemployed youth in most European countries increased as well. Later, the results of the study were rejected by Nunez and Livanos who found different results from studies conducted so far (Nunez and Livanos 2010). The authors explored the effects of tertiary education on unemployment rates across Europe both in the short term and long term. They concluded that tertiary education lowered unemployment rates across Europe and increased employment opportunities for young graduates. Similarly, Hussain et al. (2010), applying a vector error correction model, presented significant long-run causal relation between unemployment, labor, and capital to economic growth.
The relationship between the real GDP growth rate and the unemployment rate is a crucial orientation for policymakers aiming for a steady increase in the living standards of their citizens. Unemployment reduction is very significant for obtaining sustainable economic growth (Dumitrescu et al. 2009). The relationship between unemployment and economic growth has been studied in economic literature and is known as Okun’s law, which shows that there is an inversely proportional relationship between the change in the real economic growth rate of GDP and the change in the unemployment rate. Okun succeeded in showing that there is a reciprocal negative correlation between unemployment and economic growth. He found that if unemployment rates decrease by 1%, then this would be due to an increase in the real gross domestic product of 3%, and vice versa (Okun 1962). Economic growth is one of the main goals of governments as it indicates an increase in the standard and quality of living, or a reduction in poverty (Hala et al. 2021).
Some studies have empirically examined the linkage between economic growth and unemployment by implementing Okun’s law. Based on the work done by Soylu et al., it has been highlighted that an increase in economic growth in eastern European countries brings an increase in labor productivity that can be effective in creating opportunities for employment in the country. In other words, a 1% rise in GDP will reduce the unemployment rate by 0.08% (Soylu et al. 2018).
4. Methodology
Various macroeconomic studies have introduced the vector autoregressive (VAR) model and vector error correction (VEC) model as the appropriate approaches for time series data analyses. The two techniques promote the widespread application of dynamic analysis in economic issues. The VAR model, popularized by Sims (1980), was used to analyze the linear interdependencies in multiple time series and is considered a generalization of the univariate autoregressive model. VAR models apply stationary time series data, but if the time series are non-stationary, there might be the cost of disregarding possibly important “long-run” relations between the levels. Therefore, there is a probability of an information loss in the integrated series relationship. A better solution if cointegration exists among the variables is presented through the VEC model, which combines the levels and the differences. If a cointegration relationship exists between variables, the VEC model can be estimated instead of the VAR model (Lütkepohl 2005). The VEC model is a restricted VAR model with cointegration constraints, as in levels the VEC model can derive from the autoregressive distributed lag model. However, allowing for short-run dynamics, the VEC model specifications restrict the long-run behavior of the endogenous variables to converge to their long-run equilibrium relationships (Engle and Granger 1987). The VEC model can have the following form:
where Δx is the first difference of the variables in vector x, ∏ (Pi) is a coefficient matrix of cointegrating relationships in the long term, Ґ is a coefficient matrix of the lags of differenced variables of x and contains the short-run dynamics, dt is a vector of deterministic terms, C is the equivalent coefficient matrix, p is the lag order, and ϵ is the correction error term with zero mean and variance-covariance matrix. Before applying the VEC model, two preliminary tests are needed:
Stationarity test: Stationarity of time series variables is critical as it influences the statistical attributes of the series, such as the mean and the variance over time. If these attributes are different over time, then the time series is supposed to be non-stationary. Otherwise, if are constant, the series is described as stationary. If series are non-stationary at level, they are named as I(0) or integrated of order 0, or I(1) integrated of order 1. The Augmented Dickey–Fuller test is applied to test the stationarity of the variables (Dickey and Fuller 1979).
Cointegration test: Two approaches are used to test the cointegration of series: the trace test, and the maximum eigenvalue test (Johansen and Juselius 1990). The cointegration rank (r) indicates the total linear independent combinations of the time series variables that will be stationary. If there is positive cointegration, this implies that the time series are related and therefore can be combined in a linear relation. However, if there were shocks in the short run that might influence movement in the specific series, they would congregate with time in the long run.
If cointegration and non-stationarity results were detected in our time series, then a long-run relationship exists among them, and the VEC model is applied. In case of no cointegration, the VEC model is no longer suggested, and it is supposed to proceed with Granger causality.
This study illustrates an application of the vector error correction model to determine the effect of government expenditures in education and economic growth rate to the youth unemployment rate in model I, and to graduated youth unemployment rate in model II. The two VEC models analyzed in short term in this study are expressed as:
where, YUR is youth unemployment rate, TPEE is total public education expenditures in percentage of GDP, and REGR is the real economic growth rate (model I, Equation (2)). While GYUR is the graduated youth unemployment rate, and HEE is higher education expenditures in percentage of GDP (model II, Equation (3)). The estimates are the coefficient matrix of the lags of the differenced variables and contain short-run dynamics, while are the coefficient matrix of cointegrating relationships in the long term. A negative and significant coefficient of (in the above equations model results) reveals that any short-term variations among the variables will be brought to a steady long-run relationship.
Analyses were conducted to diagnose and check the robustness of the VEC models, including tests for serial correlation (Portmanteau Test), heteroscedasticity ARCH (multivariate), and normal distribution of the residuals (JB-Test). To describe the evolution of the model’s variables in reaction to shocks, impulse response analyses (IRF) were applied.
5. Empirical Results
Quarterly data of the youth unemployment rates, total public expenses in education (in percent of GDP), and real economic growth rates were used in the econometric model 1, for the time span 2001–2020. Due to the lack of data on the graduated youth unemployment rates, quarterly data of the time - period spanning 2009–2020 were used in model II. Data were retrieved from the National Institute of Statistics and the Ministry of Education and Youth. All the variables employed in the model were used in percentages. Since quarterly data were used in the models, the time series were tested for seasonality through the ‘decomposing’ of time series. Decomposing a series means splitting it into its principal elements, which are usually a trend component, a seasonal component, and an irregular component. The decomposing results of our time series showed that there was no seasonal variation (the additive estimates near zero, and the multiplicative estimates near one).
The Augmented Dickey–Fuller Test (ADF) tests the null hypothesis of non-stationarity, and a p-value higher than 5% means non-rejection of the null hypothesis that there is a unit root. The results of the ADF test demonstrate that all the variables are nonstationary (as the probabilities are higher than 5%). This holds for both models I and II (see Table 1).
The Johansen test was used for testing cointegration among the variables. There are two approaches to the Johansen test. The first one is the trace statistics variant and the second one is the maximum eigenvalue variant, both methods were used. In the autoregressive process AR(p) lag selection criteria, the smallest lag option is chosen, which is Akaike’s information criterion. According to Liew (2004), this criterion is recommended for the estimation of the autoregressive lag length in cases of small sample sizes. The results of the two test approaches lead to the same results. The results in model I show that the test statistics in the two approaches exceed the critical values r > 2, meaning that there are at least two cointegration relationships between the variables. In model II, r > 1 meaning that there is at least one positive cointegration between the interest variables (see Table 2). Based on the above, it is expected that the variables are independently non-stationary and cointegrated: the three variables might have ordinary stochastic trends alongside which they move simultaneously in a non-stationary direction. Under these two conditions, the VEC model is selected as the appropriate econometric model.
The VEC model results in model I present the cointegration Equation (4). The results show that an increase in total public education expenses by 1% lead to a decrease of 10.81% in youth unemployment rate. While there is a positive relationship between the real economic growth rate and the youth unemployment rates (+2.19%), which is contradictory to the Okun’s law, which states that increases in real economic growth rates should have decreasing effects on unemployment rates. This might suggest that the sub-component youth age group category 15–29 years is not affected by the country’s real economic growth rate in the long run, suggesting that other age categories unemployment rates might be more affected.
In the short run, there is a delayed effect of the current period youth unemployment rate values and the prior period (quarter) youth unemployment rate values (lag 1, lag 2, and lag 3 of youth unemployment rate values are significant at 1%). This suggests that there is a short-run and negative causality between the current values and the prior period values within the youth unemployment rates variable (see Table 3). The same can be concluded about the economic growth rates variable that shows a short-term causality to the youth unemployment rate (at a 5% level of significance). However, that is not the case with the total public expenses in education (none out of three lags is statistically significant in the short term). This means that there is no short-term causality to youth unemployment rates deriving from total public expenditures in education.
The speed of adjustment, calculated by multiplying the coefficient of the variable in the cointegrating equation by the coefficient of the ECT, describes the movement of the variable from the short-run to the long-run equilibrium. The speed of adjustment of the youth unemployment rate is −0.22, showing that it converges to long-run equilibrium by 22% in one time-period, which in our case is a quarter. The speed of adjustment of total public expenses in education is 29%, and of the real economic growth rate is 15% (see Table A1, in Appendix A).
The results of model II show similar results to model I. In the long run, there is a negative relationship between public expenditures in higher education and the unemployment rate of youth graduated from tertiary education. If public expenditures in higher education increase by 1%, the unemployment rate of graduated youth decreases by 5.85% (see Equation (5). While there is a positive relationship between the real economic growth rate and the graduated youth unemployment rates, which is inconsistent with theoretical results. This might suggest that the real economic growth rate is more likely to affect other age categories unemployment rates rather than youth unemployment rates of tertiary education graduates, which is not affected.
In the short run, there is a delayed effect of current and prior period values of graduated youth unemployment rates at a 5% significance level (see Table 4). This suggests that there is a short-run causality between the current values and prior period values within the graduated youth unemployment rates variable. The economic growth rate and the higher education expenditures show no causality (none out of the three lags are statistically significant) meaning there is no short-term causality to the graduated youth unemployment rates deriving from real economic growth rate and higher education expenditures variables.
The speed of adjustment of the graduated youth unemployment rate and of public expenses in higher education is −0.53, showing that these both converge to long-run equilibrium by 53% in one time - period. The speed of adjustment of the real economic growth rate is positive at 0.05, which is insignificant to the model (see Table A2, in Appendix A).
The two models were tested for robustness. The Portmanteau Test was used for autocorrelation, the ARCH model was checked for heteroskedasticity, and the JB-Test was performed for the normality of residuals. The results show that there is no autocorrelation among the variables (p > 0.05) in either of the two models (see Table 5). The autoregressive conditional heteroskedasticity test in model I and model II show that there is no arch effect and there is no clustered volatility in the models (p = 1, and p = 0.9776). The JB-Test result show that the residuals are normally distributed in model I but are not normally distributed in model II (p < 0.05).
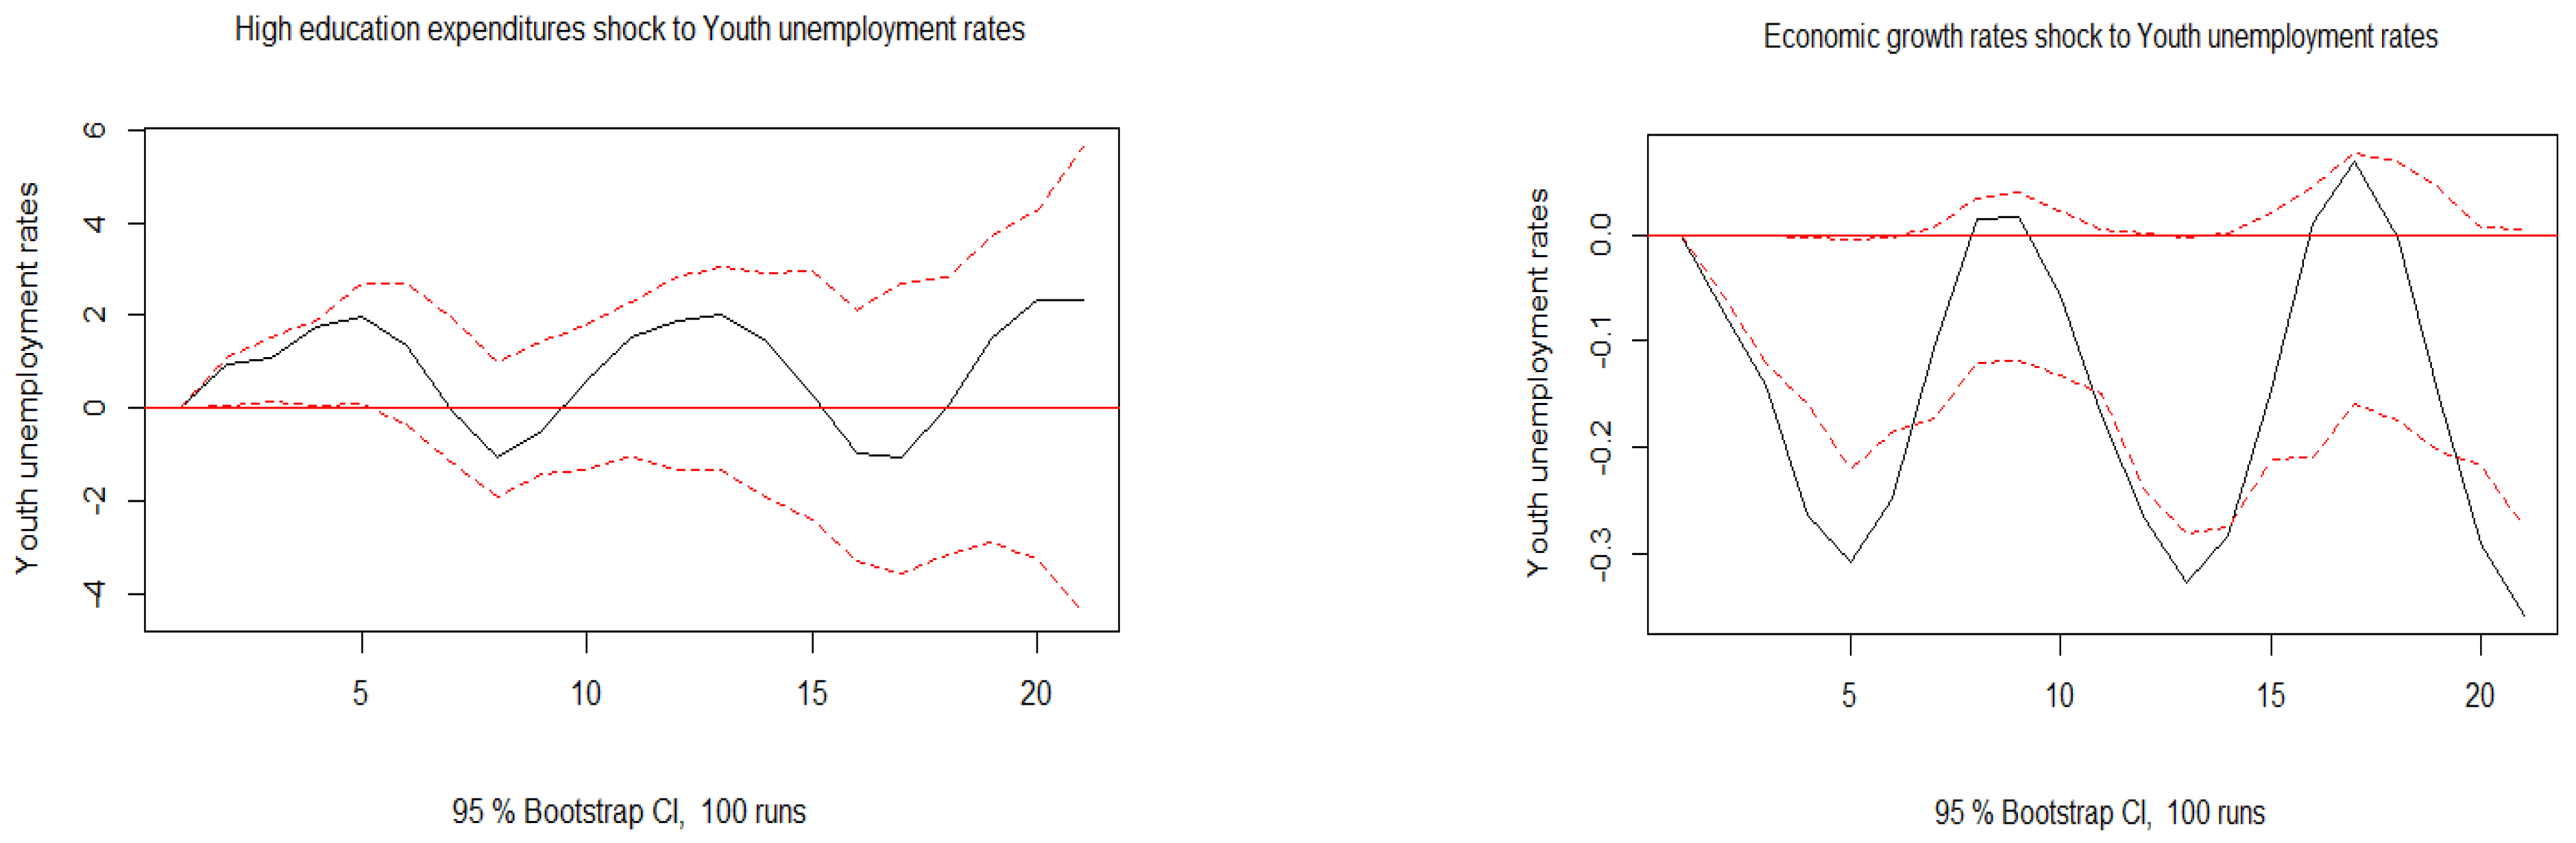
The impulse response function (IRF) presents continuous fluctuations (see Figure 4). A one standard shock deviation to total public expenses in education shows continuous increasing and decreasing fluctuations in higher education with no noticeable tendency in youth unemployment rates. One standard shock deviation to the real economic growth rate presents sharp decreasing and increasing fluctuations, also with no noticeable tendency to youth unemployment rates (this IRF function graph lies outside the 95% confidence interval) meaning shocks to both explanatory variables, TPEE and REGR, will have asymmetric effects on youth unemployment rates.
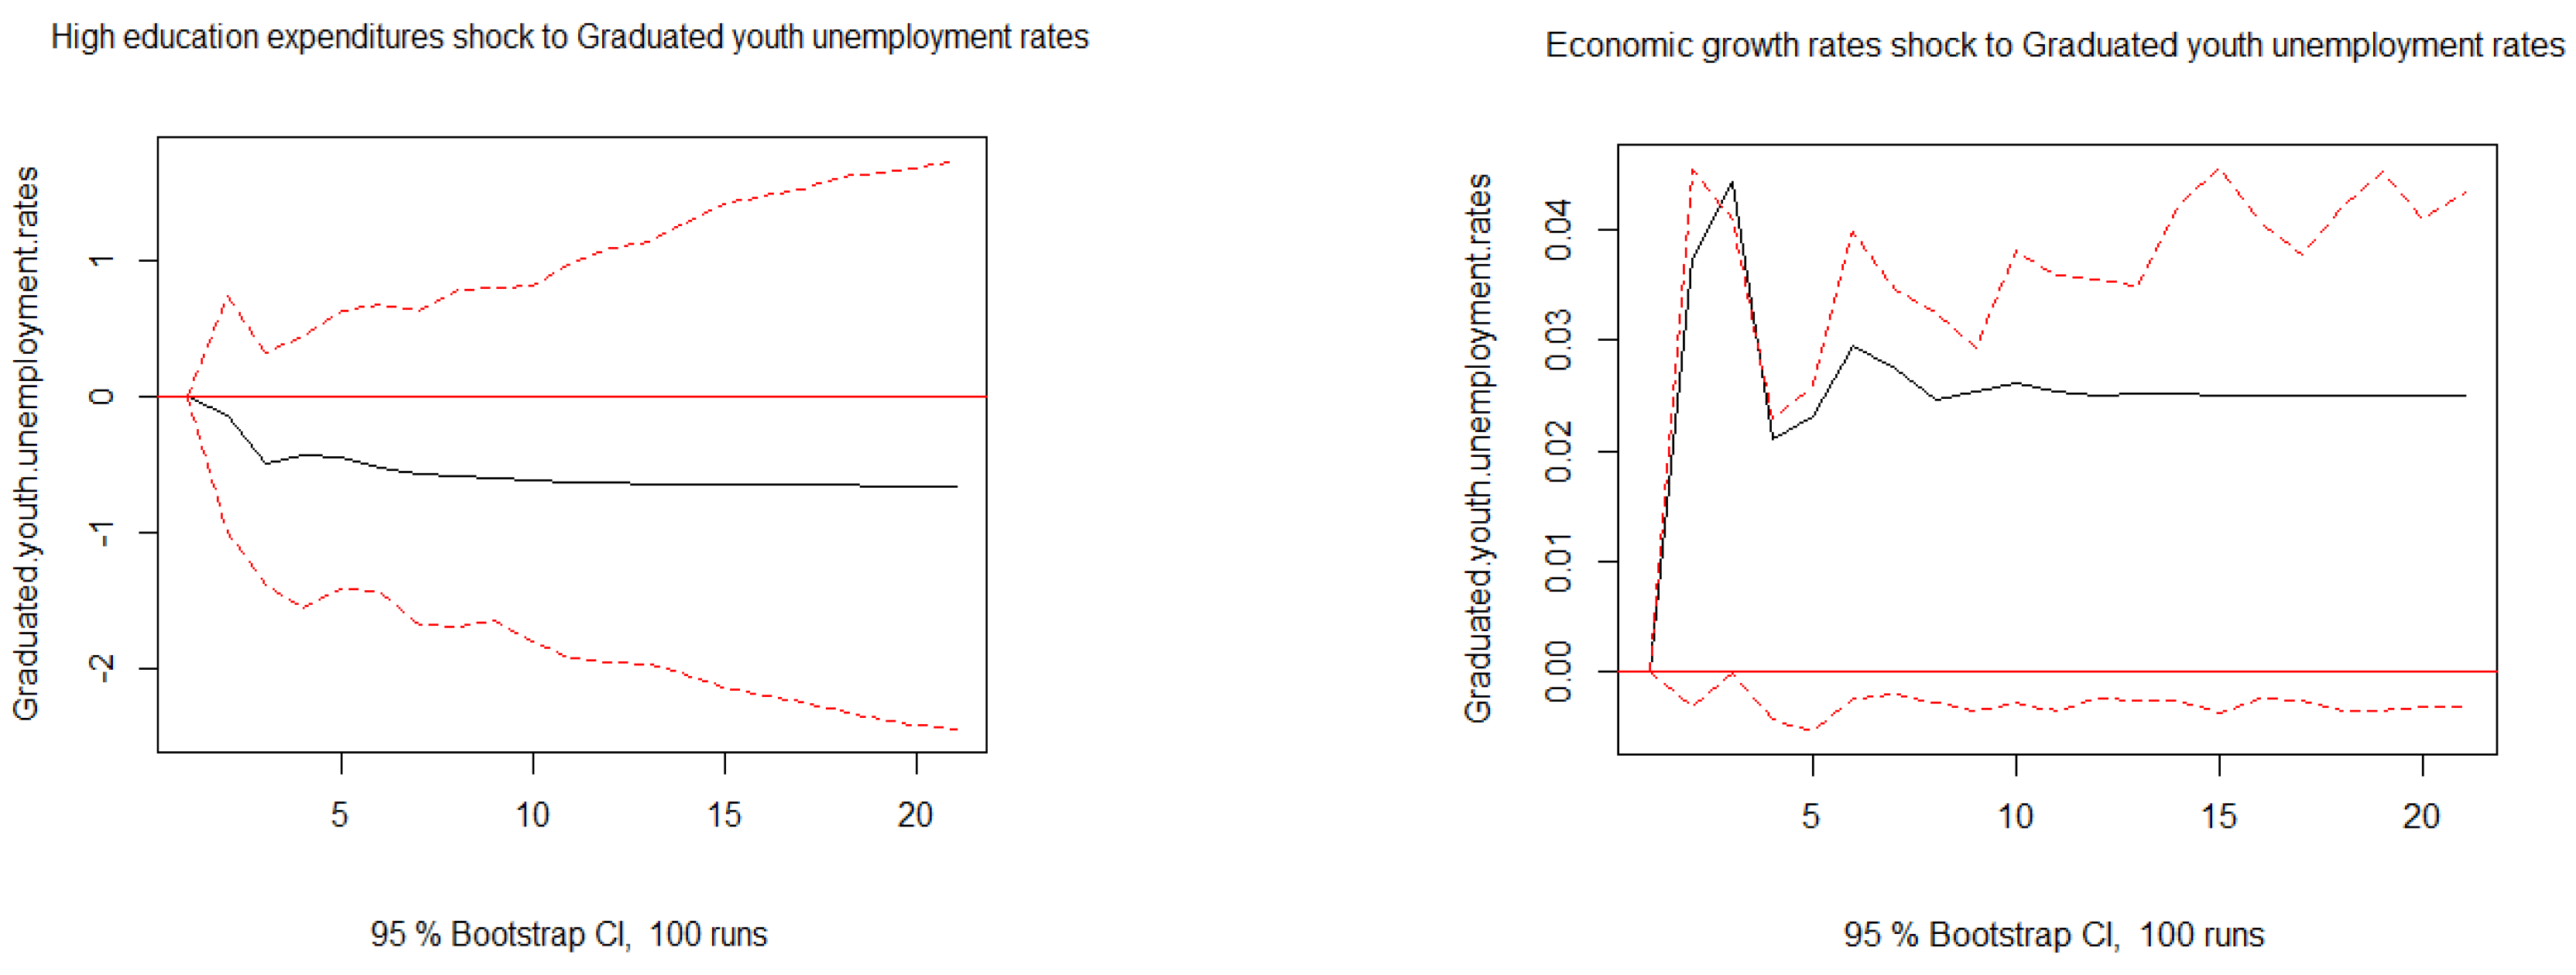
One standard shock deviation in higher education expenditure is associated with a decreased response on graduated youth unemployment rates in early periods and staying later at the same levels (Figure 5). It remains in the negative region, meaning shocks to HEE will have negative impacts on graduated youth unemployment rates. In contrast, one standard shock deviation to the real economic growth rate is associated with an increased response on graduated youth unemployment rates in early periods and staying at the same levels later. However, it remains in the positive region, meaning shocks to the economic growth rate will have a positive impact on the graduated youth unemployment rates.
6. Conclusions
Government expenditures in education play an essential role in increasing the outcome of the education process. At the same time, education also is considered as human capital investment that contributes to the increase of productivity, and the reduction of unemployment of an educated labor force. Many empirical research studies have analyzed the relationship of government public expenditures in education, real economic growth rates, and unemployment rates among youth and graduated youth age categories. The empirical results from different countries reveal ambiguous and inconclusive results. Based on the rationale of approaches, the issue at hand is to determine how much of an effect education has on youth labor force unemployment rate (age group category 15–29 years) in Albania. The VEC model was applied for the Albanian case study and the results of the models show that:
- -
- In the long run, total public expenses in education negatively affect the youth unemployment rates. If the government increases the share of GDP to total public expenditures in education by 1%, the youth unemployment rates decrease by 10.81% in the long term. Even though economic growth is a major factor affecting the reduction in unemployment rates, the data results of Albania show that the real growth economic rates have no significant impact on minimizing the youth unemployment rate nor the graduated youth unemployment rate.
- -
- Similarly, in the long run, public expenses in higher education reveal a negative relationship to the graduated youth unemployment rate. If the government increases the share of GDP to public expenditures in tertiary education by 1%, this will have a decreasing effect on the unemployment rates of the graduated youth by 5.85%.
- -
- In the short run, the real economic growth rate shows a short-term causality to the youth unemployment rate, but not to the graduated youth unemployment rate. This suggests that in conditions of economic growth in the country, the emerging vacancies are filled with new youth employees with no graduation criteria. In the short run, total public expenses in education have no impact on the youth unemployment rate, nor public expenses in higher education on the unemployment rate of graduated youth with tertiary education.
- -
- The speed of adjustment indicating the convergence from the short-run to long-run equilibrium of the youth unemployment rate is 22% in a quarter time - period, for the total public expenses in education is 29%, and for the real economic growth rate is 15% (model I). While the speed of adjustment of the graduated youth unemployment rate and the speed of adjustment of the public expenditure in higher education is the same of 53% in a quarter time-period (Model II) showing a faster convergence.
The empirical studies on causality relationships are important for policymakers and serve most in informing sustainable growth expenditure in education and higher education. This highlights the need for revision in education programs corresponding to the market economic sector vacancies.
7. Recommendations
The relationship between public education expenditures and unemployment rate in Albania, as well as their dynamics of evolution over time, provide important information for policymakers regarding education budgeting, the verification of available skills for the labor market, and the connection to employers’ demand for these skills. The findings of this study serve as an alert for policy development in the education sector. Some short-term policy actions might include monitoring of economic sectors, employment capacities, and dynamics reconciling market needs while offering higher education programs or professional training to youth categories.
Nevertheless, given the importance of high education in the formation and development of human capital, there is the necessity of long-term policy initiatives, such as increasing the total public expenses in education and the share thereof to higher education, and more importantly improving the quality of education programs for the same purpose.
Author Contributions
Conceptualization, N.M. and N.X.; methodology and formal analysis, N.M.; visualization and data curation N.M.; writing—original draft preparation, N.M.; writing—review and editing, N.X. All authors have read and agreed to the published version of the manuscript.
Funding
The paper received no funding from any organizations.
Institutional Review Board Statement
Not applicable.
Informed Consent Statement
Not applicable.
Data Availability Statement
Data is available at the cited sources websites.
Conflicts of Interest
The authors declare no conflict of interest.
Appendix A

Table A1.
The Speed of Adjustments, Model I.
| Variable | Coefficient in ECT | The Coefficient in ECT Where the Variable Is the Dependent Variable | Speed of Adjustment |
|---|---|---|---|
| YUR | 1 | −0.22 | −0.22 |
| TPEE | −10.81 | 0.027 | −0.29 |
| REGR | 2.19 | −0.07 | −0.15 |
Table A2.
The Speed of Adjustments, Model I.
| Variable | Coefficient in ECT | The Coefficient in ECT Where the Variable Is the Dependent Variable | Speed of Adjustment |
|---|---|---|---|
| GYUR | 1 | −0.53 | −0.53 |
| HEE | −5.85 | 0.09 | −0.53 |
| REGR | 0.47 | 0.11 | 0.05 |
References
- Barrel, Ray, Dawn Holland, and Iana Liadze. 2010. Accounting for UK Economic Performance 1973–2009; National Institute of Economic and Social research (NIESR) Discussion Papers. London, vol. 359, pp. 1–30. Available online: https://www.niesr.ac.uk/wp-content/uploads/2021/10/dp359_0-2.pdf (accessed on 6 August 2022).
- Barro, Robert J., and Jong-Wha Lee. 1997. Schooling Quality in a Cross Section of Countries. Economica 68: 465–88. [Google Scholar] [CrossRef]
- Barro, Robert. 2001. Human Capital and Growth. American Economic Review 91: 12–17. [Google Scholar] [CrossRef]
- Becker, Gary Stanley. 1993. Human Capital A Theoretical and Empirical Analysis with Special Reference to Education, 3rd ed. Chicago: University of Chicago Press. Available online: https://www.academia.edu/35396287/Human_Capital_a_Theoretical_and_Empirical_Analysis_with_Special_Reference_to_Education_Third_Edition (accessed on 2 June 2022).
- Castells, Manuel. 1994. The University System: Engine of Development in the New World Economy. Edited by Jamil Salmiand Adriaan M. Verspoor. Oxford: Revitalising Higher Education, pp. 14–40. [Google Scholar]
- Dickey, David A., and Wayne A. Fuller. 1979. Distribution of the estimators for autoregressive time series with a Unit Root. American Statistical Association 74: 427–31. [Google Scholar]
- Dissou, Yazid, Selma Didic, and Tatsiana Yakautsaya. 2016. Government spending on education, human capital accumulation and growth. Economic Modelling 58: 9–321. [Google Scholar] [CrossRef]
- Dumitrescu, Bogdan, Vasile Dedu, and Adrian Enciu. 2009. The Correlation between Unemployment and Real GDP Growth: A Study Case on Romania. Annals of Faculty of Economics 2: 317–22. Available online: https://econpapers.repec.org/article/orajournl/v_3a2_3ay_3a2009_3ai_3a1_3ap_3a317-322.htm (accessed on 20 April 2021).
- Engle, Robert F., and Clive. W. J Granger. 1987. Co-integration and error-correction: Representation, estimation, and testing. Econometrica 55: 251–76. [Google Scholar] [CrossRef]
- Grant, Catherine. 2017. The Contribution of Education to Economic Growth. London: UK Department for International Development, Institute of Development Studies. [Google Scholar]
- Hala, Hjazeen, Mehdi Seraj, and Hyseyin Ozdeser. 2021. The nexus between the economic growth and unemplyement in Jordan. Future Business Journal 7: 42. [Google Scholar]
- Hanushek, Eric A., and Ludger Wößmann. 2007. The Role of Education Quality in Economic Growth. World Bank Policy Research Working Paper 4122, February 26. [Google Scholar]
- Haupt, Alexander. 2012. The evolution of public spending on higher education a democracy. European Journal of Political Economy 28: 557–73. [Google Scholar] [CrossRef] [Green Version]
- Hussain, Tariq, Muhammad Wasif Siddiqi, and Asim Iqbal. 2010. A Coherent Relationship between Economic Growth and Unemployment: Empirical evidence from Pakistan. International Science Index 4: 956–63. [Google Scholar]
- IIASA. 2008. Economic Growth in Developing Countries: Education Proves Key. Available online: http://www.iiasa.ac.at/web/home/resources/publications/IIASAPolicyBriefs/pb03-web.pdf (accessed on 15 November 2021).
- INSTAT. 2021a. Economic Growth Rates. Tirane: INSTAT. [Google Scholar]
- INSTAT. 2021b. Labor Market Indexes. Tirane: INSTAT. [Google Scholar]
- Johansen, S, and K Juselius. 1990. Maximum likelihood estimation and inference on cointegration with application to the demand for money. Oxford Bulletin of Economics and Statistics 52: 169–210. [Google Scholar] [CrossRef]
- Kiefer, Nicholas M. 1985. Evidence on the Role of Education in Labor Turnover. Journal of Human Resources 20: 445–52. [Google Scholar] [CrossRef]
- Liew, Venus Khim-Sen. 2004. Which Lag Selection Criteria Should We Employ? Economics Bulletin 3: 1–9. Available online: https://www.researchgate.net/publication/4827253_Which_Lag_Selection_Criteria_Should_We_Employ (accessed on 20 January 2022).
- Lütkepohl, Helmut. 2005. New Introduction to Multiple Time Series Analysis. Berlin/Heidelberg: Springer, p. 63. [Google Scholar]
- Macrotrends. 2022. Available online: https://www.macrotrends.net/countries/ALB/albania/youth-unemployment-rate (accessed on 19 August 2022).
- Mehmetaj, Nevila, and Merita Zulfiu Alili. 2021. Employment of Economics Graduates: Does Gpa Matter? Interdisciplinary Description of Complex Systems 19: 210–26. [Google Scholar] [CrossRef]
- Ministry of Education, Sport and Youth. 2021a. Education Public Expenses in the Percentage of GDP. Available online: https://arsimi.gov.al/buxheti-dhe-financat/ (accessed on 15 May 2022).
- Ministry of Education, Sport and Youth. 2021b. Statistics. Available online: https://arsimi.gov.al/wp-content/uploads/2022/04/12-Raport-Moni-12_M-Janar-Dhjetor-2021_Final-28.2.2022_FN.pdf (accessed on 20 November 2021).
- Moreau, Marie-Pierre, and Carole Leathwood. 2006. Graduates’ employment and the dis-course of employability: A critical analysis. Journal of Education and Work 19: 305–24. [Google Scholar] [CrossRef]
- Nickell, Stephen. 1979. Education and lifetime patterns of unemployment. Journal of Political Economy 87: 117–31. [Google Scholar] [CrossRef]
- Nunez, Imanol, and Ilias Livanos. 2010. Higher education and unemployment in Europe: An analysis of the academic subject and national effects. Higher Education 59: 475–87. [Google Scholar] [CrossRef] [Green Version]
- OECD. 2000. From Initial Education to Working Life. Paris: OECD. [Google Scholar]
- OECD. 2014. Education at a Glance. Paris: OECD Publishing. [Google Scholar] [CrossRef]
- Okun, Arthur M. 1962. Potential GNP: Its Measurement and Significance. In Proceedings of Business and Economic Statistics Section. Alexandria: American Statistical Association, pp. 89–104. [Google Scholar]
- Osipian, Ararat. 2008. Role of Education in Economic Growth in the Russian Federation and Ukraine. (March 2007). Available online: https://ssrn.com/abstract=1092504 (accessed on 20 July 2022).
- Ranis, Gustav, Frances Stewart, and Alejandro Ramirez. 2000. Economic Growth and Human Development. World Development 28: 197–219. [Google Scholar] [CrossRef] [Green Version]
- Sachs, Jeffrey D., and Andrew M. Warner. 1995. Natural Resource Abundance and Economic Growth. NBER Working Papers 5398. Cambridge: National Bureau of Economic Research, Inc. [Google Scholar]
- Schultz, Theodore W. 1961. Investment in human capital. The American Economic Review 51: 1–17. Available online: https://www.ssc.wisc.edu/~walker/wp/wp-content/uploads/2012/04/schultz61.pdf (accessed on 2 July 2022).
- Schultz, Theodore W. 1989. Investing in people: Schooling in low-income countries. Economics of Education Review 8: 219–23. [Google Scholar] [CrossRef]
- Sims, Christopher A. 1980. Macroeconomics and Reality. Econometrica 48: 1–48. [Google Scholar] [CrossRef] [Green Version]
- Soylu, Özgur Bayram, Ismail Çakmak, and Fatih Okur. 2018. Economic growth and unemployment issue: Panel data analysis in Eastern European Countries. Journal of International Studies 11: 93–107. [Google Scholar] [CrossRef]
- St. Aubyn, Miguel, Alvaro Pina, Filomena Garcia, and Joana Pais. 2009. Study on the efficiency and effectiveness of public spending on tertiary education. Economic Papers 301: 1–148. Available online: https://ec.europa.eu/economy_finance/publications/-pages/publication11902_en.pdf (accessed on 2 June 2022).
- Teulings, Coen N. 2005. Comparative advantage, relative wages, and the accumulation of human capital. Journal of Political Economy 113: 425–61. [Google Scholar] [CrossRef] [Green Version]
- Tilak, Jandhyala B.G. 2003. Higher Education and Development. In The Handbook on Educational Research in the Asia Pacific Region. Springer International Handbooks of Education. Dordrecht: Springer, Volume 11, pp. 809–26. [Google Scholar] [CrossRef]
- Ullah, Sami. 2014. Relationship Between Unemployment and Human Capital. Journal of Resources Development and Management 3: 1–11. [Google Scholar]
- Woessmann, Ludger. 2015. The Ecobnomic Case for Education. Education Economics 24: 3–32. Available online: http://0-www-tandfonline-com.brum.beds.ac.uk/doi/abs/10.1080/09645292.2015.1059801?journalCode=cede20 (accessed on 5 July 2022). [CrossRef]
- World Bank. 2022. Available online: https://www.worldbank.org/en/country/albania/overview (accessed on 15 July 2022).
Figure 1.
Total Public Expenses in Education and Public Expenses in Higher Education during 2007–2020 (in % of GDP). Source: Ministry of Education, Sport and Youth (MESY) (2021b). Statistics.
Figure 1.
Total Public Expenses in Education and Public Expenses in Higher Education during 2007–2020 (in % of GDP). Source: Ministry of Education, Sport and Youth (MESY) (2021b). Statistics.

Figure 2.
Real Economic Growth Rate in Albania, 2000–2020. Source: INSTAT (2021a). Economic Growth Rates.

Figure 3.
Youth Unemployment Rates and Graduated Youth Unemployment Rates, 2009–2020. Source: INSTAT (2021b). Labor Market Indexes.

Figure 4.
The IRF results of TPEE and REGR Shocks to Youth Unemployment Rates. Source: Author’s calculations.
Figure 4.
The IRF results of TPEE and REGR Shocks to Youth Unemployment Rates. Source: Author’s calculations.

Figure 5.
The IRF Results of HEE and REGR Shocks to Graduated Youth Unemployment Rates. Source: Author’s calculations.
Figure 5.
The IRF Results of HEE and REGR Shocks to Graduated Youth Unemployment Rates. Source: Author’s calculations.

Table 1.
Augmented Dickey–Fuller Test Results.
| Model I | Dickey–Fuller | Lag Order | p-Value |
|---|---|---|---|
| YUR | −1.1441 | 4 | 0.9099 |
| TPEE | −2.7669 | 4 | 0.2619 |
| REGR | −2.6287 | 4 | 0.3185 |
| Model II | |||
| GYUR | −1.276 | 3 | 0.8549 |
| HEE | −2.3857 | 3 | 0.4231 |
| REGR | −3.5477 | 3 | 0.05178 |
Source: Author’s calculations.
Table 2.
Johansen Cointegration test Results.
| Model I H0 Hypotheses | Trace Test Statistic | Critical Value (5%) | Max-Eigen Test Statistic | Critical Value (5%) |
|---|---|---|---|---|
| r <= 2 | 20.41 | 9.24 | 20.41 | 9.24 |
| r <= 1 | 42.56 | 19.96 | 22.15 | 15.67 |
| r = 0 | 64.71 | 34.91 | 22.15 | 22.00 |
| Model II | ||||
| r <= 2 | 3.03 | 9.24 | 3.03 | 9.24 |
| r <= 1 | 20.16 | 19.96 | 17.13 | 15.67 |
| r = 0 | 49.66 | 34.91 | 29.49 | 22.00 |
Source: Author’s calculations.
Table 3.
Short Run and Long Run VEC Model I Causality Results.
| Model I. r1 (Short Term) | 1 YUR | −10.8095 TPEE | 2.1877 REGR |
|---|---|---|---|
| YUR-1 | −0.7319 (0.1166) *** | −0.0190 (0.0130) | 0.0865 (0.0711) |
| YUR-2 | −0.6833 (0.1030) *** | −0.0108 (0.0114) | 0.1003 (0.0628) |
| YUR-3 | −0.6347 (0.0779) *** | −0.0026 (0.0087) | 0.1141 (0.0475) * |
| TPEE-1 | −1.5695 (1.4792) | −0.5468 (0.1644) ** | −0.7461 (0.9019) |
| TPEE-2 | −0.7664 (1.4279) | −0.3883 (0.1587) * | −0.7063 (0.8707) |
| TPEE-3 | 0.0368 (1.1444) | −0.2298 (0.1272). | −0.6665 (0.6978) |
| REGR-1 | 0.5529 (0.2752) * | −0.0610 (0.0306). | −0.7263 (0.1678) *** |
| REGR-2 | 0.6257 (0.2550) * | −0.0624 (0.0283) * | −0.6117 (0.1555) *** |
| REGR-3 | 0.6984 (0.1994) *** | −0.0638 (0.0222) ** | −0.4971 (0.1216) *** |
| C | 0.0004 (0.0014) | −0.0000 (0.0002) | −0.0004 (0.0009) |
| ECT | −0.2195 (0.1226). | −0.0273 (0.0136) * | −0.0727 (0.0748) |
Note significance codes: ‘***’ p < 0.001, ‘**’ p < 0.01, ‘*’ p < 0.05, ‘.’ p < 0.1. Source: Author’s calculations.
Table 4.
Short Run and Long Run VEC Model II Causality Results.
| Model II. r1 (Short Term) | 1 GYUR | −5.8549 HEE | 0.4728 REGR |
|---|---|---|---|
| GYUR-1 | −0.5884 (0.2419) * | −0.0252 (0.0331) | 0.0320 (0.1449) |
| GYUR-2 | −0.5052 (0.2300) * | 0.0073 (0.0315) | 0.0523 (0.1378) |
| GYUR-3 | −0.4220 (0.1828) * | 0.0398 (0.0250) | 0.0725 (0.1095) |
| HEE-1 | −1.5491 (1.4915) | −0.4449 (0.2041) * | −0.2747 (0.8934) |
| HEE-2 | −1.1752 (1.4509) | −0.2273 (0.1985) | −0.4811 (0.8691) |
| HEE-3 | −0.8014 (1.1678) | −0.0097 (0.1598) | −0.6875 (0.6995) |
| REGR-1 | 0.2188 (0.2160) | −0.0514 (0.0296). | −0.7811 (0.1294) *** |
| REGR-2 | 0.2823 (0.2379) | −0.0755 (0.0326) * | −0.5677 (0.1425) *** |
| REGR-3 | 0.3458 (0.2026). | −0.0996 (0.0277) ** | −0.3544 (0.1214) ** |
| C | −0.0557 (0.1608) | −0.0154 (0.0220) | −0.1028 (0.0963) |
| ECT | −0.3284 (0.2241). | 0.0576 (0.0307) ** | 0.0117 (0.1342). |
Note: significance codes: ‘***’ p < 0.001, ‘**’ p < 0.01, ‘*’ p < 0.05, ‘.’ p < 0.1. Source: Author’s calculations.
Table 5.
VEC Models Diagnostic Tests Results.
| Model I | Chi-Squared | df | p Value | Model II | Chi-Squared | df | p Value |
|---|---|---|---|---|---|---|---|
| Portmanteau Test | 12.703 | 30 | 0.9187 | 38.362 | 30 | 0.1407 | |
| ARCH (multivariate) | 366 | 540 | 1 | 186 | 540 | 0.9776 | |
| JB-Test (multivariate) | 3.8331 | 6 | 0.6993 | 92.13 | 6 | 0.0000 | |
| Skewnesss (multivariate) | 3.2595 | 3 | 0.3533 | 9.0549 | 3 | 0.0285 | |
| Kurtosis (multivariate) | 0.57363 | 3 | 0.9024 | 83.076 | 3 | 0.0000 |
Source: Author’s calculations.
Publisher’s Note: MDPI stays neutral with regard to jurisdictional claims in published maps and institutional affiliations. |
© 2022 by the authors. Licensee MDPI, Basel, Switzerland. This article is an open access article distributed under the terms and conditions of the Creative Commons Attribution (CC BY) license (https://creativecommons.org/licenses/by/4.0/).
Share and Cite
MDPI and ACS Style
Mehmetaj, N.; Xhindi, N. Public Expenses in Education and Youth Unemployment Rates—A Vector Error Correction Model Approach. Economies 2022, 10, 293. https://0-doi-org.brum.beds.ac.uk/10.3390/economies10120293
AMA Style
Mehmetaj N, Xhindi N. Public Expenses in Education and Youth Unemployment Rates—A Vector Error Correction Model Approach. Economies. 2022; 10(12):293. https://0-doi-org.brum.beds.ac.uk/10.3390/economies10120293
Chicago/Turabian StyleMehmetaj, Nevila, and Nevila Xhindi. 2022. "Public Expenses in Education and Youth Unemployment Rates—A Vector Error Correction Model Approach" Economies 10, no. 12: 293. https://0-doi-org.brum.beds.ac.uk/10.3390/economies10120293
Note that from the first issue of 2016, this journal uses article numbers instead of page numbers. See further details here.