
The Trade Growth under the EU–SADC Economic Partnership Agreement: An Empirical Assessment

Department of Economics, University of Molise, 86100 Campobasso, Italy
Economies 2022, 10(12), 302; https://0-doi-org.brum.beds.ac.uk/10.3390/economies10120302
Submission received: 30 October 2022
/
Revised: 20 November 2022
/
Accepted: 23 November 2022
/
Published: 28 November 2022
(This article belongs to the Section International, Regional, and Transportation Economics)
Abstract
:The objective of this paper is an ex-post evaluation of the European Union–Southern African Development Community Economic Partnership Agreement (EU–SADC EPA) stemming from changes in trade flows from the six members of the SADC (Botswana, Eswatini, Lesotho, Mozambique, Namibia, and South Africa) to the European Union (EU). The analysis uses detailed import and tariff data at the Harmonized System 6-digit level (HS-6) and provides estimates of the changes in the intensive and extensive margins of trade resulting from tariff reductions, as a consequence of the EU–SADC EPA initiative. The impact on the intensity of trade is estimated using a Difference-in-Differences (DID) estimation, controlling for both country and product-level trade flows. The impact on the trade of new goods (the extensive margin) before and after the agreement is evaluated through a probit analysis. The results show that the EU–SADC EPA has a positive impact on the EU’s imports from the six members of the SADC, even if significant differences emerge among sectors and countries.
1. Introduction
In the last years, the European Union (EU) has been particularly engaged in a web of preferential trade relations with African countries or regional groupings, which range from the regular Generalized System of Preferences (GSP), the Africa-Caribbean-Pacific agreement (i.e., the Lomé/Cotonou agreements), and the Bilateral Euro-Mediterranean Association Agreements. Since 2016, a new development-focused trade agreement has been signed between the EU and the six countries of the Southern African Development Community (SADC), namely Botswana, Lesotho, Mozambique, Namibia, South Africa, and Eswatini (formerly Swaziland). It is called the EU–SADC Economic Partnership Agreement (EPA)1. The EU–SADC EPA considerably improved the extent of the preferential market access granted to Southern African countries, providing the most favorable regime available. The idea behind these preferences is that developing countries in the world must overcome a lot of difficulties to promote economic development as well as integration in the world economy. In this respect, preferential access to EU markets could help these economies to reach these goals.
The new EU preferential scheme grants 100% duty and quota-free access to all imports from Botswana, Lesotho, Mozambique, Namibia, and Eswatini. Access to the EU market is permanent, full, and free for all products, with the exception of arms and munitions. The EU abolishes customs duties on 98.7% of imports from South Africa, under specific quantitative quotas. The EPA foresees asymmetric access. The SADC EPA countries can protect sensitive products from full liberalization and apply safeguard measures when imports from the EU grow too fast.
This work aims to analyze the impact of the EU–SADC EPA initiative on the intensive and extensive margins of trade.
This study is part of the research effort that attempts to assess the impact of EU preferential trade policies using highly disaggregated data (Scoppola et al. 2018; Cipollina and Salvatici 2019).
One of the most frequently used methods in impact evaluation studies is the Difference-in-Differences (DID). This approach is based on a combination of before–after and treatment–control group comparisons, and the method has recently been growing in popularity in economics, public policy, health research, management, and other fields (Fredriksson and Oliveira 2019).
To estimate the impact on quantities traded (the intensive margin), this study uses a triple DID estimation, controlling for both country and product-level imports, that allows to better address the “endogeneity of policy” critique of standard DID estimation than if either a country or a product-level analysis was performed separately (Frazer and Van Biesebroeck 2010).
In the literature on international trade, economists have increasingly employed the DID estimator to evaluate the impact of trade policies on international trade (Clausing 2001; Romalis 2007; Mayda and Steinberg 2009; Frazer and Van Biesebroeck 2010). Frazer and Van Biesebroeck (2010) adopted the same methodology to analyze trade growth under the African Growth and Opportunity Act (AGOA).
It is generally argued that the number of bilateral trade flows (extensive margin) also increases as a result of trade liberalization. This analysis investigates this hypothesis using a probit model and tests whether considering two periods, one before the preferential treatment, 2012–2015, and one after the treatment, 2016–2019, the EPA increased the probability of registering a positive trade flow, which signals the existence of a wider set of bilateral trade flows (extensive margin) and may reflect a larger variety of goods traded or a larger number of exporters of the same good.
From a methodological point of view, the contribution of the article is to provide a micro-level assessment of the impact of the EU–SADC EPA. This paper is part of the research effort that attempts to assess the impact of EU preferential trade policies using highly disaggregated data (Scoppola et al. 2018; Cipollina and Salvatici 2019). Since trade policies are defined and implemented at a very detailed level, it is crucial to use disaggregated data, and this is one of the strengths of the present analysis. It covers the exports to the EU of 5465 commodities, defined at the six-digit tariff line level of the WTO Harmonized System, from the six SADC EPA countries and another 205 countries over the period 2012–2019.
From a policy point of view, the contribution of the article is to fill up the scant scientific literature in the ex-post evaluation of the EU–SADC EPA to assess the functioning and impact of the agreement. Findings point to a significant impact of the EU–SADC EPA on both the extensive and intensive margins, although it seems to be quite heterogeneous; increased probability of trade is modest and increases in the intensity of trade vary widely among the SADC EPA members and sectors.
The paper is organized as follows. Section 2 reviews the literature assessing the impact of preferential trade agreements on trade flows. Section 3 discusses the empirical model used to estimate the effect of the EU–SADC EPA on the intensive and extensive margins of trade. Section 4 provides information on data and summary statistics. Section 5 contains the empirical results and, finally, Section 6 concludes.
2. A Brief Literature Review
The EU is the world’s leading trade power and plays a leading role in international trade negotiations (Woolcock 2019). Almost all trade negotiations between EU and developing countries aim at liberalizing all trade products (from agriculture to manufactured products) and services to increase the revenues of exporting countries, offer consumers in the importing countries a wider choice of goods and services at lower prices (because of increased competition), and then allow all countries to produce and export the goods and services with which they are best placed to compete. The EPA is essentially a free trade area and is expected to stimulate more production, thereby increasing exports to the EU market. From theory, it is known that each country fully specializes in the production of the good in which it has a “comparative” cost advantage in production and, therefore, trades other goods with the other country, generating gains from trade. Thus, specialization and trade translate into an increase in total production and a reduction in costs (Ricardo’s ([1817] 1951) theory of comparative advantage).
The role of free trade agreements (FTAs) on the country, sector, and firm performance has been largely investigated in the literature. The main theoretical and empirical predictions suggest a positive impact of FTAs, especially for low-income countries that can take advantage of easier access to the foreign market. FTAs can bring tangible economic benefits to producers, by increasing the availability of a wider variety of inputs which can be characterized by higher quality and technological content, and to consumers, who can benefit from greater competition, and, therefore, lower prices, and from the widest choice of products on the market. (De Loecker et al. 2016; Cernat et al. 2018; Amiti et al. 2020). The recent developments in the theory of international trade have also promoted formal models of determinants that explain export performances. In particular, trade openness affects exports through an improvement in product quality and variety (Feenstra 1994, 2010; Hummels and Klenow 2005; Feenstra and Kee 2008). Additionally, there are also some works highlighting some potential detrimental and negative effects, especially related to a decrease in innovation and investment incentives due to stronger competitive pressures and reduced market shares (Rodrik 1992).
Rodrik (2018) argues that economists need to be aware that FTAs create winners and losers. Trade agreements could result in mutually beneficial exchanges, through freer market access, and involve the global updating of regulations and standards, for labor, for example, or the environment. However, they could lead to a set of rent-seeking interests and politically well-connected firms (international banks, pharmaceutical companies, and multinational firms), and may serve to internationalize the influence of these powerful domestic interests.
The impact of the FTA is often reduced by the presence of complex rules relating to the origin, which might be an obstacle for exporters of processed goods (Portugal-Perez 2008; Sytsma 2021). The use of FTAs implies that the members need to comply with rules of origin (RoOs) to prove that goods are produced within their borders. When eligible goods are exported under Most-Favored Nation (MFN) rules, it is likely due to compliance costs and RoOs; therefore, if an exporter prefers not to use the preferential access, it is because the ad valorem equivalent of costs to prove that the goods are produced within their borders are higher than the multilateral tariff (Brenton and Manchin 2003; Bureau et al. 2007; Bombarda and Gamberoni 2013).
Despite this large literature, the evidence, especially at the sectoral level, for African countries is scant and rests on few contributions (Jonsson and Subramanian 2001, for South Africa; Augier et al. 2007, for Morocco; Bigsten and Gebreeyesus 2009; Bigsten and Söderbom 2010, for Ethiopia and African countries; Fontagne et al. 2011, for ACP countries; de Melo and Regolo 2014, for the members of the East African Community) that find increased competitiveness and enhanced efficiency for firms in the liberalized sectors.
In addition, the impact of the EU–SADC EPA is largely unknown. Some studies provided simulations of its potential effects when the negotiations between the EU and the SADC EPA countries were launched (see, for example, Decaluwe et al. 2008; Keck and Piermartini 2008; Osman 2014). These analyses have found positive gains, though small, from the tariff reductions set out in the EPA.
Using a gravity model of trade, Stender et al. (2021) estimate the trade effects of the EPAs between the EU and African countries and find heterogeneous effects across specific agreements and economic sectors. EPAs seem to have increased EU imports from the SADC EPA countries. On the sectoral level, in the area of manufacturing trade, authors find decreases in exports of the ESA and SADC EPA countries to the EU but increases in EU imports for the SADC EPA countries.
Paha et al. (2021) analyze the effects of EU sugar reforms on development in Africa and find different implications for members of the SADC EPA, especially for South Africa, which registered an increase in sugar exports to the EU from 2016 to 2019. Differently, Mozambican sugar exporters did not benefit from improved access to the EU market as a result of joining the SADC EP, also because they already had full duty-free and quota-free access to the EU Single Market under the “Everything But Arms” scheme.
Recently, Bouët et al. (2021) develop a new model to evaluate the economic, trade, and poverty impact of the EU–SADC EPA and find that the agreement is not a full FTA between the EU and these six members of the SADC since these six African countries were already involved in another two different free trade areas; furthermore, some products are exempted from liberalization on the African side. Secondly, many products are already exchanged under free trade. Consequently, since the shock in terms of reducing trade barriers produced by the agreement is small, the impact globally, even if positive, remains tiny for the SADC EPA countries.
3. Empirical Specification
3.1. Intensive Margin: Difference-in-Differences (DID) Analysis
Compared to other works in the trade literature, which analyze the effect of trade policies on bilateral trade flows using gravity models, this work tests whether the preferential access to the EU market, granted by the EU–SADC EPA, actually had a positive impact on the export growth of the African members by employing a Difference-in-Differences (DID) estimator with high-dimensional fixed effects.
Over time, the DID estimator has been widely used in economics for the ex-post evaluation of policies (Álvarez and López 2008; Frazer and Van Biesebroeck 2010; Hannan 2016; Cerqua et al. 2021; Van Biesebroeck et al. 2022). It compares the mean value of a variable of interest between a treated group, before and after a policy treatment, and the mean value of the same variable for a control (or untreated) group, before and after the policy.
Let mjkt be the EU imports of commodity k from country j at time t. The EU imports are observed in a pre-treatment period from the year 2012 to 2015, period0 (period = 0, pre-treatment), and in a post-treatment period from the year 2016 to 2019, period1 (period = 1, post-treatment).
The set of exporter countries is divided into two groups indexed by status “treated” for the country members of the EU–SADC EPA initiative and “control” for all other countries, namely the rest of the world (RoW). The DID estimator is defined as the difference in average imports (m) of traded products from the SADC EPA countries before and after the EPA, minus the difference in average imports of products from the RoW before and after the initiative. Thus, the difference-in-differences, , is:
We distinguish EU imports from the SADC EPA countries and the RoW by using a dummy variable where statej = 1 if the exporter is an EU SADC EPA-eligible country and where statej = 0 otherwise. Between these two periods, a group of products from the SADC EPA countries is treated under a preferential trade regime. We denote statek = 1 for commodities from the SADC EPA countries treated under the EPA initiative and statek = 0 for the other commodities from the SADC EPA countries untreated and the RoW.
The standard DID regression, as formulated by Ashenfelter and Card (1985), takes the following form:
where is the constant term; is the treatment country-group specific effect (to account for average permanent differences between treatment and control); is the time trend common to the control and treatment groups; is the effect of the treatment between countries; and, finally, εjt is a random, unobserved “error” term which contains all determinants of mjkt that the model omits. We add the k-dimension to estimate the triple-difference regression:
where is the treatment commodity-group specific effect; is the effect of the treatment between products; is the effect of the treatment between products within the treated country group; finally, is the coefficient of interest, namely the “true effect” of the treatment deriving from the triple interaction.
A disadvantage of the specification (3) is that it tends to overestimate the impact of the treatment, i.e., the dummy variables could capture the impact of other effects that occurred during the same period of the treatment. Furthermore, the most critical hypothesis, the “parallel-trend assumption”, requires that the set of control countries be as similar as possible to the set of countries treated, i.e., the control countries are suitable to fully represent the treated countries if they were not subject to the processing. This may not be true; it could be verified that the countries chosen for the treatment were precisely those countries that showed greater trade growth potential than the others. In this case, there is a problem of endogeneity of the treatment, whereby the effect on the variable of interest is due to other variables (not specified in the model) and not to the treatment. To limit this problem and improve the results of the analysis, we take as a control group all countries that export to the EU market in the period 2012–2019 and use highly detailed data at the product level (HS6-digit level). Moreover, to better control for the impact of the EU–SADC EPA, we add a complete structure of fixed effects including country-year, product-year, and country-product fixed effects that control for missing and/or imperfectly measured variables (Campos et al. 2021) and permit a more focused and robust analysis. The use of disaggregated data raises the issue of a large percentage of zero trade flows, which might likely be the result of economic decision making based on the potential profitability of engaging in bilateral trade. Following the recommendations of Santos Silva and Tenreyro (2006, 2011), we use the Poisson pseudo-maximum likelihood (PPML) estimator, which accounts for potential heteroscedasticity and zero trade flows in trade data, and is reasonably efficient, especially in large samples. Thus, the following specification is estimated:
The estimation of the model with PPML and time-varying exporter () and product fixed effects (), and exporter-product fixed effects () is consistent with a structural gravity approach, as in Anderson and van Wincoop (2003) (Fally 2015).
What has been illustrated up to now is schematically shown in Table 1.
3.2. Extensive Margin: A Probit Analysis
It is generally asserted that extensive margin growth is the result of trade liberalization (Felbermayr and Kohler 2006; Cipollina and Salvatici 2010; Debaere and Shalah 2010; Hinz et al. 2019; Van Biesebroeck et al. 2022).
To test if the EU–SADC EPA has affected the extensive margin of trade, a probabilistic model is applied. It analyzes the countries’ export decisions, explaining the probability that a good was exported to the EU during the sample period 2016–2019 as period1, and controlling for whether or not it was exported in the previous period 2012–2015 as period0. A dummy variable Yjkt is defined as equal to “1” if good k is exported by country j to the EU in period1 and not exported in period0, and “0” otherwise. Then, the probit equation that specifies the probability for country j of exporting commodity k to the EU, period1, is:
An increased probability of registering a positive trade flow signals the existence of a larger set of trade flows and can reflect a larger variety of goods traded (extensive margin).
4. Data Sources and Descriptives
We use data covering imports of 5465 commodities (WTO definition at 6-digit Harmonized System) from the six members of the SADC (Botswana, Eswatini, Lesotho, Mozambique, Namibia, and South Africa) to the European Union (EU) in the period 2012–2019, and compare imports of the same commodities from the rest of the world (205 countries) in the same period.
Data on tariffs and trade at the HS6 level of detail are from the TRAINS database (see http://r0.unctad.org/trains/) and COMTRADE (https://comtrade.un.org/), which are integrated into the WITS software (see http://wits.worldbank.org/witsweb/default.aspx), accessed on 3 September 2022.
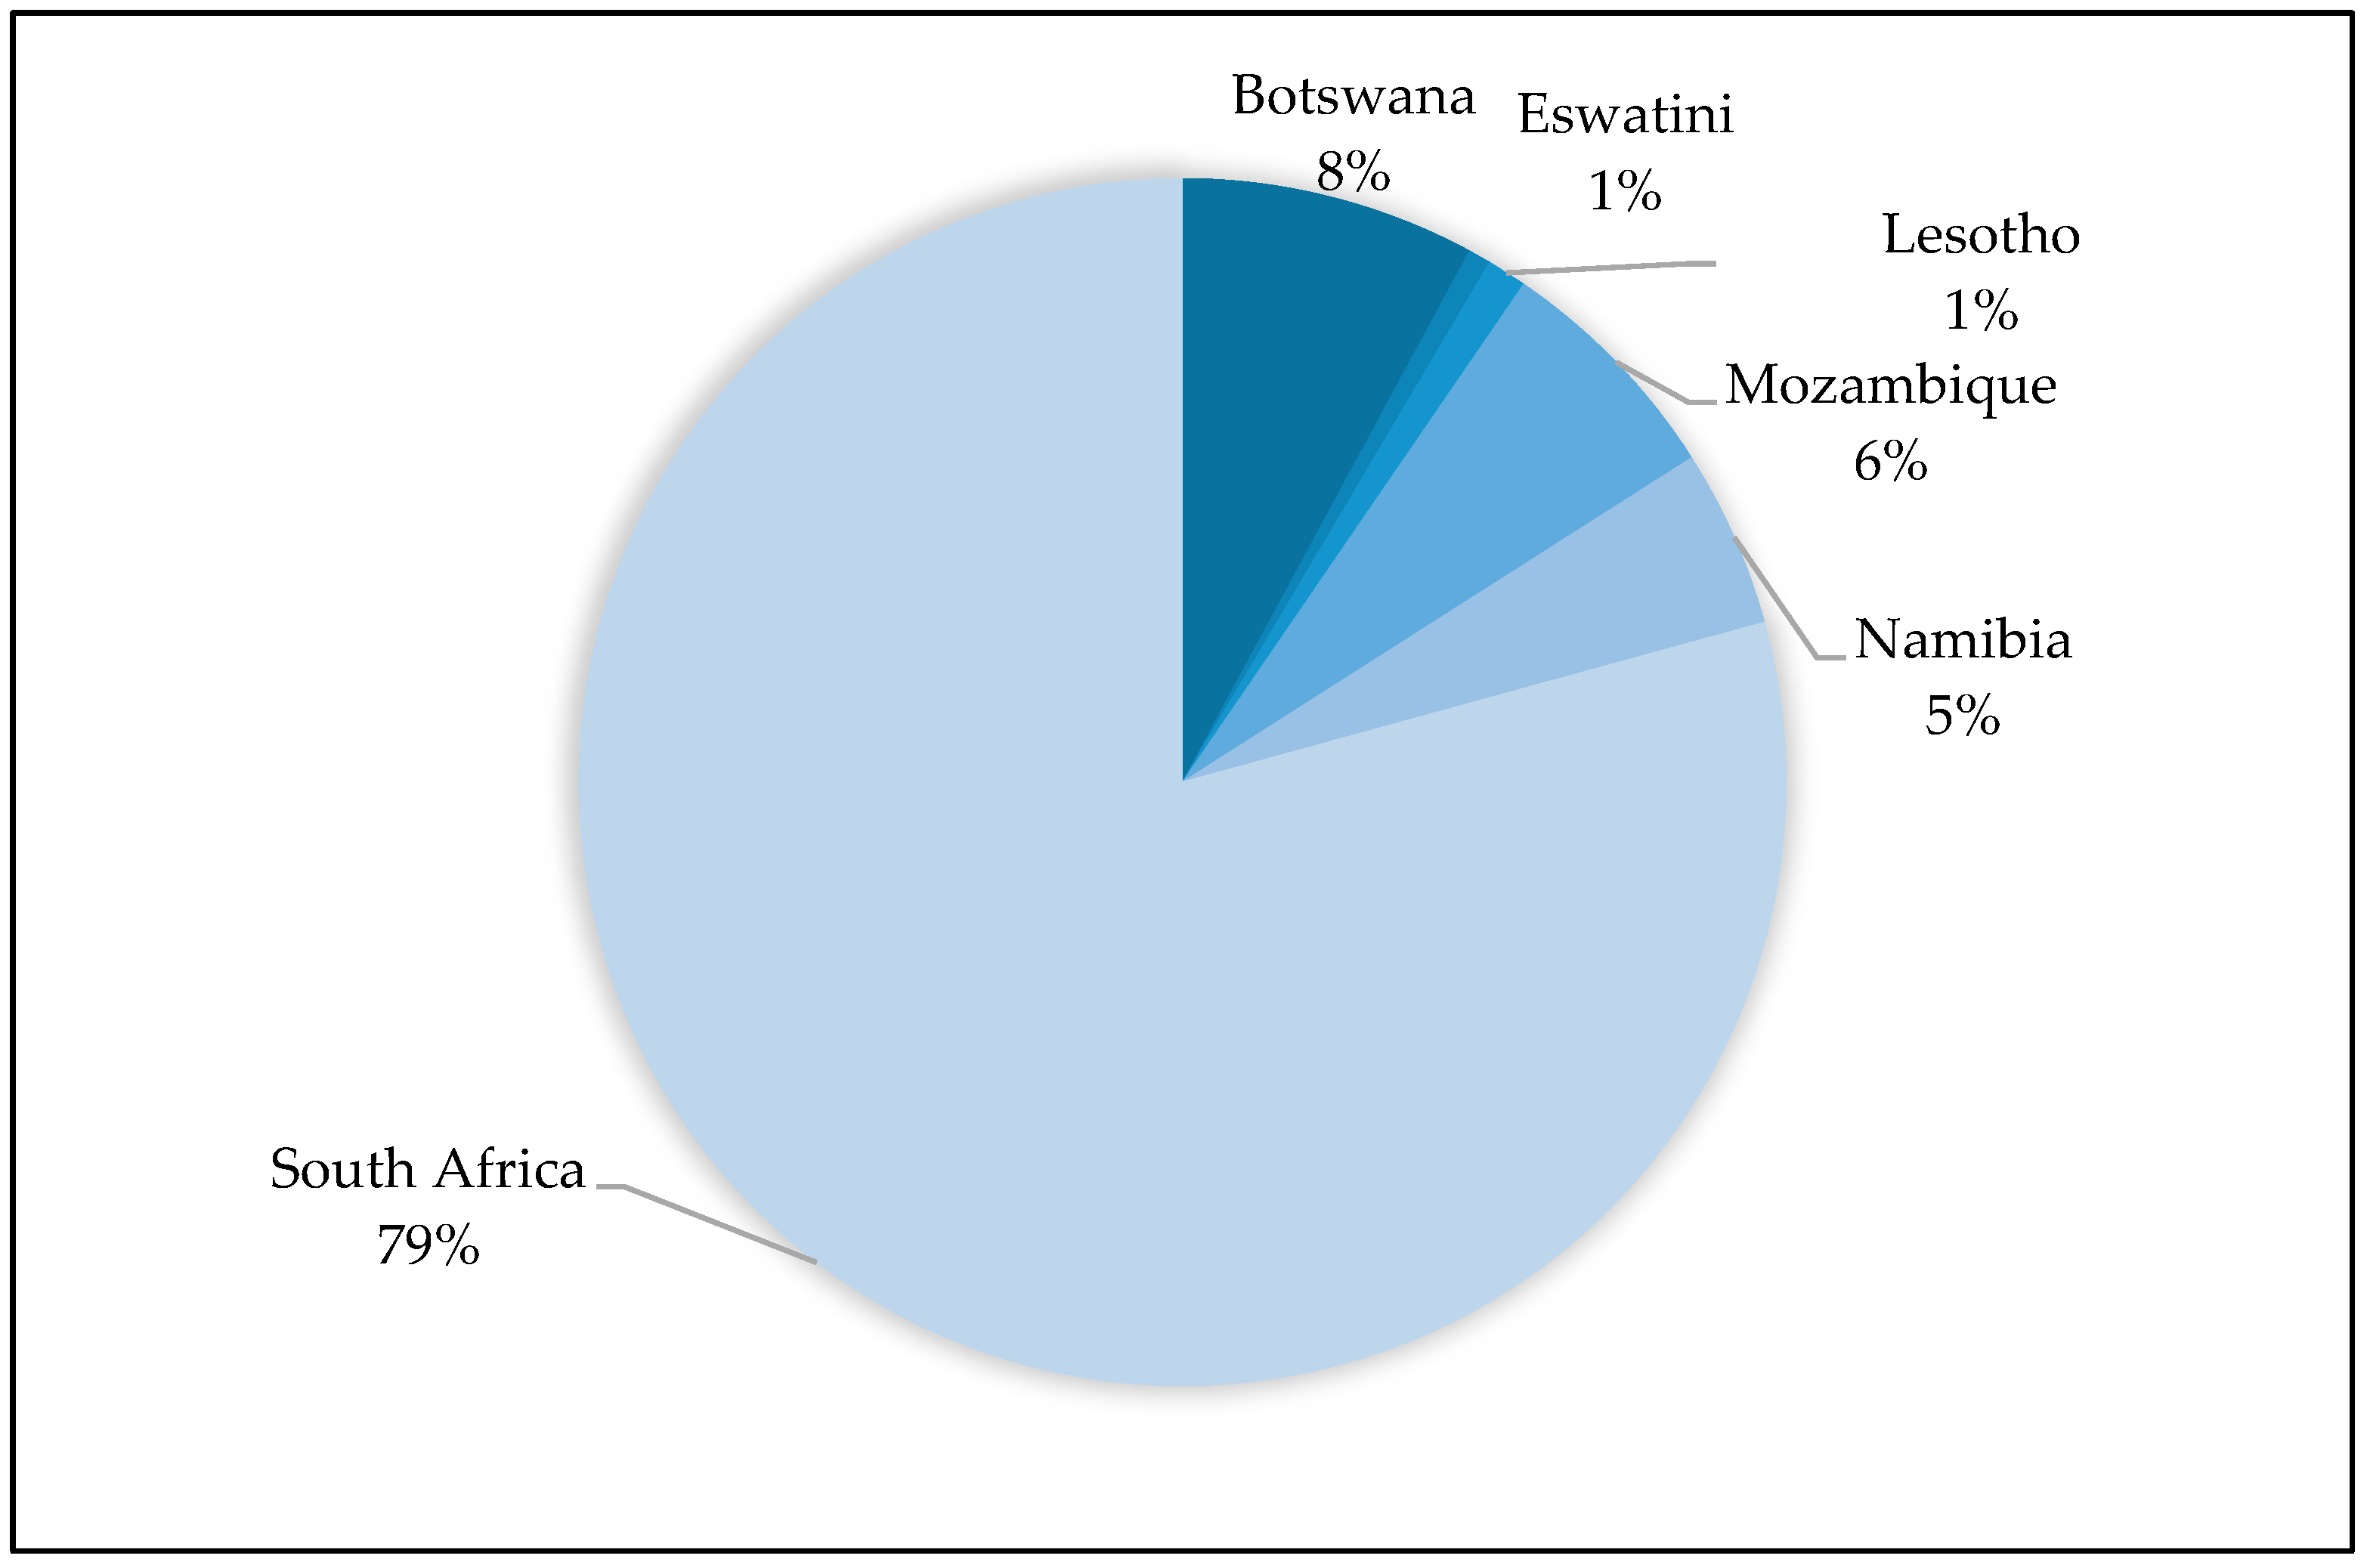
Even though the share of EU imports from the SADC EPA countries is only 1 percent, the EU remains their main trading partner. South Africa accounts for the largest part (79 percent) of EU imports from the region. The share of EU imports from the other members of the SADC is very low, 8 percent from Botswana, 6 percent from Mozambique, 5 percent from Namibia, and 1 percent from Eswatini and Lesotho (see Figure 1).
A focus at sectoral levels reveals that the SADC EPA countries are strong in the exports of diamonds in South Africa, Botswana, Lesotho, and Namibia, the share of the EU in Sector XIV (Pearl and Precious Stones) is around 31 percent (see Figure 2). The share of EU imports in Sector XVII (Transport) and Sector XVI (Machineries), respectively equal to 14 and 6 percent, are essentially from South Africa. Other products from the SADC EPA region are included in Sectors XV (Metals), V (Mineral Products), and are from Mozambique, Namibia, and South Africa. Agricultural products (Sectors I–IV) are from Botswana, Mozambique, Namibia, South Africa, and Eswatini, which mainly exports sugar.
Summary statistics are in Table 2. The table compares the descriptive statistics of the variables “trade”, “MFN duty”, and “preferential bilateral tariff” for the entire sample, for the countries treated under the EU–SADC EPA, and for the control group (i.e., the rest of the world), in the two periods under analysis. Despite a clear multilateral and bilateral liberalization, which emerges from the decrease in both MFN and preferential duties, trade flows appear to decrease in the period 2016–2019 compared to the previous period. Unsurprisingly, the SADC EPA countries export lower quantities than the average country, possibly due to their small size and low level of development. However, in the period 2016–2019, they face an increase in exports to EU markets.
The EU preferences might be considered rather generous. Table 3 shows that, despite the high percentage of duty-free preferential imports on dutiable imports (97 percent), the agreement between EU and SADC EPA countries found some room for a further increase in trade preferences through the reduction/elimination of bilateral applied tariffs. The EU guarantees Botswana, Lesotho, Mozambique, Namibia, and Swaziland free access to its market, while the EU customs duties have been removed only on 98.7 percent of imports coming from South Africa. In the period 2016–2019, 99 percent of the EU imports from the SADC countries subject to tariffs entered duty-free against the percentage of 89 percent which represents the average share of dutiable imports from the rest of the world that enter the EU market with free access.
To give some idea of the degree of protection of the EU, Table 4 shows the pattern of tariffs applied to the SADC countries in the period before and after the treatment.
In the period 2016–2019, there is a greater multilateral and bilateral liberalization. The share of dutiable tariff lines has decreased compared to the previous period, and although a lower share of duty-free preferential tariff lines can be found (75 percent compared to 77 percent in the 2012–2015 period), a higher share of tariff lines from the SADC countries are under the MFN duty-free regime in the period 2016–2019.
It is generally asserted that a result of trade liberalization is the intensive and extensive margin growth of trade. Looking at the average annual growth rates of exports of the two groups of countries to the EU in the two periods (Table 5), it emerges that, in general, exports to the EU grew in period1 compared to period0 but the average annual growth rate of exports from the SADC EPA countries is higher (9 percent) than the rest of the world (4 percent), with a difference-in-differences of 4.70 percentage points.
For a simple assessment of the impact on the extensive margin, Table 6 shows the number of exported goods to the EU from the six countries of the SADC and the rest of the world. Column (1) of the table counts the number of goods exported over the entire period 2012–2019, and one can see that Botswana, Eswatini, Lesotho, and Namibia have traded a larger variety of goods in the period1 in which a larger share of all exported goods are newly traded goods (column 2). Of the goods that Mozambique trades, 51 percent are goods that are not traded after the agreement with the EU (column 3); however, if one removes both the new and the obsolete goods, one still finds about 36 percent of exports of permanent goods from Mozambique (column 4). South Africa is the country that trades a higher variety of goods to the EU, and a share of 14 percent of newly traded goods can be explained by bilateral tariff liberalizations.
Overall, if one analyzes the newly traded goods for the rest of the world as a whole, which account for 5 percent of all goods imported from the EU, this table shows a slightly extensive margin growth of exports as a result of the multilateral tariff liberalization (see Table 4).
5. Discussion of Results
This section presents the estimation results for the impact of the EU–SADC EPA on the intensive margin of trade in Table 7, Table 8 and Table 9 and on the extensive margin of trade in Table 10, Table 11 and Table 12.
The results of Equation (4) obtained by the PPML estimator with a full set of country-year, product-year, and country-product fixed effects are in Table 7. The coefficient of interest, , that is the triple-interaction term measures the effect on the trade of goods exported to the EU under the EU–SADC EPA treatment. The estimated coefficient is positive and statistically significant, indicating that the agreement raises exports by around 27 percent ((exp(0.24) − 1) × 100).
The interaction with the six members of the SADC group in Table 8 shows that some countries have benefited more in terms of trade. In particular, positive and statistically significant coefficients for Botswana and South Africa show that, for these countries, trade is increased by around 139 and 34 percent, respectively. Mozambique and Namibia have, instead, reduced trade by around 144 and 48 percent.
The uneven impact of trade between countries is not surprising considering that the SADC EPA group is very different in terms of economic development. Lesotho and Mozambique are least developed countries (LDCs), Eswatini is a lower-middle income country, while Botswana, Namibia, and South Africa hold upper-middle income status.
In the case of Mozambique, it should also be remembered that it entered the agreement only in 2018 and, therefore, it is possible to assume that it has not yet benefited from the preferential treatment. Furthermore, as other authors (Paha et al. 2021) have highlighted in previous studies, because of the overlapping of other preferential schemes already in force, a reduced trade impact of the EU–SADC EPA is not surprising in some countries.
For analysis at the sectoral level, products are grouped into 21 WTO sectors. The analysis excludes all products of the sectors “Paper and Paperboard and Articles Thereof” (X) and “Works of Art” (XXI) that entered the EU market under an MFN duty-free regime, and all products in the sector “Arms and Ammunition” (XIX), since trade flows in this sector are not driven by economic motivations.
Table 9 reports the results for the 18 sectors under investigation. Consistent with the results by country, the sectors exported by the largest exporter in the region to the EU, namely South Africa, are those that benefit most from the agreement (see Section 4).
The SADC EPA countries mainly export precious stones, mineral products, and agricultural products, such as fruits and sugar, to the EU.
The findings show that the sectors which have registered a higher increase in trade are “Transport” (XVII) and “Mineral Products” (V), with an increase of around 120 and 65 percent, respectively. Mineral products are mainly exported from Mozambique, Namibia, and South Africa and, if we look at the findings in Table 8, it seems that part of the increased trade in South Africa can be explained by trade diversion. A positive impact is also found in the sectors “Animal and Animal Products” (I), with an increase of 23 percent, “Raw Hides, Skins, Leather, and Furs” (VIII), with an increase of 48 percent, “Wood and Articles of Wood” (IX), with an increase of 51 percent, and “Footwear and Headgear sector” (XII), with an increase of 31 percent.
On the other hand, the sectors damaged in terms of trade are “Miscellaneous Manufactured Articles” (XX), “Metals” (XV), and “Machineries” (XVI), for which trade decreased by 200, 40, and 35 percent, respectively. The decline in exports may be explained by supply-side constraints and by a potential trade diversion due to the onerous specifications of the rules of origin, which are seen as a major obstacle for exporters of processed goods.
Table 10 shows the results of the probit model in Equation (5). Due to computational problems for the estimation of the probit model with a large number of fixed effects in the presence of a huge amount of observations, a reduced structure of fixed effects is used and they are gradually introduced for a robustness check of coefficients.
The coefficient of interest, , that is the triple-interaction term in the probit model, measures the effect on the extensive margin of trade, is always positive and statistically significant, even if the magnitude is very small, implying that the impact of the EU–SADC EPA on the probability of exporting new varieties of goods to EU markets is only equal to 1 percent.
Looking at the results by country (Table 11), there emerges an increase in the probability of exporting a good of around 2 percent for Eswatini and Mozambique, and 5 percent for Namibia. For all other countries, the coefficient is negative and statistically significant, implying a decrease in the probability of registering a positive trade flow as a consequence of preferential treatment that varies between 2 percent for South Africa and 10 percent for Botswana. For these two countries, the EPA seems to increase the intensity of trade (see Table 8) not attributable to an increase in the number of product varieties but to a potential specialization in specific sectors.
The results for the different sectors, shown in Table 12, provide some insights into the consequences of the EU–SADC EPA for the extensive margin. The coefficients are statistically significant for eight out of 18 sectors.
In almost all cases, the agreement significantly increases the probability of exporting to EU markets. The increase in the probability of registering a positive trade flow in period1 varies between 3 percent for “Vegetable Products” (II) and 19 percent for “Pearl and Precious stones” (XIV).
A negative impact on the probability of registering a positive trade flow is, instead, registered for “Textiles” (XI) and “Instruments” (XVIII), where the marginal effect is, respectively, −6 percent and −2 percent. These different impacts are related to the structure of the tariffs applied as well as to the extent of the EU preferences, in particular for the textile sector (a key sector for the least developed countries), granted to other African countries.
6. Conclusions
Trade preferences for African countries have been used by the EU, and other developed countries, since the early 1960s. Most African countries can export to the EU with preferential market access under different trade agreements.
The EU continues to exert pressure on African countries to sign Economic Partnership Agreements (EPAs) as soon as possible. While it is believed that trade integration with the EU can play an important role in stimulating innovation and increasing the productivity of African firms, on the other hand, more bureaucracy and additional costs, linked to the use of the preferential regime, do not allow beneficiary countries to participate more fully in international trade and generate additional revenue from exports to support the development of industry and employment, and to reduce poverty.
Despite the large literature investigating the role of trade preferences on the country, sector, and firm performances, the empirical evidence for African countries is scant and rests on a few contributions, especially at the product level. This work improves the existing literature on several dimensions. First, it contributes to the advancement of knowledge from the point of view of the methodologies used in quantitative analyses of the trade policies’ effectiveness. Second, the findings of this research contribute to the controversial and widely debated issue of the effectiveness of EU trade preferences, providing new evidence that shows a significant, albeit very limited, impact on trade in the case of the SADC EPA countries.
This analysis aimed to assess the changes in exports of the six SADC EPA countries to the EU, dictated by EU policies for trade liberalization and integration. In particular, the goal was to provide quantitative assessments of the EU–SADC EPA’s impact at the sectoral level on the quantity of trade (intensive margin of trade) and the number of goods traded (extensive margin of trade). Based on highly disaggregated 6-digit data, this study has measured and compared changes in exports to the EU from the six SADC EPA members and the rest of the world during the four years before and four years after the EU–SADC EPA agreement.
The findings show robust estimates for the impact of the agreement on both intensive and extensive margins. The additional flow generated by the EU–SADC EPA is around 27 percent, and the impact is particularly significant for Botswana and South Africa. The agreement seems to enhance African exports to the EU, particularly in mineral products, articles of wood, and transports.
The EU–SADC EPA slightly affects the extensive margins of trade, since the increase in the probability of registering a positive export to the EU is on average equal to 1 percent, ranging between 3 percent for vegetable products and 19 percent for pearl and precious stones. While a negative impact on the probability of registering a positive trade flow is, instead, registered for the textile sector and for instruments, where the marginal effect is, respectively, −6 percent and −2 percent.
The main limitation of this analysis is that it does not capture trade creation effects due to the replacement of domestic sales. This is a tricky exercise because detailed data on intranational trade are not available. A possible extension of this work would be the estimation of the EPA-induced effect on intra-African trade.
Funding
This research received no external funding.
Informed Consent Statement
Not applicable.
Data Availability Statement
Not applicable.
Conflicts of Interest
The author declares no conflict of interest.
| 1 | The EPA entered into force provisionally on 10 October 2016 and Mozambique has been applying it provisionally since 4 February 2018. |
References
- Álvarez, Roberto, and Ricardo A. López. 2008. Trade Liberalization and Industry Dynamics: A Difference in Difference Approach. Working Papers Central Bank of Chile 470. San Diego: Central Bank of Chile. [Google Scholar]
- Amiti, Mary, Mi Dai, Robert C. Feenstra, and John Romalis. 2020. How did China’s WTO entry affect U.S. prices? Journal of International Economics 126: 103339. [Google Scholar] [CrossRef]
- Anderson, James E., and Eric van Wincoop. 2003. Gravity with gravitas: A solution to the border puzzle. American Economic Review 93: 170–92. [Google Scholar] [CrossRef]
- Ashenfelter, Orley, and David Card. 1985. Using the Longitudinal Structure of Earnings to Estimate the Effect of Training Programs. In The Review of Economics and Statistics. Cambridge: MIT Press, vol. 67, pp. 648–60. [Google Scholar]
- Augier, Patricia, Michael Gasiorek, and Gonzalo Varela. 2007. Determinants of Productivity in Morocco—The Role of Trade? CARIS Working Papers 02. Brighton: Centre for the Analysis of Regional Integration at Sussex, University of Sussex. [Google Scholar]
- Bigsten, Arne, and Mulu Gebreeyesus. 2009. Firm Productivity and Exports: Evidence from Ethiopian Manufacturing. Journal of Development Studies 45: 1594–614. [Google Scholar] [CrossRef]
- Bigsten, Arne, and Mans Söderbom. 2010. African Firms in the Global Economy. Review of Market Integration 2: 229–53. [Google Scholar] [CrossRef]
- Bombarda, Pamela, and Elisa Gamberoni. 2013. Firm heterogeneity, rules of origin and rules of cumulation. International Economic Review 54: 307–28. [Google Scholar] [CrossRef]
- Bouët, Antoine, David Laborde Debucquet, and Fousseini Traoré. 2021. MIRAGRODEP Dual-Dual (MIRAGRODEP-DD) with an Application to the EU-Southern African Development Community (SADC) Economic Partnership Agreement (EPA), IFPRI AGRODEP Technical Note 0021. Available online: https://www.ifpri.org/series/agrodep-technical-note (accessed on 2 October 2022).
- Brenton, Paul, and Miriam Manchin. 2003. Making EU trade agreements work: The role of rules of origin. The World Economy 26: 755–69. [Google Scholar] [CrossRef]
- Bureau, Jean-Christophe, Raja Chakir, and Jacques Gallezot. 2007. The utilisation of trade preference for developing countries in the agri-food sector. Journal of Agricultural Economics 58: 175–98. [Google Scholar] [CrossRef]
- Campos, Rodolfo G., Jacopo Timini, and Elena Vidal Muñoz. 2021. Structural Gravity and Trade Agreements: Does the Measurement of Domestic Trade Matter? Documentos de Trabajo. N.º 2117. Madrid: BANCO DE ESPAÑA. [Google Scholar]
- Cernat, Lucien, Daphne Gerard, Oscar Guinea, and Lorenzo Isella. 2018. Consumer Benefits from EU Trade Liberalisation: How Much Did We Save Since the Uruguay Round? DG TRADE Chief Economist Notes 2018-1. Brussels: Directorate General for Trade, European Commission. [Google Scholar]
- Cerqua, Augusto, Pierluigi Montalbano, and Zhansaya Temerbulatova. 2021. A Decade of Eurasian Integration: An Ex-Post Non-Parametric Assessment of the Eurasian Economic Union. Working Papers 1/21. Rome: Sapienza University of Rome, DISS. [Google Scholar]
- Cipollina, Maria, and Luca Salvatici. 2010. The trade impact of European Union agricultural preferences. Journal of Economic Policy Reform 13: 87–106. [Google Scholar] [CrossRef]
- Cipollina, Maria, and Luca Salvatici. 2019. The Trade Impact of EU Tariff Margins: An Empirical Assessment. Social Sciences 8: 261. [Google Scholar] [CrossRef]
- Clausing, Kimberly A. 2001. Trade Creation and Trade Diversion in the Canada-United States Free Trade Agreement. Canadian Journal of Economics 34: 677–96. [Google Scholar] [CrossRef]
- De Loecker, Jan, Pinelopi K. Goldberg, Amit K. Khandelwal, and Nina Pavcnik. 2016. Process, Mark-ups, and Trade Reform. Econometrica 84: 445–510. [Google Scholar] [CrossRef]
- de Melo, Jaime, and Julie Regolo. 2014. The African Economic Partnership Agreements with the EU: Reflections inspired by the case of the East African Community. Journal of African Trade 1: 15–24. [Google Scholar] [CrossRef]
- Debaere, Peter, and Mostashari Shalah. 2010. Do Tariffs Matter for the Extensive Margin of International Trade? An Empirical Analysis. Journal of International Economics 81: 163–69. [Google Scholar] [CrossRef]
- Decaluwe, Bernard, David Laborde, Helene Maisonnave, and V. Robichaud. 2008. Regional CGE Modeling for West Africa: An EPA Study. Report for the EC and ECOWAS secretariats. Paris: ITAQA Sarl, vol. 1–4. [Google Scholar]
- Fally, Thibault. 2015. Structural Gravity and Fixed Effects. Journal of International Economics 97: 76–85. [Google Scholar] [CrossRef]
- Feenstra, Robert C. 1994. New product varieties and the measurement of international prices. American Economic Review 84: 157–77. [Google Scholar]
- Feenstra, Robert C. 2010. Measuring the gains from trade under monopolistic competition. Canadian Journal of Economics 43: 1–28. [Google Scholar] [CrossRef]
- Feenstra, Robert C., and Hiau Looi Kee. 2008. Export variety and country productivity: Estimating the monopolistic competition model with endogenous productivity. Journal of International Economics 74: 500–18. [Google Scholar] [CrossRef]
- Felbermayr, Gabriel J., and Wilhelm Kohler. 2006. Exploring the Intensive and Extensive Margins of World Trade. Review of World Economics/Weltwirtschaftliches Archiv 142: 642–74. Available online: http://0-www-jstor-org.brum.beds.ac.uk/stable/40441114 (accessed on 30 September 2022). [CrossRef]
- Fontagne, Lionel, Cristina Mitaritonna, and David Laborde. 2011. An impact study of the EU ACP Economic Partnership Agreements (EPAs) in the six ACP regions. Journal of African Economies 20: 179–216. [Google Scholar] [CrossRef]
- Frazer, Garth, and Johannes Van Biesebroeck. 2010. Trade growth under the African Growth and Opportunity Act. The Review of Economics and Statistics 92: 128–44. Available online: http://0-www-jstor-org.brum.beds.ac.uk/stable/25651394 (accessed on 3 September 2022). [CrossRef]
- Fredriksson, Anders, and Gustavo Magalhães de Oliveira. 2019. Impact evaluation using Difference-in-Differences. RAUSP Management Journal 54: 519–32. [Google Scholar] [CrossRef]
- Hannan, Swarnali A. 2016. The Impact of Trade Agreements: New Approach, New Insights. IMF Working Papers 2016/117. Washington, DC: International Monetary Fund. [Google Scholar]
- Hinz, Julian, Amrei Stammann, and Joschka Wanner. 2019. Persistent Zeros: The Extensive Margin of Trade. Kiel Working Papers 2139. Kiel: Kiel Institute for the World Economy (IfW Kiel). [Google Scholar]
- Hummels, David, and Peter J. Klenow. 2005. The variety and quality of a nation’s exports. The American Economic Review 95: 704–23. [Google Scholar] [CrossRef]
- Jonsson, Gunnar, and Arvind Subramanian. 2001. Dynamic Gains from Trade: Evidence from South Africa. IMF Staff Papers 48: 197–224. Available online: http://0-www-jstor-org.brum.beds.ac.uk/stable/4621665 (accessed on 13 October 2022).
- Keck, Alexander, and Roberta Piermartini. 2008. The impact of Economic Partnership Agreements in countries of the Southern African Development Community. Journal of African Economies 17: 85–130. [Google Scholar] [CrossRef]
- Mayda, Anna Maria, and Chad Steinberg. 2009. Do South-South Trade Agreements Increase Trade? Commodity-Level Evidence from Comesa. The Canadian Journal of Economics/Revue Canadienne d’Economique 42: 1361–89. Available online: http://0-www-jstor-org.brum.beds.ac.uk/stable/40389534 (accessed on 3 September 2022). [CrossRef]
- Osman, Rehab O. M. 2014. SADC trade with the European Union from a preferential to a reciprocal modality. South African Journal of Economics 83: 23–40. [Google Scholar] [CrossRef]
- Paha, Johannes, Timon Sautter, and Reinhard Schumacher. 2021. Some Effects of EU Sugar Reforms on Development in Africa. Intereconomics 56: 288–94. [Google Scholar] [CrossRef]
- Portugal-Perez, Alberto. 2008. The Costs of Rules of Origin in Apparel: African Preferential Exports to the United States and the European Union. Policy Issues in International Trade and Commodities Study Series 39; Geneva: UNCTAD. [Google Scholar]
- Ricardo, David. 1951. On the Principles of Political Economy and Taxation (John Murray, London). In The Works and Correspondence of David Ricardo. Edited by P. Sraffa. Cambridge: Cambridge University Press, vol. 1. First published 1817. [Google Scholar]
- Rodrik, Dani. 1992. The Limits of Trade Policy Reform in Developing Countries. The Journal of Economic Perspectives 6: 87–105. Available online: http://0-www-jstor-org.brum.beds.ac.uk/stable/2138375 (accessed on 30 August 2022). [CrossRef]
- Rodrik, Dani. 2018. What Do Trade Agreements Really Do? Journal of Economic Perspectives 32: 73–90. [Google Scholar] [CrossRef]
- Romalis, John. 2007. NAFTA’s and CUSFTA’s Impact on International Trade. The Review of Economics and Statistics 89: 416–35. [Google Scholar] [CrossRef]
- Santos Silva, João M. C., and Silvana Tenreyro. 2006. The log of gravity. Review of Economics and Statistics 88: 641–58. [Google Scholar] [CrossRef]
- Santos Silva, João M. C., and Silvana Tenreyro. 2011. Further simulation evidence on the performance of the Poisson pseudo-maximum likelihood estimator. Economics Letters 112: 220–22. [Google Scholar] [CrossRef] [Green Version]
- Scoppola, Margherita, Valentina Raimondi, and Alessandro Olper. 2018. The impact of EU trade preferences on the extensive and intensive margins of agricultural and food products. In Agricultural Economics. Milwaukee: International Association of Agricultural Economists, vol. 49, pp. 251–63. [Google Scholar]
- Stender, Frederik, Axel Berger, Clara Brandi, and Jakob Schwab. 2021. The Trade Effects of the Economic Partnership Agreements between the European Union and the African, Caribbean and Pacific Group of States: Early Empirical Insights from Panel Data. JCMS: Journal of Common Market Studies 59: 1495–515. [Google Scholar] [CrossRef]
- Sytsma, Tobias. 2021. Rules of origin and trade preference utilization among least developed countries. Contemporary Economic Policy 39: 701–18. [Google Scholar] [CrossRef]
- Van Biesebroeck, Johannes, Yingting Yi, and Elena Zaurino. 2022. Trade liberalisation and the extensive margin of differentiated goods: Evidence from China. The World Economy 45: 2724–47. [Google Scholar] [CrossRef]
- Woolcock, Stephen. 2019. The role of the European Union in the international trade and investment order. In LSE Research Online Documents on Economics 102821. London: London School of Economics and Political Science, LSE Library. [Google Scholar]
Figure 1.
Composition of EU imports by SADC country (average period 2012–2019).

Figure 2.
Composition of EU imports by sectors (average period 2012–2019).


Table 1.
Difference-in-Differences.
| Status | Trade Effect | Difference | |
|---|---|---|---|
| Post-Treatment | Pre-Treatment | ||
| Treated | α + β + γ + δ | α + β | γ + δ |
| Control | α + γ | α | γ |
| Difference-in-differences | δ | ||
Source: Author’s elaboration.
Table 2.
Descriptive statistics.
| Total Sample | 2012–2015 | 2016–2019 | ||||
|---|---|---|---|---|---|---|
| Min | Mean | Max | Min | Mean | Max | |
| Trade (Ml) | 0 | 5.999 | 132,369 | 0 | 5.776 | 71,752 |
| MFN duty (%) | 0 | 4.41 | 74.90 | 0 | 4.34 | 74.90 |
| Preferential applied tariff (%) | 0 | 0.38 | 52.4 | 0 | 0.16 | 52.4 |
| No. of obs. with positive trade (No. of all obs.) | 813,190 (1,588,144) | 899,778 (1,588,144) | ||||
| SADC EPA countries | ||||||
| Trade (Ml) | 0 | 2.946 | 4324 | 0 | 3.102 | 4269 |
| MFN duty (%) | 0 | 4.34 | 74.9 | 0 | 4.27 | 74.90 |
| Preferential applied tariff (%) | 0 | 0.07 | 25.9 | 0 | 0.05 | 29.44 |
| No. of obs. with positive trade (No. of all obs.) | 18,221 (36,724) | 21,095 (39,674) | ||||
| RoW | ||||||
| Trade (Ml) | 0 | 6.071 | 132,369 | 0 | 5.846 | 71,752 |
| MFN duty (%) | 0 | 4.41 | 74.90 | 0 | 4.35 | 74.90 |
| Preferential applied tariff (%) | 0 | 0.39 | 74.90 | 0 | 0.16 | 52.40 |
| No. of obs. with positive trade (No. of all obs.) | 794,969 (1,551,420) | 878,683 (1,548,470) | ||||
Notes: average periods 2012–2015 and 2016–2019. Source: Elaboration on data by COMTRADE and TRAINS.
Table 3.
Percentage of duty-free preferential imports on dutiable imports (%).
| Countries | 2012–2015 | 2016–2019 |
|---|---|---|
| SADC EPA countries | 98 | 99 |
| RoW | 88 | 89 |
Notes: average periods 2012–2015 and 2016–2019. Source: Elaboration on data by COMTRADE and TRAINS.
Table 4.
The pattern of EU protection in 2012–2015 and 2016–2019 for SADC countries.
| Share of Tariff Lines (%) | ||
|---|---|---|
| 2012–2015 | 2016–2019 | |
| Free trade (MFN duty = 0) | 22 | 24 |
| Preferential duty-free | 77 | 75 |
| Tariffs under 5% | 0.4 | 0.3 |
| Tariffs between 5% and 10% | 0.4 | 0.2 |
| Tariffs between 10% and 25% | 0.2 | 0.1 |
| Tariffs over 25% | 0.0 | 0.0 |
Notes: average periods 2012–2015 and 2016–2019. Source: Elaboration on data by COMTRADE and TRAINS.
Table 5.
Change in export flows to EU.
| Status | Average Annual Growth Rate (%) | Difference | |
|---|---|---|---|
| 2012–2015 | 2016–2019 | ||
| SADC EPA countries | 0.4 | 9 | 8.60 |
| RoW | 0.1 | 4 | 3.90 |
| Difference-in-Differences | 4.70 | ||
Notes: average periods 2012–2015 and 2016–2019. Source: Elaboration on data by COMTRADE.
Table 6.
Classifying export goods from the SADC to the EU.
| Exporting Country | 1 | 2 | 3 | 4 |
|---|---|---|---|---|
| All Exported Goods | Newly Traded Goods | Disappearing Goods | Continuously Traded Goods | |
| Botswana | 740 | 39% | 30% | 31% |
| Eswatini | 1211 | 49% | 20% | 31% |
| Lesotho | 227 | 43% | 34% | 22% |
| Mozambique | 1475 | 14% | 51% | 36% |
| Namibia | 2425 | 51% | 9% | 40% |
| South Africa | 4549 | 14% | 6% | 79% |
| RoW | 5465 | 5% | 0% | 95% |
Notes: 1. Number of goods exported over the entire period 2012–2019; 2. Goods exported only in the period 2016–2019, percent of all exported goods; 3. Goods exported only in the period 2012–2015, percent of all exported goods; 4. Goods exported in periods 2012–2015 and 2016–2019, percent of all exported goods.
Table 7.
Results for the EU–SADC EPA effect on the intensive margin.
| PPML | |
|---|---|
| −0.90 *** | |
| (0.19) | |
| 0.24 *** | |
| (0.09) | |
| Constant | 13.67 *** |
| (0.00) | |
| Fixed effect | Country-product Country-year Product-year |
| N | 3,103,832 |
| pseudo R2 | 0.990 |
Notes: Dependent variable: EU imports. All other variables of Equation (4) are absorbed by fixed effects; In parentheses: robust standard errors; *** significant at 1% level.
Table 8.
Results for the EU–SADC EPA effect on the intensive margin—Disaggregated countries.
| PPML | ||
|---|---|---|
| −0.16 | (0.11) | |
| Botswana | 0.87 *** | (0.25) |
| Eswatini | −0.22 | (0.48) |
| Lesotho | −0.03 | (0.17) |
| Mozambique | −0.89 *** | (0.23) |
| Namibia | −0.39 * | (0.20) |
| South Africa | 0.29 *** | (0.10) |
| Constant | 13.67 *** | (0.00) |
| Fixed effect | Country-product Country-year Product-year | |
| N | 3,103,832 | |
| pseudo R2 | 0.990 | |
Notes: Dependent variable: EU imports. All other variables of Equation (4) are absorbed by fixed effects; In parentheses: robust standard errors; *** significant at 1% level; * significant at 10% level.
Table 9.
Results for the EU–SADC EPA effect on the intensive margin—Disaggregated sectors.
| PPML | ||
|---|---|---|
| −0.55 *** | (0.16) | |
| I: Animal & Animal Products | 0.21 ** | (0.09) |
| II: Vegetable Products | 0.11 | (0.08) |
| III: Fats & Oils | 0.14 | (0.19) |
| IV: Foodstuffs, Beverages and Tobacco | 0.03 | (0.09) |
| V: Mineral Products | 0.50 ** | (0.21) |
| VI: Chemicals & Allied Industries | 0.23 | (0.17) |
| VII: Plastics/Rubbers | 0.01 | (0.14) |
| VIII: Raw Hides, Skins, Leather, & Furs | 0.39 ** | (0.15) |
| IX: Wood & Articles of Wood | 0.41 *** | (0.14) |
| XI: Textiles | 0.05 | (0.10) |
| XII: Footwear/Headgear | 0.27 ** | (0.12) |
| XIII: Stone/Glass | 0.19 | (0.13) |
| XIV: Pearls and Precious stones | 0.24 | (0.16) |
| XV: Metals | −0.34 *** | (0.10) |
| XVI: Machineries | −0.30 *** | (0.11) |
| XVII:Transport | 0.79 *** | (0.15) |
| XVIII: Instruments | −0.03 | (0.14) |
| XX: Misc. Manufactured Articles | −1.10 *** | (0.28) |
| Constant | 13.67 *** | (0.00) |
| Fixed effect | Country-product Country-year Product-year | |
| N | 3,103,832 | |
| pseudo R2 | 0.990 | |
Notes: Dependent variable: EU imports. All other variables of Equation (4) are absorbed by fixed effects; In parentheses: robust standard errors; *** significant at 1% level; ** significant at 5% level.
Table 10.
Results for the EU–SADC EPA effect on the extensive margin.
| Coeff. | Marginal Effect | Coeff. | Marginal Effect | Coeff. | Marginal Effect | |
|---|---|---|---|---|---|---|
| −0.01 | −0.00 | −0.03 * | −0.01 * | −0.03 | −0.01 | |
| (0.01) | (0.00) | (0.02) | (0.00) | (0.02) | (0.00) | |
| 0.06 *** | 0.01 *** | 0.05 *** | 0.01 *** | 0.05 *** | 0.01 *** | |
| (0.02) | (0.00) | (0.02) | (0.00) | (0.02) | (0.00) | |
| −0.28 *** | −0.05 *** | −0.15 *** | −0.03 *** | −0.15 *** | −0.03 *** | |
| (0.03) | (0.00) | (0.03) | (0.01) | (0.03) | (0.01) | |
| Constant | −6.02 *** | −5.59 | −5.50 | |||
| (0.00) | (4.00) | (4.01) | ||||
| Fixed effect | Year | Year Country | Year Country Sector | |||
| N | 2,773,212 | 2,773,212 | 2,773,212 | |||
| pseudo R2 | 0.067 | 0.093 | 0.094 |
Notes: Dependent variable: Dummy variable (Yjkt) is defined as equal to “1” if good k is exported by country j to the EU in period1 and not exported in period0, and “0” otherwise. All other variables of Equation (5) are absorbed by fixed effects; In parentheses: robust standard errors; *** significant at 1% level; * significant at 10% level.
Table 11.
Results for the EU–SADC EPA effect on the extensive margin—Disaggregated countries.
| Coeff. | Marginal Effect | |||
|---|---|---|---|---|
| −0.08 *** | (0.01) | −0.03 *** | (0.00) | |
| Botswana | −0.29 *** | (0.04) | −0.10 *** | (0.01) |
| Eswatini | 0.07 ** | (0.03) | 0.02 *** | (0.01) |
| Lesotho | −0.17 *** | (0.06) | −0.06 *** | (0.02) |
| Mozambique | 0.08 ** | (0.03) | 0.02 ** | (0.01) |
| Namibia | 0.17 *** | (0.02) | 0.05 *** | (0.01) |
| South Africa | −0.07 *** | (0.02) | −0.02 *** | (0.01) |
| −0.13 *** | (0.03) | −0.04 *** | (0.01) | |
| Constant | −0.94 *** | (0.01) | ||
| Fixed effect | Year Country Sector | |||
| N | 3,169,728 | |||
| pseudo R2 | 0.154 | |||
Notes: Dependent variable: Dummy variable (Yjkt) is defined as equal to “1” if good k is exported by country j to the EU in period1 and not exported in period0, and “0” otherwise. All other variables of Equation (5) are absorbed by fixed effects; In parentheses: robust standard errors; *** significant at 1% level; ** significant at 5% level.
Table 12.
Results for the EU–SADC EPA effect on the extensive margin—Disaggregated sectors.
| Coeff. | Marginal Effect | |||
|---|---|---|---|---|
| −0.08 *** | (0.01) | −0.02 *** | (0.00) | |
| I: Animal & Animal Products | 0.16 *** | (0.04) | 0.05 *** | (0.01) |
| II: Vegetable Products | 0.09 *** | (0.03) | 0.03 *** | (0.01) |
| III: Fats & Oils | −0.13 | (0.09) | −0.04 | (0.03) |
| IV: Foodstuffs, Beverages and Tobacco | 0.03 | (0.04) | 0.01 | (0.01) |
| V: Mineral Products | 0.36 *** | (0.10) | 0.12 *** | (0.03) |
| VI: Chemicals & Allied Industries | −0.00 | (0.02) | −0.00 | (0.01) |
| VII: Plastics/Rubbers | −0.00 | (0.03) | −0.00 | (0.01) |
| VIII: Raw Hides, Skins, Leather, & Furs | 0.05 | (0.06) | 0.02 | (0.02) |
| IX: Wood & Articles of Wood | −0.10 | (0.06) | −0.03 *** | (0.01) |
| XI: Textiles | −0.19 *** | (0.02) | −0.06 *** | (0.01) |
| XII: Footwear/Headgear | −0.07 | (0.06) | −0.02 | (0.02) |
| XIII: Stone/Glass | −0.06 | (0.04) | −0.02 | (0.01) |
| XIV: Pearls and Precious stones | 0.56 *** | (0.12) | 0.19 *** | (0.04) |
| XV: Metals | 0.21 *** | (0.03) | 0.07 *** | (0.01) |
| XVI: Machineries | 0.01 | (0.02) | 0.00 | (0.01) |
| XVII:Transport | 0.15 *** | (0.04) | 0.05 *** | (0.01) |
| XVIII: Instruments | −0.06 * | (0.04) | −0.02 * | (0.01) |
| XX: Misc. Manufactured Articles | −0.05 | (0.04) | −0.02 | (0.01) |
| −0.12 *** | (0.03) | −0.04 *** | (0.01) | |
| Constant | −0.94 *** | (0.01) | ||
| Fixed effect | Year Country Sector | |||
| N | 3,169,728 | |||
| pseudo R2 | 0.139 | |||
Notes: Dependent variable: Dummy variable (Yjkt) is defined as equal to “1” if good k is exported by country j to the EU in period1 and not exported in period0, and “0” otherwise. All other variables of Equation (5) are absorbed by fixed effects; In parentheses: robust standard errors; *** significant at 1% level; * significant at 10% level.
Publisher’s Note: MDPI stays neutral with regard to jurisdictional claims in published maps and institutional affiliations. |
© 2022 by the author. Licensee MDPI, Basel, Switzerland. This article is an open access article distributed under the terms and conditions of the Creative Commons Attribution (CC BY) license (https://creativecommons.org/licenses/by/4.0/).
Share and Cite
MDPI and ACS Style
Cipollina, M. The Trade Growth under the EU–SADC Economic Partnership Agreement: An Empirical Assessment. Economies 2022, 10, 302. https://0-doi-org.brum.beds.ac.uk/10.3390/economies10120302
AMA Style
Cipollina M. The Trade Growth under the EU–SADC Economic Partnership Agreement: An Empirical Assessment. Economies. 2022; 10(12):302. https://0-doi-org.brum.beds.ac.uk/10.3390/economies10120302
Chicago/Turabian StyleCipollina, Maria. 2022. "The Trade Growth under the EU–SADC Economic Partnership Agreement: An Empirical Assessment" Economies 10, no. 12: 302. https://0-doi-org.brum.beds.ac.uk/10.3390/economies10120302
Note that from the first issue of 2016, this journal uses article numbers instead of page numbers. See further details here.