
Socioeconomic Relations of Food Waste in Selected European Countries


Trade and Social Studies, Institute of Marketing, Slovak University of Agriculture, 949 01 Nitra, Slovakia
*
Authors to whom correspondence should be addressed.
Economies 2022, 10(6), 144; https://0-doi-org.brum.beds.ac.uk/10.3390/economies10060144
Submission received: 18 May 2022
/
Revised: 9 June 2022
/
Accepted: 10 June 2022
/
Published: 14 June 2022
(This article belongs to the Topic Sustainable Development and Food Insecurity)
Abstract
:The present paper deals with the issue of food waste in selected European countries, in which we have tried to analyze the socioeconomic rations. The main aim of our research was to analyze food waste quantity and compare the amount of wasted food in European Union countries (except Cyprus due to the unavailability of food waste data). The analysis was based on a dataset provided through the Food Waste Index Report 2021 by the UN environment program and complemented by socioeconomic variables obtained from EUROSTAT. For a deeper analyses of the obtained results, we formulated three assumptions, which have been tested with the use of several statistical methods—Pearson’s correlation coefficient, linear regression, the distance from a fictitious object method, and hierarchical clustering. Our results show that the amount of food wasted in different sectors (retail, food, households) is not correlated, and any of the analyzed socioeconomic variables do not influence the ranking of countries by the crucial variable.
1. Introduction
Food loss and waste can be considered as the amount of food intended for human consumption that does not fulfil its purpose. Under the term food loss, we refer to spills, spoils, an abnormal reduction in quality such as bruising or wilting, or food otherwise getting lost before it reaches the consumer. On the other hand, food waste corresponds to non-consumed food of good quality, which is suitable for consumers. While food loss is unintended, food waste results from conscious decision (Lipinski et al. 2016). Approximately 1.3 billion tons of food is lost or wasted, roughly corresponding to about one-third of food produced for human consumption (Gustavsson et al. 2011).
Waste of food can be considered as an interdisciplinary problem, including economic, environmental, and ethical issues. Loss of caloric intake is only one side of the problem supplemented with the destruction of finite resources (Payne 2014). From an ethical point of view, the existence of food waste is problematic in itself as there are resources to waste nutrition sources, and on the other hand, there are millions of people who are starving or malnourished, while one-quarter of wasted food could feed them (OLIO 2020). FAO (2014) estimated the total cost of food waste in 2012 as 2625 billion USD, environmental costs (emissions, water pollution, and waste, soil erosion, deforestation, and biodiversity impact) as 696 billion USD, social costs represent 882 billion USD, the economic value of wasted and lost food is estimated at 936 billion USD, and subsidies in OECD countries regarding food waste and loss are 119 billion USD. About 24% of the fresh water used in crop production, 23% of cropland area and fertilizers, and 368 mils. metric tons are wasted every year due to food losses (Joardder and Masud 2019).
Food waste is a comprehensive and multifaceted problem, interconnected across all stages of the food supply chain, from primary production to final consumption (Canali et al. 2017). Causes are different on each value chain level. Furthermore, there is evidence of product group specifics. On the other hand, later stages of the food supply chain can influence earlier ones—for instance, standards requested by retail can be considered as an essential factor of food waste on the farmers’ level (Göbel et al. 2015).
Lack of purchase planning, storage, and preparation of food in connection with consumerism and abundance culture and the wide availability of food can be considered as the most critical drivers in the case of individual consumers (Aschemann-Witzel et al. 2015). Factors causing food waste in the processing part of the food supply chain are primarily losses resulting from processing operations and quality assurance, and non-compliance with trade quality demands (Raak et al. 2017). Researchers have identified the following causes of food waste—cold chain breaking, excess production, inadequate demand forecasting, inadequate packaging, inappropriate work procedures, incorrect handling, lack of coordination, lack of information sharing, lack of integrated systems, lack of knowledge, lack of operational control, lack of refrigerated transport, lack of training, poor inventory control, problems with display, problems with storage, problems with transport equipment, short shelf life, standards of appearance and shape, sudden changes in orders, and very restrictive laws (de Moraes et al. 2020). A relatively massive proportion of wasted food comes from hospitality and food services (16–28% of the amount representing 23% of the purchased value), while the preparation waste can be considered as the most significant fraction followed by leftovers and waste by customers (Papargyropoulou et al. 2019). Some studies also point out the tendency to waste in school canteens, while the amount of diner leftovers is mainly affected by the quality of meals, serving size, and availability of snacks for children during mid-morning breaks (Boschini et al. 2020). It is unforgettable that socio-demographic characteristics of the consumer and his consumer behaviour play a key role in food waste drivers (Fanelli 2019), while factors as motives, financial attitudes, planning routines, food surplus, social relationships also influence the tendency to wase food (Aktas et al. 2018).
Reducing food waste is considered as an essential factor in ensuring food security at a global level, as it will allow the use of limited resources for other purposes, reduce environmental risks, and avoid financial losses (Priefer et al. 2013). Changes in behaviour towards the minimization of food waste can be achieved due to price consciousness, environmental concern, and time management (Pellegrini et al. 2019), while embedding community perspectives into policy instruments can bring value in preventing food waste (Benyam et al. 2018). It is necessary to connect stakeholders to food waste optimization, mainly to utilize PPP at the global level and improve communication and bring more efficient packaging connected with a better interpretation of food labels by consumers (Halloran et al. 2014). “Food waste is an exemplar of the challenge we face; if we both see it as a resource opportunity rather than a waste threat and apply our creative science and technological energies to its valorization, we show the way to other waste-to-resource opportunities. European Union countries are committed to reducing food waste by 50% (amount of wasted food per capita) by 2030 (European Commission n.d.). The European Union also established a Farm-to-Fork strategy to secure enough affordable and nutritious food, promote more sustainable consumption and healthy eating, halve the use of pesticides and fertilizers, increase the organic farming ratio, combat food fraud in the supply chain, improve animal welfare, and reduce food losses and food waste (Horská et al. 2021).
Evaluating the current state and tracking progress on reducing food waste and losses is necessary to understand the availability of relevant data sources, which is struggling in data inconsistency and poor temporal, geographical, and supply chain coverage (Xue et al. 2017). Current methods of food waste and losses quantification include either direct measurements (physical waste surveys) or measurements based on self-reports (diaries, interviews, and questionnaires) (Elimelech et al. 2018). Hartikainen et al. (2020) consider questionnaires as an appropriate way to collect data about food waste from production and manufacturing stages (except animal production, where they suggest usage of statistics) as well as in thecase of households, while retail stakeholders and caterers should provide data collected from their operations (such as food waste diaries). Corrado et al. (2019) suggest harmonizing food waste account guidelines, increasing the quantity and representativeness of data, and developing methods for liquid waste accounting. On the other hand, Elimelech et al. (2019) point out that relying on people’s estimations could be uncertain, and it is necessary to use objective measurements such as physical waste surveys.
Calculation of food waste data varies across different countries due to different collection methodologies and different definitions of food waste (Bagherzadeh et al. 2014), which causes the problematic comparability of data from local sources. International organizations provide the following databases dedicated to food waste and losses:
- -
- Food Loss and Waste Database (FAO)
- -
- Food Waste Dataset (OECD)
- -
- Global Food Loss and Waste (World Bank)
- -
- Food Waste Index Report Database (UNEP)
Food Waste Index Report Dataset (UNEP 2021) can be considered as the most comprehensive food waste data collection that combines different local data sources. According to the report, only seven countries have high confidence in food waste estimates from sources stated below. ARCADIS (2019) published the “National Food Waste Baseline report”, which provides detailed data about food waste in Australia. EPA (2020) published the “2018 wasted food report”, which provides an analysis of food waste in the United States of America in 2018 using a new methodology developed by the US Environmental Protection Agency. The Danish environmental protection agency (2014) published results of a survey mapping food waste in retail, restaurants, and commercial kitchens, and the Swedish environmental protection agency (2012, 2020) published comprehensive reports about food waste based on analysis from years 2010 and 2018 (Westöö et al. 2018). WRAP (2020) published a report about food waste in the United Kingdom based on research conducted in 2019. Environment Agency Austria (2017) presented food waste statistics for Austria. Schmidt et al. (2015) published a comprehensive summary report on food waste in Germany for 2015.
2. Methodology
The paper’s main objective is to analyze food waste quantity and compare the amount of wasted food in European Union countries (except Cyprus due to the unavailability of food waste data). The analysis is based on a dataset provided through the Food Waste Index Report 2021 by the UN environment program and complemented by socioeconomic variables obtained from EUROSTAT (2021). Used variables are presented by Table 1.
In the analysis, we mainly used the methods of multivariate statistical analysis. We used Pearson correlation coefficients to describe linear relationship between the variables, to evaluate the development of the relationships between the individual indicators. Linear regression has been used to identify relevant socio-economic variables that relate to food waste by households. Relationships and order were analyzed using cluster analysis based on hierarchical clustering using ward linkage and Euclidian distance. Data analysis was processed using MiniTab and R Studio base packages.
Where statistical significance is evaluated using p-value without further explanation, we assume level of significance at α = 0.05.
In connection with the set goals, we set the following research assumptions:
- Assumption no. 1: Amounts of food wasted in the retail sector, food services, and households positively correlate.
- Assumption no. 2: Socioeconomic variables influence a country’s ranking based on the amount of wasted food per capita.
- Assumption no. 3: Socioeconomic variables of EU countries impact amounts of food wasted by households.
3. Results and Discussion
3.1. Amount of Wated Food
Waste, loss, or spoilage of food are efficiency issues that have attracted increasing attention from the media, researchers, politicians, companies, and the general public in last few years. Although the food waste seems to be a “simple problem”, which can be easily solved by “stopping throwing it away”, it is much more complex (Eriksson et al. 2018). The complexity of the food loss and waste issue links to the three pillars of sustainable development, when on one hand the reduction of food loss and waste could help to recover the economic losses and reduce financial burdens on the world’s most vulnerable people; on the other hand (from the environmental perspective), food loss and waste are an extremely inefficient use of resources; and last but not least (from a food security perspective), reduction of food loss and waste is a major opportunity to close the calorie gap between where the world is now and where it needs to be to sustainably feed the planet (Lipinski 2015). The mentioned does not mean that the reduced food waste automatically results in sustainable development, e.g., if the waste reducing measures are more recourse demanding then the savings they achieve (Eriksson et al. 2016), but reducing unnecessary food waste has the potential to make an important contribution and has a high symbolic value (Eriksson et al. 2018). Despite the fact that the food waste is primarily a moral issue of throwing away the edible food items when people elsewhere are starving (Stuart 2009), it is also associated with the unnecessary use of natural resources (Nellemann et al. 2009) and loss of monetary value (WRAP 2008). Addressing the issue of food waste and identifying its main “spoilers” is therefore necessary and urgent.
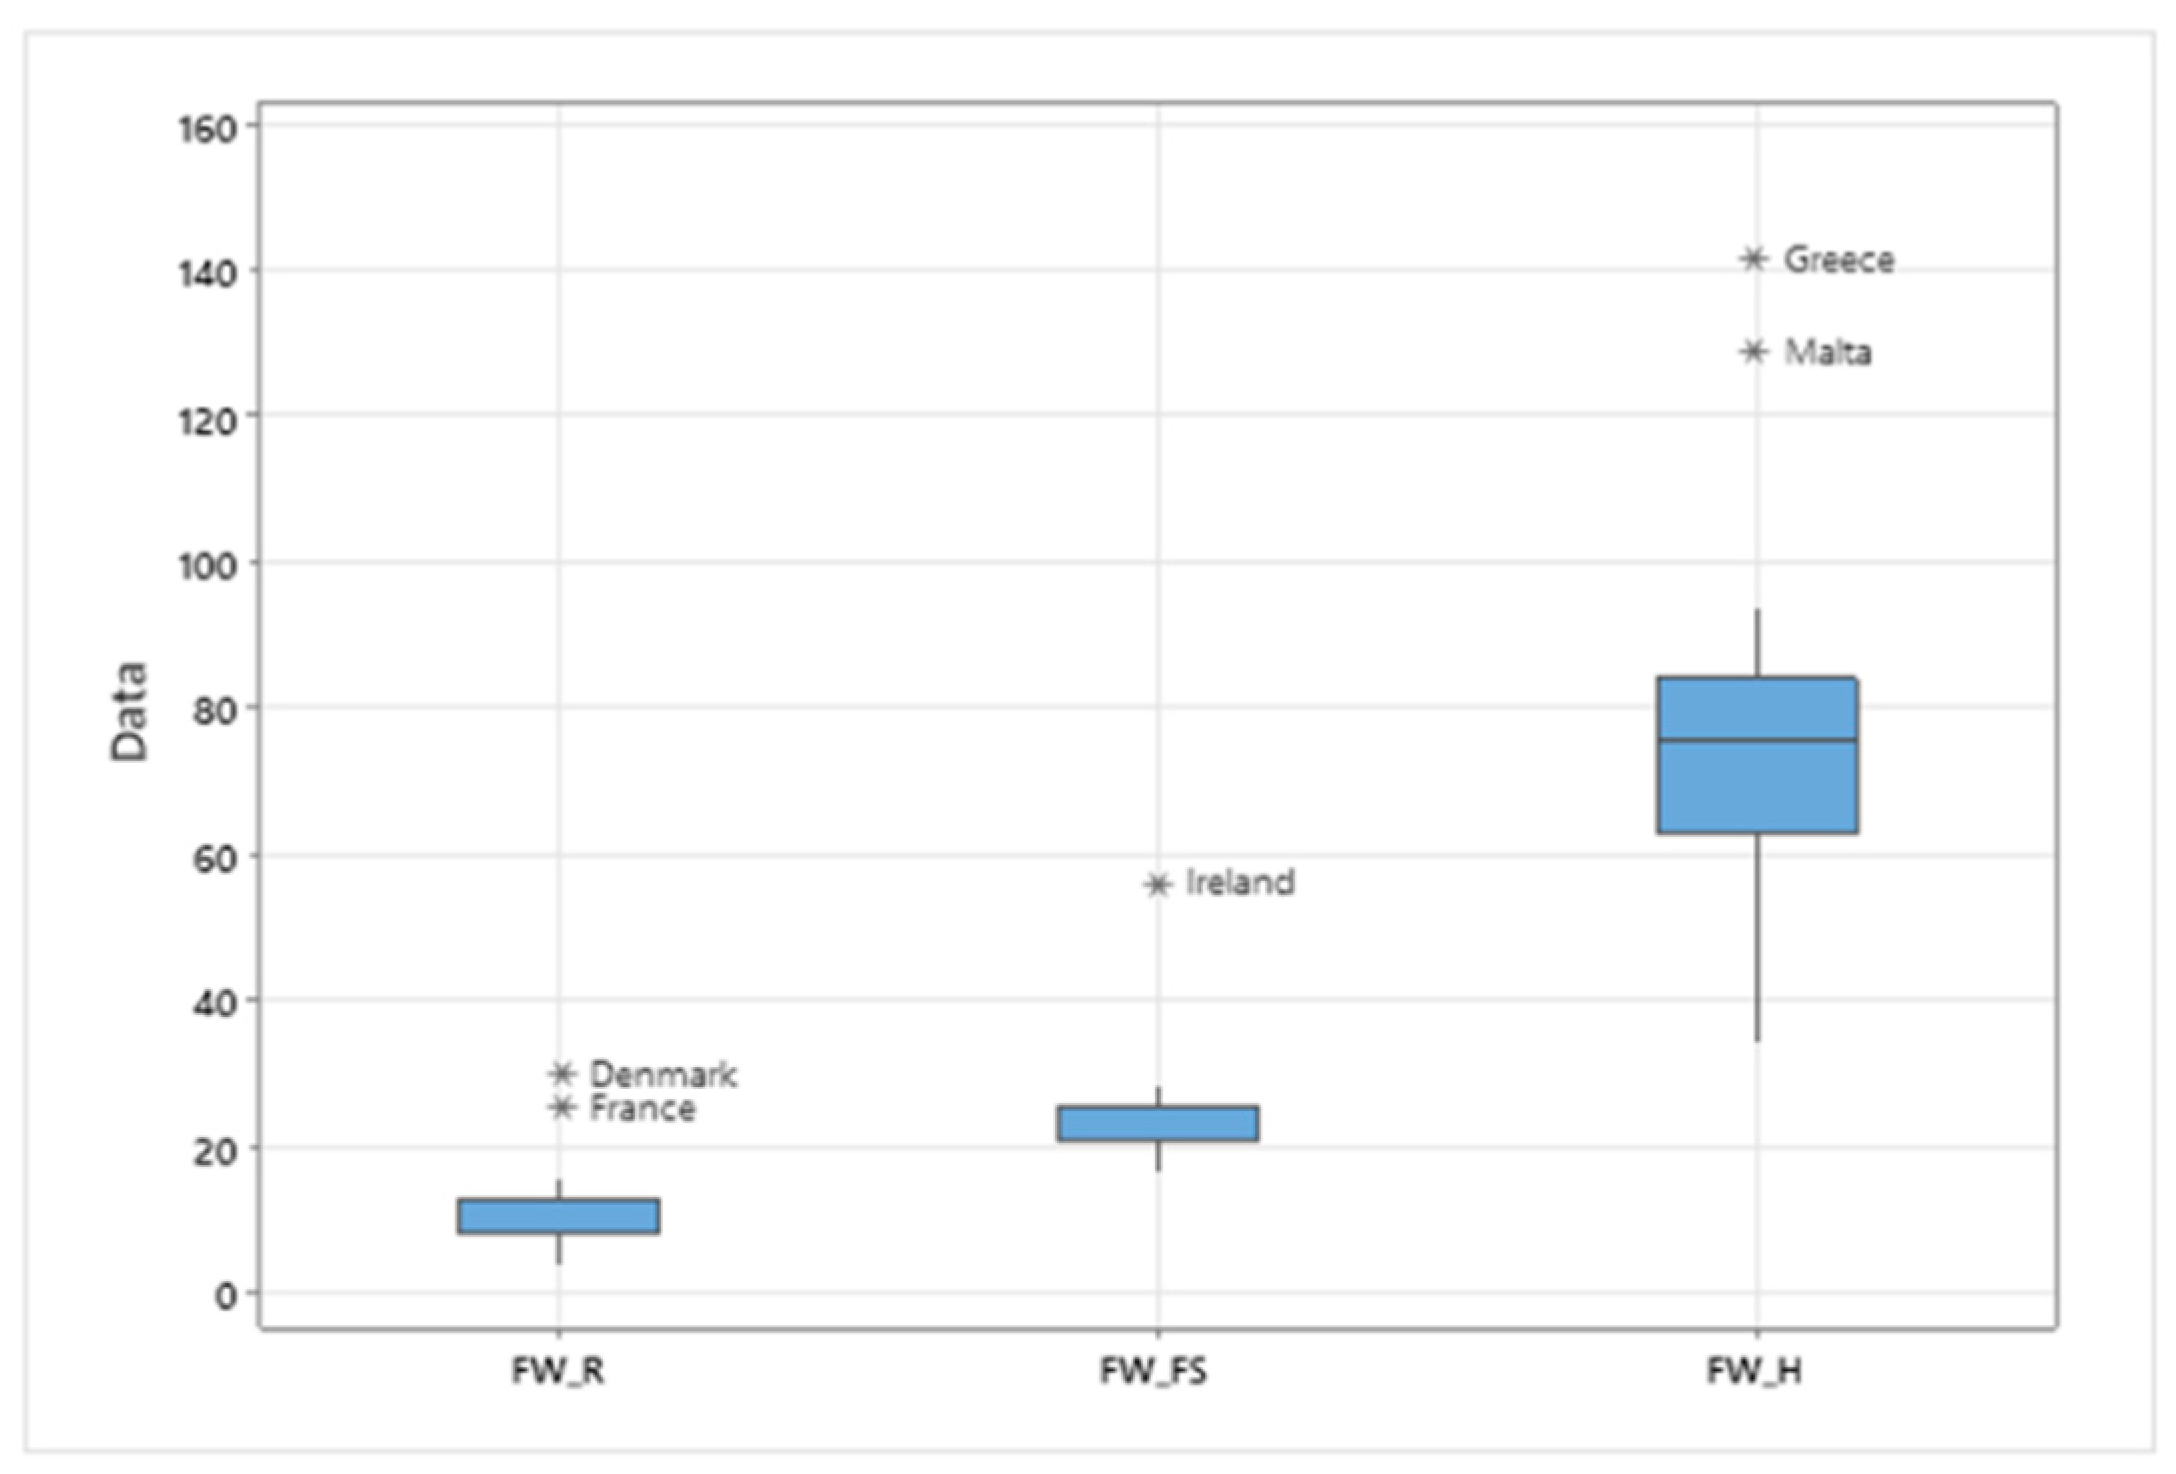
The United Nations environment program published the Food Waste Report 2021 complemented by a dataset that unites different country- and worldwide-level data on food waste per capita, separating it into three sources of waste—households, retail sector, and food services. As shown in Figure 1, the highest food waste per capita is, according to UNEP data, produced by households, followed by the food services and the retail sector.
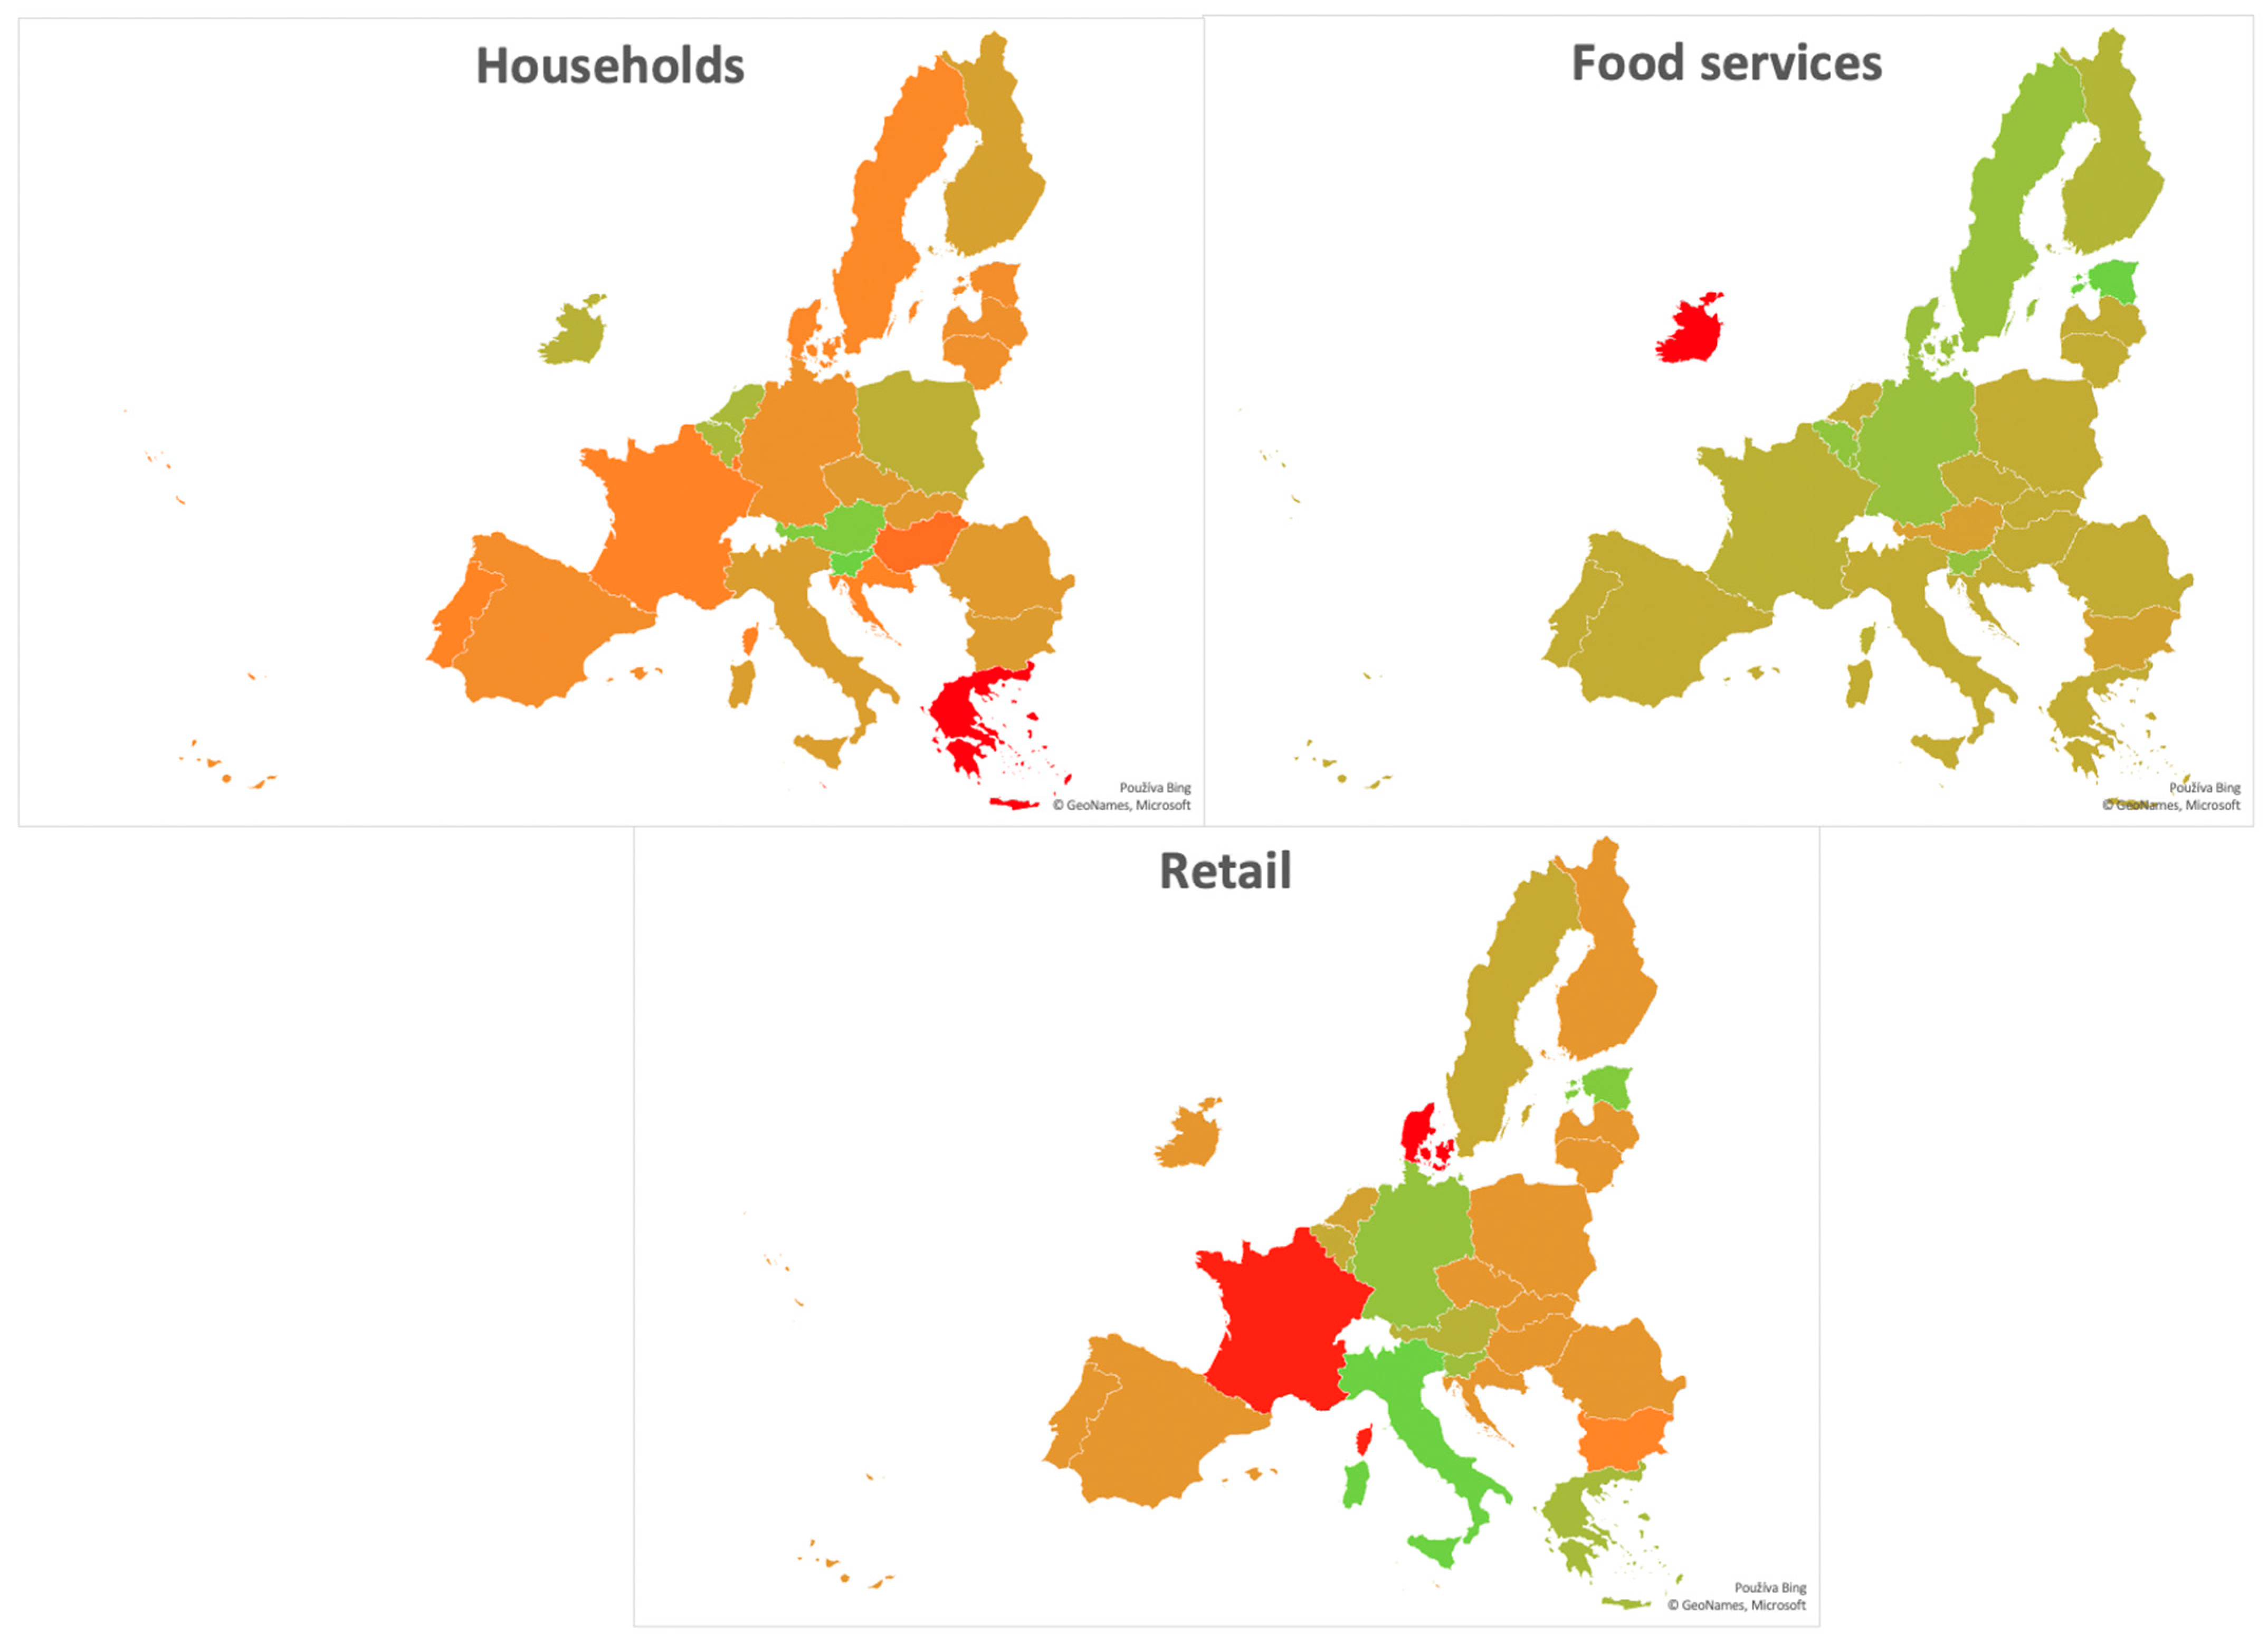
It is also evident that countries can be identified as outliers as they have a significantly higher amount of wasted food than other countries. A visual comparison of countries is presented in Figure 2. We assumed that amounts of food wasted in the retail sector, food services, and households should be correlated, but from visual analysis based on Figure 2 it seems that this is not the case. For a deeper analysis of the formulated assumption, we have tested correlations using Pearson’s correlation coefficient, which ruled out the existence of a statistically significant correlation (ρ = 0.1 for all pairs, non-significant at α = 0.05). Therefore, we can conclude that amounts of food wasted from three different sources are not dependent on each other.
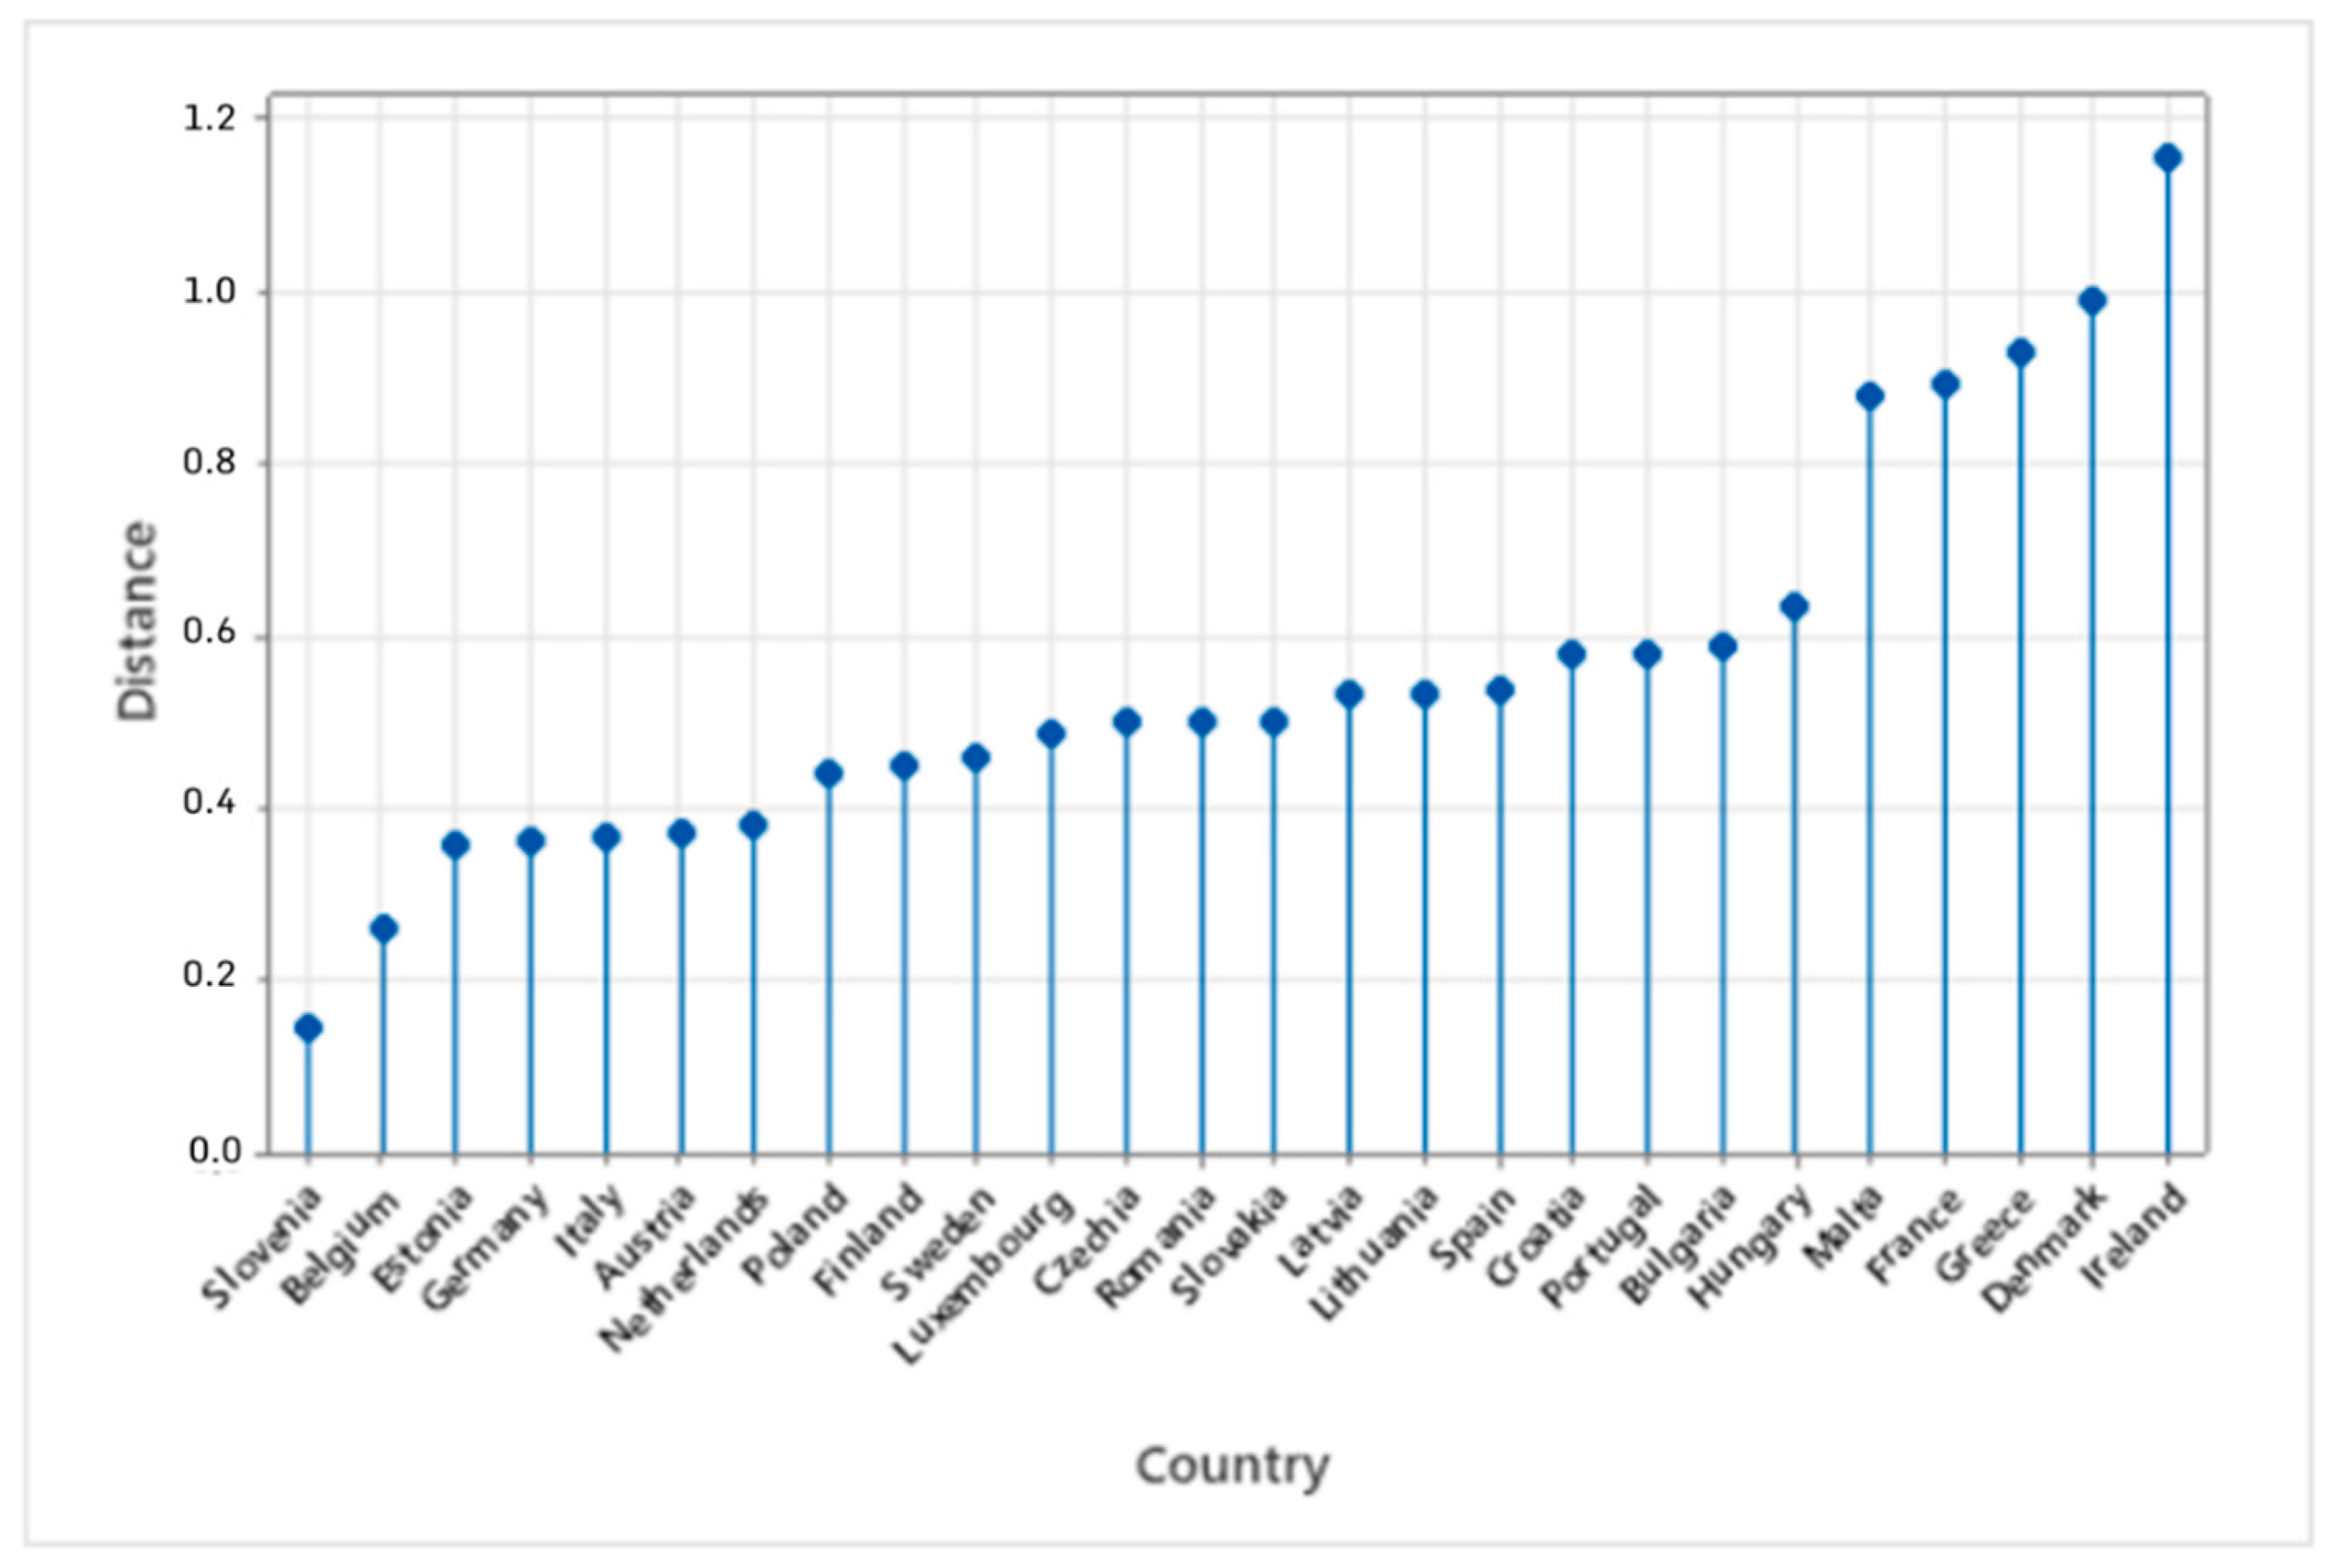
For a better comparison of countries, we have constructed integral variables using the multicriteria evaluation method (distance from the fictitious object), while the Pearson correlation matrix was used to calculate weights of individual variables. The ranking of countries is presented in Figure 3, where the lower distance represents a better position. We assumed that socioeconomic variables (GDP, Gini coefficient, Export, Urbanization, Unemployment) influence the country’s ranking, but there is no statistically significant correlation between them (ρ = <0.1, 0.2> for all variables, non-significant at α = 0.05). This could be caused by globalization of retail and food services sectors and therefore differences are not present.
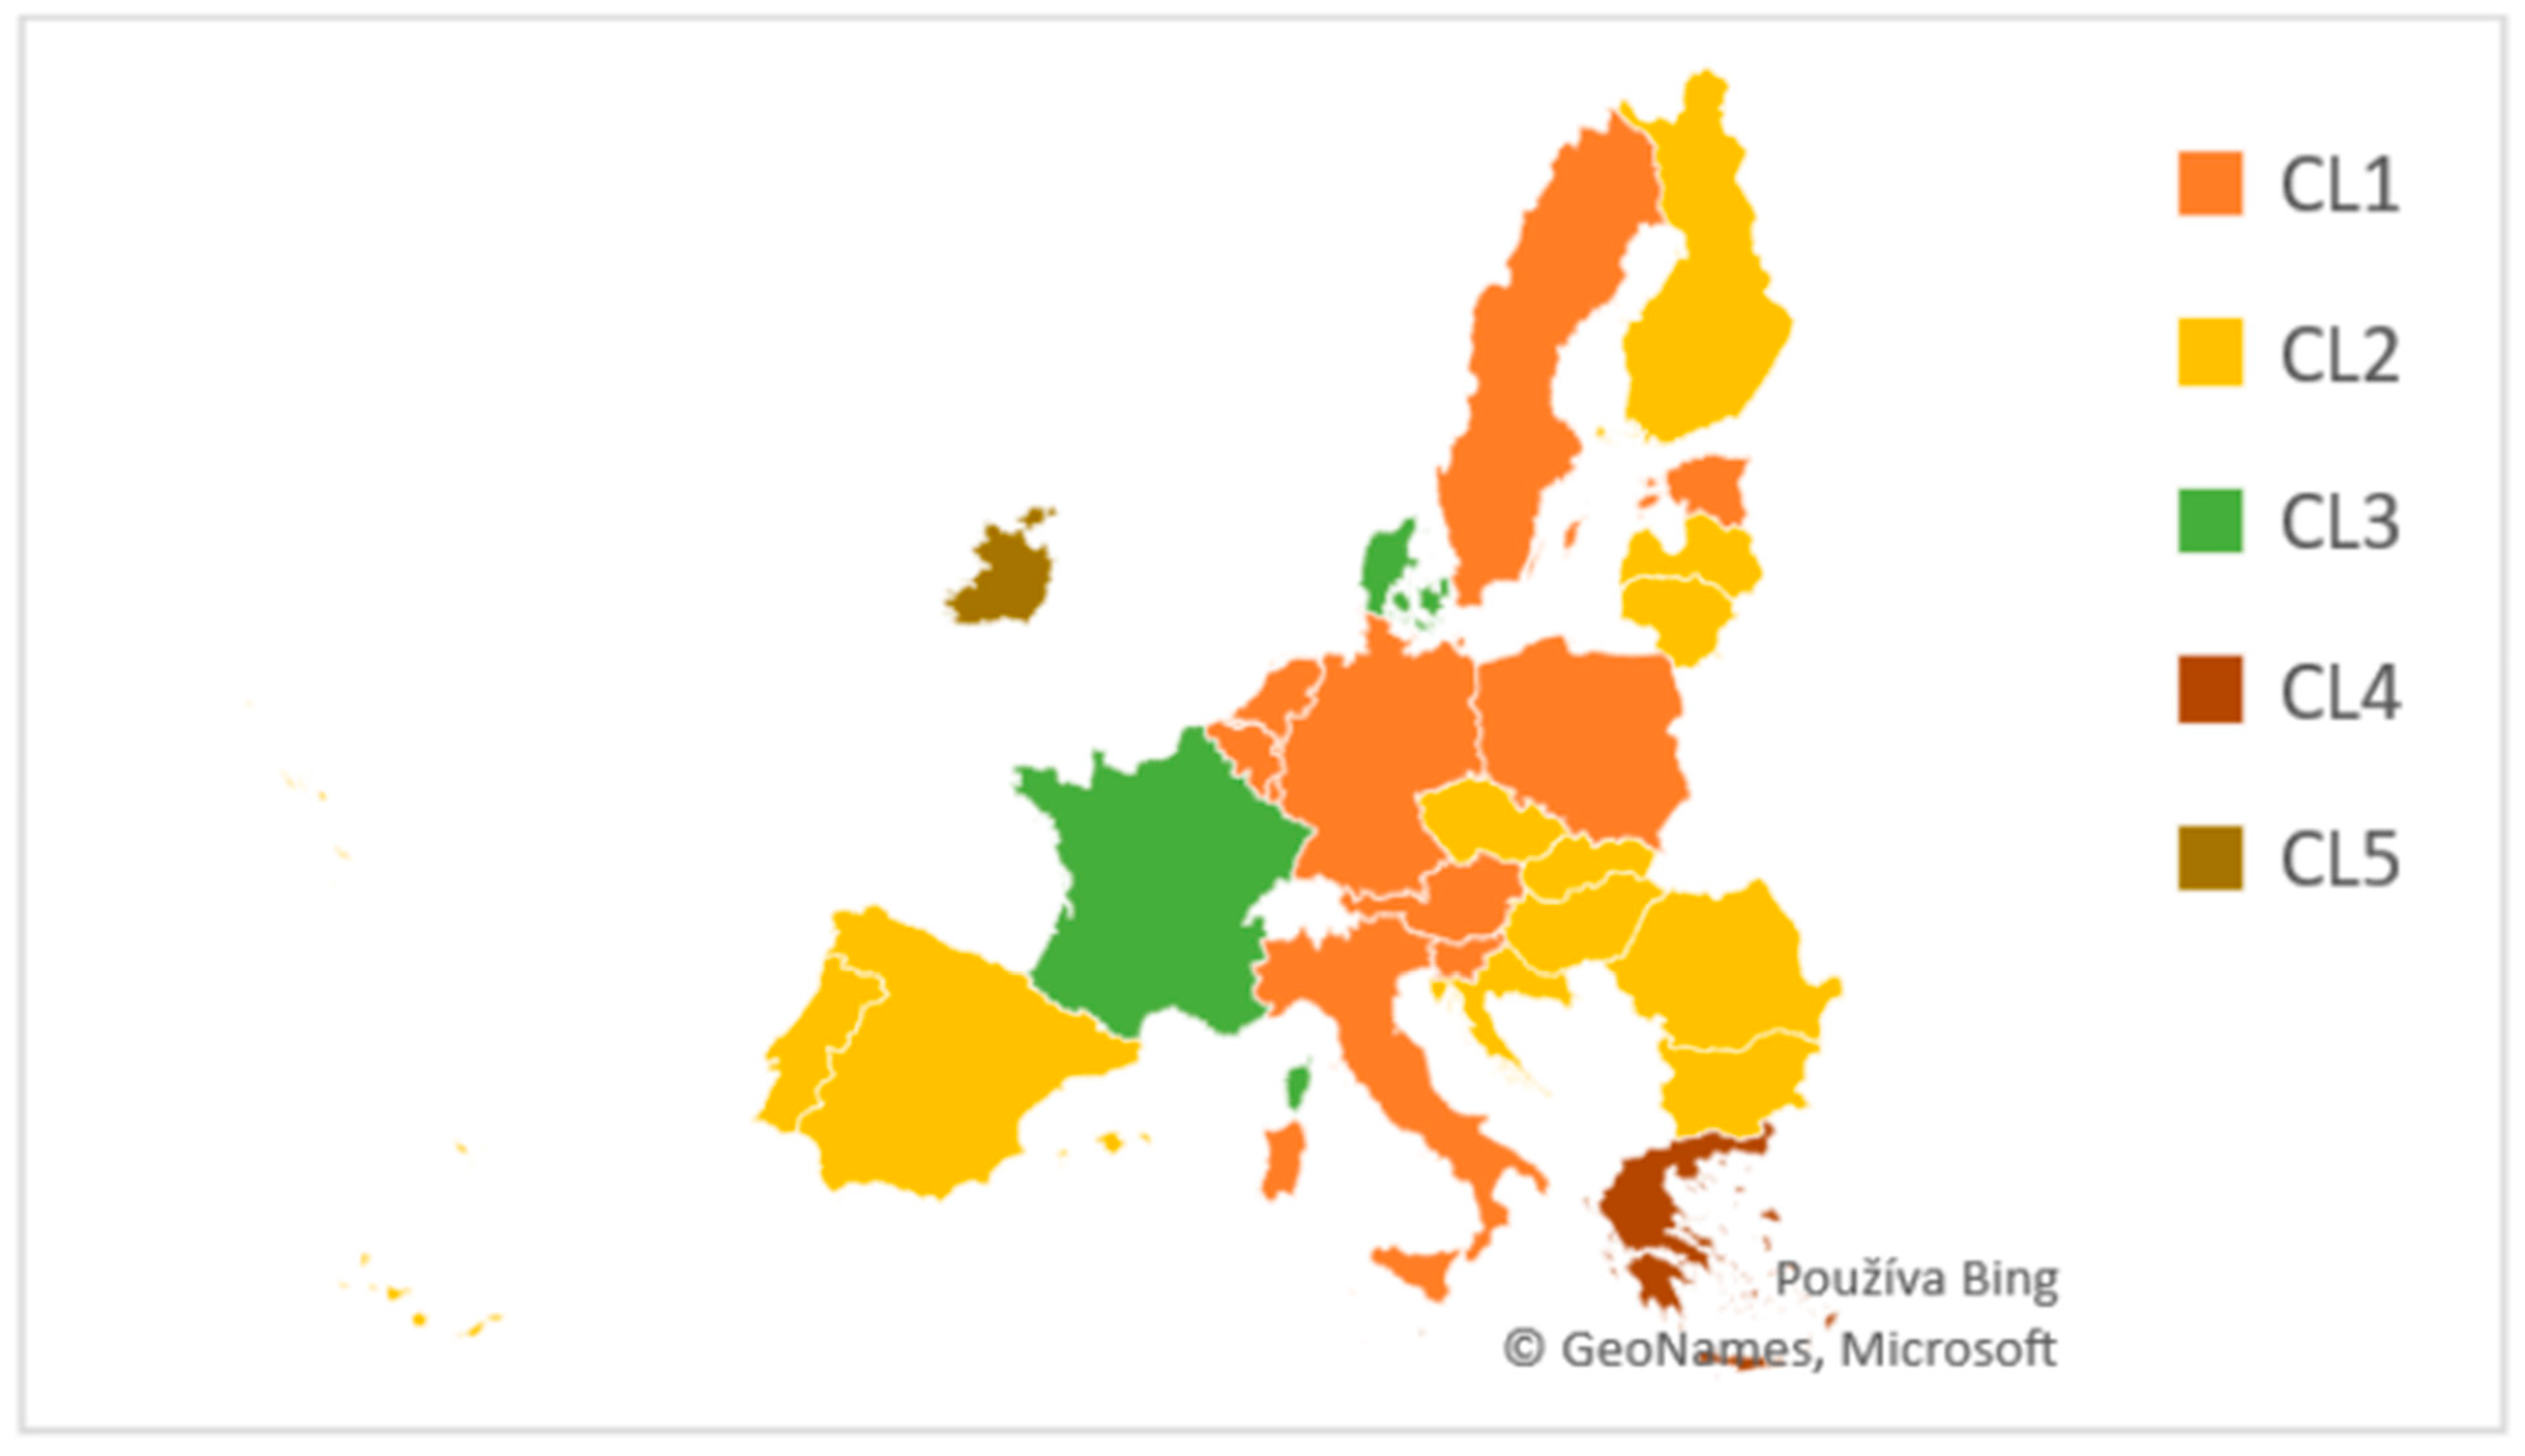
For a better understanding of the differences between countries, we have applied hierarchical cluster analysis using ward linkage and Euclidian distance while input variables were standardized. Five clusters resulted from analysis as optimal, while the division of countries according to clusters is presented in Figure 4.
From centroids of clusters calculated as non-standardized variables (Table 2), the following groups of countries can be described. Optimal countries (CL1) are countries that reach the minimum amount of food wasted in retail and food services, while food wasted by households is not very high compared to other clusters. Ambiguous countries (CL 2) have countries that reach not bad nor best values. Retail wasters (CL3) can be described as countries that reach a high amount of food wasted in the retail sector. Household wasters (CL4) are countries that reach an extremely high amount of food wasted by households, and finally, foodservice wasters (CL 5) are represented by countries that reach an extremely high amount of food wasted in food services.
3.2. Predictors of Food Waste Generated by Household
The second part of the analysis focuses on analyzing whether selected socio-demographic differences among countries impact the amount of food waste generated by households, following the fact that the situation of households is a presumed factor influencing possible differences in food waste also between developed countries. As can be seen from Table 3, food wasted by households (per capita) is significantly correlated with the unemployment rate and level of country urbanization.
Following the results shown above, we have constructed a linear model using mentioning two exogenous variables. The model explains 26.5% of food waste variability, is significant on α = 0.05, and can be described using Equation (1).
The amount of food wasted by households is influenced by levels of both country urbanization and unemployment, while the first predictor can be described by the fact that the countryside provides opportunities for food residuals in farming activities. On the other hand, the explanation of the effect of the unemployment rate is not straightforward. We can presume that employed people eat outside the household during the working week and therefore waste produced by them is counted to food services instead of households.
As a response to the urgent need to address food waste, a mass of evidence was created based on the quantities of food wasted and the related emissions along the food production–consumption chain (Edjabou et al. 2016). The results of many research studies and evidence show that the largest food-waste faction is represented by private households. Given the high amounts of food waste occurring on the household level, identification of the factors affecting the food waste, leading “people” to waste the food, as well as the prevention of food waste at the final stages of the supply chain, is of utmost importance (Parfitt et al. 2010).
4. Conclusions
This paper has studied the state of food waste and losses in selected European countries, emphasizing inter-community comparison and the impact of sociodemographic variables. The study was based on data divided into three categories, considered to be the main sources of wasted food—retail, food sector, and households. Our analysis shows that amount of food wasted in different sectors is not pairwise interconnected in terms of amounts. Moreover, there is no influence of sociodemographic characteristics, represented by selected variables, on the ranking of examined countries; this is based on the integral wasted amount of food, which we assume can be caused by the globalization of the retail and food services sectors. Therefore, differences are not present at the country level. On the other hand, we found that a higher unemployment rate and higher urbanization at the national level cause the increase. This is due to the continuous population growth, environmental impacts, and the fact that there are still people who suffer from malnutrition. We consider it appropriate to start monitoring the real state of food waste within the member states of the EU, which would contribute to a better understanding of the given issue following a more detailed analyses and ultimately facilitate the setting of public policies to reduce food waste.
Author Contributions
Conceptualization, F.T. and E.H.; methodology, F.T.; software, F.T.; validation, I.K., K.M.; formal analysis, K.M.; resources, E.H.; data curation, F.T.; writing—original draft preparation, I.K.; writing—review and editing, F.T.; visualization, K.M.; supervision, E.H.; project administration, E.H.; funding acquisition, E.H. and K.M. All authors have read and agreed to the published version of the manuscript.
Funding
This publication was supported by project VEGA Nr. 1/0245/21 Implementation of the New EU Food Strategy in the Food Chain in Slovakia.
Institutional Review Board Statement
Not applicable.
Informed Consent Statement
Not applicable.
Data Availability Statement
The data presented in this study are available on request from the corresponding author.
Acknowledgments
Publication of this article was supported by project VEGA Nr. 1/0245/21 Implementation of the New EU Food Strategy in the Food Chain in Slovakia financed by The Ministry of Education, Science, Research and Sport of the Slovak Republic.
Conflicts of Interest
The authors declare no conflict of interest.
References
- Aktas, Emel, Hafize Sahin, Zeynep Topaloglu, Akunna Oledinma, Abul Kalam Samsul Huda, Zahir Irani, Amir M. Sharif, Tamara van’t Wout, and Mehram Kamrava. 2018. A consumer behavioural approach to food waste. Journal of Enterprise Information Management 31: 658–73. [Google Scholar] [CrossRef] [Green Version]
- ARCADIS. 2019. National Food Waste Baseline (Issue March). Available online: https://www.environment.gov.au/system/files/pages/25e36a8c-3a9c-487c-a9cb-66ec15ba61d0/files/national-food-waste-baseline-final-assessment.pdf (accessed on 15 January 2022).
- Aschemann-Witzel, Jessica, Ilona de Hooge, Pegah Amani, Tino Bech-Larsen, and Marije Oostindjer. 2015. Consumer-related food waste: Causes and potential for action. Sustainability 7: 6457–77. [Google Scholar] [CrossRef] [Green Version]
- Bagherzadeh, Morvarid, Mitsuhiro Inamura, and Hyunchul Jeong. 2014. Food Waste along the Food Chain. OECD Food, Agriculture and Fisheries Papers, No. 71. Paris: OECD Publishing. [Google Scholar] [CrossRef]
- Benyam, Addisalem, Susan Kinnear, and John Rolfe. 2018. Integrating community perspectives into domestic food waste prevention and diversion policies. Resources, Conservation and Recycling 134: 174–83. [Google Scholar] [CrossRef]
- Boschini, Matteo, Luca Falasconi, Clara Cicatiello, and Silvio Franco. 2020. Why the waste? A large-scale study on the causes of food waste at school canteens. Journal of Cleaner Production 246: 118994. [Google Scholar] [CrossRef]
- Canali, Massimo, Pegah Amani, Lusine Aramyan, Manuela Gheoldus, Graham Moates, Karin Östergren, Kirsi Silvennoinen, Keith Waldron, and Matteo Vittuari. 2017. Food waste drivers in Europe, from identification to possible interventions. Sustainability 9: 37. [Google Scholar] [CrossRef] [Green Version]
- Corrado, Sara, Carla Caldeira, Mattias Eriksson, Ole Jorgen Hanssen, Hans.-Eduard Hauser, Freija van Holsteijn, Gang Liu, Karin Östergren, Andrew Parry, Luca Secondi, and et al. 2019. Food waste accounting methodologies: Challenges, opportunities, and further advancements. Global Food Security 20: 93–100. [Google Scholar] [CrossRef]
- de Moraes, Camila Colombo, Flávio Henrique de Oliveira Costa, Carla Roberta Pereira, Andrea Lago da Silva, and Ivete Delai. 2020. Retail food waste: Mapping causes and reduction practices. Journal of Cleaner Production 256: 120124. [Google Scholar] [CrossRef]
- Edjabou, Maklawe Essonanawe Ejabour, Claus Petersen, Charlotte Scheutz, and Thomas Fruergaard Astrup. 2016. Food waste from Danish households: Generation and composition. Waste Management 52: 256–68. [Google Scholar] [CrossRef] [PubMed] [Green Version]
- Elimelech, Efrat, Eyal Ert, and Ofira Ayalon. 2019. Bridging the gap between self-assessments and measured household food waste: A hybrid valuation approach. Waste Management 95: 259–70. [Google Scholar] [CrossRef]
- Elimelech, Efrat, Ofira Ayalon, and Eyal Ert. 2018. What gets measured gets managed: A new method of measuring household food waste. Waste Management 76: 68–81. [Google Scholar] [CrossRef]
- Environment Agency Austria. 2017. Food Waste Statistics Austria. Available online: https://ec.europa.eu/food/sites/food/files/safety/docs/fw_eu-platform_20170925_sub-fwm_pres-02b.pdf (accessed on 15 January 2022).
- EPA. 2020. 2018 Wasted Food Report (Issue November). Available online: https://www.epa.gov/sites/production/files/2020-11/documents/2018_wasted_food_report.pdf (accessed on 18 January 2022).
- Eriksson, Mattias, Samuel Lindgren, and Christine Persson Osowski. 2018. Mapping of food waste quantification methodologies in the food services of Swedish municipalities. Resources, Conservation and Recycling 137: 191–99. [Google Scholar] [CrossRef]
- Eriksson, Mattias, Ingrid Strid, and Per-Anders Hansson. 2016. Food waste reduction in supermarkets—Net costs and benefits of reduced storage temperature. Resources, Conservation and Recycling 107: 73–81. [Google Scholar] [CrossRef]
- European Commission. n.d. EU Actions against Food Waste. Available online: https://ec.europa.eu/food/safety/food_waste/eu_actions_en (accessed on 19 January 2022).
- EUROSTAT. 2021. Statistical Office of the European Communities. Available online: https://ec.europa.eu/eurostat/data/database (accessed on 18 December 2021).
- Fanelli, Rosa Maria. 2019. Using causal maps to analyse the major root causes of household food waste: Results of a survey among people from central and southern Italy. Sustainability 11: 1183. [Google Scholar] [CrossRef] [Green Version]
- FAO. 2014. Food Wastage Footprint: Fool Cost-Accounting. Food and Agriculture Organization of the United Nations (FAO). Available online: https://www.google.com/url?sa=t&rct=j&q=&esrc=s&source=web&cd=2&cad=rja&uact=8&ved=0ahUKEwjYgbWn0pDKAhWHCI4KHUlyCEUQFggoMAE&url=http://www.fao.org/3/a-i3991e.pdf&usg=AFQjCNH7yX7VQI_OF8sfkIIR3yUbjJG06w&sig2=uKA9X-6f2YpJF4i-ZgmBcw&bvm=bv.110151844,d.c2E (accessed on 19 January 2022).
- Göbel, Christine, Nina Langen, Antonia Blumenthal, Petra Teitscheid, and Guido Ritter. 2015. Cutting food waste through cooperation along the food supply chain. Sustainability 7: 1429–45. [Google Scholar] [CrossRef] [Green Version]
- Gustavsson, Jenny, Christel Cederberg, and Ulf Sonesson. 2011. Global Food Losses and Food Waste. Rome: FAO. [Google Scholar]
- Halloran, Afron, Jesper Clement, Niels Kornum, Camelia Bucatariu, and Jakob Magid. 2014. Addressing food waste reduction in Denmark. Food Policy 49: 294–301. [Google Scholar] [CrossRef]
- Hartikainen, Hanna, Inkeri Riipi, Juha-Matti Katajajuuri, and Kirsi Silvennoinen. 2020. From Measurement to Management: Food Waste in the Finnish Food Chain. In Food Waste Management. Cham: Springer International Publishing, pp. 415–39. [Google Scholar] [CrossRef] [Green Version]
- Horská, Elena, Kristína Mušinská, and Filip Tkáč. 2021. Theoretical foreword into the new Farm-to-Table strategy. Food, Sustainability, Nutrition and Tourism, 261–65. [Google Scholar]
- Joardder, Mohammad U. H., and Mahadi Hasan Masud. 2019. Food Preservation in Developing Countries: Challenges and Solutions. Berlin: Springer, pp. 1–245. [Google Scholar] [CrossRef]
- Lipinski, Brian, Craig Hanson, James Lomax, Lisa Kitinoja, Richard Waite, and Tim Searchinger. 2016. Toward a Sustainable Food System Reducing Food Loss and Waste; World Resource Institute, pp. 1–40. Available online: http://unep.org/wed/docs/WRI-UNEP-Reducing-Food-Loss-and-Waste.pdf%5Cnhttp://ebrary.ifpri.org/cdm/ref/collection/p15738coll2/id/130211 (accessed on 10 December 2020).
- Lipinski, Brian. 2015. What’s Food Loss and Waste Got to Do with Sustainable Development? A Lot, Actually. Washington, DC: World Reasource Institute, Available online: https://www.wri.org/insights/whats-food-loss-and-waste-got-do-sustainable-development-lot-actually (accessed on 6 May 2022).
- Nellemann, Christian, Monika MacDevette, Ton Manders, Bas Eickhout, Birger Svihus, Anne Gerdien Prins, and Bjørn P. Kaltenborn. 2009. The Environmental Food Crisis: The Environment’s Role in Averting Future Food Crises. A UNEP rapid response assessment. Arendal: United Nations Environment Programme/GRID-Arendal, Available online: https://gridarendal-website-live.s3.amazonaws.com/production/documents/:s_document/221/original/FoodCrisis_lores.pdf?1486728701 (accessed on 6 May 2022).
- OLIO. 2020. The Problem of Food Waste. Available online: https://olioex.com/food-waste/the-problem-of-food-waste (accessed on 22 January 2022).
- Papargyropoulou, Effie, Julia K. Steinberger, Nigel Wright, Rodrigo Lozano, Rory Padfield, and Zaini Ujang. 2019. Patterns and causes of food waste in the hospitality and food service sector: Food waste prevention insights from Malaysia. Sustainability 11: 6016. [Google Scholar] [CrossRef] [Green Version]
- Parfitt, Julian, Mark Barthel, and Sarah Macnaughton. 2010. Food waste within food supply chains: Quantification and potential for change to 2050. Philosophicla Transactions of the Royal Society B. Biological Sciences 365: 3065–81. [Google Scholar] [CrossRef] [Green Version]
- Payne, Kyra. 2014. The Consequences of Food Waste. Student Voices 6: 1–3. Available online: http://www.inquiriesjournal.com/articles/890/the-consequences-of-food-waste (accessed on 22 January 2022).
- Pellegrini, Giustina, Sandro Sillani, Mario Gregori, and Alessia Spada. 2019. Household food waste reduction: Italian consumers’ analysis for improving food management. British Food Journal 121: 1382–97. [Google Scholar] [CrossRef]
- Priefer, Carmen, Juliane Jorissen, and Klaus-Rainer Brautigam. 2013. Možnosti Snížení Plýtvání Potravinami. Brusel: EU. [Google Scholar]
- Raak, Norbert, Claudia Symmank, Susann Zahn, Jessica Aschemann-Witzel, and Harald Rohm. 2017. Processing- and product-related causes for food waste and implications for the food supply chain. Waste Management 61: 461–72. [Google Scholar] [CrossRef]
- Schmidt, Thomas, Felicitas Schneider, Dominik Leverenz, and Gerold Hafner. 2015. Food Waste in Germany—Baseline 2015—Summary Thünen Report 71. Braunschweig: Johann Heinrich von Thünen-Institut. [Google Scholar]
- Stuart, Tristram. 2009. Waste: Uncovering the Global Food Scandal. London: Penguin Books, 480p. [Google Scholar]
- UNEP Food Waste Index Report. 2021. Available online: https://www.unep.org/resources/report/unep-food-waste-index-report-2021 (accessed on 18 January 2022).
- Westöö, Anna-Karin, Carl Jensen, Lars Viklund, Louise Sörme, and Åsa Stenmarck. 2018. Matavfall i Sverige—Uppkomst och Behandling 2016. p. 24. Available online: http://naturvardsverket.diva-portal.org/smash/get/diva2:1503590/FULLTEXT01.pdf (accessed on 15 January 2022).
- WRAP. 2008. The Food We Waste. Branbury: WRAP, Available online: https://wrap.s3.amazonaws.com/the-food-we-waste-executive-summary.pdf (accessed on 6 May 2022).
- WRAP. 2020. UK Progress against Courtauld 2025 Targets and UN Sustainable Development Goal 12.3. UK Progress against Courtauld 2025. Targets and Sustainable Development Goal 12.3. January 2020, pp. 1–54. Available online: https://wrap.org.uk/sites/files/wrap/Progress_against_Courtauld_2025_targets_and_UN_SDG_123.pdf (accessed on 10 December 2020).
- Xue, Li, Gang Liu, Julian Parfitt, Xiaojie Liu, Erica Van Herpen, Åsa Stenmarck, Clementine O’Connor, Karin Östergren, and Shengkui Cheng. 2017. Missing Food, Missing Data? A Critical Review of Global Food Losses and Food Waste Data. Environmental Science & Technology 51: 6618–33. [Google Scholar] [CrossRef]
Figure 1.
Box-plot charts for food waste variables.

Figure 2.
Relative comparison of wasted food amount (per person) in EU countries per capita according to source sector; red colour represents higher amount.
Figure 2.
Relative comparison of wasted food amount (per person) in EU countries per capita according to source sector; red colour represents higher amount.

Figure 3.
Ranking of food wasted in countries based on the integral variable combining all three sectors.
Figure 3.
Ranking of food wasted in countries based on the integral variable combining all three sectors.

Figure 4.
Affiliation of countries to clusters.


Table 1.
Variables used in analysis.
| Label | Type | Description | Year(s) |
|---|---|---|---|
| FW_R | Numeric | Food wasted in retail sector per person | 2015–2020 |
| FW_FS | Numeric | Food wasted in food services sector per person | 2010–2020 |
| FW_H | Numeric | Food wasted by household per person | 2014–2020 |
| GDP | Numeric | Gross domestic product per person in PPP (current $) | 2019 |
| Poverty | Numeric | % of people living below the poverty threshold (EU-SILC) | 2019 |
| Urban | Numeric | % of people living in towns (EU-SILC) | 2019 |
| HSize | Numeric | Average household size in a country | 2019 |
| Unempl | Numeric | Unemployment | 2019 |
Table 2.
Centroids of clusters.
| Cluster | FW_R | FW_FS | FW_H |
|---|---|---|---|
| 1 | 8.035 | 22.35 | 61.89 |
| 2 | 13.068 | 25.553 | 75.95 |
| 3 | 27.7 | 22.56 | 83.06 |
| 4 | 10.1 | 25.57 | 135.35 |
| 5 | 12.811 | 56.146 | 54.7 |
Table 3.
Correlations between the amount of food wasted by households and selected socioeconomic variables.
Table 3.
Correlations between the amount of food wasted by households and selected socioeconomic variables.
| Variable 1 | Variable 2 | N | Correlation | p-Value |
|---|---|---|---|---|
| Unempl | FW_H | 26 | 0.419 | 0.033 |
| HSize | FW_H | 26 | 0.116 | 0.572 |
| Urban | FW_H | 26 | 0.411 | 0.037 |
| Gini | FW_H | 26 | 0.234 | 0.250 |
| GDP | FW_H | 26 | −0.118 | 0.566 |
Publisher’s Note: MDPI stays neutral with regard to jurisdictional claims in published maps and institutional affiliations. |
© 2022 by the authors. Licensee MDPI, Basel, Switzerland. This article is an open access article distributed under the terms and conditions of the Creative Commons Attribution (CC BY) license (https://creativecommons.org/licenses/by/4.0/).
Share and Cite
MDPI and ACS Style
Tkáč, F.; Košičiarová, I.; Horská, E.; Mušinská, K. Socioeconomic Relations of Food Waste in Selected European Countries. Economies 2022, 10, 144. https://0-doi-org.brum.beds.ac.uk/10.3390/economies10060144
AMA Style
Tkáč F, Košičiarová I, Horská E, Mušinská K. Socioeconomic Relations of Food Waste in Selected European Countries. Economies. 2022; 10(6):144. https://0-doi-org.brum.beds.ac.uk/10.3390/economies10060144
Chicago/Turabian StyleTkáč, Filip, Ingrida Košičiarová, Elena Horská, and Kristína Mušinská. 2022. "Socioeconomic Relations of Food Waste in Selected European Countries" Economies 10, no. 6: 144. https://0-doi-org.brum.beds.ac.uk/10.3390/economies10060144
Note that from the first issue of 2016, this journal uses article numbers instead of page numbers. See further details here.