
A Growing Light in the Lagging Region in Indonesia: The Impact of Village Fund on Rural Economic Growth


Abstract
:1. Introduction
2. Literature Review
2.1. Overview of Village Development
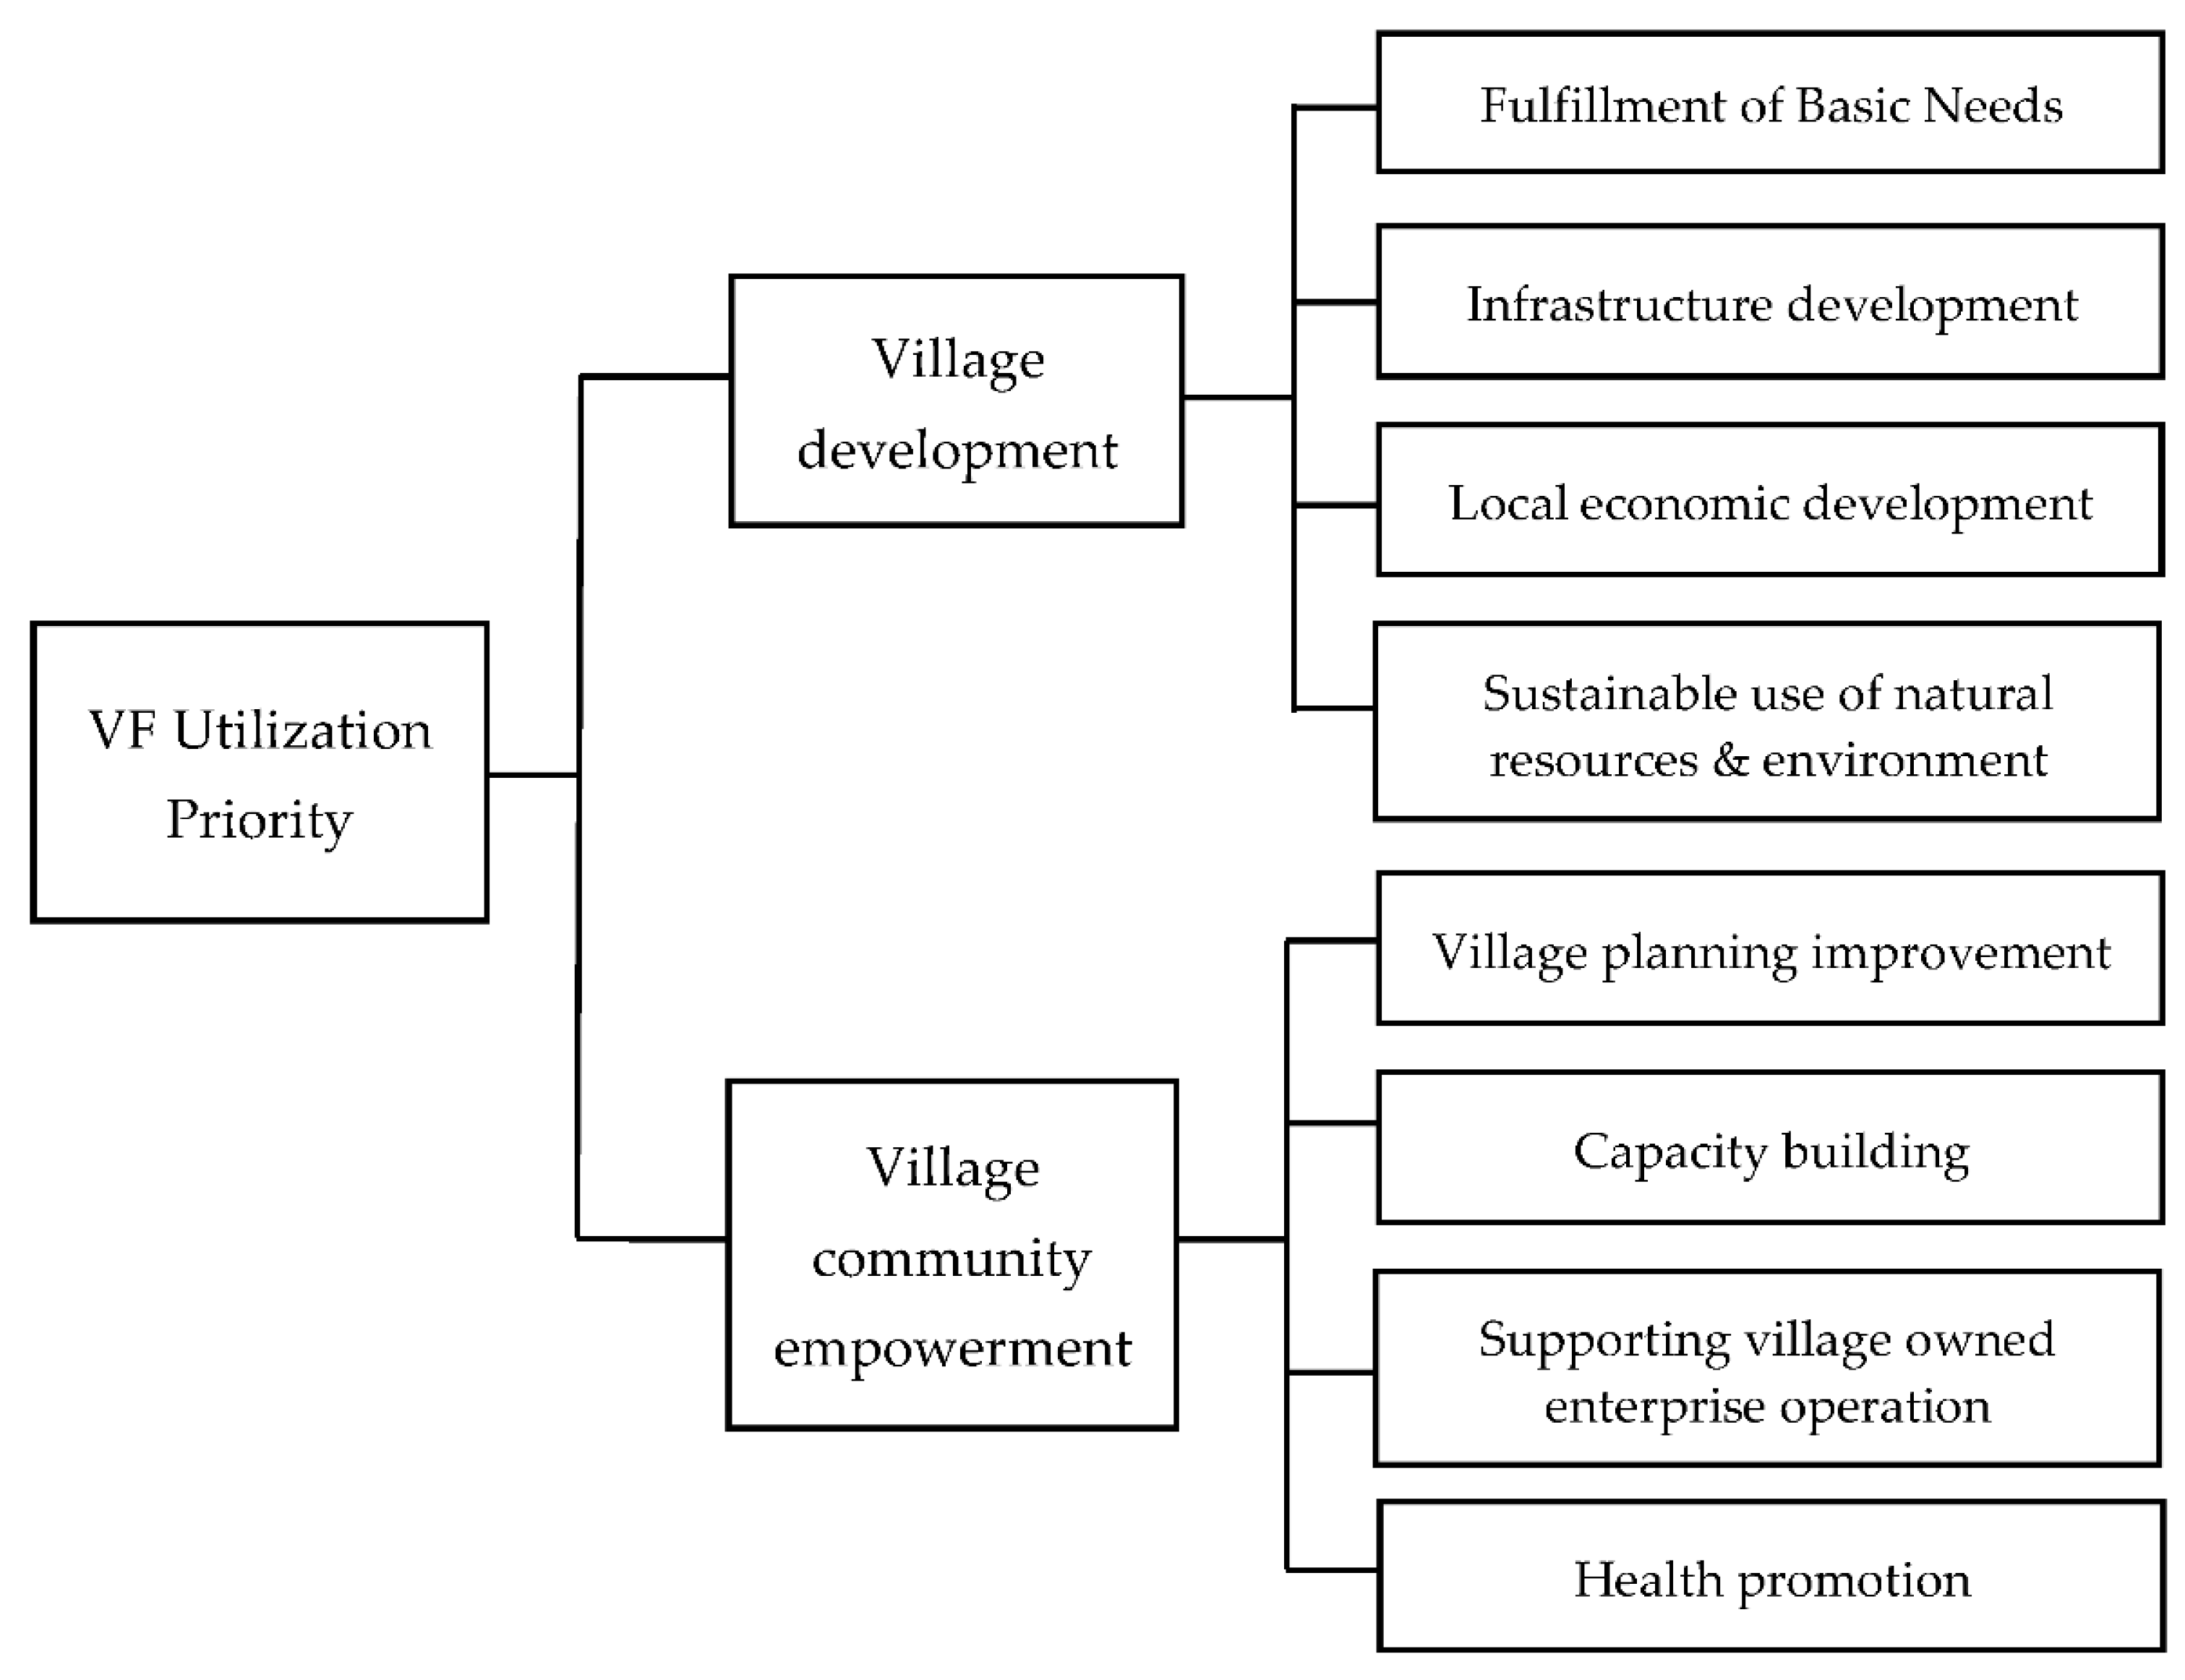
2.2. Village Fund Utilization and the SDGs
3. Material and Method
3.1. Data
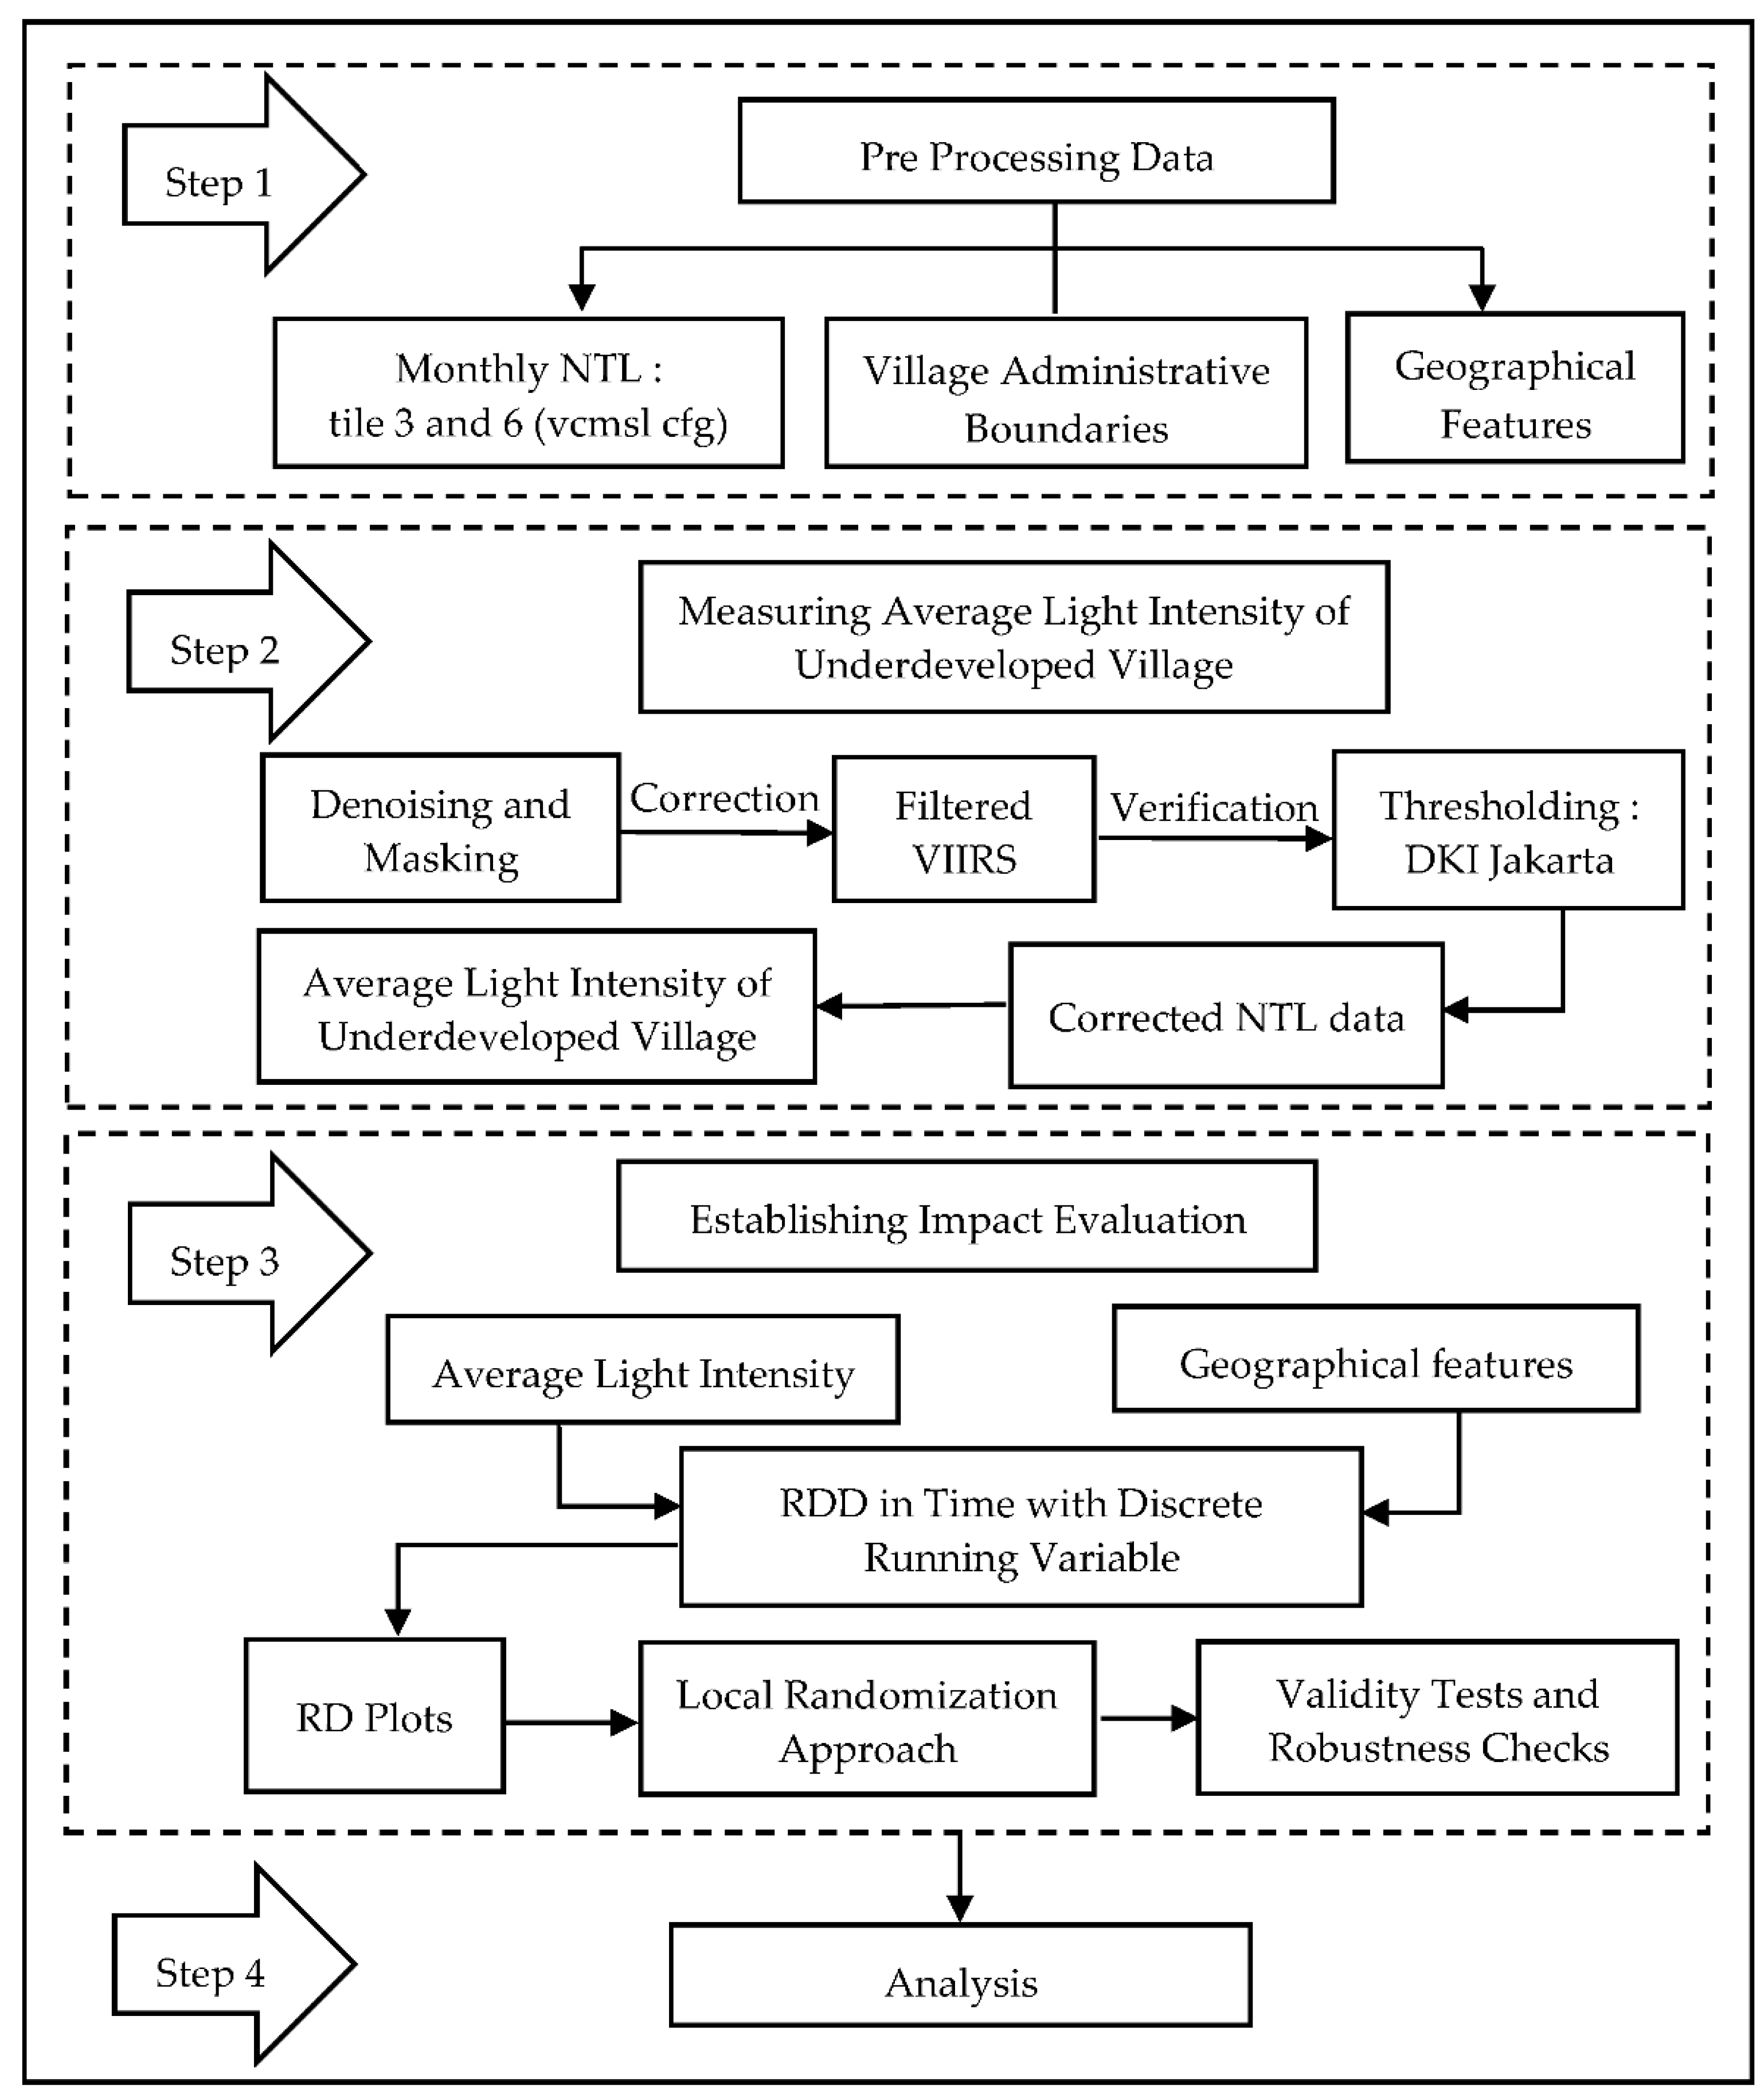
3.2. Measuring Rural Economic Growth from Average Light Intensity
3.3. Empirical Strategy
4. Result and Discussion
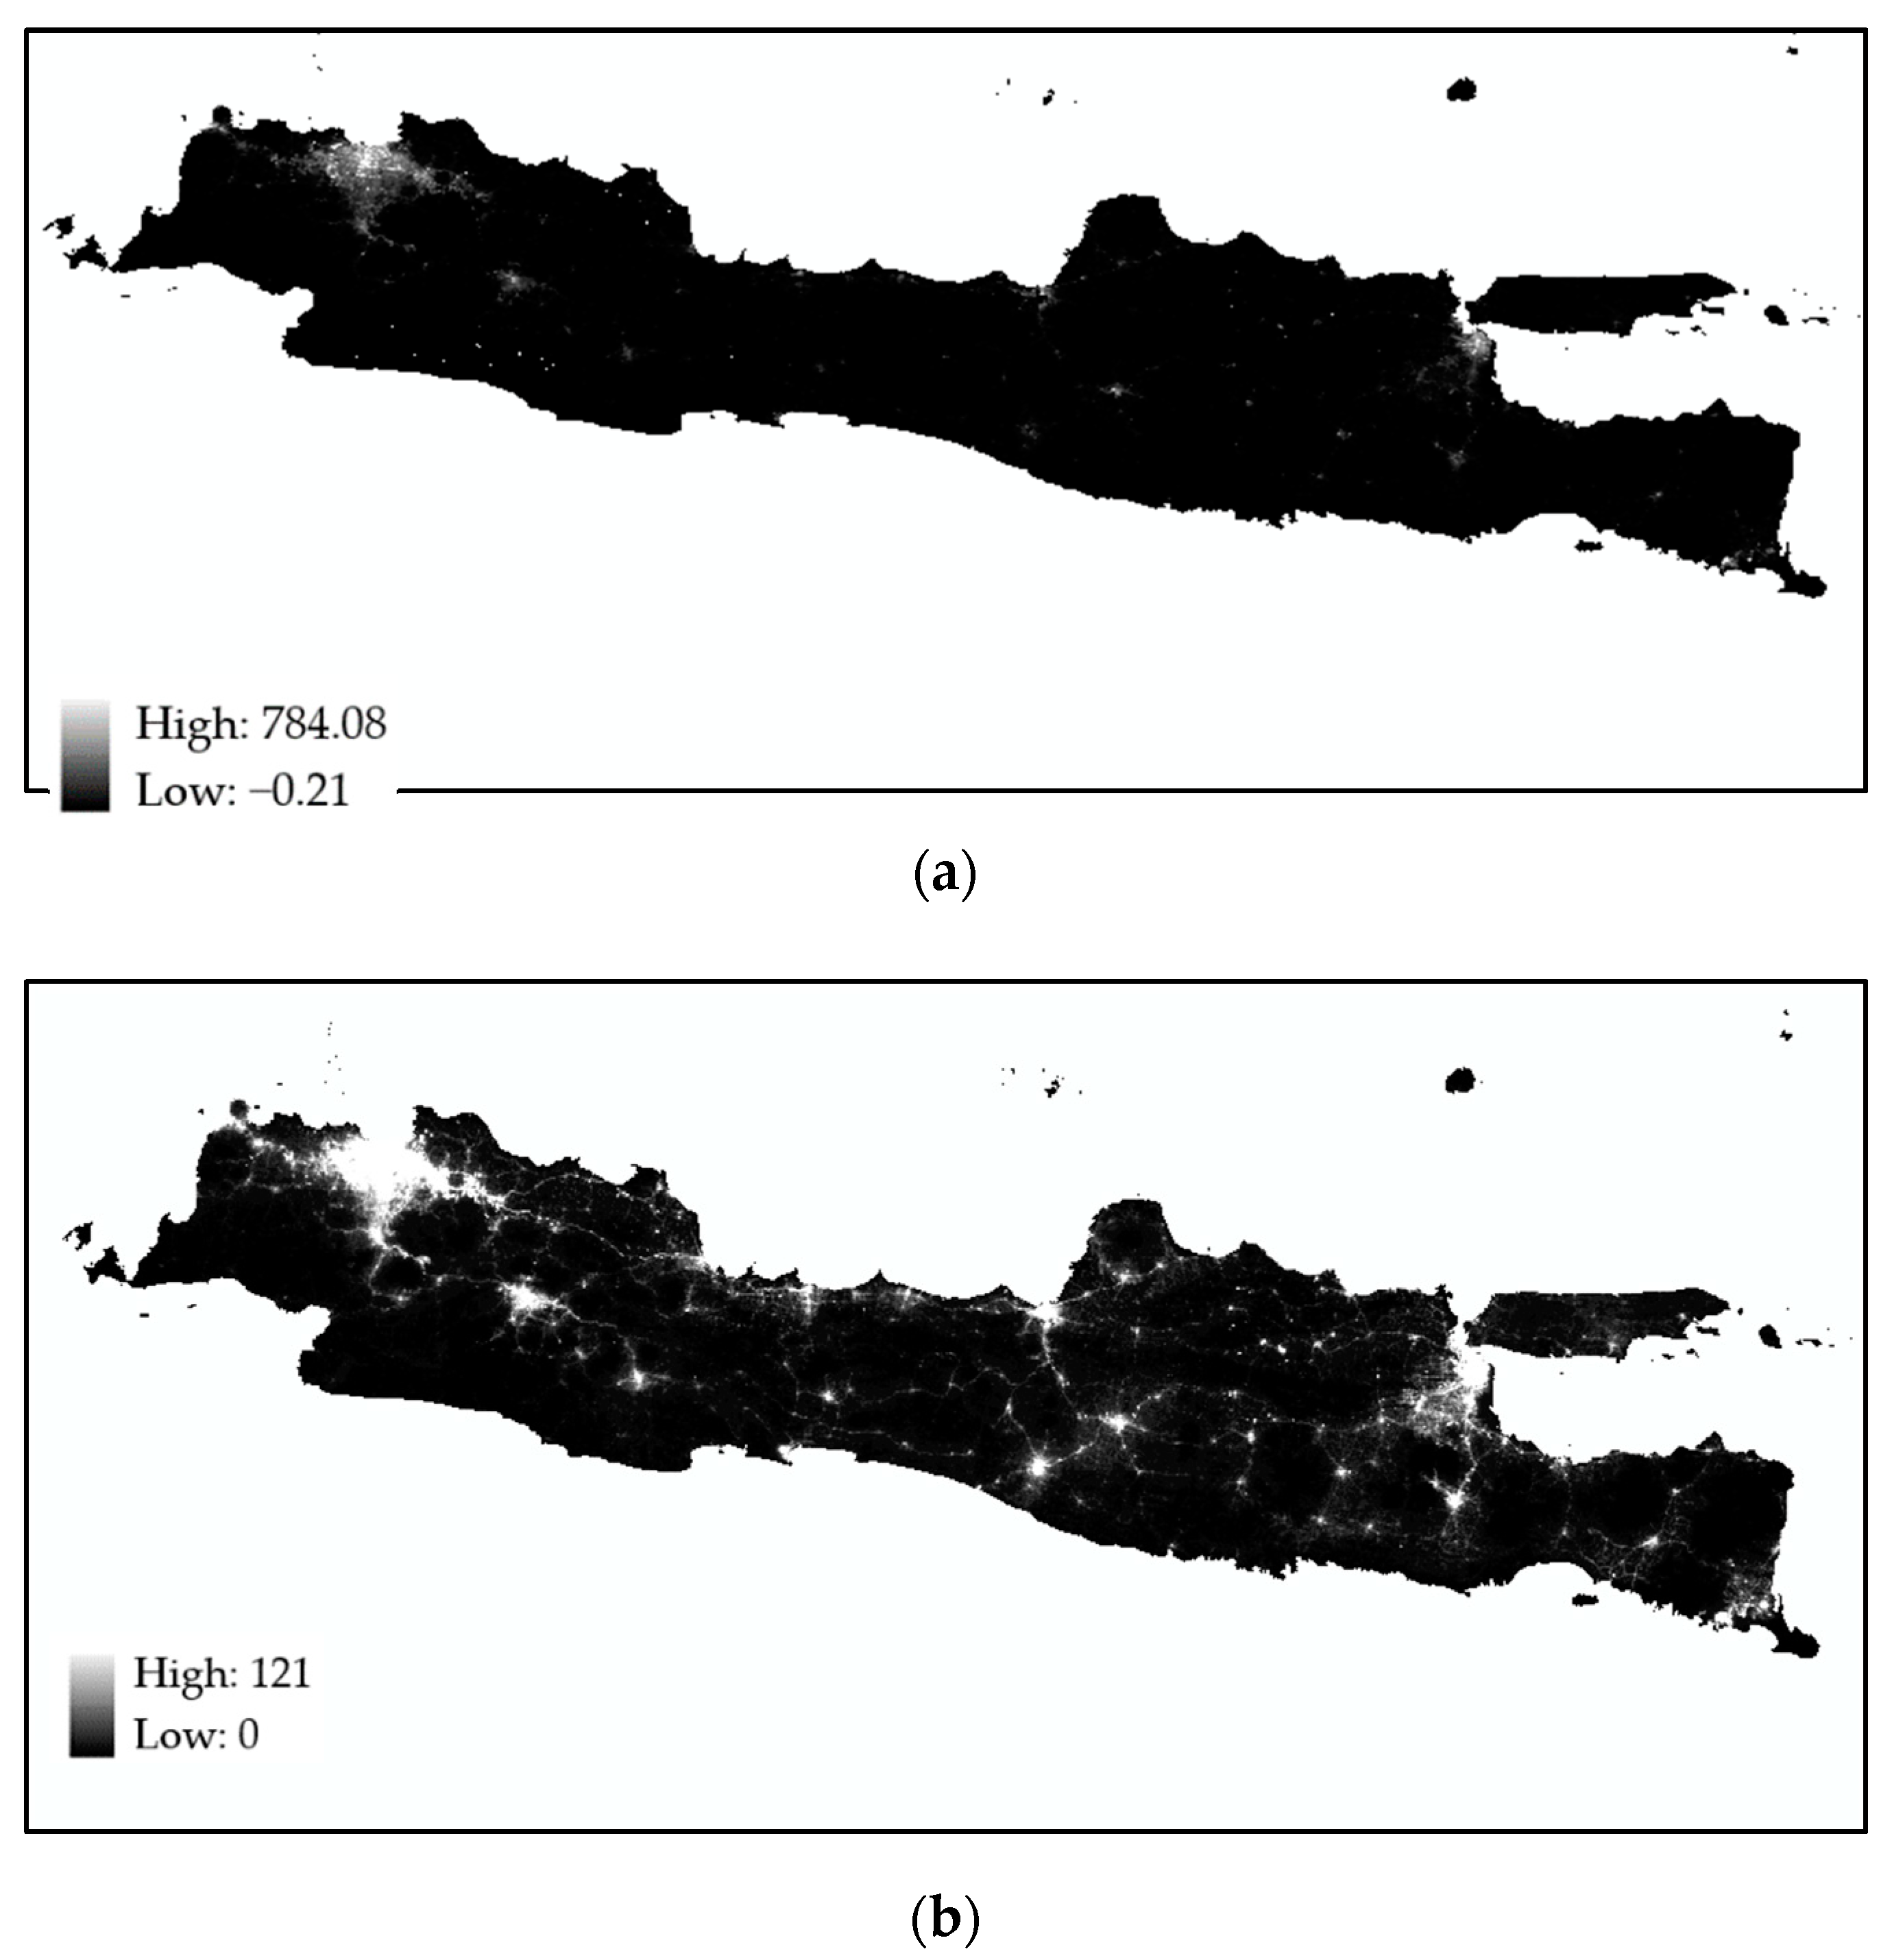
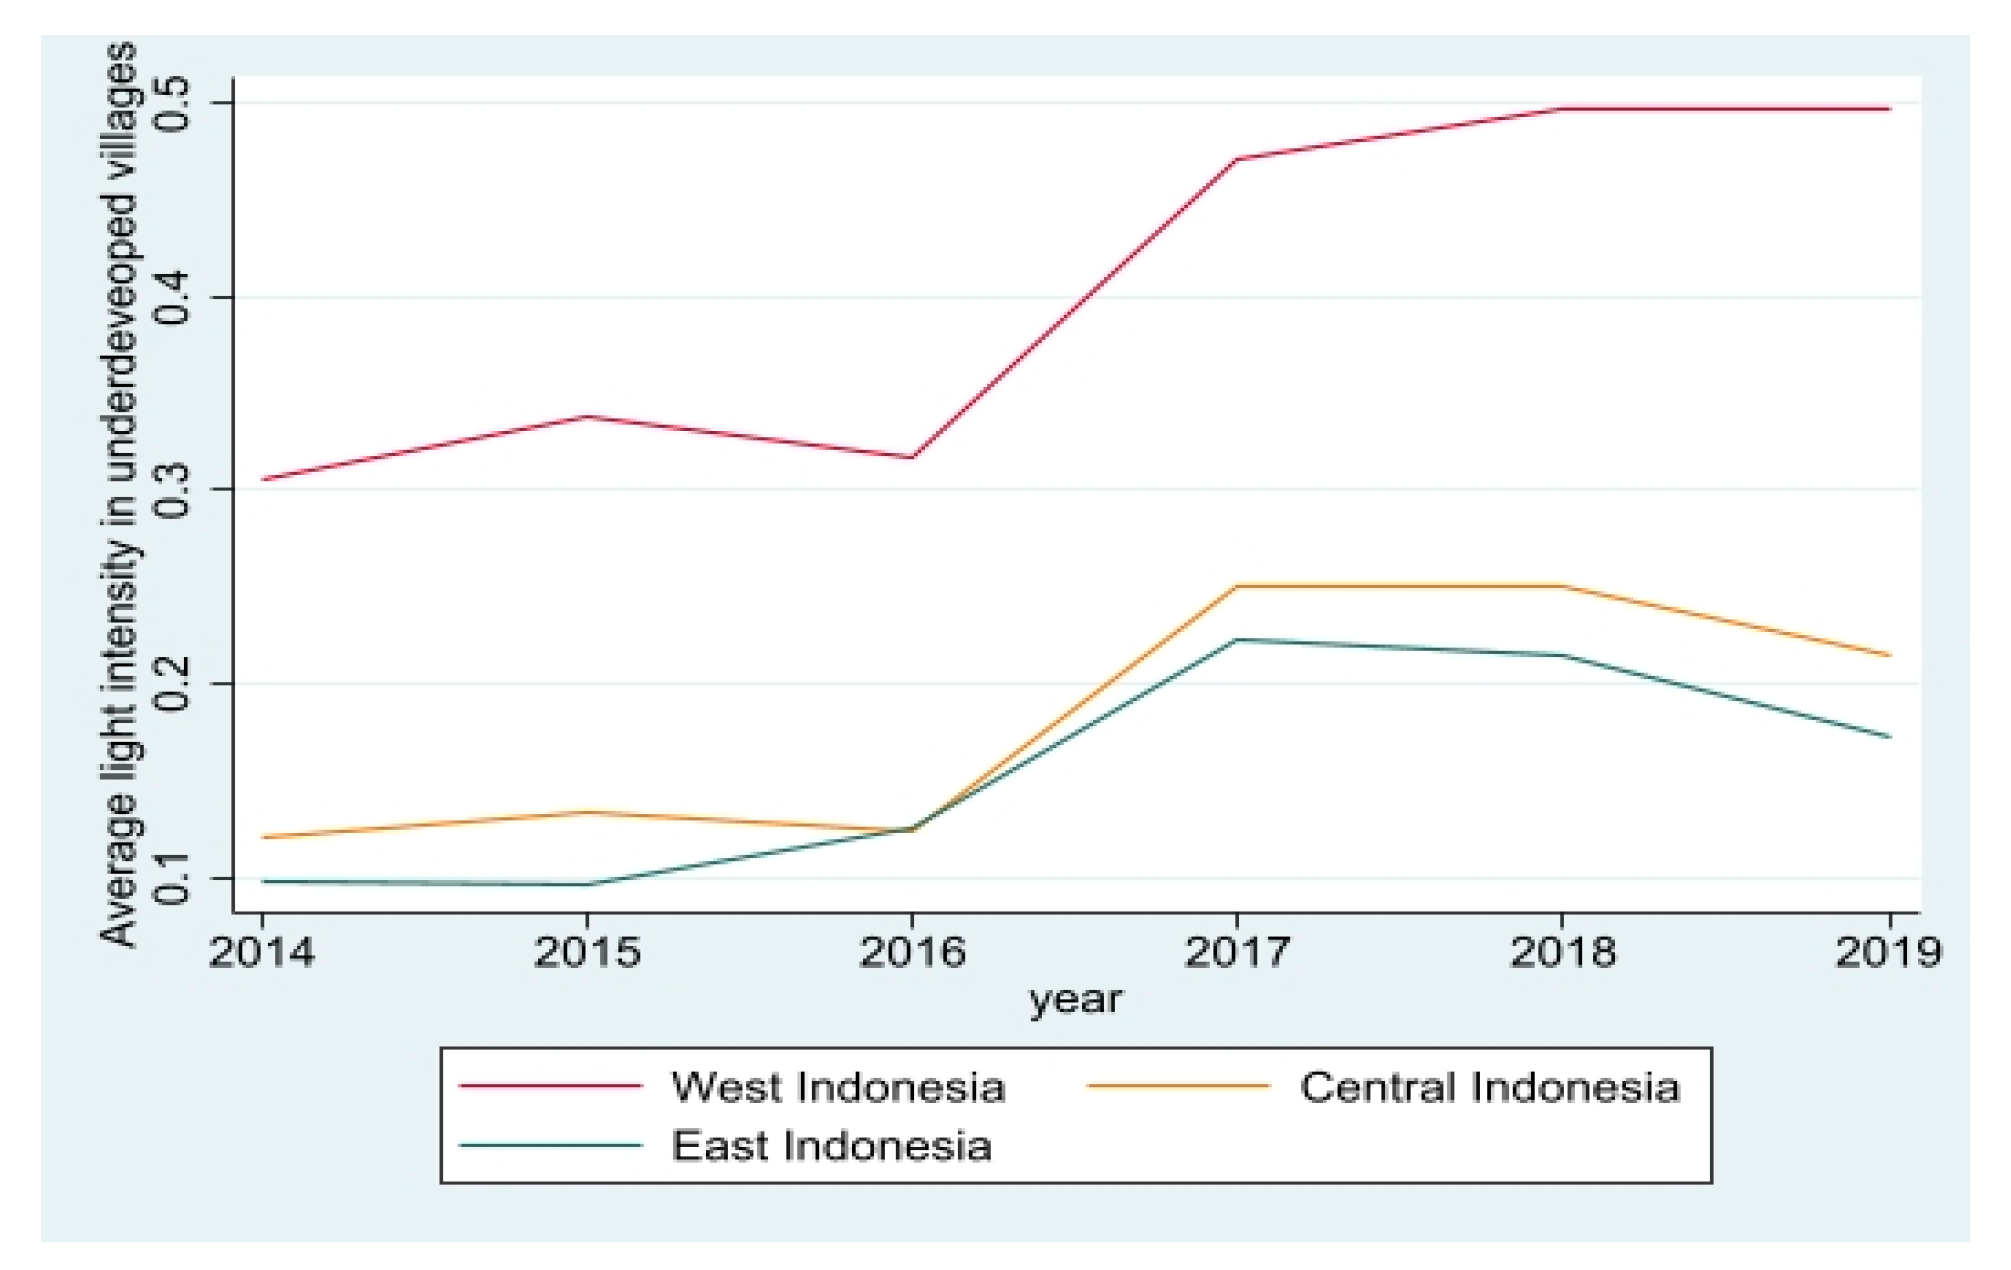
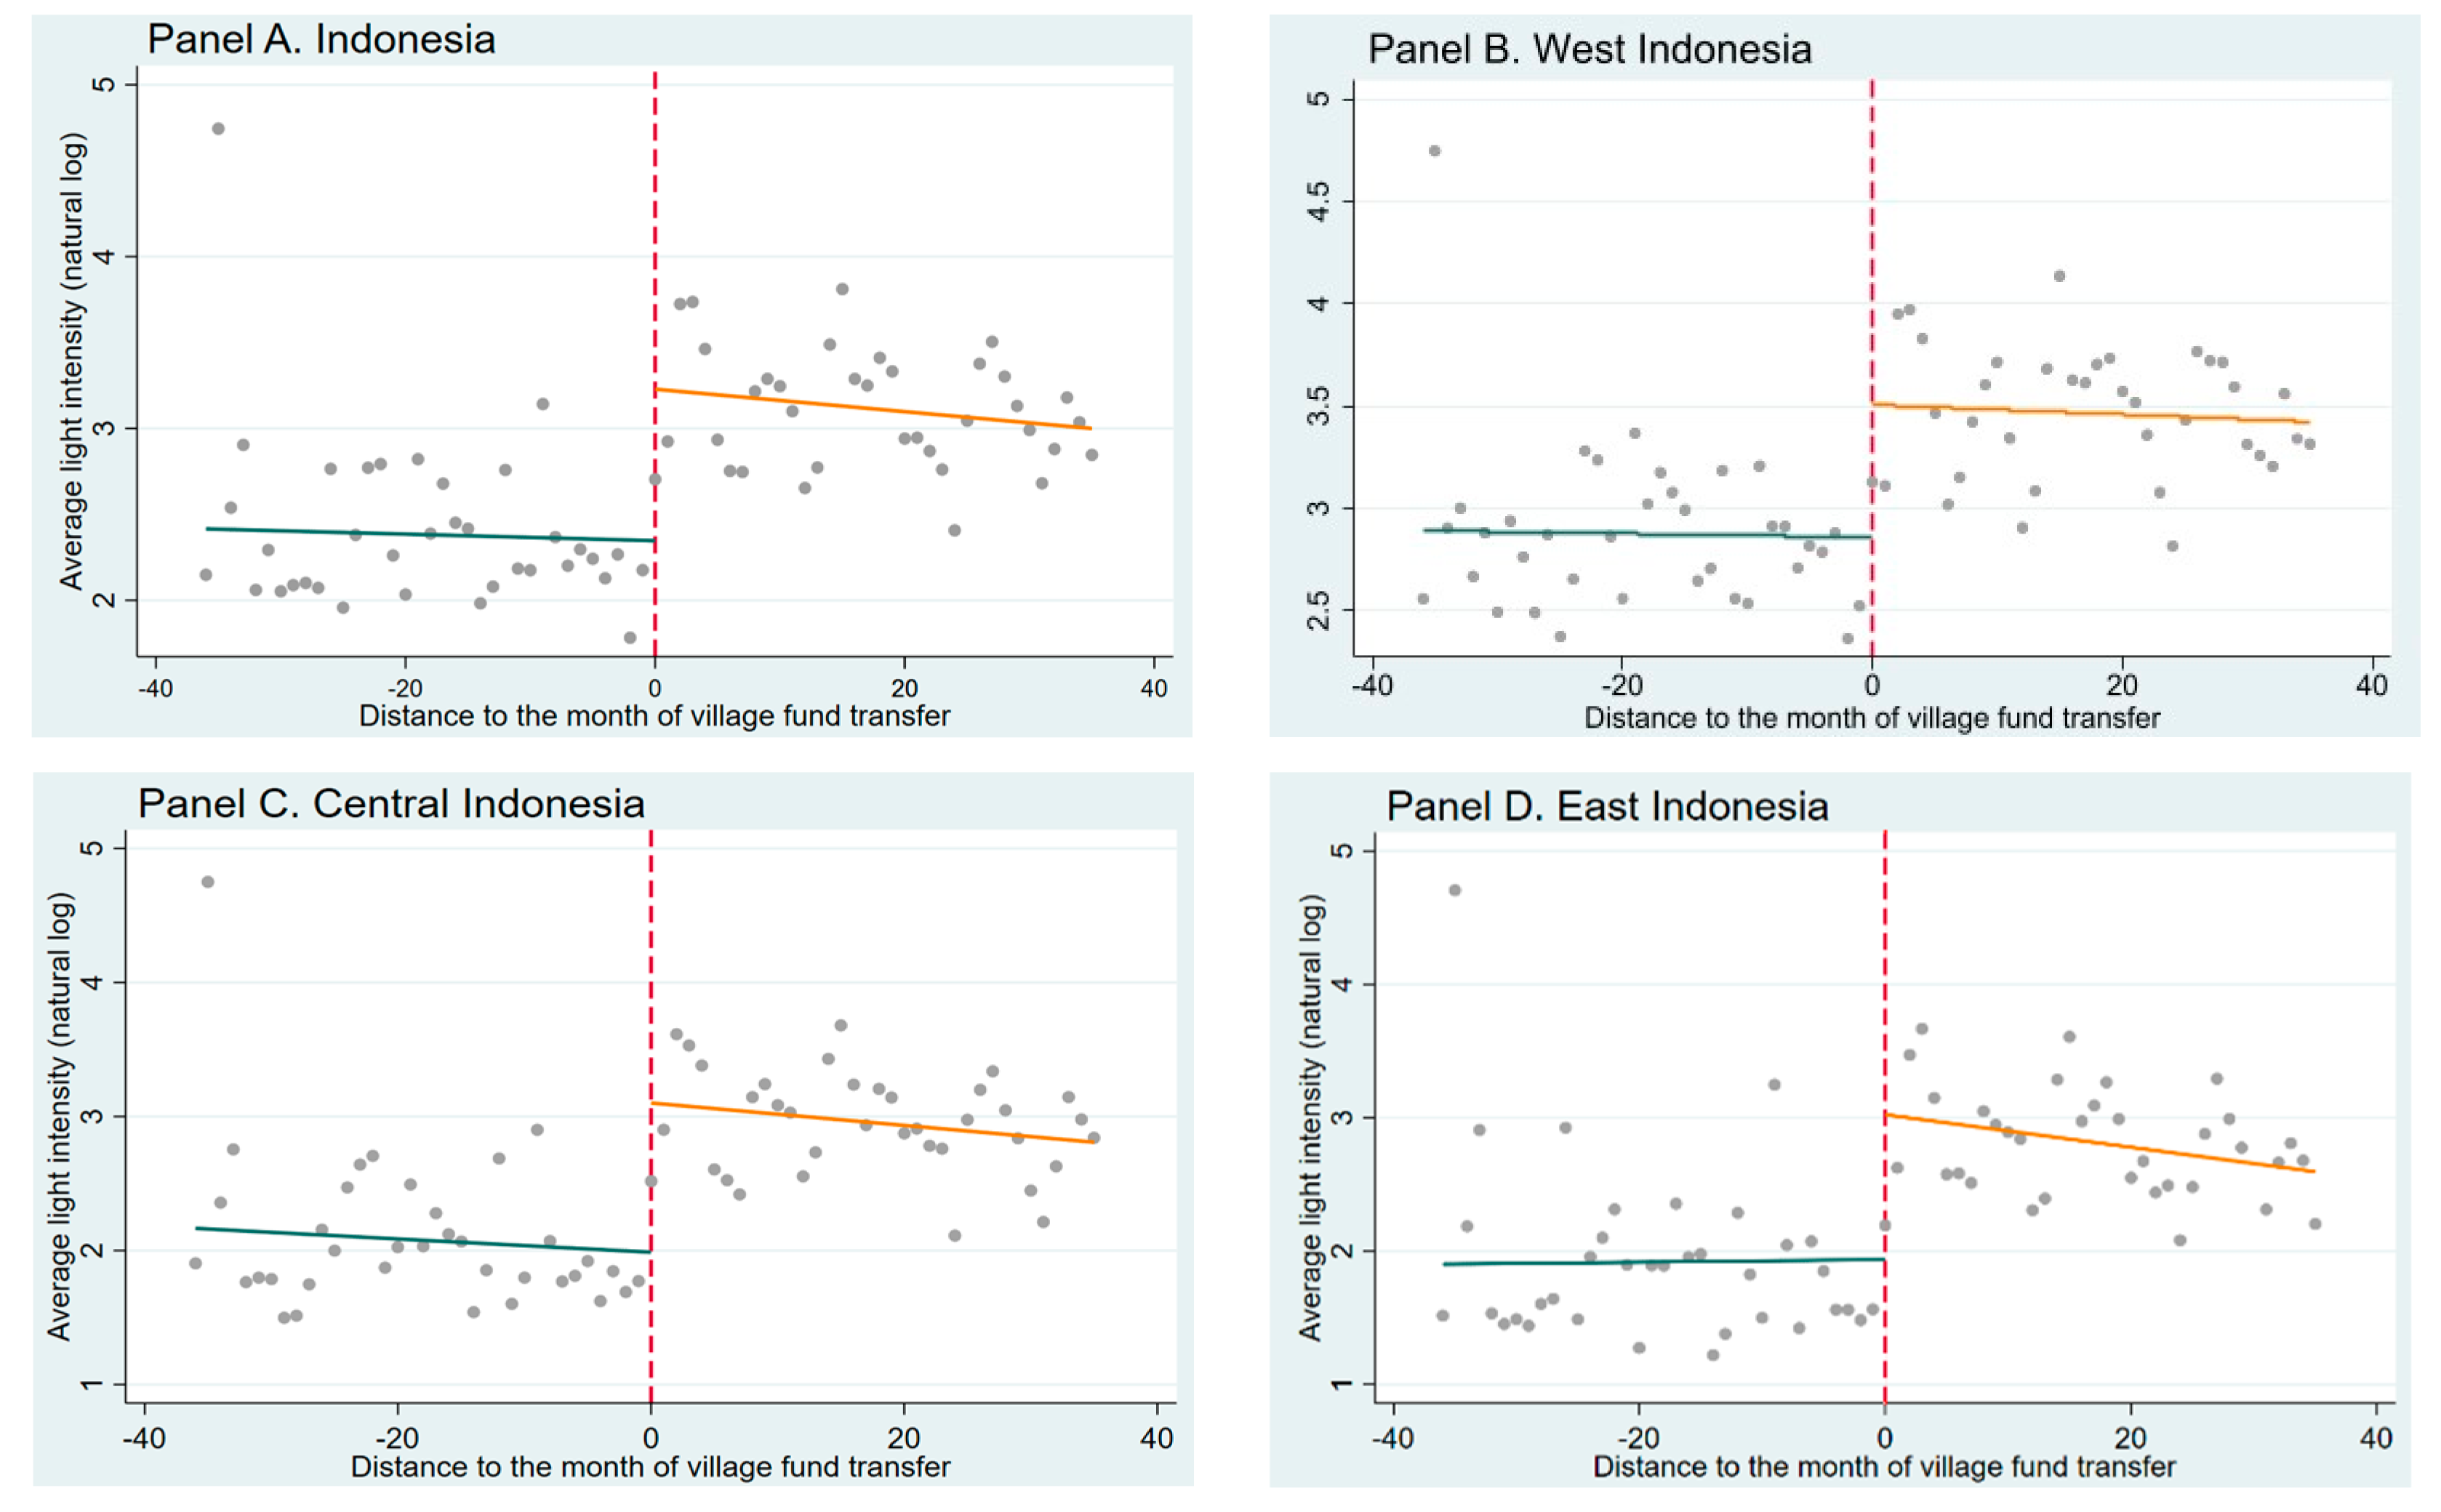
4.1. Results of the ALI Calculation
- (1)
- West Indonesia, an advanced region, consists of Sumatra, Java, and Bali islands.
- (2)
- Central Indonesia, a developing region, consists of Kalimantan, Sulawesi, and Nusa Tenggara islands.
- (3)
- East Indonesia, a remote region, consists of Maluku and Papua islands.
4.2. Baseline Estimates
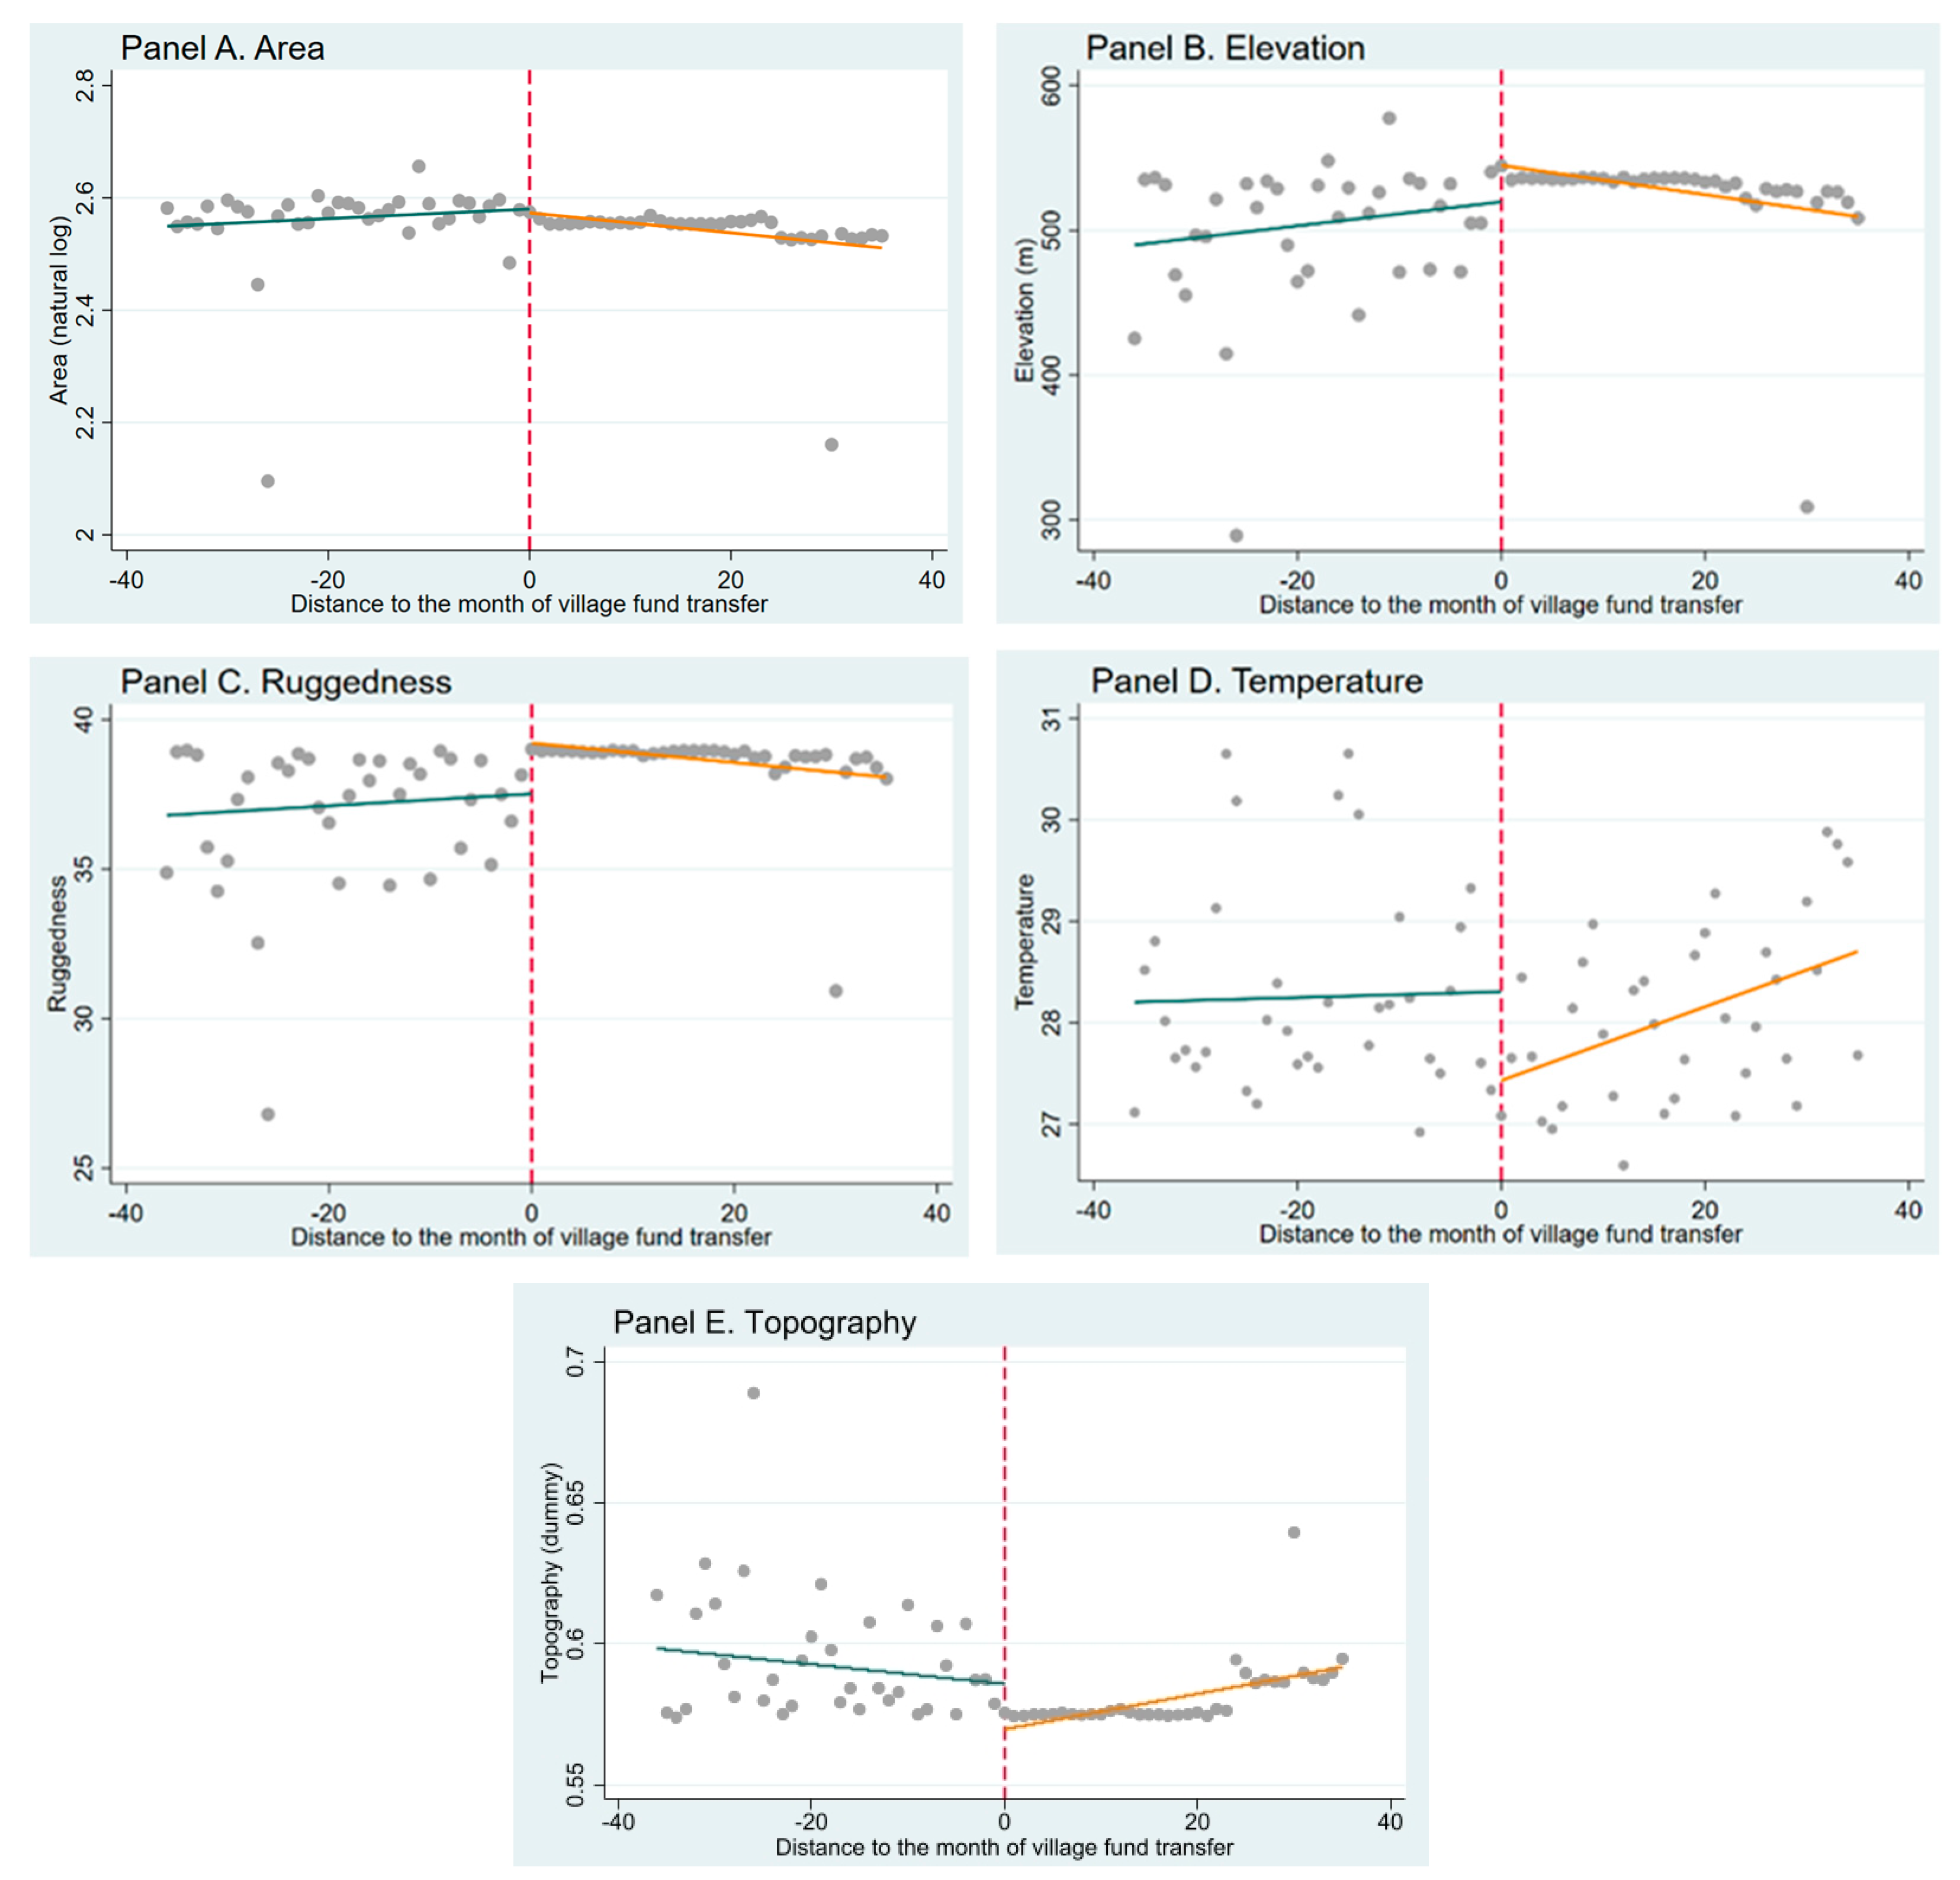
4.3. Tests of the Validity of the RDD Approach
4.4. Robustness Checks
5. Conclusions
Author Contributions
Funding
Institutional Review Board Statement
Informed Consent Statement
Data Availability Statement
Conflicts of Interest
References
- Aiyar, Shekhar, and Christian Ebeke. 2020. Inequality of opportunity, inequality of income and economic growth. World Development 136: 105115. [Google Scholar] [CrossRef]
- Arends, Helge. 2020. The Dangers of Fiscal Decentralization and Public Service Delivery: A Review of Arguments. Polit Vierteljahresschr 61: 599–622. [Google Scholar] [CrossRef]
- Arham, Muhammad Amir, and Rauf Hatu. 2020. Does Village Fund Transfer Address the Issue of Inequality and Poverty? A Lesson from Indonesia. Journal of Asian Finance, Economics and Business 7: 433–42. [Google Scholar] [CrossRef]
- Arifin, Bondi, Eko Wicaksono, Rita Helbra Tenrini, Irwanda Wisnu Wardhana, Hadi Setiawan, Sofia Arie Damayanty, Akhmad Solikin, Maman Suhendra, Acwin Hendra Saputra, Gede Agus Ariutama, and et al. 2020. Village fund, village-owned-enterprises, and employment: Evidence from Indonesia. Journal of Rural Studies 79: 382–94. [Google Scholar] [CrossRef]
- Azam, Mehtabul. 2019. Accounting for growing urban-rural welfare gaps in India. World Development 122: 410–32. [Google Scholar] [CrossRef]
- Banerjee, Abhijit Vinayak, and Esther Duflo. 2011. Growth Theory through the Lens of Development Economics. Handbook of Economic Growth 1: 473–552. [Google Scholar] [CrossRef]
- Bednarska-Olejniczak, Dorota, Jarosław Olejniczak, and Libuše Svobodová. 2020. How a participatory budget can support sustainable rural development-lessons from Poland. Sustainability 12: 2620. [Google Scholar] [CrossRef]
- Benjamin, Dwayne, Loren Brandt, and John Giles. 2011. Did Higher Inequality Impede Growth in Rural China? Economic Journal 121: 1281–309. [Google Scholar] [CrossRef]
- Boonperm, Jirawan, Jonathan Haughton, and Shahidur R. Khandker. 2013. Does the Village Fund matter in Thailand? Evaluating the impact on incomes and spending. Journal of Asian Economics 25: 3–16. [Google Scholar] [CrossRef]
- Calonico, Sebastian, Matias D. Cattaneo, and Max H. Farrell. 2021. Optimal bandwidth choice for robust bias-corrected inference in regression discontinuity designs. Econometrics Journal 23: 192–210. [Google Scholar] [CrossRef] [Green Version]
- Calonico, Sebastian, Matias D. Cattaneo, and Rocío Titiunik. 2014. Robust data-driven inference in the regression-discontinuity design. Stata Journal 14: 909–46. [Google Scholar] [CrossRef]
- Calonico, Sebastian, Matias D. Cattaneo, and Rocío Titiunik. 2015. Optimal Data-Driven Regression Discontinuity Plots. Journal of the American Statistical Association 110: 1753–69. [Google Scholar] [CrossRef]
- Canavire-Bacarreza, Gustavo, Jorge Martinez-Vazquez, and Bauyrzhan Yedgenov. 2020. Identifying and disentangling the impact of fiscal decentralization on economic growth. World Development 127: 104742. [Google Scholar] [CrossRef]
- Casey, Gregory P., and Ann L. Owen. 2014. Inequality and Fractionalization. World Development 56: 32–50. [Google Scholar] [CrossRef]
- Cattaneo, Matias D., and Gonzalo Vazquez-Bare. 2017. The Choice of Neighborhood in Regression Discontinuity Designs. Observational Studies 3: 134–46. [Google Scholar] [CrossRef]
- Cattaneo, Matias D., Brigham R. Frandsen, and Rocío Titiunik. 2014. Randomization Inference in the Regression Discontinuity Design: An Application to Party Advantages in the U.S. Senate. Journal of Causal Inference 3: 1–24. [Google Scholar] [CrossRef]
- Cattaneo, Matias D., Michael Jansson, and Xinwei Ma. 2021. Local regression distribution estimators. Journal of Econometrics, 1–18. [Google Scholar] [CrossRef]
- Cattaneo, Matias D., Nicolás Idrobo, and Rocío Titiunik. 2019a. A Practical Introduction to Regression Discontinuity Designs: Foundations. Cambridge: Cambridge University Press. [Google Scholar] [CrossRef]
- Cattaneo, Matias D., Nicolás Idrobo, and Rocío Titiunik. 2019b. A Practical Introduction to Regression Discontinuity Designs: Volume II. Cambridge: Cambridge University Press. [Google Scholar]
- Chanda, Areendam, and Sujana Kabiraj. 2020. Shedding light on regional growth and convergence in India. World Development 133: 104961. [Google Scholar] [CrossRef]
- Chandoevwit, Worawan, and Bawornpan Ashakul. 2008. The Impact of the Village Fund on Rural Households. TDRI Quarterly Review 23: 9–16. [Google Scholar]
- Clark, Andrew E., Orla Doyle, and Elena Stancanelli. 2020. The impact of terrorism on individual well-being: Evidence from the Boston Marathon bombing. Economic Journal 130: 2065–104. [Google Scholar] [CrossRef]
- de Janvry, Alain, and Elisabeth Sadoulet. 2009. Agricultural growth and poverty reduction: Additional evidence. World Bank Research Observer 25: 1–20. [Google Scholar] [CrossRef]
- de Janvry, Alain, and Elisabeth Sadoulet. 2021. Development Economics: Theory and Practice, 2nd ed. New York: Routledge. [Google Scholar] [CrossRef]
- Doll, Christopher N. H., Jan-Peter Muller, and Jeremy G. Morley. 2006. Mapping regional economic activity from nighttime light satellite imagery. Ecological Economics 57: 75–92. [Google Scholar] [CrossRef]
- Elvidge, Christopher D., Kimberly E. Baugh, Sharolyn J. Anderson, Paul C. Sutton, and Tilottama Ghosh. 2012. The Night Light Development Index (NLDI): A spatially explicit measure of human development from satellite data. Social Geography 7: 23–35. [Google Scholar] [CrossRef]
- Engstrom, Ryan, Jonathan Hersh, and David Newhouse. 2017. Poverty from Space: Using High-Resolution Satellite Imagery for Estimating Economic Well-Being. World Bank Policy Research Working Paper No. 8284. Washington, DC: World Bank Group. [Google Scholar]
- Fitriyani, Lita Yulita, Marita Marita, Widyastuti Widyastuti, and Ridho Wahyu Nurahman. 2018. Determinants of Village Fund Allocation. Jurnal Akuntansi Multiparadigma 9: 526–39. [Google Scholar] [CrossRef]
- Ghosh, Tilottama, Sharolyn J. Anderson, Christopher D. Elvidge, and Paul C. Sutton. 2013. Using nighttime satellite imagery as a proxy measure of human well-being. Sustainability 5: 4988–5019. [Google Scholar] [CrossRef]
- Gibson, John, Susan Olivia, and Geua Boe-Gibson. 2020. Night Lights in Economics: Sources and Uses. Journal of Economic Surveys 34: 955–80. [Google Scholar] [CrossRef]
- Gibson, John, Susan Olivia, Geua Boe-Gibson, and Chao Li. 2021. Which night lights data should we use in economics, and where? Journal of Development Economics 149: 102602. [Google Scholar] [CrossRef]
- Guerrero, Víctor M., and Juan A. Mendoza. 2019. On measuring economic growth from outer space: A single country approach. Empirical Economics 57: 971–90. [Google Scholar] [CrossRef]
- Harun, Harun, Peter Graham, Haryono P. Kamase, and Monir Mir. 2020. A Critical Analysis of the Impacts of Financial Literacy and NPM on Village Funds Initiative in Indonesia. International Journal of Public Administration 44: 336–45. [Google Scholar] [CrossRef]
- Henderson, J. Vernon, Adam Storeygard, and David N. Weil. 2012. Measuring economic growth from outer space. American Economic Review 102: 994–1028. [Google Scholar] [CrossRef] [PubMed]
- Islam, Nazrul. 2003. What have we learnt from the convergence debate? Journal of Economic Surveys 17: 309–62. [Google Scholar] [CrossRef]
- Ismail, Yasin R., Muhammad Amir Arham, and Sri Indriyani S. Dai. 2020. Analysis Of Village Dau, Dak, And Funds On Inequality Distribution Income And Growth In Indonesia 2015–2018. Jambura Equilibrium Journal 1: 83–93. [Google Scholar] [CrossRef]
- Ivan, Kinga, Iulian-Horia Holobâcă, József Benedek, and Ibolya Török. 2020. Potential of nighttime lights to measure regional inequality. Remote Sensing 12: 33. [Google Scholar] [CrossRef]
- Jacob, Robin Tepper, Pei Zhu, Marie-Andrée Somers, and Howard Bloom. 2012. A Practical Guide to Regression Discontinuity. New York: MDRC. [Google Scholar]
- Kaboski, Joseph P., and Robert M. Townsend. 2012. The impact of credit on village economies. American Economic Journal: Applied Economics 4: 98–133. [Google Scholar] [CrossRef]
- Khandker, Shahidur R., Gayatri B. Koolwal, and Hussain A. Samad. 2010. Handbook on Impact Evaluation: Quantitative Methods and Practices. Washington, DC: World Bank Publications. [Google Scholar]
- Kim, Euijune, and Yasir Niti Samudro. 2017. The impact of intergovernmental transfer funds on interregional income disparity in Indonesia. International Journal of Urban Sciences 21: 22–40. [Google Scholar] [CrossRef]
- Kolesár, Michal, and Christoph Rothe. 2018. Inference in regression discontinuity designs with a discrete running variable. American Economic Review 108: 2277–304. [Google Scholar] [CrossRef]
- Laurini, Ma’rcio Poletti. 2016. Income Estimation Using Night Luminosity: A Continuous Spatial Model. Spatial Demography 4: 83–115. [Google Scholar] [CrossRef]
- Lessmann, Christian, and André Seidel. 2017. Regional inequality, convergence, and its determinants – A view from outer space. European Economic Review 92: 110–32. [Google Scholar] [CrossRef]
- Lewis, Blane D. 2015. Decentralising to Villages in Indonesia: Money (and Other) Mistakes. Public Administration and Development 35: 347–59. [Google Scholar] [CrossRef]
- Liang, Che-Yuan. 2017. Optimal inequality behind the veil of ignorance. Theory and Decision 83: 431–55. [Google Scholar] [CrossRef]
- Liu, Liangliang, Donghong Ding, and Jun He. 2019. The welfare effects of fiscal decentralization: A simple model and evidence from China. Quality and Quantity 53: 417–34. [Google Scholar] [CrossRef]
- Luechinger, Simon, and Florian Roth. 2016. Effects of a mileage tax for trucks. Journal of Urban Economics 92: 1–15. [Google Scholar] [CrossRef]
- Martinez-Vazquez, Jorge, Santiago Lago-Peñas, and Agnese Sacchi. 2017. The Impact of Fiscal Decentralization: A Survey. Journal of Economic Surveys 31: 1095–129. [Google Scholar] [CrossRef]
- Marx, Susan, and Asha Gosh. 2014. Local Governance Policy Brief: Comparative Review of Village Governance in Cambodia, Indonesia, Papua New Guinea, and the Philippines. Dili: The Asia Foundation, vol. 1. [Google Scholar]
- Mellander, Charlotta, José Lobo, Kevin Stolarick, and Zara Matheson. 2015. Nighttime light data: A good proxy measure for economic activity? PloS ONE 10: e0139779. [Google Scholar] [CrossRef] [PubMed]
- Menkhoff, Lukas, and Ornsiri Rungruxsirivorn. 2011. Do village funds improve access to finance? Evidence from Thailand. World Development 39: 110–22. [Google Scholar] [CrossRef]
- Muinelo-Gallo, Leonel, Adrián Rodríguez-Miranda, and Pablo Castro-Scavone. 2017. Intergovernmental transfers and regional income inequalities in Uruguay. Hacienda Pública Española 219: 9–34. [Google Scholar] [CrossRef]
- Noor, Abdisalan M., Victor A. Alegana, Peter W. Gething, Andrew J. Tatem, and Robert W. Snow. 2008. Using remotely sensed nighttime light as a proxy for poverty in Africa. Population Health Metrics 6: 5. [Google Scholar] [CrossRef] [PubMed]
- Pan, Wenbin, Hongming Fu, and Peng Zheng. 2020. Regional poverty and inequality in the Xiamen-Zhangzhou-Quanzhou city cluster in China Based on NPP/VIIRS nighttime light imagery. Sustainability 12: 2547. [Google Scholar] [CrossRef]
- Permatasari, Paulina, Assyifa Szami Ilman, Carol Ann Tilt, Dian Lestari, Saiful Islam, Rita Helbra Tenrini, Arif Budi Rahman, Agunan Paulus Samosir, and Irwanda Wisnu Wardhana. 2021. The village fund program in Indonesia: Measuring the effectiveness and alignment to sustainable development goals. Sustainability 13: 2294. [Google Scholar] [CrossRef]
- Romeo, Leonardo G., and Spyckerelle Luc. 2004. Decentralization Reforms and Commune-Level Services Delivery in Cambodia. Paper presented at Local Government Pro-Poor Service Delivery Workshop, Manila, Philippines, February 9–13. [Google Scholar]
- Salim, Agus, Wahidah R. Bulan, Bejo Untung, Indro Laksono, and Karen Brock. 2017. Indonesia’s Village Law: Enabler or Constraint for More Accountable Governance? Available online: https://opendocs.ids.ac.uk/opendocs/bitstream/handle/20.500.12413/13324/Village_law_Indonesia_Final.pdf (accessed on 16 August 2021).
- Shi, Kaifang, Bailang Yu, Yixiu Huang, Yingjie Hu, Bing Yin, Zuoqi Chen, Liujia Chen, and Jianping Wu. 2014. Evaluating the ability of NPP-VIIRS nighttime light data to estimate the gross domestic product and the electric power consumption of China at multiple scales: A comparison with DMSP-OLS data. Remote Sensing 6: 1705–24. [Google Scholar] [CrossRef]
- Singhal, Abhishek, Sohini Sahu, Siddhartha Chattopadhyay, Abhijit Mukherjee, and Soumendra N. Bhanja. 2020. Using night time lights to find regional inequality in India and its relationship with economic development. PloS ONE 15: 0241907. [Google Scholar] [CrossRef]
- Soerjatisnanta, Hieronymus, and Rudi Natamihardja. 2016. Institutional and Cultural Approaches for Strengthening Human Right Cities and SDGs at the Village Level. Volume 15, pp. 1–23. Available online: http://www.whrcf.org/data/file/MeetingData_eng/3422239159_PMHXNzVW_b82ebe152e33b03960fa21a841711f11dd43ca16.pdf (accessed on 16 August 2021).
- Suryahadi, Asep, Daniel Suryadarma, and Sudarno Sumarto. 2009. The effects of location and sectoral components of economic growth on poverty: Evidence from Indonesia. Journal of Development Economics 89: 109–17. [Google Scholar] [CrossRef]
- Susilo, Daniel, Endik Hidayat, and Rustono Farady Marta. 2021. Village public innovations during COVID19 pandemic in rural areas: Phenomena in Madura, Indonesia. Cogent Social Sciences 7: 1. [Google Scholar] [CrossRef]
- United Nations Development Programme. 2018. What Does It Mean to Leave No One Behind? A UNDP Discussion Paper and Framework for Implementation. New York: UNDP. [Google Scholar]
- Wahyudi, Sugeng, Tarmizi Achmad, and Imang Dapit Pamungkas. 2022. Prevention Village Fund Fraud in Indonesia: Moral Sensitivity as a Moderating Variable. Economies 10: 26. [Google Scholar] [CrossRef]
- World Bank. 2005. East Asia Decentralizes: Making Local Government Work. Washington, DC: The World Bank. [Google Scholar]
- Wu, Rongwei, Degang Yang, Jiefang Dong, Lu Zhang, and Fuqiang Xia. 2018. Regional inequality in China based on NPP-VIIRS nighttime light imagery. Remote Sensing 10: 240. [Google Scholar] [CrossRef]
- Yin, Ximing, Jin Chen, and Jizhen Li. 2019. Rural innovation system: Revitalize the countryside for a sustainable development. Journal of Rural Studies 93: 471–78. [Google Scholar] [CrossRef]
- Yu, Bailang, Kaifang Shi, Yingjie Hu, Chang Huang, Zuoqi Chen, and Jianping Wu. 2015. Poverty Evaluation Using NPP-VIIRS Nighttime Light Composite Data at the County Level in China. IEEE Journal of Selected Topics in Applied Earth Observations and Remote Sensing 8: 1217–29. [Google Scholar] [CrossRef]
- Yudhistira, Muhammad Halley, Prani Sastiono, and Melly Meliyawati Meliyawati. 2020. Exploiting unanticipated change in block rate pricing for water demand elasticities estimation: Evidence from Indonesian suburban area. Water Resources and Economics 32: 100161. [Google Scholar] [CrossRef]
- Yudhistira, Muhammad Halley, Witri Indriyani, Andhika Putra Pratama, Yusuf Sofiandi, and Yusuf Reza Kurniawan. 2019. Transportation network and changes in urban structure: Evidence from the Jakarta Metropolitan Area. Research in Transportation Economics 74: 52–63. [Google Scholar] [CrossRef]
- Zheng, Lucy. 2021. Fiscal decentralization and regional disparity: Evidence from cross-section and panel data. Annals of Regional Science 82: 29–36. [Google Scholar] [CrossRef] [Green Version]


| Underdeveloped | Developing | Independent | Total | |
|---|---|---|---|---|
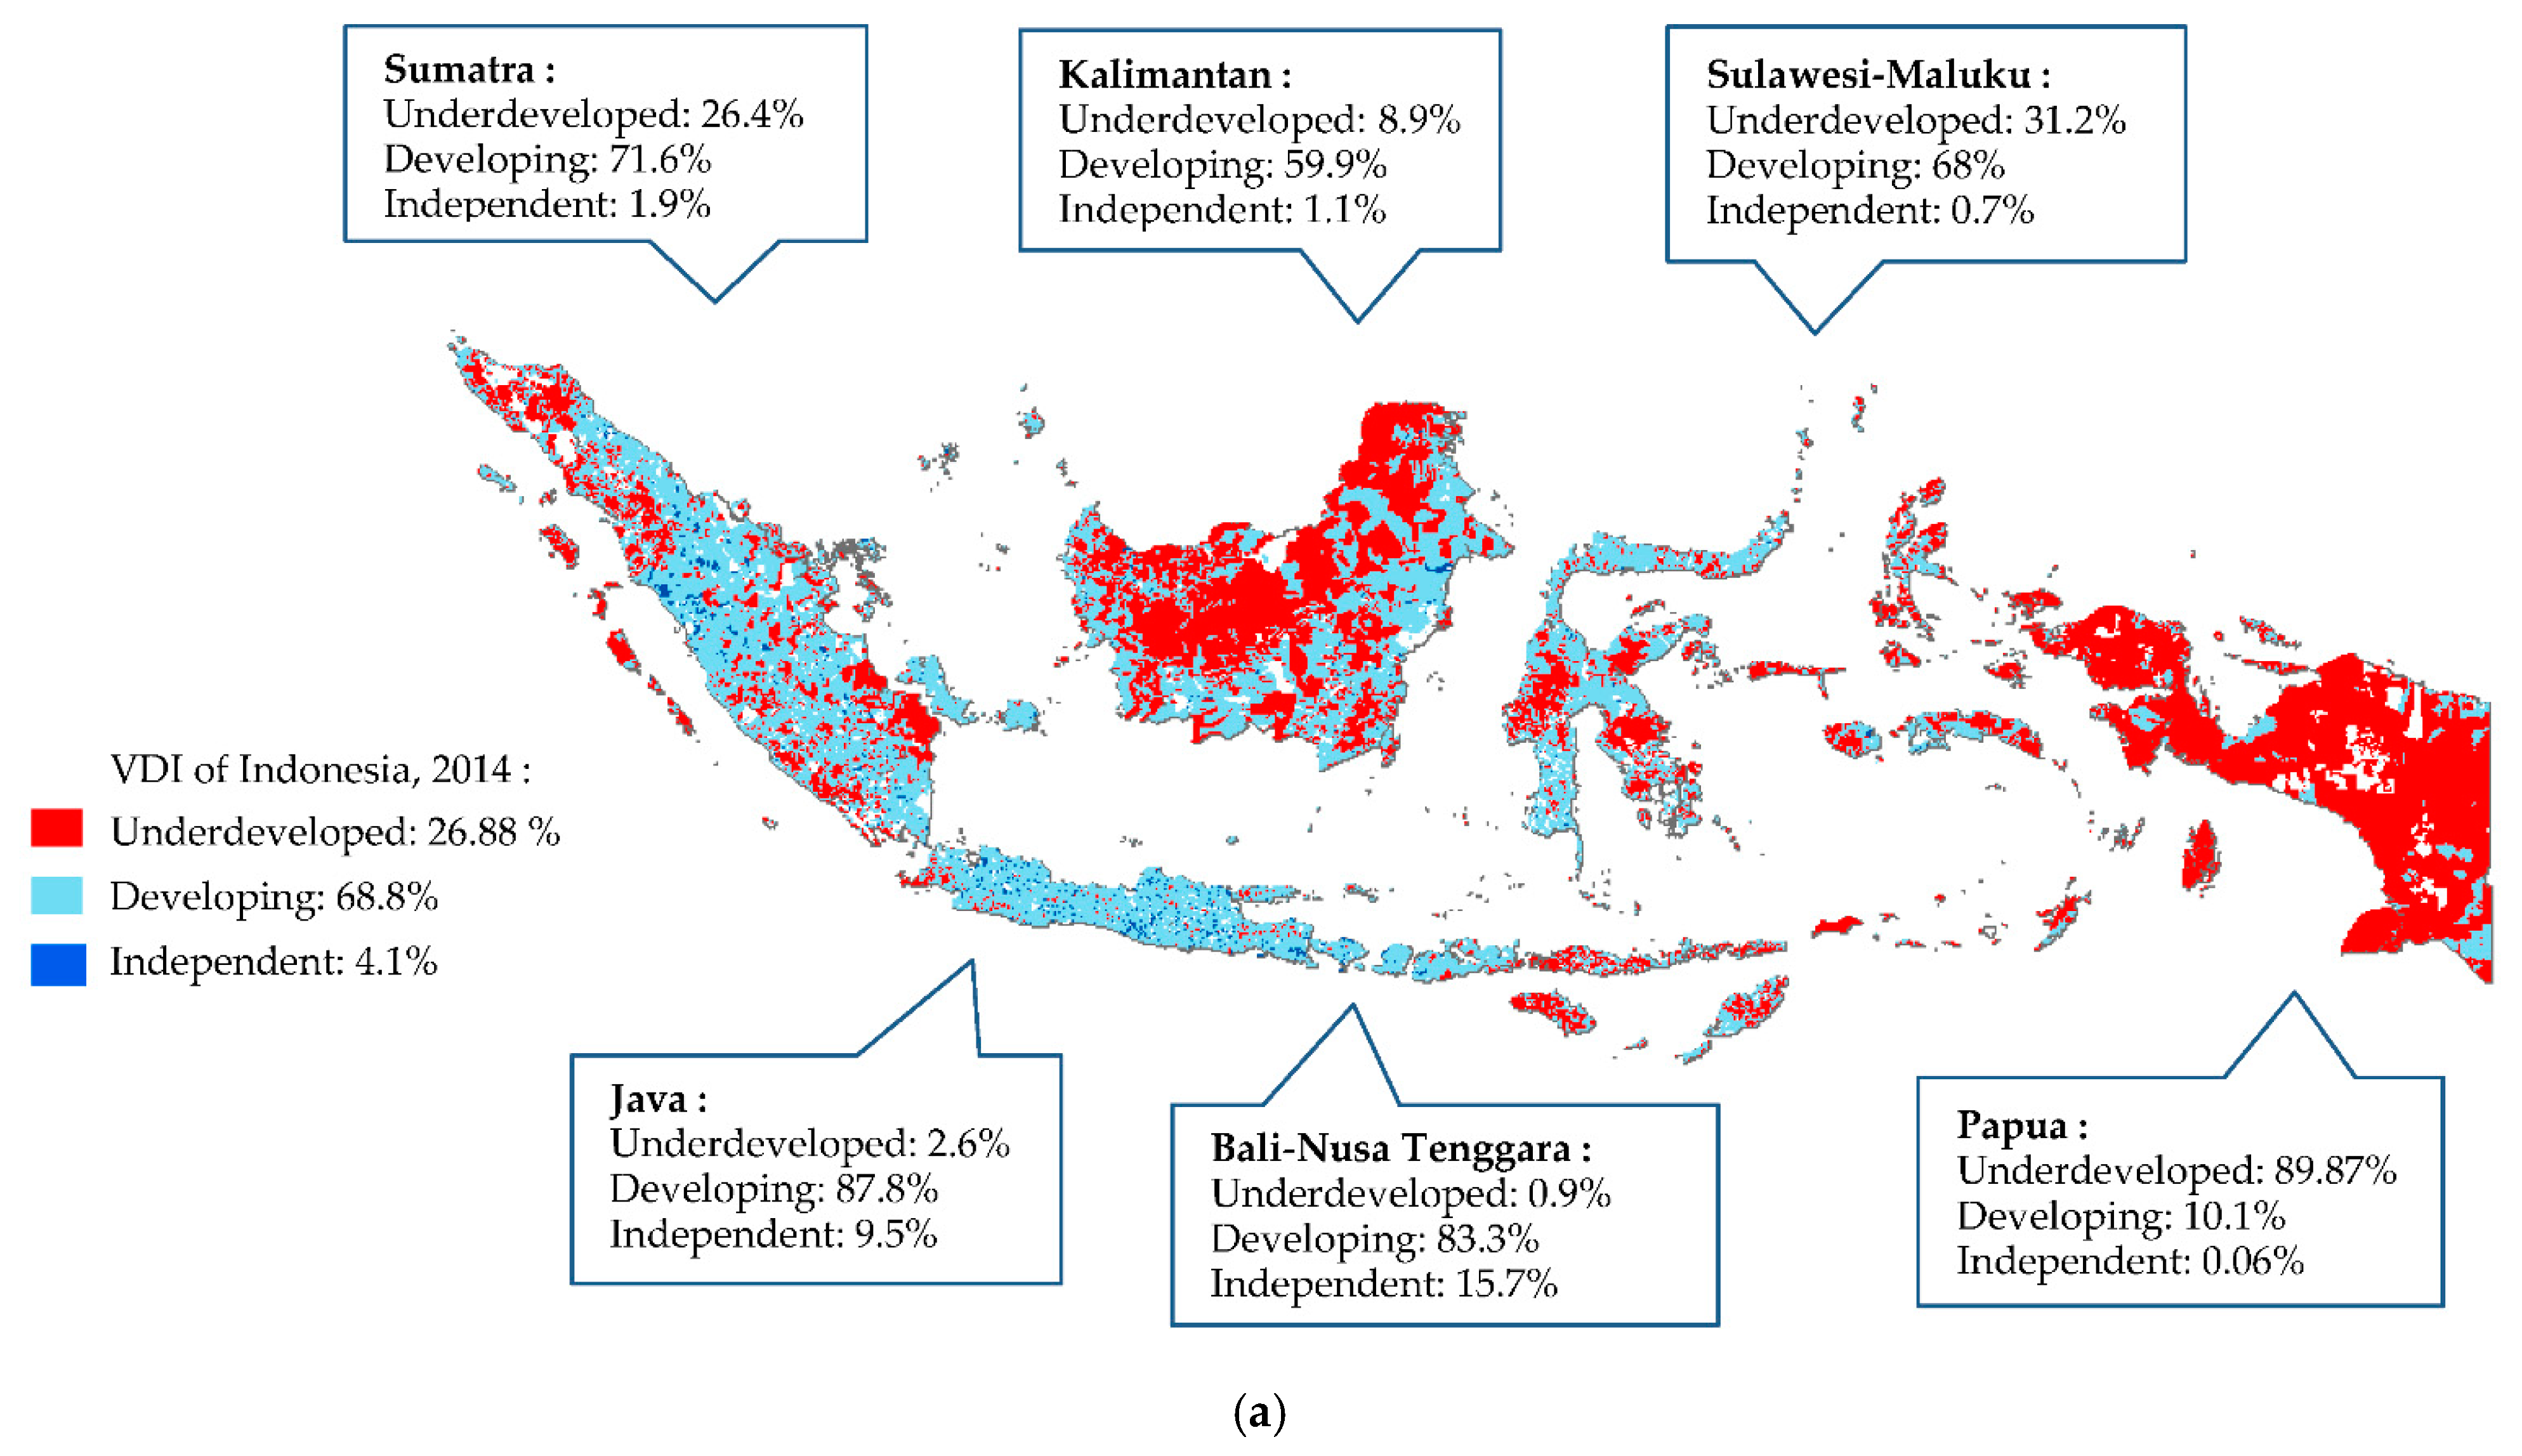
| 2014 | 19,809 | 51,003 | 2895 | 73,707 |
| (26.88) | (69.2) | (3.93) | (100.00) | |
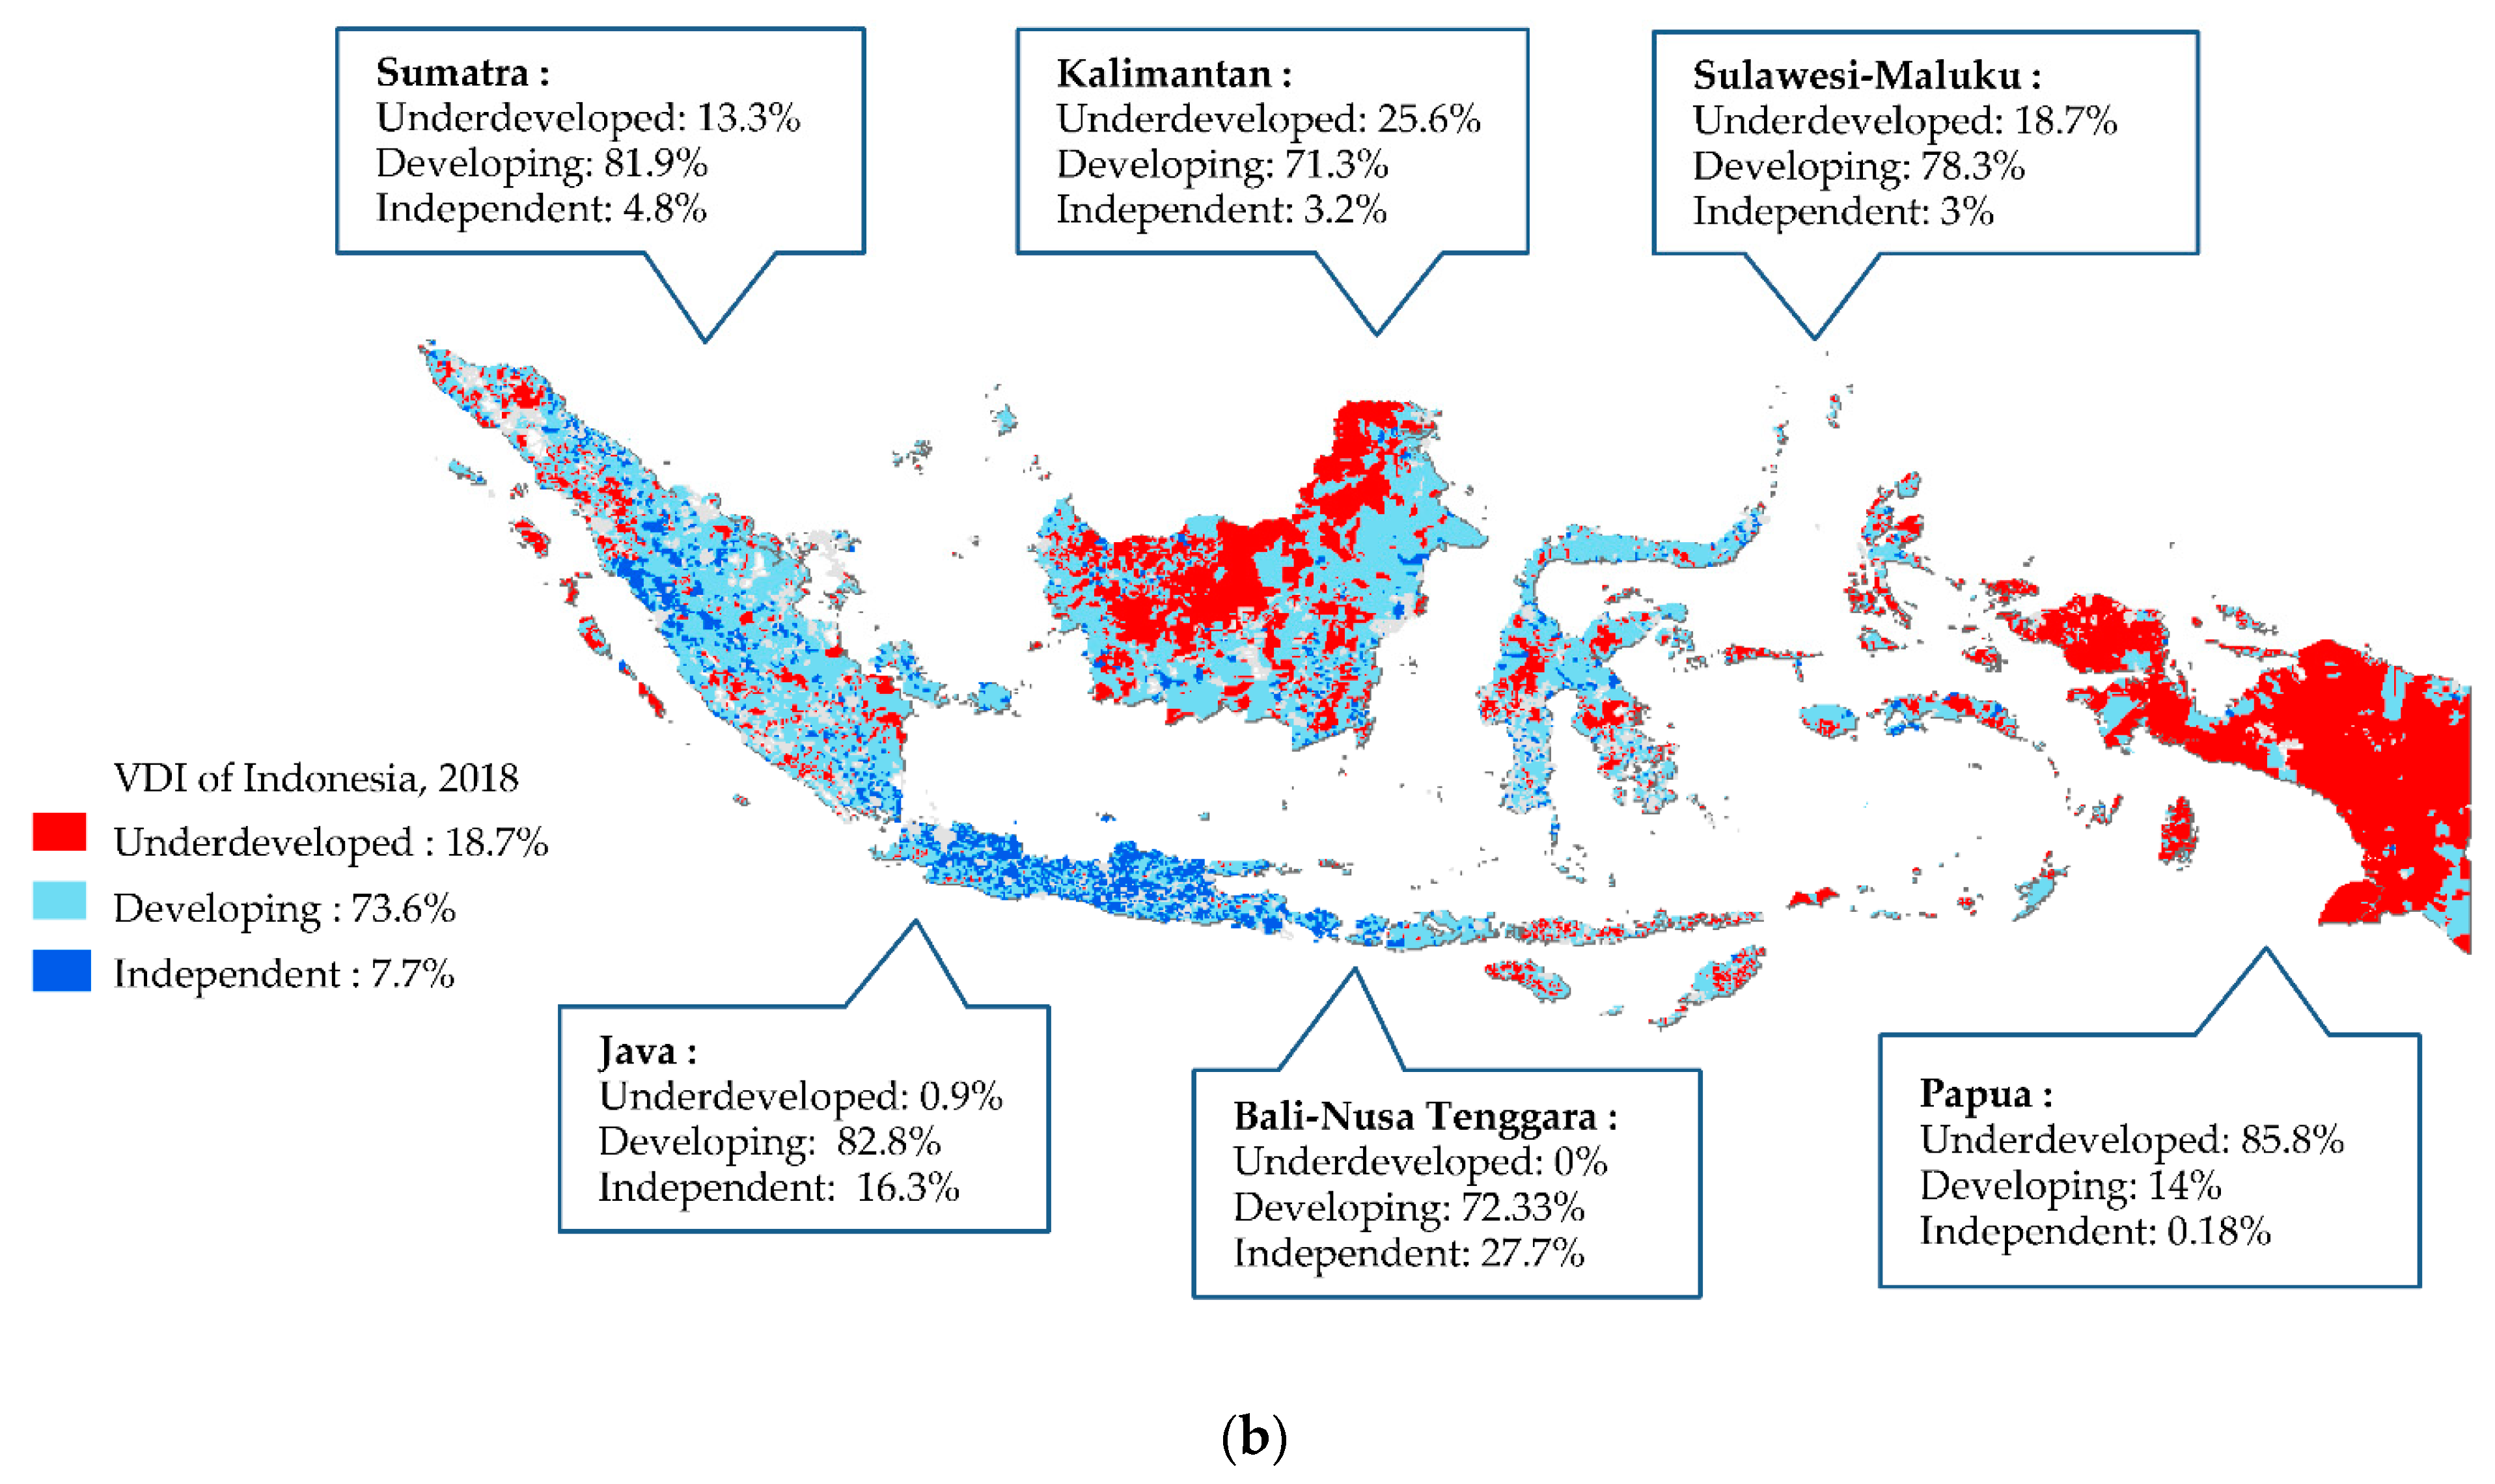
| 2018 | 14.461 | 55.369 | 5.606 | 75,436 |
| (19.17) | (73.4) | (7.43) | (100.00) |
| Goal | SDGs Agenda | Village Fund Priority in 2019 |
|---|---|---|
| 1 | No poverty |
|
| 2 | Zero hunger |
|
| 3 | Good health and well-being |
|
| 4 | Quality education |
|
| 5 | Gender equality |
|
| 6 | Clean water and sanitation | Supply of clean water and sanitation |
| 7 | Affordable and clean energy | Construction and development of fundamental infrastructure for energy development |
| 8 | Decent work and economic growth |
|
| 9 | Industry, innovation, and infrastructure | Village infrastructure procurement, building, development, and maintenance in compliance with village authority |
| 10 | Reduced inequalities | Increase in non-agricultural economic business employment |
| 11 | Sustainable cities and communities | Transportation and the environment |
| 12 | Responsible consumption and production |
|
| 13 | Climate action | - |
| 14 | Life below water | - |
| 15 | Life on land |
|
| 16 | Peace, justice, and strong institutions |
|
| 17 | Partnership for the goals | - |
| Variable | Before Village Fund Issued | After Village Fund Issued | ||||
|---|---|---|---|---|---|---|
| Obs | Mean | Std. Dev. | Obs | Mean | Std. Dev. | |
| ALI | 330,277 | 0.206 | 0.51 | 394,975 | 0.33 | 0.54 |
| Area size (km2) | 398,160 | 53.585 | 150.75 | 444,317 | 50.50 | 143.90 |
| Elevation (m) | 398,160 | 504.798 | 698.79 | 444,317 | 527.83 | 717.43 |
| Ruggedness Index | 398,160 | 37.138 | 34.91 | 444,317 | 38.64 | 35.41 |
| Temperature (°C) | 334,553 | 28.250 | 4.41 | 370,851 | 28.06 | 4.44 |
| Topography | 398,160 | 0.59 | 0.49 | 444,317 | 0.59 | 0.49 |
| Dependent Variable: | Indonesia | West Indonesia | Central Indonesia | East Indonesia |
|---|---|---|---|---|
| Average Light Intensity (Natural Logarithm) | ||||
| PANEL A | ||||
| RD_Estimate | 1.159 *** | 0.947 *** | 1.384 *** | 1.537 *** |
| (0.014) | (0.020) | (0.022) | (0.022) | |
| Additional covariates | NO | NO | NO | NO |
| Observations | 725,252 | 303,136 | 196,238 | 225,878 |
| PANEL B | ||||
| RD_Estimate | 1.281 *** | 0.981 *** | 1.406 *** | 1.559 *** |
| (0.014) | (0.022) | (0.023) | (0.024) | |
| Additional covariates | YES | YES | YES | YES |
| Observations | 616,552 | 245,915 | 180,442 | 190,195 |
| Variable | Mean of | Diff-in-Means | Fisherian | Number of Observation | ||
|---|---|---|---|---|---|---|
| Controls | Treated | Statistics | p-Value | Controls | Treated | |
| Area | 54.794 | 51.675 | −3.119 | 0.076 | 398,160 | 444,317 |
| Elevation | 540.770 | 540.016 | −0.754 | 0.937 | 398,160 | 444,317 |
| Ruggedness | 38.139 | 38.971 | 0.833 | 0.030 | 398,160 | 444,317 |
| Temperature | 27.331 | 27.366 | 0.035 | 0.505 | 334,553 | 370,851 |
| Topography | 0.578 | 0.575 | −0.004 | 0.478 | 398,160 | 444,317 |
| Polynomial Order | 2014–2018 | 2015–2019 |
|---|---|---|
| One | 0.014 *** | 0.145 *** |
| (0.004) | (0.004) | |
| Two | 0.091 *** | −0.081 *** |
| (0.004) | (0.004) | |
| Three | −0.114 *** | 0.109 *** |
| (0.005) | (0.005) | |
| Four | 0.039 *** | 0.065 *** |
| (0.005) | (0.005) | |
| Five | 0.066 *** | 0.135 *** |
| (0.005) | (0.005) | |
| Six | 0.155 *** | 0.222 *** |
| (0.006) | (0.005) | |
| Seven | 0.153 *** | 0.221 *** |
| (0.006) | (0.005) | |
| Eight | 0.292 *** | 0.248 *** |
| (0.006) | (0.005) | |
| Nine | 0.326 *** | 0.242 *** |
| (0.006) | (0.005) | |
| Ten | 0.362 *** | 0.238 *** |
| (0.006) | (0.005) | |
| Observations | 501,018 | 536,220 |
Publisher’s Note: MDPI stays neutral with regard to jurisdictional claims in published maps and institutional affiliations. |
© 2022 by the authors. Licensee MDPI, Basel, Switzerland. This article is an open access article distributed under the terms and conditions of the Creative Commons Attribution (CC BY) license (https://creativecommons.org/licenses/by/4.0/).
Share and Cite
Hartojo, N.; Ikhsan, M.; Dartanto, T.; Sumarto, S. A Growing Light in the Lagging Region in Indonesia: The Impact of Village Fund on Rural Economic Growth. Economies 2022, 10, 217. https://0-doi-org.brum.beds.ac.uk/10.3390/economies10090217
Hartojo N, Ikhsan M, Dartanto T, Sumarto S. A Growing Light in the Lagging Region in Indonesia: The Impact of Village Fund on Rural Economic Growth. Economies. 2022; 10(9):217. https://0-doi-org.brum.beds.ac.uk/10.3390/economies10090217
Chicago/Turabian StyleHartojo, Nurlatifah, Mohamad Ikhsan, Teguh Dartanto, and Sudarno Sumarto. 2022. "A Growing Light in the Lagging Region in Indonesia: The Impact of Village Fund on Rural Economic Growth" Economies 10, no. 9: 217. https://0-doi-org.brum.beds.ac.uk/10.3390/economies10090217