

Does Urban Digital Construction Promote Economic Growth? Evidence from China

1
Business School, University of Shanghai for Science and Technology, Shanghai 200093, China
2
Antai College of Economics and Management, Shanghai Jiao Tong University, Shanghai 200030, China
*
Authors to whom correspondence should be addressed.
Economies 2024, 12(3), 59; https://0-doi-org.brum.beds.ac.uk/10.3390/economies12030059
Submission received: 26 December 2023
/
Revised: 16 February 2024
/
Accepted: 27 February 2024
/
Published: 29 February 2024
(This article belongs to the Special Issue Economic Development in the Digital Economy Era)
Abstract
:In order to explore the causal relationship between the level of urban digital construction and urban economic growth, this paper takes 280 cities in China as the research object and constructs a comprehensive indicator evaluation system covering digital infrastructure, overall economic level, innovation development level, digital industry development status, and ecological environment conditions. Using the entropy method to weigh various indicators, this paper has obtained the evaluation results of the digital construction level of each city from 2011 to 2021. Furthermore, a panel data regression model is used to empirically analyze the impact of urban digital construction level on urban economic growth. The results show that for every 1% increase in the level of urban digital construction, the GDP will increase by 0.974. Through the above research, we hope to further enrich the theoretical and empirical research in the field of the digital economy, provide a scientific and reasonable method for quantitatively evaluating the level of urban digital construction, and provide decision-making references for improving the level of urban digital construction and promoting sustainable urban development.
1. Introduction
The digital economy represents a novel economic paradigm in human history, succeeding agriculture and industry (Laitsou et al. 2020; Williamson 2022; Yang et al. 2023d). In the course of social production, the digital economy places data resources as a crucial production factor, utilizing modern information networks for various socio-economic activities, continuously optimizing production efficiency, and enhancing development quality through the progressive advancement of information and communication technology (Allcott et al. 2022; Fernandes et al. 2023; Jemiluyi and Jeke 2023; Jensen 2007). Consequently, the digital economy not only profoundly alters the developmental patterns of traditional production processes but also exerts a far-reaching impact on various facets of the socio-economic domain (Beraja et al. 2023a; Cahyadi and Magda 2021; Karle et al. 2020; Loebbing 2022; Maresova et al. 2018). With the continual progress and widespread adoption of digital technologies, the digital economy has emerged as a key driver and strategic advantage for global economic development (Costinot and Werning 2023; Korgun and Hoti 2023; Mpofu 2022; Mpofu and Mhlanga 2022).
China stands as one of the global leaders in digital economy development, boasting robust digital infrastructure and policy environments, dynamic digital enterprises and innovators (Supari and Anton 2022), and a massive user base (Maresova et al. 2018; Travkina et al. 2022; Yang et al. 2023c). According to statistics from the China Cyberspace Administration, the total volume of China’s digital economy reached CNY 50.2 trillion in 2022, constituting 41.5% of the nation’s GDP. China’s digital economy not only holds a leading position globally in terms of scale but also continuously elevates its quality, giving rise to a cadre of internationally competitive and influential digital platforms, products, and services (Chen and Yang 2023; Karle et al. 2020; Travkina et al. 2022).
Urban areas serve as crucial carriers and settings for the development of the digital economy, representing primary arenas for the application and innovation of digital technologies (Liu et al. 2023; Ogujiuba and Mngometulu 2022). The level of urban digitalization reflects a city’s capacity and effectiveness in leveraging digital technologies to drive economic and social development. It also influences a city’s competitiveness and attractiveness on regional, national, and global scales (Einav et al. 2018; Lefatsa et al. 2021; Li and Camerer 2022). Therefore, evaluating the level of digitalization in Chinese cities and its impact on urban economic development holds significant importance for uncovering patterns in urban digital development, promoting digital transformation and upgrading, and enhancing overall urban capabilities.
However, there is currently a lack of a systematic and scientific evaluation framework for the level of digitalization in Chinese cities. Existing studies have mostly focused on singular aspects or domains of the digital economy (Ren et al. 2023; Yang et al. 2022), failing to comprehensively capture the multidimensional, multilevel, and multifaceted characteristics and effects of urban digitalization. Additionally, the relationship between the level of urban digitalization and urban economic development lacks sufficient theoretical and empirical support, making it challenging to reveal the mechanisms and extent of the impact of urban digitalization on urban economic growth.
Therefore, this paper first establishes a comprehensive evaluation index system for the level of digitalization in Chinese cities. Employing the entropy weighting method, we evaluate the digitalization level of 280 cities in China from 2011 to 2021 across five dimensions: urban digital infrastructure, overall economic level, innovation development level, digital industry development status, and ecological environment conditions. Building upon this foundation, a measurement model for urban digitalization levels is further developed for empirical analysis, aiming to explore the actual impact of the level of urban digital construction on economic growth. Our research findings indicate that for every 1% increase in the level of urban digitalization, the Gross Domestic Product (GDP) rises by 0.974 percentage points.
Specifically, this paper contributes in the following ways: By constructing a comprehensive evaluation index system for urban digitalization that covers five dimensions: digital infrastructure, overall economic level, innovation development level, digital industry development status, and ecological environment conditions. The application of the entropy weighting method to these indicators enriches theoretical research in the field of digital economic development. Utilizing data from 280 Chinese cities during the period 2011–2021, this paper calculates scores for each city across the five dimensions using the established index system. The results provide a summary of the achievements in digitalization for each city, offering a quantitative basis for further enhancing digitalization levels and a timely narrowing of the “digital divide” between different cities. Through empirical analysis, this paper quantifies the impact of digitalization on economic growth. The results show a significant positive effect of urban digitalization on its own economic growth. Through a series of robustness tests, this result is proven reliable, contributing not only to empirical research in the field of digital economic development but also to adding new content to the literature of urban economics.
This paper comprises six sections. Section 2 reviews the relevant literature. Section 3 constructs the index system and comprehensively evaluates the digitalization levels of various cities. Section 4 and Section 5 empirically analyze the impact of urban digitalization on economic growth. Section 6 concludes the entire paper and proposes policy recommendations.
2. Literature Review
2.1. Urban Digital Construction
The concept of urban digitalization emerged in the early 1980s. Scholars, focusing on urban development in France, introduced the concept of the “Wired City”, asserting that it represents a fundamental prototype that cities should embody under the digital economic paradigm. In the Wired City, the government invests in digital infrastructure, continuously improving urban network construction and user terminals to achieve high-quality citywide communication. Building on this, the academic community explored the convenience of information brought about by urban networking, giving rise to the theory of “urban informatization” (Avgerou 1991; Knox and Castells 1995). This theory posits that modern information technologies, represented by network communication, will significantly reshape urban planning and layout, exerting profound effects on the future development of major cities worldwide. Subsequently, developed Western countries successively formulated and implemented digital development strategies centered on cities, such as the “Information Superhighway” (Kettinger 1994) and the “Digital Earth”. These strategies aimed to propel the overall digitization of the national economy through the digital transformation and development of major cities.
Considering the digital development strategies proposed by Western developed countries’ governments and academia, the core objective is to implement the informatization and digitization of the entire national economy at the city level, realizing urban informatization and digitization (Goloshchapova et al. 2023; Kettinger 1994; Maresova et al. 2018). Specifically, it involves applying information network technologies, predominantly represented by the Internet, and digital technologies to the daily production and life of cities (Chen et al. 2023; Marshall 2023). This integration allows various sectors of the urban economy to merge with digital elements, ultimately achieving comprehensive penetration of digital elements into urban construction and development. The goal is to promote the networked and digitally intelligent development of the entire city. In this process, the digital development strategies of Western countries consider the efficient and rational allocation of urban information resources as a fundamental prerequisite. They seek to promptly integrate existing technologies and the latest achievements of informatization and digitization into various aspects of urban production, consumption, distribution, and exchange. This approach aims to facilitate citizens’ lives, achieve sustained economic growth, and comprehensively upgrade digitization in areas such as urban economic development, ecological conservation, citizen living, and public services, ultimately realizing sustainable urban development (ElMassah and Mohieldin 2020; Goloshchapova et al. 2023; Veretennikova and Selezneva 2023).
2.2. Digital Technology in Urban Digital Construction
From a technological perspective, urban digital development strategies are rooted in digital information systems comprised of computers, databases, and urban communication networks. These strategies integrate advanced digital technologies of the time, such as broadband networks, satellite remote sensing and positioning systems, geographic information collection and analysis systems, and virtual reality, into urban construction (Graham 2002; Malecki 2003; Yang et al. 2022). With the continuous advancement of digital technology, emerging technologies like mobile internet, big data, blockchain, and artificial intelligence have been incorporated into urban digital development strategies. This integration not only transforms data elements in the urban construction process but also further promotes digital technology innovation through urban development (Acemoglu and Restrepo 2022; Calvano et al. 2020). In the fields of planning and public services, urban digital development strategies provide a quantitative basis for decision-making in city management through the collection and detection of basic information, enhancing the scientific nature and operational efficiency of urban decision-making through technological means (Masik et al. 2021; Nochta et al. 2021).
Domestic scholars have also conducted in-depth research on digital technology in urban digital construction (Deng et al. 2022; Wang et al. 2022; Yang et al. 2024; Zhang et al. 2022b). They propose that to achieve digital transformation and development, cities should first improve their digital infrastructure, and then increase investment in research and development and application in the digital field. Constructing a unified and comprehensive urban informatization platform, and achieving digital integration in various fields, such as economy, trade, finance, shipping, technology, and culture, through efficient and secure digital entry points (Liu et al. 2023; Yang et al. 2023c, 2023d). Other scholars point out that in the process of urban digital development, it is crucial to deeply understand the key points of the combination of digital technology and the inherent characteristics of the city. This promotes the comprehensive and in-depth integration of digital technology into various areas of urban development, construction, public services, ecological protection, and factory utilization, ensuring that residents can benefit from digital welfare, and ultimately achieving sustainable urban development through digitization.
2.3. The Level of Urban Digital Construction and Economic Growth
The measurement methods and indicators of the level of urban digital construction are an important basis for research on the urban digital economy. In recent years, domestic and foreign scholars have proposed a variety of measurement methods and indicators for urban digitalization levels from different dimensions and perspectives, mainly including:
- Measurement dimensions and indicators of the level of urban digital construction. Generally speaking, scholars have examined the level of urban digital construction from aspects such as digital infrastructure (Cong et al. 2022; Ndubuisi et al. 2021), digital economy (Popkova and Gulzat 2020; Wang et al. 2022), digital government (Castro and Lopes 2022; Lin et al. 2021; Pedrosa et al. 2020), and digital ecology (Pauliuk et al. 2022; Peng and Tao 2022). Meanwhile, indicators involving digital innovation elements (Cheng and Wang 2022; Ramdani et al. 2022), digital infrastructure (Lan and Zhu 2023; Sotolongo 2023), core digital industries (Ariffin and Ahmad 2021; Zhu and Chen 2022), and digital convergence applications (Borowiecki et al. 2021; Mitrović 2020) have also been considered. These indicators have both commonalities and differences, reflecting the multidimensionality and complexity of urban digital construction.
- Measurement methods and technologies for urban digital construction. Scholars have used different measurement methods and techniques, such as the index method (Alderete 2020; Ren et al. 2022), factor analysis method (García-Vandewalle García et al. 2023; Zhang et al. 2022c), cluster analysis method (Xia et al. 2022; Zheng et al. 2020), structural equation model (Nicolas et al. 2020; Wang et al. 2021), data envelopment analysis method (Cao et al. 2022; Kutty et al. 2022), gray correlation analysis method (Sun and Zhang 2020), etc. In addition, some studies have also tried to use new technologies, such as big data (Atitallah et al. 2020; Zhang et al. 2022a), cloud computing (Jiang 2020; Kaginalkar et al. 2021), and machine learning (Austin et al. 2020; Li et al. 2022; Zekić-Sušac et al. 2021), to improve the measurement accuracy and real-time performance of urban digital construction.
- The relationship between urban digital construction and economic growth. A number of scholars have discussed the correlation or causality between the level of urban digital construction and economic growth, arguing that the former has positive effects on the latter (Guo et al. 2023; Zhu and Chen 2022). At the same time, other scholars have pointed out that the relationship between urban digital construction and economic growth is not a simple linear relationship (Huang et al. 2023; Liu et al. 2022).
General Secretary Xi Jinping of China places a high priority on the digital economy, explicitly urging in the 20th Central Committee report to “accelerate the development of the digital economy and promote deep integration between the digital economy and the real economy”. Nationwide, there has been a warm response to the important directives of the General Secretary, with active participation in urban digital transformation and a continuous enhancement of the diversity of digital cities based on their unique characteristics. Scholars have studied the development of the digital economy in key cities, such as Beijing, Shanghai, Guangzhou, Shenzhen, and Hangzhou, and believe that each city has distinctive characteristics in digital transformation. For instance, Beijing aggregates a large amount of high-quality high-end data resources, Shanghai possesses advanced digital industries and a superior business environment, Guangzhou has significant potential in industrial digitization, Shenzhen has advantages in the construction of new smart cities, and Hangzhou is home to leading enterprises in the Chinese digital industry. As long as these key cities fully leverage their advantages and closely integrate traditional industries with digital industries the prospects for their digital development are promising (Yang et al. 2023a).
According to research by Chinese scholars, the core of building digital cities is, in fact, a large-scale system engineering that covers the entire process of urban informatization. It involves every aspect of city operation, not only including economic and industrial digitization, digital governance, digitalization of people’s livelihoods, medical and health informatization, digital ecology, and digital government but also impacting the comprehensive development of the entire city. It is of great significance for regional and national development, contributing to enhancing urban competitiveness and sustainability. The digital transformation of cities is not only an essential part of digital government governance and construction but also a consideration in various aspects such as social production and exchange, ecological environment, etc. Digitalization is a key factor in economic digital transformation. Only through the collection, integration, and application of data, continuous innovation in technological development, and improvement of comprehensive processing capabilities can it be integrated into various aspects of economic operation, service optimization, and industrial structure upgrading, taking China’s economy to new development heights. In the process of government digital transformation, digital analysis is a key point. Digital governance requires the government to assess the implementation effects of policies and citizens’ opinions and suggestions through data analysis, continuously accept feedback, and promptly improve various policies, allowing the government to better serve the vast population. Additionally, the digital transformation of cities should be human-centered, a key focus mentioned in the current digital strategies of most countries or regions (Allcott et al. 2020; Barwick et al. 2023). The ultimate goal of urban digital construction is to benefit citizens, ensuring peaceful and progressive social development. Therefore, urban digital construction needs to prioritize citizen welfare, providing more efficient public services to the general public through digital applications, digital government, and other channels.
The above domestic and international research provides a comprehensive analysis of the strengths and weaknesses of digital economic development, summarizing experiences in national and urban digital development. However, there are still some shortcomings: On one hand, existing research tends to lean towards qualitative analysis, lacking in-depth quantitative analysis and cross-sectional comparisons of specific countries and cities in building a digital economy. On the other hand, while many scholars, especially those focusing on China’s advanced cities, have paid considerable attention to the recent digital construction and transformation, the research often revolves around digital technology and draws on international experiences. It fails to tightly integrate theoretical research, quantitative analysis, and urban characteristics, leading to a lack of a comprehensive evaluation of China’s urban digital economic development level.
To address these gaps, our research strives for a more balanced approach by incorporating both evaluation index systems and empirical analysis. Through the above efforts, we strive to further arouse interest in the digital economy among readers and related academic journals around the world. At present, the digital economy has become an important driving force and strategic advantage for global economic development. Countries are actively promoting digital transformation and upgrading, and are exploring the deep integration of digital technology with economic and social development. As one of the global leaders in the digital economy, China has a strong digital infrastructure and policy environment, active digital enterprises and innovators, and a large user group. Its experience and results in urban digital construction provide a good example and reference for the world. Therefore, the research content of this paper can arouse the interest of readers and related academic journals around the world, especially those who pay attention to the development trends and dynamics of the digital economy, seek digital development opportunities and challenges, or hope to cooperate and communicate with China in the digital field. By providing them with valuable information and perspectives, we hope to further enhance their understanding of China’s urban digital construction and promote international digital economic cooperation and exchanges.
3. Methodology
Building upon the previous analysis, this section will first establish the evaluation index system for the level of urban digital construction. Subsequently, the entropy weight method will be applied to assign weights to each indicator, thereby deriving a comprehensive score for the evaluation of the level of digital construction in various cities across China.
3.1. Factors Influencing the Level of Urban Digital Construction
When assessing the level of urban digital construction, it is crucial to base the evaluation on the digital development goals of the city, considering various factors such as the foundational elements of urban digital development, the objective conditions and subjective goals of the construction entities, and the information required to construct the evaluation system. Specifically, this includes the following: in the process of constructing the evaluation index system for the level of urban digital construction, the first consideration should be given to various foundational elements of building a digital city. Given the multitude of basic elements used to assess the level of urban digital construction, this paper, based on the actual situation of Chinese cities, has chosen the most relevant core foundational indicators. In the evaluation of the level of urban digital construction, the objective conditions and subjective goals of the construction entities are additional crucial factors in constructing the evaluation index system. This mainly includes the digital development level of the construction entities, digital output, and goals for the development of the digital industry. When constructing the evaluation index system for urban digital construction, attention should be given to the theoretical validity of the selected indicators and the various data information that needs to be collected and organized. Adjustments and improvements should be made based on actual circumstances, continuously refining and perfecting the index system.
3.1.1. Primary Indicators
Based on the principles of constructing the evaluation index system (detailed principles in Appendix A) and a thorough analysis of the theory and practice of urban digitization, this paper determines five primary indicators for the urban digital construction index system: urban digital infrastructure, overall economic level, innovation development level, digital industry development status, and ecological environment status.
Urban Digital Infrastructure: In the process of urban digital transformation, digital infrastructure is an essential element. It serves as the material carrier for economic activities in the international digital economy hub and is a necessary condition for its rapid development (Chen et al. 2023; Graham 2002; Masik et al. 2021; Nochta et al. 2021). Therefore, digital infrastructure, including networks, communication facilities, and digital platforms, has become a prerequisite for supporting the construction of digital cities.
Overall Economic Level of the City: The overall economic level is a crucial reflection of the city’s comprehensive strength and is closely tied to the process of building a digital city (Ali 2017; Li and Camerer 2022). As China enters the high-quality development stage, the continuously improving overall economic level of cities provides robust support and guarantees for digital construction. Conversely, digital construction can enhance the overall economic level by improving economic structures, operating modes, and development environments.
Innovation Development Level: As technological innovation becomes a national strategy, a city’s innovation capability has become a vital aspect of digital development (Beraja et al. 2023b; Wang et al. 2022; Zhang et al. 2022b). In a report on digital economic development by the State Council, independent innovation in key digital technologies is emphasized as an inexhaustible driving force for urban digital construction and digital economic development. Therefore, the innovation development level is considered a primary indicator to measure the progress of a city’s digital construction.
Digital Industry Development Status: The development status of the digital industry is a crucial indicator of the level of urban digital construction and a driving force for digital economic development (Deng et al. 2022; Hills et al. 2019; Jensen 2007; Mpofu and Mhlanga 2022). Currently, the digital industry has become a strategic pillar industry of the national economy, exerting a strong driving force on various industries. Assessing the development of the digital industry as a primary indicator can effectively measure the key achievements in digital city construction.
Ecological Environment Status: General Secretary Xi Jinping has profoundly revealed the inherent mechanism and dialectical relationship between technology and the environment, emphasizing the need to rely on technological innovation to solve green development problems. Improving the urban ecological environment and promoting green development will create enormous development space for urban construction and generate numerous new economic growth points (Deng et al. 2022; Wang et al. 2022; Zhang et al. 2022b). Therefore, this paper considers the ecological environment status as a primary indicator for evaluating digital city construction.
3.1.2. Secondary Indicators
Based on the practical experience of digital city construction in China, this paper conducts a detailed analysis of the connotations of the primary indicators mentioned above. Following the construction principles mentioned earlier, specific secondary indicators are selected for each primary indicator.
Under the Primary Indicator of Urban Digital Infrastructure: Telecom Service Revenue (), Number of Mobile Phone Users (), and Number of Internet Broadband Access Users (). These three secondary indicators measure the fundamental and pioneering industries supporting and reflecting the development of the digital economy. A high level of digital development in a city will require telecom operators to provide more services to support its development, and it is precisely because of demand that telecom operators will implement more telecom services in a city, so the telecom operators in a city with a higher level of digital development will provide more services and generate more telecom revenue (Harwit 2004). Judging from the actual situation in China, areas with higher levels of digital development generally have a wider range of telecom services, which means that their telecom income will be higher than in other cities (Peng and Dan 2023). Therefore, a city’s telecom service revenue can reflect the size and activity of the city’s digital service market, thereby measuring the city’s digital construction level. Moreover, the number of mobile phone users and internet broadband access users reflects the development status of digital platforms, portraying the level of informatization in the city.
Under the Primary Indicator of Overall Economic Level of the City: Per Capita Regional Gross Domestic Product (), Regional Gross Domestic Product Growth Rate (), and Proportion of Urban Construction Land to City Area (). These three secondary indicators reflect the economic development achievements and speed of the city, representing the overall economic level of the city in terms of quantity and quality. The proportion of urban construction land to city area also reflects the city’s economic development level from the perspective of urbanization.
As far as the “Proportion of Urban Construction Land to City Area” indicator is concerned, this indicator reflects the city’s land utilization rate (Han et al. 2020). If the indicator is higher, it means that the scale, density, and shape of the city are more conducive to the spread and application of digital technology and the construction and maintenance of digital infrastructure, thus providing better physical conditions for urban digitalization. In addition, the higher the indicator, the more concentrated the urban population, industries, and services are, the stronger the economic vitality and social demand, and the stronger the demand for and consumption of digital technology, digital industry, and digital services (Chen et al. 2020; Xia et al. 2020). Finally, this indicator also reflects the challenges faced by urban governance. The higher the indicator, the more likely the city will hope to improve its governance efficiency and quality through the improvement of the digitalization level. Therefore, it will be more interested in digital technology, digital industry, and digital services (Peng et al. 2022).
Under the Primary Indicator of Innovation Development Level: Innovation Index Calculated Based on the Number of Invention Patents (), and Expenditure on Science and Technology (). The number of invention patents is an important indicator for measuring a city’s innovation capability, while expenditure on science and technology reflects the government’s investment in stimulating innovation. The total GDPs of major Chinese cities such as Beijing and Shanghai are very high. Although their expenditure on science and technology is very high, the relative proportion of GDP spent in these areas is still small, and the relative ratio may not accurately characterize the real impact of science and technology spending. Therefore, here we do not use relative indicators such as the ratio of the expenditure on science and technology to the city’s GDP, etc.
Under the Primary Indicator of Digital Industry Development Status: Proportion of Employees in the Tertiary Industry (), Number of Employees in the Information Transmission, Software, and Information Technology Services Industry (), Proportion of the Tertiary Industry to GDP (), and Peking University Digital Inclusive Finance Index (). These secondary indicators are selected as there is currently no specific indicator for the digital economic industry in the statistical data from official sources such as the National Bureau of Statistics and various yearbooks. The Peking University Digital Inclusive Finance Index provides a convenient channel for evaluating the development of the digital economy.
Under the Primary Indicator of Ecological Environment Status: Greening Coverage Rate of the Built-up Area (), Number of Green Patents Applied (), Carbon Dioxide Emissions (), and Industrial Sulfur Dioxide Emissions (). These four secondary indicators reflect the city’s ecological greening level, the combination of digital technology and green development, and the city’s low-carbon development level in terms of carbon dioxide emissions and industrial sulfur dioxide emissions. Although the relationship between urban digital construction and emission is not simple, in general, the two aspects are related and therefore influence the status of the ecological environment. Positive views are also held on the relationship between the two (Lee et al. 2022; Lu et al. 2021; Qi et al. 2022; Wu et al. 2023; Yang et al. 2023b). As for , by using digital technology combined with environmental informatization to detect the city’s ecosystem, the city’s environmental management can be accurately achieved. The development of this form has not yet been specifically reflected in China’s urban data, but the development of smart city construction can be reflected through other indicators. The greening coverage of built-up areas reflects the greening level of the city and reflects the green development of the city. It is a key factor that needs to be considered for digital development and becoming a smart city.
3.2. Construction of the Evaluation Index System
3.2.1. Indicator System
This article comprehensively considers the current state of digital economic development in China, drawing on both domestic and international experiences in constructing indicator systems. Simultaneously, based on the essence of digital cities and existing research outcomes, this article involved the selection of indicators from five dimensions: urban digital infrastructure, overall economic level, innovation and development level, digital industry development status, and urban ecological environment conditions. The result is the construction of the Urban Digitalization Development Evaluation Indicator System, as presented in Table 1.
3.2.2. Data Sources
After calculating the objective weights of various indicators using the entropy method (see Appendix B), this study further computes the comprehensive evaluation scores for the level of digitalization development in various cities in China (see Table A1). Considering the continuity of the data and based on academic conventions, the research focuses on cities in mainland China during the period from 2011 to 2021 (excluding Hong Kong, the Macau Special Administrative Region, and Taiwan Province).
The data for each city’s indicators during the research period are sourced from official statistical data on China’s urban digitalization process. These include the annual “China Statistical Yearbook”, “China City Statistical Yearbook”, and “China Science and Technology Statistical Yearbook”, as well as various provincial and municipal statistical yearbooks. Additionally, this study refers to digital economy research reports compiled and released by institutions such as the National Internet Information Office, the Informationization Research Department of the National Information Center, and the China Academy of Information and Communications Technology. From these sources, data on relevant indicators were collected for 297 cities nationwide.
For the initially obtained indicator data, careful screening was conducted. Considering that this study primarily investigates the development level of China’s urban digital economy, cities with fewer than 2 years of data or those with discontinued or unreported statistics, including 17 cities such as Bijie City, Bozhou City, and Qamdo City, were excluded. Regarding the remaining data with occasional missing values for certain indicators in individual years, interpolation was employed to fit the gaps. As a result, data on relevant indicators for 280 Chinese cities from 2011 to 2021 were obtained.
4. Results
4.1. Evaluation Results
Based on the aforementioned entropy method, this study first calculates the weights of various indicators, as shown in Table 2:
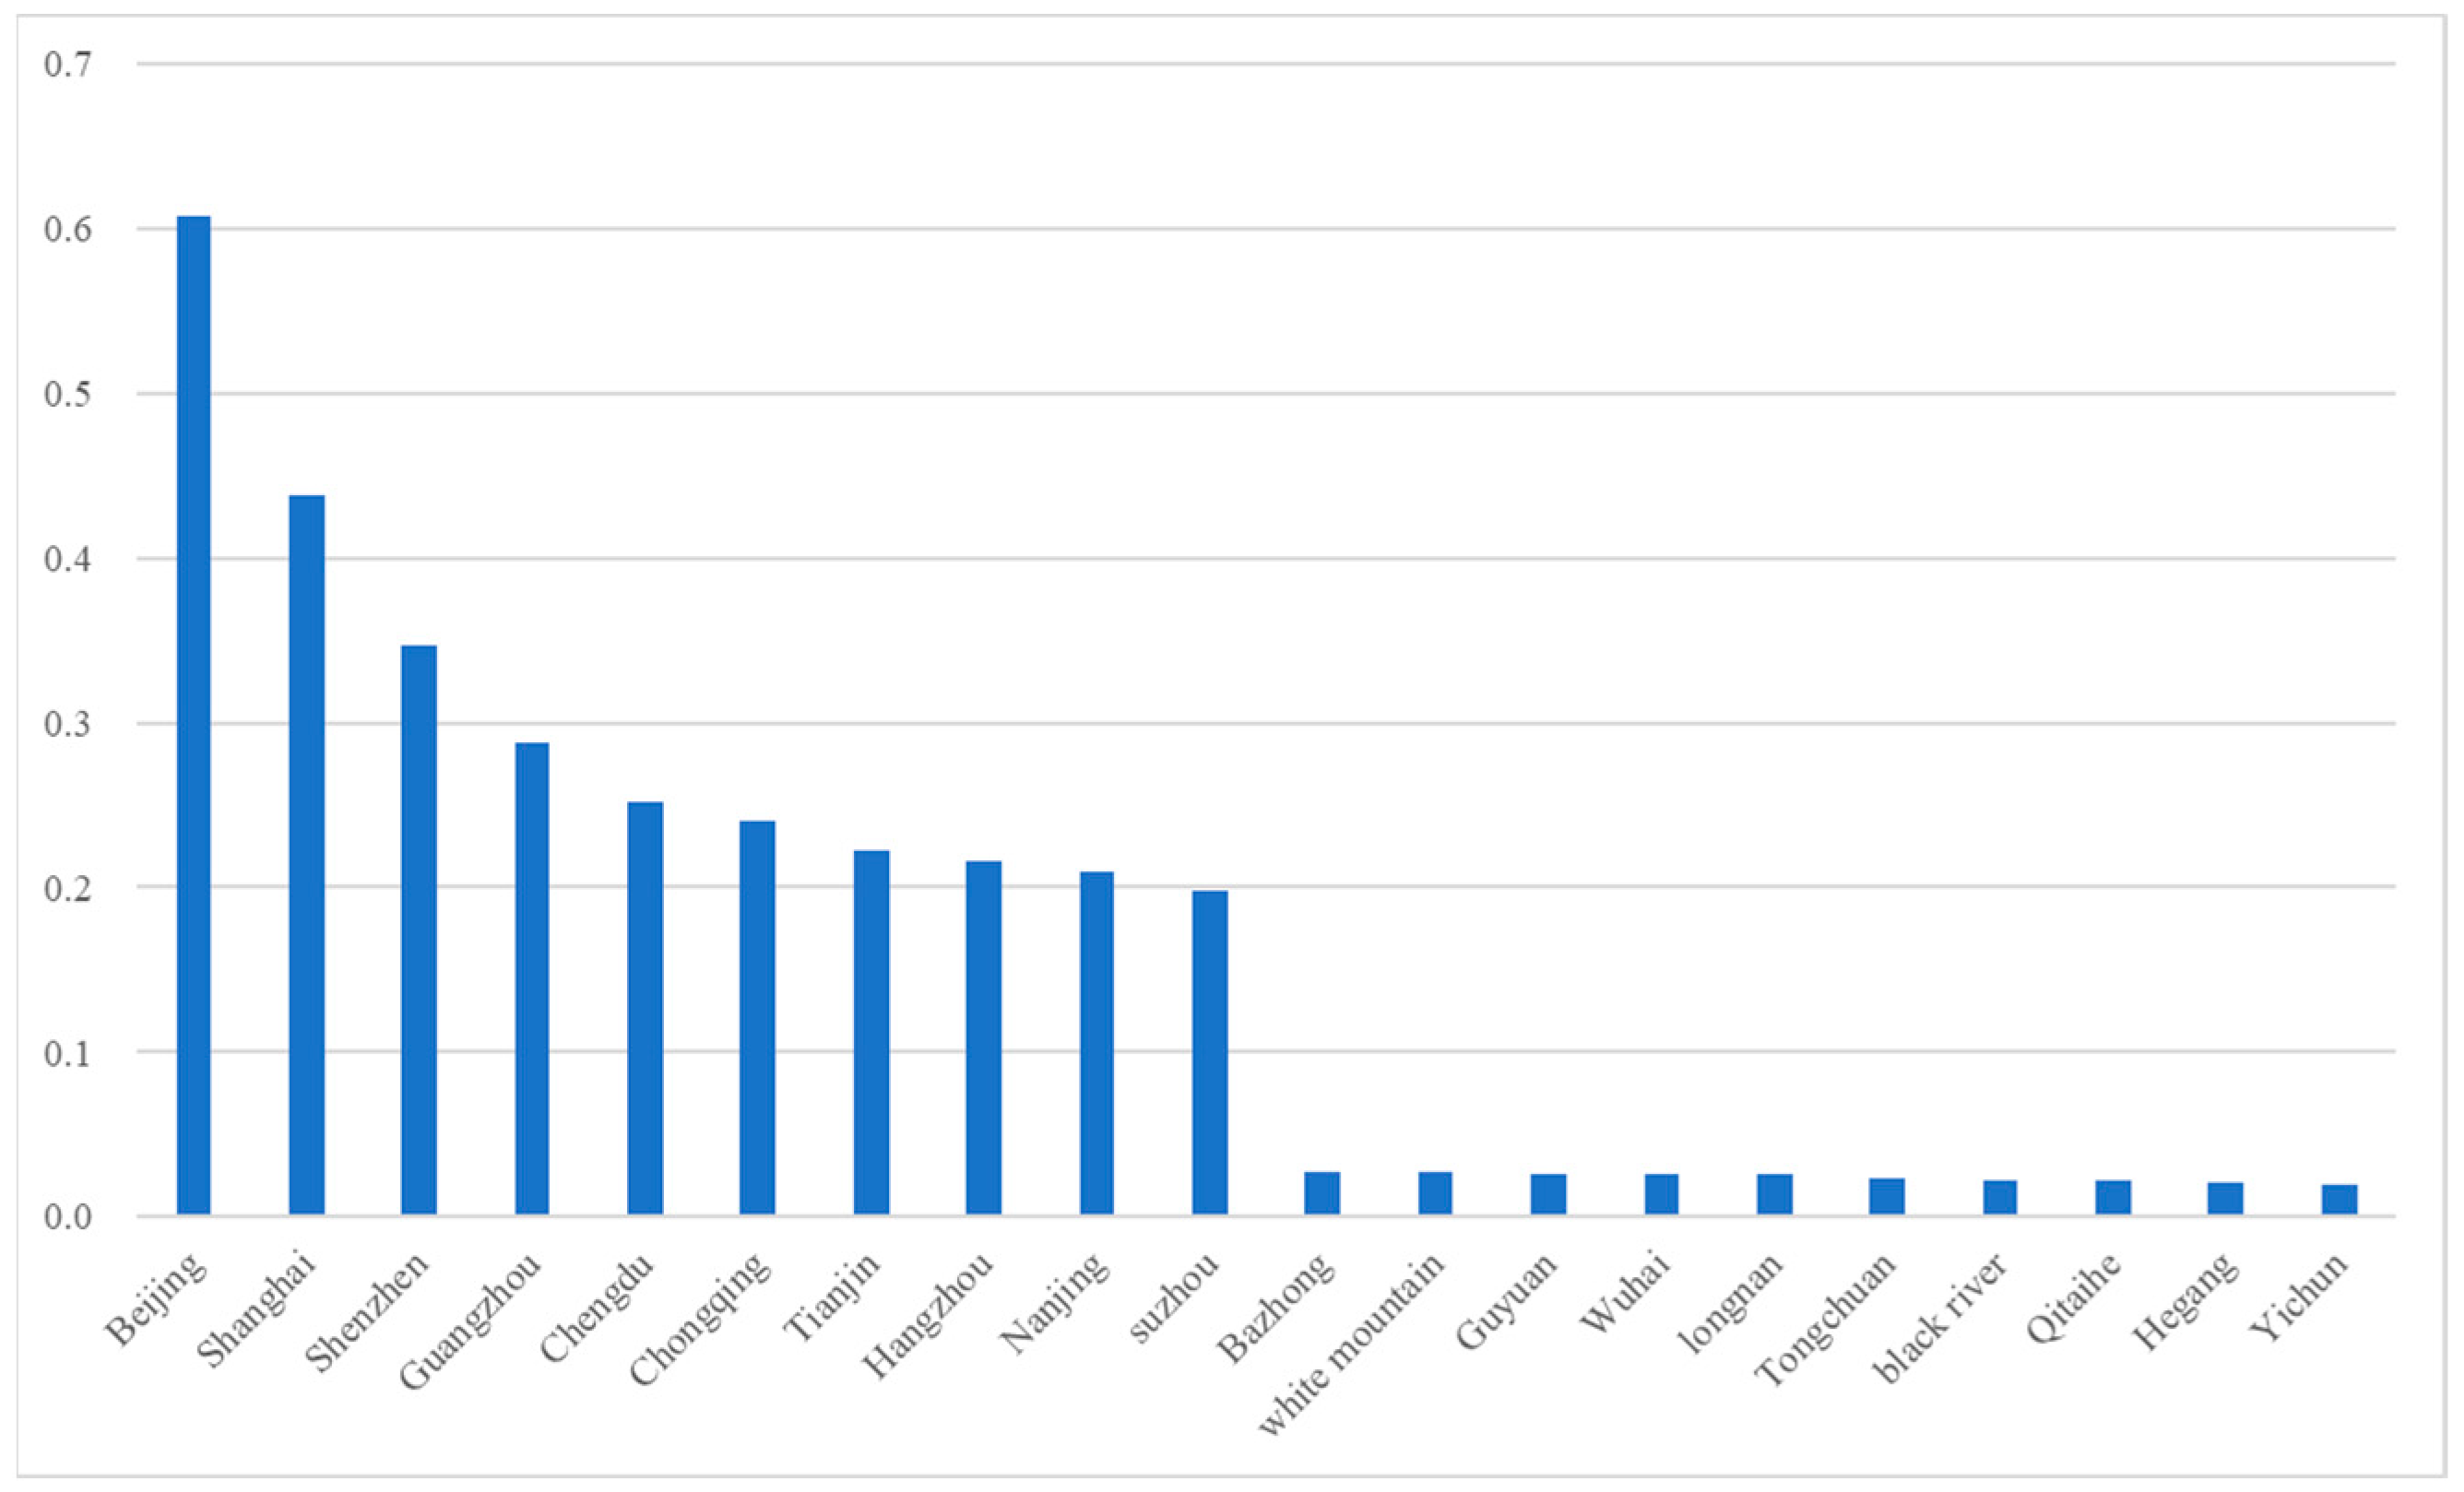
Based on the comprehensive evaluation results mentioned above, this study further calculates the average scores of the digital construction level for each city in China from 2011 to 2021. Figure 1 presents the top ten and bottom ten cities based on the average scores.
From the figure, it is evident that cities such as Beijing, Shanghai, Shenzhen, and Guangzhou have consistently led in digital construction throughout the observation period. This indicates that economically developed cities generally prioritize digital economy development and that their digital construction processes are in a phase of rapid advancement. However, there is a significant gap in the level of digital construction between leading cities, like Beijing, Shanghai, Shenzhen, and Guangzhou, and cities with lower rankings such as Hegang and Yichun. This suggests that without timely measures to achieve a synchronized improvement in the national urban digital development level, a “digital divide” between different cities may emerge and gradually deepen.
4.2. Model Specification
Based on the computed results in the previous sections, this study, following existing research and considering the characteristics of urban digital development, takes the regional gross domestic product (GDP) as the core dependent variable. Simultaneously, the comprehensive evaluation score of the digital construction level, calculated earlier, serves as the core explanatory variable. By constructing a panel data regression model, this study empirically analyzes the causal relationship between urban digital construction level and urban economic growth.
In the model selection process, the Hausman test was initially conducted, and the results indicated that a fixed-effects model is more suitable for this study. Additionally, adopting fixed effects for both years and cities aligns better with the practical aspects of this research. Therefore, this study ultimately constructs the fixed-effects model as shown in Equation (1):
where and represent cities and years, respectively. The dependent variable is the natural logarithm of the regional gross domestic product for each city. The core explanatory variable is the comprehensive evaluation score of the digital construction level for each city. is the vector of control variables. and represent the year fixed effects and city fixed effects, covering time factors unaffected by city-specific differences and city-specific factors unaffected by the passage of time. is the regression coefficient of interest, reflecting the impact of the urban digital construction level on urban economic development. is the error term.
4.3. Variable Selection
Dependent Variable: The natural logarithm of the regional gross domestic product (GDP) for each city is selected as the dependent variable for empirical analysis. Regional GDP is a crucial indicator for measuring economic growth, and using the natural logarithm of GDP as the dependent variable helps capture the causal relationship between urban digital construction level and urban economic development.
Core Explanatory Variable: The core explanatory variable is the comprehensive evaluation score of the digital construction level for each city. Calculated based on the previously constructed indicator system and evaluation method, it covers the digital construction level reflected by 5 primary indicators and 16 secondary indicators.
Control Variables: The control variables in this econometric model mainly include the natural logarithms of the end-of-period number of employees in urban units (), the number of industrial enterprises above a designated size (), the natural logarithm of fixed asset investment (), and the natural logarithm of public budget expenditure (). The selection of these control variables aims to control, to the greatest extent possible, the impact of urban unit employees, large-scale industrial enterprises, and fixed asset investment on regional GDP. This helps reflect the extent to which the urban digital construction level affects urban economic development.
Descriptive statistics for all variables are provided in Table A2.
4.4. Empirical Results and Analysis
Based on the variable specifications and data sources mentioned above, the econometric model represented by Equation (8) was used to obtain the benchmark regression results for the impact of urban digital construction on regional economic growth, as shown in Table 3. Columns (1) and (5) present the OLS regression results without and with control variables, respectively. Columns (3) and (7) further control for year and city fixed effects. According to the overall results of the benchmark regression, the coefficients of the dependent variable are significantly positive, with most being statistically significant at the 1% level. This result further confirms the calculation results of the indicator evaluation system mentioned earlier, indicating that the level of urban digital construction plays a crucial and significant role in driving and promoting economic development.
In the context of urban digitization, for every 1 percentage point increase in the digitization process, the regional gross domestic product (GDP) is expected to increase by 1.1058 percentage points. Similarly, a 1 percentage point increase in the proportion of urban employed persons to the total workforce leads to a 0.1267 percentage point increase in regional GDP. The presence of a 1 percentage point higher value in the number of industrial enterprises above a certain scale corresponds to a 0.3256 percentage point increase in regional GDP. Additionally, a 1 percentage point rise in fixed asset investment is associated with a 0.1555 percentage point increase in regional GDP. Conversely, a 1 percentage point increase in public budget expenditure results in a decrease of 0.0279 percentage points in regional GDP.
Regarding the controlled variables, the regression results suggest that the number of year-end urban employed persons, the number of industrial enterprises above a certain scale, fixed asset investment, and public budget expenditure all have positive impacts on urban regional GDP. The underlying mechanisms can be elucidated as follows: Year-End Urban Employed Persons: This variable reflects the employment and urbanization status of the city. When both the employment rate and urbanization rate are at higher levels, the overall production level of the city tends to be higher. Output increases continuously with the improvement of productivity. Number of Industrial Enterprises above a Certain Scale: These enterprises essentially constitute a crucial source of urban regional GDP. An increase in the number of industrial enterprises results in an elevation of industrial GDP, consequently leading to an overall increase in urban regional GDP. Fixed Asset Investment: This variable has consistently been a significant factor influencing regional GDP. An increase in fixed asset investment indicates a rise in current and future inputs for driving economic development. This not only generates a current increase in regional GDP but also enhances long-term production output, thereby creating a dual-increase effect. Public Budget Expenditure: From a fiscal perspective, public budget expenditure reflects the city’s spending situation. An increase in public budget expenditure indicates a greater financial outlay by the city. However, this may not necessarily exert a very strong stimulating effect on driving urban economic development.
5. Test and Analysis
5.1. Endogeneity Test
Endogeneity is an indispensable consideration in empirical research. In the empirical analysis of this paper, although the impact of urban digitalization on regional economic growth is significant, there exists a theoretical bidirectional causal relationship between the two factors. Additionally, there are numerous factors influencing urban regional GDP, leading to the inevitable presence of omitted variable issues in regression analysis. Therefore, this paper further employs the instrumental variable (IV) approach to examine potential endogeneity issues in the aforementioned empirical analysis.
The chosen instrumental variable in this study is the number of employees in the information transmission, software, and information technology services industry. This variable simultaneously satisfies the requirements of relevance and exogeneity for instrumental variables. On one hand, the mentioned industry is a core sector of the digital economy, and the number of employees in this industry is a crucial indicator considered in constructing the urban digitalization process index system. Hence, it is closely related to the digitalization processes in various cities, meeting the relevance requirement for instrumental variables. On the other hand, based on principles of macroeconomics, regional GDP is composed of consumption, investment, government purchases, and net exports. The variation in the number of employees in the information transmission, software, and information technology services industry mainly stems from the expansion and contraction of the industry itself, lacking a direct connection with regional GDP. Furthermore, as one of the indicators measuring the digital information industry, the number of employees in this sector can only influence regional GDP through the development of urban digitalization processes. Therefore, it has no direct or indirect relationship with potential factors affecting regional GDP (residual terms in the regression), meeting the exogeneity requirement for instrumental variables.
From the results in Table 3, it is evident that the coefficient of urban digitalization processes on regional GDP remains significantly positive, consistent with the earlier findings. Simultaneously, the instrumental variable undergoes overidentification and weak instrumental variable tests, where the F-statistic value exceeds 10 with a p-value of 0.000. Furthermore, the Hausman test yields a p-value of 0.000, rejecting the null hypothesis that all explanatory variables are exogenous, indicating the need for instrumental variable correction. These results affirm the credibility of selecting the number of employees in the information transmission, software, and information technology services industry as the instrumental variable for urban digitalization processes in this study.
5.2. Robustness Test
5.2.1. Substitution of Core Explanatory Variable
Despite the significant empirical results obtained in the previous analysis and the passing of endogeneity tests using instrumental variables, it is essential to conduct a robustness test to ensure the accuracy of the empirical findings. Based on the weight scores of the indicator system in Table 2, this paper reorganized the primary and secondary indicators according to their weighted scores, resulting in the ranking of indicator weights, as shown in Table A3.
Due to the higher weights assigned to indicators in the objective weighted scores, indicating their greater reference value and importance for urban digitalization, this paper, considering the characteristics of digital city development, selected the highest-weighted secondary indicators in Table A3 as the core explanatory variables for the robustness test. These include the Digital Inclusive Finance Index (), Innovation Index (), Green Patent Applications (), and the Number of Internet Broadband Access Users (). Detailed test results can be found in Table A4 and Table A5.
In both tables, it is observed that the impact coefficients of the core explanatory variables are consistently positive at the 1% significance level. The Digital Inclusive Finance Index, as an effective indicator of digital economic development, plays a crucial role in narrowing regional economic development gaps and promoting economic growth. The increase in the Innovation Index is significant for innovative development, serving as a key driver of economic progress. The positive impact of Green Patent Applications on regional GDP contributes to the advancement of both ecology and technology, fostering sustainable productivity. The increase in the number of internet broadband access users reflects the economic development strength of the region, making it a significant factor in the regression results. The robustness test, employing these core explanatory variables, reaffirms the reliability and stability of the empirical results, providing additional confidence in the findings.
5.2.2. Substitution of Control Variables
According to the evaluation indicator system, this paper subsequently selected the natural logarithm of year-end mobile phone users (), the natural logarithm of per capita regional GDP (), the proportion of urban construction land to municipal area (), the proportion of tertiary industry employees (), and the natural logarithm of carbon dioxide emissions () as control variables, replacing the original set of control variables. The regression results after substituting control variables can be found in Table A6 and Table A7.
In the overall benchmark regression results, the coefficients of each control variable are significantly positive at the 1% significance level. This further confirms the calculation results of the indicator evaluation system mentioned earlier.
5.2.3. Selection of Different Study Periods
As mentioned earlier, China’s digital economy has undergone three main stages of development. Currently, with the digital economy entering the third stage of intelligent development, the country has clearly defined the overall planning and guiding principles for digital economic development at the top-level design, making it an important national strategy. Since 2015, China has continuously formulated and released development strategies and implementation plans in the field of the digital economy, aiming to elevate it to new heights. The term “digital economy” officially appeared in Premier Li Keqiang’s government work report in 2017. Since then, many core indicators of the digital economy have had clear measurements and statistics. Accordingly, this paper chose three different research periods, 2011–2014, 2015–2016, and 2017–2021, to test the robustness of aforementioned empirical results further. Detailed test results can be found in Table A8.
From the table, it can be observed that the coefficients of the core explanatory variables are significantly positive at the 1% level, and other variables also exhibit good levels of significance. When using data from the period 2017–2021 for testing, the coefficient significantly increases, indicating that the digital economy has become a crucial driver of economic development in China. This demonstrates that the regression results after selecting different study periods remain consistent with the earlier empirical analysis results, confirming that the empirical analysis of this paper has passed this robustness test.
5.3. Heterogeneity Analysis
As mentioned earlier, there is a significant “digital divide” phenomenon in the development of China’s digital economy among different cities and even substantial regional disparities in overall economic development. Considering the imbalance in resource endowments and economic development among different regions, this section divides China’s provinces into three major regions: East, Central, and West. A panel fixed-effects model is employed to conduct heterogeneity analysis, exploring whether there are differences in the level of digital construction among regions.
The regional division in China began in 1986, officially announced during the Fourth Session of the Sixth National People’s Congress as part of the “Seventh Five-Year Plan”. The National Development and Reform Commission explained that the division into East, Central, and West is a policy-based rather than a geographical-based distinction. Specifically, the East includes 11 provinces (municipalities): Beijing, Tianjin, Hebei, Liaoning, Shanghai, Jiangsu, Zhejiang, Fujian, Shandong, Guangdong, and Hainan. The Central region comprises 10 provinces (autonomous regions): Shanxi, Inner Mongolia, Jilin, Heilongjiang, Anhui, Jiangxi, Henan, Hubei, Hunan, and Guangxi. The West includes 10 provinces (autonomous regions): Sichuan, Guizhou, Yunnan, Tibet, Shaanxi, Gansu, Qinghai, Ningxia, Chongqing, and Xinjiang.
In this heterogeneity test, two main components are considered. First, the impact of the level of digital construction on regional GDP is regressed across the East, Central, and West regions to examine whether there are significant differences between the different regions. Second, the evaluation scores of digital constructions are used as the dependent variable, regressed against high-weighted core indicators separately for each region to investigate whether there are regional differences in digital construction in various cities. Table 4 reports the results of the heterogeneity analysis obtained by regressing the comprehensive evaluation score of digital construction (Digcity) as the core explanatory variable against regional GDP in different regions.
From the table, it is evident that only in the Eastern and Central regions do the digital constructions of cities have a significant positive impact on regional GDP. One possible reason for this is that the digitalization process in the Western region is still in a developmental stage requiring the sustained expansion of investments, and its input–output ratio has not achieved the same favorable outcomes as in the Central and Eastern regions.
Subsequently, this study employs the Digital Inclusive Finance Index (), Innovation Index (), Green Patent Applications (), and Internet Broadband Access Users () as core explanatory variables. These are regressed against the evaluation scores of digital constructions in different regions to obtain results for heterogeneity analysis. The detailed findings of the tests can be found in Table A9, Table A10, Table A11 and Table A12.
In the regressions involving the Digital Inclusive Finance Index, Innovation Index, and Internet Broadband Access Users, the coefficients for all three regions are positive and statistically significant at the 1% level. This implies that there are no significant differences among the three regions concerning the impact of green development on the digital economy.
However, in the results obtained with Green Patent Applications as the core explanatory variable, only the coefficient for the Eastern region is statistically significant at the 1% level (please refer to Table A11). This suggests regional differences in the development process of urban digital construction in China. Due to the higher level of digital industry development in the Eastern region compared to the Central and Western regions, the impact of Green Patent Applications on driving the digital construction process is more pronounced in the East. In the Central and Western regions, where the digital economy and industry development are relatively lagging, its driving effect still needs further manifestation.
6. Conclusions
Based on the data of 280 cities in China from 2011 to 2021, this paper constructs a comprehensive evaluation index system for the level of urban digital construction, uses the entropy method to weigh various indicators, and obtains the evaluation results of the digital construction level of each city. On this basis, this paper further uses a panel data regression model to empirically analyze the impact of the urban digital construction level on urban economic growth. The main conclusions are as follows.
6.1. Theoretical Conclusions
First, from a theoretical perspective, this paper comprehensively considers the various aspects of urban digital construction from the five dimensions of digital infrastructure, overall economic level, innovation development level, digital industry development status, and ecological environment conditions, and constructs a systematic evaluation index system to provide a feasible method for the quantitative evaluation of the level of urban digital construction (please refer to Table 1 and Table 2). Moreover, an econometric model based on the causal relationship between the level of digital construction and economic growth is developed (please refer to Section 4.2), which empirically tests the impact of urban digital construction on urban economic growth, providing new evidence for theoretical research on urban digital construction.
6.2. Practical Conclusions
Secondly, at the practical level, the results of the empirical analysis show that the level of urban digital construction has a significant positive role in promoting economic growth, and these results have passed a series of robustness tests, proving their reliability. Specifically, every 1% increase in a city’s digital construction level will increase its GDP by 0.974. This result shows that urban digital construction is an important way to promote urban economic growth and an effective means to enhance a city’s comprehensive competitiveness. This paper also found that there are large differences in the level of digital construction between different cities, indicating that the imbalance of urban digital construction is still prominent.
6.3. Social Conclusions
Finally, in terms of social value, this research has important social value and policy significance. On the one hand, it provides a scientific tool for evaluating and monitoring the level of urban digital construction. It can help the government and all sectors of society understand the status quo and trends of urban digital construction, identify problems and deficiencies in a timely manner, formulate reasonable goals and measures, and promote urban digitalization and the healthy development of construction. On the other hand, it provides a strong basis for promoting the coordinated development of urban digital construction and economic growth. It can help the government and all sectors of society to fully understand the important role of digital construction in urban development, increase investment and support for digital construction, optimize the environment and mechanisms of digital construction, stimulate the vitality and innovation of digital construction, and achieve a positive interaction between urban digital construction and economic growth.
6.4. Policy Recommendations
Based on the research conclusions, the following policy recommendations are put forward:
Firstly, enhance the construction of urban digital infrastructure. Digital infrastructure is a prerequisite for the transformation of urban digitization and a crucial driving force for improving the level of urban digitization and enhancing economic growth efficiency. Therefore, investments in digital infrastructure, including broadband networks, cloud computing, the Internet of Things (IoT), and big data, should be increased to achieve the deep integration of digital infrastructure with other areas of the city.
Secondly, support the improvement of urban innovation development. Innovation is the core driving force for urban development and a key element in promoting urban digital transformation. Therefore, efforts should be made to strengthen the research and application of cutting-edge technologies such as artificial intelligence, blockchain, and digital twins. Additionally, fostering and attracting innovative digital enterprises and talents, and constructing and perfecting innovation ecosystems and service platforms, will stimulate innovation vitality and drive the high-quality development of the urban economy.
Thirdly, narrow the “digital divide” between cities in different regions. To address the imbalance in regional development, it is essential to promote the sharing and connectivity of digital resources among cities. Moreover, cities in the eastern region should actively share their successful experiences in digital transformation to assist cities in the central and western regions in improving their digital construction levels. The central government can establish special funds to support the digital construction of cities in the central and western regions, thereby promoting balanced regional development and further narrowing the “digital divide”.
Lastly, ensure a talent pool for digital construction. To meet the development needs of the digital economy, cities should comprehensively enhance the digital skills and literacy of citizens. The government can establish special funds to support schools and enterprises in offering digital skills courses and training programs. Simultaneously, through policy guidance, various sectors of society should be encouraged to actively participate in the promotion of digital education.
There are still some shortcomings in this research, as follows:
On the one hand, the evaluation index system for urban digital construction can be further improved. Due to limitations in data availability, when constructing an evaluation index system for urban digital construction, this paper does not cover all aspects of urban digital construction. Future research can further enrich and optimize the urban digital construction evaluation index system based on the updating and improvement of data, making it more scientific and comprehensive.
On the other hand, urban digital construction is a dynamic process, and the level and effect of urban digital construction may also change over time. Future research can consider introducing methods such as panel threshold models and panel cointegration models to analyze the dynamics of urban digital construction to reveal the deeper laws and mechanisms of urban digital construction.
Author Contributions
Conceptualization, C.Z. and W.Y.; methodology, C.Z.; software, W.Y.; validation, C.Z., W.Y. and Y.Y.; formal analysis, C.Z.; data curation, C.Z.; writing—original draft preparation, C.Z., W.Y. and Y.Y.; writing—review and editing, W.Y. and Y.Y.; visualization, C.Z.; supervision, W.Y. and Y.Y.; project administration, W.Y. and Y.Y.; funding acquisition, W.Y. and Y.Y. All the authors contributed equally to this work. All authors have read and agreed to the published version of the manuscript.
Funding
This research was funded by the Project of Shanghai Philosophy and Social Science Planning (2021BGL014, 2021EJB006), the Shanghai Soft Science Research Program (23692104400), the National Natural Science Foundation of China (72241431, 72031006), the Major Projects on Philosophy and Social Science Research of the Ministry of Education of the People’s Republic of China (20JZD010), the Humanities Young Talent Cultivation Program at Shanghai Jiao Tong University (2023QN004), the Startup Fund for Young Faculty at Shanghai Jiao Tong University (SFYF at SJTU), and the Shangli Chenxi Social Science Special Project of University of Shanghai for Science and Technology (22SLCX-ZD-010). We gratefully acknowledge the above financial support.
Institutional Review Board Statement
Not applicable.
Informed Consent Statement
Not applicable.
Data Availability Statement
The data used in this paper are all from the statistical data officially released by China and have been explained in Section 3.2.2.
Conflicts of Interest
The authors declare no conflicts of interest.
Appendix A. Principles for Constructing an Evaluation Indicator System
In conducting an empirical analysis of urban digitalization, it is imperative to quantitatively compare the digitalization levels of various cities based on a set of indicators. Given the plethora of available indicators, each possessing distinct attributes, adherence to the following principles is essential to ensure the effectiveness and objectivity of the evaluation indicator system:
Comprehensive Principle of Indicator Selection: The selection of indicators should comprehensively consider the primary influencing factors across various aspects of the digital city construction process. This entails constructing a relatively comprehensive evaluation indicator system that provides a scientific basis for analyzing and assessing the status of urban digitalization. As digital city construction encompasses multiple domains, including urban infrastructure, economic development, and public governance, it is crucial to integrate considerations from these domains and their influencing factors when selecting indicators, thereby constructing a comprehensive indicator system.
Relevance Principle of Indicator Selection: In evaluating the digitalization level of urban development, it is imperative to deeply understand its essence and influencing factors. Indicators should be selected based on their relevance to reflect the essence and influencing factors of urban digitalization accurately. Through the specific meanings embedded in each indicator concerning digital development, an objective assessment of the urban digitalization level can be achieved.
Accessibility Principle of Indicator Selection: The selection of indicators must consider their accessibility, meaning they should be easily obtainable during the research process and amenable to quantification or standardization. This ensures the comparability of data. The factors influencing the digital transformation of urban development encompass both quantitative and qualitative indicators, necessitating relevant processing to effectively apply these indicators to the evaluation system. In selecting indicators, efforts should be made to utilize primary data obtained through authoritative channels, such as the National Bureau of Statistics, official city websites, and statistical yearbooks. Moreover, there should be a conscious effort to minimize the selection of qualitative indicators to enhance the efficiency and practicality of constructing the evaluation indicator system.
Scientific Principle of Indicator Selection: As the evaluation indicator system is a judgment criterion constructed by integrating theory and practice, the selection of indicators should not only focus on objective realities but also adhere to corresponding theoretical requirements. It is crucial to strike a balance between theory and practice, selecting indicators that achieve internal consistency in theoretical logic and grasp the essential characteristics of urban digitalization in practice. This ensures that a comprehensive reflection of the essence and development status of urban digitalization is reached.
Appendix B. Empowerment Methodology
Building upon the construction of the evaluation indicator system for urban digitalization, this paper will further determine the computational weights for each indicator. In terms of empowerment methodology, this study employs the entropy method for measurement analysis to obtain the weights of each indicator. Subsequently, this enables the calculation of comprehensive scores for the digitalization construction evaluation of each city. This approach facilitates an objective comparison of the digitalization construction levels across different cities.
The entropy method is an objective empowerment technique that utilizes scientific computational procedures to objectively assign weights to each indicator. This approach mitigates the subjective biases introduced by human factors, ensuring a higher level of accuracy, credibility, and reliability in the evaluation process. The application of the entropy method enhances the reliability of the evaluation results by providing an unbiased and scientifically grounded approach to determining the weights of various indicators.

Table A1.
Comprehensive evaluation scores of digitalization level in 280 Chinese cities from 2011 to 2021.
Table A1.
Comprehensive evaluation scores of digitalization level in 280 Chinese cities from 2011 to 2021.
| 2011 | 2012 | 2013 | 2014 | 2015 | 2016 | 2017 | 2018 | 2019 | 2020 | 2021 | |
|---|---|---|---|---|---|---|---|---|---|---|---|
| Ankang | 0.3384 | 0.3540 | 0.3644 | 0.3729 | 0.3950 | 0.4198 | 0.4599 | 0.4510 | 0.4729 | 0.4333 | 0.4734 |
| Anqing | 0.3750 | 0.4103 | 0.4324 | 0.4496 | 0.4908 | 0.5250 | 0.5731 | 0.5497 | 0.5827 | 0.5970 | 0.6266 |
| Anshun | 0.2962 | 0.3378 | 0.3633 | 0.4001 | 0.4303 | 0.4607 | 0.4874 | 0.4987 | 0.4996 | 0.5008 | 0.5478 |
| Anyang | 0.3807 | 0.3997 | 0.4196 | 0.4352 | 0.4650 | 0.4916 | 0.5289 | 0.5368 | 0.5528 | 0.5503 | 0.5631 |
| Anshan | 0.4556 | 0.4672 | 0.4925 | 0.4983 | 0.5154 | 0.5270 | 0.5484 | 0.5538 | 0.5584 | 0.5578 | 0.5639 |
| Bayannur | 0.2868 | 0.2996 | 0.3242 | 0.3492 | 0.3730 | 0.4127 | 0.4413 | 0.4231 | 0.4615 | 0.4768 | 0.5022 |
| Bazhong | 0.2645 | 0.2958 | 0.3142 | 0.3477 | 0.3807 | 0.4079 | 0.4208 | 0.4105 | 0.4390 | 0.4290 | 0.4409 |
| Baicheng | 0.2916 | 0.3177 | 0.3449 | 0.3517 | 0.3702 | 0.3978 | 0.4596 | 0.4293 | 0.4532 | 0.4603 | 0.4927 |
| Baishan | 0.3282 | 0.3290 | 0.3433 | 0.3519 | 0.3661 | 0.3992 | 0.4096 | 0.4262 | 0.4523 | 0.4458 | 0.4730 |
| Baiyin | 0.2440 | 0.3044 | 0.3292 | 0.3546 | 0.3697 | 0.4096 | 0.4641 | 0.4427 | 0.4603 | 0.4702 | 0.4952 |
| Baise | 0.3074 | 0.3159 | 0.3263 | 0.3609 | 0.3900 | 0.4336 | 0.4821 | 0.4615 | 0.4931 | 0.5170 | 0.5478 |
| Bengbu | 0.3958 | 0.4257 | 0.4494 | 0.4735 | 0.5029 | 0.5456 | 0.5657 | 0.5783 | 0.5948 | 0.6033 | 0.6243 |
| Baotou | 0.4103 | 0.4425 | 0.4624 | 0.4833 | 0.4989 | 0.5368 | 0.5663 | 0.5543 | 0.5731 | 0.5894 | 0.6145 |
| Baoji | 0.3763 | 0.4301 | 0.4384 | 0.4621 | 0.4836 | 0.5030 | 0.5393 | 0.5455 | 0.5659 | 0.5832 | 0.5992 |
| Baoding | 0.4526 | 0.4824 | 0.4937 | 0.5143 | 0.5356 | 0.5618 | 0.6111 | 0.6163 | 0.6506 | 0.6630 | 0.6961 |
| Baoshan | 0.2527 | 0.2806 | 0.3017 | 0.3209 | 0.3509 | 0.3682 | 0.4184 | 0.4093 | 0.4550 | 0.4714 | 0.4978 |
| Beihai | 0.3496 | 0.3817 | 0.4051 | 0.4216 | 0.4461 | 0.4719 | 0.5343 | 0.5147 | 0.5305 | 0.5393 | 0.5603 |
| Beijing | 0.7583 | 0.7899 | 0.8304 | 0.8407 | 0.8592 | 0.8738 | 0.8920 | 0.9082 | 0.9389 | 0.9306 | 0.9334 |
| Benxi | 0.3560 | 0.3683 | 0.3955 | 0.4140 | 0.4299 | 0.4324 | 0.4607 | 0.4439 | 0.4572 | 0.4769 | 0.5027 |
| Binzhou | 0.3281 | 0.3403 | 0.3659 | 0.3627 | 0.3797 | 0.4020 | 0.4332 | 0.4280 | 0.4535 | 0.4766 | 0.5014 |
| Cangzhou | 0.3594 | 0.3777 | 0.3993 | 0.4124 | 0.4353 | 0.4504 | 0.5144 | 0.4913 | 0.5128 | 0.5292 | 0.4977 |
| Changde | 0.3822 | 0.4159 | 0.4384 | 0.4645 | 0.4918 | 0.5226 | 0.5449 | 0.5662 | 0.5986 | 0.6325 | 0.5954 |
| Changchun | 0.5131 | 0.5562 | 0.5642 | 0.5699 | 0.6039 | 0.6305 | 0.6429 | 0.6618 | 0.6719 | 0.6851 | 0.7038 |
| Changsha | 0.5628 | 0.6092 | 0.6284 | 0.6337 | 0.6688 | 0.6975 | 0.7347 | 0.7471 | 0.7745 | 0.7853 | 0.7633 |
| Changzhi | 0.3518 | 0.3945 | 0.3990 | 0.4207 | 0.4474 | 0.4730 | 0.5147 | 0.5111 | 0.5373 | 0.4753 | 0.4899 |
| Changzhou | 0.4079 | 0.4354 | 0.4744 | 0.4678 | 0.4854 | 0.5059 | 0.5045 | 0.5299 | 0.5495 | 0.5700 | 0.5486 |
| Chaoyang | 0.3285 | 0.3461 | 0.3669 | 0.3922 | 0.4068 | 0.4401 | 0.4677 | 0.4649 | 0.4878 | 0.5077 | 0.4788 |
| Chaozhou | 0.3272 | 0.3416 | 0.3481 | 0.3761 | 0.3719 | 0.3927 | 0.3858 | 0.4074 | 0.4275 | 0.4464 | 0.4243 |
| Chenzhou | 0.3091 | 0.3343 | 0.3623 | 0.3754 | 0.3953 | 0.4146 | 0.4465 | 0.4555 | 0.4742 | 0.4817 | 0.4597 |
| Chengdu | 0.5945 | 0.6269 | 0.6843 | 0.6873 | 0.7299 | 0.7551 | 0.7657 | 0.7902 | 0.8237 | 0.8597 | 0.8296 |
| Chengde | 0.3530 | 0.3841 | 0.4025 | 0.4163 | 0.4434 | 0.4720 | 0.5075 | 0.5074 | 0.5269 | 0.5506 | 0.5228 |
| Chizhou | 0.2679 | 0.3070 | 0.3185 | 0.3225 | 0.3564 | 0.3835 | 0.3708 | 0.3929 | 0.4158 | 0.4357 | 0.4666 |
| Chifeng | 0.3502 | 0.3688 | 0.3970 | 0.4125 | 0.4369 | 0.4551 | 0.4759 | 0.4972 | 0.5131 | 0.5066 | 0.5295 |
| Chongqing | 0.5642 | 0.5826 | 0.6209 | 0.6435 | 0.6726 | 0.6852 | 0.7099 | 0.7109 | 0.7572 | 0.7360 | 0.7548 |
| Chongzuo | 0.2351 | 0.2644 | 0.3020 | 0.3494 | 0.3857 | 0.4275 | 0.4629 | 0.4664 | 0.4859 | 0.4898 | 0.5086 |
| Chuzhou | 0.3144 | 0.3432 | 0.3609 | 0.3837 | 0.4004 | 0.4204 | 0.4455 | 0.4599 | 0.4700 | 0.4718 | 0.5005 |
| Dazhou | 0.2803 | 0.3127 | 0.3120 | 0.3278 | 0.3460 | 0.3715 | 0.4216 | 0.3997 | 0.4275 | 0.4136 | 0.4051 |
| Dalian | 0.5562 | 0.5845 | 0.6112 | 0.6090 | 0.6315 | 0.6540 | 0.6893 | 0.6921 | 0.7019 | 0.7071 | 0.7267 |
| Daqing | 0.4195 | 0.4426 | 0.4799 | 0.4664 | 0.4834 | 0.5105 | 0.5302 | 0.5233 | 0.5365 | 0.5507 | 0.5721 |
| Datong | 0.3589 | 0.4006 | 0.4205 | 0.4297 | 0.4591 | 0.4759 | 0.5124 | 0.5130 | 0.5377 | 0.5575 | 0.5791 |
| Dandong | 0.3934 | 0.4150 | 0.4238 | 0.4344 | 0.4464 | 0.4772 | 0.5219 | 0.5076 | 0.5243 | 0.5390 | 0.5708 |
| Deyang | 0.3711 | 0.4402 | 0.4403 | 0.4593 | 0.4862 | 0.5119 | 0.5631 | 0.5504 | 0.5687 | 0.5343 | 0.5511 |
| Dezhou | 0.3212 | 0.3592 | 0.3784 | 0.3836 | 0.3978 | 0.4223 | 0.4518 | 0.4497 | 0.4741 | 0.4483 | 0.4812 |
| Dingxi | 0.2702 | 0.3051 | 0.3285 | 0.3451 | 0.3708 | 0.3950 | 0.4351 | 0.4325 | 0.4633 | 0.4215 | 0.4879 |
| Dongguan | 0.5479 | 0.5810 | 0.6062 | 0.5976 | 0.6256 | 0.6382 | 0.6756 | 0.6858 | 0.7090 | 0.6635 | 0.6921 |
| Dongying | 0.4049 | 0.4469 | 0.4635 | 0.4775 | 0.4967 | 0.5028 | 0.5332 | 0.5375 | 0.5602 | 0.5327 | 0.5623 |
| Ordos | 0.3707 | 0.3978 | 0.4193 | 0.4303 | 0.4546 | 0.4674 | 0.5250 | 0.5103 | 0.5236 | 0.4719 | 0.5024 |
| Ezhou | 0.2324 | 0.2677 | 0.2872 | 0.2938 | 0.3125 | 0.3438 | 0.3708 | 0.3771 | 0.4022 | 0.3640 | 0.3878 |
| Fangchenggang | 0.2399 | 0.2980 | 0.3166 | 0.3589 | 0.3766 | 0.3906 | 0.4279 | 0.4168 | 0.4624 | 0.4314 | 0.4574 |
| Foshan | 0.5394 | 0.5611 | 0.5781 | 0.5830 | 0.6081 | 0.6172 | 0.6622 | 0.6762 | 0.7045 | 0.6671 | 0.7112 |
| Fuzhou | 0.4098 | 0.4433 | 0.4657 | 0.4757 | 0.5003 | 0.5059 | 0.5602 | 0.5499 | 0.5605 | 0.5747 | 0.5922 |
| Fushun | 0.3805 | 0.4072 | 0.4184 | 0.4302 | 0.4565 | 0.4459 | 0.4843 | 0.4811 | 0.4845 | 0.4979 | 0.5241 |
| Fuzhou | 0.2722 | 0.2969 | 0.3135 | 0.3248 | 0.3483 | 0.3576 | 0.4058 | 0.4169 | 0.4371 | 0.5402 | 0.5804 |
| Fuxin | 0.3244 | 0.3583 | 0.3722 | 0.3921 | 0.4051 | 0.4356 | 0.4701 | 0.4704 | 0.4953 | 0.4989 | 0.5080 |
| Fuyang | 0.3607 | 0.4057 | 0.4377 | 0.4315 | 0.4755 | 0.5091 | 0.5501 | 0.5467 | 0.5842 | 0.6107 | 0.6340 |
| Ganzhou | 0.3266 | 0.3607 | 0.3704 | 0.3877 | 0.4117 | 0.4382 | 0.4756 | 0.4800 | 0.5046 | 0.5141 | 0.5390 |
| Guyuan | 0.2268 | 0.2573 | 0.2783 | 0.2903 | 0.3173 | 0.3451 | 0.3879 | 0.3739 | 0.4150 | 0.4331 | 0.4728 |
| Guang’an | 0.2965 | 0.3306 | 0.3426 | 0.3672 | 0.4035 | 0.4230 | 0.4343 | 0.4294 | 0.4654 | 0.4707 | 0.4957 |
| Guangyuan | 0.3227 | 0.3457 | 0.3688 | 0.3856 | 0.4077 | 0.4386 | 0.4672 | 0.4624 | 0.4760 | 0.4741 | 0.5014 |
| Guangzhou | 0.6994 | 0.7224 | 0.7717 | 0.7595 | 0.7738 | 0.8015 | 0.8238 | 0.8432 | 0.8634 | 0.8782 | 0.8991 |
| Guigang | 0.2889 | 0.3376 | 0.3654 | 0.3805 | 0.4043 | 0.4312 | 0.4845 | 0.4762 | 0.5296 | 0.5300 | 0.4942 |
| Guiyang | 0.4905 | 0.5259 | 0.5664 | 0.5798 | 0.5983 | 0.6165 | 0.6476 | 0.6574 | 0.6775 | 0.6960 | 0.6698 |
| Guilin | 0.4325 | 0.4634 | 0.4836 | 0.4956 | 0.5137 | 0.5446 | 0.5842 | 0.5784 | 0.6192 | 0.6349 | 0.6124 |
| Harbin | 0.5731 | 0.5814 | 0.6336 | 0.6188 | 0.6456 | 0.6682 | 0.6972 | 0.6916 | 0.7212 | 0.7320 | 0.7083 |
| Haikou | 0.5132 | 0.5366 | 0.5824 | 0.5843 | 0.6075 | 0.6274 | 0.6595 | 0.6559 | 0.6838 | 0.6918 | 0.6727 |
| Handan | 0.4258 | 0.4617 | 0.4618 | 0.4803 | 0.5111 | 0.5249 | 0.5646 | 0.5556 | 0.5815 | 0.6067 | 0.5767 |
| Hanzhong | 0.3410 | 0.3761 | 0.4058 | 0.4107 | 0.4381 | 0.4649 | 0.4872 | 0.4881 | 0.5073 | 0.5128 | 0.5030 |
| Hangzhou | 0.6302 | 0.6597 | 0.6910 | 0.6889 | 0.7211 | 0.7456 | 0.7668 | 0.7731 | 0.8015 | 0.8205 | 0.7912 |
| Hefei | 0.5149 | 0.5406 | 0.5729 | 0.5886 | 0.6297 | 0.6654 | 0.7053 | 0.7099 | 0.7509 | 0.7275 | 0.7570 |
| Hechi | 0.2471 | 0.3044 | 0.3349 | 0.3662 | 0.4004 | 0.4482 | 0.4824 | 0.4750 | 0.4906 | 0.5031 | 0.5239 |
| Heyuan | 0.3166 | 0.3344 | 0.3775 | 0.4000 | 0.4277 | 0.4600 | 0.4972 | 0.5179 | 0.5416 | 0.5601 | 0.5892 |
| Heze | 0.4014 | 0.4285 | 0.4569 | 0.4600 | 0.4887 | 0.5175 | 0.5452 | 0.5437 | 0.5775 | 0.6020 | 0.6199 |
| Hezhou | 0.2464 | 0.2804 | 0.2941 | 0.3208 | 0.3354 | 0.3667 | 0.3980 | 0.4013 | 0.4116 | 0.4114 | 0.4377 |
| Hebi | 0.2707 | 0.3006 | 0.3364 | 0.3545 | 0.3592 | 0.3935 | 0.4354 | 0.4517 | 0.4765 | 0.4938 | 0.5221 |
| Hegang | 0.2318 | 0.2648 | 0.2873 | 0.2669 | 0.2968 | 0.3206 | 0.3483 | 0.3420 | 0.3731 | 0.3817 | 0.4141 |
| Heihe | 0.2297 | 0.2585 | 0.2952 | 0.3018 | 0.3057 | 0.3605 | 0.4058 | 0.3778 | 0.3924 | 0.4036 | 0.4453 |
| Hengshui | 0.3772 | 0.4063 | 0.4199 | 0.4352 | 0.4608 | 0.4967 | 0.5566 | 0.5425 | 0.5722 | 0.5825 | 0.6023 |
| Hengyang | 0.3803 | 0.4118 | 0.4429 | 0.4641 | 0.4825 | 0.5126 | 0.5625 | 0.5755 | 0.5996 | 0.6145 | 0.5984 |
| Hohhot | 0.4660 | 0.5083 | 0.5518 | 0.5563 | 0.5747 | 0.6032 | 0.6215 | 0.6413 | 0.6735 | 0.6299 | 0.6613 |
| Huludao | 0.3388 | 0.3844 | 0.3867 | 0.3967 | 0.4084 | 0.4389 | 0.4770 | 0.4780 | 0.4912 | 0.4340 | 0.4746 |
| Huzhou | 0.3543 | 0.3810 | 0.4112 | 0.4226 | 0.4295 | 0.4506 | 0.4758 | 0.4923 | 0.5019 | 0.4636 | 0.4869 |
| Huaihua | 0.3526 | 0.3964 | 0.4248 | 0.4341 | 0.4606 | 0.4915 | 0.5570 | 0.5410 | 0.5718 | 0.5243 | 0.5715 |
| Huai’an | 0.4195 | 0.4509 | 0.4898 | 0.4891 | 0.5066 | 0.5385 | 0.5608 | 0.5861 | 0.6191 | 0.5915 | 0.6330 |
| Huaibei | 0.3063 | 0.3437 | 0.3745 | 0.3926 | 0.4174 | 0.4557 | 0.4846 | 0.4841 | 0.5220 | 0.5131 | 0.5418 |
| Huainan | 0.3160 | 0.3604 | 0.3868 | 0.4035 | 0.4422 | 0.4786 | 0.5093 | 0.5113 | 0.5464 | 0.5157 | 0.5384 |
| Huanggang | 0.3228 | 0.3724 | 0.4016 | 0.4138 | 0.4401 | 0.4688 | 0.5192 | 0.5179 | 0.5568 | 0.5038 | 0.5592 |
| Huangshan | 0.3867 | 0.4121 | 0.4419 | 0.4514 | 0.4769 | 0.4936 | 0.5316 | 0.5345 | 0.5556 | 0.5745 | 0.6034 |
| Huangshi | 0.3315 | 0.3693 | 0.4001 | 0.4200 | 0.4379 | 0.4686 | 0.5023 | 0.5046 | 0.5444 | 0.5524 | 0.6104 |
| Huizhou | 0.3602 | 0.3874 | 0.4290 | 0.4309 | 0.4479 | 0.4630 | 0.4729 | 0.4820 | 0.5008 | 0.5142 | 0.5435 |
| Jixi | 0.3057 | 0.3271 | 0.3622 | 0.3525 | 0.3755 | 0.3883 | 0.4047 | 0.4281 | 0.4571 | 0.4496 | 0.5111 |
| Ji’an | 0.3304 | 0.3626 | 0.3839 | 0.3966 | 0.4144 | 0.4411 | 0.4848 | 0.4953 | 0.5179 | 0.5354 | 0.5734 |
| Jilin | 0.4229 | 0.4383 | 0.4679 | 0.4775 | 0.4932 | 0.5043 | 0.5353 | 0.5393 | 0.5473 | 0.5481 | 0.5569 |
| Jinan | 0.5655 | 0.5906 | 0.6312 | 0.6483 | 0.6716 | 0.6890 | 0.7108 | 0.7262 | 0.7630 | 0.7611 | 0.7348 |
| Jining | 0.4170 | 0.4463 | 0.4762 | 0.5016 | 0.5211 | 0.5439 | 0.5701 | 0.5705 | 0.5975 | 0.6317 | 0.6164 |
| Jiamusi | 0.3269 | 0.3546 | 0.4077 | 0.4028 | 0.4128 | 0.4235 | 0.4897 | 0.4257 | 0.4547 | 0.4762 | 0.4729 |
| Jiaxing | 0.4423 | 0.4727 | 0.5016 | 0.5117 | 0.5360 | 0.5538 | 0.5864 | 0.5965 | 0.6435 | 0.6296 | 0.6562 |
| Jiayuguan | 0.2239 | 0.2514 | 0.2754 | 0.3331 | 0.3379 | 0.3837 | 0.3963 | 0.4044 | 0.4238 | 0.3442 | 0.3774 |
| Jiangmen | 0.4014 | 0.4339 | 0.4670 | 0.4980 | 0.5071 | 0.5273 | 0.5488 | 0.5694 | 0.5935 | 0.5863 | 0.6088 |
| Jiaozuo | 0.3902 | 0.4104 | 0.4376 | 0.4592 | 0.4851 | 0.5223 | 0.5356 | 0.5555 | 0.5848 | 0.5302 | 0.5580 |
| Jieyang | 0.4119 | 0.4341 | 0.4356 | 0.4511 | 0.4662 | 0.4903 | 0.5035 | 0.5529 | 0.5970 | 0.5582 | 0.5853 |
| Jinchang | 0.2131 | 0.2465 | 0.2608 | 0.2955 | 0.3127 | 0.3574 | 0.3534 | 0.3772 | 0.4179 | 0.3960 | 0.4300 |
| Jinhua | 0.4611 | 0.4875 | 0.5254 | 0.5307 | 0.5571 | 0.5754 | 0.5960 | 0.6187 | 0.6556 | 0.6528 | 0.6932 |
| Jinzhou | 0.3435 | 0.3533 | 0.3776 | 0.3949 | 0.4029 | 0.4115 | 0.4431 | 0.4510 | 0.4901 | 0.4278 | 0.4521 |
| Jincheng | 0.3402 | 0.3600 | 0.3815 | 0.4048 | 0.4305 | 0.4586 | 0.4995 | 0.4970 | 0.5279 | 0.5013 | 0.5289 |
| Jinzhong | 0.3636 | 0.3672 | 0.3985 | 0.4179 | 0.4450 | 0.4822 | 0.4840 | 0.4972 | 0.5286 | 0.5355 | 0.5572 |
| Jingmen | 0.3266 | 0.3408 | 0.3799 | 0.3962 | 0.4197 | 0.4449 | 0.4658 | 0.5030 | 0.5255 | 0.5360 | 0.5756 |
| Jingzhou | 0.3095 | 0.3242 | 0.3547 | 0.3595 | 0.3867 | 0.4155 | 0.4483 | 0.4437 | 0.4664 | 0.4649 | 0.5026 |
| Jingdezhen | 0.3193 | 0.3446 | 0.3921 | 0.4018 | 0.4295 | 0.4545 | 0.5056 | 0.4856 | 0.5250 | 0.5185 | 0.5555 |
| Jiujiang | 0.3540 | 0.3653 | 0.4091 | 0.4268 | 0.4656 | 0.4843 | 0.5425 | 0.5239 | 0.5505 | 0.5784 | 0.6074 |
| Jiuquan | 0.3109 | 0.3227 | 0.3463 | 0.3497 | 0.3850 | 0.4223 | 0.4656 | 0.4670 | 0.4764 | 0.4705 | 0.4941 |
| Kaifeng | 0.3752 | 0.3728 | 0.4137 | 0.4305 | 0.4640 | 0.4857 | 0.5326 | 0.5358 | 0.5569 | 0.5715 | 0.6040 |
| Karamay | 0.2831 | 0.3187 | 0.3337 | 0.3533 | 0.3895 | 0.4146 | 0.4386 | 0.4409 | 0.4617 | 0.4713 | 0.4784 |
| Kunming | 0.4843 | 0.5345 | 0.5583 | 0.5820 | 0.5995 | 0.6177 | 0.6541 | 0.6495 | 0.6819 | 0.7155 | 0.7365 |
| Laibin | 0.2629 | 0.3099 | 0.3107 | 0.3546 | 0.3805 | 0.4238 | 0.4656 | 0.4615 | 0.4714 | 0.4585 | 0.4796 |
| Laiwu | 0.2309 | 0.2852 | 0.2910 | 0.3093 | 0.3194 | 0.3459 | 0.3598 | 0.3737 | 0.4166 | 0.4382 | 0.4557 |
| Lanzhou | 0.3639 | 0.4008 | 0.4223 | 0.4469 | 0.4664 | 0.4962 | 0.5203 | 0.5170 | 0.5319 | 0.5333 | 0.5473 |
| Langfang | 0.4204 | 0.4628 | 0.4803 | 0.5087 | 0.5409 | 0.5696 | 0.6289 | 0.6099 | 0.6324 | 0.6426 | 0.6626 |
| Leshan | 0.3418 | 0.3794 | 0.3882 | 0.4170 | 0.4376 | 0.4667 | 0.5049 | 0.5067 | 0.5184 | 0.5249 | 0.5431 |
| Lijiang | 0.2558 | 0.2984 | 0.3282 | 0.3453 | 0.3820 | 0.4077 | 0.4657 | 0.4341 | 0.4646 | 0.4658 | 0.4865 |
| Lishui | 0.3996 | 0.4353 | 0.4568 | 0.4784 | 0.5044 | 0.5353 | 0.5688 | 0.5712 | 0.5902 | 0.6063 | 0.6286 |
| Lianyungang | 0.4320 | 0.4720 | 0.5029 | 0.4931 | 0.5196 | 0.5476 | 0.5799 | 0.5751 | 0.6056 | 0.6166 | 0.6550 |
| Liaoyang | 0.3520 | 0.3713 | 0.3918 | 0.4076 | 0.4201 | 0.4540 | 0.4543 | 0.4516 | 0.4702 | 0.4855 | 0.4988 |
| Liaoyuan | 0.3037 | 0.3364 | 0.3365 | 0.3340 | 0.3611 | 0.3800 | 0.4008 | 0.4015 | 0.4267 | 0.4521 | 0.4869 |
| Liaocheng | 0.3977 | 0.4356 | 0.4819 | 0.4604 | 0.4887 | 0.5222 | 0.5344 | 0.5411 | 0.5637 | 0.5760 | 0.5985 |
| Lincang | 0.2523 | 0.2933 | 0.3067 | 0.3068 | 0.3477 | 0.3846 | 0.4290 | 0.4247 | 0.4587 | 0.4682 | 0.4915 |
| Linfen | 0.3598 | 0.3910 | 0.4045 | 0.4236 | 0.4477 | 0.4797 | 0.5385 | 0.5096 | 0.5105 | 0.5255 | 0.5455 |
| Linyi | 0.4508 | 0.4860 | 0.5075 | 0.5207 | 0.5409 | 0.5667 | 0.5984 | 0.5926 | 0.6094 | 0.6374 | 0.6522 |
| Liuzhou | 0.3291 | 0.3784 | 0.3777 | 0.3970 | 0.4177 | 0.4404 | 0.4579 | 0.4434 | 0.4482 | 0.4546 | 0.4668 |
| Lu’an | 0.3872 | 0.4193 | 0.4352 | 0.4558 | 0.5003 | 0.5253 | 0.5582 | 0.5753 | 0.6068 | 0.6306 | 0.6484 |
| Liupanshui | 0.2639 | 0.2946 | 0.3370 | 0.3611 | 0.3987 | 0.4282 | 0.4676 | 0.4588 | 0.4747 | 0.4792 | 0.5031 |
| Longyan | 0.3573 | 0.3989 | 0.4317 | 0.4604 | 0.4878 | 0.5229 | 0.5457 | 0.5477 | 0.5679 | 0.5767 | 0.5976 |
| Longnan | 0.2078 | 0.2358 | 0.2731 | 0.3066 | 0.3418 | 0.3600 | 0.4114 | 0.3534 | 0.4378 | 0.4637 | 0.4922 |
| Loudi | 0.3569 | 0.3939 | 0.3929 | 0.4069 | 0.4235 | 0.4475 | 0.5027 | 0.4972 | 0.5230 | 0.5391 | 0.5576 |
| Luzhou | 0.2676 | 0.3060 | 0.3195 | 0.3405 | 0.3639 | 0.3868 | 0.4305 | 0.4202 | 0.4358 | 0.4377 | 0.4596 |
| Luoyang | 0.4422 | 0.4835 | 0.5124 | 0.5420 | 0.5610 | 0.5935 | 0.6438 | 0.6441 | 0.6580 | 0.6694 | 0.6918 |
| Luohe | 0.2831 | 0.3163 | 0.3485 | 0.3643 | 0.3602 | 0.3908 | 0.4228 | 0.4295 | 0.5165 | 0.5435 | 0.5795 |
| Luliang | 0.3093 | 0.3610 | 0.3566 | 0.3668 | 0.3890 | 0.4174 | 0.4808 | 0.4600 | 0.4854 | 0.4843 | 0.5234 |
| Ma’anshan | 0.3628 | 0.4100 | 0.4385 | 0.4419 | 0.4748 | 0.5300 | 0.5607 | 0.5651 | 0.5894 | 0.6077 | 0.6342 |
| Maoming | 0.3564 | 0.4001 | 0.4329 | 0.4447 | 0.4715 | 0.4942 | 0.5180 | 0.5299 | 0.5588 | 0.5597 | 0.5927 |
| Meishan | 0.3291 | 0.3639 | 0.3841 | 0.3981 | 0.4178 | 0.4552 | 0.4963 | 0.5004 | 0.5175 | 0.5221 | 0.5568 |
| Meizhou | 0.3244 | 0.3428 | 0.3456 | 0.3687 | 0.3877 | 0.3899 | 0.4215 | 0.4418 | 0.4763 | 0.4218 | 0.4453 |
| Mianyang | 0.4151 | 0.4481 | 0.4690 | 0.4864 | 0.5143 | 0.5510 | 0.5998 | 0.6083 | 0.6174 | 0.6035 | 0.6235 |
| Mudanjiang | 0.3677 | 0.3772 | 0.4373 | 0.4128 | 0.4259 | 0.4515 | 0.4938 | 0.4930 | 0.5168 | 0.5149 | 0.5591 |
| Nanchang | 0.4798 | 0.5170 | 0.5456 | 0.5549 | 0.5688 | 0.6009 | 0.6496 | 0.6527 | 0.6770 | 0.6789 | 0.7162 |
| Nanchong | 0.3683 | 0.3871 | 0.4044 | 0.4133 | 0.4375 | 0.4706 | 0.5525 | 0.5219 | 0.5288 | 0.5474 | 0.5618 |
| Nanjing | 0.6066 | 0.6380 | 0.6945 | 0.6878 | 0.7117 | 0.7466 | 0.7763 | 0.7927 | 0.8214 | 0.8393 | 0.8634 |
| Nanning | 0.5101 | 0.5385 | 0.5507 | 0.5735 | 0.5979 | 0.6224 | 0.6575 | 0.6633 | 0.6894 | 0.6954 | 0.7183 |
| Nanping | 0.3680 | 0.3950 | 0.4207 | 0.4394 | 0.4727 | 0.4867 | 0.5075 | 0.5166 | 0.5419 | 0.5600 | 0.5919 |
| Nantong | 0.4933 | 0.5257 | 0.5486 | 0.5501 | 0.5734 | 0.6033 | 0.6444 | 0.6526 | 0.6749 | 0.6970 | 0.7301 |
| Nanyang | 0.3856 | 0.4205 | 0.4404 | 0.4733 | 0.4989 | 0.5365 | 0.5919 | 0.5969 | 0.6265 | 0.6313 | 0.6610 |
| Neijiang | 0.2912 | 0.3248 | 0.3269 | 0.3550 | 0.3799 | 0.4099 | 0.4793 | 0.4757 | 0.5033 | 0.4733 | 0.5173 |
| Ningbo | 0.5395 | 0.5804 | 0.6110 | 0.6238 | 0.6472 | 0.6655 | 0.7010 | 0.6983 | 0.7315 | 0.7016 | 0.7281 |
| Ningde | 0.3886 | 0.4094 | 0.4382 | 0.4432 | 0.4608 | 0.4896 | 0.5362 | 0.5267 | 0.5621 | 0.5326 | 0.5574 |
| Panzhihua | 0.3395 | 0.3829 | 0.3901 | 0.4255 | 0.4433 | 0.4711 | 0.5105 | 0.5025 | 0.5248 | 0.4863 | 0.5022 |
| Panjin | 0.3420 | 0.3734 | 0.3790 | 0.4021 | 0.4105 | 0.4244 | 0.4707 | 0.4578 | 0.4802 | 0.4556 | 0.4730 |
| Pingdingshan | 0.3552 | 0.3832 | 0.4100 | 0.4426 | 0.4396 | 0.4911 | 0.5299 | 0.5175 | 0.5555 | 0.5253 | 0.5577 |
| Pingliang | 0.2040 | 0.2559 | 0.2726 | 0.3212 | 0.3301 | 0.3837 | 0.4499 | 0.4050 | 0.4531 | 0.4289 | 0.4598 |
| Pingxiang | 0.3051 | 0.3458 | 0.3628 | 0.3761 | 0.3909 | 0.4314 | 0.4754 | 0.4793 | 0.5029 | 0.4712 | 0.4942 |
| Putian | 0.3404 | 0.4001 | 0.4172 | 0.4428 | 0.4658 | 0.5055 | 0.5375 | 0.5191 | 0.5639 | 0.5856 | 0.5632 |
| Puyang | 0.3278 | 0.3718 | 0.3997 | 0.4265 | 0.4437 | 0.5084 | 0.5409 | 0.5146 | 0.5550 | 0.5665 | 0.5484 |
| Qitaihe | 0.2122 | 0.2642 | 0.2908 | 0.2866 | 0.3023 | 0.3356 | 0.3679 | 0.3513 | 0.3705 | 0.3897 | 0.3691 |
| Qiqihar | 0.4233 | 0.4308 | 0.4855 | 0.4960 | 0.4889 | 0.5267 | 0.5759 | 0.5359 | 0.5553 | 0.5660 | 0.5510 |
| Qinzhou | 0.2674 | 0.3019 | 0.3056 | 0.3377 | 0.3440 | 0.3788 | 0.4027 | 0.3904 | 0.4204 | 0.4384 | 0.4084 |
| Qinhuangdao | 0.4248 | 0.4667 | 0.4823 | 0.4960 | 0.5124 | 0.5603 | 0.5804 | 0.5657 | 0.5885 | 0.6090 | 0.5826 |
| Qingdao | 0.5417 | 0.5867 | 0.6208 | 0.6572 | 0.6579 | 0.6997 | 0.7295 | 0.7293 | 0.7595 | 0.7798 | 0.7611 |
| Qingyuan | 0.3217 | 0.3808 | 0.4053 | 0.4144 | 0.4435 | 0.4768 | 0.5129 | 0.5152 | 0.5479 | 0.5694 | 0.5431 |
| Qingyang | 0.3036 | 0.3237 | 0.3023 | 0.3420 | 0.3625 | 0.3946 | 0.4399 | 0.4227 | 0.4585 | 0.4795 | 0.4620 |
| Quzhou | 0.3209 | 0.3428 | 0.3661 | 0.3767 | 0.4013 | 0.4244 | 0.4511 | 0.4534 | 0.4765 | 0.4867 | 0.5096 |
| Qujing | 0.3053 | 0.3259 | 0.3730 | 0.3806 | 0.4029 | 0.4441 | 0.4874 | 0.4596 | 0.4975 | 0.5230 | 0.5582 |
| Quanzhou | 0.3754 | 0.4049 | 0.4350 | 0.4265 | 0.4513 | 0.4787 | 0.5023 | 0.5083 | 0.5179 | 0.5207 | 0.5365 |
| Sunshine | 0.3691 | 0.4036 | 0.4235 | 0.4418 | 0.4606 | 0.4912 | 0.5176 | 0.5205 | 0.5448 | 0.5706 | 0.5989 |
| Sanmenxia | 0.3231 | 0.3612 | 0.3891 | 0.4142 | 0.4330 | 0.4503 | 0.4751 | 0.4688 | 0.5094 | 0.5225 | 0.5469 |
| Sanming | 0.3620 | 0.4003 | 0.4202 | 0.4303 | 0.4589 | 0.4881 | 0.5163 | 0.5100 | 0.5245 | 0.5331 | 0.5547 |
| Sanya | 0.4046 | 0.4147 | 0.4467 | 0.4482 | 0.4766 | 0.5054 | 0.5115 | 0.5267 | 0.5590 | 0.5666 | 0.5952 |
| Xiamen | 0.5189 | 0.5613 | 0.5969 | 0.6043 | 0.6352 | 0.6685 | 0.6871 | 0.7156 | 0.7401 | 0.7604 | 0.7797 |
| Shantou | 0.4460 | 0.4717 | 0.4943 | 0.4918 | 0.5233 | 0.5410 | 0.5582 | 0.5592 | 0.5922 | 0.6008 | 0.6349 |
| Shanwei | 0.3135 | 0.3470 | 0.3663 | 0.3606 | 0.3903 | 0.4105 | 0.4479 | 0.4731 | 0.5129 | 0.4827 | 0.5148 |
| Shangluo | 0.2729 | 0.3073 | 0.3193 | 0.3168 | 0.3496 | 0.3777 | 0.4017 | 0.4159 | 0.4458 | 0.4612 | 0.4492 |
| Shangqiu | 0.3551 | 0.3958 | 0.4016 | 0.4157 | 0.4506 | 0.4782 | 0.5121 | 0.5257 | 0.5570 | 0.5633 | 0.5477 |
| Shanghai | 0.6848 | 0.7219 | 0.7889 | 0.7749 | 0.8080 | 0.7881 | 0.8566 | 0.8739 | 0.9168 | 0.9221 | 0.8839 |
| Shangrao | 0.3445 | 0.3816 | 0.4013 | 0.4108 | 0.4488 | 0.4309 | 0.5166 | 0.5099 | 0.5402 | 0.5590 | 0.5355 |
| Shaoguan | 0.3595 | 0.3933 | 0.4199 | 0.4520 | 0.4636 | 0.4645 | 0.5320 | 0.5345 | 0.5441 | 0.5432 | 0.5339 |
| Shaoyang | 0.3511 | 0.3837 | 0.4091 | 0.4290 | 0.4371 | 0.4403 | 0.5152 | 0.5118 | 0.5482 | 0.5674 | 0.5492 |
| Shaoxing | 0.4727 | 0.5116 | 0.5302 | 0.5447 | 0.5632 | 0.5611 | 0.6236 | 0.6297 | 0.6522 | 0.6720 | 0.6453 |
| Shenzhen | 0.6819 | 0.7367 | 0.7712 | 0.7778 | 0.7945 | 0.7886 | 0.8434 | 0.8605 | 0.8855 | 0.8955 | 0.8568 |
| Shenyang | 0.5566 | 0.5924 | 0.6081 | 0.6133 | 0.6268 | 0.6308 | 0.6799 | 0.6889 | 0.7163 | 0.6843 | 0.7110 |
| Shiyan | 0.3517 | 0.3922 | 0.4299 | 0.4330 | 0.4460 | 0.4519 | 0.5152 | 0.5265 | 0.5604 | 0.5632 | 0.6003 |
| Shijiazhuang | 0.4992 | 0.5413 | 0.5729 | 0.5799 | 0.5960 | 0.5990 | 0.6740 | 0.6697 | 0.6936 | 0.7143 | 0.7314 |
| Shizuishan | 0.2770 | 0.3265 | 0.3335 | 0.3371 | 0.3525 | 0.3870 | 0.4179 | 0.4312 | 0.4562 | 0.4741 | 0.4894 |
| Shuangyashan | 0.2767 | 0.2984 | 0.3413 | 0.3458 | 0.3607 | 0.3874 | 0.4260 | 0.3818 | 0.4078 | 0.4136 | 0.4495 |
| Shuozhou | 0.2594 | 0.2925 | 0.3081 | 0.3222 | 0.3140 | 0.3599 | 0.4006 | 0.3798 | 0.3863 | 0.3925 | 0.4245 |
| Siping | 0.3369 | 0.3725 | 0.3816 | 0.4184 | 0.4132 | 0.4409 | 0.4713 | 0.4824 | 0.4962 | 0.4995 | 0.5335 |
| Matsubara | 0.3167 | 0.3473 | 0.3567 | 0.3654 | 0.3754 | 0.4140 | 0.4319 | 0.4410 | 0.4465 | 0.4626 | 0.4960 |
| Suzhou | 0.4423 | 0.4780 | 0.5260 | 0.5109 | 0.5184 | 0.5446 | 0.5631 | 0.5797 | 0.5986 | 0.6135 | 0.6346 |
| Suizhou | 0.2766 | 0.3012 | 0.3292 | 0.3410 | 0.3538 | 0.3763 | 0.4227 | 0.4156 | 0.3996 | 0.3807 | 0.4195 |
| Suining | 0.3119 | 0.3731 | 0.3637 | 0.3917 | 0.4138 | 0.4420 | 0.4774 | 0.4930 | 0.4724 | 0.4482 | 0.4662 |
| Taizhou | 0.3788 | 0.4125 | 0.4317 | 0.4452 | 0.4547 | 0.4786 | 0.5039 | 0.5074 | 0.5022 | 0.4839 | 0.4659 |
| Taiyuan | 0.5155 | 0.5521 | 0.5750 | 0.5955 | 0.6160 | 0.6457 | 0.6667 | 0.6887 | 0.7024 | 0.6610 | 0.6851 |
| Taian | 0.4130 | 0.4470 | 0.4741 | 0.4928 | 0.5114 | 0.5388 | 0.5620 | 0.5670 | 0.5835 | 0.5496 | 0.5666 |
| Taizhou | 0.3710 | 0.4032 | 0.4077 | 0.4072 | 0.4266 | 0.4592 | 0.4817 | 0.4818 | 0.4779 | 0.4763 | 0.5035 |
| Tangshan | 0.4538 | 0.4821 | 0.4864 | 0.5017 | 0.5290 | 0.5506 | 0.5710 | 0.5836 | 0.5826 | 0.5786 | 0.5997 |
| Tianjin | 0.5849 | 0.6235 | 0.6432 | 0.6536 | 0.7008 | 0.7211 | 0.7349 | 0.7462 | 0.7597 | 0.7604 | 0.7692 |
| Tianshui | 0.3130 | 0.3520 | 0.3682 | 0.4121 | 0.4319 | 0.4549 | 0.4796 | 0.4672 | 0.4815 | 0.4698 | 0.4836 |
| Tieling | 0.3302 | 0.3683 | 0.3747 | 0.3898 | 0.4009 | 0.4217 | 0.4769 | 0.4521 | 0.4747 | 0.4442 | 0.4635 |
| Tonghua | 0.3647 | 0.3926 | 0.4150 | 0.4054 | 0.4228 | 0.4325 | 0.4973 | 0.4920 | 0.5181 | 0.5247 | 0.5708 |
| Tongliao | 0.3282 | 0.3601 | 0.3682 | 0.3970 | 0.4265 | 0.4334 | 0.4576 | 0.4660 | 0.4829 | 0.4937 | 0.5286 |
| Tongchuan | 0.2299 | 0.2510 | 0.2634 | 0.2826 | 0.2975 | 0.3288 | 0.3536 | 0.3703 | 0.4036 | 0.4232 | 0.4018 |
| Tongling | 0.2827 | 0.3526 | 0.3808 | 0.4063 | 0.4180 | 0.4605 | 0.4849 | 0.4892 | 0.5079 | 0.5398 | 0.5076 |
| Weihai | 0.4127 | 0.4571 | 0.4856 | 0.5082 | 0.5253 | 0.5522 | 0.5675 | 0.5816 | 0.6030 | 0.6164 | 0.5949 |
| Weifang | 0.4450 | 0.5071 | 0.5410 | 0.5531 | 0.5747 | 0.5931 | 0.6189 | 0.6276 | 0.6490 | 0.6708 | 0.6523 |
| Weinan | 0.3475 | 0.4005 | 0.4112 | 0.4251 | 0.4384 | 0.4671 | 0.4941 | 0.4920 | 0.5057 | 0.5344 | 0.5638 |
| Wenzhou | 0.4061 | 0.4417 | 0.4696 | 0.4738 | 0.4908 | 0.5237 | 0.5391 | 0.5522 | 0.5520 | 0.5844 | 0.6092 |
| Wuhai | 0.2736 | 0.3088 | 0.3308 | 0.3508 | 0.3592 | 0.3913 | 0.4005 | 0.4153 | 0.4384 | 0.4420 | 0.4565 |
| Ulanqab | 0.2690 | 0.3436 | 0.3540 | 0.3667 | 0.3906 | 0.4148 | 0.4457 | 0.4403 | 0.4509 | 0.4521 | 0.4742 |
| Urumqi | 0.5052 | 0.5238 | 0.5562 | 0.5608 | 0.5855 | 0.6123 | 0.6302 | 0.6489 | 0.6734 | 0.6791 | 0.7000 |
| Wuxi | 0.5535 | 0.5884 | 0.6338 | 0.6238 | 0.6409 | 0.6740 | 0.7030 | 0.7122 | 0.7340 | 0.7506 | 0.7792 |
| Wuhu | 0.4206 | 0.4622 | 0.4895 | 0.5090 | 0.5487 | 0.5689 | 0.6084 | 0.6265 | 0.6411 | 0.6570 | 0.6851 |
| Wuhong | 0.2519 | 0.2956 | 0.3204 | 0.3291 | 0.3612 | 0.3751 | 0.3943 | 0.4348 | 0.4658 | 0.4742 | 0.4987 |
| Wuzhou | 0.2824 | 0.3123 | 0.3260 | 0.3147 | 0.3547 | 0.3694 | 0.4064 | 0.4116 | 0.4220 | 0.4392 | 0.4499 |
| Wuhan | 0.5906 | 0.6225 | 0.6640 | 0.6756 | 0.6978 | 0.7253 | 0.7467 | 0.7690 | 0.7932 | 0.7939 | 0.8291 |
| Wuwei | 0.2829 | 0.2840 | 0.2873 | 0.3233 | 0.3549 | 0.3863 | 0.4193 | 0.4317 | 0.4581 | 0.4749 | 0.4871 |
| Xi’an | 0.5987 | 0.6214 | 0.6690 | 0.6768 | 0.6986 | 0.7323 | 0.7562 | 0.7686 | 0.7894 | 0.8028 | 0.8248 |
| Xining | 0.3988 | 0.4261 | 0.4533 | 0.4641 | 0.5016 | 0.5203 | 0.5724 | 0.5763 | 0.6089 | 0.6153 | 0.5968 |
| Xianning | 0.3319 | 0.3506 | 0.3844 | 0.4058 | 0.4318 | 0.4563 | 0.4638 | 0.5154 | 0.5388 | 0.4835 | 0.5177 |
| Xianyang | 0.4076 | 0.4330 | 0.4529 | 0.4534 | 0.4718 | 0.4978 | 0.5450 | 0.5483 | 0.5719 | 0.5837 | 0.5654 |
| Xiangtan | 0.3926 | 0.4104 | 0.4413 | 0.4851 | 0.5012 | 0.5225 | 0.5351 | 0.5545 | 0.5825 | 0.6046 | 0.5789 |
| Xiaogan | 0.3389 | 0.3691 | 0.4013 | 0.4193 | 0.4397 | 0.4654 | 0.5058 | 0.5179 | 0.5543 | 0.5604 | 0.5575 |
| Xinzhou | 0.2842 | 0.3074 | 0.3205 | 0.3348 | 0.3452 | 0.3671 | 0.4026 | 0.3853 | 0.4136 | 0.4190 | 0.4117 |
| Xinxiang | 0.4064 | 0.4410 | 0.4486 | 0.4688 | 0.5005 | 0.5355 | 0.5878 | 0.5847 | 0.6118 | 0.6273 | 0.6111 |
| Xinyu | 0.2960 | 0.3367 | 0.3476 | 0.3824 | 0.4086 | 0.4348 | 0.4462 | 0.4656 | 0.4943 | 0.5081 | 0.4811 |
| Xinyang | 0.3464 | 0.3836 | 0.3942 | 0.4169 | 0.4396 | 0.4908 | 0.5010 | 0.5175 | 0.5439 | 0.5638 | 0.5971 |
| Xingtai | 0.3811 | 0.4082 | 0.4143 | 0.4336 | 0.4642 | 0.4920 | 0.5414 | 0.5544 | 0.5751 | 0.5939 | 0.6150 |
| Suqian | 0.3788 | 0.4172 | 0.4334 | 0.4437 | 0.4652 | 0.4957 | 0.5343 | 0.5422 | 0.5766 | 0.6190 | 0.6699 |
| Suzhou | 0.2848 | 0.3195 | 0.3251 | 0.3706 | 0.4001 | 0.3991 | 0.4494 | 0.4326 | 0.4610 | 0.5879 | 0.6211 |
| Xuzhou | 0.3814 | 0.4175 | 0.4467 | 0.4353 | 0.4454 | 0.4644 | 0.5042 | 0.5125 | 0.5423 | 0.5655 | 0.5968 |
| Xuchang | 0.3657 | 0.4068 | 0.4199 | 0.4483 | 0.4772 | 0.4944 | 0.5420 | 0.5458 | 0.5779 | 0.6127 | 0.6444 |
| Xuancheng | 0.3686 | 0.4054 | 0.4298 | 0.4329 | 0.4595 | 0.4826 | 0.5199 | 0.5328 | 0.5525 | 0.5582 | 0.6016 |
| Ya’an | 0.3011 | 0.3523 | 0.3631 | 0.3921 | 0.4162 | 0.4313 | 0.4853 | 0.4822 | 0.5151 | 0.5151 | 0.5488 |
| Yantai | 0.4572 | 0.5015 | 0.5281 | 0.5510 | 0.5785 | 0.5953 | 0.6341 | 0.6306 | 0.6590 | 0.6755 | 0.7048 |
| Yan’an | 0.2754 | 0.3176 | 0.3249 | 0.3528 | 0.3857 | 0.4081 | 0.4827 | 0.4635 | 0.4688 | 0.4719 | 0.5139 |
| Yancheng | 0.4335 | 0.4684 | 0.4971 | 0.4991 | 0.5249 | 0.5503 | 0.5960 | 0.6151 | 0.6578 | 0.6851 | 0.7205 |
| Yangzhou | 0.3621 | 0.3975 | 0.4174 | 0.4170 | 0.4370 | 0.4574 | 0.4971 | 0.4922 | 0.5159 | 0.5367 | 0.5569 |
| Yangjiang | 0.3201 | 0.3537 | 0.3723 | 0.3866 | 0.4126 | 0.4274 | 0.4581 | 0.4828 | 0.5040 | 0.5165 | 0.5320 |
| Yangquan | 0.2945 | 0.3378 | 0.3502 | 0.3699 | 0.3915 | 0.4198 | 0.4511 | 0.4558 | 0.4888 | 0.5097 | 0.5269 |
| Yichun | 0.2092 | 0.2526 | 0.2745 | 0.2410 | 0.2755 | 0.2759 | 0.3014 | 0.3042 | 0.3319 | 0.3476 | 0.3814 |
| Yibin | 0.3277 | 0.3596 | 0.3789 | 0.4120 | 0.4374 | 0.4656 | 0.5158 | 0.4993 | 0.5301 | 0.5452 | 0.5620 |
| Yichang | 0.3875 | 0.4470 | 0.4596 | 0.5044 | 0.5014 | 0.5418 | 0.5619 | 0.5763 | 0.5998 | 0.5977 | 0.6408 |
| Yichun | 0.2684 | 0.3014 | 0.3150 | 0.3426 | 0.3582 | 0.3839 | 0.4131 | 0.4412 | 0.4656 | 0.3672 | 0.3495 |
| Yiyang | 0.3428 | 0.3811 | 0.3970 | 0.4283 | 0.4418 | 0.4734 | 0.5115 | 0.5306 | 0.5451 | 0.5583 | 0.5824 |
| Yinchuan | 0.3904 | 0.4369 | 0.4674 | 0.5169 | 0.5311 | 0.5419 | 0.5820 | 0.5779 | 0.6058 | 0.5693 | 0.5896 |
| Yingtan | 0.2657 | 0.3249 | 0.3366 | 0.3672 | 0.3806 | 0.4161 | 0.4701 | 0.4463 | 0.4773 | 0.4266 | 0.4583 |
| Yingkou | 0.3908 | 0.4248 | 0.4394 | 0.4566 | 0.4676 | 0.4654 | 0.5320 | 0.5023 | 0.5298 | 0.4975 | 0.5133 |
| Yongzhou | 0.2933 | 0.3251 | 0.3341 | 0.3580 | 0.3714 | 0.3891 | 0.4369 | 0.4327 | 0.4607 | 0.4178 | 0.4385 |
| Yulin | 0.3303 | 0.3663 | 0.3801 | 0.3981 | 0.4133 | 0.4328 | 0.4654 | 0.4745 | 0.4964 | 0.4958 | 0.5279 |
| Yulin | 0.3440 | 0.3842 | 0.3947 | 0.4032 | 0.4449 | 0.4514 | 0.5288 | 0.5251 | 0.5371 | 0.5091 | 0.5335 |
| Yuxi | 0.3396 | 0.3704 | 0.3946 | 0.4036 | 0.4399 | 0.4497 | 0.4588 | 0.4739 | 0.5328 | 0.5152 | 0.5441 |
| Yueyang | 0.3937 | 0.4311 | 0.4578 | 0.4591 | 0.4951 | 0.5036 | 0.5684 | 0.5441 | 0.5879 | 0.5677 | 0.5960 |
| Yunfu | 0.3000 | 0.3240 | 0.3396 | 0.3476 | 0.4141 | 0.4183 | 0.4521 | 0.4581 | 0.4997 | 0.4807 | 0.5099 |
| Yuncheng | 0.3796 | 0.3990 | 0.4277 | 0.4283 | 0.4621 | 0.4809 | 0.5689 | 0.5179 | 0.5611 | 0.5530 | 0.5679 |
| Zaozhuang | 0.3818 | 0.4063 | 0.4326 | 0.4445 | 0.4678 | 0.4747 | 0.5021 | 0.5267 | 0.5450 | 0.5681 | 0.5949 |
| Zhanjiang | 0.4193 | 0.4470 | 0.4708 | 0.4807 | 0.5131 | 0.5324 | 0.5591 | 0.5491 | 0.5694 | 0.5867 | 0.6030 |
| Zhangjiajie | 0.3267 | 0.3606 | 0.3742 | 0.3957 | 0.4251 | 0.4448 | 0.4923 | 0.4926 | 0.5169 | 0.5152 | 0.5287 |
| Zhangjiakou | 0.3778 | 0.4036 | 0.4297 | 0.4350 | 0.4672 | 0.4925 | 0.5253 | 0.5327 | 0.5509 | 0.5655 | 0.5842 |
| Zhangye | 0.2767 | 0.3057 | 0.3267 | 0.3407 | 0.3862 | 0.4107 | 0.4551 | 0.4631 | 0.4791 | 0.4888 | 0.5069 |
| Zhangzhou | 0.3413 | 0.3697 | 0.3920 | 0.3902 | 0.4127 | 0.4352 | 0.4719 | 0.4752 | 0.4878 | 0.4848 | 0.4964 |
| Zhaotong | 0.2681 | 0.2893 | 0.3216 | 0.3342 | 0.3712 | 0.3900 | 0.4406 | 0.4292 | 0.4703 | 0.4340 | 0.4648 |
| Zhaoqing | 0.4132 | 0.4518 | 0.4671 | 0.4737 | 0.4840 | 0.4895 | 0.5527 | 0.5670 | 0.5820 | 0.5641 | 0.5997 |
| Zhenjiang | 0.4502 | 0.5023 | 0.5460 | 0.5369 | 0.5701 | 0.5989 | 0.6431 | 0.6332 | 0.6652 | 0.6327 | 0.6616 |
| Zhengzhou | 0.4195 | 0.4522 | 0.4728 | 0.4920 | 0.5206 | 0.5461 | 0.5846 | 0.5880 | 0.6345 | 0.6051 | 0.6256 |
| Zhongshan | 0.4755 | 0.5104 | 0.5400 | 0.5395 | 0.5646 | 0.5880 | 0.6268 | 0.6397 | 0.6496 | 0.5805 | 0.6059 |
| Zhongwei | 0.2126 | 0.2547 | 0.3011 | 0.3149 | 0.3364 | 0.3729 | 0.4114 | 0.4193 | 0.4384 | 0.3980 | 0.4227 |
| Zhoushan | 0.4125 | 0.4402 | 0.4823 | 0.5260 | 0.5463 | 0.5645 | 0.5880 | 0.5867 | 0.6019 | 0.6149 | 0.6242 |
| Zhoukou | 0.3661 | 0.3773 | 0.4042 | 0.4157 | 0.4477 | 0.4798 | 0.5272 | 0.5304 | 0.5600 | 0.5562 | 0.5906 |
| Zhuhai | 0.4748 | 0.5029 | 0.5593 | 0.5686 | 0.5976 | 0.6338 | 0.6689 | 0.6834 | 0.7141 | 0.7258 | 0.7500 |
| Zhuzhou | 0.4150 | 0.4471 | 0.4831 | 0.4924 | 0.5157 | 0.5419 | 0.5815 | 0.5922 | 0.6098 | 0.5941 | 0.6121 |
| Zhumadian | 0.3530 | 0.3614 | 0.3986 | 0.4183 | 0.4404 | 0.4759 | 0.5170 | 0.5345 | 0.5497 | 0.5599 | 0.5816 |
| Ziyang | 0.3227 | 0.3398 | 0.3518 | 0.3789 | 0.4105 | 0.4192 | 0.4553 | 0.4676 | 0.4937 | 0.5091 | 0.5237 |
| Zibo | 0.4473 | 0.4747 | 0.5039 | 0.5191 | 0.5416 | 0.5667 | 0.5922 | 0.5930 | 0.6136 | 0.6366 | 0.6683 |
| Zigong | 0.3521 | 0.3987 | 0.4029 | 0.4221 | 0.4383 | 0.4690 | 0.5223 | 0.5288 | 0.5473 | 0.5500 | 0.5655 |
| Zunyi | 0.3976 | 0.4251 | 0.4428 | 0.4682 | 0.4897 | 0.5171 | 0.5590 | 0.5740 | 0.5803 | 0.5851 | 0.6096 |
Table A2.
Descriptive statistics for all variables.
| Variable | Specific Name | Sample Size | Mean | Median | Standard Deviation | Minimum | Variable |
|---|---|---|---|---|---|---|---|
| Natural logarithm of regional gross domestic product | 3080 | 7.335 | 7.244 | 0.978 | 5.033 | 10.133 | |
| Comprehensive evaluation score for urban digitalization construction level | 3080 | 0.482 | 0.472 | 0.117 | 0.204 | 0.939 | |
| Natural logarithm of the number of urban employed persons at the end of the year | 3080 | 3.633 | 3.553 | 0.857 | 1.867 | 6.583 | |
| Natural logarithm of the number of industrial enterprises above a designated scale | 3080 | 6.584 | 6.583 | 1.099 | 3.367 | 9.243 | |
| Natural logarithm of fixed asset investment | 3080 | 16.382 | 16.411 | 0.982 | 12.352 | 18.651 | |
| Natural logarithm of public budget expenditure | 3080 | 13.451 | 13.383 | 1.351 | 10.121 | 17.522 | |
| Natural logarithm of telecommunications service revenue | 3080 | 12.521 | 12.432 | 0.976 | 9.667 | 15.582 | |
| Natural logarithm of year-end mobile phone users | 3080 | 5.840 | 5.814 | 0.782 | 3.871 | 8.210 | |
| Natural logarithm of broadband access users | 3080 | 4.257 | 4.220 | 0.932 | 1.938 | 6.662 | |
| Natural logarithm of per capita regional gross domestic product | 3080 | 10.782 | 10.763 | 0.572 | 9.289 | 12.151 | |
| Regional gross domestic product growth rate | 3080 | 8.048 | 8.100 | 3.767 | −6.630 | 17.882 | |
| Proportion of urban construction land to urban area | 3080 | 0.087 | 0.056 | 0.094 | 0.002 | 0.591 | |
| Natural logarithm of innovation index | 3080 | 1.202 | 1.021 | 1.873 | −3.316 | 6.727 | |
| Natural logarithm of scientific and technological expenditures | 3080 | 11.451 | 11.582 | 1.464 | 6.690 | 15.441 | |
| Proportion of employees in the tertiary industry | 3080 | 0.553 | 0.549 | 0.143 | 0.186 | 0.935 | |
| Natural logarithm of the number of information transmission employees | 3080 | 8.361 | 8.206 | 1.128 | 5.278 | 12.853 | |
| Proportion of the tertiary industry in GDP | 3080 | 0.430 | 0.425 | 0.105 | 0.192 | 0.773 | |
| Natural logarithm of the inclusive financial index | 3080 | 5.140 | 5.280 | 0.539 | 3.461 | 5.914 | |
| Greening coverage rate of built-up areas | 3080 | 0.400 | 0.410 | 0.0700 | 0.004 | 0.610 | |
| Natural logarithm of the number of green patents applied | 3080 | 5.397 | 5.286 | 1.704 | 1.386 | 10.062 | |
| Natural logarithm of industrial sulfur dioxide emissions | 3080 | 9.748 | 9.813 | 1.424 | 5.165 | 13.291 | |
| Natural logarithm of carbon dioxide emissions | 3080 | 3.206 | 3.229 | 0.819 | 0.269 | 5.628 |
Table A3.
Weighted ranking results of the indicator system.
| Primary Indicator | Primary Indicator Weight | Secondary Indicator | Secondary Indicator Weight |
|---|---|---|---|
| Digital Industry Development | 0.2890 | Digital Inclusive Finance Index ( | 0.1084 |
| Share of GDP from Tertiary Industry ( | 0.0734 | ||
| Share of Employees in Tertiary Industry ( | 0.0605 | ||
| Number of Employees in Information Transmission, Software, and Information Technology Services Industry ( | 0.0468 | ||
| Innovation Development | 0.2228 | Innovation Index ( | 0.1833 |
| Expenditure on Science and Technology ( | 0.0395 | ||
| Ecological Environment | 0.1963 | Green Patent Applications ( | 0.0698 |
| Industrial Sulfur Dioxide Emissions ( | 0.0620 | ||
| Carbon Dioxide Emissions ( | 0.0495 | ||
| Greening Coverage in Built-up Areas ( | 0.0149 | ||
| Digital Infrastructure | 0.1692 | Number of Internet Broadband Access Users ( | 0.0638 |
| Number of Year-End Mobile Phone Users ( | 0.0607 | ||
| Telecom Service Revenue ( | 0.0446 | ||
| Overall Economic Level | 0.1227 | Per Capita Regional Gross Domestic Product ( | 0.0578 |
| Share of Urban Construction Land in City Area ( | 0.0376 | ||
| Regional Gross Domestic Product Growth Rate ( | 0.0274 |
Table A4.
Regression results after substituting core explanatory variable (1).
| (1) | (2) | ||
|---|---|---|---|
| 0.0013 *** | 0.0011 *** | ||
| (10.6225) | (3.7116) | ||
| 0.1197 | 0.0039 | ||
| (1.5530) | (0.0748) | ||
| 0.3499 *** | 0.3173 *** | ||
| (5.8491) | (4.8955) | ||
| 0.1086 *** | 0.2373 *** | ||
| (4.1733) | (7.7841) | ||
| −0.0295 | −0.0059 | ||
| (−0.6280) | (−0.1080) | ||
| 2.6095 *** | 1.3016 *** | ||
| (6.1966) | (3.0794) | ||
| 3080 | 3080 | ||
| 0.2887 | 0.2339 | ||
| year | Yes | year | Yes |
| province | Yes | province | Yes |
Note: *, **, *** indicate significance levels at 10%, 5%, and 1%, respectively.
Table A5.
Regression results after substituting core explanatory variable (2).
| (1) | (2) | ||
|---|---|---|---|
| 0.0876 *** | 0.1720 *** | ||
| (6.6464) | (7.0706) | ||
| 0.1199 * | 0.1093 | ||
| (1.6894) | (1.5761) | ||
| 0.3310 *** | 0.3238 *** | ||
| (5.5094) | (5.1393) | ||
| 0.1601 *** | 0.1523 *** | ||
| (5.3580) | (5.1776) | ||
| −0.0322 | −0.0244 | ||
| (−0.6762) | (−0.5167) | ||
| 1.6767 *** | 1.6128 *** | ||
| (4.3927) | (4.1936) | ||
| 3080 | 3080 | ||
| 0.2671 | 0.2742 | ||
| year | Yes | year | Yes |
| province | Yes | province | Yes |
Note: *, **, *** indicate significance levels at 10%, 5%, and 1%, respectively.
Table A6.
Regression results after substituting control variables (1).
| (1) | (2) | (3) | (4) | ||
|---|---|---|---|---|---|
| OLS | FE | OLS | FE | ||
| −0.0009 *** | 0.0009 ** | 0.0004 *** | 0.0011 *** | ||
| (−8.3109) | (2.3026) | (4.3492) | (3.4512) | ||
| 0.9245 *** | 0.3710 *** | 0.9117 *** | 0.4179 *** | ||
| (80.8594) | (3.3180) | (72.7184) | (4.9920) | ||
| 0.5932 *** | 0.1623 | 0.5147 *** | 0.2371 *** | ||
| (30.3937) | (1.4927) | (30.7941) | (3.2996) | ||
| 0.2483 *** | 0.2321 | 0.2910 *** | 0.1901 | ||
| (2.8505) | (1.4826) | (3.1625) | (1.1640) | ||
| −0.2476 *** | 0.0827 | −0.4618 *** | 0.2464 ** | ||
| (−4.1135) | (0.7608) | (−8.0245) | (1.9933) | ||
| −0.0002 | −0.0006 ** | −0.0008 *** | −0.0006 ** | ||
| (−0.6576) | (−2.0142) | (−2.8606) | (−2.0194) | ||
| −4.1775 *** | 3.1980 ** | −3.3022 *** | 2.1338 *** | ||
| (−20.8858) | (2.4630) | (−17.5792) | (4.7796) | ||
| 3080 | 3080 | 3080 | 3080 | ||
| 0.8478 | 0.1994 | 0.8424 | 0.1605 | ||
| year | Yes | year | Yes | ||
| province | Yes | province | Yes |
Note: *, **, *** indicate significance levels at 10%, 5%, and 1%, respectively.
Table A7.
Regression results after substituting control variables (2).
| (1) | (2) | (3) | (4) | ||
|---|---|---|---|---|---|
| OLS | FE | OLS | FE | ||
| 0.0543 *** | 0.0600 *** | 0.0257 | 0.1038 *** | ||
| (5.6654) | (3.0428) | (1.2430) | (2.7783) | ||
| 0.8533 *** | 0.3979 *** | 0.8924 *** | 0.3529 *** | ||
| (48.8034) | (4.2964) | (36.0008) | (3.4955) | ||
| 0.4513 *** | 0.1967 ** | 0.5158 *** | 0.2098 ** | ||
| (21.5562) | (2.2444) | (30.3988) | (2.4923) | ||
| 0.2425 *** | 0.2095 | 0.3050 *** | 0.2037 | ||
| (2.7628) | (1.3224) | (3.4538) | (1.2193) | ||
| −0.4643 *** | 0.1881 * | −0.4298 *** | 0.2407 ** | ||
| (−8.9126) | (1.7234) | (−8.2462) | (2.2437) | ||
| −0.0006 ** | −0.0005 * | −0.0005 * | −0.0005 | ||
| (−1.9650) | (−1.6661) | (−1.7526) | (−1.6494) | ||
| −2.5531 *** | 2.4542 *** | −3.3201 *** | 2.4274 *** | ||
| (−10.6642) | (3.2569) | (−17.0138) | (2.9353) | ||
| 3080 | 3080 | 3080 | 3080 | ||
| 0.8475 | 0.1961 | 0.8451 | 0.1956 | ||
| year | Yes | year | Yes | ||
| province | Yes | province | Yes |
Note: *, **, *** indicate significance levels at 10%, 5%, and 1%, respectively.
Table A8.
Regression results for different study periods.
| (1) | (2) | (3) | |
|---|---|---|---|
| 2011–2014 | 2015–2016 | 2017–2019 | |
| 1.8980 *** | 1.1949 *** | 6.4258 *** | |
| (6.8811) | (6.2388) | (9.1206) | |
| 0.0830 *** | 0.0764 ** | −0.0694 | |
| (2.9329) | (2.1217) | (−0.2515) | |
| 0.1342 *** | 0.0139 | 0.3222 *** | |
| (3.3146) | (0.3357) | (2.7555) | |
| 0.1468 *** | 0.2851 *** | 0.2638 *** | |
| (3.2753) | (8.2147) | (4.0602) | |
| −0.0010 | −0.0004 | −0.0720 | |
| (−0.0570) | (−0.0196) | (−0.6570) | |
| 2.8846 *** | 1.7660 *** | −2.2119 | |
| (5.6273) | (4.1280) | (−1.3027) | |
| 1120 | 560 | 1400 | |
| 0.8258 | 0.7535 | 0.2225 | |
| year | Yes | Yes | Yes |
| province | Yes | Yes | Yes |
Note: *, **, *** indicate significance levels at 10%, 5%, and 1%, respectively.
Table A9.
Heterogeneity analysis results of the impact of the digital inclusive finance index on the evaluation score of digital construction level.
Table A9.
Heterogeneity analysis results of the impact of the digital inclusive finance index on the evaluation score of digital construction level.
| (1) | (2) | (3) | |
|---|---|---|---|
| Eastern Region | Central Region | Western Region | |
| 0.0007 *** | 0.0007 *** | 0.0007 *** | |
| (47.1090) | (42.3459) | (34.3354) | |
| 0.0295 *** | 0.0250 *** | 0.0402 *** | |
| (8.5098) | (5.7935) | (5.2229) | |
| 0.0292 *** | 0.0254 *** | 0.0386 *** | |
| (9.9885) | (6.5593) | (10.2636) | |
| 0.0166 | 0.0475 *** | −0.0019 | |
| (1.2896) | (2.6597) | (−0.1585) | |
| 0.0872 *** | 0.0973 *** | 0.0583 *** | |
| (8.4477) | (8.3861) | (4.4240) | |
| −0.0002 *** | −0.0002 *** | −0.0002 *** | |
| (−12.6247) | (−12.7052) | (−6.6956) | |
| −0.1493 *** | −0.1538 *** | −0.3241 *** | |
| (−4.0432) | (−3.5815) | (−6.2566) | |
| 1133 | 902 | 1045 | |
| 0.9690 | 0.9621 | 0.9636 | |
| year | Yes | Yes | Yes |
| province | Yes | Yes | Yes |
Note: *, **, *** indicate significance levels at 10%, 5%, and 1%, respectively.
Table A10.
Heterogeneity analysis results of the impact of the innovation index on the evaluation score of digital construction level.
Table A10.
Heterogeneity analysis results of the impact of the innovation index on the evaluation score of digital construction level.
| (1) | (2) | (3) | |
|---|---|---|---|
| Eastern Region | Central Region | Western Region | |
| 0.0002 *** | 0.0004 *** | 0.0004 *** | |
| (3.4412) | (4.7666) | (3.0753) | |
| 0.1506 *** | 0.0998 *** | 0.1154 *** | |
| (8.4374) | (6.5165) | (4.2326) | |
| 0.1234 *** | 0.1276 *** | 0.1303 *** | |
| (11.3885) | (10.3195) | (8.3331) | |
| 0.0287 | 0.0283 | −0.0023 | |
| (0.5805) | (1.1475) | (−0.0729) | |
| 0.2866 *** | 0.2762 *** | 0.3014 *** | |
| (7.6280) | (6.5969) | (6.6740) | |
| −0.0000 | −0.0001 ** | −0.0001 *** | |
| (−0.8860) | (−2.2779) | (−2.6809) | |
| −1.9027 *** | −1.6284 *** | −1.7308 *** | |
| (−17.6202) | (−18.3844) | (−17.3274) | |
| 1133 | 902 | 1045 | |
| 0.7968 | 0.7833 | 0.8155 | |
| year | Yes | Yes | Yes |
| province | Yes | Yes | Yes |
Note: *, **, *** indicate significance levels at 10%, 5%, and 1%, respectively.
Table A11.
Heterogeneity analysis results of the impact of the number of green patent applications on the evaluation score of digital construction level.
Table A11.
Heterogeneity analysis results of the impact of the number of green patent applications on the evaluation score of digital construction level.
| (1) | (2) | (3) | |
|---|---|---|---|
| Eastern Region | Central Region | Western Region | |
| 0.0868 *** | 0.0377 | 0.0606 | |
| (3.5842) | (1.5787) | (1.1979) | |
| 0.4476 ** | 0.4453 *** | 0.3224 *** | |
| (2.2487) | (4.2659) | (2.6310) | |
| 0.2011 * | 0.1338 | 0.2215 | |
| (1.7422) | (1.1016) | (1.2168) | |
| 0.6408 *** | 0.0407 | −0.2401 | |
| (3.2960) | (0.1034) | (−0.9046) | |
| 0.2268 | 0.3697 ** | −0.0964 | |
| (1.4889) | (2.1621) | (−0.5085) | |
| −0.0005 | 0.0005 | −0.0012 * | |
| (−1.3527) | (1.1370) | (−1.7670) | |
| 2.1460 * | 2.5651 *** | 2.7647 * | |
| (1.6678) | (2.9145) | (1.8200) | |
| 1133 | 902 | 1045 | |
| 0.8725 | 0.8873 | 0.8997 | |
| year | Yes | Yes | Yes |
| province | Yes | Yes | Yes |
Note: *, **, *** indicate significance levels at 10%, 5%, and 1%, respectively.
Table A12.
Heterogeneity analysis results of the impact of the number of internet broadband access users on the evaluation score of digital construction level.
Table A12.
Heterogeneity analysis results of the impact of the number of internet broadband access users on the evaluation score of digital construction level.
| (1) | (2) | (3) | |
|---|---|---|---|
| Eastern Region | Central Region | Western Region | |
| 0.0750 *** | 0.0684 *** | 0.0722 *** | |
| (9.0329) | (12.1247) | (8.0962) | |
| 0.0118 | 0.0327 *** | 0.0386 * | |
| (0.6528) | (3.2975) | (1.7426) | |
| 0.0718 *** | 0.0740 *** | 0.0858 *** | |
| (6.4117) | (8.4245) | (7.9130) | |
| 0.0017 | 0.0203 | −0.0254 | |
| (0.0349) | (1.0269) | (−1.0370) | |
| 0.2389 *** | 0.1728 *** | 0.2289 *** | |
| (7.3876) | (7.9236) | (7.1152) | |
| −0.0001 *** | −0.0002 *** | −0.0001 *** | |
| (−3.4111) | (−4.8939) | (−2.6988) | |
| −0.8112 *** | −0.8846 *** | −1.0806 *** | |
| (−4.6713) | (−8.8349) | (−9.8263) | |
| 1133 | 902 | 1045 | |
| 0.8382 | 0.8927 | 0.8820 | |
| year | Yes | Yes | Yes |
| province | Yes | Yes | Yes |
Note: *, **, *** indicate significance levels at 10%, 5%, and 1%, respectively.
References
- Acemoglu, Daron, and Pascual Restrepo. 2022. Tasks, Automation, and the Rise in U.S. Wage Inequality. Econometrica 90: 1973–2016. [Google Scholar] [CrossRef]
- Alderete, María Verónica. 2020. Exploring the Smart City Indexes and the Role of Macro Factors for Measuring Cities Smartness. Social Indicators Research 147: 567–89. [Google Scholar] [CrossRef]
- Ali, Muhammad. 2017. Determinants of Related and Unrelated Export Diversification. Economies 5: 50. [Google Scholar] [CrossRef]
- Allcott, Hunt, Luca Braghieri, Sarah Eichmeyer, and Matthew Gentzkow. 2020. The Welfare Effects of Social Media. American Economic Review 110: 629–76. [Google Scholar] [CrossRef]
- Allcott, Hunt, Matthew Gentzkow, and Lena Song. 2022. Digital Addiction. American Economic Review 112: 2424–63. [Google Scholar] [CrossRef]
- Ariffin, Khairul Akram Zainol, and Faris Hanif Ahmad. 2021. Indicators for maturity and readiness for digital forensic investigation in era of industrial revolution 4.0. Computers & Security 105: 102237. [Google Scholar] [CrossRef]
- Atitallah, Safa Ben, Maha Driss, Wadii Boulila, and Henda Ben Ghézala. 2020. Leveraging Deep Learning and IoT big data analytics to support the smart cities development: Review and future directions. Computer Science Review 38: 100303. [Google Scholar] [CrossRef]
- Austin, Mark, Parastoo Delgoshaei, Maria Coelho, and Mohammad Heidarinejad. 2020. Architecting Smart City Digital Twins: Combined Semantic Model and Machine Learning Approach. Journal of Management in Engineering 36: 04020026. [Google Scholar] [CrossRef]
- Avgerou, Chrisanthi. 1991. The Informational City: Information Technology Economic Restructuring and the Urban Regional Process. European Journal of Information Systems 1: 76–77. [Google Scholar] [CrossRef]
- Barwick, Panle Jia, Yanyan Liu, Eleonora Patacchini, and Qi Wu. 2023. Information, Mobile Communication, and Referral Effects. American Economic Review 113: 1170–207. [Google Scholar] [CrossRef]
- Beraja, Martin, Andrew Kao, David Y. Yang, and Noam Yuchtman. 2023a. AI-tocracy. The Quarterly Journal of Economics 138: 1349–402. [Google Scholar] [CrossRef]
- Beraja, Martin, David Y. Yang, and Noam Yuchtman. 2023b. Data-intensive Innovation and the State: Evidence from AI Firms in China. The Review of Economic Studies 90: 1701–23. [Google Scholar] [CrossRef]
- Borowiecki, Ryszard, Barbara Siuta-Tokarska, Jolanta Maroń, Marcin Suder, Agnieszka Thier, and Katarzyna Żmija. 2021. Developing Digital Economy and Society in the Light of the Issue of Digital Convergence of the Markets in the European Union Countries. Energies 14: 2717. [Google Scholar] [CrossRef]
- Cahyadi, Afriyadi, and Róbert Magda. 2021. Digital Leadership in the Economies of the G20 Countries: A Secondary Research. Economies 9: 32. [Google Scholar] [CrossRef]
- Calvano, Emilio, Giacomo Calzolari, Vincenzo Denicolò, and Sergio Pastorello. 2020. Artificial Intelligence, Algorithmic Pricing, and Collusion. American Economic Review 110: 3267–97. [Google Scholar] [CrossRef]
- Cao, Lingling, Huawei Niu, and Yifeng Wang. 2022. Utility analysis of digital villages to empower balanced urban-rural development based on the three-stage DEA-Malmquist model. PLoS ONE 17: e0270952. [Google Scholar] [CrossRef] [PubMed]
- Castro, Conceição, and Cristina Lopes. 2022. Digital Government and Sustainable Development. Journal of the Knowledge Economy 13: 880–903. [Google Scholar] [CrossRef]
- Chen, Bin, Chen Lin, Peng Gong, and Jiafu An. 2023. Optimize urban shade using digital twins of cities. Nature 622: 242. [Google Scholar] [CrossRef]
- Chen, Kunqiu, Hualou Long, Liuwen Liao, Shuangshuang Tu, and Tingting Li. 2020. Land use transitions and urban-rural integrated development: Theoretical framework and China’s evidence. Land Use Policy 92: 104465. [Google Scholar] [CrossRef]
- Chen, Nan, and Yunpeng Yang. 2023. The Role of Influencers in Live Streaming E-Commerce: Influencer Trust, Attachment, and Consumer Purchase Intention. Journal of Theoretical and Applied Electronic Commerce Research 18: 1601–18. [Google Scholar] [CrossRef]
- Cheng, Cong, and Limin Wang. 2022. How companies configure digital innovation attributes for business model innovation? A configurational view. Technovation 112: 102398. [Google Scholar] [CrossRef]
- Cong, Xuhui, Sai Wang, Liang Wang, Jonas Šaparauskas, Jarosław Górecki, and Miroslaw J. Skibniewski. 2022. Allocation Efficiency Measurement and Spatio-Temporal Differences Analysis of Digital Infrastructure: The Case of China’s Shandong Province. Systems 10: 205. [Google Scholar] [CrossRef]
- Costinot, Arnaud, and Iván Werning. 2023. Robots, Trade, and Luddism: A Sufficient Statistic Approach to Optimal Technology Regulation. The Review of Economic Studies 90: 2261–91. [Google Scholar] [CrossRef]
- Deng, Haiyan, Ge Bai, Zhiyang Shen, and Lanqi Xia. 2022. Digital economy and its spatial effect on green productivity gains in manufacturing: Evidence from China. Journal of Cleaner Production 378: 134539. [Google Scholar] [CrossRef]
- Einav, Liran, Chiara Farronato, Jonathan Levin, and Neel Sundaresan. 2018. Auctions versus Posted Prices in Online Markets. Journal of Political Economy 126: 178–215. [Google Scholar] [CrossRef]
- ElMassah, Suzanna, and Mahmoud Mohieldin. 2020. Digital transformation and localizing the Sustainable Development Goals (SDGs). Ecological Economics 169: 106490. [Google Scholar] [CrossRef]
- Fernandes, Catarina, Rui Pires, and Maria-Ceu Gaspar Alves. 2023. Digital Entrepreneurship and Sustainability: The State of the Art and Research Agenda. Economies 11: 3. [Google Scholar] [CrossRef]
- García-Vandewalle García, José Manuel, Marina García-Carmona, Juan Manuel Trujillo Torres, and Pablo Moya Fernández. 2023. Analysis of digital competence of educators (DigCompEdu) in teacher trainees: The context of Melilla, Spain. Technology, Knowledge and Learning 28: 585–612. [Google Scholar] [CrossRef]
- Goloshchapova, Tatiana, Vladimir Yamashev, Natalia Skornichenko, and Wadim Strielkowski. 2023. E-Government as a Key to the Economic Prosperity and Sustainable Development in the Post-COVID Era. Economies 11: 112. [Google Scholar] [CrossRef]
- Graham, Stephen. 2002. Bridging Urban Digital Divides? Urban Polarisation and Information and Communications Technologies (ICTs). Urban Studies 39: 33–56. [Google Scholar] [CrossRef]
- Guo, Bingnan, Yu Wang, Hao Zhang, Chunyan Liang, Yu Feng, and Feng Hu. 2023. Impact of the digital economy on high-quality urban economic development: Evidence from Chinese cities. Economic Modelling 120: 106194. [Google Scholar] [CrossRef]
- Han, Wenjing, Xiaoling Zhang, and Xian Zheng. 2020. Land use regulation and urban land value: Evidence from China. Land Use Policy 92: 104432. [Google Scholar] [CrossRef]
- Harwit, Eric. 2004. Spreading Telecommunications to Developing Areas in China: Telephones, the Internet and the Digital Divide. The China Quarterly 180: 1010–30. [Google Scholar] [CrossRef]
- Hills, Gage, Christian Lau, Andrew Wright, Samuel Fuller, Mindy D. Bishop, Tathagata Srimani, Pritpal Kanhaiya, Rebecca Ho, Aya Amer, Yosi Stein, and et al. 2019. Modern microprocessor built from complementary carbon nanotube transistors. Nature 572: 595–602. [Google Scholar] [CrossRef] [PubMed]
- Huang, Jie, Huali Jin, Xuhui Ding, and Aihua Zhang. 2023. A Study on the Spatial Correlation Effects of Digital Economy Development in China from a Non-Linear Perspective. Systems 11: 63. [Google Scholar] [CrossRef]
- Jemiluyi, Olufunmilayo Olayemi, and Leward Jeke. 2023. How Catalytic Is Digital Technology in the Nexus between Migrants’ Remittance and Financial Development in Sub-Saharan African Countries? Economies 11: 74. [Google Scholar] [CrossRef]
- Jensen, Robert. 2007. The Digital Provide: Information (Technology), Market Performance, and Welfare in the South Indian Fisheries Sector. The Quarterly Journal of Economics 122: 879–924. [Google Scholar] [CrossRef]
- Jiang, Dingfu. 2020. The construction of smart city information system based on the Internet of Things and cloud computing. Computer Communications 150: 158–66. [Google Scholar] [CrossRef]
- Kaginalkar, Akshara, Shamita Kumar, Prashant Gargava, and Dev Niyogi. 2021. Review of urban computing in air quality management as smart city service: An integrated IoT, AI, and cloud technology perspective. Urban Climate 39: 100972. [Google Scholar] [CrossRef]
- Karle, Heiko, Martin Peitz, and Markus Reisinger. 2020. Segmentation versus Agglomeration: Competition between Platforms with Competitive Sellers. Journal of Political Economy 128: 2329–74. [Google Scholar] [CrossRef]
- Kettinger, William J. 1994. National infrastructure diffusion and the U.S. information super highway. Information & Management 27: 357–68. [Google Scholar] [CrossRef]
- Knox, Paul L., and M. Castells. 1995. The Informational City. Information Technology, Economic Restructuring, and the Urban-Regional Process. The Geographical Journal 161: 94. [Google Scholar] [CrossRef]
- Korgun, Irina, and Altin Hoti. 2023. Dynamics of Bilateral Digital Trade: The Case of a Korea–EU Digital Partnership. Economies 11: 248. [Google Scholar] [CrossRef]
- Kutty, Adeeb A., Murat Kucukvar, Galal M. Abdella, Muhammet Enis Bulak, and Nuri Cihat Onat. 2022. Sustainability Performance of European Smart Cities: A Novel DEA Approach with Double Frontiers. Sustainable Cities and Society 81: 103777. [Google Scholar] [CrossRef]
- Laitsou, Eleni, Antonios Kargas, and Dimitris Varoutas. 2020. Digital Competitiveness in the European Union Era: The Greek Case. Economies 8: 85. [Google Scholar] [CrossRef]
- Lan, Mudan, and Yuke Zhu. 2023. Digital infrastructure construction, carbon total factor productivity, and carbon rebound effect. Environmental Science and Pollution Research 30: 88968–85. [Google Scholar] [CrossRef] [PubMed]
- Lee, Chien-Chiang, Ying Yuan, and Huwei Wen. 2022. Can digital economy alleviate CO2 emissions in the transport sector? Evidence from provincial panel data in China. Natural Resources Forum 46: 289–310. [Google Scholar] [CrossRef]
- Lefatsa, Palesa Milliscent, Kin Sibanda, and Rufaro Garidzirai. 2021. The Relationship between Financial Development and Energy Consumption in South Africa. Economies 9: 158. [Google Scholar] [CrossRef]
- Li, Xiaomin, and Colin F. Camerer. 2022. Predictable effects of visual salience in experimental decisions and games. The Quarterly Journal of Economics 137: 1849–900. [Google Scholar] [CrossRef]
- Li, Xiaoming, Hao Liu, Weixi Wang, Ye Zheng, Haibin Lv, and Zhihan Lv. 2022. Big data analysis of the Internet of Things in the digital twins of smart city based on deep learning. Future Generation Computer Systems 128: 167–77. [Google Scholar] [CrossRef]
- Lin, Jiesen, Lemuria Carter, and Dapeng Liu. 2021. Privacy concerns and digital government: Exploring citizen willingness to adopt the COVIDSafe app. European Journal of Information Systems 30: 1–14. [Google Scholar] [CrossRef]
- Liu, Jing, Chin-Hong Puah, Mohammad Affendy Arip, and Meng-Chang Jong. 2023. Impacts of Digital Financial Inclusion on Urban–Rural Income Disparity: A Comparative Research of the Eastern and Western Regions in China. Economies 11: 282. [Google Scholar] [CrossRef]
- Liu, Tinghua, Mengyuan Hu, Ehsan Elahi, and Xiao Liu. 2022. Does digital finance affect the quality of economic growth? Analysis based on Chinese city data. Frontiers in Environmental Science 10: 951420. [Google Scholar] [CrossRef]
- Loebbing, Jonas. 2022. An Elementary Theory of Directed Technical Change and Wage Inequality. The Review of Economic Studies 89: 411–51. [Google Scholar] [CrossRef]
- Lu, Sha, Yiyun Zhao, Zhouqi Chen, Mengke Dou, Qingchun Zhang, and Weixin Yang. 2021. Association between Atrial Fibrillation Incidence and Temperatures, Wind Scale and Air Quality: An Exploratory Study for Shanghai and Kunming. Sustainability 13: 5247. [Google Scholar] [CrossRef]
- Malecki, Edward J. 2003. Digital development in rural areas: Potentials and pitfalls. Journal of Rural Studies 19: 201–14. [Google Scholar] [CrossRef]
- Maresova, Petra, Ivan Soukal, Libuse Svobodova, Martina Hedvicakova, Ehsan Javanmardi, Ali Selamat, and Ondrej Krejcar. 2018. Consequences of Industry 4.0 in Business and Economics. Economies 6: 46. [Google Scholar] [CrossRef]
- Marshall, Will. 2023. Governance: A Pugwash council for the digital age. Nature 621: 691. [Google Scholar] [CrossRef]
- Masik, Grzegorz, Iwona Sagan, and James W. Scott. 2021. Smart City strategies and new urban development policies in the Polish context. Cities 108: 102970. [Google Scholar] [CrossRef]
- Mitrović, Đorđe. 2020. Measuring the efficiency of digital convergence. Economics Letters 188: 108982. [Google Scholar] [CrossRef]
- Mpofu, Favourate Y. 2022. Taxation of the Digital Economy and Direct Digital Service Taxes: Opportunities, Challenges, and Implications for African Countries. Economies 10: 219. [Google Scholar] [CrossRef]
- Mpofu, Favourate Y., and David Mhlanga. 2022. Digital Financial Inclusion, Digital Financial Services Tax and Financial Inclusion in the Fourth Industrial Revolution Era in Africa. Economies 10: 184. [Google Scholar] [CrossRef]
- Ndubuisi, Gideon, Chuks Otioma, and Godsway Korku Tetteh. 2021. Digital infrastructure and employment in services: Evidence from Sub-Saharan African countries. Telecommunications Policy 45: 102153. [Google Scholar] [CrossRef]
- Nicolas, Clément, Jinwoo Kim, and Seokho Chi. 2020. Quantifying the dynamic effects of smart city development enablers using structural equation modeling. Sustainable Cities and Society 53: 101916. [Google Scholar] [CrossRef]
- Nochta, T., L. Wan, J. M. Schooling, and A. K. Parlikad. 2021. A Socio-Technical Perspective on Urban Analytics: The Case of City-Scale Digital Twins. Journal of Urban Technology 28: 263–87. [Google Scholar] [CrossRef]
- Ogujiuba, Kanayo, and Ntombifuthi Mngometulu. 2022. Does Social Investment Influence Poverty and Economic Growth in South Africa: A Cointegration Analysis? Economies 10: 226. [Google Scholar] [CrossRef]
- Pauliuk, Stefan, Maximilian Koslowski, Kavya Madhu, Simon Schulte, and Sebastian Kilchert. 2022. Co-design of digital transformation and sustainable development strategies—What socio-metabolic and industrial ecology research can contribute. Journal of Cleaner Production 343: 130997. [Google Scholar] [CrossRef]
- Pedrosa, Glauco Vitor, Ricardo A. D. Kosloski, Vitor G. De Menezes, Gabriela Y. Iwama, Wander C. M. P. Da Silva, and Rejane M. Da C. Figueiredo. 2020. A Systematic Review of Indicators for Evaluating the Effectiveness of Digital Public Services. Information 11: 472. [Google Scholar] [CrossRef]
- Peng, Weibin, Liuqing Fang, and Xiaojing Lin. 2022. Digital Governance for Smart City and Future Community Building: From Concept to Application. Singapore: Springer Nature, pp. 41–67. [Google Scholar]
- Peng, Yongzhang, and Changqi Tao. 2022. Can digital transformation promote enterprise performance?—From the perspective of public policy and innovation. Journal of Innovation & Knowledge 7: 100198. [Google Scholar] [CrossRef]
- Peng, Zhuangzhuang, and Ting Dan. 2023. Digital dividend or digital divide? Digital economy and urban-rural income inequality in China. Telecommunications Policy 47: 102616. [Google Scholar] [CrossRef]
- Popkova, Elena G., and Kantoro Gulzat. 2020. Contradiction of the Digital Economy: Public Well-Being vs. Cyber Threats. Cham: Springer International Publishing, pp. 112–24. [Google Scholar]
- Qi, Guangzhi, Zhibao Wang, Zhixiu Wang, and Lijie Wei. 2022. Has Industrial Upgrading Improved Air Pollution?—Evidence from China’s Digital Economy. Sustainability 14: 8967. [Google Scholar] [CrossRef]
- Ramdani, Boumediene, Siddhartha Raja, and Marina Kayumova. 2022. Digital innovation in SMEs: A systematic review, synthesis and research agenda. Information Technology for Development 28: 56–80. [Google Scholar] [CrossRef]
- Ren, Shuming, Lianqing Li, Yueqi Han, Yu Hao, and Haitao Wu. 2022. The emerging driving force of inclusive green growth: Does digital economy agglomeration work? Business Strategy and the Environment 31: 1656–78. [Google Scholar] [CrossRef]
- Ren, Xiaohang, Gudian Zeng, and Giray Gozgor. 2023. How does digital finance affect industrial structure upgrading? Evidence from Chinese prefecture-level cities. Journal of Environmental Management 330: 117125. [Google Scholar] [CrossRef] [PubMed]
- Sotolongo, Marisa. 2023. Defining environmental justice communities: Evaluating digital infrastructure in Southeastern states for Justice40 benefits allocation. Applied Geography 158: 103057. [Google Scholar] [CrossRef]
- Sun, Minglin, and Jian Zhang. 2020. Research on the application of block chain big data platform in the construction of new smart city for low carbon emission and green environment. Computer Communications 149: 332–42. [Google Scholar] [CrossRef]
- Supari, Supari, and Hendranata Anton. 2022. The Impact of the National Economic Recovery Program and Digitalization on MSME Resilience during the COVID-19 Pandemic: A Case Study of Bank Rakyat Indonesia. Economies 10: 160. [Google Scholar] [CrossRef]
- Travkina, Elena Vladimirovna, Alim Borisovich Fiapshev, and Marianna Tolevna Belova. 2022. Stablecoin-Based Digital Trading and Investment Platforms and Their Potential in Overcoming Sanctions Restrictions. Economies 10: 246. [Google Scholar] [CrossRef]
- Veretennikova, Anna Y., and Daria A. Selezneva. 2023. Development of Regulatory Strategies in the Sharing Economy: The Application of Game Theory. Economies 11: 298. [Google Scholar] [CrossRef]
- Wang, Di, Tao Zhou, and Mengmeng Wang. 2021. Information and communication technology (ICT), digital divide and urbanization: Evidence from Chinese cities. Technology in Society 64: 101516. [Google Scholar] [CrossRef]
- Wang, Jianda, Kangyin Dong, Xiucheng Dong, and Farhad Taghizadeh-Hesary. 2022. Assessing the digital economy and its carbon-mitigation effects: The case of China. Energy Economics 113: 106198. [Google Scholar] [CrossRef]
- Williamson, Stephen. 2022. Central Bank Digital Currency: Welfare and Policy Implications. Journal of Political Economy 130: 2829–61. [Google Scholar] [CrossRef]
- Wu, Liu, Xiaowen Wan, Atif Jahanger, Mengyi Li, Muntasir Murshed, and Daniel Balsalobre-Lorente. 2023. Does the digital economy reduce air pollution in China? A perspective from industrial agglomeration. Energy Reports 9: 3625–41. [Google Scholar] [CrossRef]
- Xia, Chang, Anthony Gar-On Yeh, and Anqi Zhang. 2020. Analyzing spatial relationships between urban land use intensity and urban vitality at street block level: A case study of five Chinese megacities. Landscape and Urban Planning 193: 103669. [Google Scholar] [CrossRef]
- Xia, Haishan, Zishuo Liu, Maria Efremochkina, Xiaotong Liu, and Chunxiang Lin. 2022. Study on city digital twin technologies for sustainable smart city design: A review and bibliometric analysis of geographic information system and building information modeling integration. Sustainable Cities and Society 84: 104009. [Google Scholar] [CrossRef]
- Yang, Lifan, Jiatian Dong, and Weixin Yang. 2024. Analysis of Regional Competitiveness of China’s Cross-Border E-Commerce. Sustainability 16: 1007. [Google Scholar] [CrossRef]
- Yang, Weixin, Lingying Pan, and Qinyi Ding. 2023a. Dynamic analysis of natural gas substitution for crude oil: Scenario simulation and quantitative evaluation. Energy 282: 128764. [Google Scholar] [CrossRef]
- Yang, Weixin, Yue Hu, Qinyi Ding, Hao Gao, and Lingguang Li. 2023b. Comprehensive Evaluation and Comparative Analysis of the Green Development Level of Provinces in Eastern and Western China. Sustainability 15: 3965. [Google Scholar] [CrossRef]
- Yang, Yunpeng, Hongmin Chen, and Hejun Liang. 2023c. Did New Retail Enhance Enterprise Competition during the COVID-19 Pandemic? An Empirical Analysis of Operating Efficiency. Journal of Theoretical and Applied Electronic Commerce Research 18: 352–71. [Google Scholar] [CrossRef]
- Yang, Yunpeng, Nan Chen, and Hongmin Chen. 2023d. The Digital Platform, Enterprise Digital Transformation, and Enterprise Performance of Cross-Border E-Commerce—From the Perspective of Digital Transformation and Data Elements. Journal of Theoretical and Applied Electronic Commerce Research 18: 777–94. [Google Scholar] [CrossRef]
- Yang, Zhen, Weijun Gao, Qing Han, Liyan Qi, Yajie Cui, and Yuqing Chen. 2022. Digitalization and carbon emissions: How does digital city construction affect china’s carbon emission reduction? Sustainable Cities and Society 87: 104201. [Google Scholar] [CrossRef]
- Zekić-Sušac, Marijana, Saša Mitrović, and Adela Has. 2021. Machine learning based system for managing energy efficiency of public sector as an approach towards smart cities. International Journal of Information Management 58: 102074. [Google Scholar] [CrossRef]
- Zhang, Dan, Loogeok. G. Pee, Shan L. Pan, and Lili Cui. 2022a. Big data analytics, resource orchestration, and digital sustainability: A case study of smart city development. Government Information Quarterly 39: 101626. [Google Scholar] [CrossRef]
- Zhang, Jinning, Yanwei Lyu, Yutao Li, and Yong Geng. 2022b. Digital economy: An innovation driving factor for low-carbon development. Environmental Impact Assessment Review 96: 106821. [Google Scholar] [CrossRef]
- Zhang, Wei, Xuemeng Liu, Die Wang, and Jianping Zhou. 2022c. Digital economy and carbon emission performance: Evidence at China’s city level. Energy Policy 165: 112927. [Google Scholar] [CrossRef]
- Zheng, Chuanjun, Jingfeng Yuan, Lei Zhu, Yajing Zhang, and Qiuhu Shao. 2020. From digital to sustainable: A scientometric review of smart city literature between 1990 and 2019. Journal of Cleaner Production 258: 120689. [Google Scholar] [CrossRef]
- Zhu, Wenjing, and Jianjun Chen. 2022. The spatial analysis of digital economy and urban development: A case study in Hangzhou, China. Cities 123: 103563. [Google Scholar] [CrossRef]
Figure 1.
Average scores of digital construction level in Chinese cities (2011–2021).

Table 1.
Urban Digitalization Development Evaluation Indicator System.
| Primary Indicator | Secondary Indicator | Unit | Indicator Type |
|---|---|---|---|
| Digital Infrastructure | Telecommunication Revenue () | CNY | Positive |
| End-of-Year Mobile Phone Users () | 10,000 Households | Positive | |
| Internet Broadband Access Users () | 10,000 Households | Positive | |
| Overall Economic Level | Per Capita Regional GDP () | CNY | Positive |
| GDP Growth Rate () | % | Positive | |
| Urban Construction Land as a Percentage of Municipal Area () | % | Positive | |
| Innovation Development Level | Innovation Index () | / | Positive |
| Expenditure on Science and Technology () | CNY | Positive | |
| Digital Industry Development Status | Proportion of Tertiary Industry Employees () | % | Positive |
| Employees in Information Transmission, Software, and Information Technology Services () | 10,000 People | Positive | |
| Proportion of Tertiary Industry in GDP () | % | Positive | |
| Digital Inclusive Finance Index () | / | Positive | |
| Ecological Environment Conditions | Greening Coverage of Built-up Areas () | % | Positive |
| Number of Green Patents Applied () | Units | Positive | |
| Industrial Sulfur Dioxide Emissions () | 10,000 Tons | Negative | |
| Carbon Dioxide Emissions () | 10,000 Tons | Negative |
Table 2.
Weights of indicators.
| Primary Indicator | Primary Indicator Weight | Secondary Indicator | Secondary Indicator Weight |
|---|---|---|---|
| Digital Infrastructure | 0.1692 | Telecommunication Revenue () | 0.0446 |
| End-of-Year Mobile Phone Users () | 0.0607 | ||
| Internet Broadband Access Users () | 0.0638 | ||
| Overall Economic Level | 0.1227 | Per Capita Regional GDP () | 0.0578 |
| GDP Growth Rate () | 0.0274 | ||
| Urban Construction Land as a Percentage of Municipal Area () | 0.0376 | ||
| Innovation Development | 0.2228 | Innovation Index () | 0.1833 |
| Expenditure on Science and Technology () | 0.0395 | ||
| Digital Industry Development Status | 0.2890 | Proportion of Tertiary Industry Employees () | 0.0605 |
| Employees in Information Transmission, Software, and Information Technology Services () | 0.0468 | ||
| Proportion of Tertiary Industry in GDP () | 0.0734 | ||
| Digital Inclusive Finance Index () | 0.1084 | ||
| Ecological Environment Conditions | 0.1963 | Greening Coverage of Built-up Areas () | 0.0149 |
| Number of Green Patents Applied () | 0.0698 | ||
| Industrial Sulfur Dioxide Emissions () | 0.0620 | ||
| Carbon Dioxide Emissions () | 0.0495 |
Table 3.
Benchmark regression results.
| (1) | (2) | (3) | (4) | (5) | (6) | (7) | (8) | |
|---|---|---|---|---|---|---|---|---|
| OLS | 2SLS | OLS | 2SLS | OLS | 2SLS | OLS | 2SLS | |
| Second stage | ||||||||
| 6.2341 *** (77.3740) | 9.1571 *** (56.6460) | 2.1390 *** (16.6791) | 1.661 *** (2.6093) | 1.2632 *** (11.3900) | 2.4478 *** (7.0686) | 1.1058 *** (6.1547) | 2.5731 *** (11.3978) | |
| 0.4711 *** (26.5348) | 0.3929 *** (13.8294) | 0.1267 * (1.7031) | 0.1282 *** (2.9278) | |||||
| 0.2316 *** | 0.2489 *** | 0.3256 *** | 0.3459 *** | |||||
| (15.5896) | (18.4672) | (5.4253) | (11.3756) | |||||
| 0.2045 *** | 0.1365 *** | 0.1555 *** | 0.1152 *** | |||||
| (9.7338) | (5.7467) | (4.8843) | (4.5678) | |||||
| −0.0405 | −0.0564 | −0.0279 | −0.0347 | |||||
| (−0.7668) | (−1.0448) | (−0.5815) | (−0.6778) | |||||
| 4.3292 *** | 2.9199 *** | 6.3037 *** | 6.5344 *** | 0.2034 | 0.9447 *** | 1.6907 *** | 3.1551 *** | |
| (106.9652) | (36.9279) | (101.9463) | (21.2872) | (0.7590) | (3.2521) | (4.1097) | (8.5837) | |
| 3080 | 3080 | 3080 | 3080 | 3080 | 3080 | 3080 | 3080 | |
| 0.5519 | 0.8590 | 0.1618 | 0.2643 | |||||
| year | No | No | Yes | Yes | Yes | Yes | Yes | Yes |
| city | No | No | Yes | Yes | Yes | Yes | Yes | Yes |
| First stage | ||||||||
| 0.0729 *** (55.2808) | 0.0242 *** (7.7671) | 0.0403 *** (15.6866) | 0.0151 *** (5.2663) | |||||
| 0.4306 | 0.1537 | 0.8512 | 0.1377 | |||||
| F Statistic on IV | 1534.468 | 60.328 | 246.070 | 27.734 | ||||
Note: *, **, *** indicate significance levels at 10%, 5%, and 1%, respectively.
Table 4.
Heterogeneity analysis results of the impact of digital construction evaluation scores on regional GDP.
Table 4.
Heterogeneity analysis results of the impact of digital construction evaluation scores on regional GDP.
| (1) | (2) | (3) | |
|---|---|---|---|
| Eastern Region | Central Region | Western Region | |
| 1.6365 *** | 0.9483 *** | 0.3897 | |
| (5.4042) | (3.0052) | (1.0557) | |
| 0.1855 | 0.0330 | 0.0587 | |
| (1.5284) | (0.3179) | (0.6051) | |
| 0.2555 *** | 0.3663 *** | 0.4053 *** | |
| (4.1380) | (4.6102) | (4.5466) | |
| 0.1573 *** | 0.1542 *** | 0.2130 *** | |
| (3.5028) | (2.8417) | (3.1969) | |
| −0.0118 | −0.1311 | −0.0075 | |
| (−0.2270) | (−1.3708) | (−0.0667) | |
| 1.7770 *** | 1.9547 *** | 0.6454 | |
| (2.7238) | (2.9582) | (0.7373) | |
| 1133 | 902 | 1045 | |
| 0.3447 | 0.2931 | 0.2016 | |
| year | Yes | Yes | Yes |
| province | Yes | Yes | Yes |
Note: *, **, *** indicate significance levels at 10%, 5%, and 1%, respectively.
Disclaimer/Publisher’s Note: The statements, opinions and data contained in all publications are solely those of the individual author(s) and contributor(s) and not of MDPI and/or the editor(s). MDPI and/or the editor(s) disclaim responsibility for any injury to people or property resulting from any ideas, methods, instructions or products referred to in the content. |
© 2024 by the authors. Licensee MDPI, Basel, Switzerland. This article is an open access article distributed under the terms and conditions of the Creative Commons Attribution (CC BY) license (https://creativecommons.org/licenses/by/4.0/).
Share and Cite
MDPI and ACS Style
Yang, W.; Zhu, C.; Yang, Y. Does Urban Digital Construction Promote Economic Growth? Evidence from China. Economies 2024, 12, 59. https://0-doi-org.brum.beds.ac.uk/10.3390/economies12030059
AMA Style
Yang W, Zhu C, Yang Y. Does Urban Digital Construction Promote Economic Growth? Evidence from China. Economies. 2024; 12(3):59. https://0-doi-org.brum.beds.ac.uk/10.3390/economies12030059
Chicago/Turabian StyleYang, Weixin, Chen Zhu, and Yunpeng Yang. 2024. "Does Urban Digital Construction Promote Economic Growth? Evidence from China" Economies 12, no. 3: 59. https://0-doi-org.brum.beds.ac.uk/10.3390/economies12030059
Note that from the first issue of 2016, this journal uses article numbers instead of page numbers. See further details here.