
Environment and Digitalization: The New Paradigms in the European Stock Markets


1
Department of Economic Studies, University of “G. d’Annunzio” of Chieti-Pescara, 65127 Pescara, Italy
2
Faculty of Finance & Banking, University of Economics and Law, Ho Chi Minh City 700000, Vietnam
3
Vietnam National University, Ho Chi Minh City 700000, Vietnam
4
International Centre for Economic Analysis (ICEA), Waterloo, ON N2L 3C5, Canada
*
Authors to whom correspondence should be addressed.
Economies 2024, 12(3), 65; https://0-doi-org.brum.beds.ac.uk/10.3390/economies12030065
Submission received: 4 November 2023
/
Revised: 7 February 2024
/
Accepted: 4 March 2024
/
Published: 7 March 2024
Abstract
:In a European context in which the objectives of climate neutrality and digitalization appear fundamental, the work analyzes the relationships between the price of the main stock market indices and the most representative variables such as carbon emissions, digitalization, use of renewable energy, research and development expenses, environmental taxes, and all economic and management activities aimed at reducing or eliminating any form of pollution. The analysis was developed through three different regressions involving the long period 1995–2020 and the short period 2017–2020. The results show how increasing carbon emissions and environmental taxes positively impact stock indices. The former is linked to an increase in production and, therefore, economic growth, and the latter encourages sustainability. Taxes on transport and energy in the long term generate higher costs, which damage profitability and negatively impact the performance of stock indices. Finally, in the short term, implementing environmental protection measures or the sustainable management of resources may lead to higher operating costs for the companies involved. These cost increases can negatively impact profit margins and reduce the value of companies. These results, therefore, show us how environmental sustainability has a significant impact on European stock markets; consequently, the relevant regulations and policies should also consider the economic and managerial impacts that companies implement to achieve their objectives of the Green Deal.
1. Introduction
Today, the financial markets face two critical issues: the digital and green transitions. The topics are strongly linked to each other. By investing synergistically and strategically, they can create a virtuous circle capable of accelerating economic and financial recovery and new, more sustainable financial models. Creating projects and initiatives supported by national and international programs can multiply benefits, creating new development paradigms and bridging delays and gaps generated over time.
The European Green Deal is a combination of strategic initiatives that lead the European Union on the path to a green transition, with the ultimate goal of achieving climate neutrality by 2050. There is evidence of the need for a multidisciplinary approach, where all relevant policy areas contribute to the leading climate target. The package includes climate, environment, energy, transport, industry, agriculture, and sustainable finance initiatives, all strongly interconnected sectors. The implementation of this strategy started in December 2019 by the Commission, and the European Council took note of it at its meeting in December of the same year. With its adoption, the EU and its Member States committed to reducing net greenhouse gas emissions in the EU by at least 55% by 2030, compared to 1990 levels. The Commission conducted an impact assessment before setting this legally binding target. The main actions envisaged by the regulation are the following:
- define the pace of emissions reduction until 2050 to ensure planning for businesses, stakeholders, and citizens;
- develop and elaborate a reporting system to monitor the progress;
- provide a cost-effective and socially fair green switch.
The implementation of this strategy started in December 2019 by the Commission, and the European Council acknowledged it at its meeting in December of the same year.
On the other hand, the concept of digital transition or digitization is more complicated. Using the most widely used definition in the literature (Bharadway et al. 2013), “organizational strategy formulated and executed by leveraging digital resources to create differential value”, the transformation is based on processes that have a significant impact on an organizational, technological, communicative, and cultural level. They generate multiple competitive advantages, allowing companies to move resources and strategies to the digital world.
In 2021, in line with the National Recovery and Resilience Plans, the European Commission adopted the Digital Compass, which defines clear targets for 2030 in four main policy areas to support the digital transition: skills, infrastructure, digitalization of businesses, and digitalization of public services.
The EU’s digital strategy aims to ensure that this transformation benefits citizens and businesses while helping to achieve the goal of a climate-neutral Europe by 2050.
The relationship between European index prices, carbon emissions, and digitalization can be complex, multi-dimensional, and influenced by several factors. Here are some ways these three elements can interact:
Effects on business performance: Digitalization can increase the operational efficiency of European companies, reducing costs and improving productivity. This could reflect positively on stock index prices, as more efficient companies are more profitable. However, digitalization can also require significant upfront investments, negatively impacting short-term profit margins.
Carbon emissions: Pressure to reduce carbon emissions and address climate change is increasing in Europe. Companies that adopt sustainable practices and reduce carbon emissions could be considered more attractive to ethical or responsible investors. At the same time, companies that ignore these challenges could face sanctions or lose business opportunities. As a result, carbon emissions could significantly impact investor perception and, therefore, the performance of indices.
Regulation: Digitalization and the sustainability agenda are increasingly influenced by government regulation. For example, strict European rules, such as the emissions trading system, have been introduced to reduce carbon emissions. Digitalization can help companies monitor and comply with these regulations but may also be subject to specific rules such as data protection. Laws can significantly impact operating costs and compliance, thus influencing the financial performance of companies and, consequently, indices.
Innovation and emerging sectors: Digitalization can foster the development of new industries and technologies, such as renewable energy, sustainable mobility, and intelligent resource management. Investments in these areas can lead to new opportunities for growth and innovation. As a result, European indices could benefit from this transformation if they include companies involved in emerging sustainability-related sectors.
Digitalization can influence company performance and, therefore, index performance, while carbon emissions and regulation can be key factors in the valuation of companies. The transition to a more sustainable economy is becoming increasingly important for investors and significantly impacts European financial markets.
Therefore, the work aims to analyze the impact of CO2 emissions, the rate of renewable energy used, life expectancy, expenditure on research and development, and economic growth on the performance of the major European stock market indices. Secondly, the DESI is also introduced to analyze if the digitalization level presented in the enterprises of single European countries affects the prices of the major European indices. The scope is to fill a gap in the literature because many works have focused on the direct effect of digitalization using the single indicator of the percentage of Internet users as a variable. In this analysis, instead, digitalization is represented through its inclusion in the company production processes described in part of the DESI, and the document simultaneously combines it with environmental variables, such as activities, expenditures, and products to protect the environment, spending on research and development and life expectancy of European countries. Furthermore, the work’s innovative character and strong point is also the quantification of the overall environmental protection and resource management activities.
2. Literature
The environment–digitalization connection in literature is growing exponentially and does not concern studies on a particular geographical area but the whole world (Firoiu et al. 2022; Godil et al. 2021; Karlilar et al. 2023; Kopp et al. 2023; Santarius et al. 2023; Su et al. 2021). Certainly, digitalization regards much of the process of every sector, and your impact is reflected in the sustainable growth of the economy. Nevertheless, the effect on the environment is cryptic, like the two sides of the same coin.
The climate neutrality objective of the European Green Deal has highlighted how the risks linked to the impacts of the economic and social transition toward a low-carbon economy impact the performance of companies. For example, the studies by Monasterolo (2020) and Monasterolo et al. (2017) show that the financial system could help the transition through the integration of the source of climate risk in financial risk management and the impact of the incorporation of the climate transition risks in risk management system on the performance of the Chinese commercial banks. Reshetnikova et al. (2023) studied the influence of carbon risk on the Russian stock returns divided by the carbon-free and carbon firms. They conclude that there is a positive carbon premium in the market, so the carbon firms present higher returns. Another work is by Kotsompolis et al. (2023), who focus on the future of carbon emissions and the impact on climate change economics by the ARDL model.
This paper subdivision will show the principal studies of the variables used in the econometric analysis, focusing on carbon emissions, renewable energy, life expectancy, digitalization, and economic growth.
The starting point briefly describes the Digital Economy and Society Index (DESI) (Bánhidi et al. 2020; Di Febo and Angelini 2019a, 2022; Olczyk and Kuc-Czarnecka 2022) (Di Febo and Angelini 2019a, 2019b, 2022). It is the index that, since 2014, the European Commission has been monitoring the digital progress of the European countries. In line with the Digital Decade 2030 Strategic Agenda (focusing on creating safe digital spaces and services, creating a level playing field on digital markets with large platforms, and strengthening Europe’s digital sovereignty, contributing simultaneously to the European objective of climate neutrality by 2050), the index is integrated into Digital Decade Status Report (European Commission 2023) and used to monitor the progress towards digital goals.
Kreiterling (2023), considering the performance of firms in terms of return or operative cost and in the markets, shows that digital innovations are associated with increased economic growth. Digitalization improves expansion into new needs with better interaction between investors and financial markets. Banelienė and Strazdas (2023) affirm two essential concepts: In Europe, green innovation has a positive influence on economic growth, but the impact of digitalization on GDP is ambiguous because it depends on the qualitative aspects of coverage and how this is reflected in the digitalization gauges. Also, Antonescu et al. (2023) analyze the impact of digitalization on the economic growth of Romania. Tran et al. (2023), through a correlation and hierarchical cluster analysis, affirm that all digital skills (excluding the basis) positively affect economic development in European countries. Imran et al. (2022) analyze the topic of digitalization through the DESI and its impact on the sustainable development indicators in European countries. Parra et al. (2021) show how the economic growth per capita was directly linked with Internet services and your integration into the company. From the opposite vision, the article by Vyshnevskyi et al. (2020) affirms that the digitalization of European countries does not positively impact economic growth.
Regarding renewable energy, there is an article by Odilova et al. (2023) that improves a systematic literature review on green energy and its impact on the financial return of organizations. Simionescu et al. (2020), using a fully modified ordinary least squares methodology, show a positive relationship between economic growth and the use of renewable energies in European countries. Furthermore, they demonstrate that green energy consumption progress positively influences economic growth and the Global Competitiveness Index. Another paper including demographic variables about life expectancy (Human Development Index) shows the coupling effect between it and carbon emissions in 30 Chinese provinces (Chen et al. 2024).
3. Data and Methodology
Our data have been identified through various databases and providers: Eurostat, the site of European Digital Strategy, and Investing.com. In detail, Eurostat obtained the carbon emissions, the rate of economic growth, the percentage of use of renewable energy, life expectancy, and the amount of expenditure in research and development. The DESI was downloaded from the European Commission on the Digital Strategy site. Investing.com downloads the all-time series of the major indices of single European countries. The number of European countries is 26 (Table 1), and the timeframe was extended from 1995 to 2020 in the first analysis and from 2017 to 2020 in the second analysis, highlighting that this extension is derived from the choice to have a panel database that is as balanced as possible and with certain and unconfirmed data. The price listings of the major European indices are downloaded from Investing.com (Table 1).
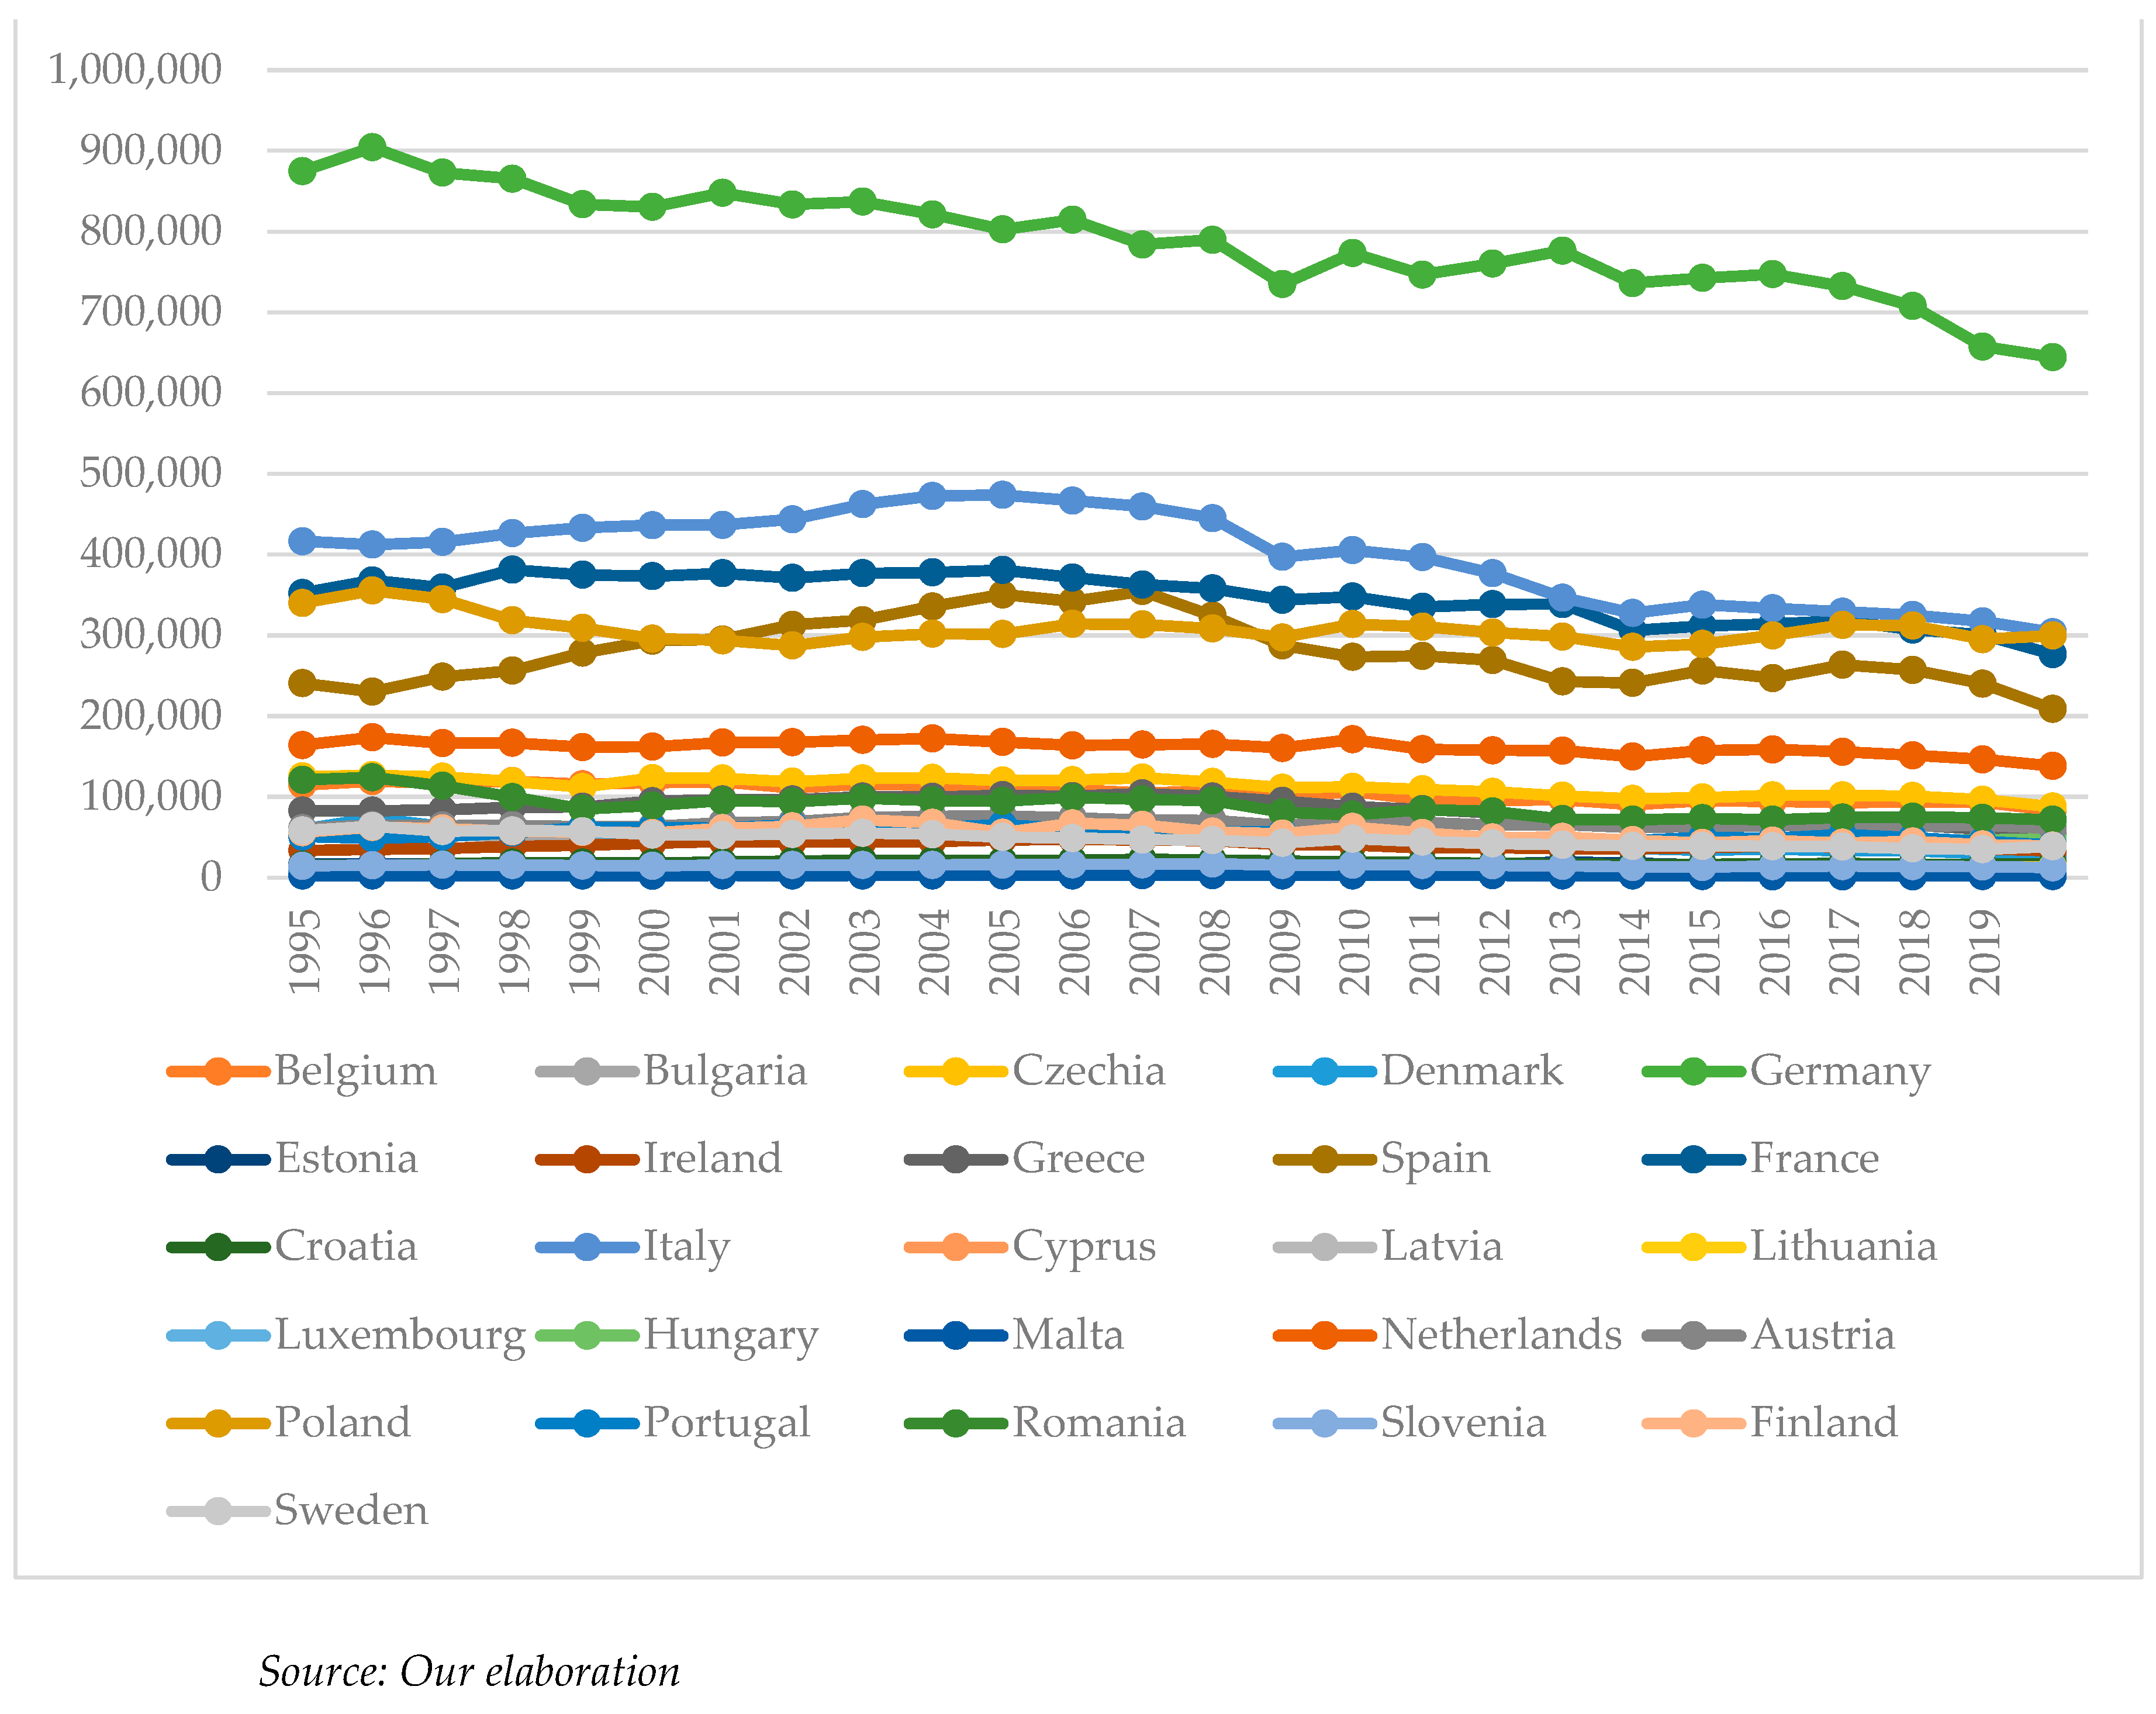
Figure 1 shows how much of the European countries have decreased their carbon emissions from 1995 to 2020. It is true that in 2020, the level was exceptionally low due to the coronavirus pandemic. However, in 2021, EU emissions fell by 5% compared to 2019. This put the EU on track to reduce emissions by 55% by the end of this decade.
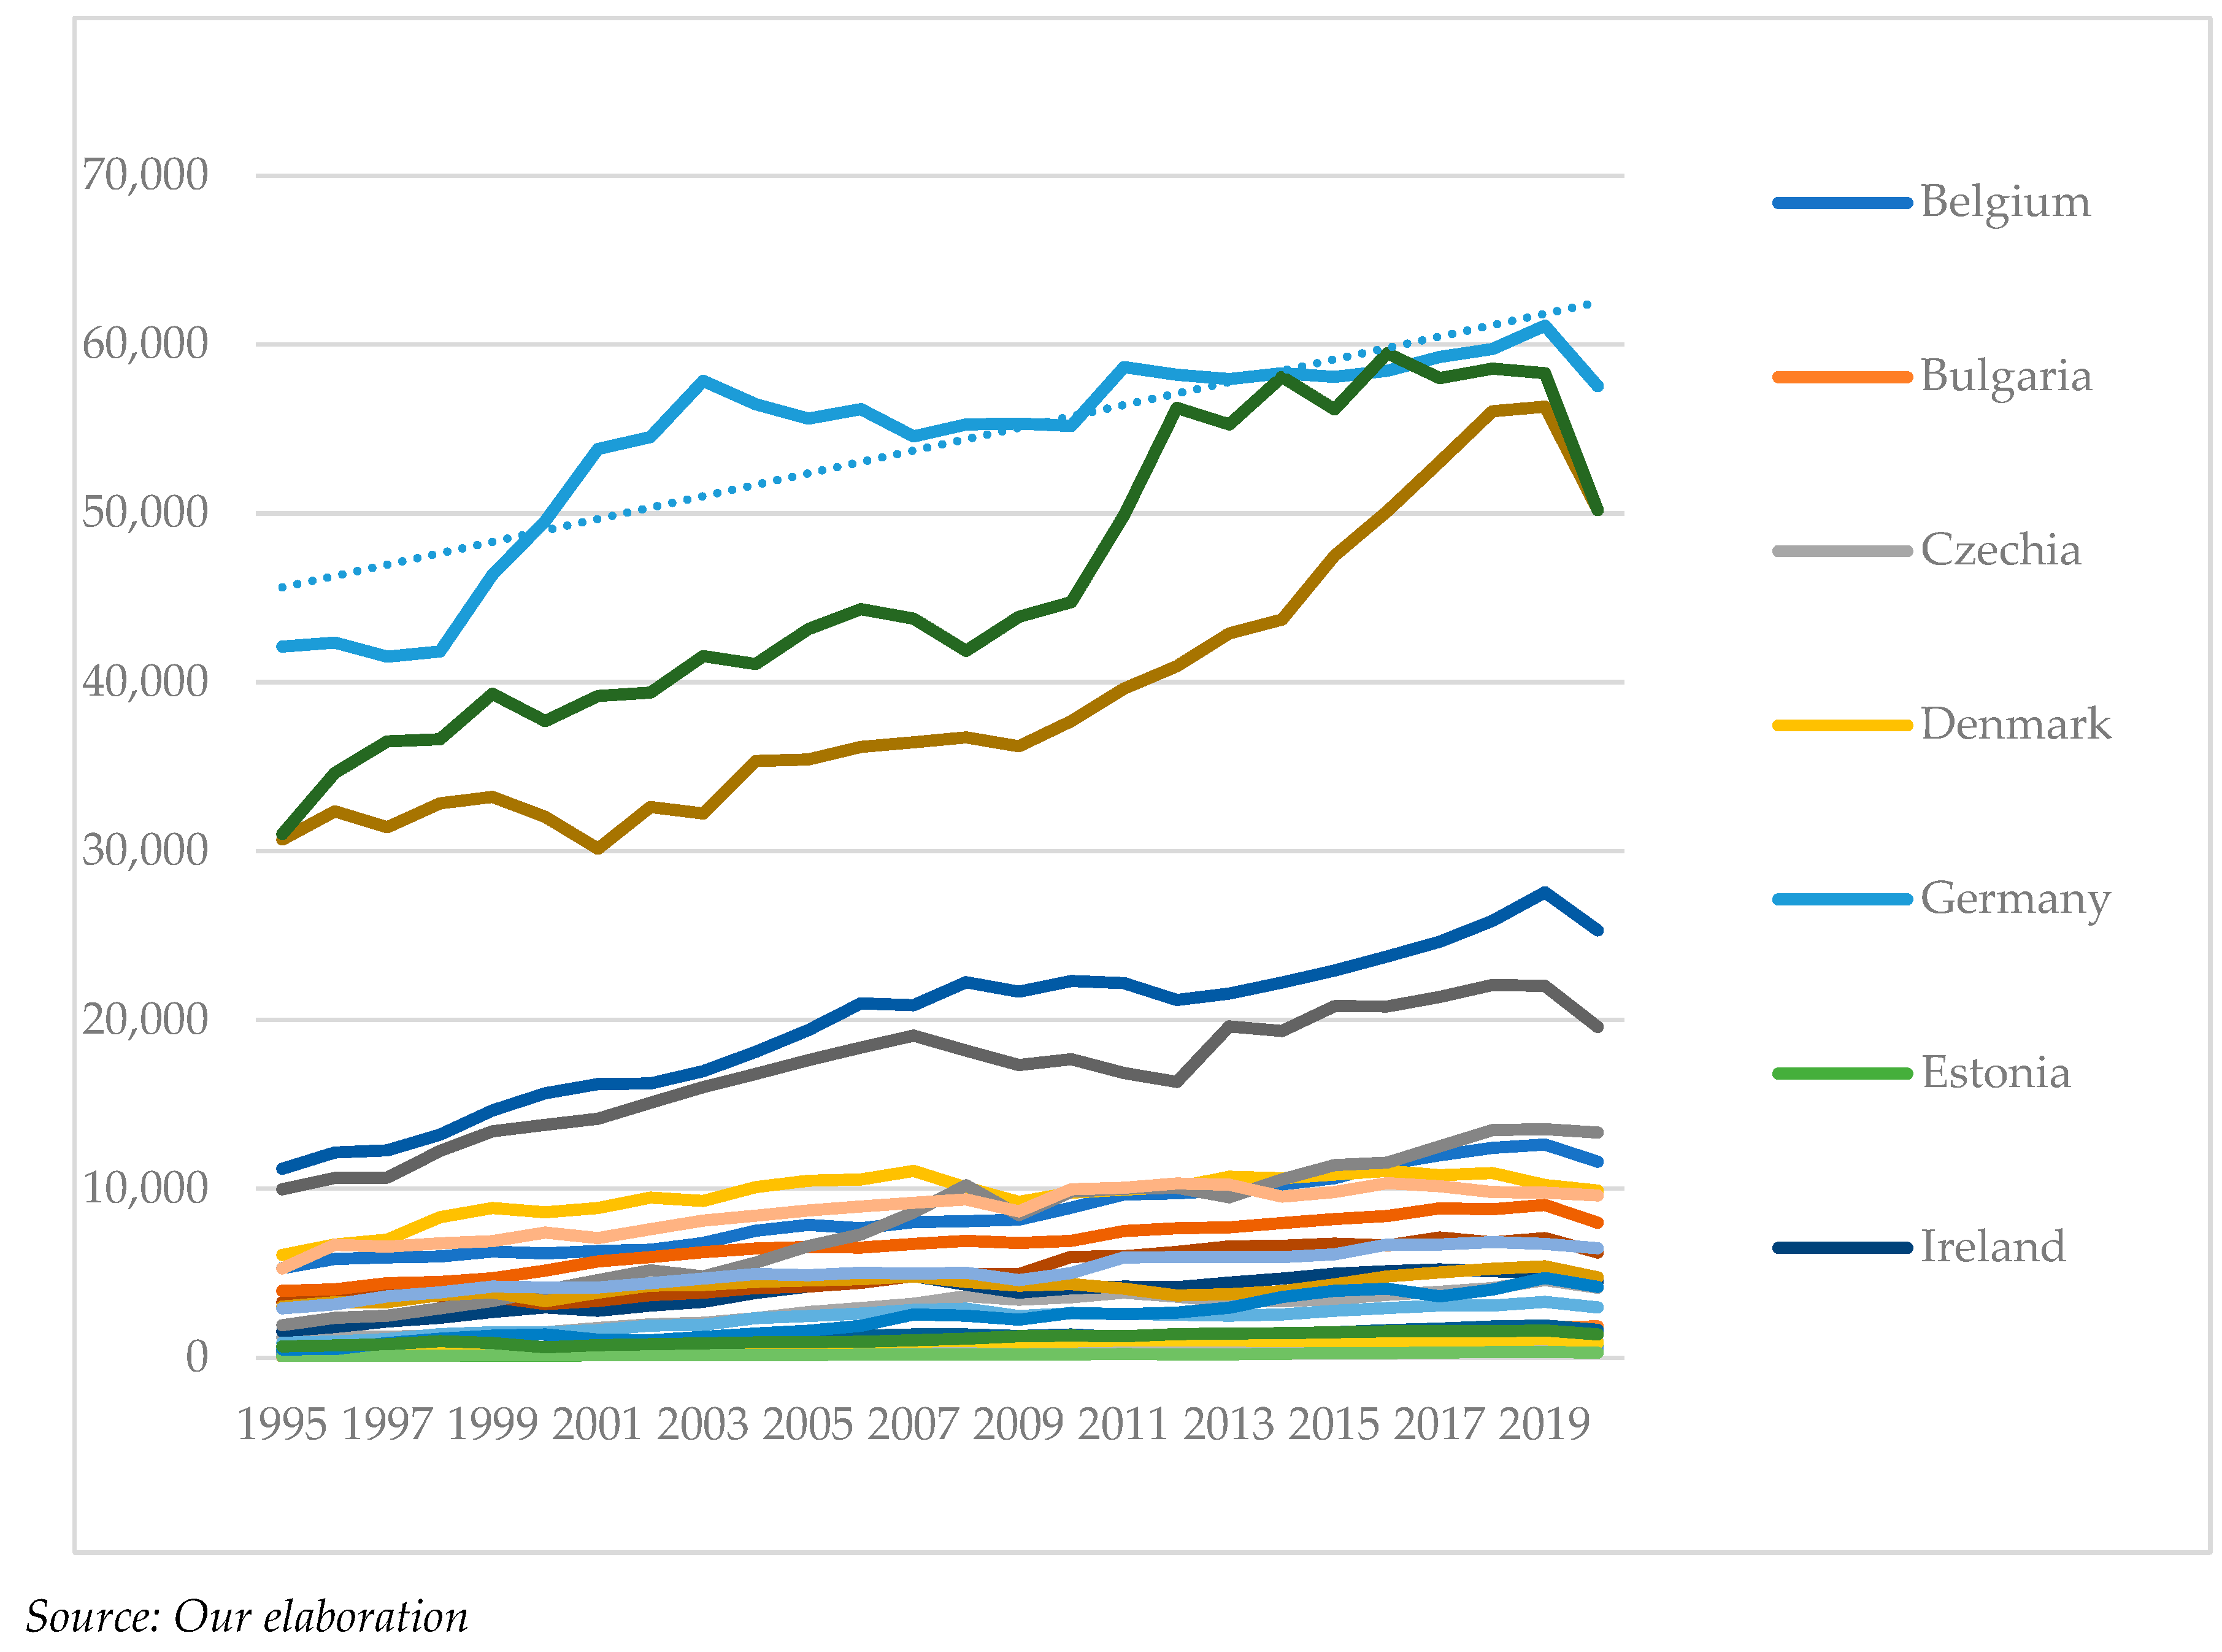
The five most polluting countries are Germany, Italy, France, Poland, and Spain. Also, the fiscal policy is helping to achieve the objectives of the Green Deal, and Figure 2 shows us how Germany (the most polluting country) has the highest tax burden.
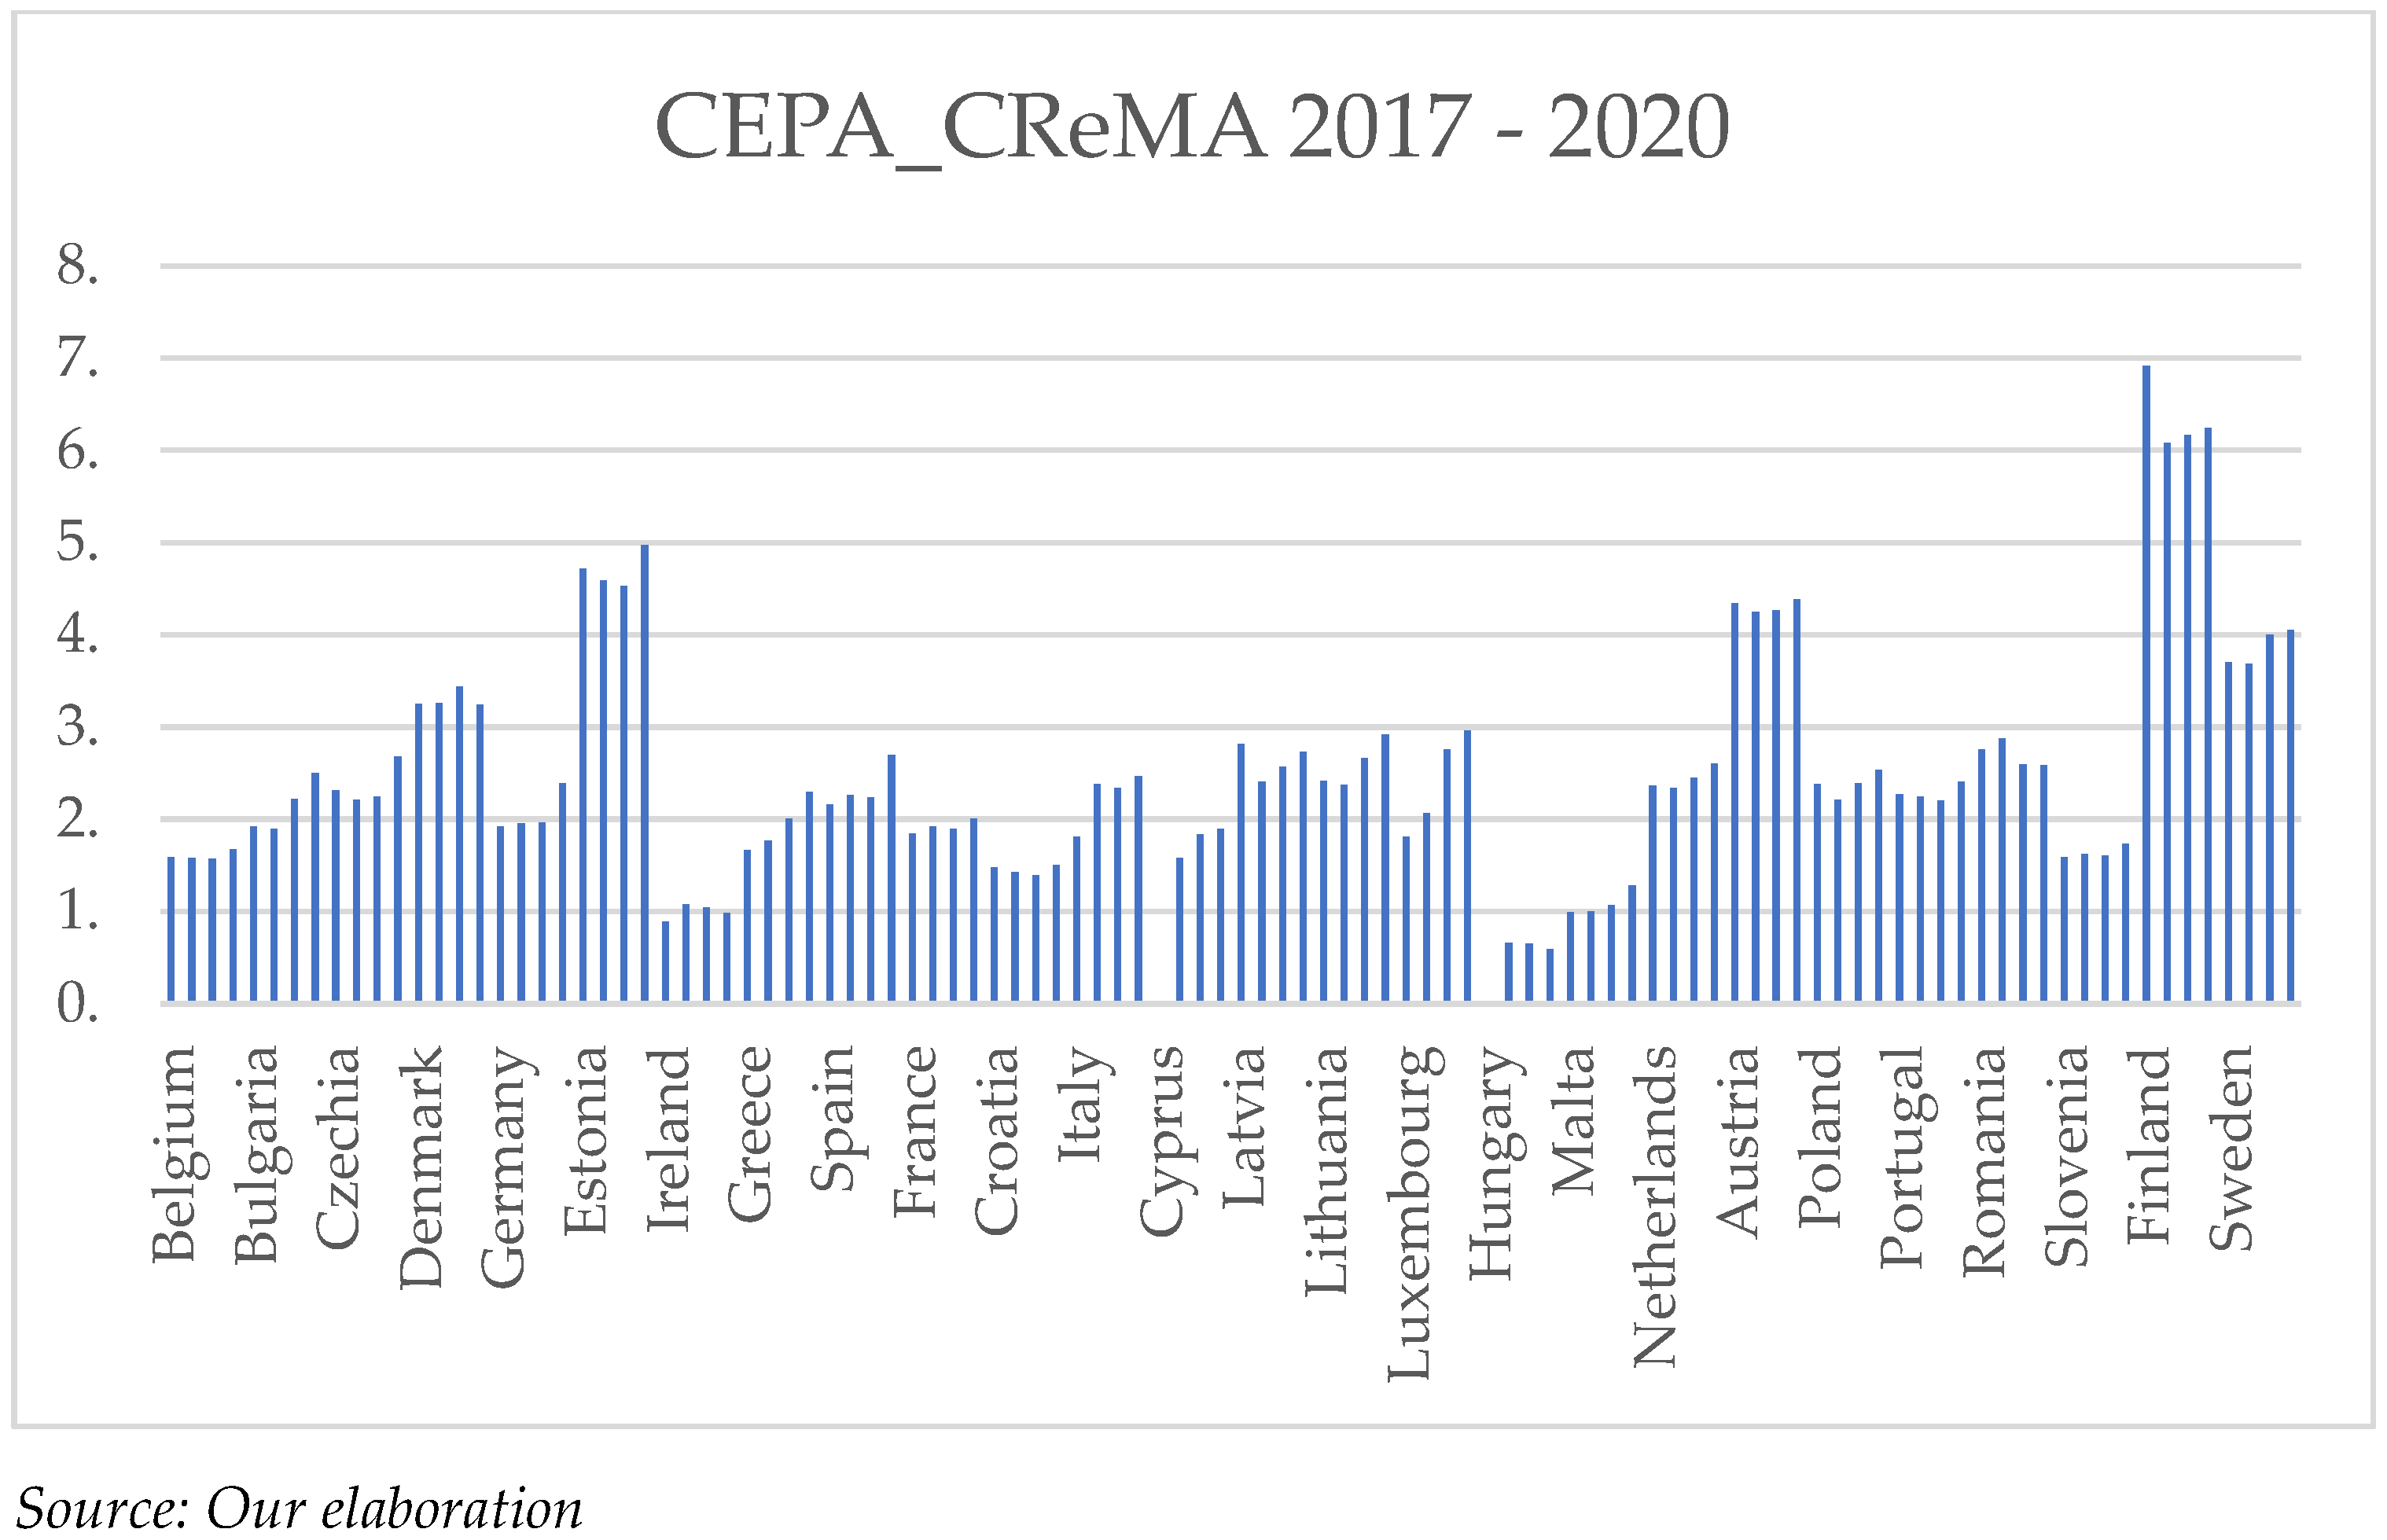
Another indicator that reveals the European situation is the CEPA_CReMA, encompassing all products, expenses, and activities carried out for environmental protection. They, as defined by Eurostat (2020), are not only all economic activities aimed at preventing, reducing, and eliminating any form of pollution or environmental deterioration but also all the activities dedicated to restoring already compromised situations. Figure 3 shows that the European countries most committed to pollution prevention and everything that can make the entire system more sustainable are Finland, Estonia, Austria, and Sweden.
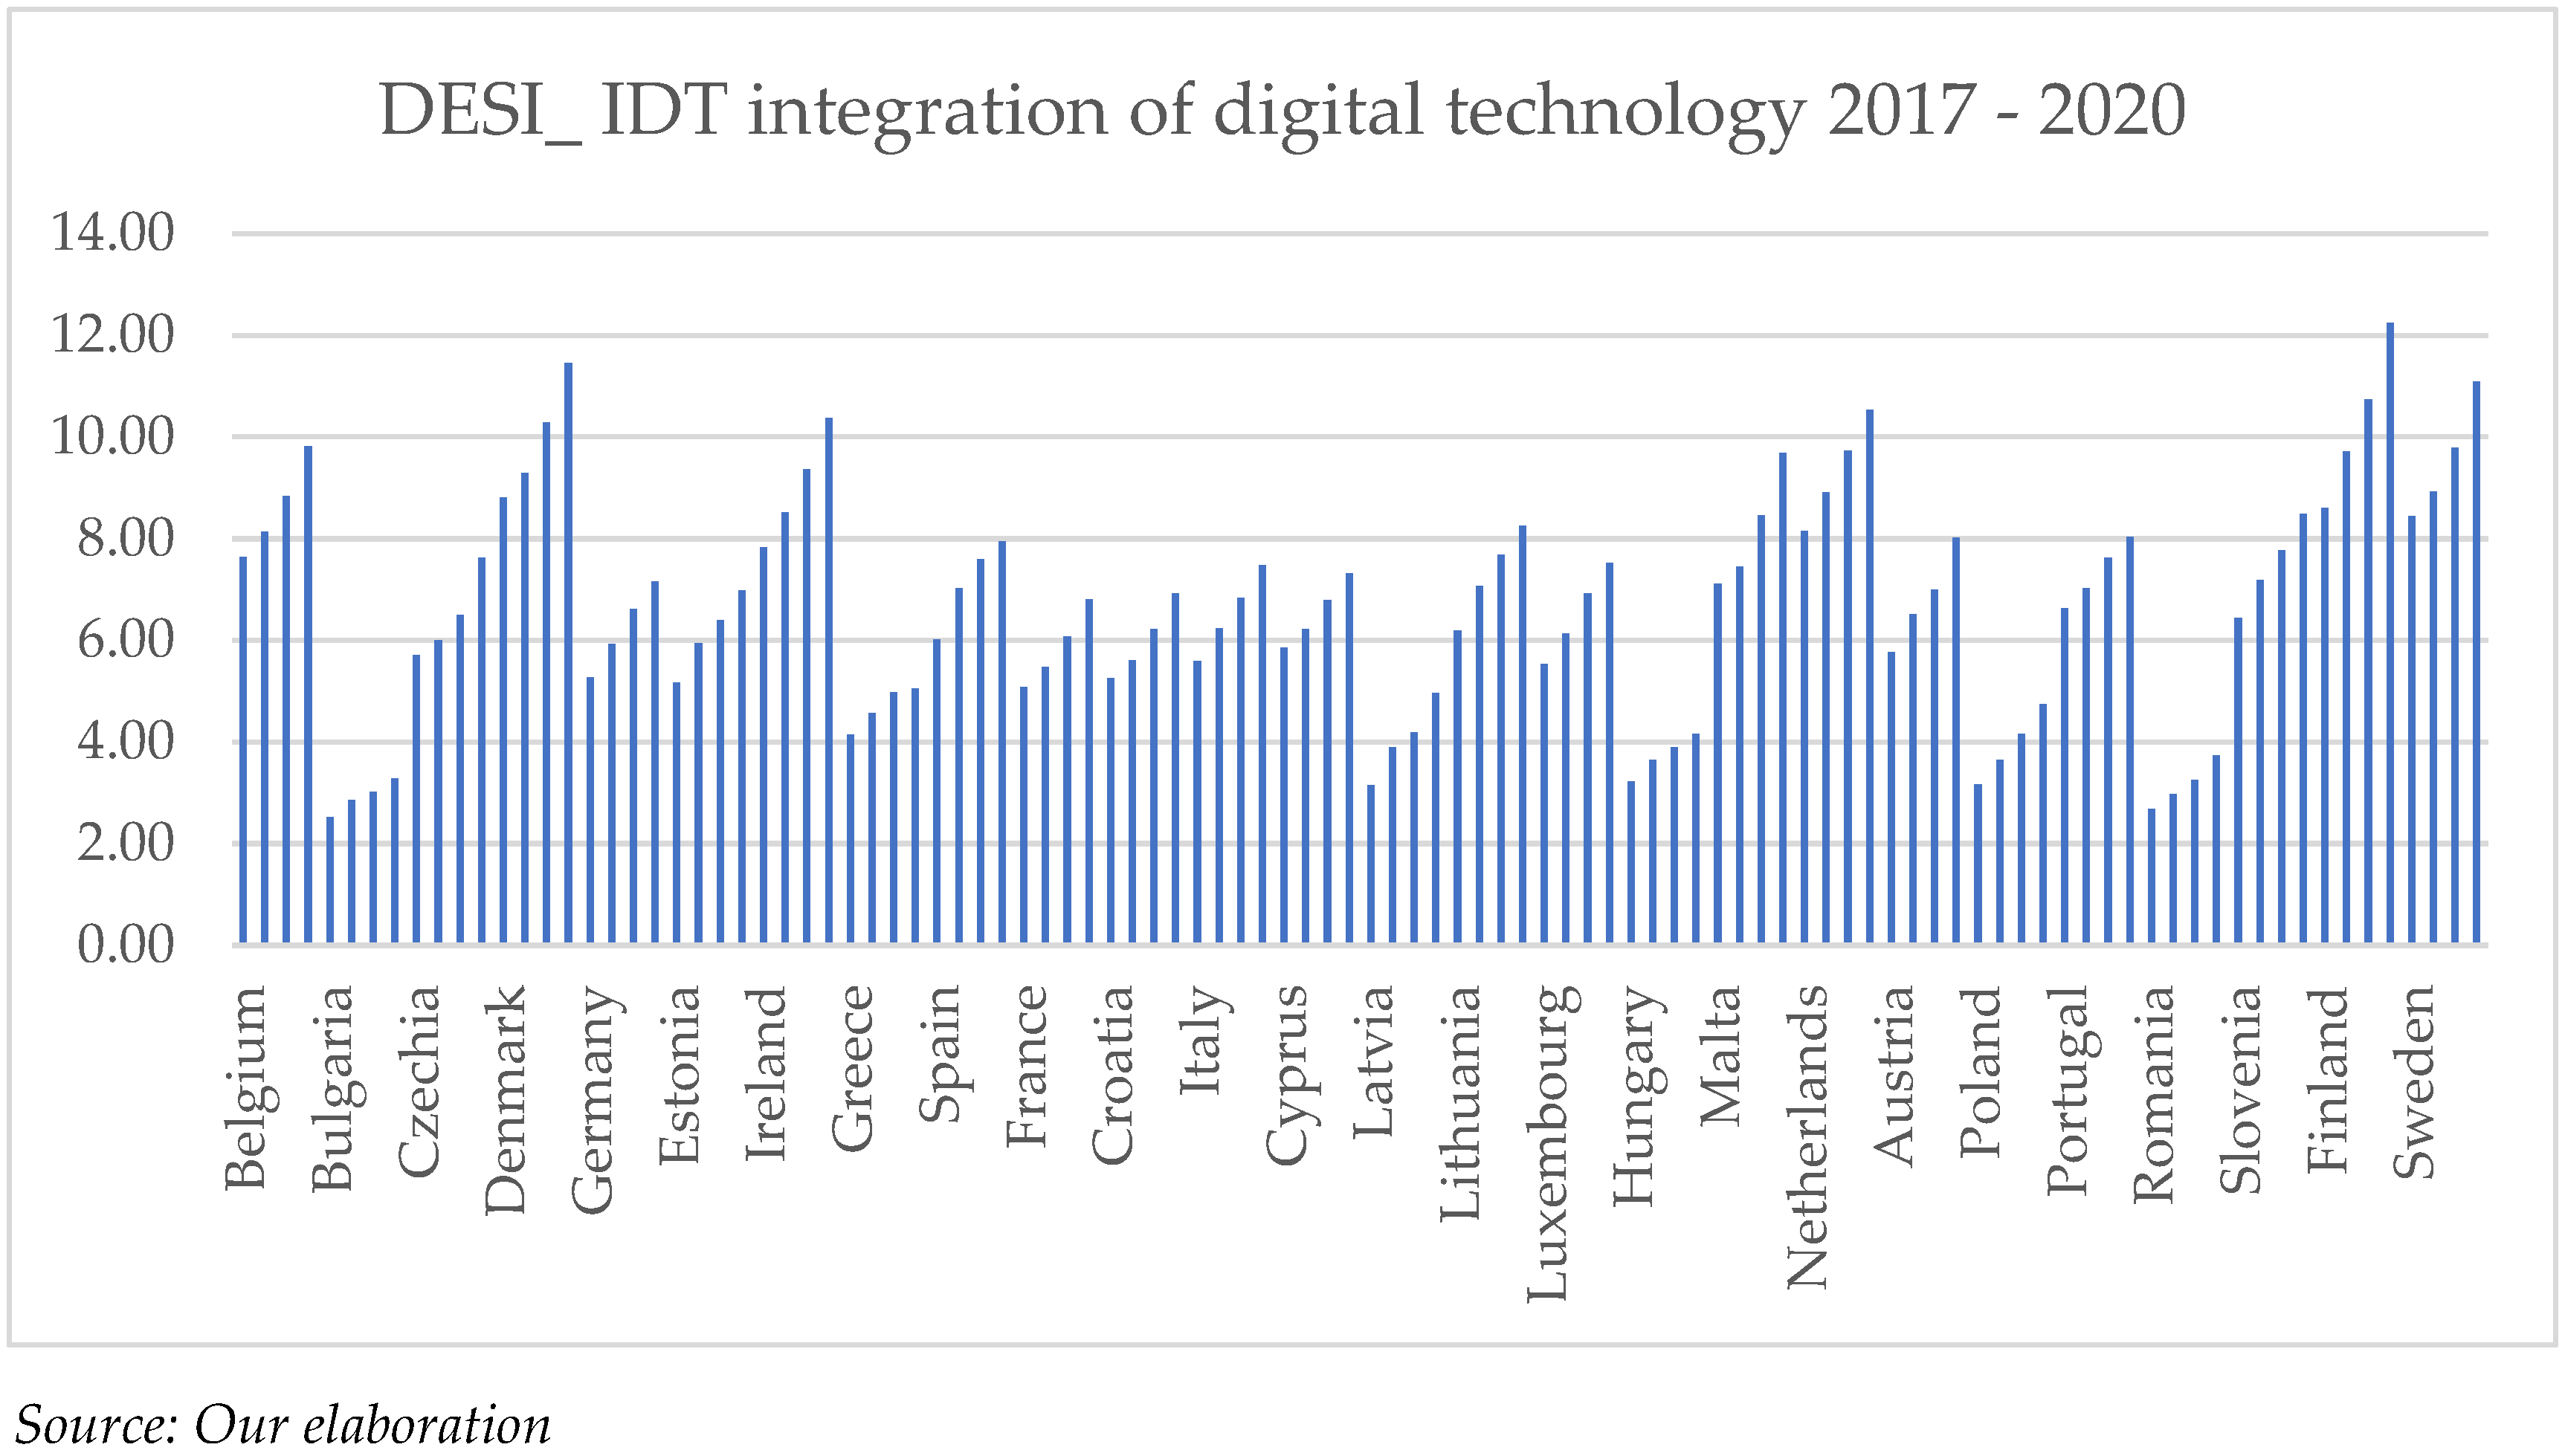
Figure 4 represents the evolution of the level of the integration of digital technology in European businesses from 2017 to 2020. It is evident that digitalization is more developed in the northern European countries, but the positive aspect is the growing trend the index assumed in the timeframe.
Our study attempts to answer two questions:
Q1: What are the critical factors affecting the price of the leading European stock market indices?
Along with classic macroeconomic variables, such as transport taxes, environmental taxes, and expenditure on research and development, to a sociodemographic variable, such as “the expectation of life”, we also include carbon emissions into the model to identify the determinants of the prices of the main market indices.
Q2: What are the roles of the integration of digital technology in enterprises and total environmental protection and resource management activities in explaining the price of the leading European stock market indices?
The innovativeness of this second question comprises two different factors: The first is the variable used as a proxy for digitalization, and the second is the inclusion of all the economic and management activities implemented by companies to protect the environment. Digitalization is not represented, as commonly happens, by the percentage of Internet banking users but rather by the inclusion of human capital, connectivity, the use of the Internet, and the integration of digital technologies in businesses.
The methodology used is a panel model estimator because it is one of the most widespread statistical tools, especially in economics. It allows you to draw information from multiple countries and for numerous periods. The use of panel data, which may include fixed or random effects, in a statistical analysis is often motivated by the presence of variation both across sectional units and over time. These data provide richer information than single cross-section or time series data, allowing us to address specific challenges and obtain more efficient and precise estimates. Here are some main reasons for using panel data with fixed or random effects in statistical analyses: controlling for individual heterogeneity, fixed or variable time control, increased estimating efficiency, handling the autocorrelation problem, greater statistical power, etc.
In summary, using panel data with fixed or random effects is useful when managing heterogeneity between units, controlling variations over time, obtaining more efficient and precise estimates, and improving the ability to answer complex research questions (Baltagi 2008). Table 2 and Table 3 present the unit root test and the descriptive statistics, highlighting the analysis timeframe, 1995–2020 and 2017–2020, respectively. The unit root test used is the Im–Pesaran–Shin unit root test as using it is a way to increase the power of unit root tests based on a single time series. It is now accepted that the Dickey–Fuller, augmented Dickey–Fuller, and Phillips–Perron tests cannot distinguish the null unit root from the stationary alternatives (Maddala and Wu 1999).
The econometric software used for the analysis is STATA.
4. Q1: European Indices, Carbon Emissions, and Renewable Energy
Sustainability as a dogma represents a guiding vision that has profoundly influenced European financial markets. The priority of reducing carbon emissions has pushed companies to review and transform their practices, adopting a greener agenda. This has not only contributed to greater environmental responsibility but has also attracted investors sensitive to environmental issues.
To try to understand how they interact with each other, we have identified two different regressions:
, where is the intercept and an error term.
The variables of the analysis are described as follows: represents the logarithm of the price regarding the major index of a single European country; is the first difference of the variable, representing the share of energy from renewable sources. Renewable resources include solar, wind, hydropower, geothermal energy, renewable parts of waste, biofuels, and ambient heat. represents the first differenced variable of the expenditure in research and development. The definition on the Eurostat database is “the creative and systematic work undertaken to increase the stock of the knowledge of humankind, culture and society” (European Commission 2020, p. 99; ) represents the life expectations of the population of each country; represents the transport taxes. This category primarily comprises taxes associated with the ownership and utilization of motor vehicles. Taxes on other transportation equipment (e.g., planes, ships, or railway stocks) and related transport services (e.g., duties on charter or scheduled flights) are also encompassed here, provided they adhere to the general definition of environmental taxes. Transport taxes can take the form of “one-off” levies related to the import or sale of equipment or recurring taxes such as an annual road tax (European Commission and Eurostat 2013, p. 14). represents the environmental taxes. The definition aligns with the regulation EU No 691/2011 (European Commission and Eurostat 2013, p. 9). represents the first differenced var logarithm of the carbon emissions of a single European count. The last variable considered is , that is, the energy taxes. This category encompasses taxes on energy production and energy products utilized for transportation and stationary purposes. The key energy products relevant to transportation are petrol and diesel (European Commission and Eurostat 2013, p. 13).
The results of the two regressions, the Hausman, Breusch–Pagan, and Wald tests are given in Table 4.
The results of the first regression show that the variables statistically significant are the expenditure in research and development, the environmental tax (at a 1 percent level), and the renewable energy but at a 10 percent level. There are several reasons why using renewable energy and research and development expenditure affect the prices of European stock indices, while environmental taxes could have positive effects. First, high upfront costs: Investments in renewable energy and research and development can result in significant upfront costs for companies. These costs impact profits, negatively impacting stock values. Businesses face financial pressure in the near term before investments generate positive returns. Second is the investor perception: Investors, especially short-term ones, react negatively to expenses that reduce immediate profits. Many investors’ approaches may be focused on maximizing short-term returns, so long-term investments are not initially well received. Third is the initial uncertainty about investment returns: Investments in renewable energy and research and development may take time to generate tangible returns. During this period, investors are cautious due to uncertainty about the long-term financial benefits of such initiatives.
On the other hand, environmental taxes have positive effects for several reasons. Incentive towards sustainable practices: Environmental taxes create an economic incentive for companies to adopt more sustainable practices. Companies that comply with environmental regulations are perceived as being responsibly managed, which is positively reflected in their market values. Long-term sustainability: Environmental taxes are often associated with broader environmental policies promoting sustainability. In the long term, companies that adopt sustainable strategies benefit from an improved reputation, greater resilience to future environmental regulations, and growing consumer demand for sustainable products and services. Reduce environmental risk: Environmental taxes can help reduce environmental risk and potential future company liabilities. Responsible management of environmental impacts can be viewed positively by investors concerned about the risks associated with environmental issues. In summary, while investments in renewable energy and research and development may initially represent a cost and a source of uncertainty, environmental taxes are perceived as measures that incentivize sustainability and reduce environmental risks, leading to positive effects on market values in the long term.
In the second regression, however, we only set environmental variables, and the results show us how all the variables are statistically significant. What was said previously for the Log_ent variable is confirmed. The positive relationship linking the dependent variable to carbon emissions should be underlined. This result is also consistent with what is reported in the literature (Adha et al. 2023; Boukhelkhal 2022; Godil et al. 2021; Odilova et al. 2023; Pejović et al. 2021; Reshetnikova et al. 2023). However, some explanations exist for this phenomenon, such as the carbon-intensive sectors. Carbon-intensive economic sectors, such as the fossil fuel industry or heavy manufacturing, could increase stock index prices. Despite contributing to rising carbon emissions, these industries represent a significant part of the economy and positively influence stock indices. Moreover, in some cases, an increase in carbon emissions can be correlated with increased economic activity and industrial production. If investors interpret this increase as a sign of robust economic growth, they may react positively to stock indexes, at least in the short term.
Instead, taxes on transport and energy negatively affect the dependent variable. Transportation and energy taxes increase operating costs for businesses, particularly those that rely heavily on transportation and energy. This could reduce profitability and adversely affect the value of the shares. Also, the factor of global competitiveness is very important. Companies operating in energy-intensive or transportation-intensive industries may find themselves at a disadvantage compared to competitors in countries with lower taxes. This will negatively impact the competitiveness and valuation of companies. Moreover, the perception of regulatory instability and tax increases negatively affect the European indices.
5. Q2: European Environmental Activities and Digitalization
Since the availability of data on digitalization in 2017, we further examine whether the price of the major European indices is affected by digitalization in business, environmental protection activities, resource management activities, and environmental and transport taxes.
The second model is constructed as follows:
, where is the intercept and an error term.
represents the logarithm of only one part of the DESI. In particular, this index is composed of politically relevant areas: human capital, connectivity, use of the Internet, and the integration of digital technology in businesses. The variable comprises only the “idt”, that is, the integration of digital technology in enterprises. represents the logarithm of each country’s “total environmental protection and resource management activities” (Eurostat 2020). Certainly, a weakness of the analysis is the lack of balanced data and a time frame of only four years concerning the variables relating to digitalization and environmental protection activities. This choice is, however, forced by the characteristics of the database present on Eurostat.
For the third regression, the Hausman and Breusch–Pagan tests were also carried out, allowing us to choose the random-effects GLS model (Table 5).
Even in this short-term analysis considering only four years, the positive relationship between carbon emissions and the dependent variable is confirmed, while there is an inversion concerning transport taxes. In a context where transport taxes are implemented to incentivize the adoption of low-emission vehicles or more sustainable transport, companies that comply with these regulations are well-regarded by investors and consequently positively impact stock indices. Increased transportation taxes can sometimes be interpreted as a government response to external shocks, such as oil price fluctuations or emergencies. Investors see this response as a form of stability and resilience, helping to support stock index prices.
Regarding “Log_CEPA_CReMA”, the motivation for the negative relationship with the dependent variable is the high initial costs of the environmental activities: Environmental protection and resource management require significant initial investments. For example, implementing environmental protection measures or sustainably managing resources can lead to higher operating costs for the enterprises involved. These raised costs can negatively impact profit margins and reduce the value of companies. Also, stringent environmental regulations generate the same effects. Environment-related activities increase operational costs and increase the complexity of the companies. During periods of economic growth, there may be increased attention and investment in these activities. However, in times of economic downturn, companies and investors may focus more on cost reduction and short-term profitability, which may disadvantage companies involved in such activities. In the end, the international markets also influence the relationship. Environmental protection and resource management activities often require international cooperation and can be affected by goal events. The fluctuations in global markets, such as prices of commodity prices, certainly influence European stock prices.
Another crucial aspect discussed in the paper is including the independent variable “Log_Desi_idt.” It was expected that there would be a positive correlation between “Log_Index” and “Log_Desi_idt,”, as supported, referred to economic growth by Imran et al. (2022), Kreiterling (2023), Mutascu et al. (2023), Olczyk and Kuc-Czarnecka (2022), Parra et al. (2021), and Tran et al. (2023). However, in our analysis, it is not significant. The non-significance certainly depends on at least two factors: the timing of effects and lack of investor awareness. The impacts of the DESI on the price performance of equity indices may take some time to manifest. It may take a longer period to see how initiatives aimed at improving the digital economy and digital society affect companies and, consequently, stock markets. Finally, investors may not be fully aware of the DESI or may not attach much importance to it in their investment evaluations. Lack of awareness or interest limits the index’s effect on stock index prices. The empirical results confirm how important digitalization is for the country’s growth, but on a generalized level, it does not influence the performance of the main European stock indices.
6. Conclusions
In summary, through two research questions, the analysis explores the intricate relationship between environmental sustainability measures, digitalization, and their impact on European stock market indices. Having different time horizons, i.e., 1995–2020 and 2017–2020, we can also distinguish long- and short-term influences. For the first research question, two regression models were used to evaluate the significance of various factors, such as carbon emissions, expenditure of research and development, use of renewable energy, and all environmental taxes. The first regression revealed that using renewable energy (consecutively investments in renewable energy) and expenditure research and development negatively affect stock indices, while environmental taxes demonstrate a positive correlation. This is attributed to the high initial cost that renewable energy requires for its use and the significant investments in research and development that can penalize profit margins, in contrast to environmental taxes that incentivize sustainability and reduce environmental risks. The second regression, focusing exclusively on environmental variables, shows the positive impact of carbon emissions on stock indices, likely driven by carbon-intensive sectors and perceptions of short-term economic growth. However, transportation and energy taxes show a negative association, reflecting increased operating costs for businesses, potential challenges to global competitiveness, and concerns about regulatory stability. Moving on to examine digitalization and environmental activities in the second research question, the results highlight the positive correlation between carbon emissions and stock indices and an unexpected reversal regarding transport taxes. This could be explained by interpreting transport taxes as government responses to external shocks, promoting stability. On the contrary, the negative relationship with the variable “Log_CEPA_CReMA” in the short period, representing environmental protection and resource management activities, highlights the impact of high initial costs and stringent regulations on reducing company value. Surprisingly, the inclusion of the variable “Log_Desi_idt”, which represents a part of the Digital Economy and Society Index (DESI), did not produce significant results. This is attributed to the timing of the effects and the potential lack of investor awareness regarding the influence of digitalization on stock index prices. In conclusion, the analysis highlights the complexity of factors influencing European stock markets, with short-term costs and investor perceptions shaping the impact of sustainability measures and digitalization initiatives. The interplay between economic, regulatory, and global market dynamics highlights the need for a nuanced understanding of the intricate relationships within the financial landscape. These results, therefore, show how environmental sustainability has a significant impact on European stock markets; consequently, the relevant regulations and policies should also take greater account of the economic and managerial impacts that companies implement to achieve their objectives of the Green Deal. Regarding possible developments, it would be very interesting to extend the analysis to other geographical areas such as China or America and, if we wanted to remain within Europe, to deepen the connections concerning the individual NACE sectors.
Author Contributions
Conceptualization, E.D.F.; methodology, E.D.F.; software, E.D.F. and T.L.; validation, E.D.F. and T.L.; formal analysis, E.D.F.; investigation, E.D.F.; resources, E.D.F.; data curation, E.D.F.; writing—original draft preparation, E.D.F. and T.L.; writing—review and editing, E.D.F. and T.L.; visualization, E.D.F. and T.L.; supervision, E.A. All authors have read and agreed to the published version of the manuscript.
Funding
This research received no external funding.
Informed Consent Statement
Not applicable.
Data Availability Statement
The data presented in this study are openly available in Eurostat at https://ec.europa.eu/eurostat/data/database, accessed on 7 February 2024.
Conflicts of Interest
The authors declare no conflicts of interest.
References
- Adha, Rishan, Cheng Yih Hong, Somya Agrawal, and Li Hua Li. 2023. ICT, carbon emissions, climate change, and energy demand nexus: The potential benefit of digitalization in Taiwan. Energy and Environment 34: 1619–38. [Google Scholar] [CrossRef]
- Antonescu, Daniela, Victor Platon, Ioana Cristina Florescu, Andreea Constantinescu, and Florina Popa. 2023. The Impact of Digitalization on Regional GDP: The Case of Romania. In Social and Economic Studies within the Framework of Emerging Global Developments. Berlin: Peter Lang. [Google Scholar]
- Baltagi, Badi Hani. 2008. Econometric Analysis of Panel Data. Hoboken: John Wiley and Sons. Available online: https://books.google.it/books?id=oQdx_70Xmy0C (accessed on 5 February 2024).
- Banelienė, Rūta, and Rolandas Strazdas. 2023. Green Innovation for Competitiveness: Impact on GDP Growth in the European Union. Contemporary Economics 17: 92–108. [Google Scholar] [CrossRef]
- Bánhidi, Zoltán, Imre Dobos, and András Nemeslaki. 2020. What the overall Digital Economy and Society Index reveals: A statistical analysis of the DESI EU28 dimensions. Regional Statistics 10: 42–62. [Google Scholar] [CrossRef]
- Bharadway, Anandhi, Omar El Sawy, Paul A. Pavlou, and N. Venkat Venkatraman. 2013. Digital Business Strategy: Toward a Next Generation of Insights. MIS Quartely 37: 471–82. [Google Scholar] [CrossRef]
- Boukhelkhal, Abdelaziz. 2022. Energy use, economic growth and CO2 emissions in Africa: Does the environmental Kuznets curve hypothesis exist? New evidence from heterogeneous panel under cross-sectional dependence. Environment, Development and Sustainability 24: 13083–110. [Google Scholar] [CrossRef]
- Chen, Liu, Yigi Tan, Gengpei Lv, Weiguang Cai, Xiaofeng Gao, and Rui Li. 2024. Uncovering the coupling effect with energy-related carbon emissions and human development variety in Chinese provinces. Journal of Environmental Sciences 139: 527–42. [Google Scholar] [CrossRef] [PubMed]
- Di Febo, Elisa, and Eliana Angelini. 2019a. Digitalization and Business Model: The case of European Banks. IUP Journal of Bank Management XVIII: 7–31. [Google Scholar]
- Di Febo, Elisa, and Eliana Angelini. 2019b. The digitalization’s effect in different business models on the Italian banks. International Journal of Management and Applied Science 5: 14–22. [Google Scholar]
- Di Febo, Elisa, and Eliana Angelini. 2022. Internet banking, age, gender, and performance: Which connections in Italy? Bank and Credit 53: 295–324. [Google Scholar]
- European Commission. 2020. Commision Implementing Regulation (EU) 2020/1197 of 30 July 2020. Brussels: European Commission. [Google Scholar]
- European Commission. 2023. Report on the State of the Digital Decade 2023. Brussels: European Commission. [Google Scholar]
- European Commission, and Eurostat. 2013. Environmental Taxes: A Statistical Guide 2013 Edition. Brussels: European Commission. [Google Scholar]
- Eurostat. 2020. Classification of Environmental Protection Activities and Expenditure (CEPA) and Classification of Resource Management Activities (CReMA)—Explanatory Notes. December. Luxembourg: Eurostat. [Google Scholar]
- Firoiu, Daniela, Ramona Pîrvu, Elena Jianu, Laura Mariana Cismaș, Sorin Tudor, and Gabriela Lățea. 2022. Digital Performance in EU Member States in the Context of the Transition to a Climate Neutral Economy. Sustainability 14: 3343. [Google Scholar] [CrossRef]
- Godil, Danish Iqbal, Arshian Sharif, Muhammad Iftikhar Ali, Ilhan Ozturk, and Rimsha Usman. 2021. The role of financial development, R&D expenditure, globalization and institutional quality in energy consumption in India: New evidence from the QARDL approach. Journal of Environmental Management 285: 112208. [Google Scholar] [CrossRef] [PubMed]
- Imran, Muhammad, Xiangyang Liu, Rongyu Wang, Shah Saud, Yun Zhao, and Muhammad Jalal Khan. 2022. The Influence of Digital Economy and Society Index on Sustainable Development Indicators: The Case of European Union. Sustainability 14: 1130. [Google Scholar] [CrossRef]
- Karlilar, Selin, Mehmet Balcilar, and Firat Emir. 2023. Environmental sustainability in the OECD: The power of digitalization, green innovation, renewable energy and financial development. Telecommunications Policy 47: 102568. [Google Scholar] [CrossRef]
- Kopp, Thomas, Markus Nabernegg, and Steffen Lange. 2023. The net climate effect of digitalization, differentiating between firms and households. Energy Economics 126: 106941. [Google Scholar] [CrossRef]
- Kotsompolis, Giorgos, Konstantinos N. Konstantakis, Panos Xidonas, Panayotis G. Michaelides, and Dimitrios D. Thomakos. 2023. Climate change economics and the determinants of carbon emissions’ futures returns: A regime-driven ARDL model. Finance Research Letters 58: 1544–6123. [Google Scholar] [CrossRef]
- Kreiterling, Christoph. 2023. Digital innovation and entrepreneurship: A review of challenges in competitive markets. Journal of Innovation and Entrepreneurship 12: 49. [Google Scholar] [CrossRef]
- Maddala, Gangadharrao. S., and Shaowen Wu. 1999. A comparative study of unit root tests with panel data and a new simple test. Oxford Bulletin of Economics and Statistics 61: 631–52. [Google Scholar] [CrossRef]
- Monasterolo, Irene. 2020. Climate Change and the Financial System. Annual Review of Resource Economics 12: 299–320. [Google Scholar] [CrossRef]
- Monasterolo, Irene, Stefano Battiston, Anthony C. Janetos, and Zoey Zheng. 2017. Vulnerable yet relevant: The two dimensions of climate-related financial disclosure. Climatic Change 145: 495–507. [Google Scholar] [CrossRef]
- Mutascu, Mihai, Florian Horky, and Cristina Strango. 2023. Good or Bad? Digitalisation and Green Preferences. Energy Economics 121. [Google Scholar] [CrossRef]
- Odilova, Shoirahon, Zebo Sharipova, and Sardor Azam. 2023. Investing in the Future: A Systematic Literature Review on Renewable Energy and its Impact on Financial Returns. International Journal of Energy Economics and Policy 13: 329–37. [Google Scholar] [CrossRef]
- Olczyk, Magdalena, and Marta Kuc-Czarnecka. 2022. Digital transformation and economic growth—DESI improvement and implementation. Technological and Economic Development of Economy 28: 775–803. [Google Scholar] [CrossRef]
- Parra, Javier, María Eugenia Pérez-Pons, and Jorge González. 2021. Study based on the incidence of the index of economy and digital society (DESI) in the GDP of the eurozone economies. Advances in Intelligent Systems and Computing 1242: 164–68. [Google Scholar] [CrossRef]
- Pejović, Bojan, Vesna Karadžić, Zdenka Dragašević, and Tamara Backović. 2021. Economic growth, energy consumption and CO2 emissions in the countries of the European Union and the Western Balkans. Energy Reports 7: 2775–83. [Google Scholar] [CrossRef]
- Reshetnikova, Liudmila, Danila Ovechkin, Anton Devyatkov, Galina Chernova, and Natalia Boldyreva. 2023. Carbon Emissions and Stock Returns: The Case of Russia. Journal of Risk and Financial Management 16: 370. [Google Scholar] [CrossRef]
- Santarius, T., L. Dencik, T. Diez, H. Ferreboeuf, P. Jankowski, S. Hankey, A. Hilbeck, L. M. Hilty, M. Höjer, D. Kleine, and et al. 2023. Digitalization and Sustainability: A Call for a Digital Green Deal. Environmental Science and Policy 147: 11–14. [Google Scholar] [CrossRef]
- Simionescu, Mihaela, Carmen Beatrice Păuna, and Tiberiu Diaconescu. 2020. Renewable energy and economic performance in the context of the European green deal. Energies 13: 6440. [Google Scholar] [CrossRef]
- Su, Chi Wei, Yannong Xie, Sadaf Shahab, Ch Muhammad Nadeem Faisal, Muhammad Hafeez, and Ghulam Muhammad Qamri. 2021. Towards achieving sustainable development: Role of technology innovation, technology adoption and CO2 emission for brics. International Journal of Environmental Research and Public Health 18: 277. [Google Scholar] [CrossRef]
- Tran, Trang L. Q., Miklós Herdon, Thich D. Phan, and Tuan M. Nguyen. 2023. Digital skill types and economic performance in the EU27 region, 2020–2021. Regional Statistics 13: 536–58. [Google Scholar] [CrossRef]
- Vyshnevskyi, Oleksandr, Ihor Stashkevych, Olena Shubna, and Svetlana Barkova. 2020. Economic growth in the conditions of digitalization in the EU countries. Studies of Applied Economics 38. [Google Scholar] [CrossRef]
Figure 1.
Carbon emissions by European countries from 1995 to 2020.

Figure 2.
European environmental taxes from 1995 to 2020.

Figure 3.
Activities, products, expenditures, and other transactions related to environmental protection.
Figure 3.
Activities, products, expenditures, and other transactions related to environmental protection.

Figure 4.
Part of DESI that indicates the level of integration of digital technology in European business.
Figure 4.
Part of DESI that indicates the level of integration of digital technology in European business.


Table 1.
European countries of the database.
| Country Name | Index | |
|---|---|---|
| 1 | Belgium | BEL20 |
| 2 | Bulgaria | BSE SOFIX |
| 3 | Czechia | PX |
| 4 | Denmark | OMX 20 |
| 5 | Germany | DAX |
| 6 | Estonia | Tallin SE General |
| 7 | Ireland | ISEQ Overall |
| 8 | Greece | Athens General Composite |
| 9 | Spain | IBEX 35 |
| 10 | France | CAC 40 |
| 11 | Croatia | CROBEX |
| 12 | Italy | FTSE Italia All Share |
| 13 | Cyprus | Cyprus Main Market |
| 14 | Latvia | Riga General |
| 15 | Lithuania | Vilnius SE General |
| 16 | Luxembourg | LUX General |
| 17 | Hungary | Budapest SE |
| 18 | Malta | MSE |
| 19 | Netherlands | AEX |
| 20 | Austria | ATX |
| 21 | Poland | WIG20 |
| 22 | Portugal | PSI |
| 23 | Romania | BET |
| 24 | Slovenia | Blue-chip SBITOP |
| 25 | Finland | OMX Helsinki 25 |
| 26 | Sweden | OMX Stockholm 30 |
Table 2.
Im–Pesaran–Shin unit root test.
| Im–Pesaran–Shin Unit Root Test (Lag (1)) | |
|---|---|
| Log_index | S (0.000) |
| Log_CO2 | NS (0.999) |
| d_Log_CO2 | S (0.000) |
| Log_re | NS (1.000) |
| d_Log_re | S (0.000) |
| Log_rd | NS (0.874) |
| d_Log_rd | S (0.000) |
| Log_tt | S (0.004) |
| Log_ent | S (0.000) |
| Log_et | S (0.000) |
| Log_le | NS (0.263) |
| d_Log_le | S (0.000) |
Table 3.
Descriptive statistics of the analysis variables.
| 1995–2020 | |||||
|---|---|---|---|---|---|
| Variables | Obs. | Mean | Std. Dev. | Min | Max |
| Log_index | 576 | 7.493 | 1.3302 | 3.493 | 10.637 |
| d_Log_CO2 | 650 | −0.010 | 0.0625 | −0.4087 | 0.2331 |
| d_Log_re | 643 | 0.049 | 0.133 | −0.952 | 1.546 |
| d_Log_rd | 598 | 0.084 | 0.188 | −0.914 | 1.923 |
| Log_tt | 672 | 6.286 | 1.960 | 0.215 | 9.294 |
| Log_ent | 676 | 8.048 | 1.651 | 3.243 | 11.021 |
| Log_et | 676 | 7.766 | 1.742 | 2.785 | 10.831 |
| d_Log_le | 650 | 0.003 | 0.005 | −0.020 | 0.035 |
| 2017–2020 | |||||
| Variables | Obs. | Mean | Std. Dev. | Min | Max |
| Log_index | 104 | 7.703 | 1.403 | 3.493 | 10.636 |
| d_Log_CO2 | 104 | −0.023 | 0.068 | −0.409 | 0.162 |
| Log_desi | 104 | 1.840 | 0.0361 | 0.928 | 2.5055 |
| Log_cepa_crema | 104 | 0.803 | 0.473 | −0.528 | 1.934 |
| Log_ent | 104 | 8.470 | 1.448 | 5.69 | 11.02 |
| Log_tt | 104 | 6.596 | 1.805 | 2.41 | 9.29 |
Table 4.
Results of the analysis of research hypotheses Q1 with the regressions 1 and 2.
| H1: 1995–2020 | ||
|---|---|---|
| (1) | (2) | |
| (Random Effects) | (Fixed Effect) | |
| Log_Index | Coef. | Coef. |
| d_Log_re | −0.291 * | |
| d_Log_rd | −0.362 *** | |
| Log_tt | 0.098 | −0.185 *** |
| Log_ent | 0.48 *** | 3.036 *** |
| d_Log_le | −1.799 | |
| d_Log_CO2 | 0.652 ** | |
| Log_et | −2.171 *** | |
| Year | ||
| 1997 | 0.293 | 0.418 ** |
| 1998 | 0.467 ** | 0.483 *** |
| 1999 | 0.412 *** | 0.551 *** |
| 2000 | 0.540 *** | 0.639 *** |
| 2001 | 0.253 | 0.389 ** |
| 2002 | 0.205 | 0.187 |
| 2003 | 0.149 | 0.200 |
| 2004 | 0.447 *** | 0.453 ** |
| 2005 | 0.719 *** | 0.743 *** |
| 2006 | 0.942 *** | 0.932 *** |
| 2007 | 1.080 *** | 1.092 *** |
| 2008 | 0.698 *** | 0.767 *** |
| 2009 | 0.331 ** | 0.528 *** |
| 2010 | 0.524 *** | 0.613 *** |
| 2011 | 0.457 *** | 0.614 *** |
| 2012 | 0.277 | 0.472 *** |
| 2013 | 0.369 *** | 0.559 *** |
| 2014 | 0.447 *** | 0.628 *** |
| 2015 | 0.417 ** | 0.573 *** |
| 2016 | 0.362 ** | 0.515 *** |
| 2017 | 0.506 *** | 0.628 *** |
| 2018 | 0.511 *** | 0.632 *** |
| 2019 | 0.493 *** | 0.631 *** |
| 2020 | 0.431 ** | 0.602 *** |
| _cons | 2.470 *** | |
| R-sq: | ||
| Within | 0.369 | 0.439 |
| Between | 0.245 | 0.136 |
| Overall | 0.251 | 0.128 |
| Hausman test | 0.260 | 0.0009 |
| Breusch–Pagan | 0.000 | |
| Wald test | 0.000 | 0.0000 |
Notes: Standard errors are in parentheses. *, **, *** Significant at 10, 5, and 1 percent levels, respectively.
Table 5.
Results of the analysis of research questions Q2.
| 2017–2020 | |
|---|---|
| (Random Effects) | |
| Log_Index | Coef. |
| d_Log_CO2 | 0.260 * |
| Log_Desi_idt | 0.083 |
| Log_CEPA_CReMA | −0.601 *** |
| Log_ent | 0.069 |
| Log_tt | 0.333 ** |
| _cons | 5.250 |
| R-sq: | |
| Within | 0.409 |
| Between | 0.274 |
| Overall | 0.273 |
| Hausman test | 0.514 |
| Breusch–Pagan | 0.000 |
Notes: Standard errors are in parentheses. *, **, *** Significant at 10, 5, and 1 percent levels, respectively.
Disclaimer/Publisher’s Note: The statements, opinions and data contained in all publications are solely those of the individual author(s) and contributor(s) and not of MDPI and/or the editor(s). MDPI and/or the editor(s) disclaim responsibility for any injury to people or property resulting from any ideas, methods, instructions or products referred to in the content. |
© 2024 by the authors. Licensee MDPI, Basel, Switzerland. This article is an open access article distributed under the terms and conditions of the Creative Commons Attribution (CC BY) license (https://creativecommons.org/licenses/by/4.0/).
Share and Cite
MDPI and ACS Style
Di Febo, E.; Angelini, E.; Le, T. Environment and Digitalization: The New Paradigms in the European Stock Markets. Economies 2024, 12, 65. https://0-doi-org.brum.beds.ac.uk/10.3390/economies12030065
AMA Style
Di Febo E, Angelini E, Le T. Environment and Digitalization: The New Paradigms in the European Stock Markets. Economies. 2024; 12(3):65. https://0-doi-org.brum.beds.ac.uk/10.3390/economies12030065
Chicago/Turabian StyleDi Febo, Elisa, Eliana Angelini, and Tu Le. 2024. "Environment and Digitalization: The New Paradigms in the European Stock Markets" Economies 12, no. 3: 65. https://0-doi-org.brum.beds.ac.uk/10.3390/economies12030065
Note that from the first issue of 2016, this journal uses article numbers instead of page numbers. See further details here.