
Impact of US Trade with China on Shareholders’ Wealth: Insights from Shipment Data in the COVID-19 Era
1
Department of Accounting, Finance, Management Information Systems and Economics, Governors State University, University Park, IL 60484, USA
2
Department of Management and Marketing, Northeastern Illinois University, Chicago, IL 60625, USA
*
Author to whom correspondence should be addressed.
Economies 2024, 12(3), 67; https://0-doi-org.brum.beds.ac.uk/10.3390/economies12030067
Submission received: 9 January 2024
/
Revised: 6 March 2024
/
Accepted: 7 March 2024
/
Published: 12 March 2024
Abstract
:This study analyzes the impact of Chinese shipment volumes measured in TEUs on US stock performance in the initial stages of the COVID-19 outbreak. The analysis indicates that, initially, US stocks were negatively affected irrespective of firms’ trade engagements with China; however, as the global pandemic unfolded, companies with elevated imports from China exhibited more pronounced abnormal returns. The findings further reveal an increased influence of debt level and cash holdings on stock performance as the crisis intensified in Europe and the USA. These results highlight the evolving nature of global trade dynamics and their implications for financial markets amid global crises. Furthermore, this study provides valuable insights into the resilience of global supply chains during crises like the COVID-19 pandemic. The observed pattern, where companies with greater import volumes from China experienced better stock returns, underscores the importance of adaptable supply chains during disruptions.
1. Introduction
Epidemics have historically exerted significant influence on global economies, with major events such as influenza, Ebola, and severe acute respiratory syndrome (SARS) affecting public health and economic stability worldwide, as reported by the World Health Organization (WHO) (Shehzad et al. 2020). Among these, the COVID-19 pandemic, originating in late 2019 in Wuhan, China, stands out for its unprecedented impact on global financial markets and economic systems. The COVID-19 health crisis, which escalated rapidly into a global emergency by early 2020, induced a multitude of economic challenges and uncertainties, profoundly affecting stock markets across the globe (Liu et al. 2021). The pandemic’s onset led to substantial disruptions in global economic activity, a phenomenon observed in the sharp decline in market value of over 30% across various financial markets (Shehzad et al. 2020; Liu et al. 2021; Sharif et al. 2020).
The rapid spread of COVID-19, along with the implementation of stringent measures such as lockdowns, travel restrictions, and social distancing, caused significant upheavals in the global economic landscape. Key sectors such as global supply chains, labor markets, and consumer behavior underwent profound changes, leading to heightened volatility in financial markets (Onyeaka et al. 2021; Debata et al. 2020). This volatility in financial markets was particularly evident in the form of substantial fluctuations in stock prices. Furthermore, the unpredictable nature of COVID-19’s transmission and its mortality rate added layers of uncertainty to the economic outlook, casting a shadow of ambiguity over future economic prospects. This uncertainty was most acutely reflected in the projections for future cash flows of companies, which became increasingly difficult to predict due to the rapidly changing global economic landscape (Liu et al. 2021; Baker et al. 2020).
The ability of companies to maintain sufficient cash flows and liquidity during times of crisis has played a crucial role when determining resilience to economic shocks. During the COVID-19 pandemic, unpredictable projections of future cash flows, liquidity constraints, and financial fragility made companies more vulnerable to stock price volatility. Moreover, the role of China in global trade, especially its interconnectedness with companies worldwide, emerged as a crucial vulnerability factor for investors and policymakers to consider during the initial stages of the COVID-19 pandemic. The trade conflict between the US and China, notably marked by the 2018 trade war, highlighted the need to scrutinize the effects of tariffs and geopolitical tensions on global supply chains. These trade tensions, resulting in tariffs and trade restrictions, have disrupted supply chains, altered production costs, and significantly influenced the stock prices of companies engaged in international trade (Huang et al. 2023). China’s involvement in global trade and ensuing trade tensions are key to grasping the targeted effects of these geopolitical developments on the stock market, especially during the pandemic period.
Consequently, fluctuations in stock prices, unpredictable projections for future cash flows, and the interplay between China’s trade policies and the US during the COVID-19 outbreak have garnered considerable attention within the academic community, sparking a surge in research aimed at deciphering the complex relationship between the pandemic’s progression and its multifaceted impact on financial markets. Our research serves as a critical foundation for understanding how specific economic variables, such as cash level, depth holdings, and shipment volumes from China, became pivotal factors influencing stock market behaviors during COVID-19 global crisis.
The COVID-19 pandemic’s impact on different industry sectors was not only a function of shifts in consumer demand but also a reflection of the supply chain flexibility and reliance on imports, particularly from China, of many countries around the globe. Industries like medical devices, pharmaceuticals, and essential consumer goods not only benefited from increased demand but also demonstrated a certain degree of supply chain adaptability. This adaptability was crucial in maintaining the flow of goods despite disruptions, particularly those reliant on imports from China. Their ability to navigate the challenges posed by disrupted global supply chains contributed significantly to the resilience of their stock prices during the pandemic (Liu et al. 2021). On the other hand, sectors such as transportation, entertainment and leisure, and retail faced severe challenges. These industries, already impacted by a reduction in consumer demand due to lockdowns and social distancing, also grappled with supply chain disruptions. The reliance on imports from China for many businesses in these sectors further compounded their operational difficulties, reflected in their stock valuations.
The disparate impact of the COVID-19 pandemic across various industry sectors can be further understood by examining the relationship between supply chain integration with China and stock market performance. The reliance on imports from China was not uniformly detrimental across sectors. This reliance may have translated into a competitive advantage for some companies, especially those in essential goods and services.
Given China’s role in global trade, this study aims to explore how shipment volumes from China, particularly during the pandemic, influenced the US stock market. The analysis investigates whether companies with higher import volumes from China experienced differing stock returns compared to those with lower import volumes. This inquiry is especially pertinent considering the 2018 trade tensions between the US and China, which already underscored the importance of examining the impact of tariffs and geopolitical events on global supply chains and stock prices (Huang et al. 2023).
The significance of global supply chains in trade underlines the importance of sustainability as a critical factor. Multinational corporations (MNCs), particularly companies with significant shipment volumes from China, are increasingly accountable for the environmental and social impacts of their supply chain decisions, especially during global disruptions like a pandemic; however, MNCs encounter substantial challenges in maintaining sustainability practices within these networks, dealing with complexities such as adhering to social as well as environmental standards across supplier tiers and managing the risks of non-compliance during the COVID-19 pandemic (Villena and Gioia 2020). Industries such as medical devices and pharmaceuticals exemplified the advantage of robust supply chains, as they not only sustained operations but also responded effectively to surges in global demand amidst the pandemic. This situation highlights the variable impacts of the pandemic across different sectors, with some benefiting from their strong links to China while others faced compounded challenges. Therefore, there is a need for sector-specific sustainability strategies and effective governance to enhance supply chain resilience and sustainability, ensuring that companies can sustain economic viability and meet critical needs during global disruptions (Villena and Gioia 2020).
A sustainable supply chain serves as a bridge between production and consumption, influencing diverse dimensions of social development, including urban infrastructure, industrial structure, social contexts, and the economy (Liu et al. 2023). Notably, there is a growing emphasis on addressing environmental impacts; in particular, reducing global supply chain carbon emissions (Liu et al. 2023; Cariou et al. 2019). This focus intersects with the role of containerization in the global economy, which cannot be overstated, with its significance permeating various aspects of international trade and economic growth. Research by Michail, Melas, and Batzilis (Michail et al. 2021) highlights the relationship between container shipping trade and real GDP growth, emphasizing containerization’s pivotal role in facilitating economic expansion through a panel vector autoregressive approach. Containerization significantly mitigates the impact of distance on maritime trade, as evidenced in Del Rosal’s (Del Rosal 2022) study. The research highlights the need for better data on container usage to enhance trade policy and infrastructure development (Del Rosal 2022).
The purpose of this paper is fourfold and centers on the influence of Chinese shipment volumes (measured in TEUs) on US stock market performance during the early stages of the COVID-19 pandemic. First, this study investigates how internationally oriented firms, especially those dependent on China, are affected by a sudden and disruptive event like COVID-19, an exogenous shock providing a unique opportunity to examine the determinants of firm value during disruptions (Ramelli and Wagner 2020). Second, the study aims to assist policymakers in understanding how financial flexibility, in terms of cash holdings and debt, influences firm value and performance during such unforeseen shocks. Third, by delving into the nuanced interplay between shipment volumes and stock prices, the study aims to uncover how varying degrees of trade activity with China impact investor perceptions and stock performance. Finally, the study explores the amplified effects of debt and cash holdings on stock performance as the pandemic intensified, particularly in the US and Europe. This comprehensive examination contributes to understanding how global trade disruptions, especially those involving China, played a significant role in shaping stock market responses during this period of global economic uncertainty.
The structure of this paper is organized as follows: The next section provides a comprehensive literature review. This is followed by the methodology section, which outlines the approach and techniques used in our study and presents the findings. Next, the paper concludes with a discussion section offering concluding remarks and implications. Finally, the paper addresses the limitations.
2. Literature Review
The existing literature on economic disruptions and stock markets is extensive, covering diverse scenarios such as export subsidies, elections, and trade wars. Desai and Hines (2008) explore the impact of export subsidies, while Wagner et al. (2018) and Huang et al. (2023) investigate the effects of political events such as Trump’s election and the US–China trade war on stock markets.
In the context of the COVID-19 pandemic, previous research has predominantly focused on stock reactions to this unprecedented crisis. Ramelli and Wagner (2020) analyze US stock dynamics, noting the underperformance of firms with international trade links, especially with China. Ding et al. (2021) and Albuquerque et al. (2020) extend this analysis to global firms and environmental as well as social policies, respectively. De Vito and Gómez (2020) concentrate on the liquidity challenges faced by firms during the pandemic. Similarly, our research focuses on the COVID-19 pandemic as an exogenous shock and investigates its effects on stocks in the United States.
Building on the existing research focused on economic disruptions, a substantial body of literature examines corporate financial strategies in response to the COVID-19 shock. The concept of financial flexibility, as emphasized by Fahlenbrach et al. (2021), and defined by Gamba and Triantis (2008) as the ability to efficiently adjust and acquire financing with minimal costs, is crucial for navigating disruptions in cash flows or investment opportunities (Bancel and Mittoo 2011). The COVID-19 pandemic has particularly highlighted the importance of the financial flexibility concept, with firms enhancing their cash holdings as a precautionary measure (DeAngelo et al. 2006; Acharya and Steffen 2020), despite potential agency and opportunity costs associated with high cash reserves (Jensen 1986; Stulz 1990). Fahlenbrach et al. (2021) delved into the impact of financial flexibility on stock prices in the wake of the COVID-19 shock, characterizing financially flexible firms as those possessing more cash and incurring lower short-term as well as long-term debt. They found that the stocks of highly flexible firms experienced a significantly smaller decline during the market collapse compared to those with lower financial flexibility. Barry et al. (2022) demonstrated how financial, workplace, and investment flexibility provided vital support to firms during the pandemic. In line with the aforementioned studies, the emphasis of this research lies in evaluating the significance of financial flexibility in terms of cash withholdings in alleviating the impact of the COVID-19 shock.
The significance of maintaining substantial cash reserves, a key aspect of financial flexibility, has been explored in depth in the literature. Opler and Titman (1994) investigated the impact of financial distress on company performance, while Almeida et al. (2004) examine how financially constrained firms exhibit cash flow sensitivity. Faulkender and Wang (2006) discussed how firms with more liquidity are valued higher, though they note the diminishing returns of additional cash. Bates et al. (2009) observed an increasing cash-to-assets ratio among US industrial firms, attributing it to a long-term trend driven by a precautionary motive for cash holdings. Duchin et al. (2010) proposed a precautionary savings motive for seemingly excess cash, particularly during the financial crisis of 2007–2008. Lins et al. (2010) distinguished between non-operational cash and lines of credit, emphasizing their respective roles in cushioning against future cash flow shocks and funding growth opportunities. Gilchrist et al. (2017) highlighted how liquidity constraints and high operating leverage led certain firms to increase prices during the 2008 financial crisis.
However, interpreting the findings of these studies requires considering the role of anticipatory factors in financial policies, as underscored by Kothari and Warner (2007). The anticipation of events, especially financial crises, is likely to shape firms’ financial policies. This anticipation dynamic introduces complexity, and its impact on market reactions following event resolution can be misleading, particularly when there is a high level of market anticipation, as highlighted by Huberman and Schwert (1985) and Bhattacharya et al. (2000). In situations where market participants anticipate events, prices tend to already incorporate a substantial portion of the event’s impact before its actual occurrence. Consequently, any residual signals related to the relative value effects for individual firms may be obscured by the noise introduced through liquidity trades. This challenge becomes even more intricate when the event’s effects vary across individual firms.
In stark contrast, the COVID-19 pandemic, as an exemplary case of an exogenous shock, offers a unique lens with which to study the channels influencing firm value. As an unforeseen external force, it provides distinct insights into the role of financial strength during economic downturns. In examining its impact, we can disentangle the effects of exogenous shocks from the anticipatory noise that often complicates the interpretation of financial events, allowing for a clearer understanding of how financial decisions and strength are crucial in navigating economic challenges. Our study aims to explore this domain, examining the pandemic’s impact to better understand the role of financial flexibility in such unprecedented times.
In the realm of corporate finance and international trade, many empirical studies have utilized the Hoberg and Moon (2017) dataset, which employs a text-based approach to analyze firm-level geographic segment data for US firms. The dataset, known as the text-based offshoring database, is constructed from annually updated firm disclosures in their 10-K filings about their international activities. While this dataset is widely recognized for its extensive coverage, it primarily sources information from firms’ 10-K filings to determine their geographic segments. This reliance poses a significant challenge, as 10-K filings may not always mirror the actual operational footprint of these firms. There are scenarios where firms may have substantial operations in locations not disclosed in their 10-K filings, or the reported locations might not accurately represent the scope of their operations. Such discrepancies between reported data and actual operations can introduce errors into the dataset, potentially skewing the results and interpretations of these empirical studies. This issue underscores the need for a cautious approach in utilizing and interpreting these data, highlighting the importance of verifying and supplementing them with additional sources to ensure accuracy and reliability in research findings.
3. Methodology
3.1. Data
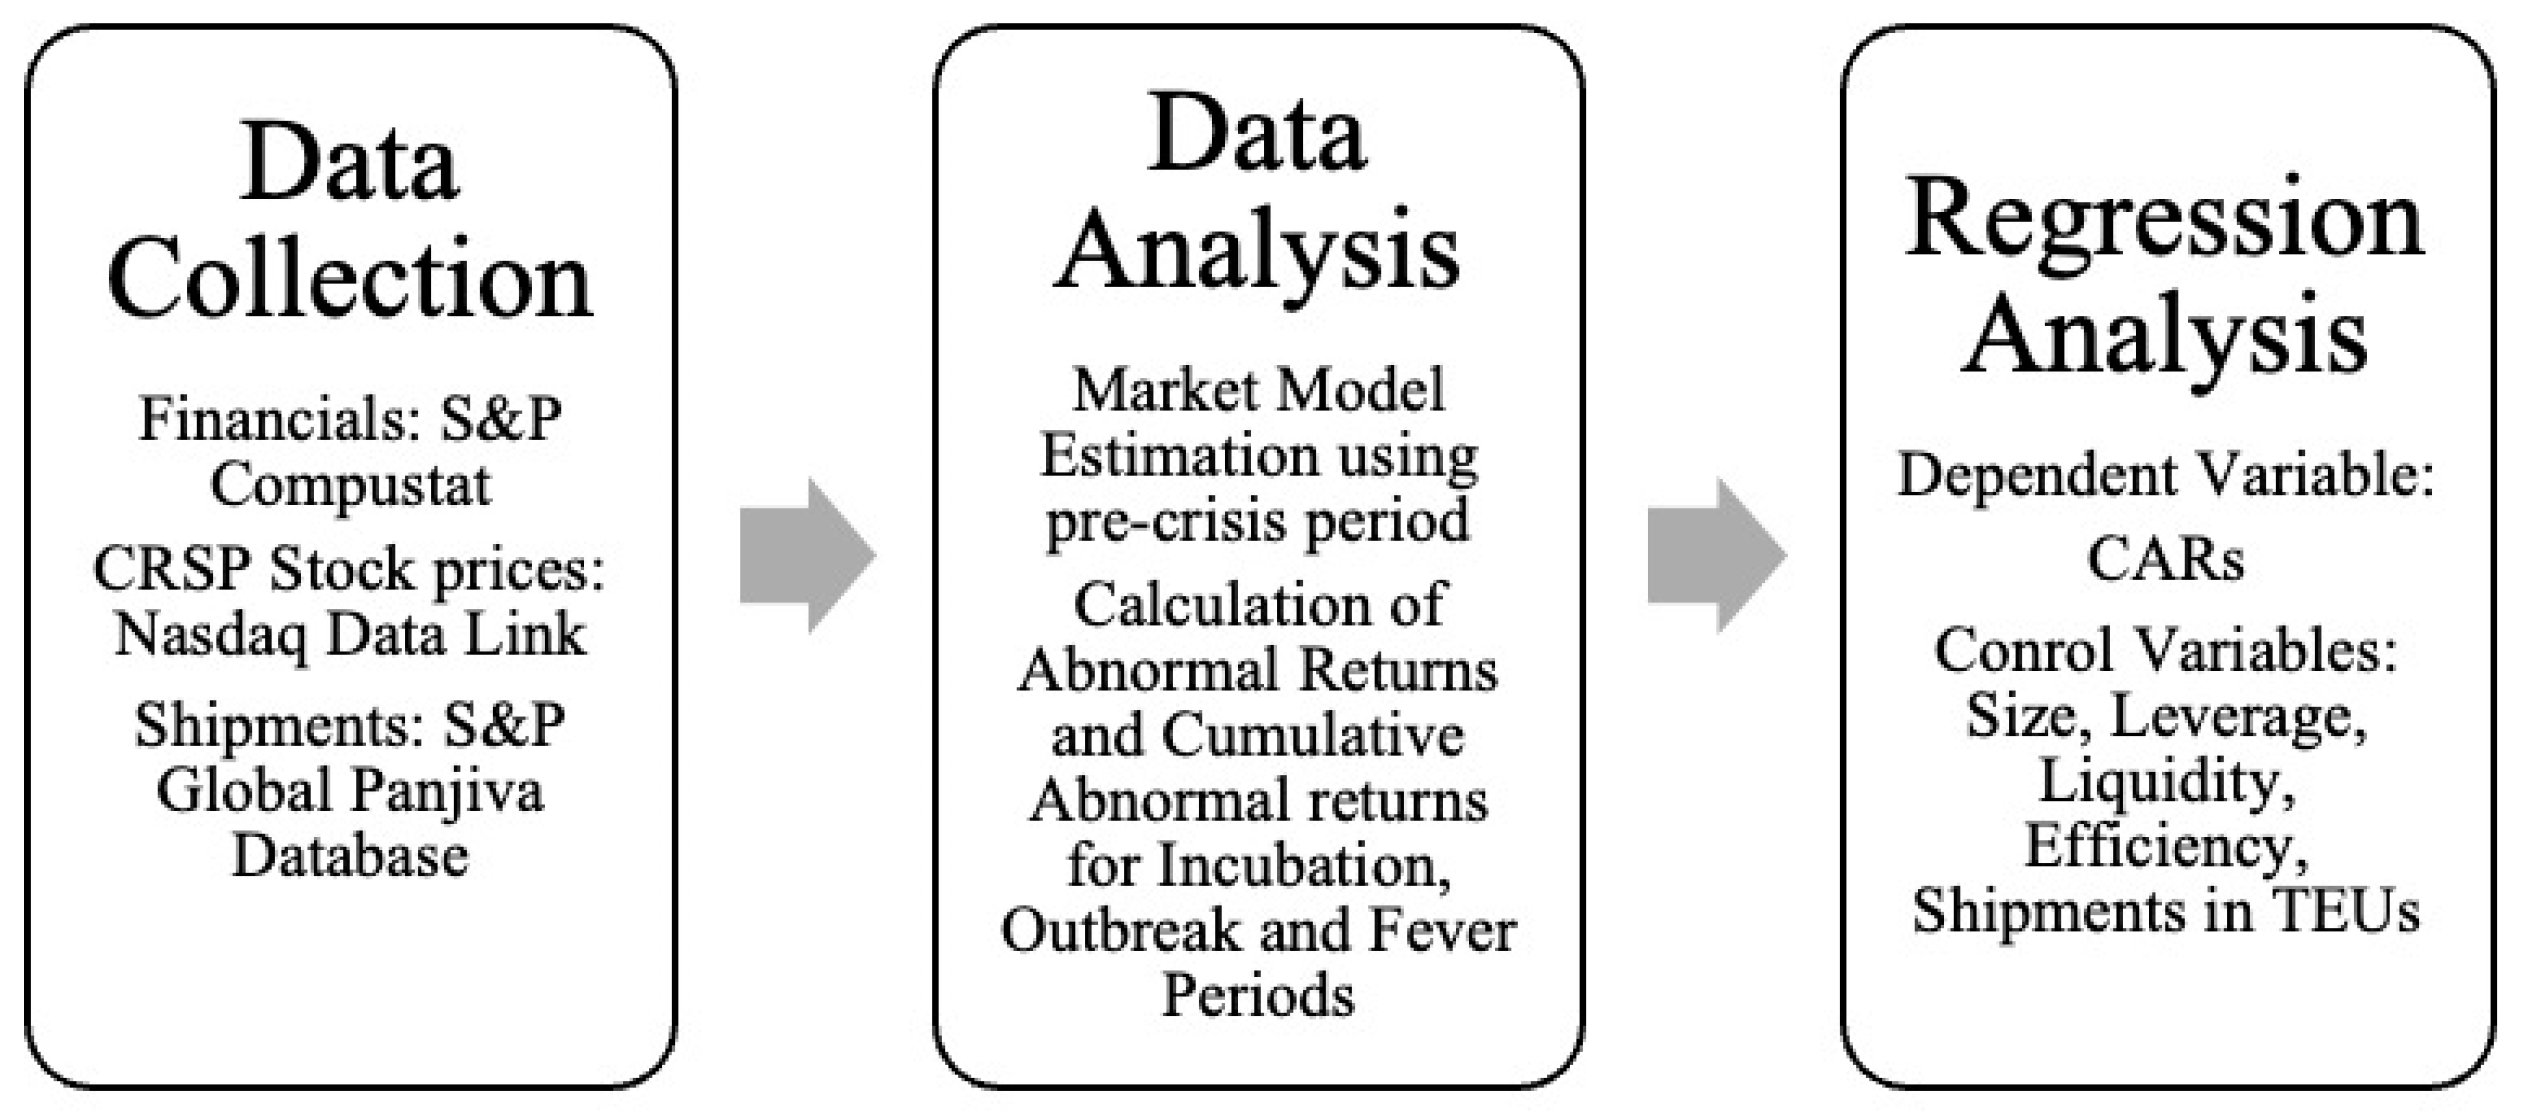
In the methodology section of our study, we outline a structured approach to examine the impact of the COVID-19 crisis on stock performance. Our analysis begins with the aggregation of a dataset that includes daily stock performance, market index returns, and a range of financial and trade-related metrics. The data are from three distinct and reputable sources, each contributing essential data for a comprehensive analysis. Company financials, including key metrics such as revenue, profit margins, debt levels, and cash holdings, are sourced from the S&P Compustat database. This information is crucial for assessing the financial health and operational capabilities of companies during the study period. Stock price data, essential for understanding market valuation and investor sentiment, are obtained from Nasdaq Data Link. This dataset provides a clear picture of how the market responded to the evolving economic landscape during the COVID-19 pandemic. Additionally, US import data, particularly important for examining the impact of international trade dynamics and the role of imports from China, is gleaned from the S&P Global Panjiva database. These data include detailed information on US import volumes, measured in TEUs, which is key to analyzing the relationship between trade activities and stock market performance. By integrating these diverse data streams, our study aims to offer a multifaceted analysis of the pandemic’s impact on US companies, especially regarding their financial performance, stock market valuation, and international trade activities. Figure 1 summarizes the steps of our methodology.
In this study, we have chosen to utilize the Panjiva database for our analysis, diverging from the commonly used Hoberg and Moon (2017) dataset. Panjiva specializes in supply chain intelligence, bringing clarity and transparency to global trade. A key feature of Panjiva is its ability to impute a standard measure of volume known as twenty-foot equivalent units (TEUs). This measurement is derived from various factors, including container size, the nature of goods shipped, and their weight. Most trade records primarily provide weight information. Panjiva applies advanced methodologies to correct for a range of data inaccuracies, such as misplaced decimals and incorrect units, and standardizes these figures to metric equivalents. This capability to refine and normalize data makes Panjiva an invaluable resource for our analysis. Panjiva takes into account various factors, such as container size, shipped goods, and weight, and, importantly, it corrects various errors often found in trade records and standardizes the data to metric equivalents. This meticulous approach to data handling is referenced in the work of Flaaen et al. (2023). The choice of Panjiva over the Hoberg and Moon (2017) dataset is strategic: while Hoberg and Moon’s text-based offshoring database, derived from firms’ 10-K filings, offers insightful firm–nation–year network summaries of international activities, it may not fully capture the operational reality of firms due to potential inaccuracies or omissions in 10-K filings. In contrast, Panjiva’s focus on standardized, error-corrected trade data provides a more direct and perhaps more accurate representation of firms’ international trade activities and their volumes. This is particularly relevant in our analysis, which aims to closely examine the impact of international shipment volumes, specifically from China, on US stock market performance during the early stages of the COVID-19 pandemic.
Our study incorporates specific adjustments to ensure the accuracy and relevance of the data analyzed. To account for the impact of dividends on stock prices, we apply Compustat’s price adjustment factors. This step is crucial for obtaining a true reflection of stock performance, free from distortions caused by dividend payouts. Furthermore, in the case of dual-listed firms, we prioritize those with a higher market capitalization. This criterion is adopted to focus on firms that have a more significant impact on and representation in the stock market, thereby enhancing the robustness of our analysis.
Additionally, in line with standard practices in financial research, we exclude financial firms from our analysis. This exclusion is based on the unique regulatory and financial characteristics of these firms, which can differ significantly from non-financial firms and potentially skew the general understanding of market dynamics. We only considered firms with a share price higher than USD 5, aiming to exclude companies whose low share price might indicate higher risk or a less established market position. A minimum market capitalization of USD 10 million was set as a criterion to filter out further smaller companies that may not have the same level of financial robustness or operational scale as larger entities. This screening approach was designed to focus our analysis on firms more likely to have significant trading activity and relevance in the market, thus ensuring the robustness of our findings.
3.2. Model
The market model utilizes an estimation window spanning from 255 days to 3 days prior to each crisis period’s onset. This window captures the market conditions before the pandemic’s influence, providing a baseline for comparison. Within this framework, the model’s parameters are derived from the relationship between individual stock returns and the broader market performance, informed by data from Kenneth French’s website, which includes market excess returns and the US 1-month treasury bill rate as a proxy for the risk-free rate. Additionally, we have applied a criterion for data selection, excluding stocks with less than 127 daily observations in the estimation window, to ensure robustness in our analysis.
Cumulative abnormal returns (CARs) are derived by summing the daily abnormal returns (ARs) for each stock across the defined crisis periods. These ARs are calculated as the difference between the actual stock returns and the expected returns, where the expected returns are estimated using the market model. The market model considers the stock’s daily return minus its expected return, incorporating a constant term and the daily market factor.
Dutta and Dutta (2015) explore the challenges of long-run event study methods and acknowledge the need for methodological improvements. Their analysis suggests that the practice of examining cumulative returns over extended periods is well established but requires further development for enhanced accuracy and reliability in studying long-term event impacts.
The COVID-19 crisis is divided into three distinct periods based on the progression of the pandemic incubation period (Thursday, 2 January to Friday, 17 January), outbreak period (Monday, January 20 to Friday, 21 February), and fever period (Monday, 24 February through Friday, 20 March). This division, inspired by the periodization approach of Ramelli and Wagner (2020), allows for a granular analysis of the pandemic’s unfolding impact on the stock market.
We proceed with a regression analysis where the dependent variable is the CARs. This analysis aims to explore the influence of the COVID-19 crisis alongside other control variables that might affect stock returns. These controls include firm-specific characteristics such as size, leverage, liquidity, and operational efficiency, capturing a comprehensive view of factors that could drive stock performance during the pandemic.
3.3. Variables
In our analysis of the COVID-19 crisis’s impact on stock performance, a comprehensive understanding of the underlying factors influencing stock movements is crucial. To this end, we integrate a carefully selected set of control variables derived from financial and trade-related data.
“Shipments from China (TEUs)” represents the historical monthly average volume of shipments from China to the USA, utilizing data from January 2018 to December 2019. Meanwhile, “shipments from China/total shipments” is a metric indicating the historical monthly average share of shipments from China in the total shipments to the USA, also based on data from the same period, January 2018 to December 2019. This measure provides insight into the proportion of total US imports that are sourced from China. For liquidity assessment, we use the cash/total assets ratio, which is derived from dividing cash and short-term investments by total assets. This ratio reflects a firm’s ability to meet short-term obligations and overall financial stability.
In our analysis, we compute several key control variables using accounting data for the fiscal year 2019. The debt ratio, represented as debt/equity, is calculated by dividing the sum of long-term debt and debt in current liabilities by total equity. This ratio provides insights into a company’s financial leverage and risk profile. The book-to-market value is another crucial metric in our analysis. It is obtained by dividing the book value of equity by the market price. This ratio helps in understanding the market valuation of a company in relation to its accounting value, often used as an indicator of potential investment returns. Additionally, we calculate the log market cap, which is the natural logarithm of the equity market value as of 31 December 2019. The logarithmic transformation of market capitalization normalizes the data, making them more suitable for statistical analysis, especially when dealing with large variances typical in market cap data. Lastly, return on assets (ROA) is computed by dividing the annual income for 2019 by total assets. ROA is a key indicator of how efficiently a company is using its assets to generate earnings.
4. Results
Table 1 presents descriptive statistics, offering valuable insights into the variability and distribution of our data, particularly concerning shipments from China. The large standard deviation of 1345.1 for the “China input (#)” metric, compared to its mean of 118.6, indicates a substantial spread in the shipment volumes from China across different firms.
Similarly, the “shipment from China/total shipments” ratio, with a standard deviation of 0.30, also exhibits considerable variability. This ratio measures the proportion of a firm’s total shipments that originate from China, and the observed variability in this ratio across firms indicates differing degrees of reliance on Chinese imports. Some firms might be heavily reliant on imports from China, while others might source more diversely or predominantly from other regions.
The descriptive statistics also highlight significant differences among firms in terms of financial control variables. This variation could be due to differences in industry sectors, company sizes, financial strategies, or operational models. Such diversity in financial metrics is crucial for understanding how different types of firms responded to and were affected by the economic impacts of the COVID-19 pandemic, especially regarding their financial flexibility, debt structures, liquidity positions, and overall financial health.
Table 2 highlights the average cumulative returns, shipments from China in TEUs, and the ratio of shipments from China to total shipments across various Fama–French industry groups. Notably, sectors like electrical equipment, pharmaceuticals, measuring and control, electronic equipment, agriculture, and medical equipment performed relatively well over the entire period. In contrast, during the pandemic, stock performance varied markedly among different industries. The energy, industrial, travel, and service sectors bore the brunt of the impact, particularly the travel and entertainment sectors, which struggled due to reduced oil demand and prices. Meanwhile, the healthcare and consumer staples sectors experienced less significant declines.
Table 3 indicates the variables related to the shipments from China. In the wake of COVID-19, shipments from China (in TEUs) and China’s share in total shipments are insignificant. As the situation in China began to improve in comparison to other countries, China experienced a decline in confirmed cases and deaths, while Europe and the United States saw a rapid increase in these figures. Given these developments, it would be reasonable to anticipate that firms exposed to China would no longer continue to underperform in the market. Shipments from China (in TEUs) were significant and positive in the outbreak and fever periods, and China’s share in total shipments became positive in the fever period.
The control variable for size, Log (market cap), consistently shows positive and significant results across all periods, suggesting that investors see larger firms as better equipped to navigate market downturns. Additionally, the profitability measure, return on assets (ROA), is significant and positive in both the incubation and outbreak periods, highlighting its relevance to investors during the initial stages of the pandemic; however, its significance diminished during the fever period, signaling a possible shift in investor priorities or the criteria used for evaluating companies as the pandemic’s impact evolved.
Table 4 indicates the results from financial flexibility regressions based on different stages of the pandemic. During the incubation period of the pandemic, corporate leverage—the ratio of a company’s total debt to its equity or assets—did not significantly explain the variations in stock returns across different companies. Starting in the outbreak period, investors paid attention to the financial risk of companies.
The liquidity ratio, cash/assets, demonstrated a positive and strengthening trend throughout the pandemic. It began at 0.056 during the incubation period, increased to 0.1373 in the outbreak period, and reached 0.4719 in the fever period. This escalating trend highlights the growing significance of liquidity for firms’ financial stability as the pandemic worsened globally. This pattern suggests that investors increasingly valued cash holdings as crucial, especially as the pandemic led to deteriorating economic conditions, potentially resulting in tighter credit markets and challenges in raising external capital.
In the following sections, we discuss our findings and the limitations of our study.
5. Discussion
The disparate impact of the COVID-19 pandemic across various industry sectors can be further understood by examining the relationship between supply chain integration with China and stock market performance.
Instead of adopting the Hoberg and Moon (2017, 2019) approach, which involves counting the frequency of each time a country is mentioned in annual reports, we utilized standardized shipment volume in TEUs (twenty-foot equivalent units). This method offers a more concrete and measurable way to assess international trade activities, specifically focusing on the volume of shipments, rather than relying on textual references in corporate reports.
This study aimed to uncover how varying degrees of trade activity with China impacted investor perceptions and stock performance. Initially, the analysis revealed that investors broadly penalized firms irrespective of their trade involvement with China; however, as the pandemic evolved into a global phenomenon, a shift occurred. Companies with higher import volumes from China began to experience higher abnormal returns compared to those with lower import volumes. In addition, the study explored the amplified effects of debt and cash holdings on stock performance as the pandemic intensified, particularly in the US and Europe. This comprehensive examination contributes to understanding how global trade disruptions, especially those involving China, played a significant role in shaping stock market responses during this period of global economic uncertainty.
Our analysis revealed that companies with higher import volumes from China experienced better stock returns as the situation worsened in Europe and the US. This counterintuitive result may be attributed to several factors: Firstly, industries like medical devices and pharmaceuticals, which saw an upsurge in demand, were able to leverage their established supply chains with China to meet this increased demand effectively. Their ability to quickly adapt to supply chain disruptions and maintain the flow of essential goods played a crucial role in their financial resilience, as reflected in their stock prices.
Moreover, the reliance on imports from China was not uniformly detrimental across sectors. This reliance may have translated into a competitive advantage for some companies, especially those in essential goods and services. By maintaining steady import volumes from China, these companies could sustain their operations and fulfill market demands during a period where many competitors faced supply shortages. This operational continuity likely contributed to increased investor confidence, reflecting positively on their stock returns.
In contrast, sectors that faced both a decline in consumer demand and supply chain disruptions—such as transportation, entertainment, and retail—did not benefit from their ties to Chinese imports in the same way. This distinction underscores the nuanced relationship between supply chain dynamics, particularly with China, and stock market responses during the pandemic. It highlights the complexity of global trade connections and their varied implications for different industry sectors in times of crisis.
In light of these findings, this study offered substantial insights into the sustainability of global supply chains during crises such as the COVID-19 pandemic. The observed trend, where companies with higher import volumes from China experienced better stock returns, underscores the importance of resilient and adaptable supply chains in sustaining economic viability during global disruptions.
Particularly noteworthy is the role of industries like medical devices and pharmaceuticals, which not only managed to sustain operations through established supply chains with China but also responded efficiently to the surge in global demand. This ability to quickly adapt and maintain essential goods flow is a critical aspect of economic sustainability, ensuring that critical needs are met even during periods of crisis.
Furthermore, this study highlighted the varying impacts of supply chain reliance on different industry sectors. While some sectors leveraged their connections with China as a competitive advantage, others, like transportation, entertainment, and retail, faced compounded challenges due to both demand decline and supply chain disruptions. This differentiation not only reflects the complexity of global trade relationships, but also emphasizes the need for sector-specific sustainability strategies that consider the unique supply chain dependencies and vulnerabilities.
The pandemic thus acted as a catalyst for re-evaluating and potentially restructuring supply chain strategies, emphasizing the need for greater resilience and adaptability in the face of unforeseen challenges. Companies and industries must consider diversification and flexibility in their supply chain networks to mitigate risks and sustain operations under varying market conditions. This approach is not only crucial for short-term recovery but also fundamental in building long-term sustainable economic practices that can withstand future global crises.
In conclusion, the pandemic’s disparate impact across various sectors, through the lens of supply chain integration with China, offers valuable lessons in economic sustainability. It calls for a rethinking of global trade dynamics, urging businesses and policymakers to prioritize supply chain resilience as a cornerstone of sustainable economic development.
6. Limitations
There were a few limitations in our study: First, our dataset, which captures 84,960 TEUs, indeed represents a little over 10 percent of the total average monthly shipments from China to the USA, which stands at 700,666 TEUs, according to our source. While this constitutes a substantial portion of the trade volume, we acknowledge that it reflects a small market share. This selection was guided by the availability and relevance of data for the objectives of our study, aiming to provide insights into the impacts of the COVID-19 crisis on trade flows.
Furthermore, there are limitations using datasets from sources like Panjiva or other trade-related databases. We understand that these constraints can influence the breadth of our conclusions; while valuable for their detailed transaction-level data, such datasets may not fully encompass the entirety of trade activities due to reporting, variations in data collection methodologies across countries, and potential delays in data availability. These factors can lead to the under-representation of specific segments of trade, particularly smaller transactions or those conducted by entities not covered by the dataset.
Author Contributions
Conceptualization, C.G.K. and M.K.; methodology, M.K.; software, M.K.; validation, M.K.; formal analysis, M.K.; resources, C.G.K. and M.K.; data curation, M.K.; writing—original draft preparation, C.G.K. and M.K.; writing—review and editing, C.G.K. and M.K.; visualization, C.G.K. and M.K. All authors have read and agreed to the published version of the manuscript.
Funding
This research received no external funding.
Institutional Review Board Statement
Not applicable.
Informed Consent Statement
Not applicable.
Data Availability Statement
Data is contained within the article: The original contributions presented in the study are included in the article, further inquiries can be directed to the corresponding author.
Conflicts of Interest
The authors declare no conflicts of interest.
References
- Acharya, Viral V., and Sascha Steffen. 2020. The Risk of Being a Fallen Angel and the Corporate Dash for Cash in the Midst of COVID. Review of Corporate Finance Studies 9: 430–71. [Google Scholar] [CrossRef]
- Albuquerque, Rui, Yrjo Koskinen, Shuai Yang, and Chendi Zhang. 2020. Resiliency of Environmental and Social Stocks: An Analysis of the Exogenous COVID-19 Market Crash. Review of Corporate Finance Studies 9: 593–621. [Google Scholar] [CrossRef]
- Almeida, Heitor, Murillo Campello, and Michael S. Weisbach. 2004. The Cash Flow Sensitivity of Cash. The Journal of Finance 59: 1777–804. [Google Scholar] [CrossRef]
- Baker, Scott R., Nicholas Bloom, Steven J. Davis, Kyle J. Kost, Marco C. Sammon, and Tasaneeya Viratyosin. 2020. The Unprecedented Stock Market Impact of COVID-19. National Bureau of Economic Research No. w26945. Cambridge: National Bureau of Economic Research. [Google Scholar]
- Bancel, Franck, and Usha R. Mittoo. 2011. Financial Flexibility and the Impact of the Global Financial Crisis: Evidence from France. International Journal of Managerial Finance 7: 179–216. [Google Scholar] [CrossRef]
- Barry, John W., Murillo Campello, John R. Graham, and Yueran Ma. 2022. Corporate Flexibility in a Time of Crisis. Journal of Financial Economics 144: 780–806. [Google Scholar] [CrossRef]
- Bates, Thomas W., Kathleen M. Kahle, and René M. Stulz. 2009. Why Do U.S. Firms Hold So Much More Cash Than They Used to? The Journal of Finance 64: 1985–2021. [Google Scholar] [CrossRef]
- Bhattacharya, Utpal, Hazem Daouk, Brian Jorgenson, and Carl-Heinrich Kehr. 2000. When an Event Is Not an Event: The Curious Case of an Emerging Market. Journal of Financial Economics 55: 69–101. [Google Scholar] [CrossRef]
- Cariou, Pierre, Francesco Parola, and Theo Notteboom. 2019. Towards low carbon global supply chains: A multi-trade analysis of CO2 emission reductions in container shipping. International Journal of Production Economics 208: 17–28. [Google Scholar] [CrossRef]
- DeAngelo, Harry, Linda DeAngelo, and René M. Stulz. 2006. Dividend Policy and the Earned/Contributed Capital Mix: A Test of the Life-Cycle Theory. Journal of Financial Economics 81: 227–54. [Google Scholar] [CrossRef]
- Debata, Byomakesh, Pooja Patnaik, and Abhisek Mishra. 2020. COVID-19 Pandemic! It’s Impact on People, Economy, and Environment. Journal of Public Affairs 20: e2372. [Google Scholar] [CrossRef]
- Del Rosal, Ignacio. 2022. Does containerisation reduce the constraints imposed by distance in seaborne trade? Maritime Policy & Management 1: 1–15. [Google Scholar]
- Desai, Mihir A., and James R. Hines Jr. 2008. Market Reactions to Export Subsidies. Journal of International Economics 74: 459–74. [Google Scholar] [CrossRef]
- De Vito, Antonio, and Juan-Pedro Gómez. 2020. Estimating the COVID-19 Cash Crunch: Global Evidence and Policy. Journal of Accounting and Public Policy 39: 106741. [Google Scholar] [CrossRef]
- Ding, Wenzhi, Ross Levine, Chen Lin, and Wensi Xie. 2021. Corporate Immunity to the COVID-19 Pandemic. Journal of Financial Economics 141: 802–30. [Google Scholar] [CrossRef]
- Duchin, Ran, Oguzhan Ozbas, and Berk A. Sensoy. 2010. Costly External Finance, Corporate Investment, and the Subprime Mortgage Credit Crisis. Journal of Financial Economics 97: 418–35. [Google Scholar] [CrossRef]
- Dutta, Anupam, and Probal Dutta. 2015. Measuring Long-Run Security Price Performance: A Review. Investment Management and Financial Innovations 12: 26–32. [Google Scholar]
- Fahlenbrach, Rüdiger, Kevin Rageth, and René M. Stulz. 2021. How Valuable Is Financial Flexibility when Revenue Stops? Evidence from the COVID-19 Crisis. The Review of Financial Studies 34: 5474–521. [Google Scholar] [CrossRef]
- Faulkender, Michael, and Rong Wang. 2006. Corporate Financial Policy and the Value of Cash. The Journal of Finance 61: 1957–90. [Google Scholar] [CrossRef]
- Flaaen, Aaron, Flora Haberkorn, Logan Lewis, Anderson Monken, Justin Pierce, Rosemary Rhodes, and Madeleine Yi. 2023. Bill of Lading Data in International Trade Research with an Application to the COVID-19 Pandemic. Review of International Economics 31: 1146–72. [Google Scholar] [CrossRef]
- Gamba, Andrea, and Alexander Triantis. 2008. The Value of Financial Flexibility. The Journal of Finance 63: 2263–96. [Google Scholar] [CrossRef]
- Gilchrist, Simon, Raphael Schoenle, Jae Sim, and Egon Zakrajšek. 2017. Inflation Dynamics During the Financial Crisis. American Economic Review 107: 785–823. [Google Scholar] [CrossRef]
- Hoberg, Gerard, and S. Katie Moon. 2017. Offshore Activities and Financial vs. Operational Hedging. Journal of Financial Economics 125: 217–44. [Google Scholar] [CrossRef]
- Hoberg, Gerard, and S. Katie Moon. 2019. The Offshoring Return Premium. Management Science 65: 2876–99. [Google Scholar] [CrossRef]
- Huang, Yi, Chen Lin, Sibo Liu, and Heiwai Tang. 2023. Trade Networks and Firm Value: Evidence from the US-China Trade War. Journal of International Economics 145: 103811. [Google Scholar] [CrossRef]
- Huberman, Gur, and G. William Schwert. 1985. Information Aggregation, Inflation, and the Pricing of Indexed Bonds. Journal of Political Economy 93: 92–114. [Google Scholar] [CrossRef]
- Jensen, Michael C. 1986. Agency Costs of Free Cash Flow, Corporate Finance, and Takeovers. American Economic Review 76: 323–29. [Google Scholar]
- Kothari, S. P., and Jerold B. Warner. 2007. Econometrics of Event Studies. In Handbook of Empirical Corporate Finance. Amsterdam: Elsevier, pp. 3–36. [Google Scholar]
- Lins, Karl V., Henri Servaes, and Peter Tufano. 2010. What Drives Corporate Liquidity? An International Survey of Cash Holdings and Lines of Credit. Journal of Financial Economics 98: 160–76. [Google Scholar] [CrossRef]
- Liu, Hao, Xingjian Yi, and Libo Yin. 2021. The impact of operating flexibility on firms’ performance during the COVID-19 outbreak: Evidence from China. Finance Research Letters 38: 101808. [Google Scholar] [CrossRef]
- Liu, Yuru, Jingyu Zhu, Christopher Padi Tuwor, Chen Ling, Lei Yu, and Ke Yin. 2023. The impact of the COVID-19 pandemic on global trade-embodied carbon emissions. Journal of Cleaner Production 408: 137042. [Google Scholar] [CrossRef]
- Michail, Nektarios, Konstantinos D. Melas, and Dimitris Batzilis. 2021. Container Shipping Trade and Real GDP Growth: A Panel Vector Autoregressive Approach. Economics Bulletin 41: 304–15. [Google Scholar]
- Onyeaka, Helen, Christian K. Anumudu, Zainab T. Al-Sharify, Esther Egele-Godswill, and Paul Mbaegbu. 2021. COVID-19 Pandemic: A Review of the Global Lockdown and Its Far-Reaching Effects. Science Progress 104: 00368504211019854. [Google Scholar] [CrossRef] [PubMed]
- Opler, Tim C., and Sheridan Titman. 1994. Financial Distress and Corporate Performance. The Journal of Finance 49: 1015–40. [Google Scholar] [CrossRef]
- Ramelli, Stefano, and Alexander F. Wagner. 2020. Feverish Stock Price Reactions to COVID-19. Review of Corporate Finance Studies 9: 622–55. [Google Scholar] [CrossRef]
- Sharif, Arshian, Chaker Aloui, and Larisa Yarovaya. 2020. COVID-19 Pandemic, Oil Prices, Stock Market, Geopolitical Risk and Policy Uncertainty Nexus in the US Economy: Fresh Evidence from the Wavelet-Based Approach. International Review of Financial Analysis 70: 101496. [Google Scholar] [CrossRef]
- Shehzad, Khurram, Liu Xiaoxing, and Hayfa Kazouz. 2020. COVID-19’s Disasters Are Perilous than Global Financial Crisis: A Rumor or Fact? Finance Research Letters 36: 101669. [Google Scholar] [CrossRef]
- Stulz, Reném. 1990. Managerial Discretion and Optimal Financing Policies. Journal of Financial Economics 26: 3–27. [Google Scholar] [CrossRef]
- Villena, Verónica H., and Dennis A. Gioia. 2020. A more sustainable supply chain. Harvard Business Review 98: 84–93. [Google Scholar]
- Wagner, Alexander F., Richard J. Zeckhauser, and Alexandre Ziegler. 2018. Company Stock Price Reactions to the 2016 Election Shock: Trump, Taxes, and Trade. Journal of Financial Economics 130: 428–51. [Google Scholar] [CrossRef]
Figure 1.
Methodology steps flow chart.


Table 1.
Descriptive statistics.
| Descriptive Statistics | No of Obs. | Mean | Median | Std Dev | Min | Max |
|---|---|---|---|---|---|---|
| Shipments from China (TEUs) | 720 | 118.6 | 3.8 | 1345.1 | 0 | 34,400.24 |
| Shipments from China/total shipments | 720 | 0.38 | 0.324 | 0.28 | 0 | 1 |
| Debt/equity | 720 | 2.74 | 1.36 | 7.91 | 0 | 0.663 |
| Cash/assets | 720 | 0.11 | 0.08 | 0.101 | 0.001 | 0.76 |
| ROA | 720 | 0.02 | 0.04 | 0.15 | −1.58 | 0.48 |
| Log (market cap) | 720 | 21.89 | 21.86 | 1.95 | 16.33 | 27.72 |
| Market-to-book ratio | 720 | 1.49 | 2.75 | 34.41 | 0.11 | 272.16 |
Table 2.
Industry averages.
| Cum Returns | Average Monthly Shipments from China per Company in TEUs | Shipments from China/Total Shipments | ||
|---|---|---|---|---|
| Restaurant and hotel | 11 | −0.511 | 15.8053 | 0.606 |
| Printing and publication | 6 | −0.459 | 50.36 | 0.314 |
| Rubber and plastic | 2 | −0.436 | 21.71 | 0.336 |
| Entertainment | 7 | −0.435 | 28.07 | 0.33 |
| Personal service | 6 | −0.406 | 6.05 | 0.533 |
| Aircraft | 6 | −0.373 | 168.3 | 0.229 |
| Petroleum and natural gas | 16 | −0.370 | 7.88 | 0.392 |
| Recreation | 9 | −0.360 | 180.55 | 0.354 |
| Non-metallic and industrial metal mining | 5 | −0.311 | 3.00 | 0.342 |
| Building materials | 20 | −0.291 | 50.81 | 0.378 |
| Beer and liquor | 4 | −0.276 | 64.98 | 0.040 |
| Apparel | 12 | −0.276 | 65.10 | 0.301 |
| Utilities | 15 | −0.270 | 16.50 | 0.566 |
| Textile | 5 | −0.265 | 24.76 | 0.222 |
| Transportation | 26 | −0.255 | 1718.58 | 0.4287 |
| Construction | 15 | −0.228 | 50.81 | 0.378 |
| Wholesale | 35 | −0.174 | 48.96 | 0.334 |
| Retail | 58 | −0.144 | 341.01 | 0.472 |
| Tobacco products | 2 | −0.157 | 10.21 | 0.045 |
| Computers | 23 | −0.132 | 35.38 | 0.413 |
| Consumer goods | 30 | −0.161 | 58.07 | 0.321 |
| Machinery | 56 | −0.114 | 33.02 | 0.3143 |
| Automobiles and trucks | 25 | −0.097 | 90.82 | 0.306 |
| Steelworks | 14 | −0.096 | 23.06 | 0.227 |
| Business service | 59 | −0.088 | 6.71 | 0.571 |
| Healthcare | 10 | −0.0358 | 10.11 | 0.6127 |
| Business supplies | 7 | −0.037 | 55.278 | 0.264 |
| Shipping containers | 4 | −0.038 | 14.567 | 0.179 |
| Chemicals | 29 | −0.0367 | 17.189 | 0.1849 |
| Shipbuilding, railroad equipment | 5 | −0.0187 | 10.137 | 0.334 |
| Communication | 10 | −0.009 | 5.052 | 0.473 |
| Electrical equipment | 15 | 0.003 | 142.04 | 0.479 |
| Pharmaceutical | 18 | 0.008 | 6.691 | 0.255 |
| Measuring and control | 19 | 0.021 | 8.145 | 0.528 |
| Electronic equipment | 53 | 0.064 | 25.36 | 0.4304 |
| Agriculture | 2 | 0.083 | 0.142 | 0.116 |
| Medical equipment | 29 | 0.144 | 13.94 | 0.3155 |
| Other | 52 | −0.056 | 17.18 | 0.185 |
Table 3.
Chinese import regressions.
| Variables | Incubation | Outbreak | Fever |
|---|---|---|---|
| 2 January–17 January | 20 January–21 February | 24 February–20 March | |
| Dependent variable: CAPM-adjusted cumulative returns | |||
| Shipments from China (in 1000 TEUs) | 0.0021 | 0.0288 *** | 0.1049 ** |
| (0.63) | (2.51) | (2.43) | |
| China’s share in total shipments | 0.0154 | 0.0286 | 0.0966 * |
| (0.98) | (1.49) | 1.90 | |
| Log (market cap) | 0.15 ** | 0.122 *** | 0.284 *** |
| (0.88) | (4.09) | (3.73) | |
| Book-to-market | 0.002 | 0.002 | −0.001 |
| (0.148) | (0.16) | (−0.06) | |
| ROA | 0.118 ** | 0.2117 *** | −0.0914 |
| (1.96) | (2.62) | (−0.48) | |
| Firm controls | Yes | Yes | Yes |
| Industry fixed effects | Yes | Yes | Yes |
| Observations | 718 | 718 | 718 |
| R-squared | 0.143 | 0.167 | 0.216 |
Note: Values in parentheses indicate the t-statistics; *** p < 0.01; ** p < 0.05; and * p < 0.1.
Table 4.
Financial flexibility regressions.
| Variables | Incubation | Outbreak | Fever |
|---|---|---|---|
| 2 January–17 January | 20 January–21 February | 24 February–20 March | |
| Dependent variable: CAPM-adjusted cumulative returns | |||
| Debt/equity | 0.0019 | −0.1098 * | −0.4745 ** |
| (0.81) | (−1.61) | (−2.51) | |
| Cash/assets | 0.056 * | 0.1373 ** | 0.4719 *** |
| (1.96) | (2.18) | (3.03) | |
| Shipments from China (in 1000 TEUs) | 0.0098 | 0.0407 * | 0.0652 * |
| (0.45) | (1.55) | (1.42) | |
| China’s share in total shipments | 0.0018 | 0.0236 | 0.0777 * |
| (0.22) | (1.28) | (1.51) | |
| Firm controls | Yes | Yes | Yes |
| Industry fixed effects | Yes | Yes | Yes |
| Observations | 718 | 718 | 718 |
| R-squared | 0.12 | 0.15 | 0.19 |
Note: Values in parentheses indicate the t-statistics; *** p < 0.01; ** p < 0.05; and * p < 0.1.
Disclaimer/Publisher’s Note: The statements, opinions and data contained in all publications are solely those of the individual author(s) and contributor(s) and not of MDPI and/or the editor(s). MDPI and/or the editor(s) disclaim responsibility for any injury to people or property resulting from any ideas, methods, instructions or products referred to in the content. |
© 2024 by the authors. Licensee MDPI, Basel, Switzerland. This article is an open access article distributed under the terms and conditions of the Creative Commons Attribution (CC BY) license (https://creativecommons.org/licenses/by/4.0/).
Share and Cite
MDPI and ACS Style
Kochan, M.; Gonul Kochan, C. Impact of US Trade with China on Shareholders’ Wealth: Insights from Shipment Data in the COVID-19 Era. Economies 2024, 12, 67. https://0-doi-org.brum.beds.ac.uk/10.3390/economies12030067
AMA Style
Kochan M, Gonul Kochan C. Impact of US Trade with China on Shareholders’ Wealth: Insights from Shipment Data in the COVID-19 Era. Economies. 2024; 12(3):67. https://0-doi-org.brum.beds.ac.uk/10.3390/economies12030067
Chicago/Turabian StyleKochan, Mucahit, and Cigdem Gonul Kochan. 2024. "Impact of US Trade with China on Shareholders’ Wealth: Insights from Shipment Data in the COVID-19 Era" Economies 12, no. 3: 67. https://0-doi-org.brum.beds.ac.uk/10.3390/economies12030067
Note that from the first issue of 2016, this journal uses article numbers instead of page numbers. See further details here.