Participating to Compete: Do Small Firms in Developing Countries Benefit from Global Value Chains?

1
Executive Office, Research & Strategy Programme, International Bureau, Universal Postal Union, Weltpoststrasse 4, 3000 Berne 15, Switzerland
2
Department of Market Development, International Trade Centre, Palais des Nations, 1211 Geneva 10, Switzerland
*
Author to whom correspondence should be addressed.
Economies 2021, 9(1), 12; https://0-doi-org.brum.beds.ac.uk/10.3390/economies9010012
Submission received: 30 June 2020
/
Revised: 29 December 2020
/
Accepted: 22 January 2021
/
Published: 2 February 2021
(This article belongs to the Special Issue Trade and Investment Policy and Global Value Chains)
Abstract
:Standard trade theory suggests that the profile of exporting firms is characterized by large firms which dominate domestic productivity distribution. Large manufacturing multinationals have increased their productivity by participating, creating and shaping global production networks. In recent decades, trade flows have become increasingly dominated by trade-in-tasks within global production networks. Given the importance of pro-competitive effects in establishing the gains from trade following trade liberalizations, it is important to look at the link between participation in global value chains and a firm’s competitiveness. The paper does so by using the International Trade Centre’s competitiveness index, for small, medium-sized and large firms, coupled with global value chain participation measures extracted from multi-regional input-output tables, and together forming a panel dataset at country and firm category level. The main finding establishes that the gains from integration into value chains are greater for small firms than for large firms. In particular, at the sample median, an increase of participation by 2.5% reduces the competitiveness gap between small and large firms by 1.25%. In addition, the analysis suggests that it is the use of foreign inputs that drives the result. In contrast, the domestic value in intermediate goods matters only in cases where value chains respond to domestic demand needs. The identification strategy relies on a fractional probit model allowing for unobserved effects, and a causal framework using the depth of trade agreements as instrument, in order to mitigate potential reverse causality.
Keywords:
heterogeneous firms; small firms; competitiveness; global value chains; economic integration; trade agreementsJEL Classification:
F14; L251. Introduction
Trade theory is explicit on the anatomy of exporting firms. The typical exporter is large and dominates the productivity distribution of domestic firms (Eaton et al. 2011). Opening up to trade entails a reorganization of domestic firms, where the most productive ones expand and less productive ones recess (Melitz 2003). Thus, the impact of trade liberalization on firms is heterogeneous and part of the gains from trade revolve around pro-competitive effects. The result is the paradigm behind the contemporary theory of trade in goods.
In recent years, economic integration has been less about tariff cuts and more about facilitating international shared production. The split of production across borders allows firms to leverage their comparative advantage in a specific task. Instead of building final goods from scratch, they integrate into one stage of the production process. The benefits from specialization are clear-cut—the production capabilities of factories are not confined to one geographical location and can “unbundle”. Therefore, trade flows are less and less about final goods and more about trade-in-tasks (Baldwin and Lopez-Gonzalez 2015).
Exporting firms engaging in trade-in-tasks are commonly viewed to be part of global value chains (GVCs). The benefits for these firms are not as clear-cut as the ones from trade-in-goods, although they both revolve around productivity gains. GVCs offer the possibility to share production processes with global lead firms, which in turn share knowledge, capital, managerial practices and technical assistance with local firms. However, the discussion on the challenges and benefits of participating in GVCs for small and medium-sized enterprises (SMEs) lacks empirical support that goes beyond case studies and anecdotal evidence.
The goal of this paper is to test the impact of GVC participation on the competitiveness of firms. The analysis distinguishes the impact according to firm size classes in a panel of developing countries. We use the competitiveness score capturing firm-level capabilities, as in Falciola et al. (2020). We measure two types of value chain integration. First, we analyze backward linkages, which are related to the foreign content of exports. Second, we focus on forward linkages, which are measured through the domestic value added in intermediate goods. Based on the literature summarized below we expect a positive impact of GVC integration on competitiveness.
Hypothetically, integrating into value chains may help domestic firms to become more competitive in a dual fashion. On the one hand, backward linkages allow firms to access intermediate inputs that may be unavailable in their domestic markets or that were too costly to produce in-house. Firm-level evidence demonstrates a significant positive impact of import of intermediate inputs and capital goods on firm total factor productivity and innovation, with a 1% increase in the share of imported intermediate inputs raising a firm’s productivity by 0.3%, and a 1% increase in capital goods imports increasing it by 0.2% (Stone and Shepherd 2011). Moreover, Bas and Strauss-Kahn (2014) use French firm-level import data to show that an increase in imported inputs also results in an increase of export scope that can be attributed to enhanced productivity (indirect productivity channel) and low prices of inputs that boost export revenue (direct cost channel).
On the other hand, forward linkages characterize firms that integrate into international production networks as providers of highly specialized intermediate goods used by firms abroad. For example, Amendolagine et al. (2019) find that more GVC participation is associated with a higher share of inputs sourced locally by foreign investors. The results are based on country-sector level measures of GVC involvement matched with firm-level information from 19 Sub-Saharan African countries and Vietnam. Similarly, Gereffi et al. (2019) observe that GVC participation drove market diversification for medical service sector firms in Costa Rica.
In addition to easier access to inputs, know-how, capital and technology, smaller firms can benefit from reduced costs of entry and economies of scale offered by value chains, as shown by Giovannetti et al. (2015) for a sample of Italian firms. Thus, owing to lower entry costs, the most frequent type of SME internationalization is supplying to GVCs rather than exporting directly (Cusolito et al. 2016; World Trade Organization 2016).
Whether GVCs stimulate upgrading and innovation depends on the characteristics of suppliers—including technological capabilities, especially in the case of least developed countries, as shown in Morrison et al. (2008), the governance of value chains (Gibbon et al. 2008; Ponte and Sturgeon 2014), and ownership characteristics (Morris and Staritz 2014). More specifically, in quasi-hierarchical value chains, lead firms impose standards that enhance product and process upgrading but not functional upgrading (Giuliani et al. 2005; Ponte and Ewert 2009). Ponte (2009) also shows that lead firms drive value chains where industrial and market conventions are dominant. More intense buyer involvement with local suppliers is associated with higher supplier productivity, as shown by Pietrobelli and Saliola (2008) for firms in Thailand, and by Wynarczyk and Watson (2005) for SMEs in the United Kingdom. Javorcik and Spatareanu (2009) find evidence that suppliers learn from their relationship with lead firms, controlling for the selection of high productivity firms to supply to multinationals.
The closest contribution to our research is Montalbano et al. (2018) who, using a dataset of firms located in Latin American and the Caribbean countries, established that firms characterized by international linkages are more productive than those that are not, and that the firms that internationalize through GVC integration are even more productive than those exporting outside value chains. While Montalbano et al. (2018) primarily focus on the heterogeneity among firms by country and industry, and the impact of both participation in GVCs and position within GVCs, our paper is specifically dedicated to SMEs, i.e., the paper explores heterogeneity by firm size. Furthermore, we cover a broader range of countries, including developing countries in all geographic regions. The paucity of industry level data has limited us to country-level analyses, although differences across industries are expected.
The results are corroborated by a number of single country studies. For example, in the case of Estonia, Banh et al. (2020) find that GVCs contribute to increased productivity and long-term growth. Like our paper, they analyze separately backward and forward linkages and find that small firms benefit more from backward linkages. In the case of Thailand, Korwatanasakul and Paweenawat (2020) find that both backward and forward participation is positively associated with firms’ performance, and that being an SME is associated with a lower degree of GVC participation, that nonetheless leads to increased revenues. Our paper has wider geographic scope as its results extend to a wide range of developing countries.
The empirical analysis of this paper finds that the overall measure of GVC integration is positively correlated with SME competitiveness, but the results are more nuanced when backward and forward linkages are analyzed separately and in detail. To calculate the overall effect of GVC integration, we combine backward and forward linkages as in Taglioni and Winkler (2016) and evaluate the median impact on the competitiveness gap. (The competitiveness gap is the difference between the average competitiveness score of large firms and the average competitiveness score of small firms in a given country and year.) We find that increasing GVC participation, at the median, by 2.5% reduces the competitiveness gap, at the median, by 1.25%. The main channel is backward integration. Backward linkages (measured by foreign content of exports) help small firms become more productive and reduce the gap with the productivity level of larger firms. According to our analysis, increasing the foreign content of exports by 10 basis points leads to a reduction of the gap by 2 basis points. In contrast, forward GVC integration, measured as intermediates re-exported, is not correlated with a reduction of the competitiveness gap. Forward GVC integration appears to be relevant only when the value chain responds to the demand in the home country. This is the case captured by the variable “Domestic value added that returns home”, measuring exports that are sent abroad for processing and returned to the domestic market for final consumption. This finding is corroborated by Lopez Gonzalez (2017) who show that SMEs in ASEAN economies have a lower share of foreign value added in their exports than larger companies. Similarly, Banh et al. (2020) finds that, in the case of Estonia, large firm benefit more from forward integration into GVCs.
The analysis is important for at least four reasons. First, GVCs are playing a decisive role in SMEs’ internationalization intentions. As shown in a study of Asian SMEs (Asian Development Bank Institute and Asian Development Bank 2015), 50% of the surveyed SMEs that are already engaged in GVCs consider scaling up their operation through more GVC integration, while 42% of the SMEs that do not participate in GVCs intent to participate in the future.
Second, since the early days in GVC research, there has been a debate between the labor market outcomes of participating in GVCs, offshoring and outsourcing activities. On a theoretical basis (Grossman and Rossi-Hansberg 2008), the effects on employment will be positive as long as there are substantial productivity gains. As SMEs account for the lion’s share of the world’s labor force, this paper makes a valuable contribution by looking at the gains of GVC participation in terms of firm performance.
Third, as trade flows are reshaped into more and more parts and components, we can expect its impact to be disruptive. In the context of inclusive growth, SMEs play the lead role. Therefore, it is essential to understand the gains for SMEs in areas other than simple productivity. To that effect, we focus on a measure of competitiveness which goes beyond productivity by looking at firm performance in relation to the global environment. This approach is similar to Brancati et al. (2018) who studied firm-level drivers of competitiveness in a single country (Italy) but with an advantage of having firm-level measures of GVC integration at their disposal.
Finally, the paper indirectly contributes to the debate on the resilience of GVCs to external shocks and subsequently the desirability of the fragmentation of production, or, in other words, the costs and benefits of nearshoring and onshoring. This debate is not new but has risen in importance as a result of the COVID-19 pandemic. On the one hand, the proponents of nearshoring can cite a number of studies showing that GVCs transmit the negative effects of shocks. For example, according to Ramelli and Wagner (2020), international firms, especially those with strong production links to Chinese firms, saw their stock prices decrease relative to less exposed firms, when lockdowns started in China. Baldwin and Freeman (2020) show how COVID-19 led to economic contagion, i.e., at the onset of the pandemic firms in Germany suffered from a supply shock when factories in China were in shutdown, but several months later re-opened Chinese factories experienced a demand shock because this coincided with the lockdown in Germany.
On the other hand, a rapidly growing stream of literature points to the benefits of GVCs during the 2020 pandemic and suggests that the current organization of production is economically optimal (Baldwin and Tomiura 2020). One argument for GVCs is the diversification of risks as shocks can more easily propagate through production networks where many firms rely on a small, common set of suppliers (Acemoglu et al. 2012), or where production is concentrated in a single country thus increasing the risks of environmental shock (Stellinger et al. 2020). Bonadio et al. (2020) calibrate a model with global consumption and production linkages and show that the largest economic shock during the COVID-19 crisis was caused by domestic lockdowns rather than foreign containment measures, suggesting that hedging risks requires a globally diversified production. Our paper is based on the period prior to the pandemic and does not test directly any hypothesis on the impact of COVID-19. Yet, indirectly, it supports the pro-GVC conclusions by identifying a spill-over effect of GVC participation on competitiveness.
We use two databases for the analysis. First is the World Bank Enterprise Survey (WBES) to separate firms into three categories (also referred to as firm size classes), namely small firms (5 to 19 employees), medium-sized firms (20 to 99 employees) and large firms (100 or more employees). For each of the three firm categories we compute their competitiveness score over two survey rounds. (Enterprise Surveys, The World Bank, the fourth and the fifth rounds; the data is freely available at http://www.enterprisesurveys.org.) We extract the GVC participation variables from the Eora Multi-Regional Input-Output tables (Lenzen et al. 2013) (the Eora Multi-Region Input-Output tables are available at http://worldmrio.com), using the Quast and Kummritz (2015) adaptation of GVC indicators originally developed in Wang et al. (2013) and Koopman et al. (2014). The two resulting datasets are matched at country, firm size class and time period level.
We faced some important challenges in estimating the effect of GVCs on firm competitiveness. First, we needed to gather time variation for firm-level indicators in order to control for unobserved effects. Second, we needed to control for reverse causality as it is likely that lead firms decide to establish supply chain linkages with firms that are already competitive. For example, Mendoza (2020) find that, in the case of Philippines, age and total factor productivity driving the GVC participation of SMEs, while foreign ownership, past importing activities, and proximity to economic zones being factors important to firms of all sizes. Reddy and Sasidharan (2020) show the role of financial constraints in shaping the participation of Indian manufacturing SMEs in GVCs. Hence it is possible that it is not only more GVCs that improve competitiveness, but that competitiveness attracts GVCs. Third, as firm competitiveness is an index, we need an estimation technique that takes this fact into account.
We solved the first challenge by using several rounds of the WBES. This way, we generated country-specific time variation that allows control for country-specific effects. For the second challenge, we used an instrumental variables setting. The instrument that we propose is the depth of regional trade agreements. The argument for the choice of the instrument is that deep trade agreements help countries integrate in GVCs, but trade agreements alone do not have a causal link with SME competitiveness. We build on Papke and Wooldridge (2008) to estimate an unobserved effects model that matches our data in an optimal way.
2. Data Description
This section describes the measurement of firm competitiveness and value chain indicators alongside the underlying data and figures that plot relations motivating our research. The main goal of this paper is to gather evidence on the link between firm competitiveness and GVCs for developing countries. The task bears a considerable challenge since accurate firm-level databases with information on productivity exist only for a handful of countries. Thus, instead of productivity, we embrace the concept of competitiveness, and in particular the competitiveness score developed by the International Trade Centre (ITC) (Falciola et al. 2020). In this paper we focus on firm-specific characteristics of competitiveness, including both its static and dynamic dimensions. Falciola et al. (2020) conceptualize these dimensions of firm competitiveness under three pillars—compete, connect and change. The “compete” pillar centers on existing operations that allow firms to be competitive in a static sense. The “connect” pillar focuses on the importance of connectivity to information channels to navigate a competitive environment. Lastly, the “change” pillar refers to the capacity to adapt and embrace change—essential to ensuring adequate and sustainable returns.
The ITC competitiveness score has been constructed to capture the components under these pillars that drive firm competitiveness. Falciola et al. (2020) provide a detailed instruction and explanation of the steps taken for constructing the index. The firm-level dimension of the index is constructed using the publicly available data from the World Bank Enterprise Surveys (WBES), focusing on ten questions on firm capabilities. The 10 questions extracted from the World Bank Enterprise Surveys at the firm level are grouped along the three dimensions: compete, connect and change. Regarding compete, the questions concern the availability of a quality certification for the firm, the existence of a firm’s bank account and the years of experience of the firm’s manager. For connect, the index looks at the usage of an email address and the presence of a website. When it comes to change, the questions pertain to the availability of training for staff, the presence of regular financial audits, the availability of bank financing and the use of foreign licences. The World Bank Enterprise Survey data is freely available at http://www.enterprisesurveys.org. The index is a weighted aggregation of the indicators under the three pillars. The weights for aggregating the indicators are estimated by employing confirmatory factor analysis (CFA). The CFA model is based on a pre-specified theoretical model that posits the hypothesized causal relationship of the latent factors and their observed indicator variables (Mueller and Hancock 2001). Under this approach, we observe that the questions (from WBES) correlate well to standard productivity and firm-level performance variables such as sales and output per worker. This score has the advantage of being both computationally simple and easy to adapt from standard questions in firm-level surveys. Sub-indices for each pillar are computed as:
The formula for computing the final index is:
where is the weight estimated using confirmatory factor analysis for indicator in pillar .
We apply this competitiveness score methodology to the WBES data. To obtain a panel dataset we focus on countries where at least two waves of the WBES have been performed between 2006 and 2013. The time span is determined by both the availability of WBES data and the Eora MRIO. Since the WBES are performed at irregular time intervals, the available years differ between cross sections. The average time gap within a cross-sectional unit is 4.6 years. This exercise, nevertheless, comes at a cost in terms of representativeness of the countries involved in the analysis, which, following the pattern of the WBES, are mostly developing. The resulting unbalanced panel is subsequently merged, by country and year, to several GVC participation variables computed from the Eora input-output tables. The final sample covers 64 countries over two time periods (countries and years are listed in Table A1). The competitiveness score is computed for three size classes of firms. The definition of the size of a firm is based on the number of full-time employees: small firms have 5 to 19 employees, medium-sized firms 20 to 99 employees, and large firms 100 or more employees (as in Mazzarol and Reboud 2020). Thus, our data is at country-year-firm size class level. The GVC variable derived from the Eora table is constant across firm size classes. Econometrically we control for this by estimating robust standard errors.
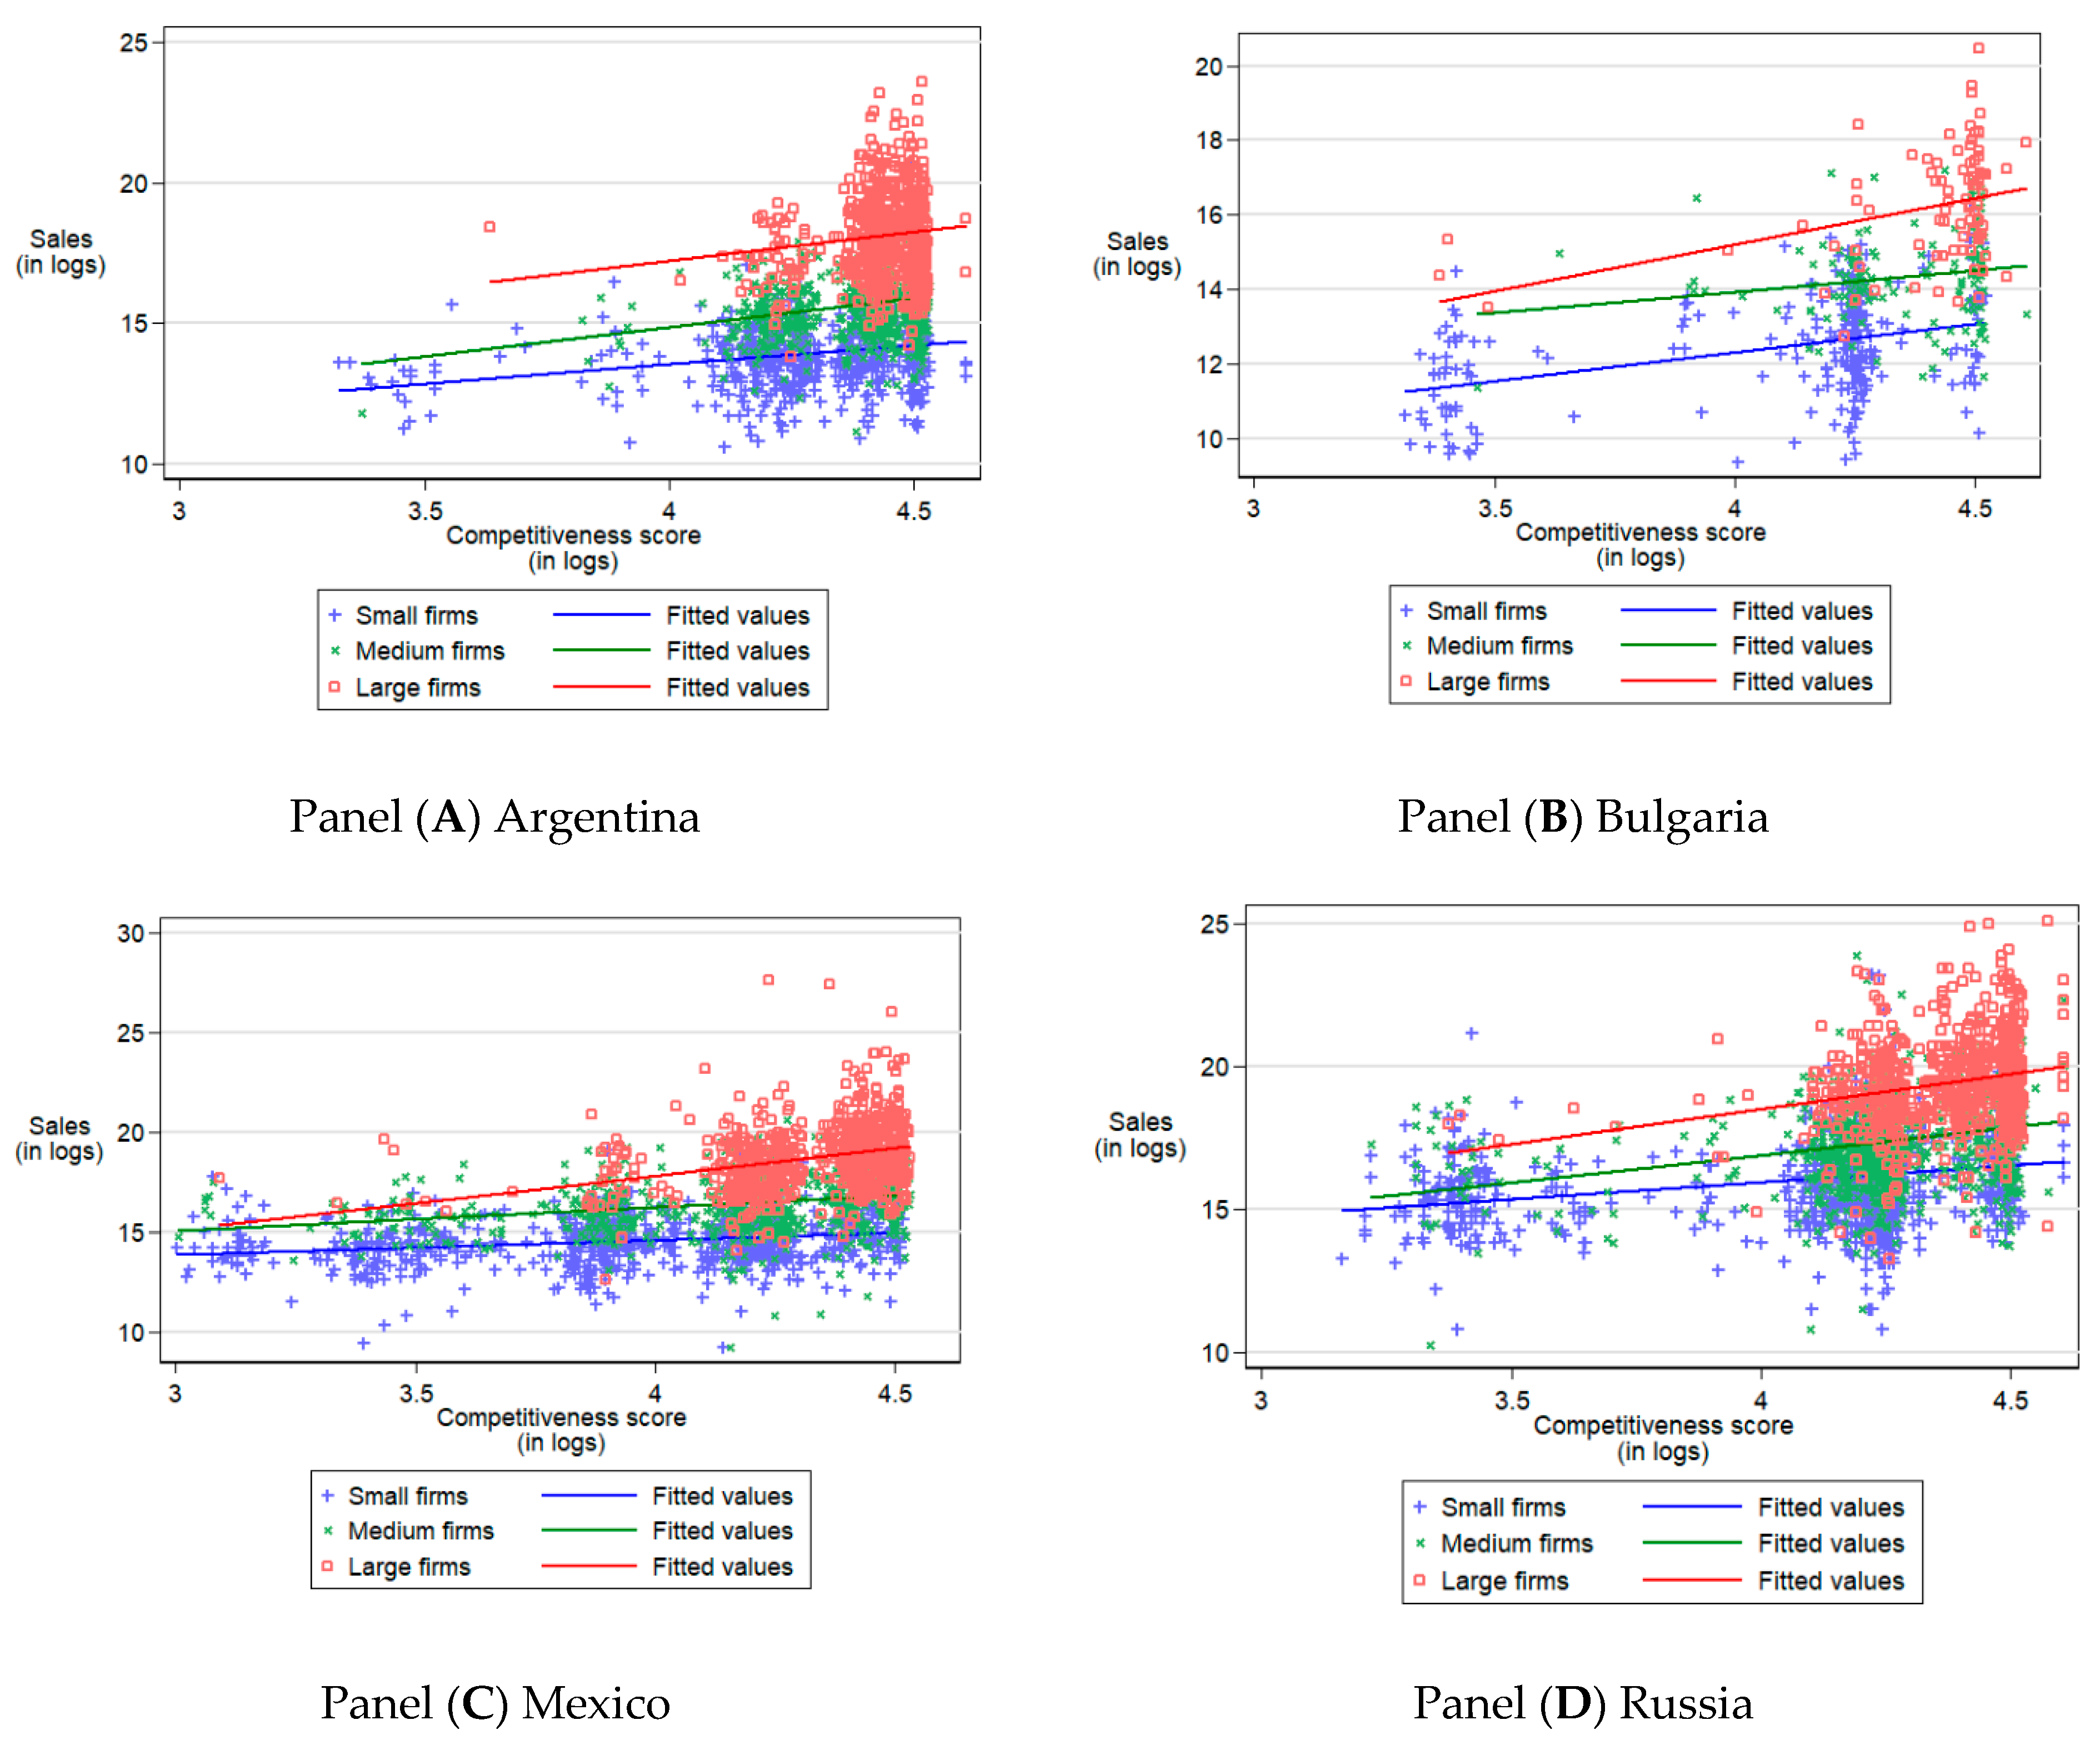
As an example, Figure 1 plots sales for three categories of firms in Argentina, Bulgaria, Mexico and Russia against the ITC competitiveness score. As we consistently observe, small firms score below medium-sized and large firms, on average, and have lower sales. The correlation is high and significant for the three firm size classes. The correlation shows that the ITC competitiveness score behaves according to our prior expectations, as in the graph it has the expected sign and slope.
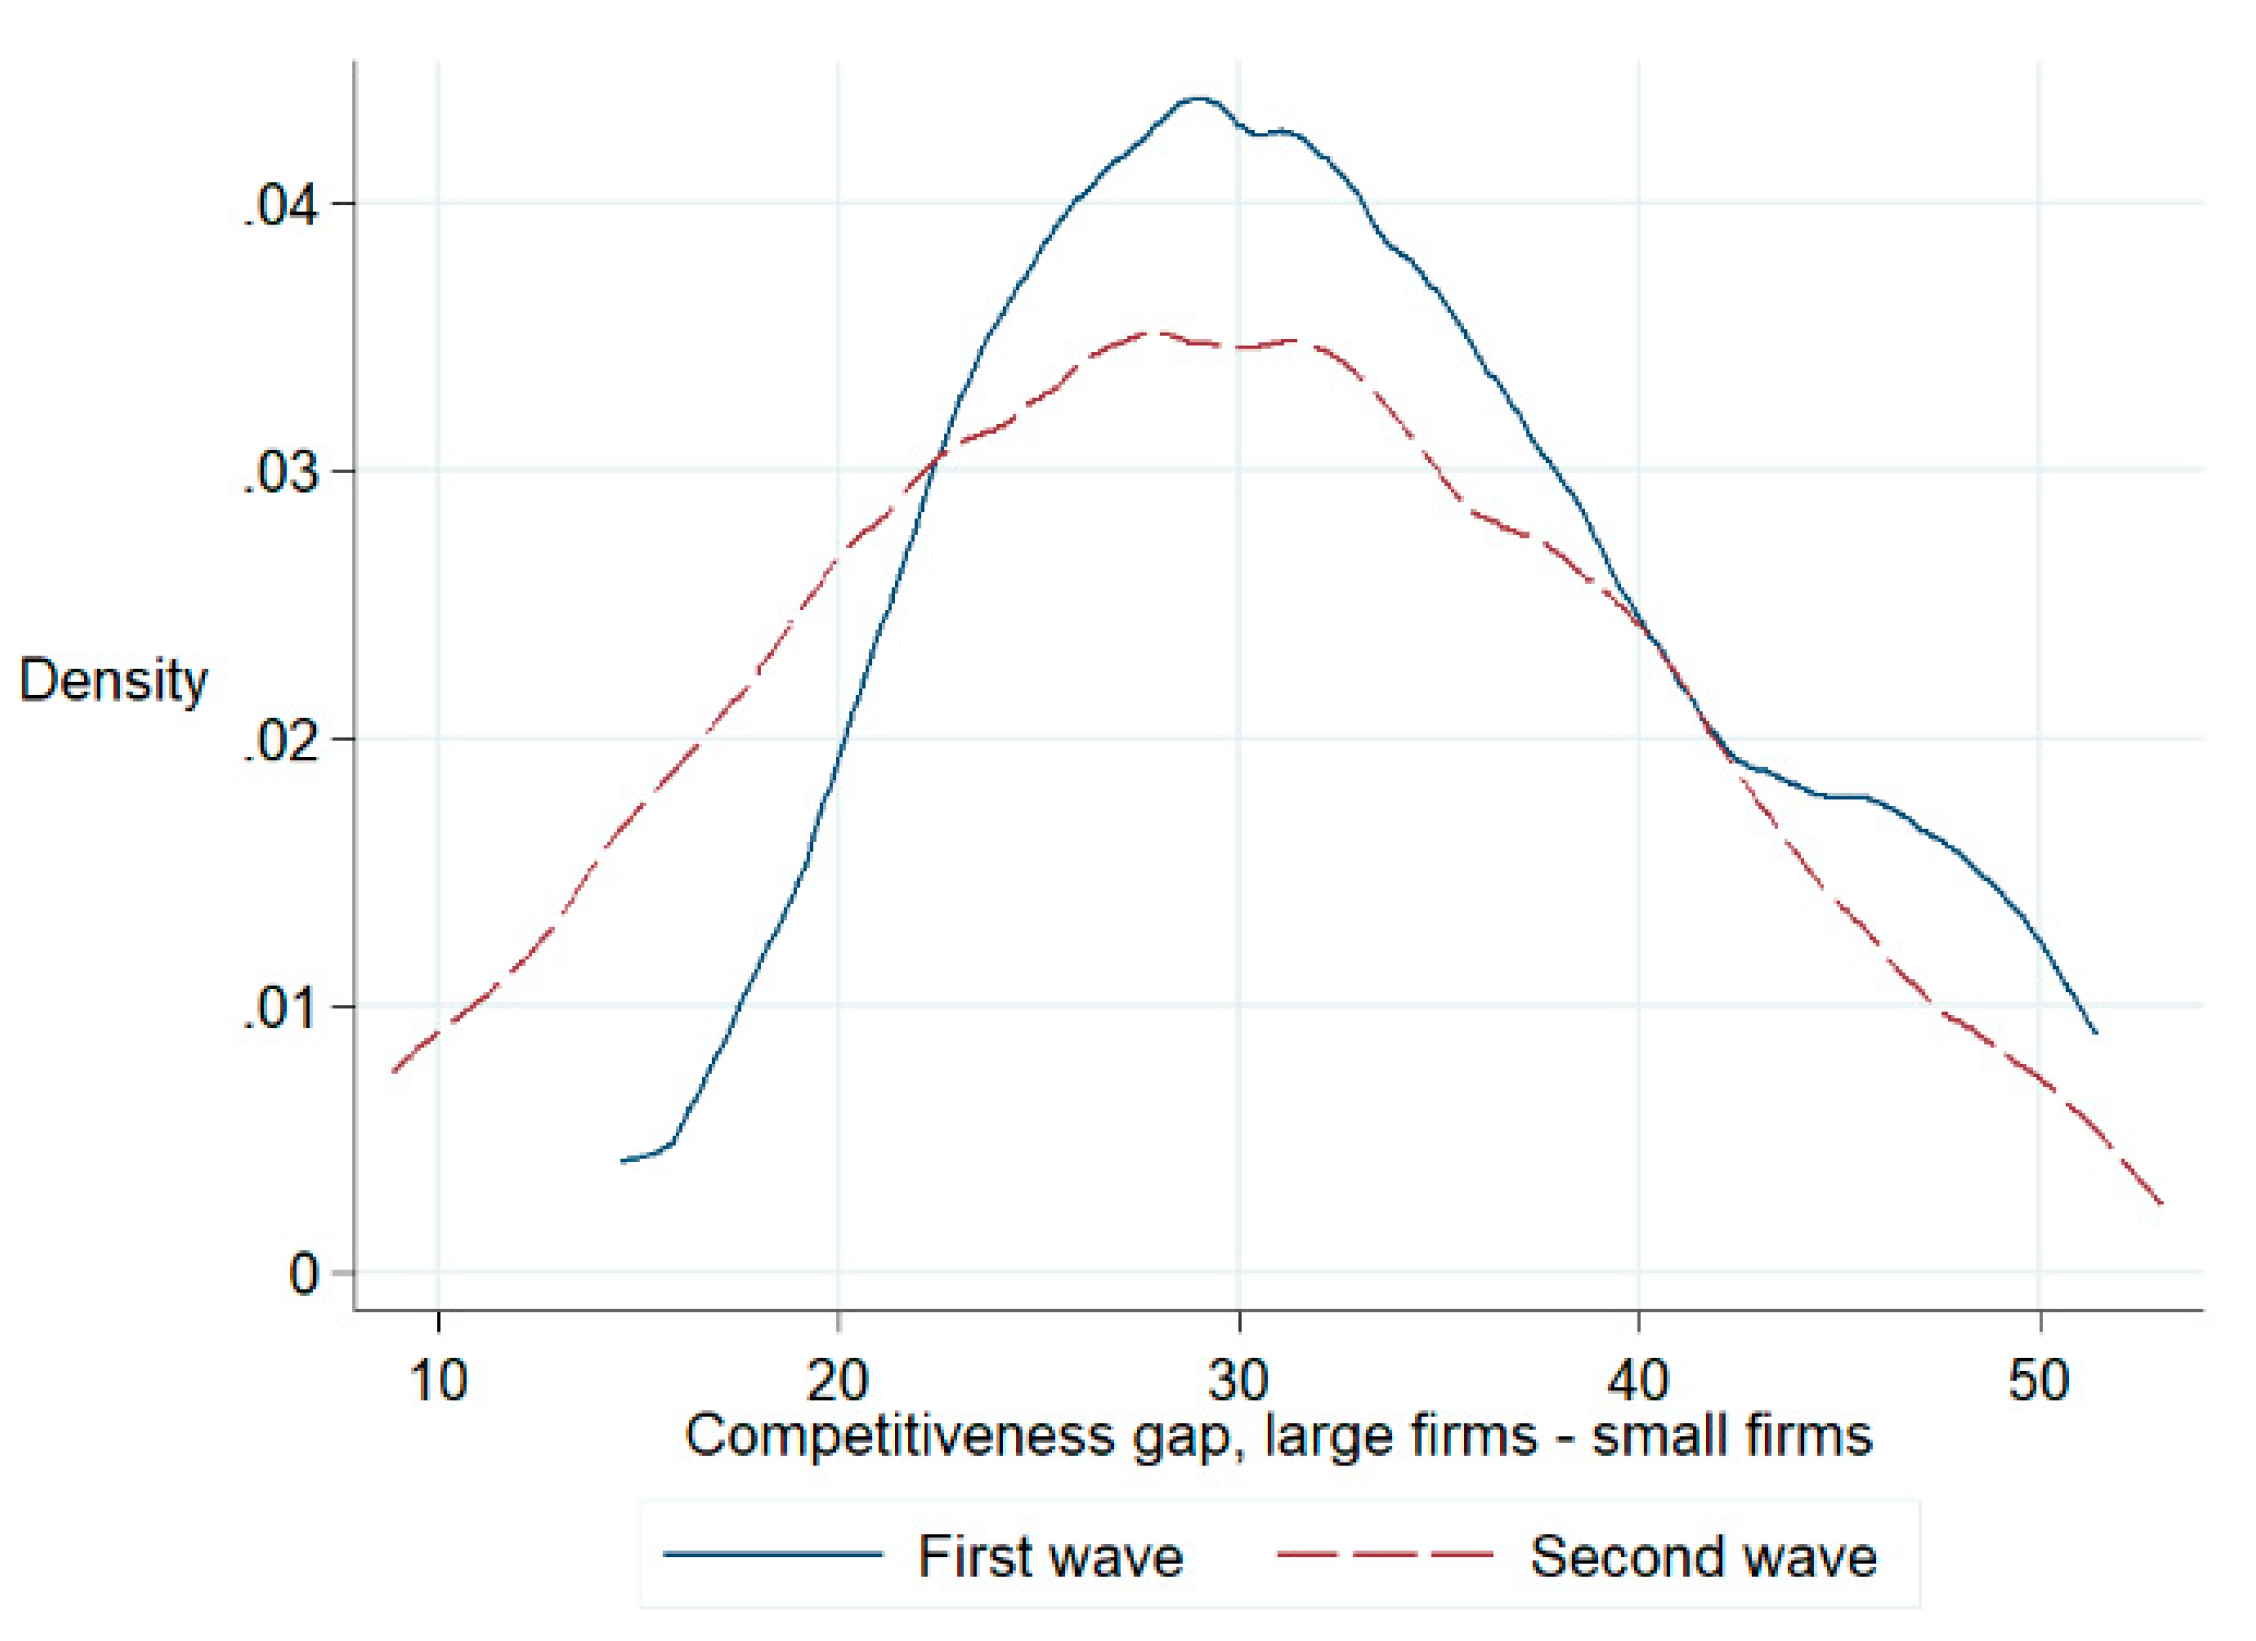
The competitiveness scores across all countries suggest that small firms are catching up with their larger counterparts. Figure 2 plots the kernel density of the competitiveness gap (the difference between the score of large firms and small firms), showing that the difference shrunk during the second wave of surveys and that the increase in the competitiveness of small firms is larger than the increase in the competitiveness of large firms. This suggests that the bottom scorers’ growth is higher, indicating convergence in the long run. This paper sets out to identify whether value chain participation contributed to this convergence.
With regard to countries’ participation in value chains, the research questions require an overall measure of GVC integration, as well as specific measures of backward linkages and forward linkages. Our database of choice is the Eora Multi-Regional Input-Output tables (Lenzen et al. 2013), because it covers the largest number of countries, including developing economies. We measure GVC integration at the country level for the years in which the WBES are available, so that our GVC measures can be matched to the competitiveness score described above. We decompose Eora using the algorithm developed by Quast and Kummritz (2015). The algorithm separates gross exports in value added components at the sector and country-pair level. The components are then aggregated at the country level to retrieve the indicators of vertical specialization proposed by Koopman et al. (2014).
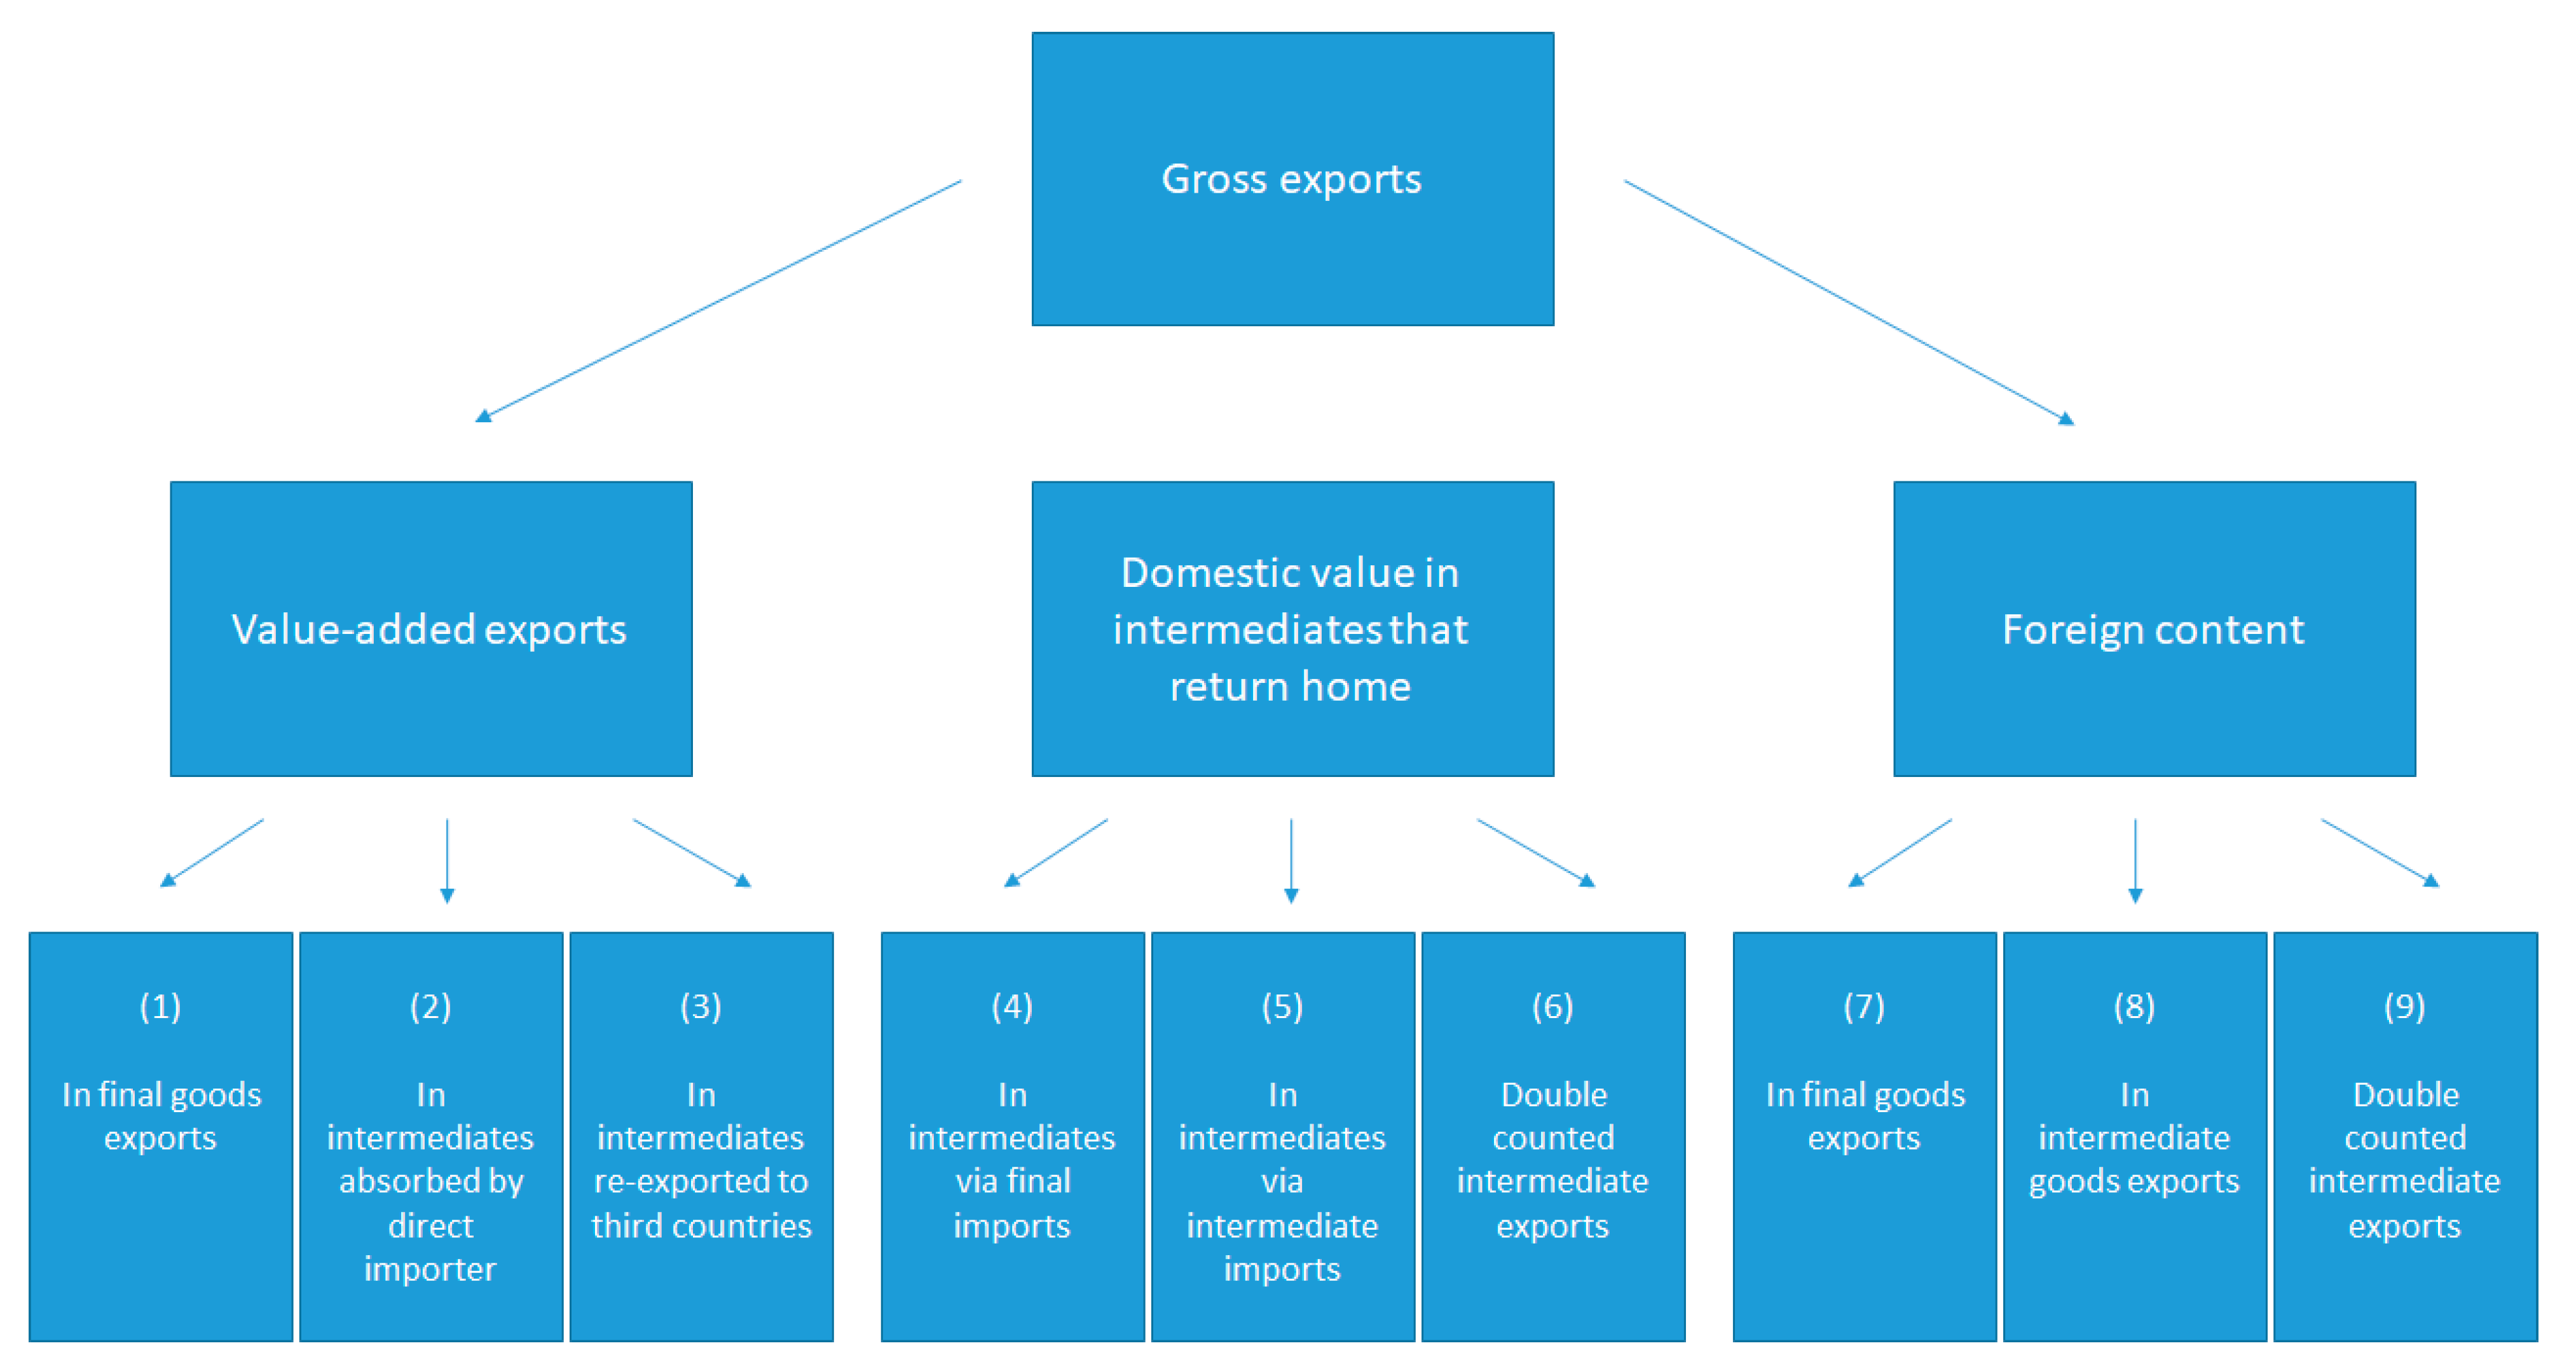
We employ selected indicators proposed by Koopman et al. (2014). The framework separates gross exports at the country level into three variables (Figure 3), namely value added exports, domestic value added in intermediate goods that return home, and foreign content of exports. Furthermore, each of these elements can be decomposed into three sub-categories, resulting in nine separate elements.
From the nine components in Figure 3, we extract indicators of vertical specialization, including the overall GVC participation, backward integration and forward integration. Backward integration refers to the contribution from foreign inputs to the production of domestic exports. For example, a cell phone assembled in the domestic market may contain R&D produced elsewhere. Forward integration is the other side of the coin. It represents the domestic content of exports, i.e., the contribution made through a country’s exports to the production of exports to third countries.
Quantitatively, we measure the overall GVC participation by the value of vertical trade as a share of gross exports. It is represented by the sum of elements (3) to (9) in Figure 3, divided by gross exports. We use foreign content of exports as a measure of backward linkages in value chains, represented by the sum of boxes (7) to (9) in Figure 3, as a share of gross exports. In addition, we analyze separately double counted intermediate exports, represented by box (9). Finally, domestic value added, re-exported to third countries, is a measure of forward linkages. It is calculated by the sum of elements (4) to (6) in Figure 3, divided by gross exports. Furthermore, in exploratory analysis preceding econometric modelling, we separate the intermediate goods shipped back to the domestic economy from intermediate goods that are re-exported to all other countries.
We start empirical analysis by plotting correlations between the vertical trade variables and the ITC competitiveness score. Each figure contains two panels, with the top panel plotting competitiveness scores (SC) by firm size class, and the bottom panel focusing on the competitiveness score gap.
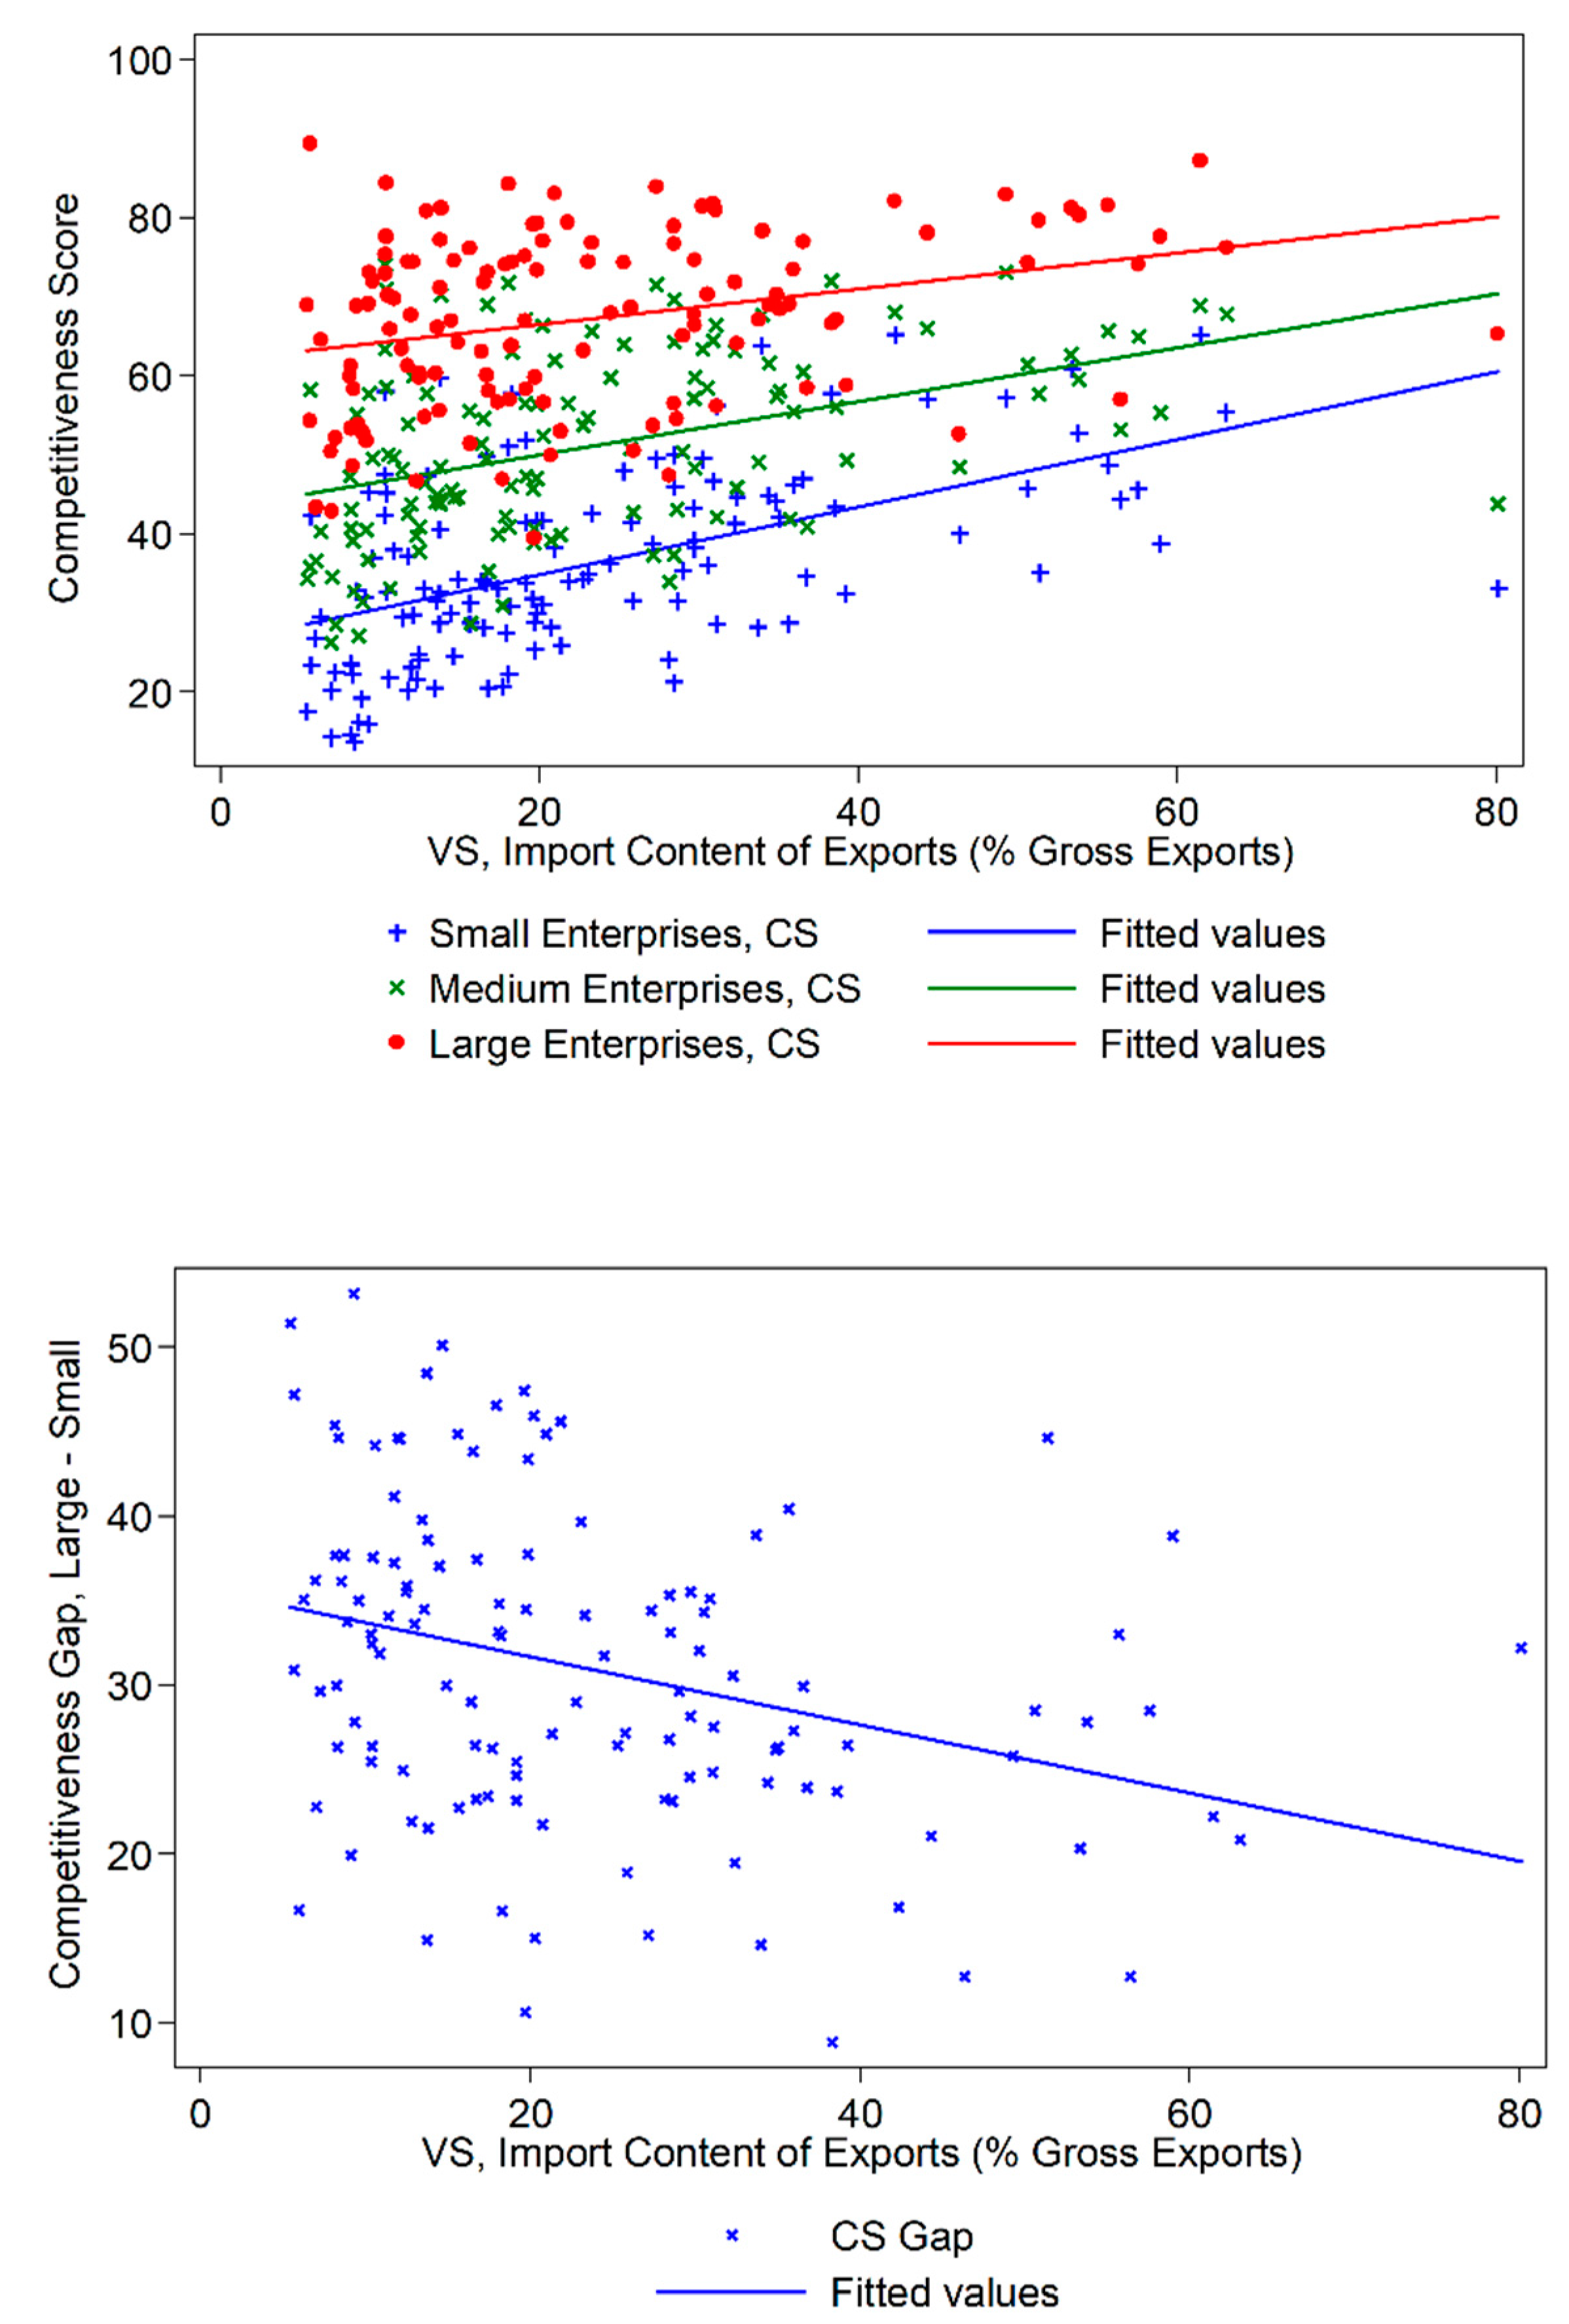
Figure 4 and Figure 5 focus on backward linkages. The top panel of Figure 4 plots the competitiveness score for small, medium-sized and large enterprises against the foreign content of exports (VS). The bottom panel puts the competitiveness gap in focus, and shows that the difference between the competitiveness score of large firms and small firms is negatively correlated with the foreign content of exports.
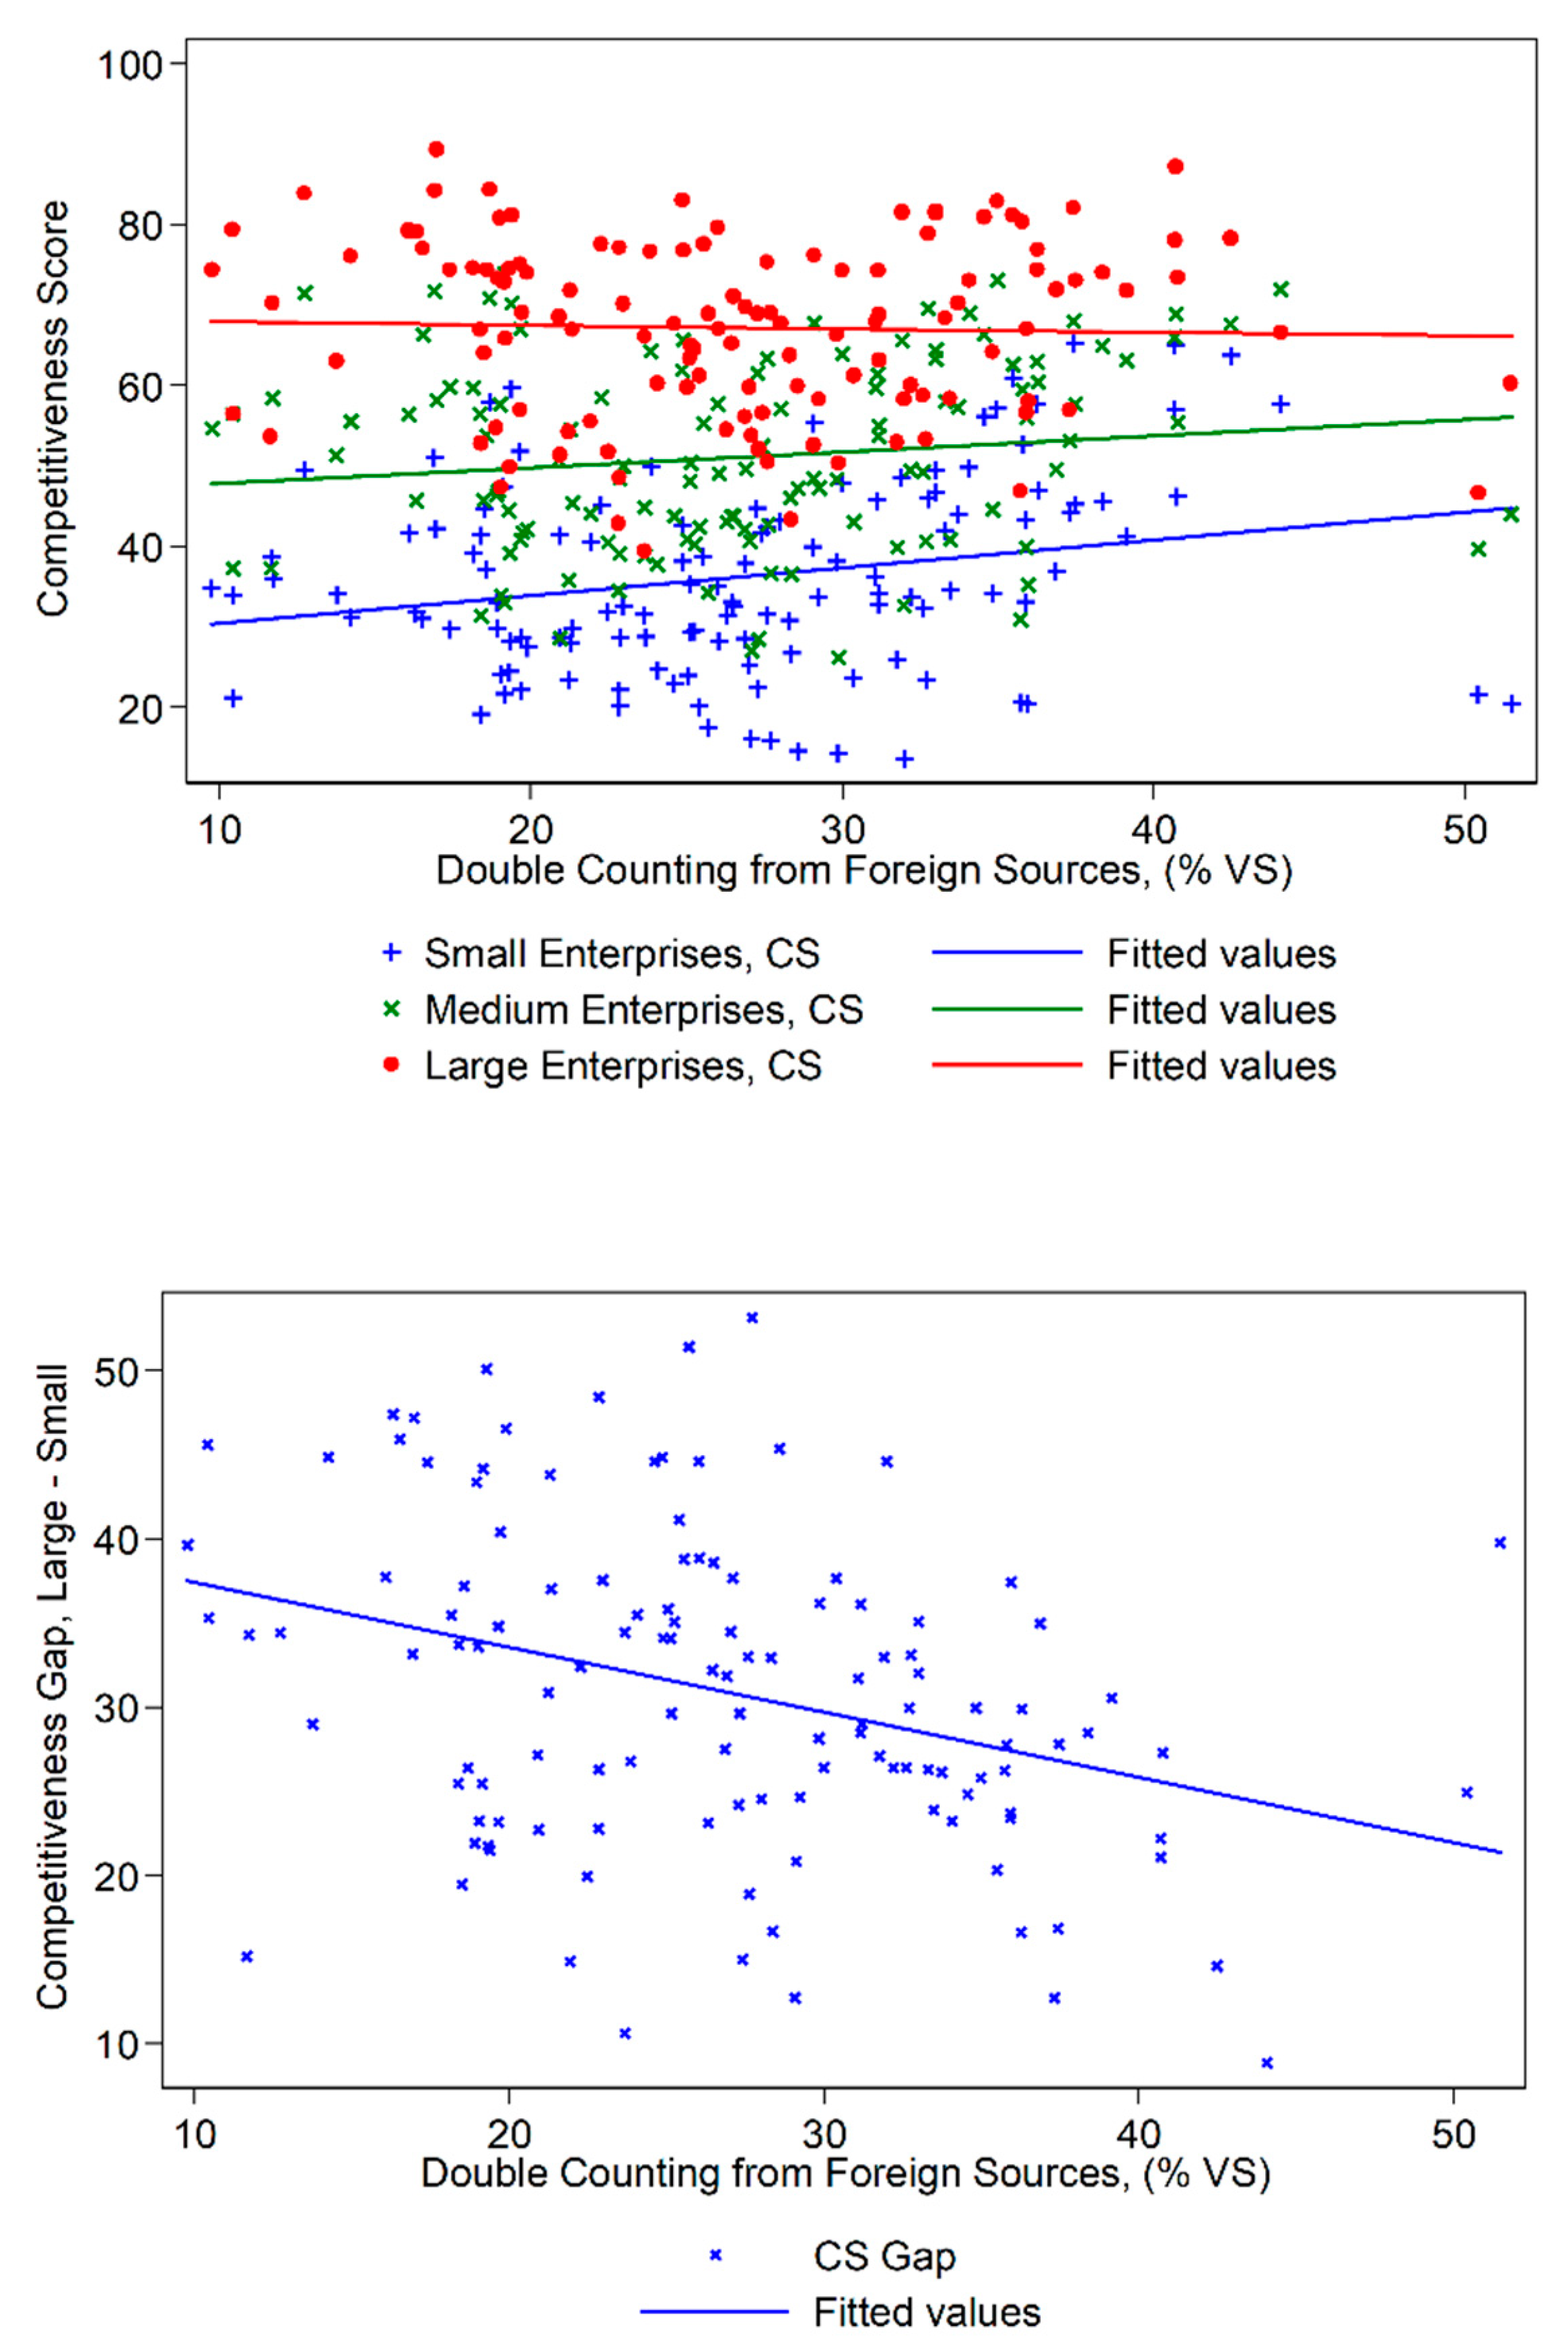
Through further disaggregation of GVC variables, we find that the component driving the correlation behind the foreign content of exports is the double counting of intermediate foreign goods (Figure 5). The greater the share of double counting from foreign intermediate sources, the greater the reduction in the competitiveness gap. Double counting occurs when intermediate goods cross borders several times and the double counting indicator tends to be sizable when GVC trade is prevalent.
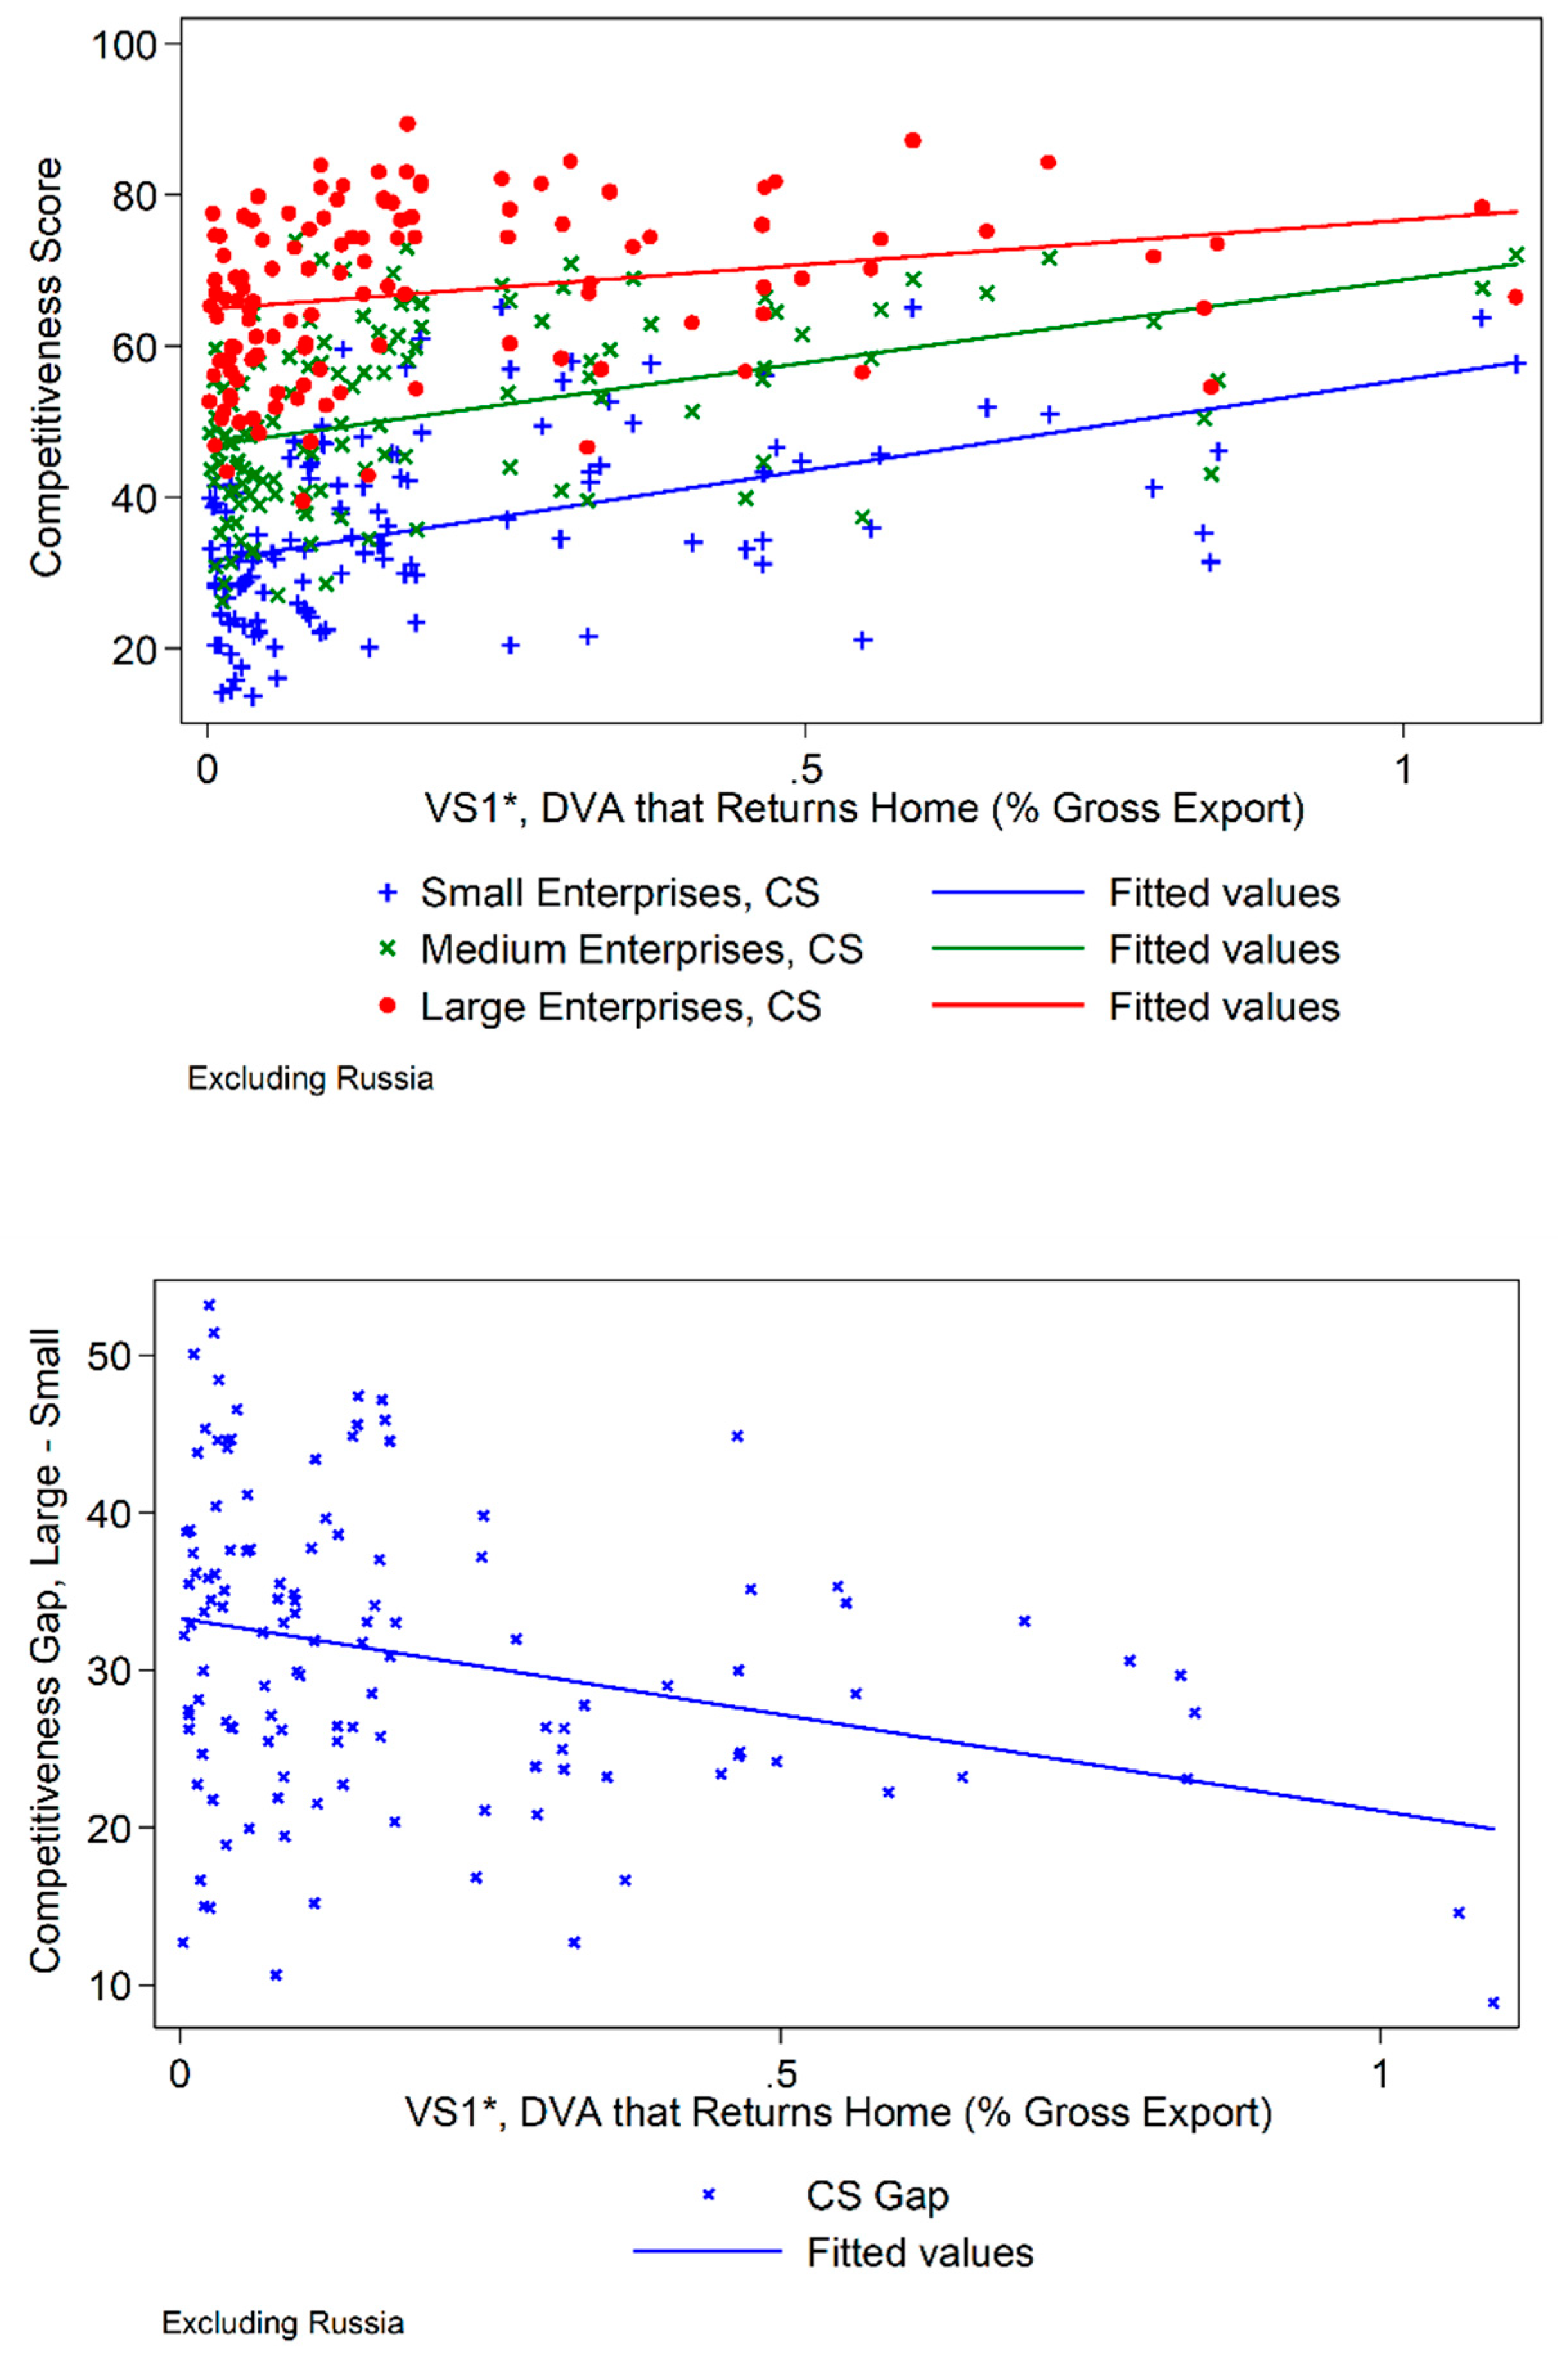
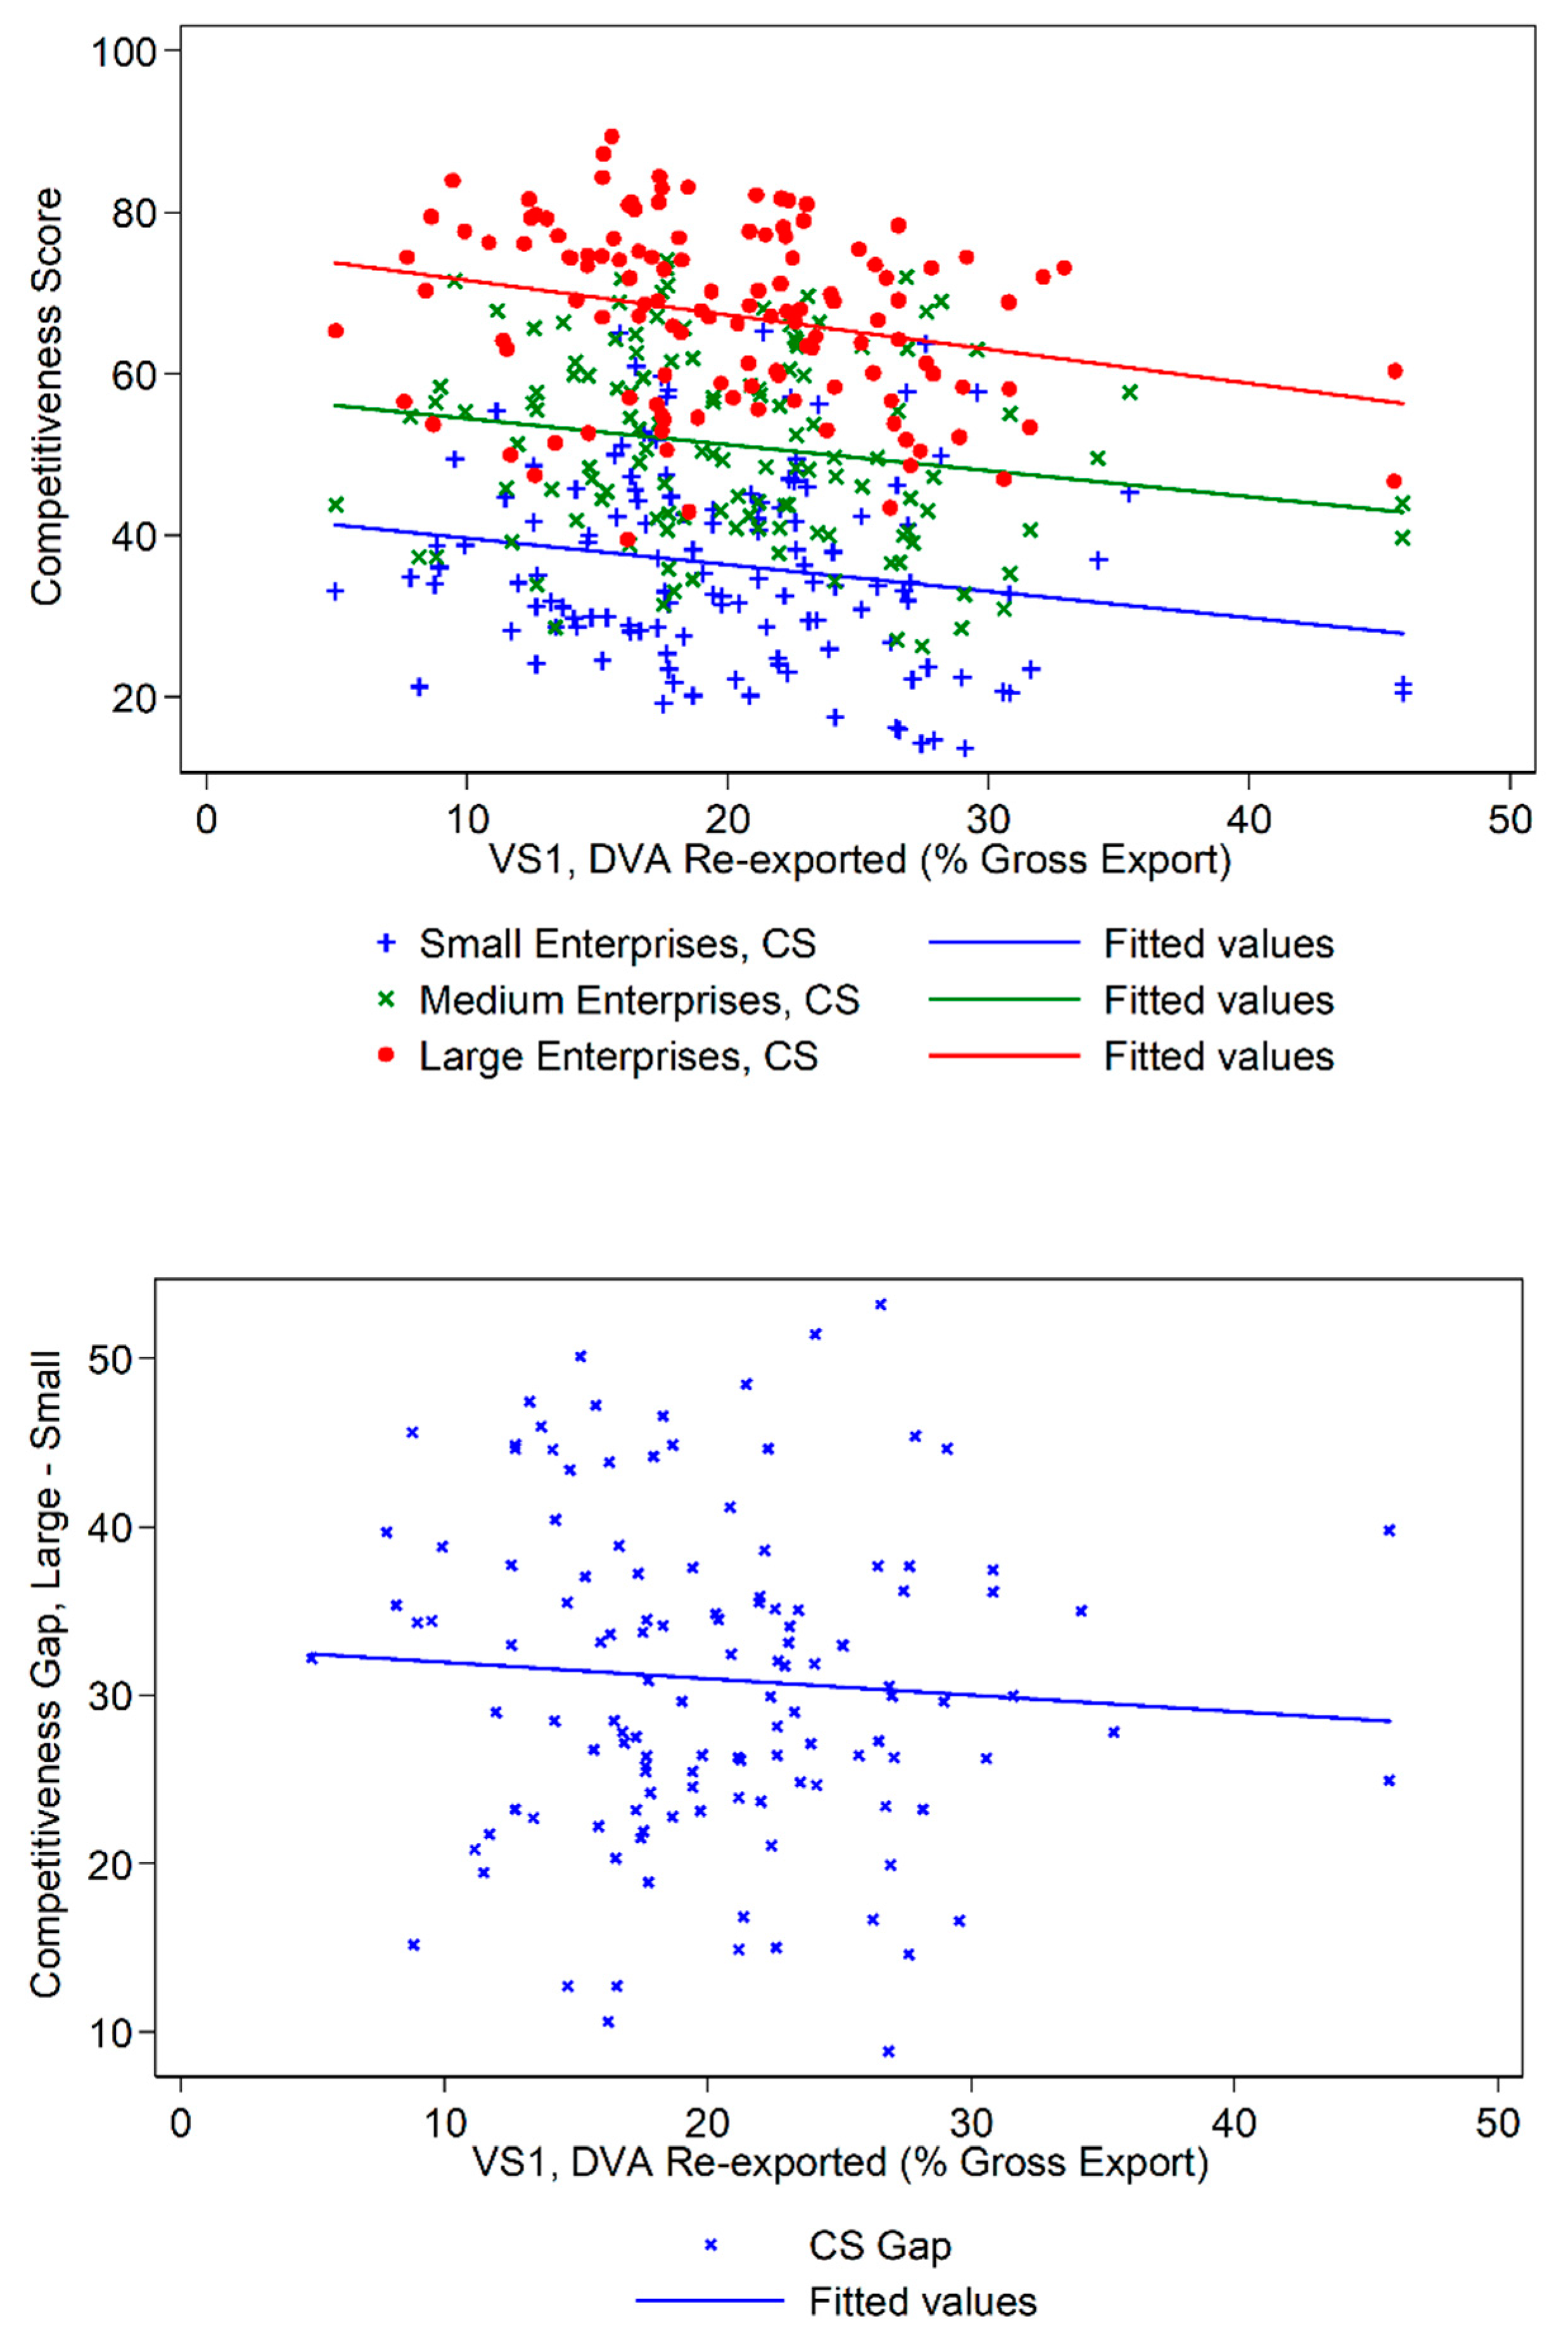
Forward linkages are explored in Figure 6 and Figure 7, using two different indicators, namely the value of intermediate goods shipped back to the domestic economy (VS1*) and the value of intermediate goods that are re-exported to all other countries (VS1). We observe that countries exporting a large share of intermediate goods that are shipped back home have a lower competitiveness gap (Figure 6). In contrast, intermediates re-exported (VS1) are not correlated with a lower competitiveness gap (Figure 7). The result suggests that firms that integrate in value chains and that are linked back to the domestic markets may be better off than their counterparts. By using the domestic market to leverage GVCs, firms may have the possibility of placing themselves at the beginning, the middle or the bottom of the supply chain. The additional flexibility might allow them to choose the most adequate segment of the supply chain, driving the relation with the competitiveness gap.
This initial exploratory analysis suggests the overall measure of GVC participation is positively correlated with SME competitiveness and negatively correlated with the gap in competitiveness of large and small firms. Separating GVC integration into specific components shows that all measures of backward integration carry on the positive relation with competitiveness and reduction in the competitiveness gap. In the case of forward integration, the negative relation with the competitiveness gap is statistically significant only in the case of domestic value added in intermediate goods that returns home.
3. Methodology: Econometric Setup and Identification Strategy
Since the competitiveness score is bounded in an open interval between 0 and 100, we model the response variable as a fractional probit model with unobserved effects. In particular, for a given country i, firm size s at time t, the competitiveness score is modelled as a function of the GVC participation variables. The model’s condition is the following:
where denotes the normal probability distribution, is a fixed time effect and is an unobserved firm size class-country effect. There are two major problems connected with the estimation of Equation (1). First, we do not observe the firm size class-country effect. Second, the variable might be endogenous. We solve the two problems by applying the procedure introduced by Papke and Wooldridge (2008) for fractional probit balanced panels. The method assumes that the unobserved effect follows a normal distribution whose average relates to the time average of the covariates. The intuition is that we are estimating the optimal de-meaning factor, which is time invariant.
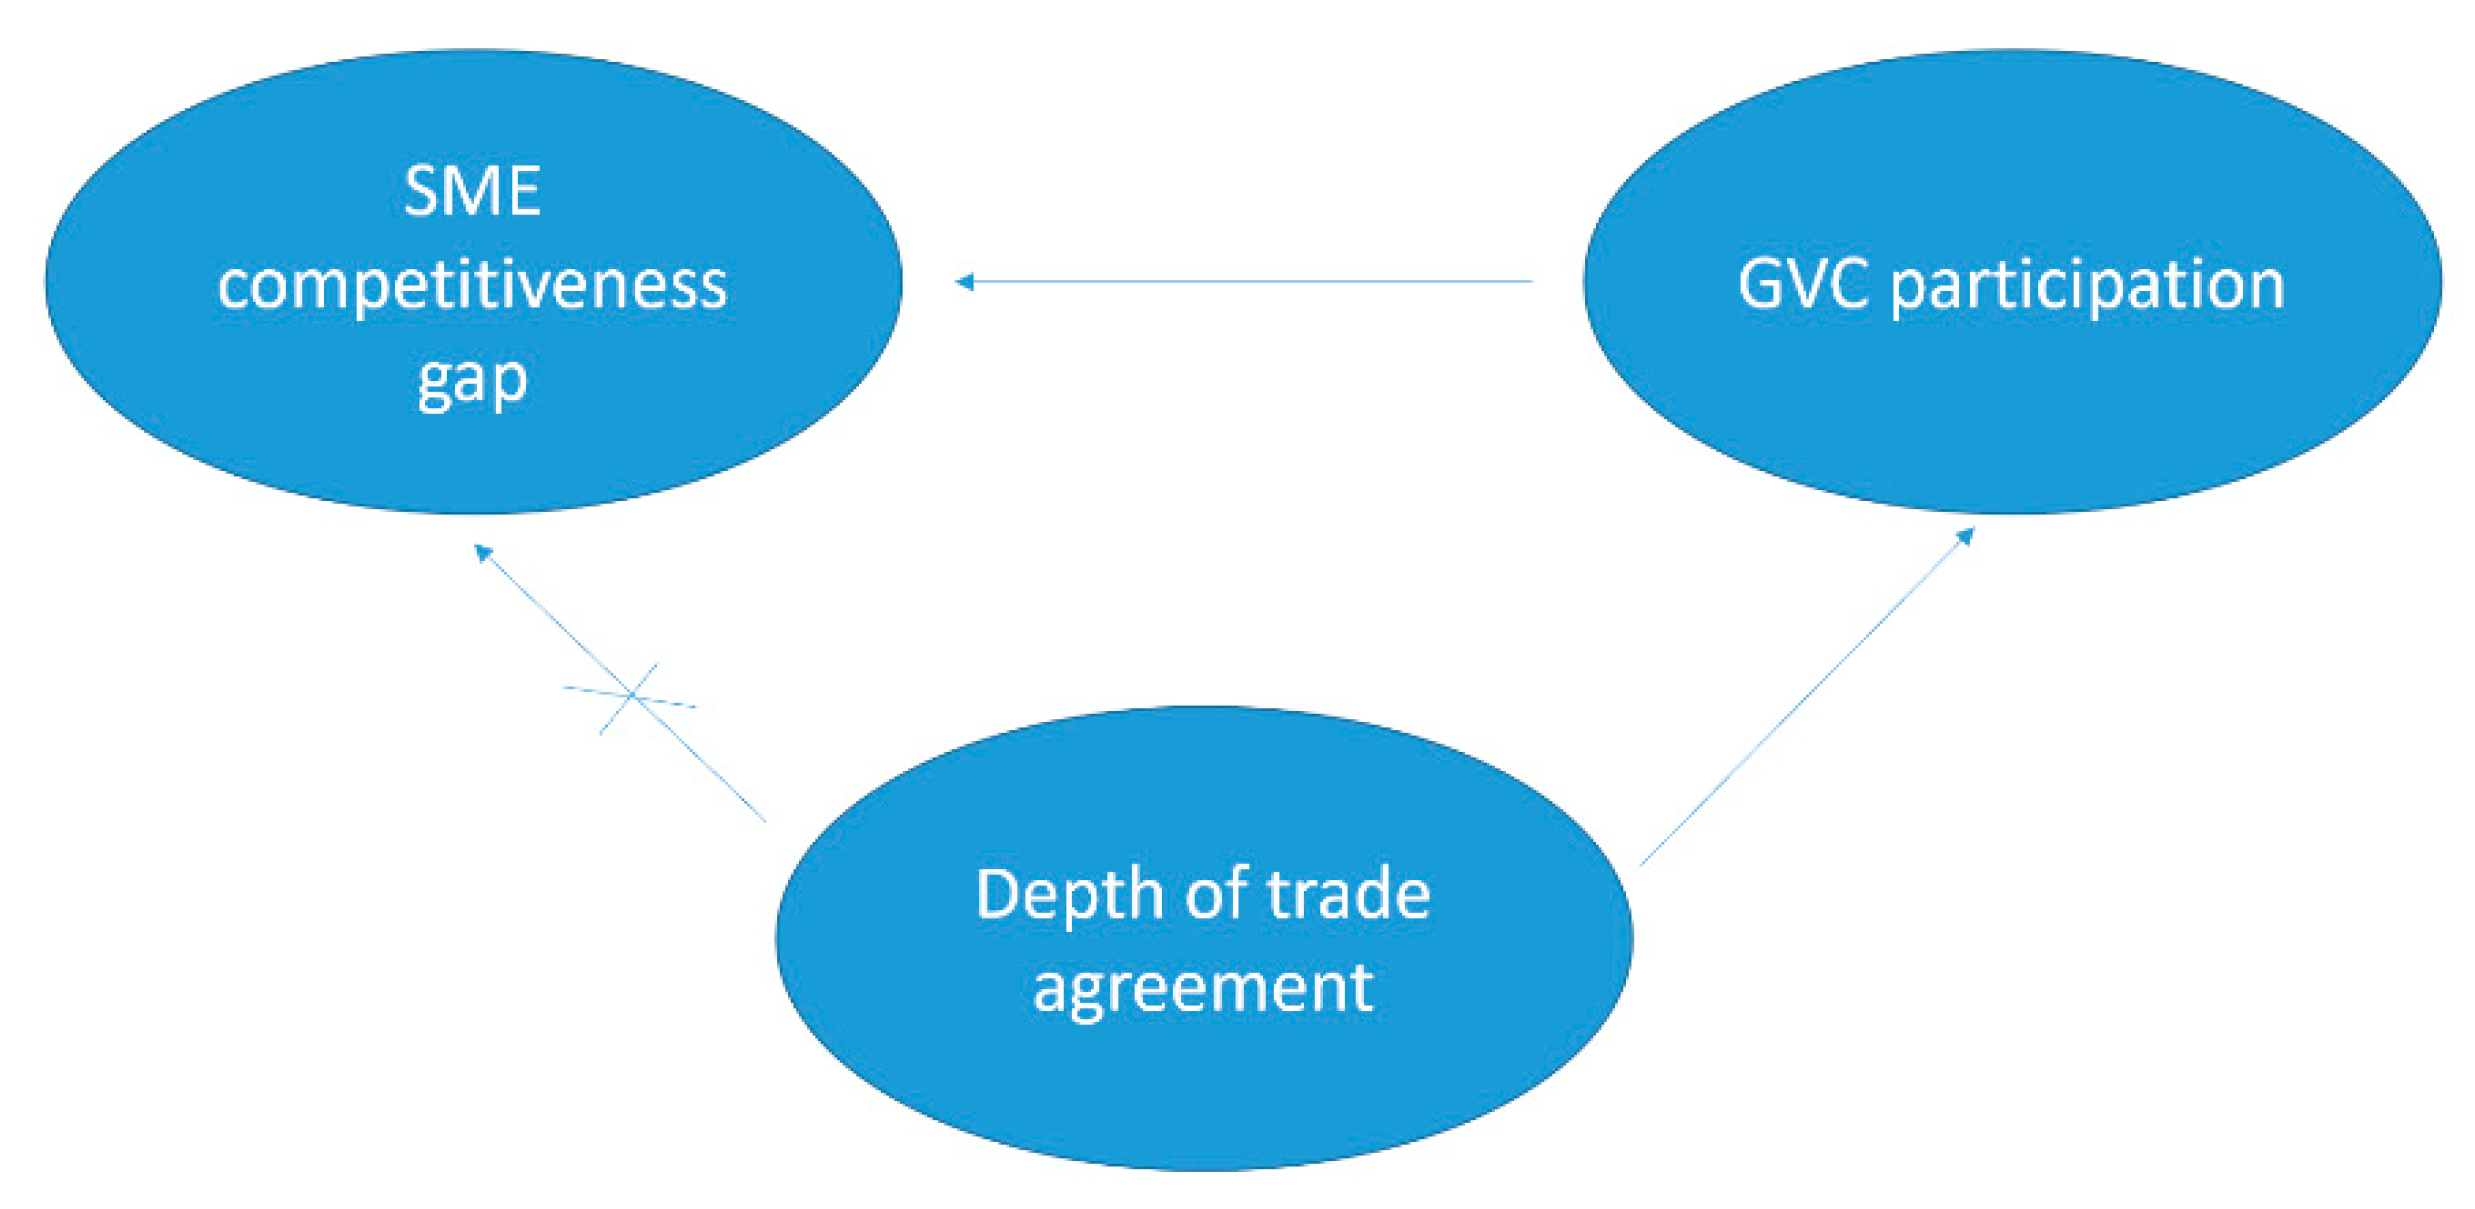
Furthermore, the GVC participation variable might suffer from an identification problem, because the most competitive SMEs are more likely to participate in GVCs. To deal with the endogeneity issue, we suggest an instrumental variables estimator that uses the depth of a trade agreement as the main instrument. Figure 8 depicts the underlying causal structure assumed in the model. We exploit the fact that the signing of a trade agreement helps firms integrate in value chains, with deeper agreements having a stronger effect on the vertical trade. However, an agreement has no effect per se on the competitiveness of SMEs. Hence, the depth of a trade agreement is a reasonable instrument for GVC participation. The competitiveness framework elaborated by ITC (Falciola et al. 2020) contains the competitiveness scores for three layers of the economy: firm capabilities, the business ecosystem and the national environment. Deep trade agreements contain provisions aimed at changing the domestic regulatory environment and are likely to influence the national environment and the business ecosystem. Therefore, we exclude these two layers from our calculations of the competitiveness score and included only the score at the firm capabilities level because it is not influenced by the depth of trade agreements. We define the depth of an agreement as the sum of the policy areas that contain legally enforceable provisions. The indicator is calculated based on the data from the World Bank Database on the Content of Preferential Trade Agreements (Hofmann et al. 2017). (The World Bank Database on the Content of Preferential Trade Agreements is freely accessible at https://datacatalog.worldbank.org/dataset/content-deep-trade-agreements.)
Papke and Wooldridge (2008) derive a series of assumptions that allow controlling for endogenous covariates through a two-stage procedure. We follow their method to estimate consistently the marginal effects of our independent variables on the competitiveness score. The assumption requires an exogenous regressor that is present in the first stage and absent in the second stage.
For robustness purposes, we estimate the model using a linear specification with an instrumental variables approach in a random effects model for panel data. The error components model builds around the following assumptions:
We estimate (2) with the Generalized Two-Step Least Squares (G2SLS) estimator (Baltagi 2013). To back up the assumption of random effects, we perform a Hausman-test where we compare the fixed effects and random effects estimators. The test supports the applicability of the random effects estimator, as it is the most efficient one in the absence of correlation between the main covariate and the individual specific effect.
4. Discussion of the Results
The results are presented in the following way. We start with the overall measure of GVC participation and employ three different techniques to evaluate its effect on the competitiveness score of different firm size classes. First, we report the effects of GVC participation estimated using fractional probit. Second, we address the potential endogeneity by employing instrumental variable (IV) and running fractional IV probit. Third, we provide results of a linear estimation as a robustness check. Fourth, we report three more sets of results, showing the effect of specific measures of forward and backward linkages on the competitiveness gap, with and without IV. Fifth, we test the effect on the competitiveness gap of two firm-level GVC participation variables.
In Table 1, we report the marginal effects for model (1) estimated with Papke and Wooldridge’s (2008) technique. We estimate the impact of the GVC participation variable on the competitiveness score of firms in a country. In columns (2), (3), (5) and (6), we allow the coefficient on GVC participation to differ across firm sizes. The specifications are all fractional probit models for panel data with different sets of unobserved effects. The preferred specification is the one in column (6) because it accounts for most types of heterogeneous effects. In column (6), we observe that a 100 basis point increase in GVC participation results in an increase in competitiveness of 51 basis points for small firms, 39 basis points for medium-sized firms and 24 basis points for large firms. Therefore, the effect of GVC participation is stronger for the competitiveness of small firms than for medium-sized and large firms. For comparison, in column (1) and (2) we also provide an estimation of the effect of GVC participation on the average measure of firm’s competitiveness (independent of the size of firms). Notice that the overall magnitude of the coefficients is stable across all specifications in Table 1.
The estimates in Table 1 might be biased because the GVC participation variable can suffer from endogeneity. To mitigate the bias, Table 2 reports the two-stage fractional probit model that uses the average depth of a country’s trade commitments as the exogenous variable. The variable is constructed using the World Bank Database on the Content of Preferential Trade Agreements (Hofmann et al. 2017), with the depth of the agreements being measured as the count of policy areas with legally enforceable provisions.
In Table 2, we report the coefficients that use the depth of trade agreements as an instrument. We find the marginal effects to be larger than in the baseline model but comparable in magnitude. Column (1) shows that, on average, increasing GVC participation by 100 basis points increases the competitiveness score by 70 basis points. Once we separate the effect between small, medium-sized and large firms, we notice the same pattern as in the baseline results reported in Table 1. Small firms benefit the most from GVCs. For a 100 basis points increase in GVC participation, we observe an increase of the competitiveness of small firms by 82 basis points. In contrast, medium-sized and large firm competitiveness increases by 70 basis points and 56 basis points, respectively.
For robustness purposes, we provide a linear estimation of model (2) in Table 3. We use a random effects model so that the order of magnitude of marginal effects is comparable to the fractional probit. Indeed, across all four specifications, we observe similar results to what we reported in Table 1 and Table 2. Columns (1) to (3) are Generalized Least Squares (GLS) estimates and column (4) is the generalized Two-Stage Least Squares (G2SLS) using the depth of trade agreements as an instrument. Alternatively, we have used the average depth of WTO-plus and WTO-extra provisions. The additional instruments confirm the results.
Having established the link between the overall GVC participation and competitiveness by firm size, we delve deeper and separate the GVC participation into two types: forward linkages variables (measured by the domestic value added in exports that return home, and the domestic value of intermediate imports that are re-exported by the partner country) and backward linkages (foreign content of exports in intermediate and final goods, and double counting in exports). We report the results for forward linkages in Table 4, while Table 5 shows the results for backward linkages. Both are estimated by Generalized Least Squares. Finally, Table 6 presents the selected models with their G2SLS estimations.
In Table 4 we report the results of the GLS estimations with forward linkages indicators as explanatory variables. Column (1) reports the results for the domestic value added that returns home. An increase in the domestic content of exports of 10 basis points is accompanied by a decrease of the competitiveness gap of 120 basis points. In column (2) we observe that exports for re-exports to third countries are not related to the competitiveness gap. The result may be explained by the finding in Cusolito et al. (2016) who show that participation in GVC is mostly taking place through backward linkages, especially in developing countries. The large coefficient in column (1) is explained by the fact that the amount of domestic value added that returns home is usually very low, with the maximum being around 7%. An example of domestic value added that returns home are Apple patents that come back to the United States embedded in the goods designed by Apple but produced in foreign factories.
In Table 5 we report the results of the GLS estimations with backward linkages indicators as explanatory variables. The main goal is to determine the impact of vertical specialization on the competitiveness gap and identify specific drivers. We report the results for the overall measure of forward integration, i.e., foreign content of exports, and its two components, namely double counted terms from foreign sources and foreign value added in intermediate goods. We find in column (1) that increasing the foreign content of exports by 10 basis percentage points decreases the competitiveness gap by 2 basis points. The component driving the result is the amount of double counting in gross exports shown in column (2). Double counted exports are an indicator that an intermediate good has crossed the border several times; in contrast to foreign value added in intermediate exports, this denotes stronger interlinkages in GVCs. It is not only an import to be processed and re-exported; it is a product that has been imported and processed several times. Column (3) highlights that foreign value added in intermediate goods is not related to the competitiveness gap.
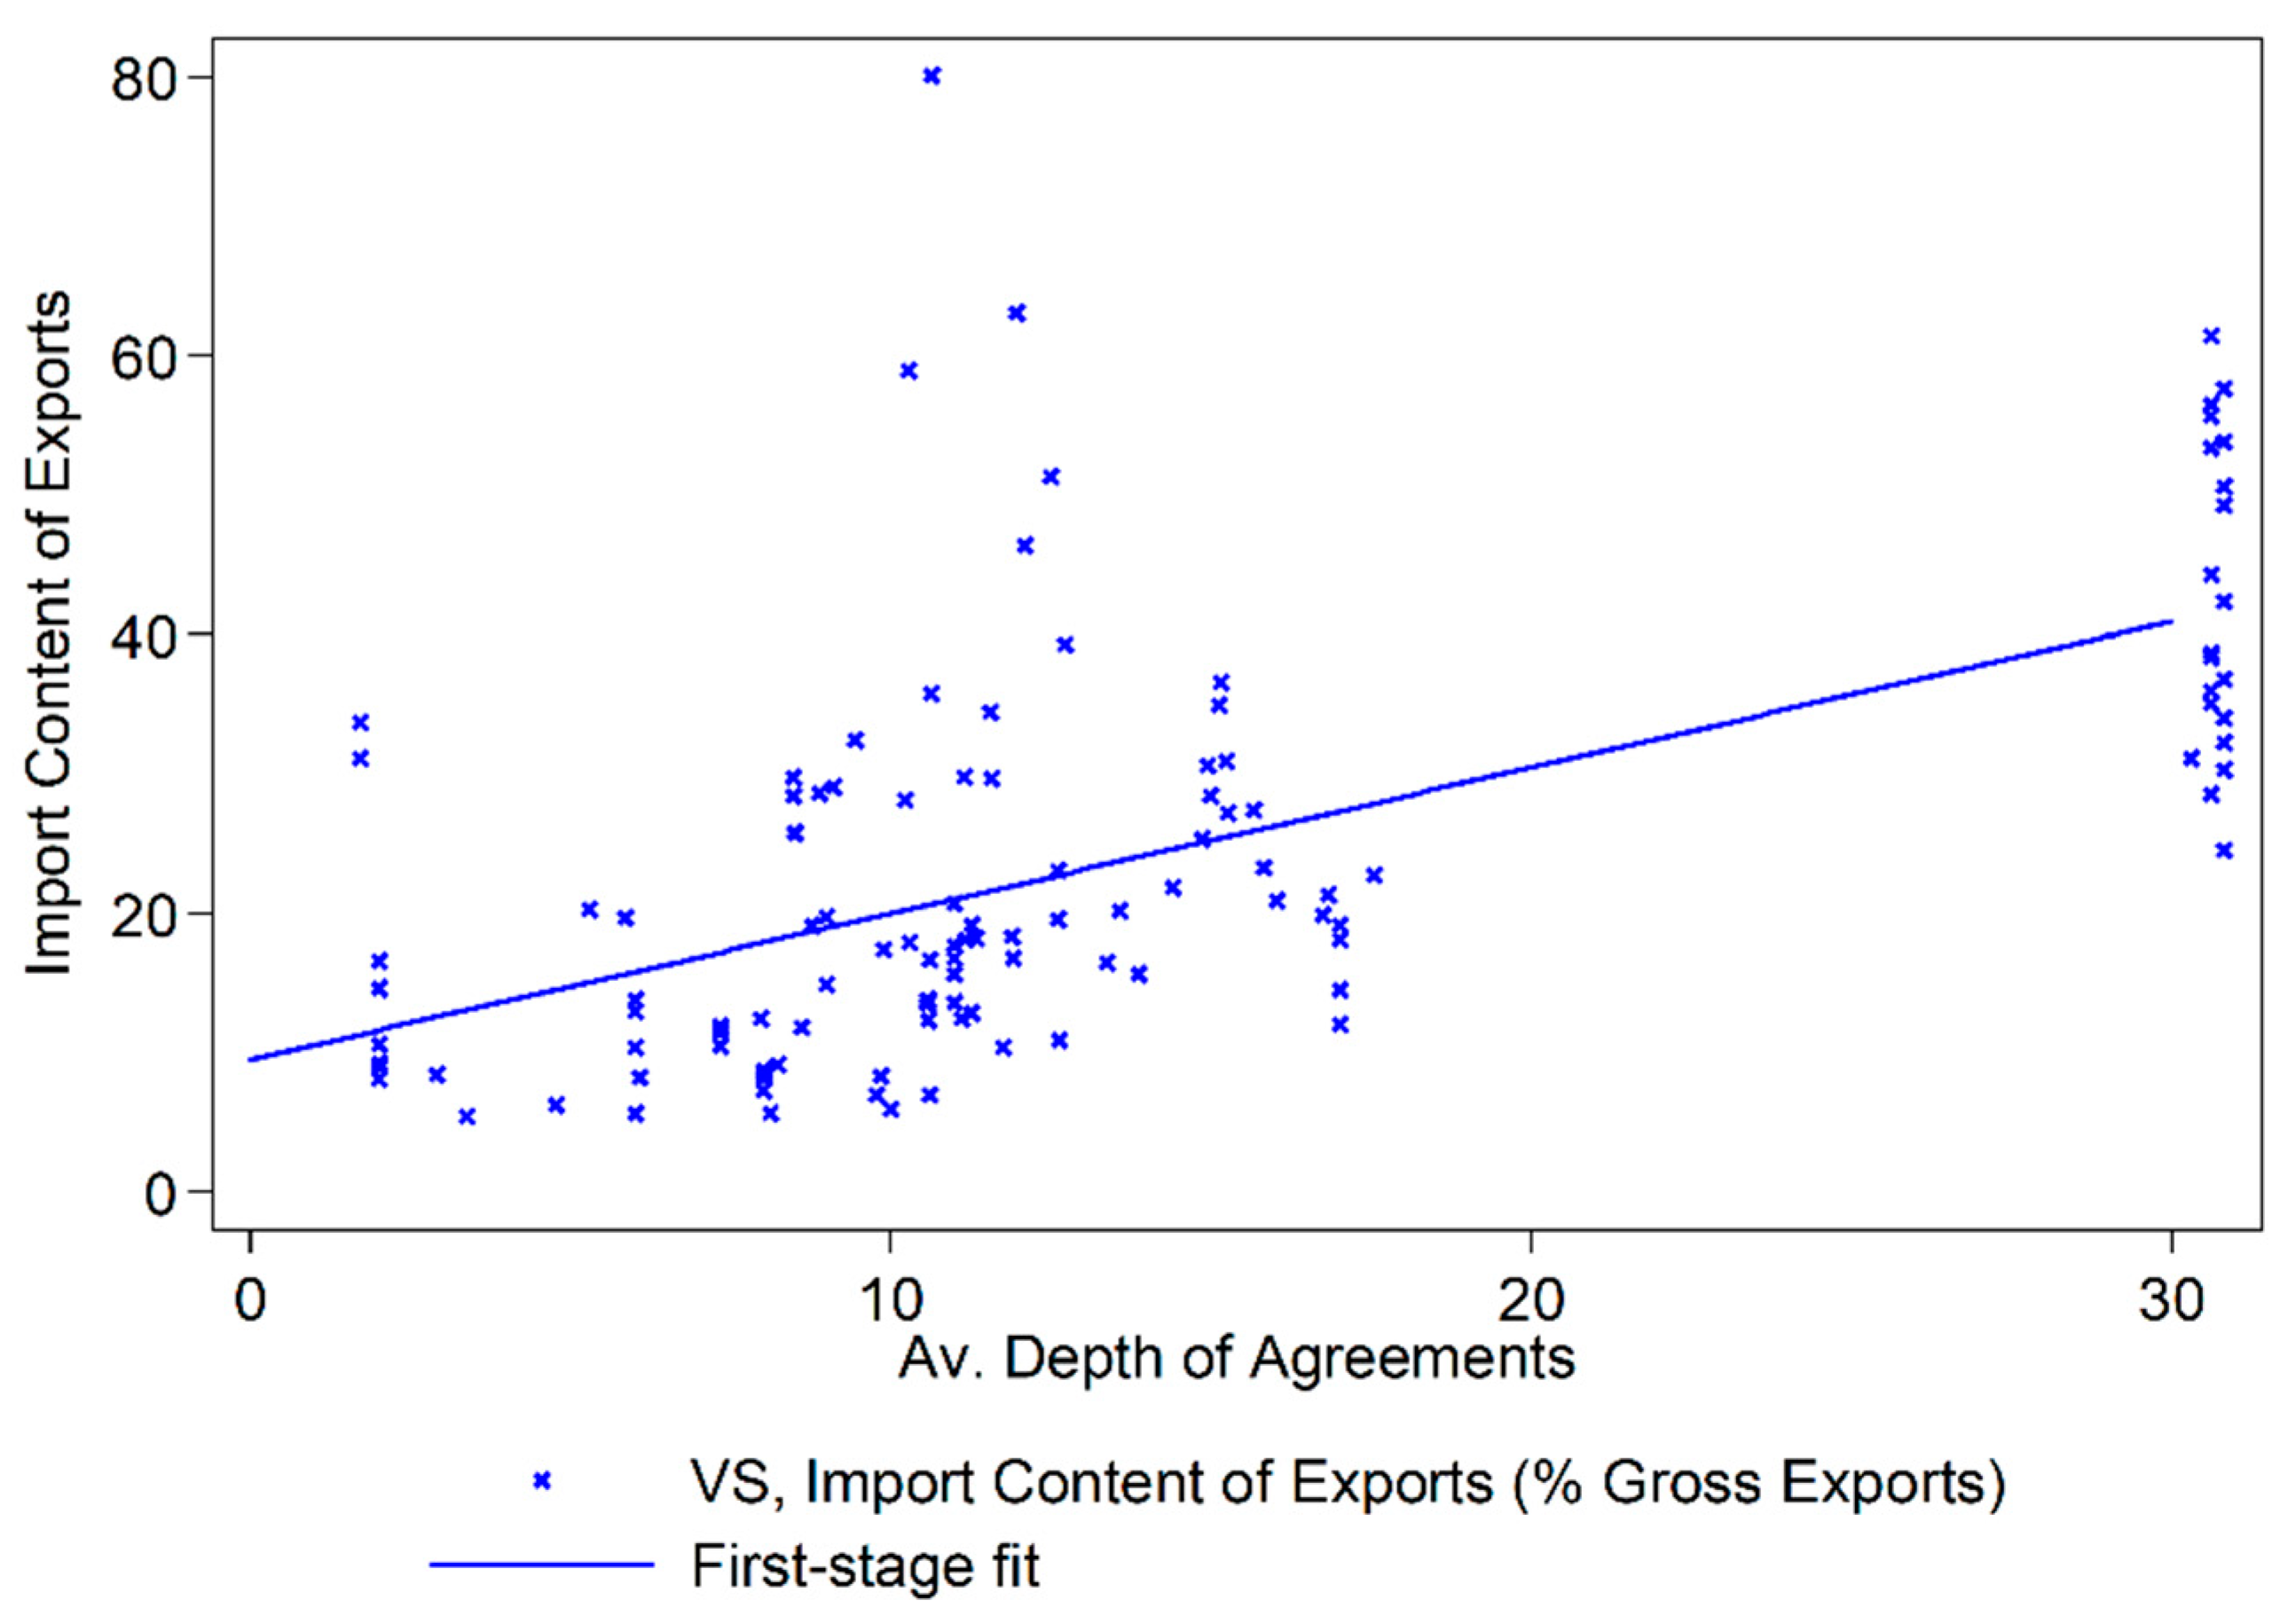
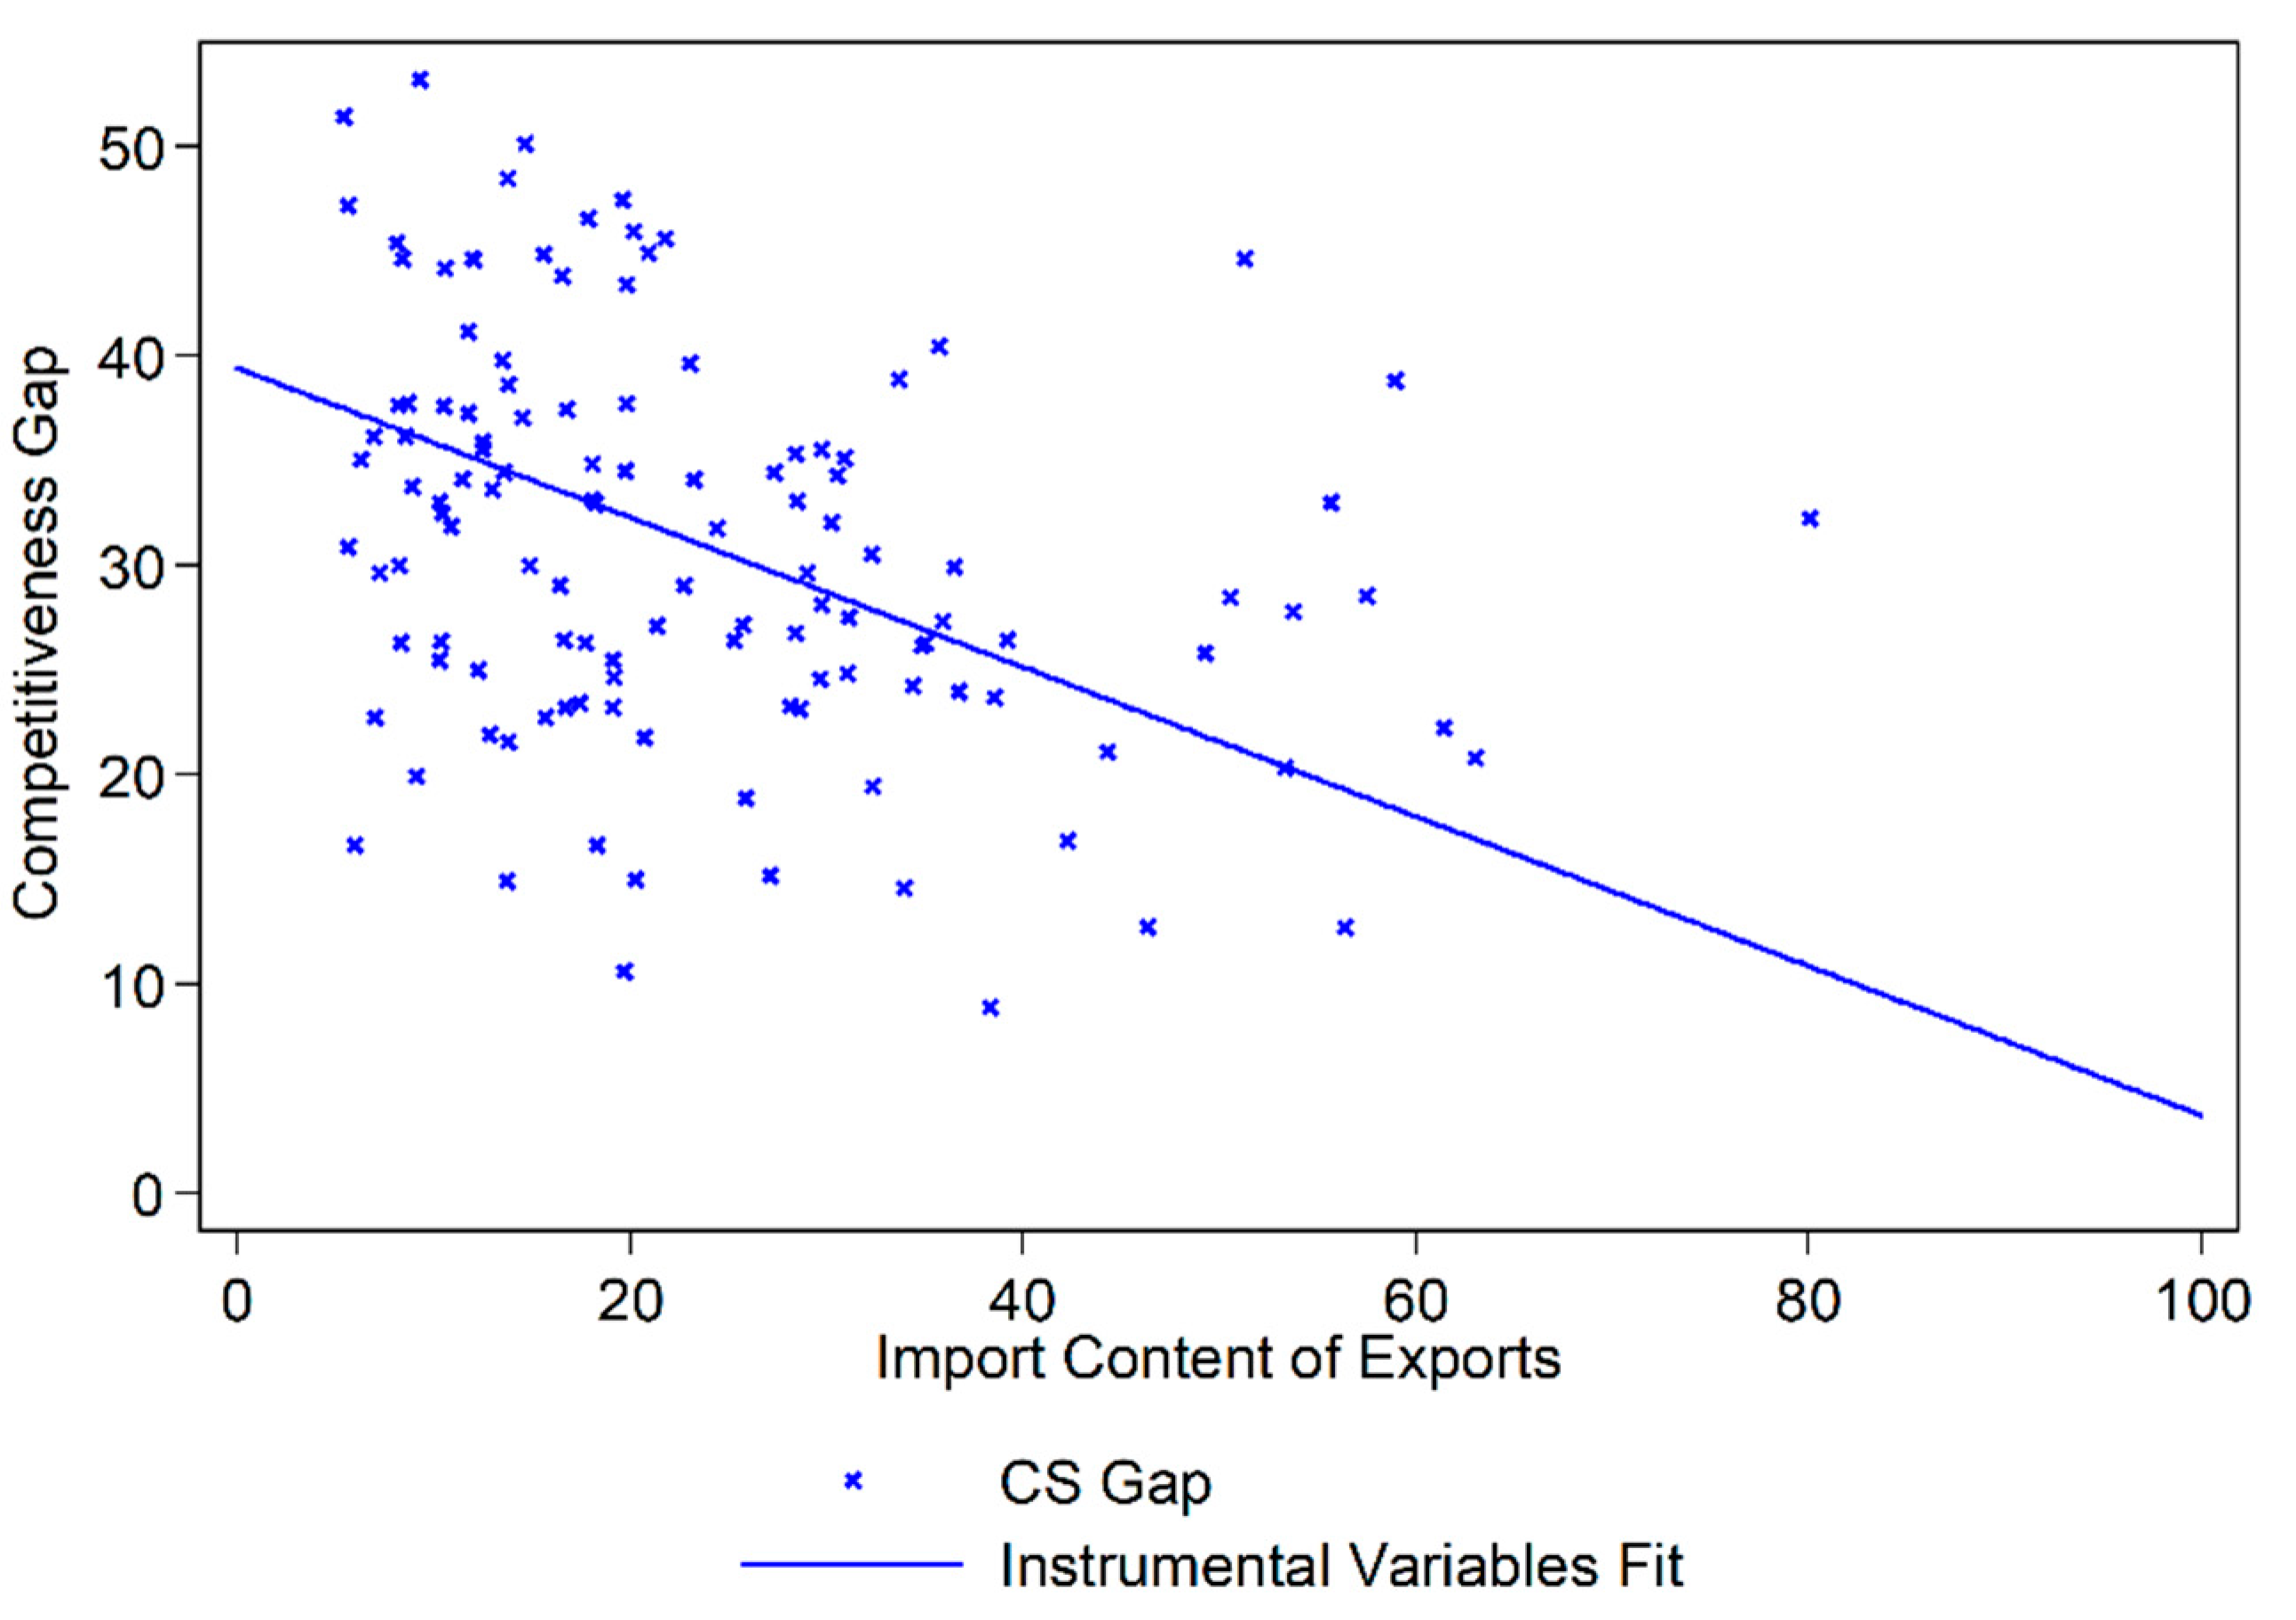
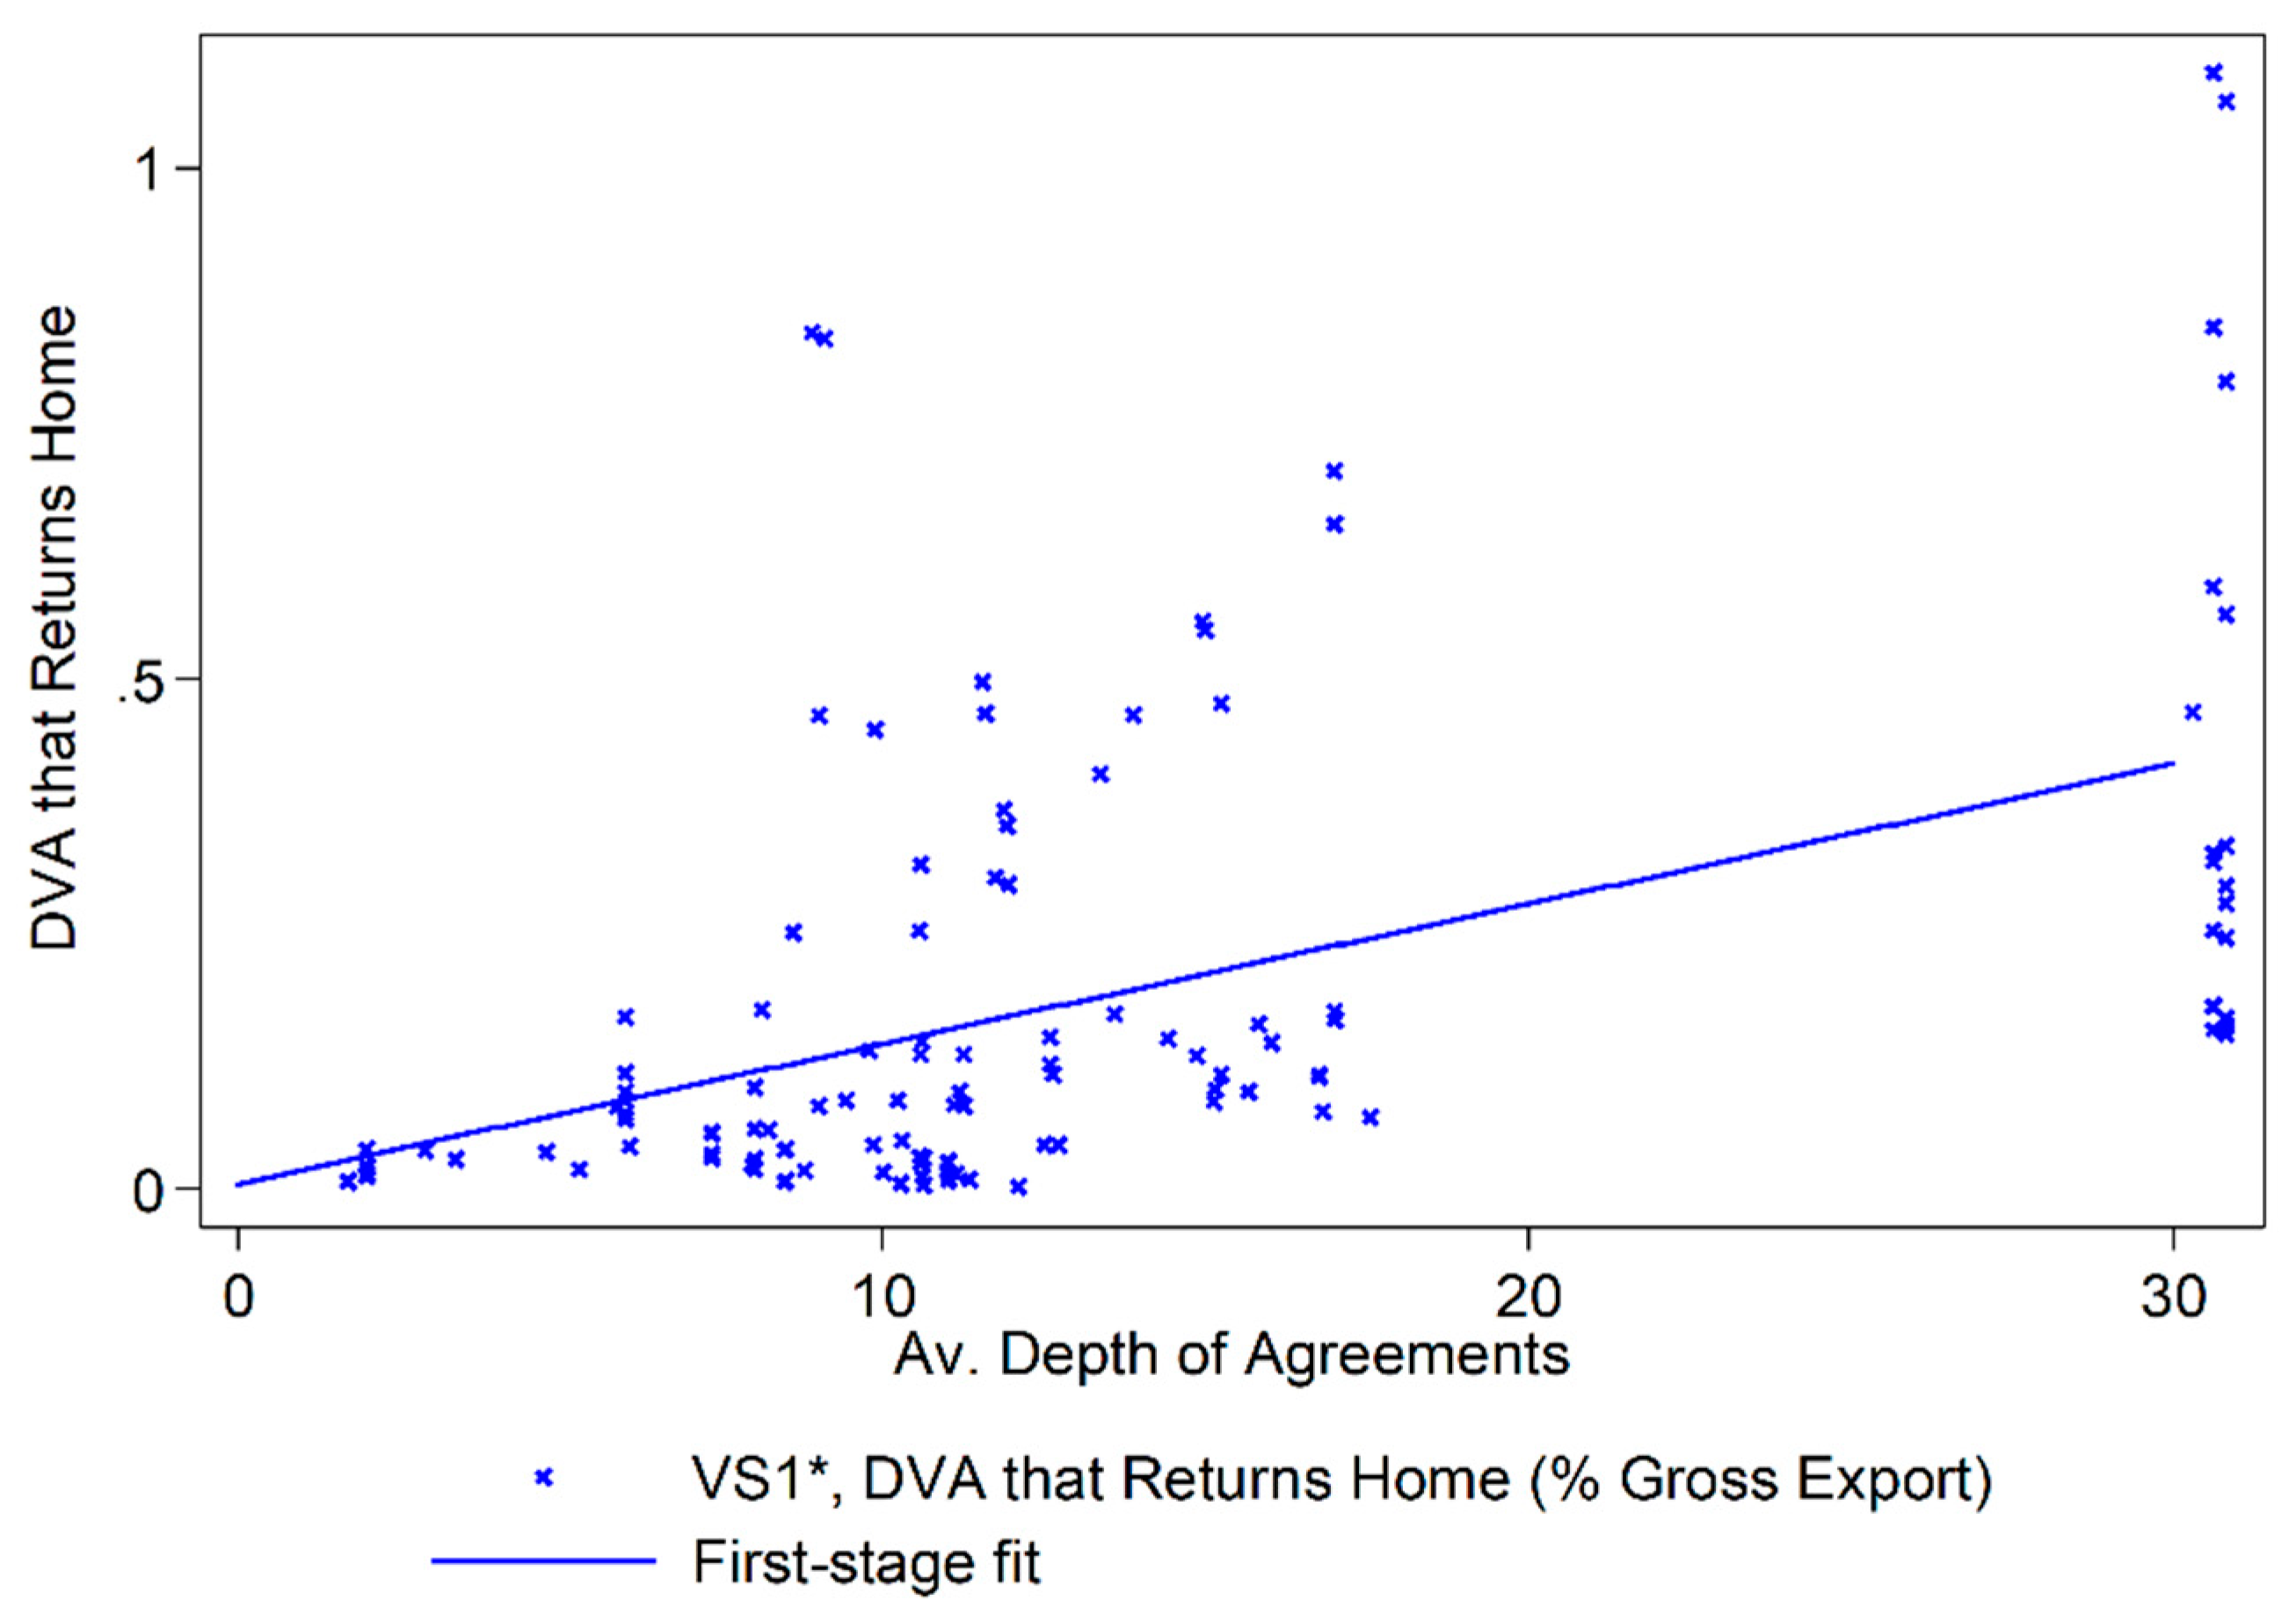
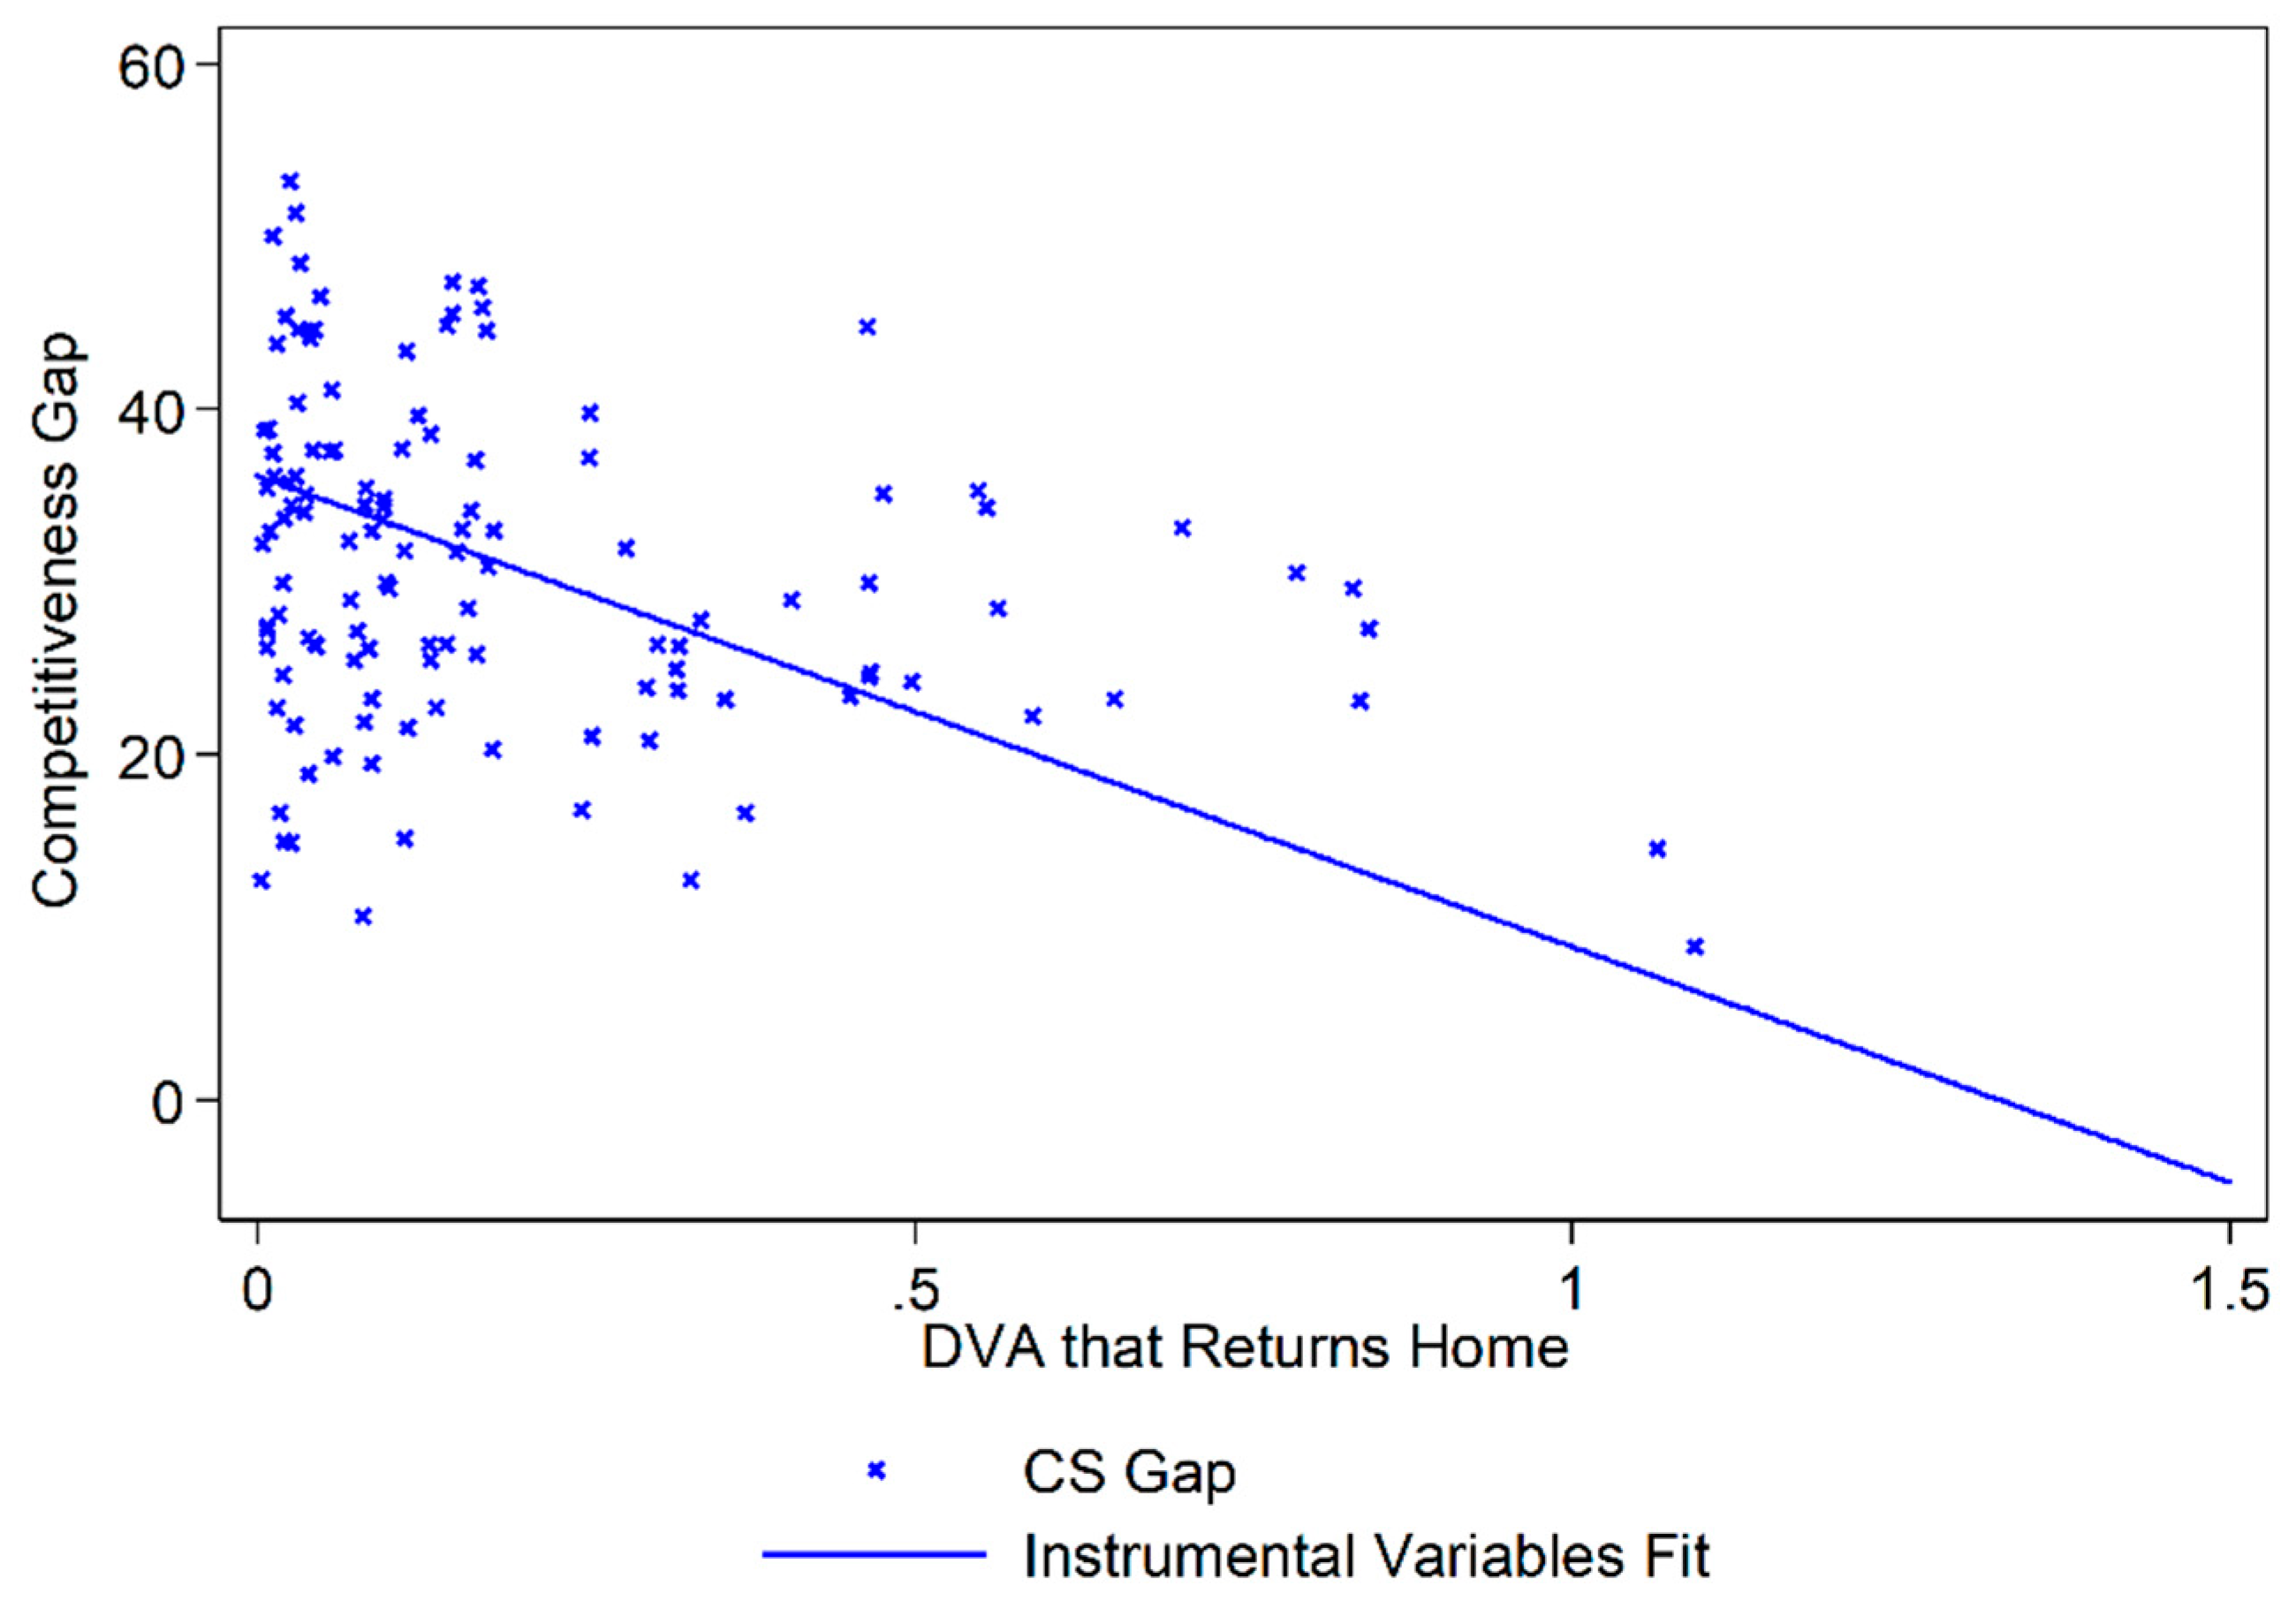
In Table 6 we show the results for the instrumental variables estimator. The instrument is the average depth of a country’s trade agreements. First stage fits are reported in the Appendix A (Figure A1, Figure A2, Figure A3 and Figure A4). The IV corroborates our previous estimates. We observe a significant impact of the backward linkages, in other words vertical specialization as an importer of value added. An increase of 10 basis points in the index results in a 4 basis point reduction of the competitiveness gap, shown in column (1). Furthermore, the effect of domestic value added shipped back home is even stronger. We observe that a 10 basis point change deals a significant reduction of 270 basis points (column 2). Intuitively, from lead firms’ points of view, competitiveness of foreign suppliers of value added (backward linkages) is more important than competitiveness of foreign buyers of value added (forward linkages), unless the buyers purchase value added that ultimately returns and is consumed in the home economy (measured by the GVC indicator “domestic value added that returns home”). In these cases, lead firms in value chains are more likely to share the technologies and know-how and contribute investment and other capital.
Finally, column (3) of Table 6 shows that increasing the overall GVC participation by 10 basis points leads to a reduction of the competitiveness gap by 4 basis points. The magnitude is significant. Deepening a country’s trade commitments by an additional policy area corresponds, on average, to a 2.5% increase in the country’s integration into value chain trade. This benefits both small and large firms. Small firms benefit even more, which leads to a 1.25% reduction in the competitiveness gap between large and small firms. For example, increasing Ecuador’s commitments by one policy area would result in a reduction of the competitiveness gap between large and small firms, with the reduced gap being similar to the competitiveness gap observed in Slovakia.
An important caveat of the analysis insofar lays in the fact that the differences observed between groups of firms could be currently explained by differences within categories of firms. Therefore, in order to assess if there are decreasing returns of GVC participation to firm size, we calculate two participation measures at the firm level, as suggested by Taglioni and Winkler (2016), together with a monotonic firm size variable. Table 7 reports the impact, on the competitiveness score, of a GVC participation variable based on backward linkages, namely the domestic firm’s share of imported input. The regressions in column (1) and (2) of Table 7 show that larger firms are more competitive that smaller ones and that backward linkages are positively correlated with the competitiveness score. In column (2) of Table 7, the interaction between the GVC participation variable and the firm-size variable is negative. This can be interpreted as GVC participation having a decreasing impact on the competitiveness score based on the size of the firm.
In Table 8, we report test the impact of another firm-level GVC participation measure based on forward linkages, suggested by Taglioni and Winkler (2016), on the competitiveness score. The multinational share of inputs from domestic suppliers is negatively correlated with the competitiveness score. The negative coefficient, however, is weaker for larger firms. The interpretation of this result is clear. Only very large firms benefit from strong forward GVC linkages.
5. Conclusions
The literature shows how opening up to trade affects the productivity distribution of domestic firms. GVCs dominate international production and trade, reallocating tasks, capital and knowledge flows across countries. The paper investigates the spill-over effect, in terms of competitiveness, for firms participating in GVCs. By looking at a large sample of developing countries, we estimate the effect of GVC participation on competitiveness across different firm size classes, while identifying the potential channels of transmission.
The empirical analysis supports previous findings on the benefits accruing to firms through their integration into global production networks. In particular, firms of all sizes appear to benefit from the average level of GVC integration of the country. The paper highlights that the effect is stronger for the competitiveness of small firms than for the competitiveness of large firms. There are two possible economic explanations for this observation. On the one hand, pro-competitive effects of opening up to trade might push the least productive firms out of the market, which might coincidentally be the smallest, rising the overall average productivity of small firms proportionally more than for large firms. On the other hand, a learning effect could be taking place where importing goods translates into importing knowledge and best practices. For example, Vidavong (2019) shows that, in the case of Laos, firms’ experiences in GVCs are very significant in explaining improvements among SMEs, with positive changes being attributed to innovations and learning-by-exporting. Small firms would benefit the most from the transfer of knowledge because of their lower initial human capital endowment.
The natural follow-up of the analysis was to identify the channels of transmission for the effect. We find that backward linkages are the most important for the competitiveness of small firms. The finding supports the hypothesis that the use of foreign inputs allows small firms to access high quality intermediates that may be unavailable in their domestic economy. As a consequence, the imported knowledge serves as a vector to achieving a higher performance. Indeed, we provide evidence that double counted intermediate goods are the main factor driving the result, which is a clear indicator of cases where GVC trade is prevalent. Forward linkages appear to matter only in the case of domestic value added that returns home. This makes the case for “circular” value chains that leverage on the domestic economy for consumption and use foreign hubs for processing and assembly.
Further research can integrate a sectorial dimension in the current study. Moreover, identifying specific determinants that matter both for the competitiveness and GVC participation can provide valuable inputs for informed policy making.
Author Contributions
Conceptualization, M.B.; Data curation, M.B.; Formal analysis, M.B.; Methodology, M.B.; Project administration, O.S.; Resources, O.S.; Software, M.B. and O.S.; Supervision, M.J.; Validation, M.J.; Visualization, M.B.; Writing–original draft, M.B and O.S.; Writing–review & editing, O.S. All authors have read and agreed to the published version of the manuscript.
Funding
This research received no external funding.
Data Availability Statement
Data available in publicly accessible repositories that do not issue DOIs. Word Bank’s Enterprise Surveys are freely accessible at http://www.enterprisesurveys.org, and the Content of Preferential Trade Agreements is freely accessible at https://datacatalog.worldbank.org/dataset/content-deep-trade-agreements. The Eora Multi-Regional Input-Output tables are free for academic use at http://worldmrio.com.
Acknowledgments
We thank Mario Filadoro, Loe Franssen, Nathalie Raschka, Valentina Rollo, Sameedh Sharma, Ben Shepherd and Jasmeer Virdee for their useful inputs and suggestions. The paper benefited from the comments of Luca Salvatici and the participants of the 9th International Conference "Economics of Global Interactions: New Perspectives on Trade, Factor Mobility and Development” in Bari, Italy on 11–12 September 2018, and the participants of Geneva Trade and Development Workshop on 17 October 2017, as well as editors and anonymous referees.
Conflicts of Interest
The authors declare no conflict of interest. The views expressed in this paper are those of the authors and do not necessarily coincide with those of International Trade Centre (ITC), United Nations (UN), Universal Postal Union (UPU), or the World Trade Organization (WTO). The designations employed and the presentation of material in this paper do not imply the expression of any opinion whatsoever on the part of ITC, UN, UPU or the WTO concerning the legal status of any country, territory, city or area or of its authorities, or concerning the delimitation of its frontiers or boundaries. Mention of firms, products and product brands does not imply the endorsement of ITC, UN, UPU, or the WTO.
Appendix A
Figure A1.
First stage, import content of exports and the average depth of trade agreements. Note: Authors’ calculations using panel data from Eora multi-regional input-output tables and the World Bank Enterprise Survey (fourth and fifth round). The model is estimated by Generalized Two-Stage Least Squares. First stage of 2SLS random effects regression is plotted.

Figure A2.
Second stage, competitiveness gap and import content of exports. Note: Authors’ calculations using a panel data from Eora Multi-Regional Input-Output tables and the World Bank Enterprise Survey (fourth and fifth round). The model is estimated by Generalized Two-Stage Least Squares. Second stage of 2SLS random effects regression is plotted. CS stands for competitiveness score.

Figure A3.
First stage, domestic value added that returns home and the average depth of agreements. Note: Authors’ calculations using panel data from Eora Multi-Regional Input-Output tables and the World Bank Enterprise Survey (fourth and fifth round). The model is estimated by Generalized Two-Stage Least Squares. First stage of 2SLS random effects regression is plotted.

Figure A4.
Second stage, competitiveness gap and domestic value added that returns home. Note: Authors’ calculations using panel data from Eora Multi-Regional Input-Output tables and World Bank Enterprise Survey (fourth and fifth round). The model is estimated by Generalized Two-Stage Least Squares. Second stage of 2SLS random effects regression is plotted. CS stands for competitiveness score.


Table A1.
Countries in the sample.
| Country | Available World Bank Enterprise Survey Years | Country | Available World Bank Enterprise Survey Years | ||
|---|---|---|---|---|---|
| Albania | 2007 | 2013 | Madagascar | 2009 | 2013 |
| Angola | 2006 | 2010 | Malawi | 2009 | 2013 |
| Argentina | 2006 | 2010 | Mali | 2007 | 2010 |
| Armenia | 2009 | 2013 | Mexico | 2006 | 2010 |
| Azerbaijan | 2009 | 2013 | Moldova | 2009 | 2013 |
| Bangladesh | 2007 | 2013 | Montenegro | 2009 | 2013 |
| Belarus | 2008 | 2013 | Namibia | 2006 | 2013 |
| Bhutan | 2009 | 2013 | Nepal | 2009 | 2013 |
| Bolivia | 2006 | 2010 | Nicaragua | 2006 | 2010 |
| Bosnia and Herzegovina | 2009 | 2013 | Nigeria | 2007 | 2013 |
| Botswana | 2006 | 2010 | Pakistan | 2007 | 2013 |
| Bulgaria | 2009 | 2013 | Panama | 2006 | 2010 |
| Burundi | 2006 | 2013 | Paraguay | 2006 | 2010 |
| Chile | 2006 | 2010 | Peru | 2006 | 2010 |
| Colombia | 2006 | 2010 | Poland | 2009 | 2013 |
| Congo, Democratic Republic of the | 2010 | 2013 | Romania | 2009 | 2013 |
| Croatia | 2007 | 2013 | Russian Federation | 2009 | 2012 |
| Czech Republic | 2009 | 2013 | Rwanda | 2006 | 2011 |
| Ecuador | 2006 | 2010 | Senegal | 2007 | 2013 |
| Estonia | 2009 | 2013 | Serbia | 2009 | 2013 |
| Georgia | 2008 | 2013 | Slovakia | 2009 | 2013 |
| Ghana | 2007 | 2013 | Slovenia | 2009 | 2013 |
| Guatemala | 2006 | 2010 | Tajikistan | 2008 | 2013 |
| Honduras | 2006 | 2010 | Tanzania | 2006 | 2013 |
| Hungary | 2009 | 2013 | Turkey | 2008 | 2013 |
| Kazakhstan | 2009 | 2013 | Uganda | 2006 | 2013 |
| Kenya | 2007 | 2013 | Ukraine | 2008 | 2013 |
| Kyrgyzstan | 2009 | 2013 | Uruguay | 2006 | 2010 |
| Lao PDR | 2009 | 2012 | Uzbekistan | 2008 | 2013 |
| Latvia | 2009 | 2013 | Venezuela, Bolivarian rep. of | 2006 | 2010 |
| Lithuania | 2009 | 2013 | Yemen | 2010 | 2013 |
| Macedonia, Republic of | 2009 | 2013 | Zambia | 2007 | 2013 |
References
- Acemoglu, Daron, Vasco Marques Carvalho, Asuman Ozdaglar, and Alireza Tahbaz-Salehi. 2012. The network origins of aggregate fluctuations. Econometrica 80: 1977–2016. [Google Scholar] [CrossRef] [Green Version]
- Amendolagine, Vito, Andrea Filippo Presbitero, Roberta Rabellotti, and Marco Sanfilippo. 2019. Local sourcing in developing countries: The role of foreign direct investments and global value chains. World Development 113: 73–88. [Google Scholar] [CrossRef]
- Asian Development Bank Institute and Asian Development Bank. 2015. Integrating SMEs into Global Value Chains: Challenges and Policy Actions in Asia. Mandaluyong City: Asian Development Bank Institute, Available online: https://0-muse-jhu-edu.brum.beds.ac.uk/book/47014/ (accessed on 28 January 2021).
- Baldwin, Richard, and Rebecca Freeman. 2020. Supply Chain Contagion Waves: Thinking Ahead on Manufacturing ‘Contagion and Reinfection’ from the COVID Concussion. VoxEU.org, CEPR Press. Available online: https://voxeu.org/article/covid-concussion-and-supply-chain-contagion-waves (accessed on 28 January 2021).
- Baldwin, Richard, and Javier Lopez-Gonzalez. 2015. Supply-chain Trade: A Portrait of Global Patterns and Several Testable Hypotheses. The World Economy 38: 1682–721. [Google Scholar] [CrossRef]
- Baldwin, Richard, and Eiichi Tomiura. 2020. Thinking ahead about the trade impact of COVID-19. In Economics in the Time of COVID-19. London: Centre for Economic Policy Research, p. 59. [Google Scholar]
- Baltagi, Badi Hani. 2013. Econometric Analysis of Panel Data, 5th ed. Chichester: John Wiley and Sons. [Google Scholar]
- Banh, Hang, Philippe Wingender, and Cheikh Anta Gueye. 2020. Global Value Chains and Productivity: Micro Evidence from Estonia. IMF Working Paper No. 117. Washington, DC: International Monetary Fund. [Google Scholar]
- Bas, Maria, and Vanessa Strauss-Kahn. 2014. Does importing more inputs raise exports? Firm-level evidence from France. Review of World Economics 150: 241–75. [Google Scholar] [CrossRef] [Green Version]
- Bonadio, Barthélémy, Zhen Huo, Andrei Levchenko, and Nitya Pandalai-Nayar. 2020. Global Supply Chains in the Pandemic. No. 0898–2937. Cambridge: National Bureau of Economic Research. [Google Scholar]
- Brancati, Emanuele, Raffaele Brancati, Dario Guarascio, Andrea Maresca, Manuel Romagnoli, and Antonello Zanfei. 2018. Firm-Level Drivers of Export Performance and External Competitiveness in Italy. Luxembourg: Publications Office of the European Union, Available online: https://data.europa.eu/doi/10.2765/598054 (accessed on 28 January 2021).
- Cusolito, Ana Paula, Raed Safadi, and Daria Taglioni. 2016. Inclusive Global Value Chains: Policy Options for Small and Medium Enterprises and Low-Income Countries. Directions in Development. Washington, DC: World Bank. [Google Scholar]
- Eaton, Jonathan, Samuel Kortum, and Francis Kramarz. 2011. An Anatomy of International Trade: Evidence from French Firms. Econometrica 79: 1453–98. [Google Scholar] [CrossRef] [Green Version]
- Falciola, Justine, Marion Jansen, and Valentina Rollo. 2020. Defining firm competitiveness: A multidimensional framework. World Development 129: 104857. [Google Scholar] [CrossRef]
- Gereffi, Gary, Stacey Frederick, and Penny Bamber. 2019. Diverse paths of upgrading in high-tech manufacturing: Costa Rica in the electronics and medical devices global value chains. Transnational Corporations: Investment and Development 26: 1–30. [Google Scholar]
- Gibbon, Peter, Jennifer Bair, and Stefano Ponte. 2008. Governing global value chains: An introduction. Economy and Society 37: 315–38. [Google Scholar] [CrossRef]
- Giovannetti, Giorgia, Enrico Marvasi, and Marco Sanfilippo. 2015. Supply Chains and the Internalization of SMEs: Evidence from Italy. Small Business Economics 44: 845–65. [Google Scholar] [CrossRef]
- Giuliani, Elisa, Carlo Pietrobelli, and Roberta Rabellotti. 2005. Upgrading in Global Value Chains: Lessons from Latin American Clusters. World Development 33: 549–73. [Google Scholar] [CrossRef]
- Grossman, Gene Michael, and Esteban Rossi-Hansberg. 2008. Trading Tasks: A Simple Theory of Offshoring. American Economic Review 98: 1978–97. [Google Scholar] [CrossRef] [Green Version]
- Hofmann, Claudia, Alberto Osnago, and Michele Ruta. 2017. Horizontal depth: A new database on the content of preferential trade agreements. In World Bank Policy Research Working Paper 7981. Washington, DC: World Bank, Available online: https://papers.ssrn.com/sol3/papers.cfm?abstract_id=2923535 (accessed on 21 January 2021).
- Javorcik, Beata Smarzynska, and Mariana Spatareanu. 2009. Tough Love: Do Czech Suppliers Learn from their Relationships with Multinationals? Scandinavian Journal of Economics 111: 811–33. [Google Scholar] [CrossRef] [Green Version]
- Koopman, Robert, Zhi Wang, and Shang-Jin Wei. 2014. Tracing Value-Added and Double Counting in Gross Exports. American Economic Review 104: 459–94. [Google Scholar] [CrossRef] [Green Version]
- Korwatanasakul, Upalat, and Sasiwimon Warunsiri Paweenawat. 2020. Trade, Global Value Chains, and Small and Medium-Sized Enterprises in Thailand: A Firm-Level Panel Analysis. ADBI Working Paper Series No. 1130. Tokyo: Asian Development Bank Institute, Available online: https://www.adb.org/sites/default/files/publication/604661/adbi-wp1130.pdf (accessed on 21 January 2021).
- Lenzen, Manfred, Daniel Moran, Keiichiro Kanemoto, and Arne Geschke. 2013. Building Eora: A Global Mulit-Region Input-Output Database at High Country and Sector Resolution. Economic Systems Research 25: 20–49. [Google Scholar] [CrossRef]
- Lopez Gonzalez, Javier. 2017. Mapping the Participation of ASEAN Small- and Medium- Sized Enterprises in Global Value Chains. 203 vols. OECD Trade Policy Papers No. 203. Paris: OECD Publishing. [Google Scholar] [CrossRef]
- Mazzarol, Timothy, and Sophie Reboud. 2020. Small Business Management. Singapore: Springer. [Google Scholar]
- Melitz, Marc. 2003. The impact of trade on intra-industry reallocations and aggregate industry productivity. Econometrica 71: 1695–725. [Google Scholar] [CrossRef] [Green Version]
- Mendoza, Adrian. 2020. What Matters for the GVC Entry and Exit of Manufacturing SMEs in the Philippines? No. 1147. ADBI Working Paper Series; Tokyo: Asian Development Bank Institute, p. 35. Available online: https://www.think-asia.org/bitstream/handle/11540/12109/adbi-wp1147.pdf?sequence=1 (accessed on 21 January 2021).
- Montalbano, Pierluigi, Silvia Nenci, and Carlo Pietrobelli. 2018. Opening and linking up: Firms, GVCs, and productivity in Latin America. Small Business Economics 50: 917–35. [Google Scholar] [CrossRef]
- Morris, Mike, and Cornelia Staritz. 2014. Industrialization Trajectories in Madagascar’s Export Apparel Industry: Ownership, Embeddedness, Markets, and Upgrading. World Development 56: 243–57. [Google Scholar] [CrossRef]
- Morrison, Andrea, Carlo Pietrobelli, and Roberta Rabellotti. 2008. Global Value Chains and Technological Capabilities: A Framework to Study Learning and Innovation in Developing Countries. Oxford Development Studies 36: 39–58. [Google Scholar] [CrossRef]
- Mueller, Ralph, and Gregory Hancock. 2001. Factor Analysis and Latent Structure, Confirmatory. International Encyclopedia of the Social & Behavioral Sciences, 5239–44. [Google Scholar]
- Papke, Leslie, and Jeffrey Marc Wooldridge. 2008. Panel data methods for fractional response variables with an application to test pass rates. Journal of Econometrics 145: 121–33. [Google Scholar] [CrossRef]
- Pietrobelli, Carlo, and Federica Saliola. 2008. Power relationships along the value chain: Multinational firms, global buyers and performance of local suppliers. Cambridge Journal of Economics 32: 947–62. [Google Scholar] [CrossRef] [Green Version]
- Ponte, Stefano. 2009. Governing through Quality: Conventions and Supply Relations in the Value Chain for South African Wine. Sociologia Ruralis 49: 236–57. [Google Scholar] [CrossRef]
- Ponte, Stefano, and Joachim Ewert. 2009. Which Way is “Up” in Upgrading? Trajectories of Change in the Value Chain for South African Wine. World Development 37: 1637–50. [Google Scholar] [CrossRef]
- Ponte, Stefano, and Timothy Sturgeon. 2014. Explaining governance in global value chains: A modular theory-building effort. Review of International Political Economy 21: 195–223. [Google Scholar] [CrossRef] [Green Version]
- Quast, Bastiaan, and Victor Kummritz. 2015. DECOMPR: A Global Value Chain Decomposition in R. Geneva: The Graduate Institute of International and Development Studies, Available online: http://repec.graduateinstitute.ch/pdfs/cteiwp/CTEI-2015-01.pdf (accessed on 21 January 2021).
- Ramelli, Stefano, and Alexander F. Wagner. 2020. Feverish Stock Price Reactions to Covid-19. The Review of Corporate Finance Studies 9: 622–55. [Google Scholar] [CrossRef]
- Reddy, Ketan, and Subash Sasidharan. 2020. Driving Small and Medium-Sized Enterprise Participation in Global Value Chains: Evidence from India. ADBI Working Paper Series No. 1118. Tokyo: Asian Development Bank Institute, Available online: https://www.adb.org/sites/default/files/publication/579781/adbi-wp1118.pdf (accessed on 21 January 2021).
- Stellinger, Anna, Ingrid Berglund, and Henrik Isakson. 2020. How trade can fight the pandemic and contribute to global health. COVID-19 and Trade Policy: Why Turning Inward Won’t Work 21: 21–30. [Google Scholar]
- Stone, Susan, and Ben Shepherd. 2011. Dynamic Gains from Trade: The Role of Intermediate Inputs and Equipment Imports. In OECD Trade Policy Papers. No. 110. Paris: OECD Publishing. [Google Scholar] [CrossRef]
- Taglioni, Daria, and Deborah Winkler. 2016. Making Global Value Chains Work for Development. Washington, DC: World Bank. [Google Scholar] [CrossRef]
- Vidavong, Chanhphasouk. 2019. Roles of Global Value Chains (GVCs) in Promoting Small and Medium-Sized Enterprises (SMEs) in Laos. Forum of International Development Studies 50: 1–20. [Google Scholar] [CrossRef]
- Wang, Zhi, Shang-Jin Wei, and Kunfu Zhu. 2013. Quantifying International Production Sharing at the Bilateral and Sector Levels. National Bureau of Economic Research. Available online: www.nber.org/papers/w19677 (accessed on 21 January 2021).
- World Trade Organization. 2016. World Trade Report 2016: Leveling the Trading Field for SMEs. Geneva: World Trade Organization. [Google Scholar]
- Wynarczyk, Pooran, and Robert Watson. 2005. Firm Growth and Supply Chain Partnerships: An Empirical Analysis of U.K. SME Subcontractors. Small Business Economics 24: 39–51. [Google Scholar] [CrossRef]
Figure 1.
Competitiveness score and firm sales. Source: Authors’ calculations using panel data from the World Bank Enterprise Survey.
Figure 1.
Competitiveness score and firm sales. Source: Authors’ calculations using panel data from the World Bank Enterprise Survey.

Figure 2.
Evolution of the competitiveness gap, large firms vs. small firms. Source: Authors’ calculations using panel data from the World Bank Enterprise Survey. The values are for all firm-specific scores in the first and second waves of the surveys (fourth and fifth round).
Figure 2.
Evolution of the competitiveness gap, large firms vs. small firms. Source: Authors’ calculations using panel data from the World Bank Enterprise Survey. The values are for all firm-specific scores in the first and second waves of the surveys (fourth and fifth round).

Figure 3.
Decomposition of gross exports at the country level. Source: Koopman et al. (2014).
Figure 3.
Decomposition of gross exports at the country level. Source: Koopman et al. (2014).

Figure 4.
Backward participation and the competitiveness gap. Source: Authors’ calculations using panel data from Eora Multi-Regional Input-Output tables and the World Bank Enterprise Surveys. Backward participation (also referred to as VS, vertical specialization, or import content of exports) is the sum of foreign value added and the double counted import content of exports. CS stands for competitiveness score.

Figure 5.
Double counting component and the competitiveness gap. Source: Authors’ calculations using Eora Multi-Regional Input-Output tables and the World Bank Enterprise Survey. CS stands for competitiveness score.
Figure 5.
Double counting component and the competitiveness gap. Source: Authors’ calculations using Eora Multi-Regional Input-Output tables and the World Bank Enterprise Survey. CS stands for competitiveness score.

Figure 6.
Domestic value added in intermediate goods that returns home and the competitiveness gap. Source: Authors’ calculations using panel data from Eora Multi-Regional Input-output tables and the World Bank Enterprise Survey. Forward linkages here are measured by the value of intermediates that returns home, i.e., to be consumed in the domestic market (VS1*). CS stands for competitiveness score. DVA stands for domestic value added.

Figure 7.
Domestic value in intermediate imports that are re-exported and the competitiveness gap. Source: Authors’ calculations using panel data from Eora Multi-Regional Input-Output tables and the World Bank Enterprise Survey (fourth and fifth round). Forward linkages here are measured by the domestic value of intermediate imports that are re-exported by the partner country (VS1). CS stands for competitiveness score. DVA stands for domestic value added.

Figure 8.
Causality diagram behind the identification strategy. Source: Authors’ elaboration. Arrows indicate the expected direction of causality.
Figure 8.
Causality diagram behind the identification strategy. Source: Authors’ elaboration. Arrows indicate the expected direction of causality.

Table 1.
Effect of global value chain (GVC) participation on competitiveness, baseline results.
| Model | Fractional Probit, Marginal Effects | |||||
|---|---|---|---|---|---|---|
| (1) | (2) | (3) | (4) | (5) | (6) | |
| Dependent variable: | Competitiveness score | Competitiveness score | Competitiveness score | Competitiveness score | Competitiveness score | Competitiveness score |
| GVC participation x Small | - | 0.400 *** | 0.462 *** | - | 0.383 *** | 0.510 *** |
| (0.089) | (0.083) | (0.072) | (0.091) | |||
| GVC participation x Medium-sized | - | 0.300 *** | 0.365 *** | - | 0.264 *** | 0.388 *** |
| (0.090) | (0.080) | (0.066) | (0.092) | |||
| GVC participation x Large | - | 0.136 | 0.191 ** | - | 0.121 * | 0.241 *** |
| (0.086) | (0.081) | (0.068) | (0.089) | |||
| GVC participation | 0.243 *** | 0.200 ** | ||||
| (0.072) | (0.086) | |||||
| Observations | 378 | 378 | 378 | 378 | 378 | 378 |
| Firm size FE | NO | YES | YES | YES | YES | YES |
| Country-firm size effects | NO | NO | NO | YES | YES | YES |
| Year FE | NO | NO | YES | YES | NO | YES |
Standard errors in parentheses. *** p < 0.01, ** p < 0.05, * p < 0.1. Note: Bootstrapped standard errors based on 100 replications.
Table 2.
Effect of GVC participation on competitiveness; fractional probit with endogenous variables.
Table 2.
Effect of GVC participation on competitiveness; fractional probit with endogenous variables.
| Model | Fractional IV Probit | |
|---|---|---|
| (1) | (2) | |
| Dependent variable: | Competitiveness score | Competitiveness score |
| GVC participation | 0.697 *** | - |
| (0.062) | ||
| GVC participation x Small | - | 0.817 *** |
| (0.079) | ||
| GVC participation x Medium-sized | - | 0.698 *** |
| (0.071) | ||
| GVC participation x Large | - | 0.562 *** |
| (0.083) | ||
| Observations | 378 | 378 |
| Firm size FE | YES | YES |
| Country-firm size effects | YES | YES |
| Year FE | YES | YES |
Standard errors in parentheses. *** p < 0.01. Bootstrapped standard errors based on 100 replications. Note: The instrument for the first stage is the average depth a country’s trade agreements.
Table 3.
Effect of GVC participation on competitiveness; linear models as a robustness check.
| Model | Linear | Linear 2SLS | ||
|---|---|---|---|---|
| (1) | (2) | (3) | (4) | |
| Dependent variable: | Competitiveness score | Competitiveness score | Competitiveness score | Competitiveness score |
| GVC participation x Small | - | - | 0.480 *** | - |
| (0.089) | ||||
| GVC participation x Medium-sized | - | - | 0.370 *** | - |
| (0.081) | ||||
| GVC participation x Large | - | - | 0.204 ** | - |
| (0.081) | ||||
| GVC participation | 0.254 *** | 0.349 *** | 0.729 *** | |
| (0.072) | (0.052) | (0.082) | ||
| Constant | 0.398 *** | 0.225 *** | 0.168 *** | 0.093 *** |
| (0.036) | (0.024) | (0.039) | (0.033) | |
| Observations | 378 | 378 | 378 | 378 |
| Firm size FE | NO | YES | YES | YES |
| Country-firm size RE | YES | YES | YES | YES |
| Year FE | YES | YES | YES | YES |
Robust standard errors in parentheses. *** p < 0.01, ** p < 0.05.
Table 4.
Forward integration and competitiveness gap.
| Model | Random Effects | |
|---|---|---|
| (1) | (2) | |
| Dependent variable: | Competitiveness gap | Competitiveness gap |
| Domestic value added that returns home (% of gross exports) | −12.19 *** | - |
| (4.263) | ||
| Domestic value of intermediate imports re-exported (% of gross exports) | - | −0.070 |
| (0.153) | ||
| Constant | 33.27 *** | 32.33 *** |
| (1.274) | (3.195) | |
| Observations | 124 | 124 |
| Number of Countries | 63 | 63 |
Standard errors in parentheses. *** p < 0.01.
Table 5.
Backward integration and competitiveness gap.
| Model | Random Effects | ||
|---|---|---|---|
| (1) | (2) | (3) | |
| Dependent variable: | Competitiveness gap | Competitiveness gap | Competitiveness gap |
| Foreign content of exports (% of gross exports) | −0.207 *** | - | - |
| (0.061) | |||
| Double counting from foreign sources, (% of VS) | - | −0.388 *** | - |
| (0.113) | |||
| Foreign value added in intermediate goods (% of VS) | - | - | 0.148 |
| (0.095) | |||
| Constant | 35.82 *** | 41.33 *** | 24.69 *** |
| (1.722) | (3.160) | (4.146) | |
| Observations | 126 | 126 | 126 |
| Number of Countries | 64 | 64 | 64 |
Standard errors in parentheses. *** p < 0.01. Note: VS or vertical specialization denotes the foreign content of exports.
Table 6.
GVC participation and competitiveness gap, preferred models (2SLS).
| Model | Generalized Two-Stage Least Squares with IV | ||
|---|---|---|---|
| (1) | (2) | (3) | |
| Dependent variable: | Competitiveness gap | Competitiveness gap | Competitiveness gap |
| Foreign content of exports (% of gross exports) | −0.357 *** | - | - |
| (0.100) | |||
| Domestic value added that returns home (% of gross export) | - | −27.25 *** | - |
| (7.819) | |||
| GVC participation index | - | - | −0.368 *** |
| (0.094) | |||
| Constant | 39.41 *** | 36.16 *** | 47.05 *** |
| (2.548) | (1.756) | (4.203) | |
| Observations | 124 | 124 | 126 |
| Number of Countries | 63 | 63 | 64 |
Standard errors in parentheses. *** p < 0.01. Note: The model is estimated by Generalized Two-Stage Least Squares. The instrument in the first stage is the average depth of a country’s trade agreements. The F-statistic passes the weak instrument test.
Table 7.
Robustness check, firm-level backward GVC participation and competitiveness score.
| Model | Linear | |
|---|---|---|
| (1) | (2) | |
| Dependent variable: | Competitiveness Score | Competitiveness Score |
| Domestic firm’s share of imported inputs | 0.0839 *** | 0.136 *** |
| (0.00295) | (0.00787) | |
| Number of full-time employees (in logs) | 7.157 *** | 7.665 *** |
| (0.0747) | (0.104) | |
| Domestic firm’s share of imported inputs * Number of full-time employees (in logs) | - | −0.0154 *** |
| (0.00198) | ||
| Constant | 28.60 *** | 26.77 *** |
| (1.845) | (1.861) | |
| Observations | 31,359 | 31,359 |
| R-squared | 0.455 | 0.456 |
| Country FE | Yes | Yes |
| Year FE | Yes | Yes |
Robust standard errors in parentheses. *** p < 0.01. * p < 0.1.
Table 8.
Robustness check, firm-level forward GVC participation and competitiveness score.
| Model | Linear | |
|---|---|---|
| (1) | (2) | |
| Competitiveness score | Competitiveness score | |
| Multinational share of inputs from domestic suppliers | −0.0532 *** | −0.172 *** |
| (0.00685) | (0.0226) | |
| Number of full-time employees (in logs) | 4.360 *** | 2.823 *** |
| (0.171) | (0.275) | |
| Multinational share of inputs from domestic suppliers * Number of full-time employees (in logs) | - | 0.0280 *** |
| (0.00444) | ||
| Constant | 41.45 *** | 47.93 *** |
| (4.262) | (4.320) | |
| Observations | 3940 | 3940 |
| R-squared | 0.330 | 0.338 |
| Country FE | Yes | Yes |
| Year FE | Yes | Yes |
Robust standard errors in parentheses. *** p < 0.01. * p < 0.1.
Publisher’s Note: MDPI stays neutral with regard to jurisdictional claims in published maps and institutional affiliations. |
© 2021 by the authors. Licensee MDPI, Basel, Switzerland. This article is an open access article distributed under the terms and conditions of the Creative Commons Attribution (CC BY) license (http://creativecommons.org/licenses/by/4.0/).
Share and Cite
MDPI and ACS Style
Boffa, M.; Jansen, M.; Solleder, O. Participating to Compete: Do Small Firms in Developing Countries Benefit from Global Value Chains? Economies 2021, 9, 12. https://0-doi-org.brum.beds.ac.uk/10.3390/economies9010012
AMA Style
Boffa M, Jansen M, Solleder O. Participating to Compete: Do Small Firms in Developing Countries Benefit from Global Value Chains? Economies. 2021; 9(1):12. https://0-doi-org.brum.beds.ac.uk/10.3390/economies9010012
Chicago/Turabian StyleBoffa, Mauro, Marion Jansen, and Olga Solleder. 2021. "Participating to Compete: Do Small Firms in Developing Countries Benefit from Global Value Chains?" Economies 9, no. 1: 12. https://0-doi-org.brum.beds.ac.uk/10.3390/economies9010012
Note that from the first issue of 2016, this journal uses article numbers instead of page numbers. See further details here.