Administrative Costs and Tariff Rates in the Presence of Customs Evasion: Evidence from Ecuador

1
Economics and Business Management, University of Alcala (UAH), 28802 Alcala de Henares, Spain
2
Department of Applied Economics, University of Alcala (UAH), 28802 Alcala de Henares, Spain
*
Authors to whom correspondence should be addressed.
Economies 2021, 9(1), 21; https://0-doi-org.brum.beds.ac.uk/10.3390/economies9010021
Submission received: 29 November 2020
/
Revised: 29 January 2021
/
Accepted: 2 February 2021
/
Published: 8 February 2021
Abstract
:This paper seeks to assess the effectiveness of customs policies in increasing the resources devoted to controlling and inspection. Specifically, it seeks to analyze whether an increase in the administrative cost of collecting taxes on foreign trade in Ecuador contributes to reducing customs fraud. To this end, we identify and estimate a transfer function model (ARIMAX), considering information on foreign trade such as official international trade statistics report and tariff rates, as well as the execution of budgetary expenditure and Ecuador’s gross domestic product (GDP). The period under study includes quarterly series from 2006 to 2018. The results obtained by the model indicate that allocating greater material and budgetary resources to combat customs fraud does not always achieve the objective of reducing customs evasion.
JEL Classification:
E62; F1; H21; H26; K421. Introduction
After 2007, Ecuador implemented the policy of selective import substitution—policies to restrict imports of manufactured goods—with the objective of strengthening national production and decelerating the trade deficit. The main objective is to shift from an economy founded on the agricultural and extractive sectors to one based on higher value-added manufacturing and services. Before 2007, the industrial sector’s share was less than 13% of the GDP, so the government set itself to reach, at least until 2017, a share of 25% of the GDP.
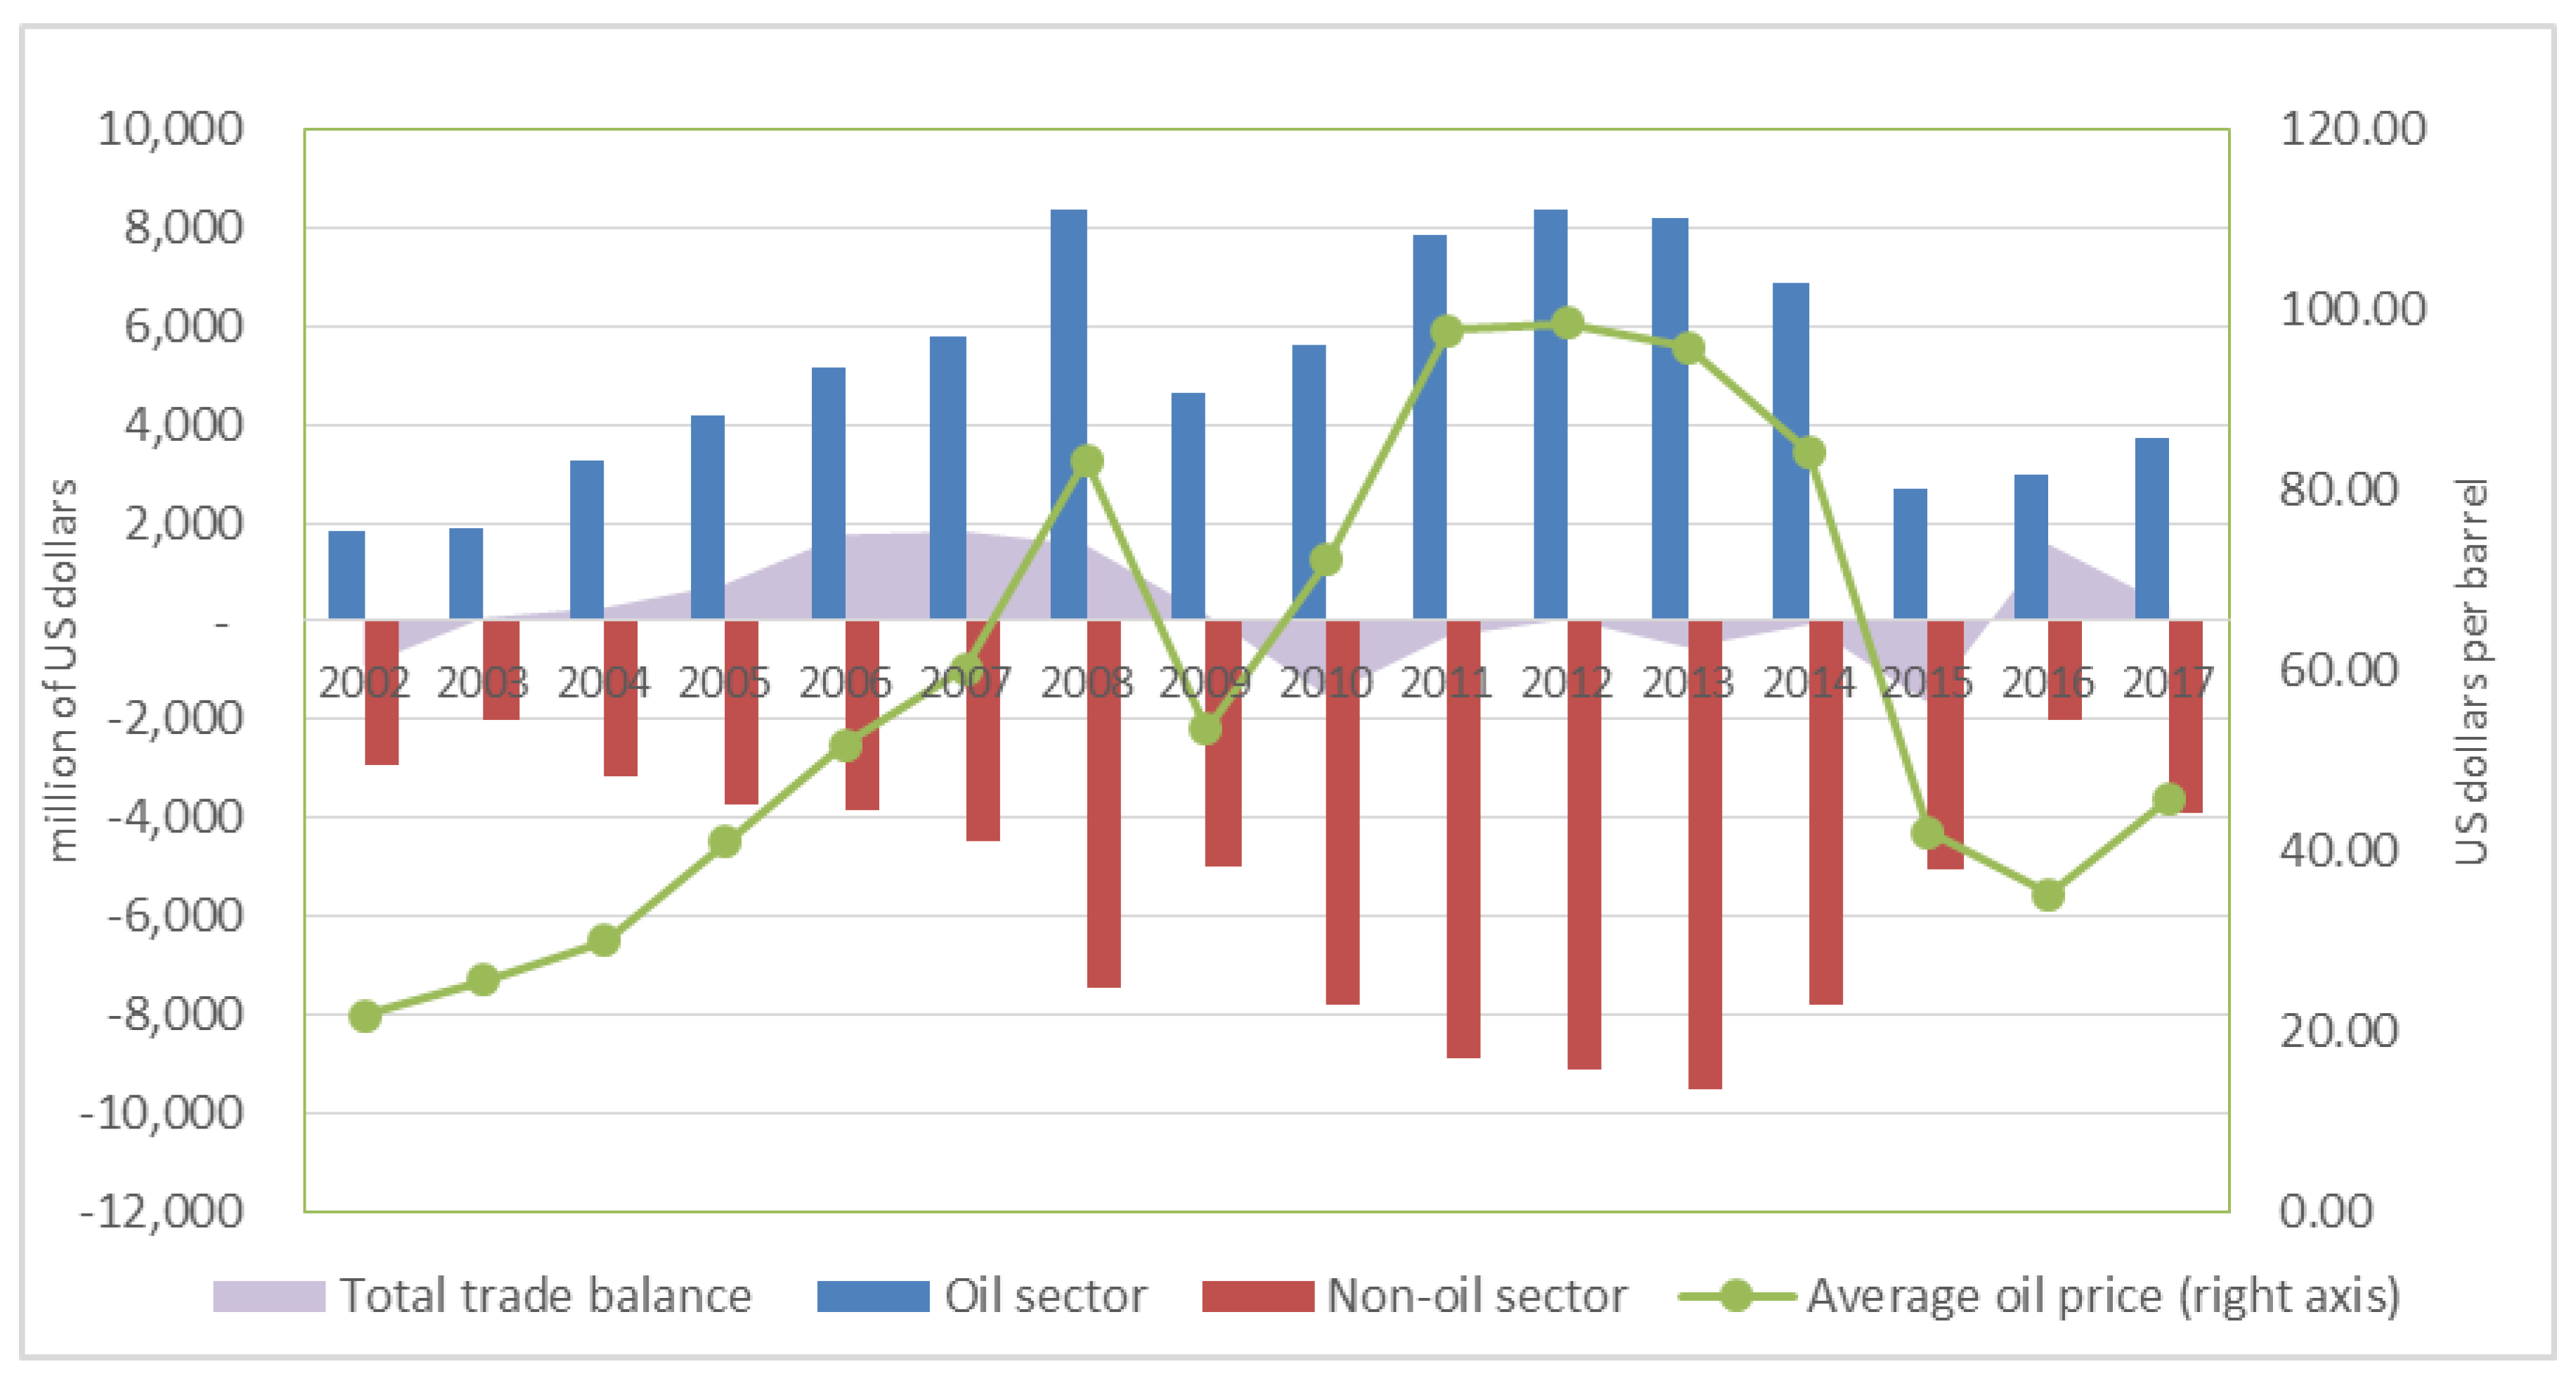
An additional objective was to control trade flows. The US dollar is the national currency in Ecuador and has legal tender status since March 2000. Therefore, fiscal and trade policy are the essentials tools of Ecuador’s government for macroeconomic adjustment. The dollarization of Ecuador’s economy showed the lack of diversification of production and exports. For example, Ecuador’s trade balance prior to the dollarization of the economy (1990–1999) averaged US$ 791 million, while in dollarization (2000–2017), the trade balance was in deficit with an average of US$ −27 million (Central Bank of Ecuador 2018a). The oil trade balance has historically enjoyed a surplus, largely driven by high international oil prices. The non-oil trade balance, on the other hand, has a long and growing history of deficit (Figure 1).
To support the selective import substitution economic policy, a series of reforms and measures were necessary, such as, for instance:
- (a)
- The creation of some trade policy-governing entities and suppression of other to provide a greater institutional framework for changing the production structure. Among the most important elements are the creation of the Ministry of Foreign Trade and Investment and the Foreign Trade Committee, the entity responsible for approving public policies on trade;
- (b)
- The public investment plan was ambitious and grew considerably from 7.5% of GDP in 2007 to 17% of GDP in 2014, decelerating to 10.6% of GDP in 2017 due to an economic recession driven by the weakening of the international price of oil and the appreciation of the US dollar, which is the legal tender in Ecuador. The government prioritized public investment in production and the strategic sectors identified as priorities for changing the productive matrix. Other sectors targeted for investment were social and human development, security and justice, economic policy and patrimony;
- (c)
- Between 2007 and 2017, the simple average applied most favored nation1 (MFN) tariff went from 11.7% to 12.2% (all products), from 14.6% to 18.3% (agricultural) and from 11.3% to 11.2% (non-agricultural) (World Tariff Profiles 2008, 2018). Among the products with the highest average tariff between 2007 and 2017 are dairy products (18.9% to 32.8%), sugar and confectionery (14.5% to 12.7%), animals and their products (17.1% to 28.2%), and fish and their products (19% to 25.4%). Likewise, the clothing sector experiences tariff increases from 20% to 22.7%. The sector of textiles (17.5% to 18.1%), leather and footwear (12.9% to 13.6%), electrical machinery (10.1% to 10.6%), manufacturing (13.3% to 15.8%) and transportation material (10.5% to 12.1%) continue with the same protectionist pace. Additionally, tariffs suffer an additional increase in certain years, the most representative being 2009, 2013, 2014 and 2015;
- (d)
- In 2009, the country began applying compounds duties to different products such as clothing, footwear, alcoholic beverages, motor vehicles, etc.; it affected to five percent of harmonized system (HS) subheadings;
- (e)
- In 2009, 2015 and 2016, the government resorted to the implementation of a safeguard measure to compensate the balance of payments. The measure applied as a tariff surcharge to approximately 38% of the corresponding tariff subheadings. The level of the tariff surcharge varied between 5% and 45%, with the 25% and 45% surcharges levied on 58.6% of the universe of products subject to the safeguard measure;
- (f)
- For the period 2011–2018, the applied MFN tariff had already exceeded the bound tariff by 28% of the total set of tariff lines, according to Ecuador’s Trade Policy Review Report;
- (g)
- Within the period 2007 and 2017, some reforms introduced in relation to control requirements prior to import; for example, the requirement for inspection at origin eliminated. On the other hand, a series of measures and requirements applied to allow the import of certain products such as cotton, clothing, fruits and vegetables, among others. These measures include the use of an importer registry, certificate of recognition, automatic and non-automatic import licenses, certificates of recognition for products subject to technical regulations, as well as import quotas for motor vehicles and cell phones;
- (h)
- The customs administration chose to prioritize a risk management system in order to reduce physical inspections in dispatch, as well as to strengthen audits in a post-clearance phase.
Despite all the efforts and improvements, however, Ecuador continues to present serious problems of fiscal imbalance and customs fraud. Public spending has grown rapidly and in an unsustainable way, from 24.1% of GDP (2007) to 36.5% of GDP (2017). This fact caused the gradual growth of the public deficit, which was unsustainable at a time when the price of Ecuadorian oil was falling (8.26% of GDP, 2016).
The rise in tariff rates encouraged the commission of illegal customs, especially on products such as alcoholic beverages, textiles and clothing, cell phones, shoes, tires, liquefied petroleum gas and other perishables. National Customs Service of Ecuador (SENAE) statistics show rising merchandise seizure figures year after year. Between 2015 and 2018, the aforementioned institution estimated a loss of US$ 2 billion in revenue (De La Torre 2017; SENAE 2017). According to some researchers, the customs control policy is not sufficient; for every new control established at the border, smugglers devise five new unauthorized border crossings (FLACSO 2015).
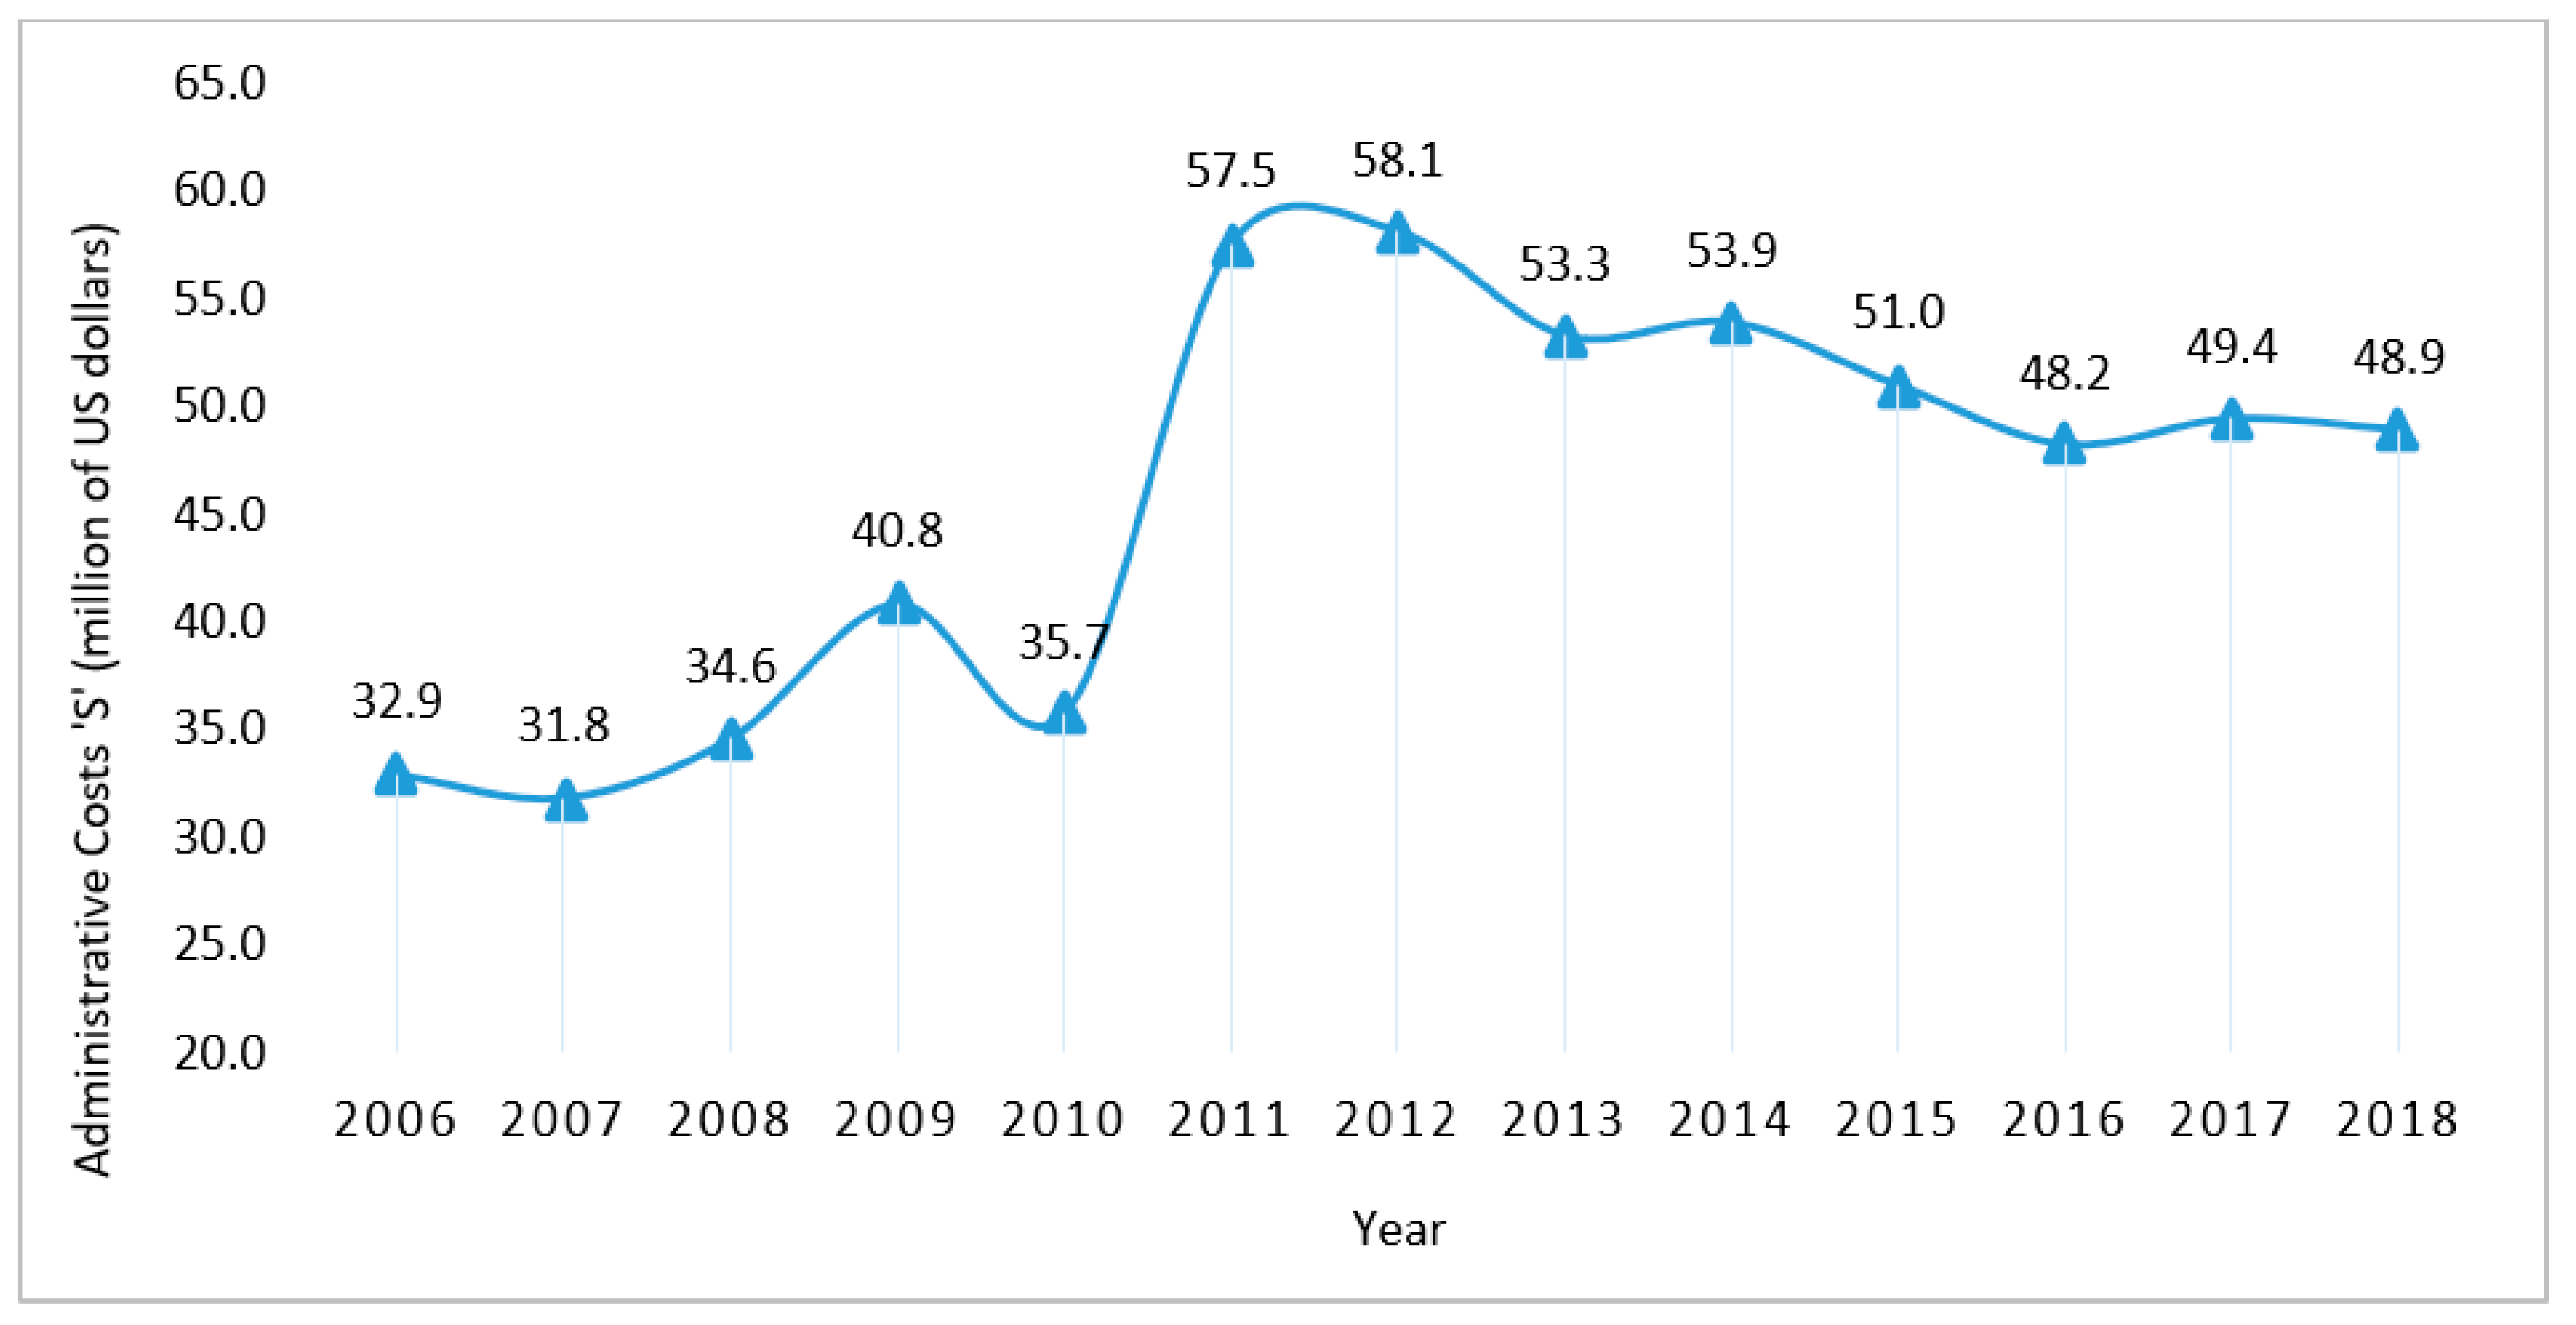
The efforts that the SENAE has made to fight against illegal customs have been immense. It is from legal reforms to increase considerable fines and penalties to intensifying controls with specialized equipment such as drones, X-ray machines, police dogs, motor vehicles, staff, computer equipment and systems, etc. An example of this is that the institutional budget went from 31.8 (2007) to 49.4 (2017) million US dollars in nominal value, with amounts equal to 57.5 million US dollars in 2011 and 58.1 million US dollars in 2012 due to investment in technology and capital goods (Figure 2). The labor force also increased from 1811 to 1906 civil servants between 2007 and 2017.
In 2017, the SENAE considered that the monetary resources were insufficient to continue fighting against illegal customs. At that time, expanding the institutional budget was not a viable option; the country was already in the process of economic contraction. To face its debts, it resorted to pre-sale of oil, placement of sovereign state bonds at rates around 10% and using the Central Bank of Ecuador as a lender. In view of the evident need to continue with the fiscal adjustment plan, the SENAE was unable to request a larger budget from the central government. Thus, in November 2017, Ecuador implemented a customs control service fee with the objective of having more monetary resources to deal with activities to combat smuggling and customs fraud (Resolution No. SENAE-2017–001-RE-M 2017). Its calculation corresponded to the division of the net weight declared by imported merchandise (grams) for a control unit established by SENAE and variable by tariff subheading (grams), the result of this division must be multiplied by US$ 0.10. This issue raised some controversy: the private sector pointed out that its creation was unfair, discriminatory and irrational. That is because its purpose was to subsidize control activities that, by their nature, are the responsibility of the customs administration itself. Subsequently, the customs control service fee was repealed by Resolution No. SENAE-SENAE-2018-0003-RE of 7 June 2018.
Currently, the country is working on a series of reforms that will allow it to deal with the public debt. However, in terms of trade policy, little has been said about the impact that tariff levels have on public spending and whether they favor the environment for national production. Therefore, it is convenient to analyze the impact of public spending in circumstances where tariff levels are restrictive. For this purpose, we will compare different approaches. We focus on the Chilean case study for the following reasons: Chile is a Latin American country with easy access to high-quality official information, which allows for the construction of an adequate time-series of data. In addition, the case of Chile (free trade) contrasts with that of Ecuador (protectionism) in terms of trade policy.
2. Related Literature
Allingham and Sandmo (1972) developed an explanatory model on the behavior of tax evaders, inspired by the theory of criminal behavior puts forward by Becker (1968) and the portfolio theory of Arrow (1965) and Stiglitz (1969). In the model of “economic deterrence of tax behavior”, (Allingham–Sandmo), they evaluate the decision that a taxpayer, averse to risk, will make between declaring total or partial payment of his taxes considering the following elements: the rate of the tax and the profits and/or losses (penalty) that would take place before the probability of being detected or not. If the taxpayer is risk-averse, the expected profit function is concave and increasing. It means that the individual will commit tax evasion in situations involving low-risk, thus disregarding high-risk situations, even if the expected profit is high. In this sense, the evader’s behavior is determined by a function that maximizes his expected benefit, whose only deterrent effect is the probability of detection and punishment. However, the Allingham–Sandmo model received criticism for the effect of tax rates since if these are increased, and the level of fines remains unchanged. It could happen that the gains from evasion (substitution effect) are greater than the individual’s after-tax disposable income (income effect), so a tax increase would stimulate tax evasion. Consequently, the theoretical appreciation of the model that suggests that the higher the level of inspection and fine, the lower the amount evaded is incomplete.
Later, Yitzhaki (1974) would modify the model of Allingham and Sandmo (1972) to tax the fine as a proportion of the tax evaded, as opposed to the unreported income. He concludes that an increase in the tax rate, a higher level of audits and fines would influence greater tax compliance, maintaining the assumption of absolute risk aversion. This particularity would also attract the attention of other researchers. In practice, it is evident that certain countries have a high level of tax compliance, despite having a low-level of audits and relatively high tax rates. The literature includes researchers such as Friedland et al. (1978); Clotfelter (1983); Slemrod (1985); Crane and Nourzad (1986); Baldry (1987); Poterba (1987); Alm et al. (1992) and Park and Hyun (2003). They provide strong evidence that the higher tax rates heighten the risk of tax evasion, thus contradicting one of Yitzhaki’s (1974) findings. As for the degree of audit and penalties, Witte and Woodbury (1985), Dubin and Wilde (1988); Dubin et al. (1990); Evans et al. (2005); Dubin (2007); support the model of Allingham and Sandmo (1972), arguing that the greater the likelihood of a tax audit, the lesser the degree of evasion.
However, other research contradicts the effect of fines on tax compliance; for example, Alm et al. (1992); Pommerehne and Weck-Hannemann (1996); Doob and Webster (2003) concluded that the impact of fines on collected revenues is zero. Tauchen et al. (1993); Pommerehne and Weck-Hannemann (1996) find evidence of the slight effect of being audited on improving tax compliance. Similarly, Alm et al. (1992) draw attention to how the deterrent effect of a large number of audits decreases over time. Now, Barone and Mocetti (2009), for the case of municipal taxes in Italy, found evidence that fiscal morale tends to increase when the taxpayer perceives and observes that the government is efficient. The evidence can interpret as meaning that if the government spends public resources more efficiently, the taxpayer is more inclined to pay taxes; conversely, unwillingness to pay taxes would translate into the taxpayer punishing the government when it sees that resources are not properly spent.
Certainly, the effect of the increased administrative cost to improve tax compliance does not yet know in customs matters. However, in the area of internal taxes, two studies of interest can mention that we will take as a basis for exploring the problem of customs evasion. One of them carried out by Agha and Haughton (1996) for 17 countries of the Organization for Economic Cooperation and Development (OECD), who estimated that an increase of one percentage point in the value-added tax (VAT) rate impacts the compliance rate with a decrease of 2.7 percentage points. Furthermore, an average increase of one percentage point in administrative costs/revenue from VAT affects an increase of 12 percentage points in the compliance rate. Additionally, they found that a 1-percentage point increase in the number of differential VAT rates impacts increasing the compliance rate by seven percentage points. Subsequently, Engel et al. (2001), based on the model proposed by Agha and Haughton (1996), replaced the dependent variable “compliance rate” with “VAT collection as a proportion of GDP”. Studying the case of Chile, they found that a 1-percentage point increase in the proportion of administrative costs as a percentage of GDP influences a 0.34 percentage point increase in VAT collection. At the same time, the two studies concluded that increased administrative cost improves tax collection. In the present investigation, it is important to analyze whether it is possible to reach the same conclusion in the face of significant levels of tariff rates.
3. Methodology and Data
We now focus on analyzing whether the administrative cost for the collection of taxes on foreign trade has had an impact on customs fraud. For this purpose, we will use a transfer function model with the presence of outliers, which is a multivariate time-series model (Box et al. 2016). Taking into account the recommendation of Box and Jenkins (Pérez 2011) regarding the minimum number of observations for this type of model, about 50 quarterly “q” observations will be used from the first quarter of 2006 (2006q1) to the second quarter of 2018 (2018q2), according to the information available.
For the construction of the model, the motivation assumed by Agha and Haughton (1996) will be followed, where it is expected that the evasion rate “e” will increase with tariff rates “τ” and decrease with the highest level of spending “S/R”. Additionally, the model will consider the variation of the GDP with respect to its delay, taking into account the observations of some authors such as Engel et al. (2001); Sancak et al. (2010). They found evidence that the evasion presents behavior that varies with economic cycles. In this respect, the lack of fiscal compliance tends to increase in periods of crisis or recession. That is to say; the individual will be predisposed to run a greater risk in order to maximize their profits. Adapted to the customs context, the objective function of our model would present the following form:
where:
log (1 − et) = α + β log (S/R)t + γ log (τ) t + δ log (PIB/PIB−1)t + at
α, constant term of the equation
β, γ, δ, elasticity coefficients. It is a number that measures the percentage change that will occur in the voluntary compliance rate when the ratio between institutional spending and Ecuador’s customs collection “S/R”, a simple average of MFN applied duties (percentage) “τ” and the ratio between the gross domestic product and its lag (GDP/GDP−1), respectively, changes one percent.
Log (1 − e) is the logarithm of the dependent variable, defined as the voluntary compliance rate. The rate of evasion “e” is obtained by dividing: the difference between the value of imports “I” and exports “E” in absolute terms for the value of exports “E”, in million of US$ FOB (Bhagwati 1964; Fisman and Wei 2001; Javorcik and Narciso 2008). “I” corresponds to the declared value of imports reported by Ecuador, and “E” corresponds to the exports reported by Ecuador’s trading partners (mirror imports)2 at one time. The export-related information “E” has been obtained from the Trade Map (2018), a database developed by the International Trade Centre (ITC) in cooperation with the United Nations Conference on Trade and Development (UNCTAD) and the World Trade Organization (WTO). With regard to the trade flows of imports “I”, the information in Trade Map only records the value of imports in CIF terms. Therefore, in order to avoid errors and achieve the greatest possible coincidence of import and export flows, we will use the foreign trade database of the Central Bank of Ecuador (2018c), which presents information on the FOB value of imports made “I” by Ecuador.
Log S/R is defined as the logarithm of the institutional expenditure “S” on the Ecuadorian collection of taxes and customs duties “R” in millions of US$, for a time “t”. In other words, it relates to the administrative costs “S” as a percentage of revenue collections “R”. The revenue bodies most commonly use the ratio “cost of the collection” as a surrogate measure of the efficiency/effectiveness of their administration (Centre for Tax Policy and Administration 2010). In fact, yields of the expenditures, among other things, are an appropriate variable for analyzing whether it is a good idea to increase the budget of the agencies in charge of collecting taxes (Engel et al. 2001). The Administrative costs “S” were the costs incurred by the Ecuadorian Customs in order to administer the tax system (government’s current, capital and investment spending). “R” includes customs duties, special consumption tax (ICE), value-added tax on imports (VAT), development fund for children (FODINFA), safeguards for the years that they were in force, as well as other items such as procedural costs, fines, safeguards, customs control service fee (TSCA), etc. “S” and “R” are obtained from the budgetary execution of the National Customs Service of Ecuador (2018), whose data are reported by the institution itself through the Web site for Transparency Portal of the National Customs Service of Ecuador (2018) or otherwise under application forms.
Log τ it corresponds to the logarithm of the simple average of the most favored nation (MFN) applied duties (percentage) of Ecuador at time t. These data were obtained from “(Tariff Profiles in the World n.d.)”, a joint annual publication of the World Trade Organization (WTO), International Trade Centre (ITC) and the United Nations Conference on Trade and Development (UNCTAD).
Log (GDP/GDP−1) refers to the logarithm of the ratio of the year’s GDP (n) to the year’s GDP (n − 1), at constant 2007 prices, expressed in millions of US$ for a time “t”. This information was obtained from the database of the Central Bank of Ecuador (2018d).
at, white noise.
4. Results and Discussion
Table 1 presents the descriptive statistics of the variables used in the model for the case of Chile and Ecuador. At first glance, it could seem that, on average, Chile has a better voluntary compliance rate. That is, a lower degree of evasion, and its collection cost is much more efficient than in the Ecuadorian case. The simple average of the tariffs applied in Chile presents a level approximately 100% lower than the average level of the tariffs applied in Ecuador. Likewise, the standard deviation is significantly different between Chile (0.0047) and Ecuador (0.8872); Chile’s tariff rate remains practically constant during the study period, while the standard deviation of the tariff rate in Ecuador presents greater variability. On the other hand, Chile experienced a greater variation in productivity (GDP) than Ecuador during the study period.
4.1. Ecuador Case Study
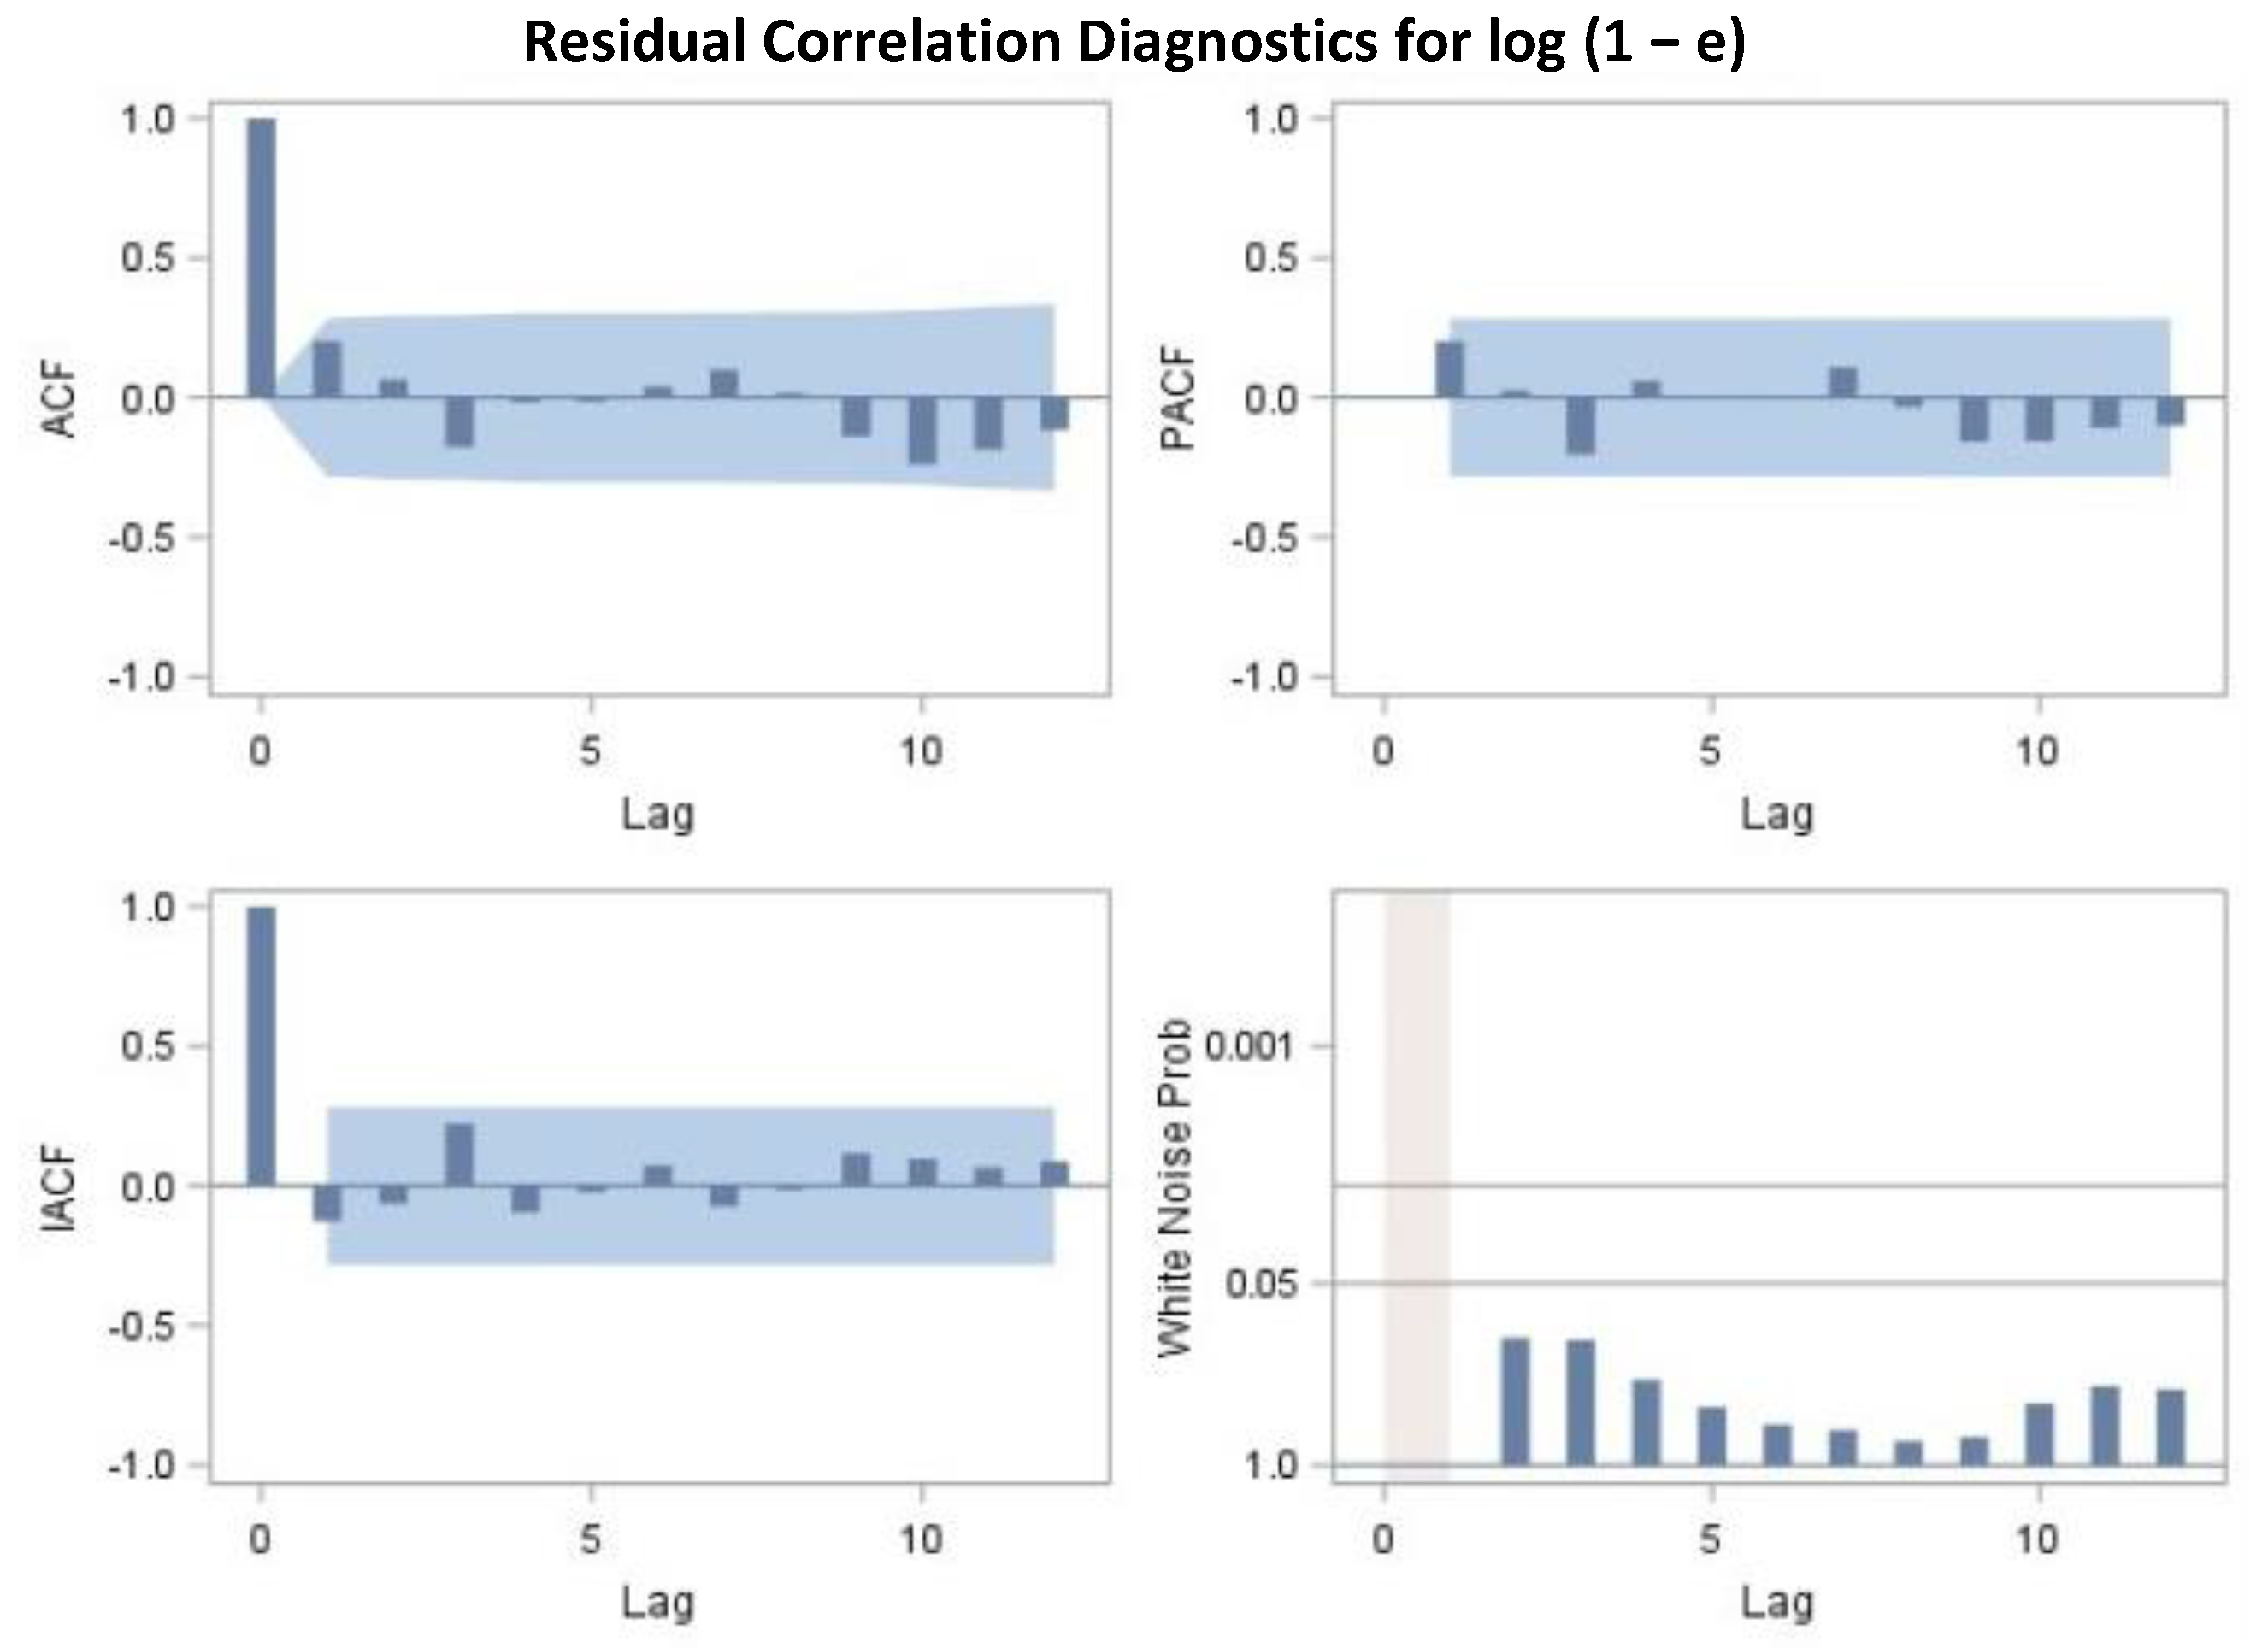
We analyzed the data using SAS/STAT® software. The following statements fit an autoregressive model of order 1. Table 2 shows a check of the autocorrelations of the residuals. The test statistics did not reject the no-autocorrelation hypothesis at a high level of significance for the six, twelve, eighteen and twenty-four lags. This means that the residuals are white noise, and so the AR (1) model is an adequate model for this case.
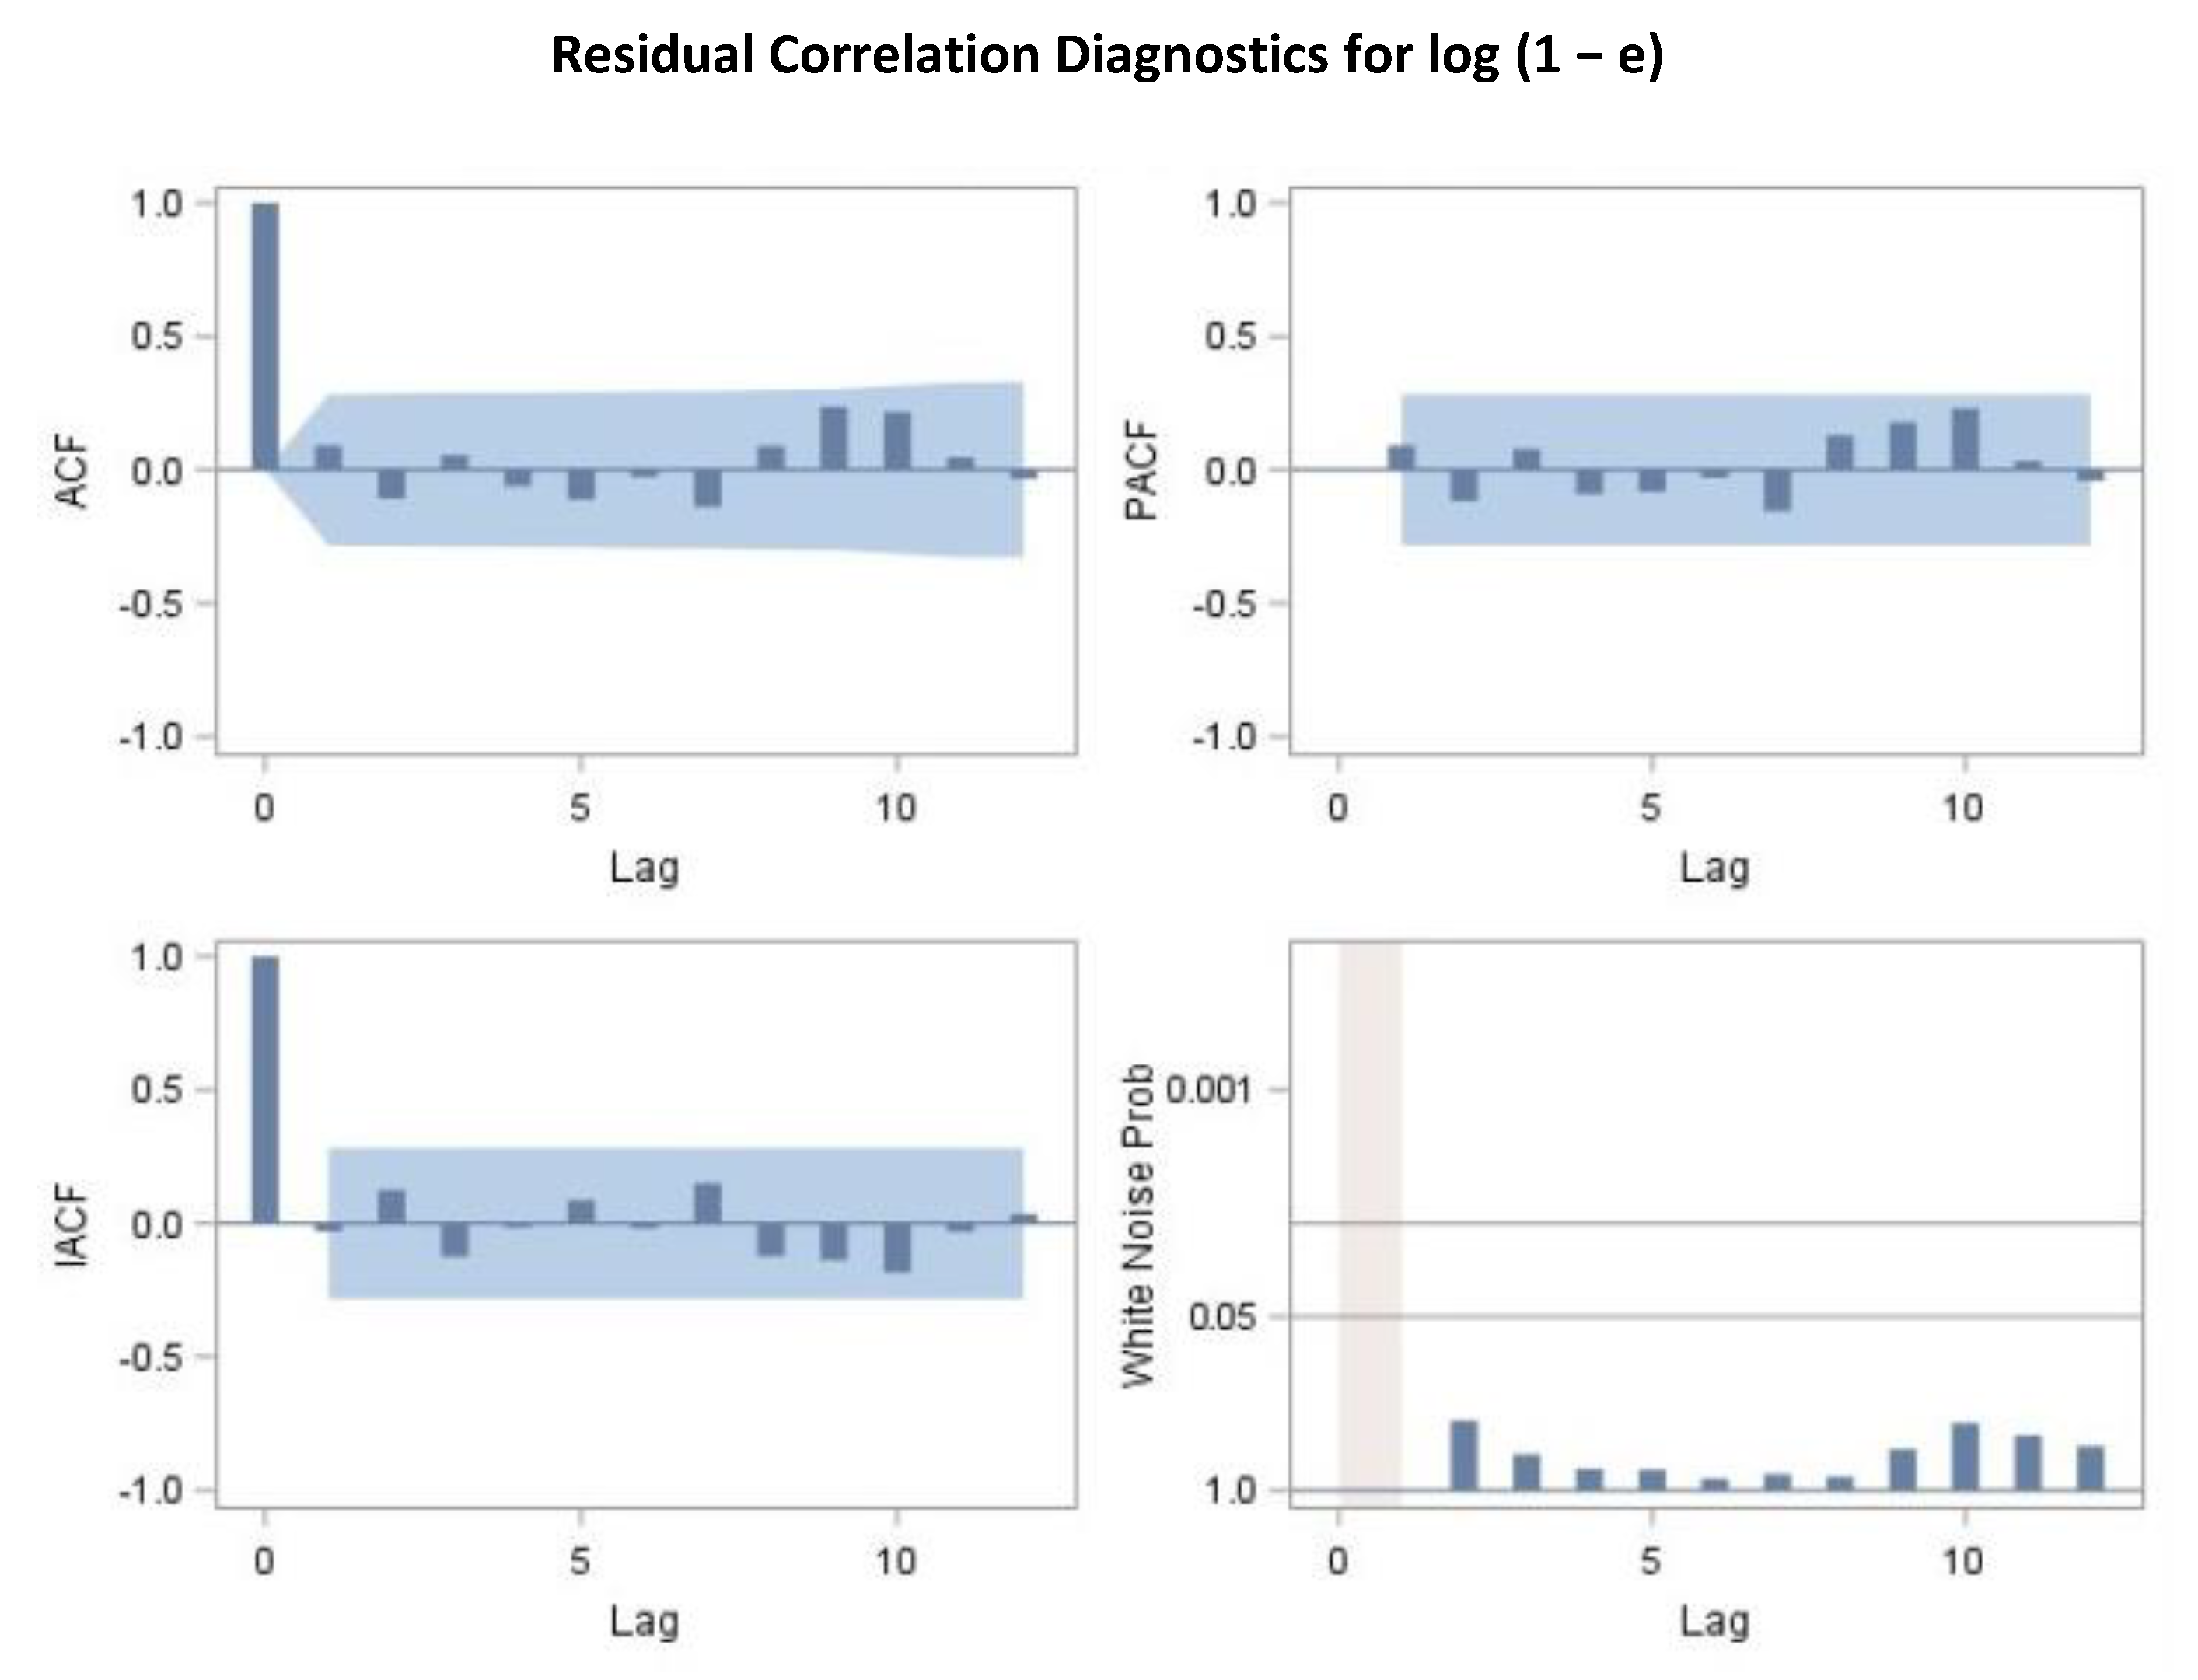
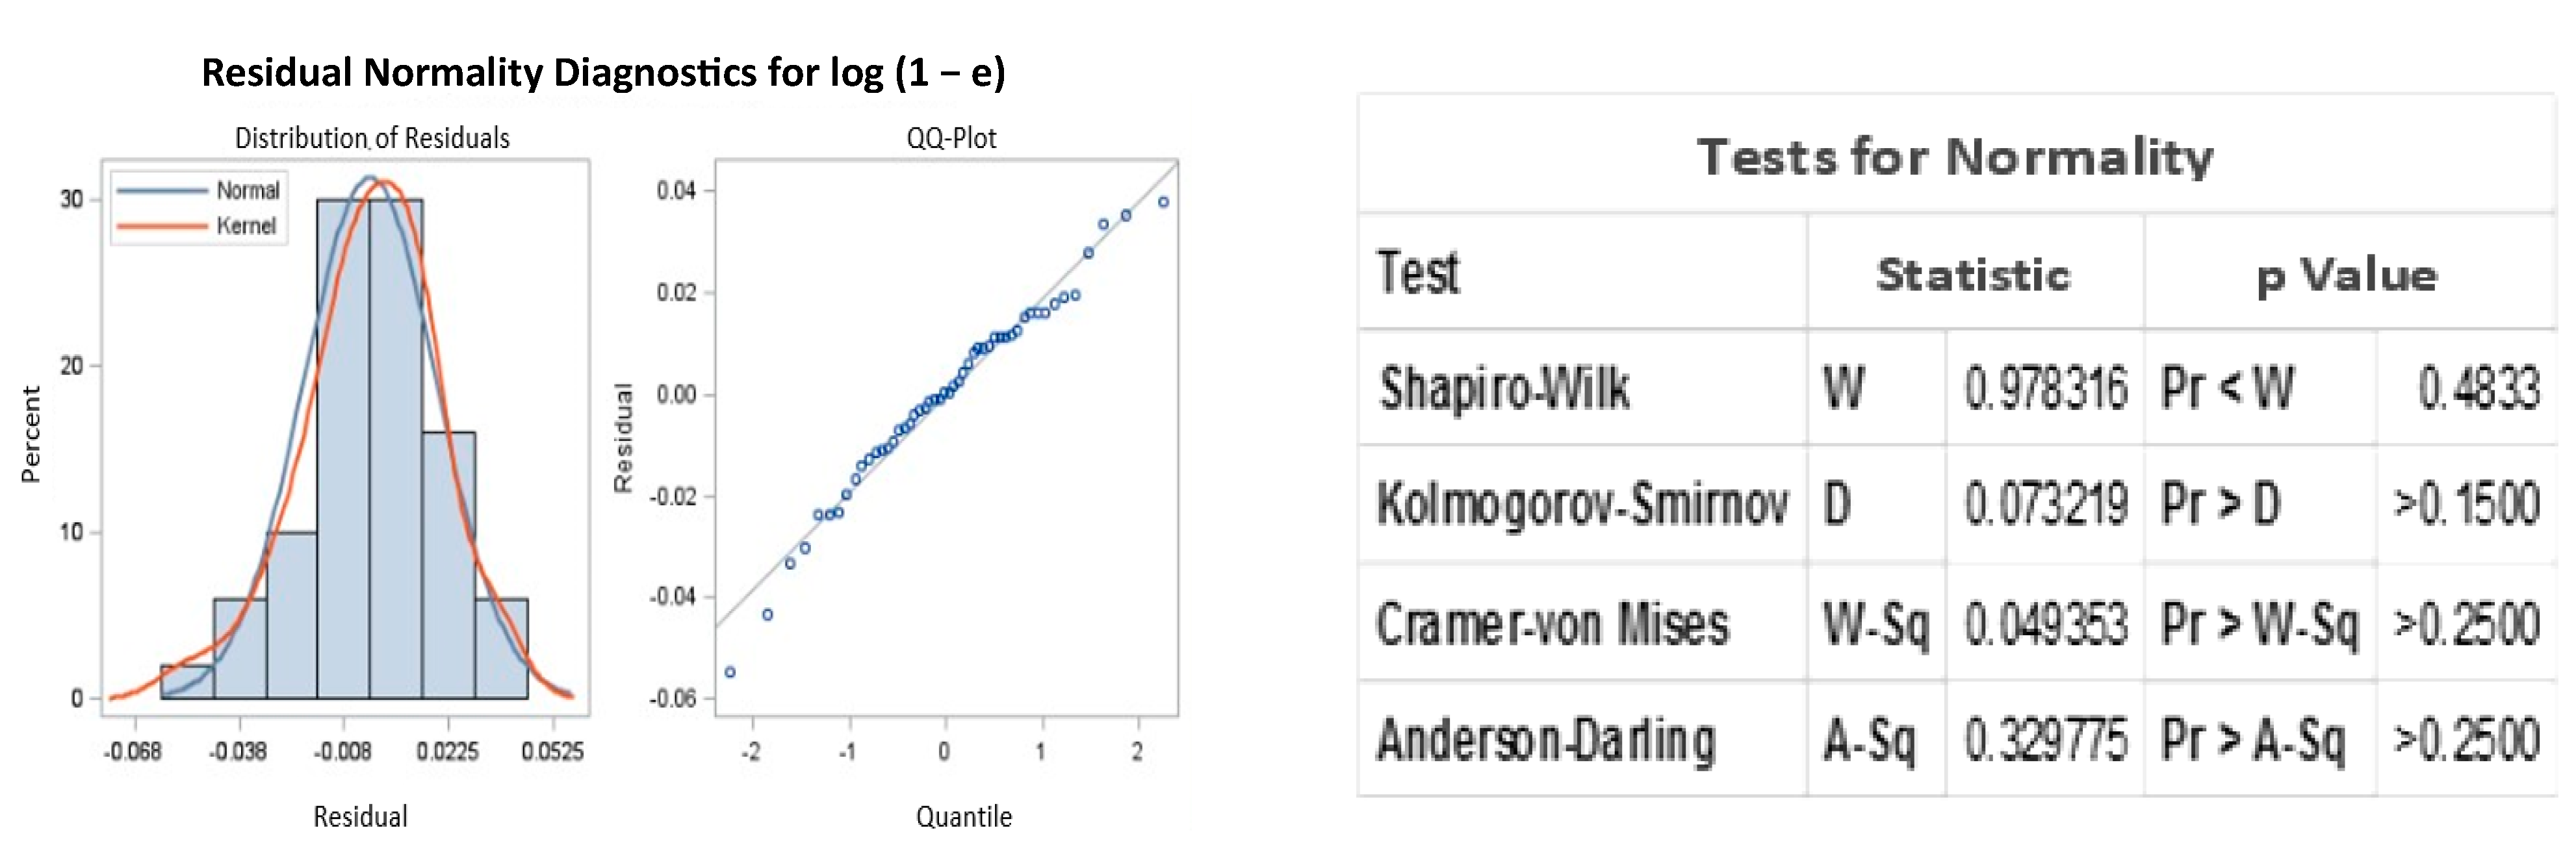
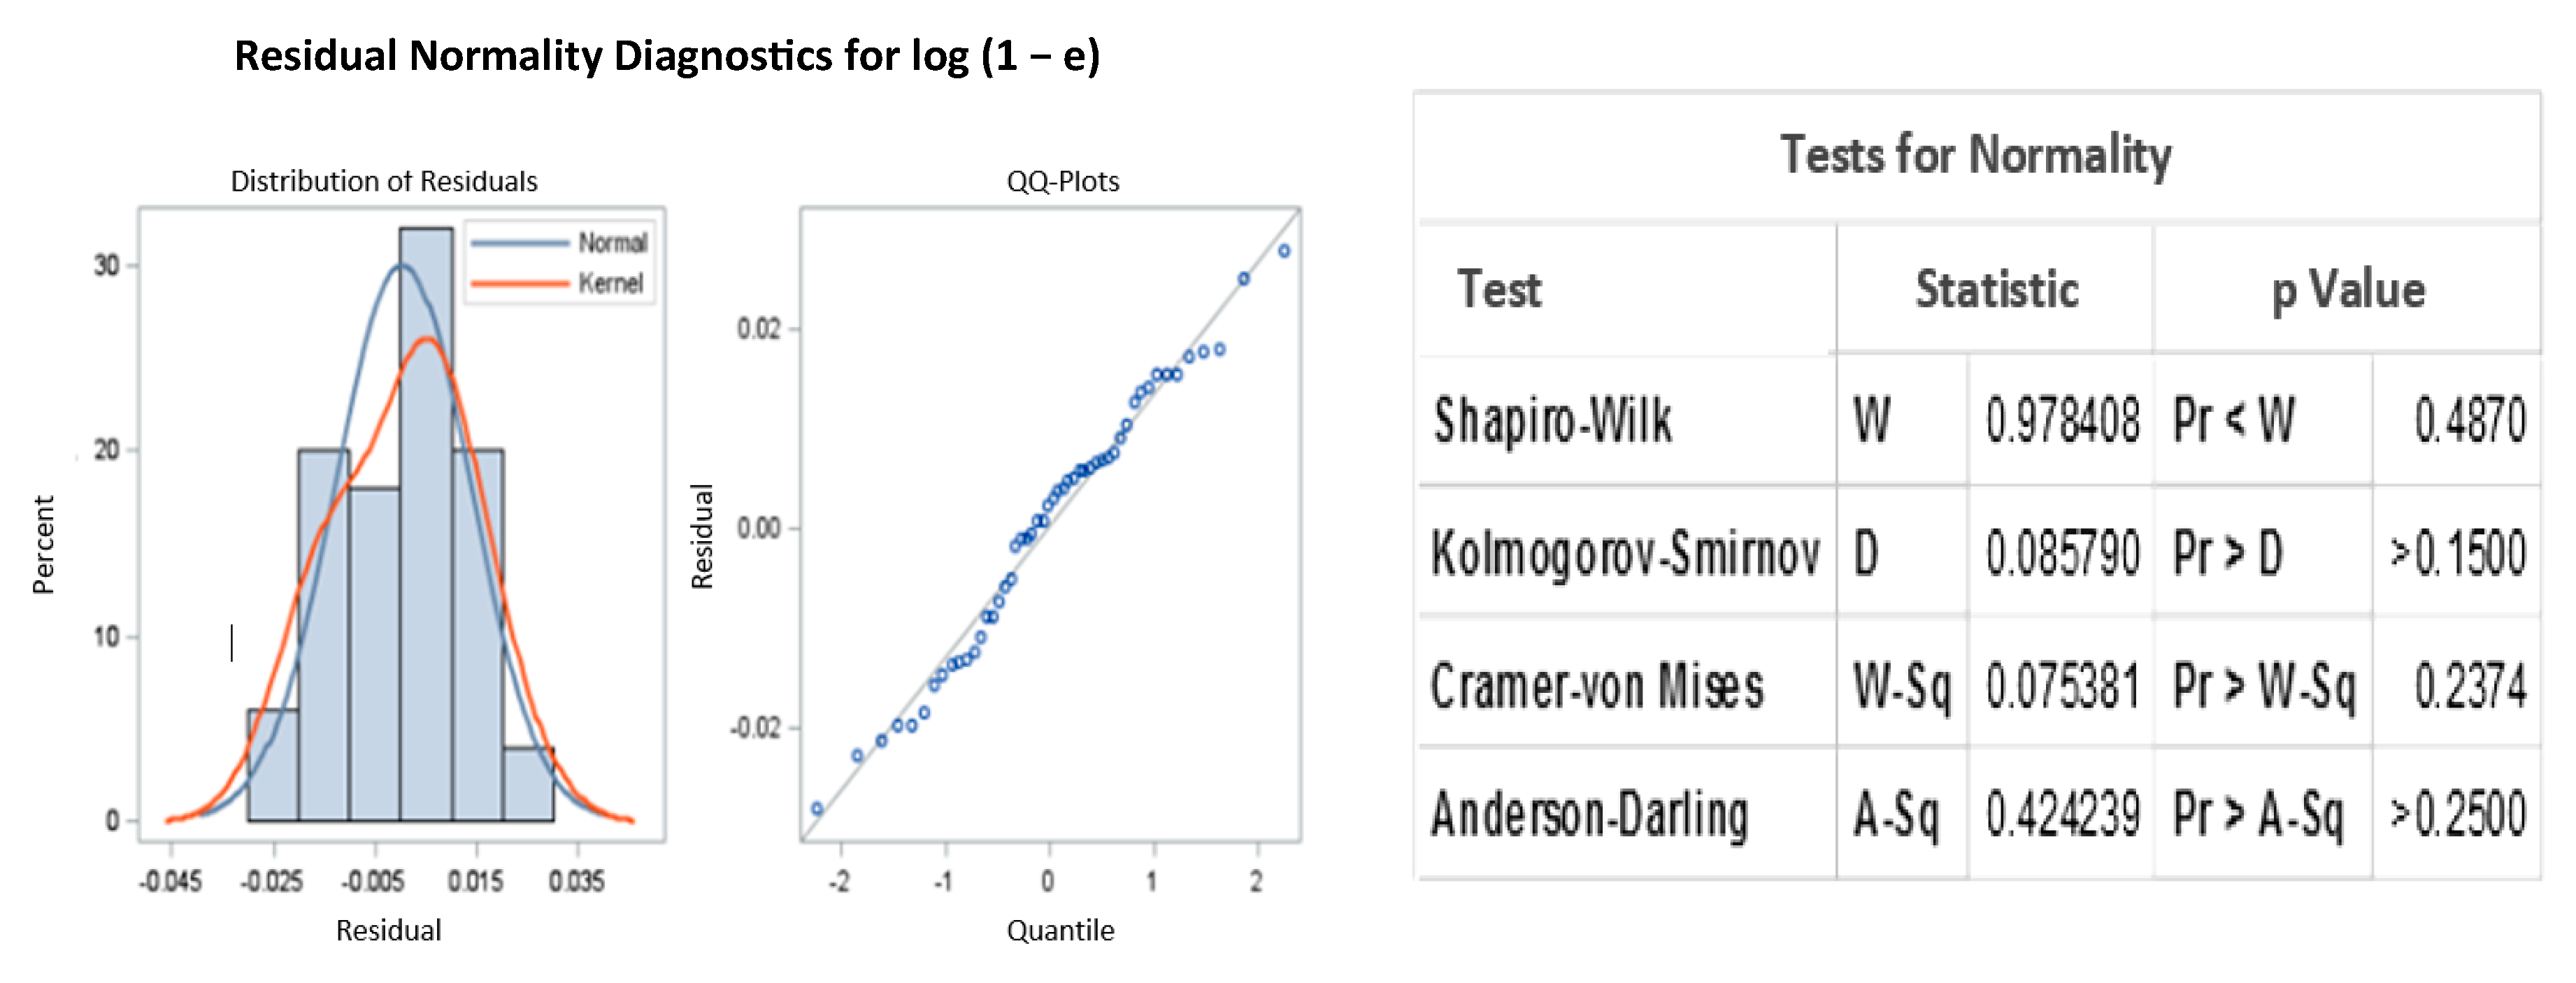
In addition, Figure 3 and Figure 4 show the graphical check of the residuals. The residual correlation and white noise test plots show that we cannot reject the hypothesis that the residuals are uncorrelated. The normal probability plot also suggests no departure from normality.
On other hand, the software detects changes in the level of response series; these are additive outliers (AO) and level shifts (LS). In this regard, it should be noted that time series are usually affected by events that produce shifts in the level of the series. Such would, for example, be the case of strikes, environmental disasters, changes on holidays, accidents, regulatory reforms, measurement errors, etc. (Pérez 2011). In the case of time-series related to foreign trade, it is recognized that these may be subject to changes produced by the level of tariff rates, non-tariff measures, regulatory and institutional reforms, revisions of the harmonized system, signing of trade agreements, among others. These events may occur simultaneously, sporadically or continuously during the period under analysis. Furthermore, the identification of the event that causes the change in the level of the series may be unknown. Thus, the incorporation of an outlier in the analysis is important since it allows for improved modeling and estimation (Chen et al. 1990).
Table 3 shows the estimate results for the transfer function model, which also include a table of goodness-of-fit statistics such as the innovation variance estimate, the innovation standard deviation (standard error estimate), Akaike’s information criterion (AIC), Schwarz’s Bayesian criterion (SBC), and the number of residuals.
The mathematical form of the estimated model is as follows:
where: at following an AR (1) process: (1/1 – 0.71136 L) at (this is the autoregressive parameter of the equation). For his part, (1 – et), (S/R)t, (τt) and (PIB/PIB−1)t are, respectively, the voluntary compliance rate, administrative costs as a percentage of revenue collections, a simple average of MFN applied duties and GDP growth rate.
log (1 − et) = −0.03723 log (S/R)t – 0.15756 log (τt) + 2.26551 (PIB/PIB−1)t + (0.04907/1 – L)Ils2016q2 +
0.05480Iao2014q3 − 0.06221Iao2008q3 + 0.06142Iao2009q4 − 0.05475Iao2015q1 − 0.04908Iao2007q3 − 0.04198Iao2011q2 −
0.03826Iao2013q2 − 0.03504Iao2008q1 + (1/1 − 0.71136 L)at
0.05480Iao2014q3 − 0.06221Iao2008q3 + 0.06142Iao2009q4 − 0.05475Iao2015q1 − 0.04908Iao2007q3 − 0.04198Iao2011q2 −
0.03826Iao2013q2 − 0.03504Iao2008q1 + (1/1 − 0.71136 L)at
With regard to ls2016q2, it is a level shift (ls) outlier by the second quartile of 2016; 0 if t < 2016q2; 1 if t ≥ 2016q2. Meanwhile, ao2014q3; ao2008q3; ao2009q4; ao2015q1; ao2007q3; ao2011q2; ao2013q2 and ao2008q1 are additives outliers (ao). It represents an isolated spike for the duly specified quartiles of the year; for example, 0 if t ≠ 2014q3; 1 if t = 2014q3.
4.2. Chile Case Study
In order to be able to compare the results, the same methodology was used to obtain the equation that adjusts the function of the model for the case of Chile. The source to obtain the data corresponding to the Tariff rate, most favored nation, simple mean, all products (%) is the same as the one used for the case of Ecuador. For the calculation of the compliance rate, “(1 – e)”, “E” data are from the Trade Map Database and “I” from the statistical database of the Central Bank of Chile (2018b). The information is available in US dollars and corresponds to FOB terms. The quarterly execution of the Budget Expenditure is available in the following electronic portal of the Chilean Budget Office (DIPRES 2018). The observed exchange rate used for the conversion of Chilean pesos to US dollars proceeds from the Central Bank of Chile (2018a). In turn, the source of information for the quarterly series of real GDP obtained from the Central Bank of Chile (measured at constant 2013 prices).
Test statistics for the residual series indicate whether the residuals are uncorrelated (Table 4). In this case, the test statistics for the residual series indicate that the residuals are uncorrelated for the six lags, nor for the twelve, eighteen and twenty-four lags. This means that the residuals are not white noise, and so the AR (4) model is a fully adequate model for this series. The graphical analysis also reveals the adequacy of the AR (4) model (Figure 5). Furthermore, the residual normality test shows a normality pattern (Figure 6).
The parameter estimates for this case are shown in Table 5.
The results in Table 5 indicate that all the parameter estimates are significant. Then, the mathematical form of the estimated model shown in this output is as follows:
log (1 − et) = 0.09533 log (S/R)t + 0.13048 log (τt) + 0.13847 (PIB/PIB−1)t + (0.06165/1 − L)Ils2008q1 −
0.04843Iao2006q1 + 0.03928Iao2006q4 − 0.03680Iao2007q3 − 0.02938Iao2010q4 + (1/1 − 0.64758L4) at
0.04843Iao2006q1 + 0.03928Iao2006q4 − 0.03680Iao2007q3 − 0.02938Iao2010q4 + (1/1 − 0.64758L4) at
In this case, the mathematical form of the autoregressive model of Equation (3) specifies an AR (4) model. It has parameters for lag 4, with the coefficients for lags 1, 2 and 3 constrained to 0. The outlier detection results are as follows: level shift (ls) outlier to the 1st quartile 2008 and additives outliers (ao) to the first quartile 2006; fourth quartile 2006; third quartile 2007; fourth quartile 2010.
In the case of Ecuador, it can observe that the variable of budgetary expenditure in relation to collection (S/R) has a negative and significant impact on the compliance rate. In other words, the coefficient β, which is equal to −0.03723, corresponds to the elasticity of budgetary spending on customs collection expressed, as a formula would be:
Δ(1 − e)/Δ(S/R) = β (R/S) * (1 − e)
If Equation (4) is used to calculate the performance of budgetary expenditure in customs collection in Ecuador, the negative value of the coefficient β (−0.03723) reflects the loss of efficiency that does not compensate for the collection income since budgetary expenditure has increased more rapidly than tax collection. With respect to the parameter γ, it can mention that an increase of 1% in the simple average of the tariff rate “τ” affects the compliance rate (1 − e) with a drop of 0.15756%. The above leads to the deduction that a decrease in the tariff rate implies, ceteris paribus, an improvement in compliance with tax payments. Thus, the incentive to evade is diminished. The coefficient δ is positive and statistically significant, which suggests that the compliance rate (1 − e) improves in the face of economic growth in GDP, coinciding with this finding with other authors.
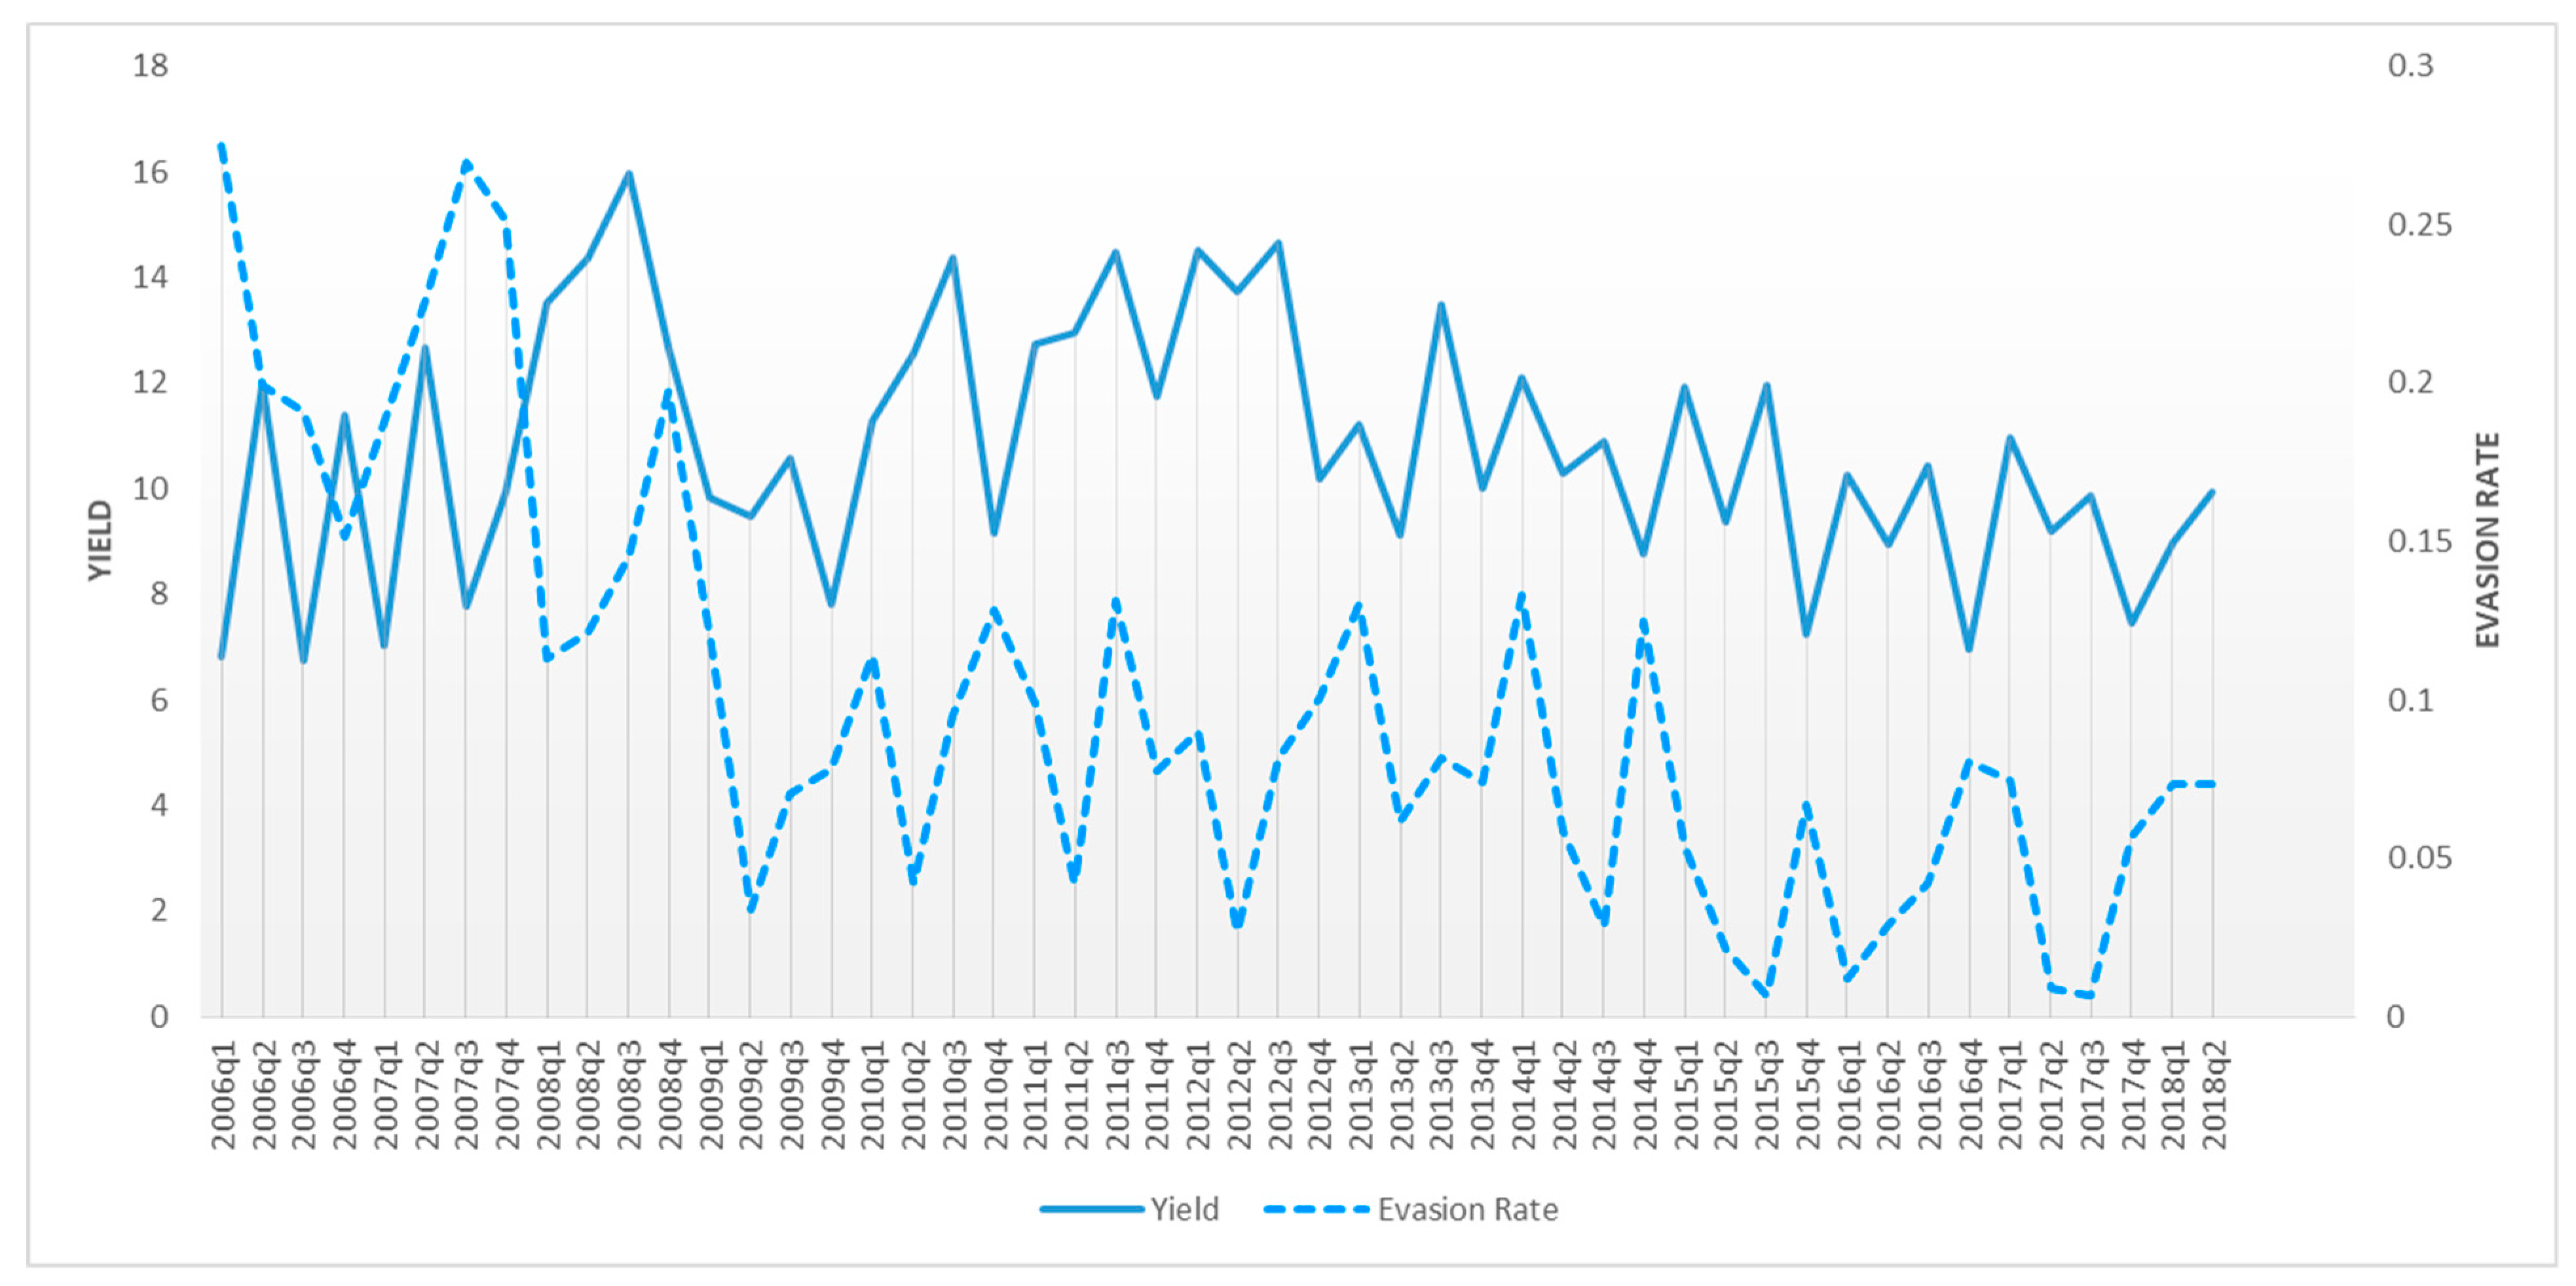
In the case of Chile, a different panorama to that of Ecuador can observe, for example, a percentage increase in budgetary expenditure (S/R) has a significant and positive impact on the compliance rate. Thus, an increase of 1% in budgetary spending as a percentage of collection improves the compliance rate by approximately 0.1%. Then, using Equation (4), in Figure 7, the performance of budgetary expenditure in customs collection versus the estimated evasion rate for the period under study in Chile is observed; in general terms, it is observed that when there is an improvement in expenditure, the evasion rate experiences a decrease.
In relation to the tariff rate, it is observed that it is significant and positive. This explained in the following way, the sign of the coefficient γ is ambiguous, depending on which side of the Laffer curve the economy is. From the results obtained, there are indications to assume that a rise in the level of the tariff rate faced by Chile would allow it to further increase customs collection. On the other hand, Ecuador would be at a saturation point in the level of its tariff rate. This implies that any increase in the level of the tariff rate would not have a positive effect on the increase of customs collection. The parameter δ is positive and statistically significant, ceteris paribus, it expects that the compliance rate will improve (1 − e) in an economic boom.
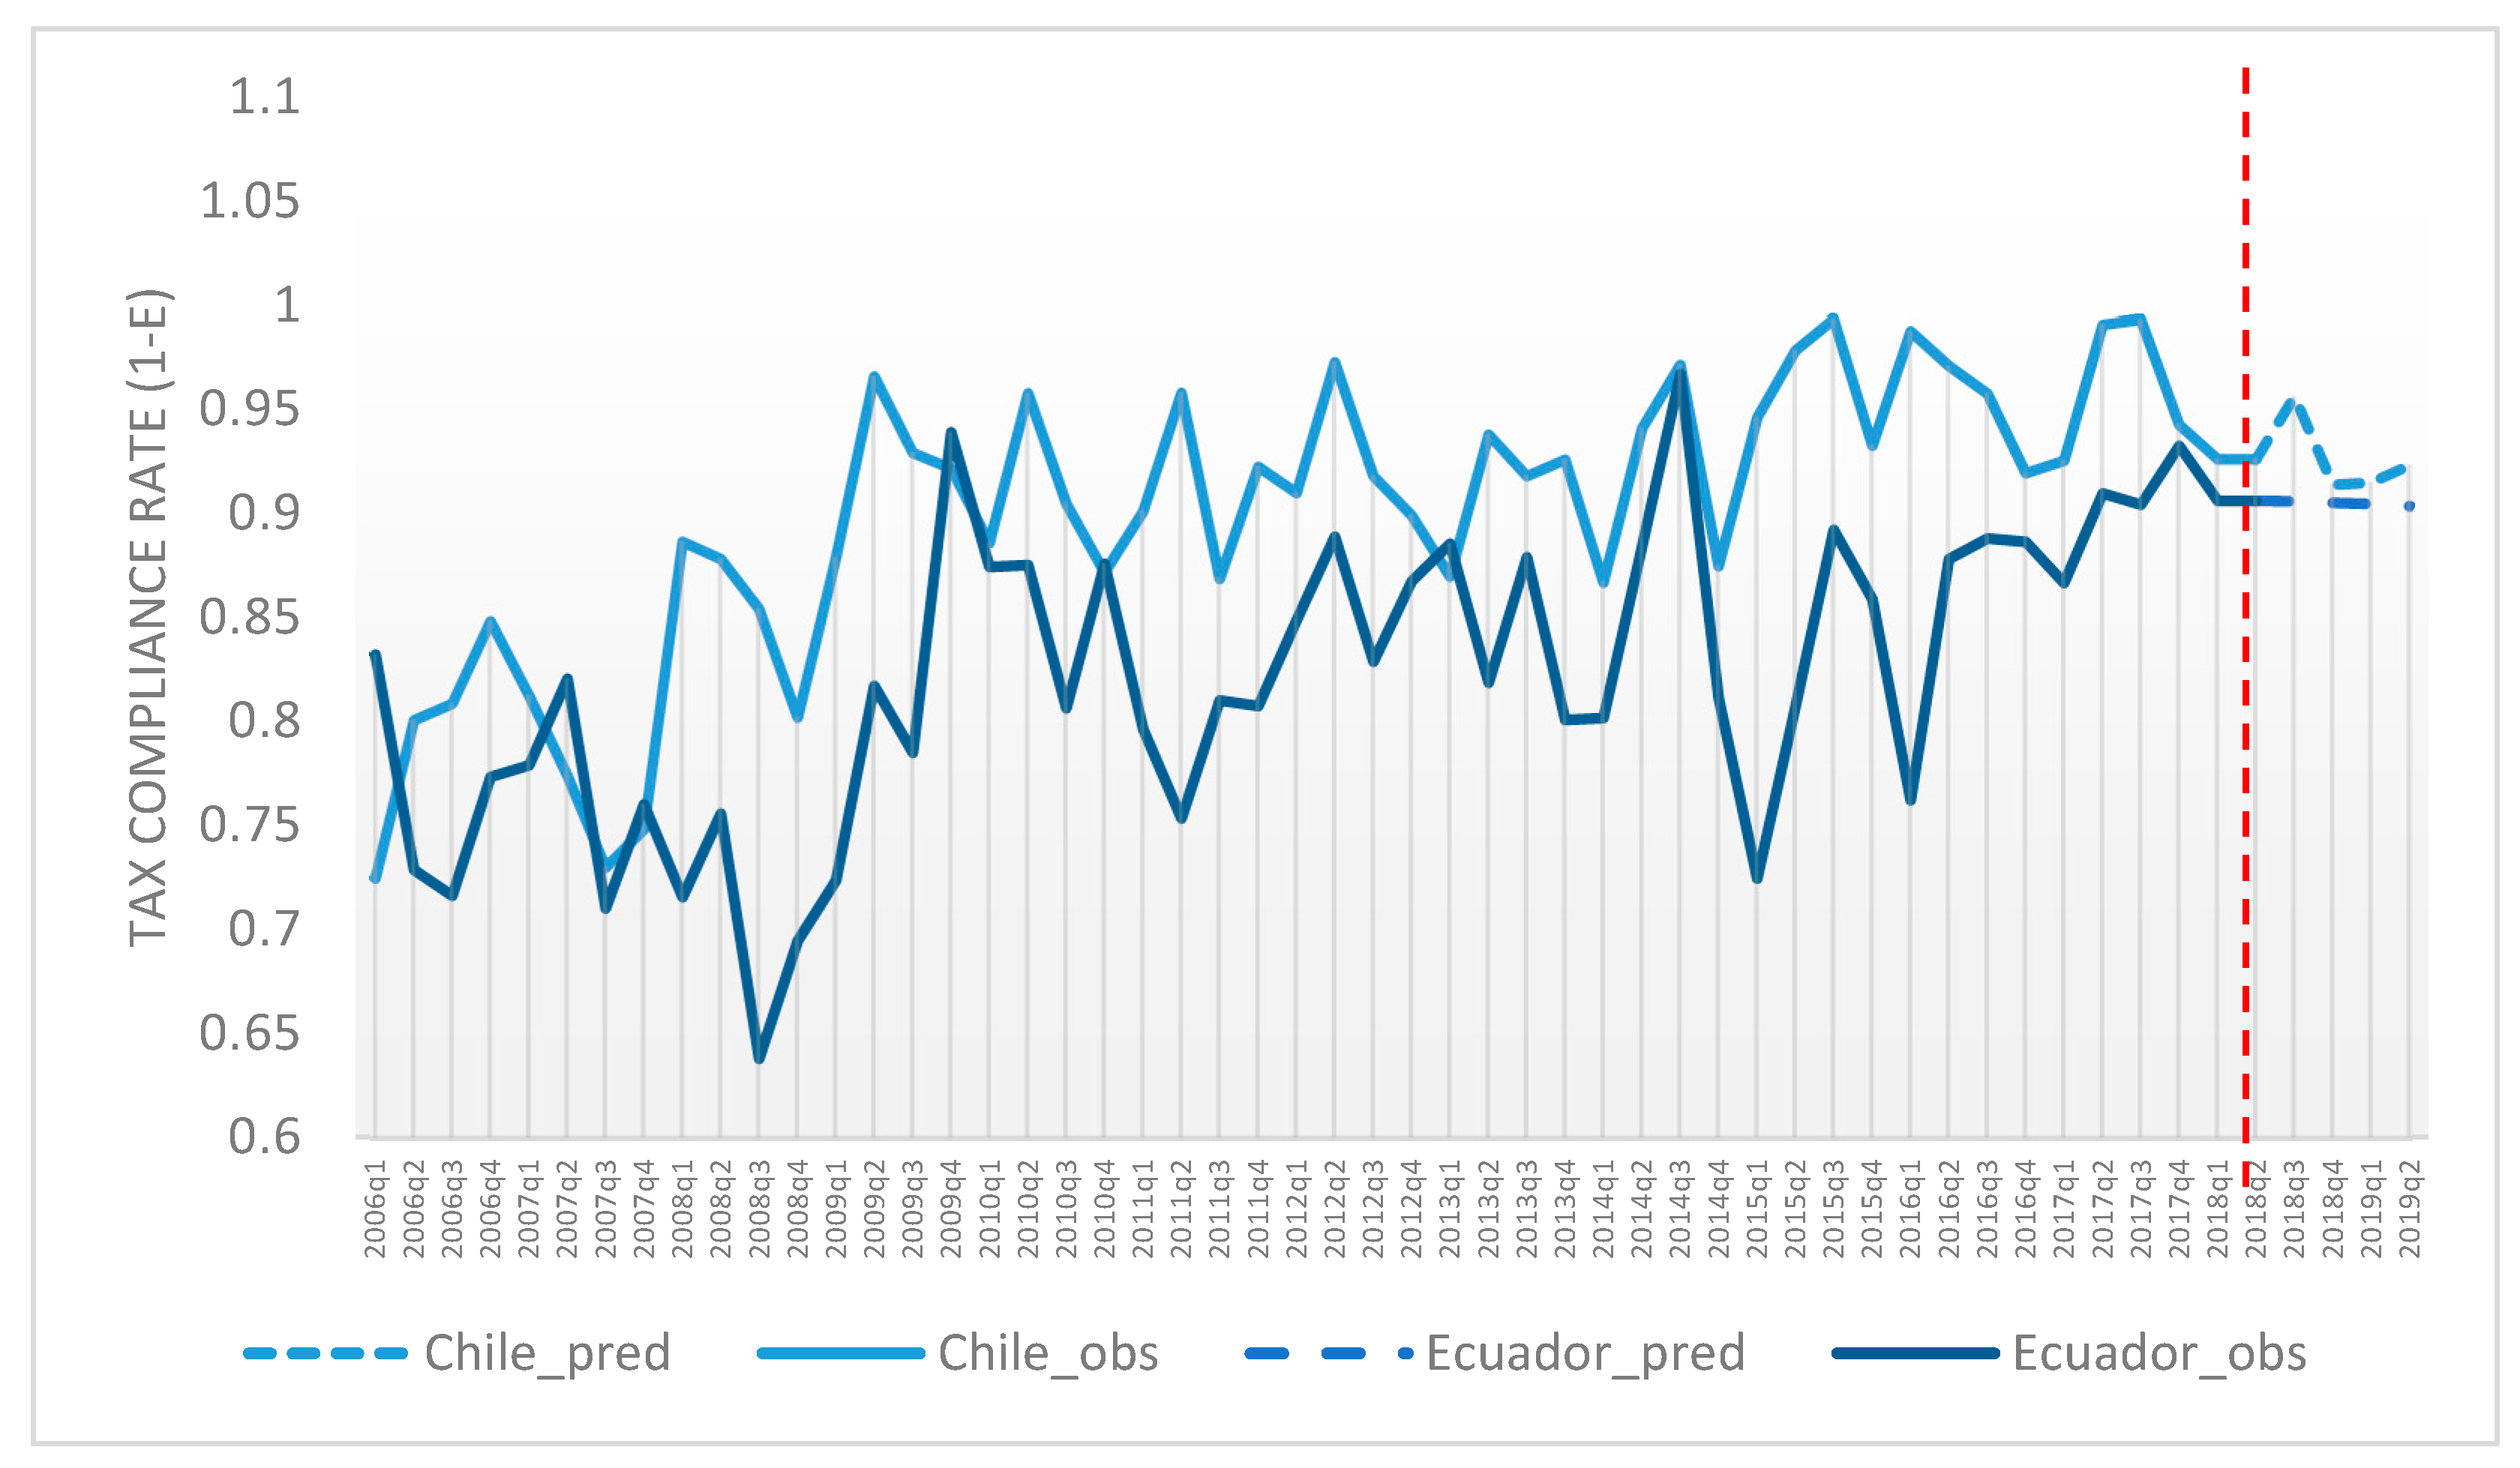
Figure 8 shows the predictions for the compliance rate (1 − e) in a one-year time horizon for Chile and Ecuador; in both cases, the compliance rate tends to decrease (World Trade Organization 2020).
However, if using the model in Equation (1) and only the quarterly series of the quotient between institutional expenditure and customs revenue of Ecuador replace by that of Chile (S/R), which means that Ecuador collected (R) much more maintaining the same expenditure (S). The mathematical form of the AR (4) model estimated in the case is shown in Equation (5):
log (1 − et) = 0.13126 log (S/R)t + 0.12881 log (τt) + 2.21336(PIB/PIB−1)t + (0.06392/1 − L)Ils2009q3 +
0.06532Iao2007q4 + 0.03765Iao2009q4 − 0.06216Iao2011q2 − 0.05936 I ao2013q2 − 0.03896Iao2015q1 + (1 + 0.62297L4) at
0.06532Iao2007q4 + 0.03765Iao2009q4 − 0.06216Iao2011q2 − 0.05936 I ao2013q2 − 0.03896Iao2015q1 + (1 + 0.62297L4) at
Thus, it can see how the parameters β (0.13126) influence the increase in the compliance rate (1 − e), which allows for the deduction that the administrative cost of customs taxes in Ecuador should be more efficient in order to achieve some effect in reducing evasion. Given that an average increase of 81% in the original series (R) has been assumed, the positive sign of the coefficient γ (0.12881) is to be expected, i.e., an adequate level of efficiency in the administrative cost of collecting customs taxes would mean that the tariff rate would not reach saturation point. As in the case of Equations (2) and (3), the parameter δ (2.21336) is positive, so in periods of welfare and economic growth, compliance with tax obligations is favored.
5. Conclusions
Allingham and Sandmo’s (1972) theory, which argues that an adequate surveillance and control system is the most viable way to promote tax compliance, even if tariff rate levels are increased, has been widely criticized in several empirical studies as unrealistic (Alm et al. 1992; Slemrod and Yitzhaki 2002). Currently, there are empirical studies that show the zero effect that the application of punishment measures has on tax behavior, for example, Alm et al. (1992); Pommerehne and Weck-Hannemann (1996); Doob and Webster (2003) concluded that the impact of fines on tax revenues is zero. Tauchen et al. (1993); Pommerehne and Weck-Hannemann (1996) find evidence of the slight effect of auditing on improving tax compliance. Similarly, Alm et al. (1992) draw attention to how the deterrent effect of a large number of audits is diminished over time.
The findings of this research suggest the following: no matter how much money Ecuador spent on implementing prevention and control measures, tax noncompliance will continue to rise unless the level of tariff rates is changed or the productive sectors experience greater growth. In our view, such a conclusion does not seem far-fetched, but rather realistic: How could the imposition of a measure of power, force or shock succeed in modifying bad tax behavior when tariff rates are at levels that exceed the economic agent’s ability to pay? In this regard, note the difference between Equations (2) and (3) corresponding to the cases of Ecuador and Chile, respectively; the output of the model in Equation (2) suggests that an increase in the tariff rate will lead to a decrease in tax compliance. Equation (3) shows the opposite effect, that is, an increase in the tariff rate would not affect tax compliance. This empirical finding shows that tax levels in Ecuador are not at an optimal point (Laffer curve—saturation point).
To conclude, tariff policies do not always produce the effects for which they are designed. The practice of raising customs duties does not always result in increased revenue. Similarly, increasing resources to fight customs fraud may not be the most efficient way to reduce tax evasion. A suitable tool for the analysis of these tariff policies is multivariate time-series models. They allow the relationship between tariff policy and customs evasion to be established, analyzing the incentives for tax compliance. In the case analyzed for Ecuador, a reduction in the tariff rate or an increase in the rate of variation of GDP has a positive effect on reducing customs evasion. However, as can be deduced from the operation of the model, an increase in the budget for combating customs evasion would not help reduce evasion.
For Ecuador, it would be advisable to establish a tariff policy based on a reduction in the levels of tariff rates in order to decrease evasion levels. It would bring as a benefit an improvement in voluntary compliance with tax obligations. With regard to the circumstances relating to Chile, the country is doing its best with the public resources available. However, customs evasion shows an upward trend throughout the study period, and even in the forecast model (Figure 8). In such a situation, the increase in public spending to strengthen customs controls and thus reduce the risk of evasion is fully justified. In short, allocating greater monetary resources to combat fraud does not always help reduce customs evasion. It will depend on the efficiency of the administrative cost of customs duties, the level of the tariff rate and the economic cycle that a country faces. For future investigations, it is interesting to analyze which elements could have an impact on the increase of administrative costs. For example, the implications of a complex and difficult to supervise tariff system.
Author Contributions
Conceptualization, A.D.V.; formal analysis, J.G.A.; investigation, J.G.A. and A.D.V.; methodology, J.G.A.; resources, A.D.V.; writing—review and editing, J.G.A. and A.D.V. All authors have read and agreed to the published version of the manuscript.
Funding
This research received no external funding.
Data Availability Statement
Publicly available datasets were analyzed in this study. This data can be found here: https://www.aduana.gob.ec (accessed on 15 October 2018); https://www.bce.fin.ec (accessed on 15 October 2018); https://www.bcentral.cl (accessed on 15 October 2018); http://www.dipres.gob.cl (accessed on 15 October 2018); https://www.wto.org (accessed on 15 October 2018); https://www.intracen.org/ (accessed on 15 October 2018).
Conflicts of Interest
The authors declare no conflict of interest.
References
- Agha, Ali, and Jonathan Haughton. 1996. Designing Vat Systems: Some Efficiency Considerations. The Review of Economics and Statistics 2: 303–8. [Google Scholar] [CrossRef]
- Allingham, Michael G., and Agnar Sandmo. 1972. Income Tax Evasion: A Theoretical. Analysis Journal of Public Economics 1: 323–80. [Google Scholar] [CrossRef] [Green Version]
- Alm, James, Betty Jackson, and Michael McKee. 1992. Institutional Uncertainty and Taxpayer Compliance. American Economic Review 82: 1018–26. [Google Scholar]
- Arrow, Kenneth J. 1965. Essays in the Theory of Risk-Bearing. Helsinki: Yrjö Jahnsson Lectures. [Google Scholar]
- Baldry, Jonathan C. 1987. Income Tax Evasion and the Tax Schedule: Some Experimental Results. Public Finance 42: 357–83. [Google Scholar]
- Barone, Guglielmo, and Sauro Mocetti. 2009. Tax Morale and Public Spending Inefficiency. In Bank of Italy Temi di Discussione. (Working Paper) (732). Roma: Bank of Italy, Economic Research Unit, Bologna Branch. [Google Scholar] [CrossRef]
- Becker, Gary S. 1968. Crime and Punishment: An Economic Approach. Journal of Political Economy 76: 169–217. [Google Scholar] [CrossRef] [Green Version]
- Bhagwati, Jagdish N. 1964. On the Underinvoicing of Imports. Bulletin of the Oxford University Institute of Economics and Statistics 26: 389–97. [Google Scholar]
- Box, George E. P., Gwilym M. Jenkins, Gregory C. Reinsel, and Greta M. Ljung. 2016. Transfer Function and Multivariate Model Building, 5th ed. Time Series Analysis: Forecasting and Control; Hoboken: John Wiley & Sons, Inc., pp. 395–502. [Google Scholar]
- Central Bank of Chile. 2018a. Statistical Database, Exchange Rate. Available online: https://si3.bcentral.cl/siete/en (accessed on 15 October 2018).
- Central Bank of Chile. 2018b. Statistical Database, Foreign Trade of Goods. Available online: https://www.bcentral.cl/en/areas/statistics/external-sector/foreign-trade-of-goods (accessed on 15 October 2018).
- Central Bank of Ecuador. 2018a. Macroeconomic Statistics, Structural Presentation; Quito: Ecuadorian Central Bank. Available online: https://www.bce.fin.ec/index.php/estadisticas-economicas (accessed on 8 November 2018).
- Central Bank of Ecuador. 2018b. Quarterly Balance of Payments Bulletin No 64 and Monthly Statistical Information No. 1847, 1930 and 2000; Quito: Ecuadorian Central Bank. Available online: https://www.bce.fin.ec/index.php/component/k2/item/297-bolet%C3%ADn-trimestral and https://contenido.bce.fin.ec/home1/estadisticas/bolmensual/IEMensual.jsp (accessed on 18 October 2018).
- Central Bank of Ecuador. 2018c. Foreign Trade Statistics Database. Available online: https://www.bce.fin.ec/index.php/comercio-exterior (accessed on 15 October 2018).
- Central Bank of Ecuador. 2018d. Quarterly National Accounts Bulletin. Available online: https://contenido.bce.fin.ec/home1/estadisticas/cntrimestral/CNTrimestral.jsp (accessed on 15 October 2018).
- Centre for Tax Policy and Administration. 2010. Tax Administration in OECD and Selected Non-OECD Countries: Comparative Information Series. Paris: OECD Publishing, vol. 4, p. 119. [Google Scholar]
- Chen, Chung, Lon-Mu Liu, and Gregory B. Hudak. 1990. Outliers Detection and Adjustment in Time Series Modeling and Forecasting. Working Papers and Reprint Series; DeKalb: Scientific Computing Associates. [Google Scholar]
- Clotfelter, Charles T. 1983. Tax Evasion and Tax Rates: An Analysis of Individual Returns. The Review of Economics and Statistics 65: 273–363. [Google Scholar] [CrossRef]
- Crane, Steven E., and Farrokh Nourzad. 1986. Inflation and Tax Evasion: An Empirical Analysis. The Review of Economics and Statistics 68: 217–23. [Google Scholar] [CrossRef]
- De La Torre, C. 2017. Ecuador Pierde 700 Millones Anuales por Contrabando, Dice Carlos De la Torre, Ministro de Finanzas del Ecuador. Available online: https://www.elcomercio.com/actualidad/ecuador-pierde-contrabando-ministro-finanzas.html (accessed on 4 December 2018).
- DIPRES. 2018. Directorate of Budget, Republic of Chile, Dipres. Available online: http://www.dipres.gob.cl/598/w3-propertyvalue-2129.html (accessed on 15 October 2018).
- Doob, Anthony N., and Cheryl Marie Webster. 2003. Sentence Severity and Crime: Accepting the Null Hypothesis. Crime and Justice 30: 143–95. [Google Scholar] [CrossRef]
- Dubin, Jeffrey A. 2007. Criminal Investigation Enforcement Activities and Taxpayer Noncompliance. Public Finance Review 35: 500–29. [Google Scholar] [CrossRef] [Green Version]
- Dubin, Jeffrey A., and Louis L. Wilde. 1988. An Empirical Analysis of Federal Income Tax Auditing and Compliance. National Tax Journal 41: 61–74. [Google Scholar]
- Dubin, Jeffrey A., Michael J. Graetz, and Louis L. Wilde. 1990. The Effects of Audit Rates on the Federal Income Tax 1977–1986. National Tax Journal 43: 395–409. [Google Scholar]
- Engel, Eduardo Goetz, Alexander Galetovic Potsch, and Claudio E. Raddatz. 2001. A Note on Enforcement Spending and VAT Revenue. The Review of Economics and Statistics 83: 384–87. [Google Scholar] [CrossRef]
- Evans, Chris, Shirley Carlon, and Darren Massey. 2005. Record Keeping Practices and Tax Compliance of SME’s. eJournal of Tax Research 3: 288–334. [Google Scholar]
- Fisman, Raymond, and Shang-Jin Wei. 2877. Tax rates and Tax Evasion: Evidence from “Missing Imports” in China. National Bureau of Economic Research (NBER) Working Paper: w8551. Available online: https://papers.ssrn.com/sol3/papers.cfm?abstract_id=287748 (accessed on 22 December 2017).
- FLACSO. 2015. FLACSO—Latin American Faculty of Social Sciences, Ecuador. Revista Perfil Criminológico (15). Available online: https://repositorio.flacsoandes.edu.ec/xmlui/bitstream/handle/10469/7512/BFLACSO-PC15.pdf?sequence=2&isAllowed=y (accessed on 15 October 2019).
- Friedland, Nehemiah, Shlomo Maital, and Aryeh Rutenberg. 1978. A Simulation Study of Income Tax Evasion. Journal of Public Economics 10: 107–16. [Google Scholar] [CrossRef]
- Javorcik, Beate S., and Gaia Narciso. 2008. Diferentiated products and evasion of import tariffs. Journal of International Economics 76: 208–22. [Google Scholar] [CrossRef] [Green Version]
- National Customs Service of Ecuador, Senae. 2018. Open data Portal for transparency. Available online: https://www.aduana.gob.ec/transparencia/ and https://www.aduana.gob.ec/de-interes/recaudaciones/ (accessed on 15 October 2018).
- Park, Chang-Gyun, and Jin Kwon Hyun. 2003. Examining the determinants of tax compliance by experimental data: A case of Korea. Journal of Policy Modeling 25: 673–84. [Google Scholar] [CrossRef]
- Pérez, Cesar. 2011. Series Temporales: Técnicas y Herramientas. Madrid: Ibergarceta Publicaciones, S.L. [Google Scholar]
- Pommerehne, Werner W., and Hannelore Weck-Hannemann. 1996. Tax Rates, Tax Administration and Income Tax Evasion in Switzerland. Public Choice 88: 161–70. [Google Scholar] [CrossRef]
- Poterba, James M. 1987. Tax Evasion and Capital Gains Taxation. American Economic Review 77: 234–39. [Google Scholar]
- Resolution No. SENAE-2017-001-RE-M. 2017. First Supplement to the Official Registry 115 of 8 November 2017. Quito: National Customs Service of Ecuador, Available online: https://www.aduana.gob.ec/wp-content/uploads/2017/11/SENAE-SENAE-2017-001-RE-M-ESTABLECER-LA-TASA-DE-SERVICIO-DE-CONTROL-ADUANERO.pdf (accessed on 4 December 2018).
- Sancak, Cemile, Ricardo Velloso, and Jing Xing. 2010. Tax Revenue Response to the Business Cycle. Fondo Monetario Internacional. Working Paper No. WP/10/71. Available online: https://www.imf.org/en/Publications (accessed on 15 November 2018).
- National Customs Service of Ecuador (SENAE). 2017. Exportadores Cuestionan Tasa de Control Aduanero. Available online: https://www.eltelegrafo.com.ec/noticias/economia/8/exportadores-cuestionan-tasa-de-control-aduanero (accessed on 17 November 2017).
- Slemrod, Joel. 1985. An Empirical Test for Tax Evasion. The Review of Economics and Statistics 67: 232–38. [Google Scholar] [CrossRef]
- Slemrod, Joel, and Shlomo Yitzhaki. 2002. Tax avoidance, evasion, and administration. Handbook of Public Economics. In Handbook of Public Economics, 1st ed. Amsterdam: Elsevie, vol. 3, chp. 22. pp. 1423–70. [Google Scholar]
- Stiglitz, Joseph E. 1969. A Re-examination of the Modigliani-Miller Theorem. The American Economic Review 59: 784–93. [Google Scholar]
- Tariff Profiles in the World. n.d. Tariff Profiles in the World Is a Co-Publication of the WTO, ITC and UNCTAD on Market Access for Goods (2007 to 2018). Available online: https://www.wto.org/english/res_e/reser_e/tariff_profiles_e.htm (accessed on 15 October 2019).
- Tauchen, Helen V., Ann Dryden Witte, and Kurt J. Beron. 1993. Tax Compliance: An Investigation Using Individual Taxpayer Compliance Measurement Program (TCMP) Data. Journal of Quantitative Criminology 9: 177–202. [Google Scholar] [CrossRef]
- Trade Map. 2018. Trade Map of the International Trade Centre, ITC. The Tool is Freely Accessible. Available online: www.trademap.org (accessed on 15 October 2018).
- Witte, Ann D., and Diane F. Woodbury. 1985. The effect of tax laws and tax administration on tax compliance: The case of the U.S. individual income tax. National Tax Journal 38: 1–13. [Google Scholar]
- World Tariff Profiles. 2008. Geneva: World Trade Organization (WTO), International Trade Centre (ITC) and e United Nations Conference on Trade and Development (UNCTAD). Available online: https://www.wto.org/english/res_e/statis_e/its2008_e/its08_toc_e.htm (accessed on 15 October 2019).
- World Tariff Profiles. 2018. Geneva: World Trade Organization (WTO), International Trade Centre (ITC) and e United Nations Conference on Trade and Development (UNCTAD). Available online: https://www.wto.org/english/res_e/reser_e/tariff_profiles_e.htm (accessed on 15 October 2019).
- World Trade Organization. 2020. Annual Report by General Director. Available online: https://www.wto.org/english/news_e/news20_e/trdev_11dec20_e.htm (accessed on 14 December 2020).
- Yitzhaki, Shlomo. 1974. A note of income tax evasion: A theorical analysis. Journal of Public Economics 3: 202–2. [Google Scholar] [CrossRef]
| 1 | The simple average of MFN applied duties is the simple average of most favored nation (MFN) applied duties. The “most favored nation” are the highest (most restrictive) tariffs that members of the WTO charge one another, unless the country is part of a preferential trade agreement. |
| 2 | The data for mirror imports are provisional; some countries may take several months to report their trade data to the International Trade Center, known as ITC. For more information, please refer to the following link https://www.trademap.org/stDataAvailability.aspx?nvpm=3|152|||||||2|1|1|1|2|2|2|1|1 (accessed on 15 October 2018). Similar situation is presented with the registration of imports from Ecuador, which could vary by the time of registration in which the nationalization of the good has occurred that can be after the date of disclosure of the Quarterly Bulletin of Balance of Payment, so there could be reprocessing of information with the presentation of a new bulletin quarterly. In the case of the information obtained from the ECB (imports) and the ITC (mirror imports), the cutoff date was 5 February 2019. |
Figure 1.
Trade balance and average oil prices in Ecuador (2002–2017). Source: calculated from Quarterly Balance of Payments Bulletin No 64 and Monthly Statistical Information No. 1847, 1930 and 2000, Central Bank of Ecuador (2018b).
Figure 1.
Trade balance and average oil prices in Ecuador (2002–2017). Source: calculated from Quarterly Balance of Payments Bulletin No 64 and Monthly Statistical Information No. 1847, 1930 and 2000, Central Bank of Ecuador (2018b).

Figure 2.
Total Ecuadorian customs administration expenditure (2006–2018). Source: National Customs Service of Ecuador (2018).
Figure 2.
Total Ecuadorian customs administration expenditure (2006–2018). Source: National Customs Service of Ecuador (2018).

Figure 3.
Residuals correlation diagnostic, transfer function model for Ecuador.

Figure 4.
Residual normality analysis, transfer function model for Ecuador.

Figure 5.
Residuals correlation diagnostic, transfer function model for Chile.

Figure 6.
Residual normality analysis, transfer function model for Chile. Note: output in Figure 2, Figure 3, Figure 4 and Figure 5 were generated using SAS/STAT® software.

Figure 7.
The yield of each additional dollar of budgetary expenditure in the collection of customs taxes in Chile vs. Evasion Rate (e). Source: Chilean Central Bank (BC), Directorate of Budget, Republic of Chile (DIPRES), International Trade Centre (ITC).
Figure 7.
The yield of each additional dollar of budgetary expenditure in the collection of customs taxes in Chile vs. Evasion Rate (e). Source: Chilean Central Bank (BC), Directorate of Budget, Republic of Chile (DIPRES), International Trade Centre (ITC).

Figure 8.
Tax compliance rate forecast (1 − e) Ecuador vs. Chile.


Table 1.
Summary of the descriptive statistics of the variables used in the model.
| Variable | Arithmetic Mean | Standard Deviation | Extreme Values | |||||
|---|---|---|---|---|---|---|---|---|
| Minimum | Maximum | |||||||
| Chile | Ecuador | Chile | Ecuador | Chile | Ecuador | Chile | Ecuador | |
| Voluntary compliance rate (1 − e) | 0.9 | 0.81 | 0.068 | 0.077 | 0.73 | 0.63 | 0.99 | 0.97 |
| Administrative cost for each US dollar collected in customs (S/R) | 0.0083 | 0.0144 | 0.0019 | 0.0043 | 0.0051 | 0.0061 | 0.0126 | 0.0263 |
| Simple average of applied tariffs, all products (τ) (%) | 5.98 | 11.61 | 0.0047 | 0.8872 | 5.98 | 10.1 | 5.99 | 13.47 |
| Variation in economic cycle (PIB/PIB−1) | 1.007 | 1.008 | 0.0678 | 0.0104 | 0.859 | 0.984 | 1.158 | 1.032 |
Source: Chilean Central Bank (BC), Central Bank of Ecuador (BCE), Directorate of Budget, Republic of Chile (DIPRES), International Trade Centre (ITC), World Trade Organization (WTO), Ecuadorian National Customs Service (SENAE). Note: n = 50.
Table 2.
Check white noise residuals, transfer function model for Ecuador.
| Autocorrelation Check Residuals | |||||||||
|---|---|---|---|---|---|---|---|---|---|
| To Lag | Chi-Squared | DF | PR > ChiSq | Autocorrelations | |||||
| 6 | 2.23 | 5 | 0.8165 | 0.091 | −0.109 | 0.055 | −0.062 | −0.112 | −0.027 |
| 12 | 10.65 | 11 | 0.4732 | −0.140 | 0.088 | 0.235 | 0.216 | 0.046 | −0.036 |
| 18 | 14.36 | 17 | 0.6413 | −0.055 | 0.108 | −0.135 | −0.077 | −0.010 | −0.102 |
| 24 | 15.75 | 23 | 0.8656 | −0.018 | 0.072 | −0.049 | 0.083 | −0.025 | 0.001 |
Table 3.
Parameter estimates for transfer function model, Ecuador. Dependent variable: log (1 – e).
| Conditional Least Squares Estimation | |||||||
|---|---|---|---|---|---|---|---|
| Parameter | Estimate | Standard Error | t Value | Approx. Pr > |t| | Lag | Variable | Shift |
| AR1,1 | 0.71136 | 0.11627 | 6.12 | <0.0001 | 1 | log_1_e | 0 |
| NUM1 | −0.03723 | 0.02306 | −1.61 | 0.1149 | 0 | log_S_R | 0 |
| NUM2 | −0.15756 | 0.04258 | −3.70 | 0.0007 | 0 | log τ | 0 |
| NUM3 | 2.26551 | 0.80211 | 2.82 | 0.0076 | 0 | log_pib | 0 |
| NUM4 | 0.04907 | 0.01820 | 2.70 | 0.0105 | 0 | ls2016q2 | 0 |
| NUM5 | 0.05480 | 0.01804 | 3.04 | 0.0044 | 0 | ao2014q3 | 0 |
| NUM6 | −0.06221 | 0.01802 | −3.45 | 0.0014 | 0 | ao2008q3 | 0 |
| NUM7 | 0.06142 | 0.01828 | 3.36 | 0.0018 | 0 | ao2009q4 | 0 |
| NUM8 | −0.05475 | 0.01819 | −3.01 | 0.0047 | 0 | ao2015q1 | 0 |
| NUM9 | −0.04908 | 0.01807 | −2.72 | 0.0100 | 0 | ao2007q3 | 0 |
| NUM10 | −0.04198 | 0.01854 | −2.26 | 0.0295 | 0 | ao2011q2 | 0 |
| NUM11 | −0.03826 | 0.01812 | −2.11 | 0.0415 | 0 | ao2013q2 | 0 |
| NUM12 | −0.03504 | 0.01847 | −1.90 | 0.0656 | 0 | ao2008q1 | 0 |
Variance and error: Variance estimation, 0.000485; Std error estimation, 0.022014; AIC, −228.768; SBC, −203.912; Number of residuals, 50. AIC and SBC do not include log determinants.
Table 4.
Check white noise residuals, transfer function model for Chile.
| Autocorrelation Check Residuals | |||||||||
|---|---|---|---|---|---|---|---|---|---|
| To Lag | Chi-Squared | DF | PR > ChiSq | Autocorrelations | |||||
| 6 | 4.27 | 5 | 0.5115 | 0.203 | 0.066 | −0.176 | −0.016 | −0.014 | 0.042 |
| 12 | 12.81 | 11 | 0.3056 | 0.102 | 0.020 | −0.136 | −0.235 | −0.184 | −0.112 |
| 18 | 16.99 | 17 | 0.4552 | 0.063 | −0.017 | 0.092 | 0.041 | 0.034 | −0.193 |
| 24 | 24.57 | 23 | 0.3729 | 0.011 | 0.212 | 0.196 | 0.043 | 0.000 | 0.028 |
Table 5.
Parameter estimates for transfer function model, Chile. Dependent variable: log (1 − e).
| Conditional Least Square Estimation | |||||||
|---|---|---|---|---|---|---|---|
| Parameter | Estimate | Standard Error | t Value | Approx. Pr >|t| | Lag | Variable | Shift |
| AR1,1 | 0.64758 | 0.12651 | 5.12 | <0.0001 | 4 | log_1_e | 0 |
| NUM1 | 0.09533 | 0.02526 | 3.77 | 0.0005 | 0 | log_S_R | 0 |
| NUM2 | 0.13048 | 0.06676 | 1.95 | 0.0575 | 0 | log τ | 0 |
| NUM3 | 0.13874 | 0.07766 | 1.79 | 0.0814 | 0 | log_PIB | 0 |
| NUM4 | 0.06165 | 0.0074901 | 8.23 | <0.0001 | 0 | ls2008q1 | 0 |
| NUM5 | −0.04843 | 0.01282 | −3.78 | 0.0005 | 0 | ao2006q1 | 0 |
| NUM6 | 0.03928 | 0.01305 | 3.01 | 0.0044 | 0 | ao2006q4 | 0 |
| NUM7 | −0.03680 | 0.01285 | −2.86 | 0.0066 | 0 | ao2007q3 | 0 |
| NUM8 | −0.02938 | 0.01262 | −2.33 | 0.0250 | 0 | ao2010q4 | 0 |
Variance and error: Variance estimation, 0.000212; Std error estimation, 0.014553; AIC, −273.021; SBC, −255.813; Number of residuals, 50. AIC and SBC do not include log determinants.
Publisher’s Note: MDPI stays neutral with regard to jurisdictional claims in published maps and institutional affiliations. |
© 2021 by the authors. Licensee MDPI, Basel, Switzerland. This article is an open access article distributed under the terms and conditions of the Creative Commons Attribution (CC BY) license (http://creativecommons.org/licenses/by/4.0/).
Share and Cite
MDPI and ACS Style
González Aguirre, J.; Del Villar, A. Administrative Costs and Tariff Rates in the Presence of Customs Evasion: Evidence from Ecuador. Economies 2021, 9, 21. https://0-doi-org.brum.beds.ac.uk/10.3390/economies9010021
AMA Style
González Aguirre J, Del Villar A. Administrative Costs and Tariff Rates in the Presence of Customs Evasion: Evidence from Ecuador. Economies. 2021; 9(1):21. https://0-doi-org.brum.beds.ac.uk/10.3390/economies9010021
Chicago/Turabian StyleGonzález Aguirre, Jazmín, and Alberto Del Villar. 2021. "Administrative Costs and Tariff Rates in the Presence of Customs Evasion: Evidence from Ecuador" Economies 9, no. 1: 21. https://0-doi-org.brum.beds.ac.uk/10.3390/economies9010021
Note that from the first issue of 2016, this journal uses article numbers instead of page numbers. See further details here.