
Regional Stock Exchange Development and Economic Growth in the Countries of the West African Economic and Monetary Union (WAEMU)


School of Economics and Management, Southwest Jiaotong University, Jiuli Campus, Chengdu 610031, China
Economies 2021, 9(4), 181; https://0-doi-org.brum.beds.ac.uk/10.3390/economies9040181
Submission received: 10 October 2021
/
Revised: 5 November 2021
/
Accepted: 8 November 2021
/
Published: 17 November 2021
(This article belongs to the Special Issue International Financial Markets and Monetary Policy)
Abstract
:This study used panel data covering 27 years to investigate the causality between regional stock exchange development and economic growth in the West African Economic and Monetary Union (WAEMU) countries. We performed a homogeneous Granger non-causality with an autoregressive distributed lag model (ARDL) and Markov-switching analysis, using six indicators for the stock and financial market and six for control. The results showed a close economic relationship between WAEMU countries and causality from the regional stock exchange, which supports the supply leading hypothesis. The causality was confirmed in the short and long run, depending on the variable. The causal relationships that support the demand-driven hypothesis were recorded from the economic growth for four market measurements.
JEL Classification:
E44; G10; O431. Introduction
Financial market conditions are usually linked to a country’s political and economic conditions. Developed countries have an established market or trade in well-developed markets, whereas emerging financial markets belong to developing countries. Further, pre-emerging markets, or frontier markets, are those belonging to less developed countries. Almost every developed country has many financial services provided by a multitude of institutions operating in a diversified and complex network, which together make up the financial system.
However, in developing countries, the financial system offers shorter ranges or lower-quality services. Today, in developing countries, development of the financial system is considered an excellent way to support economic growth and includes the development of financial institutions, financial markets, etc. Rao and Cooray (2011) found that for countries with lower incomes, but not for those with higher ones, there is a close relationship between future economic growth and stock exchange activity.
Most low-income countries are still at an early stage of development. With a low Gross Domestic Product (GDP) per capita, and a small population, these frontier market countries (Shum 2015) usually do not even have a domestic financial market. However, they can depend on or be influenced by stock exchange activities. Among these countries, some have established communities, such as the West African Economic and Monetary Union (WAEMU). Categorised as a frontier market (MSCI 2021), the WAEMU possesses a financial market known as the Regional Securities Exchange or the Bourse Régionale des Valeurs Mobilières (BRVM). As the saying goes, “United, we are stronger.” WAEMU countries are neither financially stable nor economically strong enough to have different exchanges, and so by pooling resources they can safely navigate internationally.
The BRVM, the common exchange of the eight states (Benin, Burkina-Faso, Cote d’Ivoire, Guinea-Bissau, Mali, Niger, Senegal, Togo) of the WAEMU, is one of the very few exchanges worldwide that is regionally integrated and serves as the central exchange for a group of regionally related countries, as noted by Ganti (2019). Despite many challenges, it should be a pioneer for the further integration of the stock exchanges in Africa (James 2018). The eight member states of WAEMU are all developing countries, which are still considered low-income countries; hence, the impact of the regional stock exchange on their economy becomes important.
Another factor that should not be overlooked is what WAEMU countries have in common: they are all post-colonial states that are still under monetary control. They use a currency called the CFA franc (Franc of the African Financial Community). Assane and Malamud (2010) pointed out that the constraints of monetary unions affect the financial depth of the CFA countries and hurt economic growth. Koddenbrock and Sylla (2019) later found that the CFA caused extreme external repression of financial and monetary policies because of its dependence on the euro and the US dollar. The reason is that France prints the CFA for the CFA countries and is, therefore, able to control the financial and monetary regulations, the money supply, the credit allocation, the banking activities, and the economic and budgetary policies of these nations.
Moreover, as suggested by Tadesse (2018), this control breeds corruption and illegal diversion of public aid between France and its former colonies. For instance, conditional French public aid has forced these African states to spend the money destined for aid on French equipment, goods or contracts with French firms, especially construction and public work firms. Internally, the design of the CFA franc strengthens the constraints that are imposed on all bank–firm relations and central bank policies in the Global South and makes it more difficult to pursue growth strategies for the benefit of the broader population. The CFA franc is a heavy economic burden on WAEMU countries. To support these observations, Sow et al. (2020) explained that various financial development policies have been unsuccessful from independence (1960) to the present. As a result, economic development is slow, not to mention the existence of lasting economic precarity. WAEMU countries are facing an unprecedented economic dilemma stemming from their common currency, whereas, in contrast, most of the low- and high-income countries studied have independent currencies.
Given the interest in financial markets, the specifics of developing markets, and WAEMU countries, this study attempts to assess the existence and nature of the relationship between BRVM development and economic growth in WAEMU countries. To this end, a panel Granger non-causality procedure is conducted for the eight WAEMU countries, followed with an Autoregressive Distributed Lag model (ARDL) and a Markov-switching analysis.
The contribution of this paper to the empirical literature on stock exchange development and economic growth covers various aspects. First, it examines the WAEMU regional stock exchange, which has not been the subject of many studies up to now. Second, awareness is created concerning whether WAEMU countries should use the BRVM as an economy booster given their current level of development. Third, given the analysis process, cross-sectional dependence is considered for the causality approach, in order to avoid inconsistency and bias in the empirical results. To the best of our knowledge, no such attempt to include the cross-sectional hypothesis in the literature on stock exchange development and economic growth in the WAEMU countries has been made up to date. Fourth, financial development is known to be of a multidimensional nature. Thus, to capture the numerous aspects of the market in the economic development process, we utilize six indicators. Finally, the dataset contains eight countries for a period of 27 years, to abide by the well-known rule of thumb in economics which stipulates that a large dataset is necessary for a relevant panel data analysis.
2. Review of Literature
Long-run securities, such as bonds and shares, are among the services provided by capital markets. Several authors, such as Ewah et al. (2009) and Oke and Adeusi (2012), stated in their contributions to the literature that the capital market (comprising bond and equity markets) is the market in which medium- to long-term financing can be obtained. The purpose is to develop companies that, as a result, promote a nation’s economic growth. Therefore, the existence of the capital market seems to be an economic booster. However, such an expected positive effect should differentiate between countries to avoid scientific bias, as economic realities differ from country to country.
Seven and Yetkiner (2016), who examined 146 middle- and high-income countries from 1991 to 2011, found a significant positive correlation between economic growth and stock exchange development. However, almost a decade earlier, Ben Naceur and Ghazouani (2007) had contradicting views on developments in financial markets and economic growth in middle-income countries. By examining a sample of 11 countries in the MENA (the Middle East and North Africa) region, they reported that the development of financial systems could harm economic growth. Later, Stephen and Enisse (2012) pointed out that financial booms rarely encourage growth and suggested re-examining the relationship between real growth and finance. Yu et al. (2012) were more specific, arguing that the positive relationship between growth and finance found in many studies is a long-run relationship. Regarding underdeveloped countries, they mentioned that these countries may face slower economic growth in the short run, although the stock exchange is developing, mainly because of political instability and poorly enforced legal systems. It can be observed here that the positive effect of stock exchange developments on economic growth, especially in the middle- and low-income countries, is shadowed by the negative impact of political instability and poor enforcement. Thus, depending on the size and direction of the changes, the positive effect may prevail, or the countries may face a slowdown in their economy in the short or long run.
With underdeveloped or low-income countries, however, some authors, such as Haque (2013), who examined the countries of the South Asian Association for Regional Corporation (SAARC), could show that stock exchange developments had no significant influence on economic growth. Rioja and Valev (2014) supported these findings. Using a large cross-country panel, they observed a significant positive impact on stock exchanges and capital accumulation in banks for high-income countries; however, banks have not contributed to productivity growth or capital accumulation in low-income countries. Here, the stock exchange development seems to have a neutral effect on economic growth, and thus we can conclude that capital markets are not among the best channels for economic development in developing countries.
This idea is supported by the findings of Ewah et al. (2009). Using multiple regression and ordinary least squares (OLS) on 44 years of data, they conducted a study on Nigeria and showed that the Nigerian capital market, although endowed with the ability to induce growth, has not contributed significantly to Nigeria’s economic growth because of low market capitalisation, small market size, low transaction volume, illiquidity, and few listed companies, etc. Francis and Ofori (2015), working with data on 101 countries from 1980 to 2009, showed that political instability in some underdeveloped countries can hamper the development of stock exchanges and justify their ineffectiveness regarding economic growth because the stock exchange development is positively influenced by policy scores. Karim and Chaudhary (2017) also pointed out that while stock exchange developments contribute to South Asia’s economic growth to some extent, their effect is negligible. A year later, Pan and Mishra (2018) concluded that there is no significant impact on economic growth in economies where the stock exchange plays a minimal role (large economies like China).
The preceding lines reveal two major pieces of information. Firstly, the positive or negative impact of the stock exchange on economic growth is to be observed in the long or short run, depending on the income level and political characteristics of the country. Secondly, in most cases, the development of the stock exchange plays an economically neutral role and can even be a hindrance.
Instead, some authors have looked only for a connection and have concentrated on analysing the causal relationship between economic growth and stock exchange developments. In Nigeria, Adamu and Sanni (2005) used regression analysis and the Granger causality test to assess the role of the stock exchange in economic growth in Nigeria. A one-way causality between market capitalisation and GDP and a two-way causality between market turnover and GDP growth was discovered. A significantly positive relationship between turnover ratios and GDP growth was also observed. This suggests that market turnover and turnover ratios are essential stock exchange proxies that impact economic growth.
In Nigeria too, Kolapo and Adaramola (2012) carried out a Granger causality and Johansen cointegration test. They discovered a long-run positive influence of the capital market on economic growth. Demirguc-Kunt et al. (2012) also showed that the development of banks and stock exchanges shows a parallel relationship with the economic growth of countries. Therefore, even if no direct causality is shown, it is evident that the development of stock exchanges and economic growth advance as a pair. Ikikii and Nzomoi (2013) confirmed this by examining the effects of the development of the stock exchange on economic growth in Kenya. Using quarterly time-series data, they found that stock exchange developments had a positive impact on economic growth.
Mittal (2014) also found strong indications of an existing causality in his search for a causal relationship between economic growth and the stock exchange in the newly industrialised countries (NIC). He suggested that the governments of these countries should better direct monetary and fiscal policies towards promoting the growth of the financial sector. Later, Milka (2021) carried out a similar analysis in Serbia. With the Toda-Yamamoto-Dolado-Lütkepohl approach for the Granger causality test, the vector autoregression model, the forecast error variance decomposition, and the impulse response function, he demonstrated the existence of a unidirectional Granger causality from stock exchange development to economic growth.
Similarly, Maku (2020) used an autoregressive distributed lag model (ARDL) bound test and examined the relationship between the development of stock exchanges and economic growth in Nigeria. The empirical results confirmed the existence of a long-run relationship between stock exchange development and growth. Ezeibekwe (2021) used a vector error correction model and concluded that using the ratio of market capitalisation to GDP as a proxy for stock exchange development does not contribute significantly to economic growth in Nigeria in the long run. This finding implies that the Nigerian economy is still at a stage of development where the stock exchange cannot play a crucial role in economic development.
It is evident that there are still contradictory views regarding the relationship between stock exchange development and economic growth, even though the causal effect of the stock exchange on the economy, especially in underdeveloped countries, has been confirmed by most studies. This hypothesis of the causal effect of stock exchange development on the real economy belongs to supply leading theory.
This theory suggests that the accumulation of financial assets improves economic growth; therefore, the development of the financial markets will lead to positive economic growth (McKinnon 1973; Shaw 1973). As observed in some studies, the results sometimes suggest an economy to stock exchange causality or a reverse relationship between the stock exchange and economic growth. This gives rise to another hypothesis, expressed as the demand-driven hypothesis, by Friedman and Schwartz (1963). They suggested that economic growth brings with it the emergence and establishment of financial centres. Simply put, the growth of the real economy endogenously determines financial development. These two theories are part of others drawn from decades of research into the finance–growth nexus. Fink et al. (2006) pointed out that the nexus between the real economy and the financial market can be summarised in five forms: supply leading, demand-driven, no causal relationship, interdependence, and negative causality from finance to growth.
One reason for the ambiguity in the existing literature about the financial growth nexus issue could be the proxies used for the stock exchange and the real economy. Using one or two proxies is too restrictive to capture different aspects of the market. As often used, gross domestic product (GDP) also measures an annual global or individual level of production instead of the actual economic growth trend. Another reason may be the geographical limitations and economic diversity of countries. Most studies relate to specific countries and rarely to groups of countries with a financial market. Even if different countries are included in panels, they are often heterogeneous. Most of the countries examined so far have also been economically independent with a local currency, unlike WAEMU countries, which still use a common currency, often referred to as colonial money.
Given the peculiarities of the WAEMU context, this paper seeks to determine whether WAEMU countries will benefit from having a financial market. We also test demand-driven and supply-driven hypotheses
3. Research Data, Materials, and Methods
3.1. Data Source and Type
The first steps of the BRVM can be traced back to 14 November 1973 when the treaty establishing the WAEMU was signed. Members included Burkina Faso, Benin, Côte d’Ivoire, Niger, Mali, Togo, and Senegal. In 1997, Guinea-Bissau joined, and to date there are eight member countries. On 17 December 1993, the WAEMU Council of Ministers set up a regional financial market and commissioned the West African Central Bank (WACB), known as Banque Centrale des États de l’Afrique de l’Ouest (BCEAO) in French, to manage the project.
Introducing the market regime in 1997 gave investors more confidence and helped stimulate business. With e-commerce and the transition to daily basic trading (1999–2001), a steady increase has been observed since 2000. As Proshare (2010) reported, many years of reforms caused significant changes in 2011 and 2013, and saw a sharp decline in operations, with the market recovering and booming in 2012. Since then, the BRVM has experienced a stable evolution.
Pan and Mishra (2018) found that most time-series research used a short sampling period because of data limitations. This problem is more pronounced in developing countries where obtaining data is quite a challenge. This study also deals with this problem, even though the focus is on panel data. While updated time-series data can be obtained for most of the companies listed on the BRVM, countries updated market data remain a challenge. The data used in this study were obtained for each WAEMU country from the World Bank (Global Financial Development Database, World Development Indicators Database, and World Governance Indicators Database) and the International Monetary Fund (Financial Development Index Database). The first data collected covered from 1971 to 2020. Data were then filtered variably. For some variables, data were not available as early as 1989, and the last update for some variables was before 2016. Therefore, after filtering, the final data set contained observations from 1989 to 2015.
3.2. Stock Exchange and Other Variables
The model used was, like that of Mohtadi and Agarwal (2007), a modified and improved version of the well-known model by Levine and Zervos (1998). The first specificity of this improved model is to overcome the measurement and consistency problem associated with the use of two different data sources by Levine and Zervos (1998). Although the present study uses different data sources, they are filtered and combined into one single final dataset for analysis. Moreover, the data sources are interconnected, which guarantees the consistency of our data. Second, this model uses several measures of stock exchange development to maximize the use of information extracted from the data, as opposed to a single composite measure. It enables the economic growth in year t to be estimated as a function of the stock exchange development in year t-1.
This study also used several proxies of the stock exchange development to optimally employ the information obtained from the data instead of a single composite measure. However, some financial indices were added individually to represent the development of both the financial market and of the stock market. The purpose was to capture different aspects of the market and create more space for relevant results to be achieved. The PSE (primary school enrolment) variable was also added to the model, along with CC (corruption control) and OP (oil prices). WAEMU countries face many challenges in primary and secondary education. In a 2015 education report, the Africa-America Institute (AAI) mentions that many African countries cannot keep up with rising enrolments, the results of which are that the learning outcomes have been negatively impacted (AAI 2015). Therefore, governments need to invest in educational innovation to improve the quality of education in schools. The variables were the following:
- -
- Stock Market Capitalisation (SMC): This results from the market capitalisation of listed companies divided by GDP.
- -
- Shares Traded Total Value (STTV): This represents the value of the shares traded and the total market capitalisation above GDP.
- -
- Stock Market Turnover Ratio (SMTR): This is measured as the market capitalisation of listed companies (MCLC) divided by the total market capitalisation (TMC).
Three variables for financial development were taken from the financial development index database and used in this study, as follows:
- -
- Financial Markets Access Index (FMA): This represents the level or degree of accessibility of the market by individuals, companies, and countries to raise funds, invest in the market, etc.
- -
- Financial Markets Depth Index (FMD): This represents the depth of the market or its ability to take large orders without significantly impacting the prices of the securities.
- -
- Financial Development Index (FD): This represents the level of development of the market.
Information for the remaining variables was collected from the World Development Indicators database:
- -
- Growth: This measure represents the annual growth rate per capita and was used as a dependent variable.
- -
- Foreign Direct Investment (FDI): Since FDI is considered a determinant of economic growth, it is used as a control variable. In this study, the variable was the value of net FDI divided by GDP.
- -
- Investment (INV): Investments are defined as real investments divided by GDP.
- -
- Primary School Enrolment (PSE): PSE was represented as a percentage of the total population.
- -
- Corruption Control (CC): CC captures the perception of the extent to which public power is exercised for private gain. The values were estimates (in units of a standard normal distribution) of the country’s score on CC.
- -
- Oil Prices (OP): OP represents the pump prices of the best-selling grade of gasoline.
- -
- Inflation (INF): INF shows the rate of change in prices in the economy. This variable was used because of the special situation that WAEMU countries have (sharing a common colonial currency, namely the CFA franc). WAEMU member countries were once French colonies. After their independence, among other agreements, they have kept a currency that is printed and entirely dependent on France, their former colonist. Thus, the CFA franc is called colonial currency. Some studies have analysed the parity of the fixed exchange rate between the French franc (FF) and the CFA franc (FCFA), as this exchange rate does not reflect the economic fundamentals of the countries it should serve (Des Adom 2012). Given also the increasing globalisation of financial markets, raw materials, and volatile oil prices, the CFA franc faces challenges, such as significant changes in export prices and a prolonged genuine appreciation of the currency (Gulde and Tsangarides 2008).
3.3. Model Specification
According to Mohtadi and Agarwal (2007), the original approach enables control for countries as a block and each country specifically. It is divided into two models: the first model tests whether the stock exchange affects economic growth, and the second examines their relationship. However, our approach was slightly different in that we only checked for the entire region. This is because the WAEMU states have a unique stock exchange that pools the countries’ financial market investments.
Checking for country-specific observations would also have meant a small sample of observations over 27 years. As a result, a country-specific process in WAEMU countries could have resulted in biases. We only used one model and directly investigated the relationship between regional financial market development (with an emphasis on stock exchange development) and economic growth in WAEMU countries.
Here, the growth (as a dependent variable) at time t was a function of the other variables at time t − 1. Our analysis was based on the following panel data model:
where i represents the unit of observation, t indicates the time, j is the observed explanatory variables, t is the time trend, and δ signifies the implicit assumption of a constant rate of change. y stands for the dependent variable and X for the independent variable (k is up to 12 in this study). c represents the unobserved effect, and ε is the error term. β are the individual intercepts or slope coefficients that can differ across the states.
We reinforced the model with a step-by-step analysis process that compensated for our dropping of model 1 by Mohtadi and Agarwal (2007) and made the results more robust. For the analysis process, the steps recommended by Menegaki (2019) to implement an ARDL were followed. This procedure was chosen because it is a step-by-step sequence that guarantees control of model misspecifications and more relevant results. The approach of Mohtadi and Agarwal (2007) has long since been proven efficient, but the economic case of the WAEMU requires more precision. With the additional variables in the model (both stock and financial market) and considering the improvement of econometric measurements in the scientific literature, traditional analysis procedures (regression, correlation tests, etc.) may not be enough. Therefore, it was applied in the ARDL procedure. The ARDL is a step-by-step procedure in which the next test to apply depends on the results from the previous test; thus, the final results are more precise. The first stage of the analysis was a cross-sectional dependency test, the second stage was a stationarity test, the third stage was a cointegration test (for non-stationarity), and the last step was a causality test. After these steps, an actual ARLD regression with structural break control was implemented to check the robustness. The control of structural breaks was important to our analysis because of many global events (such as the Afghanistan and Iraq wars, the Asian financial crisis, the attacks on the World Trade Centre, and the 2008 Global Financial Crisis), which occurred during our sample period. We completed our analysis process by performing a dynamic regression (Markov-switching regression).
4. Data Analysis, Results, and Discussion
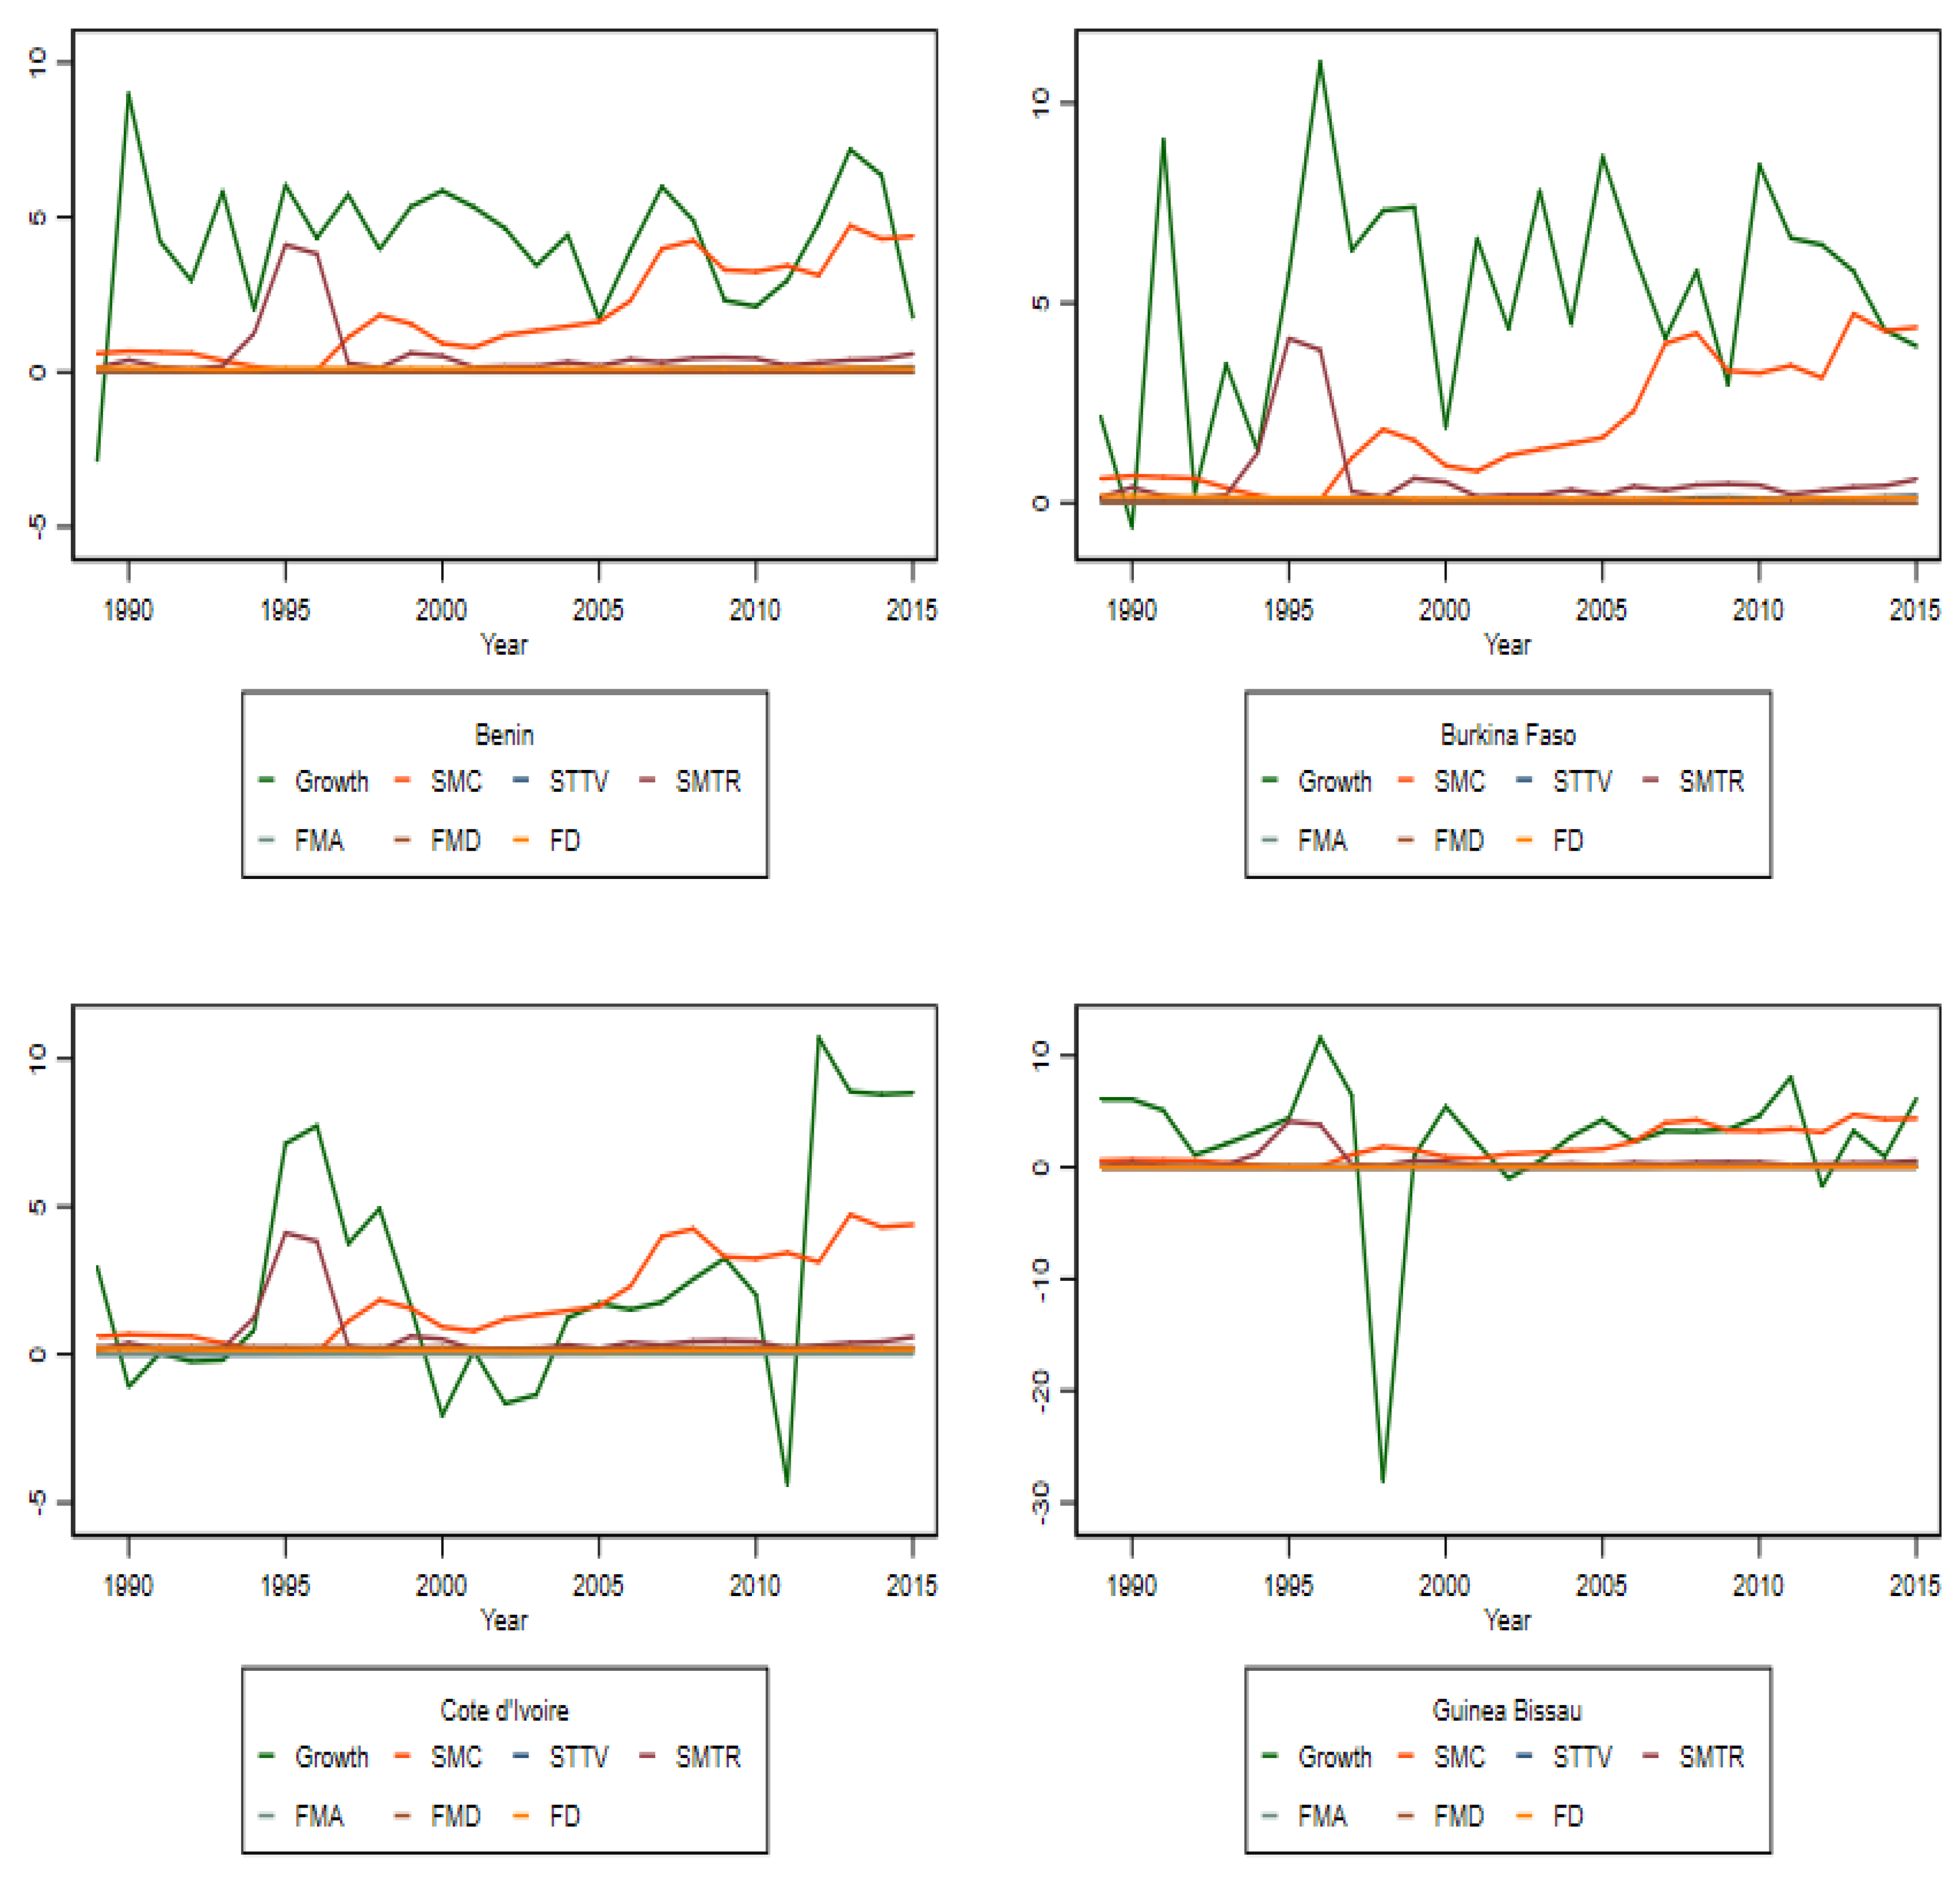
The details of the data for each variable are shown in Table A1. Negative values can be observed for Growth, CC, INV, FDI, and INF in WAEMU countries. Figure A1 and Figure A2 in the Appendix A Table A1 give a visual representation of the evolution of economic growth along with the stock and financial market variables in each of the WAEMU countries. A quick look at the figures does not seem to show that growth for any WAEMU country followed the same trend as other variables. However, higher stock market capitalisation (SMC) appears to be associated with higher economic growth.
We had an overall observation of 216 per variable with T = 27 and N = 8. Where T is small and N is large (the common situation when analysing panel data), a Pesaran test, a Friedman test, or a Frees test (Friedman 1937; Frees 1995, 2004; Pesaran 2004) are better adapted, but if T > N, the Lagrange Multiplier (LM) test by Breusch and Pagan (1980) is well suited to test the cross-sectional dependency (CD) (see Equation (2)).
where is the estimated correlation coefficient between the residuals derived from the panel model estimate. Under H0, there is an asymptotic chi-square distribution (chi2) concerning the LM statistic with a degree of freedom of N (N − 1)/2. i, j, and T are derived from the panel model equation, with t = 1, 2, ..., T.
As shown in Table A2, the results suggest the rejection of the null hypothesis; there was a correlation between the panels’ attributes. This means that any shock in one of the WAEMU countries will be transmitted to others. In line with Pesaran and Yamagata (2008), we also checked the nature of our panels.
The slope homogeneity null hypothesis H0 is βi = β for each is compared to the heterogeneity hypothesis H1: βi ≠ βj for pair-wise slopes non-zero fraction for i ≠ j.
Pesaran and Yamagata (2008) developed standardised dispersion statistics that cover a broader spectrum of analysis. In contrast to Swamy’s (1970) model, which is only limited to models where N is relatively smaller than T, it takes the Pesaran and Yamagata model into account and extends it to wider panels. The model is represented as:
with being a modified version of Swamy’s (1970) slope homogeneity test.
where represents the pooled OLS estimator, is the pooled estimator of the weighted fixed effect, is an identity matrix, and is the estimator of .
In addition, the test’s small sample properties can be improved with normally distributed errors by using the following variance and mean bias-adjusted version:
with , and .
The analysis result (Table A2) did not reject the null hypothesis of homogeneous coefficients. Therefore, in the WAEMU area, there will be replication in other countries of every significant economic relationship or change in one country.
From the previous analysis, we could have gone straight to a bootstrap panel Granger causality according to Kónya (2006); however, this requires cross-sectional dependency and cross-border heterogeneity, which was not the case for us.
Following the analysis, four tests—Hadri Lagrange, Levin Lin Chu, Im-Pesaran-Shin, and Fisher—(Hadri 2000; Levin et al. 2002; Im et al. 2003) were carried out to check the stationarity; this provided information about the degree of integration for each variable. As shown in Table A3, only Growth, SMTR, FD, OP, FDI, and INF were stationary. By computing the first difference, the stationarity for SMC, STTV, FMA, FD, CC, INV, and PSE was restored.
The non-stationarity of some variables suggests a long-run relationship between them that can affect growth. Therefore, a little digression into cointegration analysis is necessary. Since there are multiple cointegration tests and remembering that our panels were homogeneous (Table A2), the best option was that of Kao (1999), which allows five sets of tests specifically designed for homogeneous panels to be performed. Kao’s cointegration test can be carried out together with those of Pedroni (1999) and Westerlund (2005). However, since the Westerlund test assumes heterogeneous coefficients, it did not fit into our context. Pedroni’s test assumes both homogeneous and heterogeneous coefficients. Therefore, besides the Kao test, we also carried out the Pedroni cointegration test. Both tests’ results confirmed the cointegration (Table A4).
For further analysis and to take robustness into account, we performed a dynamic ordinary least squares (DOLS) regression.
The fully modified ordinary least squares (FMOLS) regression was developed by Phillips and Hansen (1990), and later Stock and Watson (1993) developed the DOLS. These models help generate coefficients that are asymptotically efficient because they consider both serial autocorrelation and endogeneity. They are only used if the variables are stationary at the first difference. The ordinary least squares (OLS) regression is often skewed when the variables are non-stationary and cointegrated, while DOLS and FMOLS are not. However, FMOLS is designed and works well with heterogeneous data, while DOLS offers more flexibility. Because of our data, we only had a DOLS regression.
As can be seen in Table A5, there was a significant and positive long-run relationship between stock and financial market variables and growth, except for STTV, which hinders growth over the long run. The control variables (except for OP and FDI) also showed significant long-run relationships with growth. CC, INV, and PSE contribute to economic growth, while INF does not. These results reflect reality since the reduction of corruption reduces the loss of money and allows the perfect implementation of projects and policies, thus improving the economy. The more investment, the more employment and increased economic activity. As for education, it is the very basis for any nation; and it starts from primary school. Based on these first observations, one might be tempted to say that stock exchange developments are contributing to economic growth in WAEMU countries; however, such a conclusion would be far too easy.
We proceeded with a causality analysis by running a Granger non-causality test. The most widely used Granger causality tests are designed for heterogeneous panels. Juodis et al. (2021) proposed a novel approach that helps perform a Granger non-causality test in both heterogeneous and homogeneous panels that best fit our data. Table A6 shows the outcome of the Granger non-causality test.
A first test was performed with Growth as the dependent variable; then reverse causality was implemented to assess the effect of Growth on each of the dependent and control variables. There was a one-way causality between FMA and FMD to Growth and from Growth to INV. For the other independent variables and control variables, a bidirectional causality was observed in Growth.
According to the results so far, the financial market (the BRVM) is linked to economic growth and contributes to this in WAEMU countries. This conclusion is supported by the results of the DOLS regression, which showed significant long-run relationships between Growth and SMC, STTV, SMTR, FMA, FMD, and FD. The only negative relationship observed over the long run was with STTV, which showed significance at the 1% level (Table A5). The results also confirmed the supply-leading hypothesis for the stock and financial markets (all six variables cause growth); in other words, the development of the stock and financial market contributes to economic growth. The demand-driven hypothesis was confirmed for the stock exchange (the three stock exchange variables were caused by Growth versus one in three for the financial market variables); that is to say, the increase of the economy significantly participates to the improvement of the stock exchange, and somewhat to the development of the financial market.
Regarding the control variables, although INV had a long-run relationship with Growth, it had no causality. The remaining control variables (CC, OP, FDI, PSE, INF) Granger caused growth (Table A6); meaning that they have an impact on the economy. The positive impact of CC is not surprising, as better anti-corruption policies will lead to a healthier economy in the long run.
After the causality analysis, an ARDL regression was implemented. Since the number of the ARDL’s regressive variables was limited, we split our original model into two equations for its application. We outline our ARDL representation in Equation (6) for stock and financial market variables and in Equation (7) for control variables.
where i, j, k, l, m, and n are the number of lags for the independent variables in the models. Akaike Information Criterion (AIC) and Schwartz Bayesian Criterion (SBC) were used to determine the optimal lag number and the ARDL (1,0,0,0,0,4) was chosen for both equations. We then formulated our unrestricted error correction models:
We estimated long- and short-run coefficients. The long-run relationship results of the DOLS analysis were robust with the ARDL results. Therefore, only the ARDL results for the short-run relationship were reported (Table A7).
From the observation of Table A7, we see that only STTV and SMTR had a significant positive relationship to Growth in the short run at the 1% and 5% levels, respectively; so a one point increase in the SSTV (SMTR) increases growth by 11.4781 (0.7832) points in the short run. So while STTV promotes growth in both the short and long run, SSTV hinders growth in the short run and promotes it in the long run. Other stocks and financial market variables do not appear to impact economic growth in the short run. As for the control variables, CC, OP, and FDI had a significant negative relationship to growth in the short run; any increase in point in this variable will reduce economic growth. The short-run negative effect of CC is understandable because the West African states have been under the influence of Western countries for decades and still leave the doors open to mismanagement of the countries’ economic resources. A sudden breakdown of corruption in these countries will undoubtedly shake the system and affect the economy in the short run. However, the equilibrium is restored over time for the benefit of citizens and the economy, as shown by the positive long-run results (Table A5). This long-run horizon may be difficult to estimate at present since WAEMU countries are still under the yoke of France, which steers policies from outside. It implies that corruption control is unlikely to be effective at the high level of government decision-making. The short-run effects will be those observed outside of the government system’s core: the part which is directly connected to the population, and which explains the immediate negative impact on the economy. Only INV, PSE, and INF had no short-run impact on economic growth. One comment on OP is that most WAEMU countries are oil price takers, and the few countries that produce cannot set prices at will because they are post-colonial states. Post-colonial states are de jure independent but are constrained by their economic systems so that policy is steered from outside (Ian 2019).
It seems understandable that if a negative effect on the economy is observed in the short run, no recognisable effects are to be expected in the long run. The negative impact of FDI in both the short and long run can be explained by the fact that foreign investment is mainly aimed at capitalising on the weaknesses of WAEMU countries and serving Western countries. Concerning PSE, it is widely used in assessing economic growth in underdeveloped or developing countries. Primary education is the foundation for any government to upgrade and improve its educational level, and our results confirmed its importance to the economy. The real benefits of primary education can only be seen in the long run. Our inflation results were contrary to those of Barcola and Kebalo (2018). They found that inflation does not affect economic growth in West Africa and has a positive effect on the economy within a certain threshold. While some economically independent West African countries, such as Ghana, Nigeria, etc., could benefit from INF, our results demonstrate that in WAEMU countries, inflation significantly hinders economic growth in the long run. This can be explained by the fact that WAEMU member countries, as mentioned earlier, are using a colonial currency. Since that currency limits them, they do not receive direct shocks from the international price movements and are literally in a state of “stability.” Thus, the impact of inflation on the economy will take longer to be observed, compared to economically independent countries.
The diagnostic checks showed that there was no serial correlation and heteroscedasticity. The three tests carried out to control structural breaks also yielded negative results; namely, they confirmed the null hypothesis of no structural breaks over the study period (Table A7).
We complemented our static analysis with a dynamic analysis using a Markov-switching dynamic regression. Although the WAEMU’s regional stock exchange shows no structural break, there may be times of regime changes (international or regional) that will affect the market and the economy. We assume two regimes in the economy: high and low volatility. According to Bautista (2003), the state of volatility comes from an unobserved first-order Kth state Markov process. It can be described by transition probabilities.
With Pij, the probability is that state i will be followed by state j. Ertugrul and Ozturk (2013) later specified that for the first-order Markov assumption it is necessary that the probability of being in a state depends entirely on the previous state. The simplified transition probability matrix, according to Coskun et al. (2017), is shown in Equation (11) below:
As can be seen from Table A8, the dynamic regression confirmed the findings of the static analysis. SMC promotes economic growth in the long run but can hinder it in a system with high volatility. STTV has a short-term positive influence on economic growth with high volatility and in the long run a negative impact on growth with low volatility. SMTR contributes to economic growth in the short and long run with high and low volatility. FMA, FMD, and FD all promote long-run economic growth with low and high volatility regimes, respectively. Details of other variables can be found in Table A7.
From the above analysis, the study’s results show that WAEMU member countries are homogeneously interconnected. Similarly, their financial and real sectors are interdependent. The individually addressed regional stock exchanges and the globally considered financial markets are closely connected to WAEMU’s economic growth. All the stock and financial market proxies cause (contribute to) economic growth, and a bidirectional causality has been observed between economic growth and the stock and financial market proxies, except for financial market access and depth.
The study has revealed that the stock exchange is driving economic growth in the region, which is very important. Only STTV hinders economic growth in the long run with low volatility regimes. Financial markets are driving economic growth globally. Increased FMA, increased FMD, and FD will contribute to WAEMU’s economic growth in the long run. These observations suggest that the development of BRVM and its stock exchange play an important role in boosting the economies of WAEMU countries.
In the long run, measures must also be taken to prevent or undo the negative effects of the STTV.
In the remaining variables, we found that INV does not cause (has no impact on) economic growth in WAEMU countries, despite having long-run positive relationships with WAEMU countries. FDI and OP cause (lead to) economic downturns in the short run, and INF impedes economic growth in the long run.
The impact of CC in WAEMU is negative in the short run but positive in the long run. Primary school education (PSE) has no impact on growth in the short run but has a significant positive impact in the long run.
5. Conclusions
The relationship between economic growth and financial development remains a hot topic for extensive research and debate. The existence of a causal relationship between financial development and economic growth is still unknown. The available literature that proves the existence of causality remains uncertain regarding the direction of the causality.
This paper has examined the direction of the causal relationship between stock exchange development and economic growth in eight WAEMU countries that have shared a unique stock exchange (BRVM) for 27 years. The applicable methodology was Granger’s non-causal relationship, completed by ARDL and Markov-switching analysis.
The study reveals that WAEMU member countries are not simple members of the Union but are all interconnected. Any significant economic situation in one country will reverberate on other countries. Further, the regional stock exchange is confirmed to be a major participant the economic development of WAEMU countries. The level of market capitalization, the value of share traded and the market turnover contribute to boosting the regional economy. In return, the growth of the economy contributes to the development of BRVM. The index of financial development further confirms this mutual relationship between BRVM development and WAEMU economic growth. Thus, it is a call for the eight countries’ governments to work hand in hand with institutional and individual investors to guarantee a healthier development of the regional stock exchange for a better economy. Increased investment on the stock exchange is a key economic booster for the WAEMU member countries.
As access to the financial market is also important to boost the stock exchange activities and further promote the economy, governments should put more efforts into sensitizing the populations regarding financial investment and the use of the regional stock exchange. A sad reality of frontier markets is that, due to the low-income, the larger part of the population is focus on its day-to-day survival and is not educated for financial investment. The result is that, unlike developing or developed countries, most of the investors of BRVM are institutional, and very few are individuals.
It is well known that the WAEMU government uses financial markets to raise funds for public projects and investments, but these funds are often raised through the bond market. For example, WAEMU member countries mobilised US $17 billion in the regional money markets in 2020. The Republic of Benin alone completed one and set a record as of early January 2021 with a Eurobond issuance of 1 billion euros in the international bond market (Ecofinagency 2021a, 2021b). Given the importance of the stock exchange, the WAEMU government needs to rethink the activities of the regional stock exchanges and pay close attention to the optimal use of the stock exchange for the economic development of the country. This should start by raising awareness and educating the populations for investment in the regional stock exchange. Following this, measures should be taken to increase and facilitate market access to both individuals and institutional investors. More efforts should also be put into increasing the market depth for BRVM.
In the same perspective, WAEMU governments should gradually aim at giving priority to BRVM as financial partner and consider leaving the grip of the colonial currency. As observed, investments in WAEMU member countries do not promote economic growth, because most of the funds raised for projects or local development come from foreign investors, partners, or foreign companies. This also explains why when foreign direct investment is added, it does not take long for the economy to receive a blow. In addition, the control of monetary policies by France, as well as the use of the colonial currency, do not leave enough room for an efficient use of BRVM by WAEMU.
This study sheds more light on BRVM, which has not been the subject of extensive research. Diouf and Boutin-Dufresne (2012) focused on WAEMU’s growth financing from the securities market and reviewed its achievements and prospects. Ouedraogo and Drabo (2019) have investigated WAEMU’s regional integration and economic growth, and Zoungrana et al. (2021) have studied the effect of the occurrence of COVID-19 on BRVM stock returns. Other researchers have also conducted some research on WAEMU or BRVM, but none have focused on the relationship between the two. The relationship between financial market development and national economic growth has been widely studied around the world, and this study is the first of its kind. It provides a survey of the BRVM and economic growth in WAEMU countries under the pressure of a colonial currency.
Another contribution of this paper is that the financial markets considered as a whole, and some of them specifically considered (the stock exchange in this study), show a positive impact on the WAEMU. It also supports the stock and financial market supply leading hypothesis and, primarily, the stock exchange demand-driven hypothesis in WAEMU. Current research results are also consistent with most of the results of previous studies on the causal relationship between stock exchange development and the real economy in low- and middle-income countries (Kolapo and Adaramola 2012; Demirguc-Kunt et al. 2012; Ikikii and Nzomoi 2013; Mittal 2014; Milka 2021; Maku 2020; etc.).
A limitation may be that empirical analysis is not country specific. Proven country interconnections suggest that the economic events of one country are shared with others, but the findings relate to WAEMU as a whole. Therefore, further research may cause similar assessments at the WAEMU-country level. A future study can also focus on how financial debts, especially bonds, affect the economic growth of WAEMU member countries. Moreover, given the growing complaint that the FCFA as a currency slows the development of many African countries, future studies could analyse its role as a vector reducing the performance of the BRVM and the extent to which it hinders the economic prosperity of WAEMU countries. From a governance point of view, later research can examine to which extent policy makers can influence the development of both BRVM and WAEMU countries.
Funding
This research has been self-sponsored.
Data Availability Statement
The datasets used and analyzed in this study are available from the corresponding author on justified request.
Acknowledgments
Sincere gratitude to my dear supervisor, advisor, and teachers who contributed to this manuscript. Their moral support, expert advice, and suggestions will always be remembered.
Conflicts of Interest
The author declares no conflict of interest.
Appendix A

Table A1.
Summary statistics.
| Variables | Observations | Mean | Median | Std. Dev. | Min. | Max. |
|---|---|---|---|---|---|---|
| Growth | 216 | 3.645 | 3.932 | 4.248 | −4.666 | 14.377 |
| SMC | 216 | 1.930 | 1.478 | 1.496 | 0.049 | 4.728 |
| STTV | 216 | 0.053 | 0.029 | 0.048 | 0.006 | 0.168 |
| SMTR | 216 | 0.619 | 0.320 | 0.976 | 0.093 | 4.111 |
| FMA | 216 | 0.003 | 0.000 | 0.005 | 0.000 | 0.022 |
| FMD | 216 | 0.042 | 0.012 | 0.074 | 0.000 | 0.256 |
| FD | 216 | 0.106 | 0.110 | 0.030 | 0.013 | 0.171 |
| CC | 216 | −0.433 | −0.422 | 0.440 | −1.326 | 0.059 |
| OP | 216 | 0.391 | 0.000 | 0.531 | 0.000 | 1.680 |
| INV | 216 | 0.039 | 0.000 | 0.899 | −2.651 | 3.382 |
| FDI | 216 | −1.289 | −0.933 | 2.391 | −9.913 | 6.666 |
| PSE | 216 | 66.698 | 69.793 | 33.837 | 0.000 | 128.736 |
| INF | 216 | 6.930 | 3.108 | 14.068 | −5.816 | 67.894 |
Note: Table of the descriptive statistics for the variables. The sample contains 216-year observations from 1989 to 2015.
Table A2.
Cross-sectional independence and slope homogeneity test.
| Form | Test | p-Value |
|---|---|---|
| Cross-sectional dependence test a | ||
| LM Breusch-Pagan test | 41.50 | 0.048 |
| Slope homogeneity test b | ||
| −0.819 | 0.413 | |
| adj | −1.181 | 0.238 |
Note: The null hypothesis (Ho) for a is that there is cross-section independence. For b, the coefficients are homogeneous.
Table A3.
Stationarity test.
| Form | Variables | Hadri | LLC | IPS | Fisher-ADF | Conclusion |
|---|---|---|---|---|---|---|
| Normal | Growth | 0.1196 | 0.0000 | 0.0000 | <0.0500 | Stationary |
| SMC | 0.0000 | 0.4570 | 0.9995 | >0.0500 | Non-stationary | |
| STTV | 0.0000 | 0.7907 | 1.0000 | >0.0500 | Non-stationary | |
| SMTR | 0.0494 | 0.0000 | 0.0003 | <0.0500 | Stationary | |
| FMA | 0.0000 | 1.0000 | 0.0000 | <0.0500 | Non-stationary | |
| FMD | 0.0000 | 0.0583 | 0.0000 | >0.0500 | Non-stationary | |
| FD | 0.0000 | 0.0109 | 0.0385 | <0.0500 | Stationary | |
| CC | 0.0000 | 0.2942 | 0.0008 | <0.0500 | Non-stationary | |
| OP | 0.5493 | 0.3446 | 0.0000 | <0.0500 | Stationary | |
| INV | 0.0000 | 0.8145 | 0.0000 | <0.0500 | Non-stationary | |
| FDI | 0.0000 | 0.0150 | 0.0016 | <0.0500 | Stationary | |
| PSE | 0.0000 | 0.1695 | 0.2006 | <0.0500 | Non-stationary | |
| INF | 0.0000 | 0.0000 | 0.0000 | <0.0500 | Stationary | |
| First difference | SMC | 0.9303 | 0.0000 | 0.0000 | <0.0500 | Stationary |
| STTV | 0.3034 | 0.0000 | 0.0000 | <0.0500 | Stationary | |
| FMA | 0.9500 | 0.0000 | 0.0000 | >0.0500 | Stationary | |
| FMD | 0.7796 | 0.0000 | 0.0000 | <0.0500 | Stationary | |
| CC | 0.9957 | 0.0000 | 0.0000 | <0.0500 | Stationary | |
| INV | 0.9885 | 0.0000 | 0.0000 | <0.0500 | Stationary | |
| PSE | 0.9957 | 0.0000 | 0.0000 | <0.0500 | Stationary |
Note: For Hadri Lagrange (Hadri), Ho: all the panels are stationary; the alternative hypothesis (Ha) is that some panels contain unit roots. For Levin Lin Chu (LLC), Ho: there are unit roots in the panels, Ha: the panels are stationary. For Im-Pesaran-Shin (IPS), Ho: there are unit roots in all panels, Ha: some panels are stationary. For Fisher, Ho: all the panels contain unit roots, Ha: at least one panel is stationary.
Table A4.
Cointegration test.
| Form | Test | Statistic | p-Value | Conclusion |
|---|---|---|---|---|
| Kao | Modified Dickey-Fuller | −6.8663 | 0.0000 | Cointegrated |
| Dickey-Fuller | −8.5123 | 0.0000 | Cointegrated | |
| Augmented Dickey-Fuller | −6.0538 | 0.0000 | Cointegrated | |
| Unadjusted modified Dickey-Fuller | −17.1662 | 0.0000 | Cointegrated | |
| Unadjusted Dickey-Fuller | −11.0471 | 0.0000 | Cointegrated | |
| Pedroni | Modified Phillips-Perron | 0.6275 | 0.2652 | Not Cointegrated |
| Phillips-Perron | −6.6608 | 0.0000 | Cointegrated | |
| Augmented Dickey-Fuller | −7.0636 | 0.0000 | Cointegrated |
Note: The tests presented in this table have Ho of no cointegration. Ha is that all panels are cointegrated.
Table A5.
Dynamic ordinary least squares (DOLS) regression.
| Variables | SMC | STTV | SMTR | FMA | FMD | FD | CC | OP | INV | FDI | PSE | INF | Constant |
|---|---|---|---|---|---|---|---|---|---|---|---|---|---|
| Coefficients | 12.5360 | −313.3423 | 0.6370 | 708.5800 | 53.2830 | 1.2000 | 15.1240 | −0.2080 | 1.6970 | −0.0560 | 0.0940 | −0.0460 | 3.6000 |
| z-values | (2.66) *** | (−3.00) *** | (1.80) * | (1.76) * | (1.73) * | (1.67) * | (3.17) ** | (−0.10) | (1.63) * | (−0.33) | (2.28) ** | (−1.84) * | (2.19) ** |
Note: This table reports the results of the DOLS regression for the cointegrated variables. The z-values are shown in parentheses below the coefficients. *, **, and *** indicate significance at the 10%, 5%, and 1% level, respectively.
Table A6.
Causality test.
| Variables | SMC | STTV | SMTR | FMA | FMD | FD | CC | OP | INV | FDI | PSE | INF |
|---|---|---|---|---|---|---|---|---|---|---|---|---|
| Test 1 | ||||||||||||
| Coefficients | 10.2097 | −262.9142 | 3.5925 | 1447.8210 | 69.6771 | 88.3132 | 15.6401 | −3.9260 | −0.4106 | −0.4898 | −0.0374 | −0.1458 |
| z-values | (2.49) ** | (−2.21) ** | (2.75) *** | (2.87) ** | (2.02) ** | (2.23) ** | (9.67) ** | (−2.16) ** | (−0.98) | (−2.12) ** | (−2.78) ** | (−2.96) ** |
| Conclusion | C | C | C | C | C | C | C | C | NC | C | C | C |
| Test 2 | ||||||||||||
| Coefficients | 0.0418 | 0.0007 | −0.0395 | 0.4843 | −0.0484 | −0.0009 | 0.0192 | 0.6036 | −0.0464 | −0.0660 | 1.9810 | 0.5468 |
| z-values | (3.38) ** | (2.29) ** | (−2.19) ** | (0.28) | (−0.96) | (−5.25) ** | (3.49) ** | (2.10) * | (−2.79) ** | (−2.08) ** | (4.12) | (2.95) |
| Conclusion | C | C | C | NC | NC | C | C | C | C | C | C | C |
Note: The test’s null hypothesis is that the independent variable does not cause the dependent variable. “C” means causes, and “NC” means does not cause. In test 1, the dependent variable is Growth. In test 2, the direction of causality is reversed, with Growth being the independent variable. *, **, and *** indicate significance at the 10%, 5%, and 1% level, respectively.
Table A7.
Estimated short-term coefficients for ARDL model.
| ARDL Model (1,0,0,0,0,0,4) | |||||||
|---|---|---|---|---|---|---|---|
| Stock and financial market variables | |||||||
| Variables | SMC | STTV | SMTR | FMA | FMD | FD | Constant |
| Coefficients | 0.0198 | 11.4781 | 0.7832 | 110.5114 | 8.9475 | 18.27 | 1.5005 |
| t-values | (0.03) | (1.66) * | (2.48) ** | (0.23) | (0.26) | (0.85) | (1.13) |
| LM test a | Durb. test b | Het. test c | Norm. d | Cusum test | Cus. Sq. | Single test | |
| 1.5010 | 1.4430 | 9.9500 | 49.8200 | 0.4126 e | 0.8478 f | 13.3596 g | |
| (0.2206) | (0.2297) | (0.0016) | (0.0498) | ||||
| Control variables | |||||||
| Variables | CC | OP | INV | FDI | PSE | INF | Constant |
| Coefficients | −2.6005 | −0.9851 | 0.2131 | −0.1153 | 0.0119 | −0.0527 | 3.9363 |
| t-values | (−3.23) *** | (−1.65) * | (0.65) | (−1.91) * | (1.04) | (−1.97) | (6.70) *** |
| LM test a | Durbin test b | Het. test c | Norm. d | Cusum test | Cus. Sq. | Single test | |
| 0.0670 | 0.0640 | 30.5400 | 23.7700 | 0.3432 e | 0.5521 f | 5.6293 g | |
| (0.7964) | (0.8004) | (0.0000) | (0.6430) | ||||
Note: The dependent variable is Growth. a Breusch-Godfrey Lagrange Multiplier (LM) test for autocorrelation; the p-values is in parentheses. b Durbin’s alternative test for autocorrelation; the p-values is in parentheses. c Breusch-Pagan/Cook-Weisberg test for heteroscedasticity; the p-values is in parentheses. d White test for homoscedasticity; the p-values is in parentheses. Cusum, Cusum Square, and Single tests are all for the detection of structural breaks. e,f the test statistics are lower than the critical value at 1, 5, and 10%, so we confirm the null hypothesis of no structural break. g p-values are all > 0.050; thus, we confirm the null hypothesis of no structural break. *, **, and *** indicate significance at the 10%, 5%, and 1% level, respectively.
Table A8.
Markov-switching dynamic regression.
| Variables | SMC | STTV | SMTR | FMA | FMD | FD | CC | OP | INV | FDI | PSE | INF | Constant |
|---|---|---|---|---|---|---|---|---|---|---|---|---|---|
| Regime 1 (High Volatility), | |||||||||||||
| Coefficients | −7.7008 | 280.4843 | 1.1925 | 5609.459 | −45.0576 | 181.4329 | −12.4264 | −9.4715 | −1.7978 | −1.1427 | −0.0501 | 0.1035 | −19.0943 |
| z-values | (−4.22) *** | (2.60) *** | (1.82) * | (3.53) *** | (−0.40) | (3.78) *** | (−4.95) *** | (−5.38) *** | (−1.23) | (−1.73) * | (−1.11) | (0.57) | (−3.24) *** |
| Regime 2 (Low Volatility), | |||||||||||||
| Coefficients | 0.8345 | −0.09028 | 0.6175 | −38.9273 | 15.4718 | −4.1333 | 0.673 | 0.2382 | 0.0535 | −0.1035 | 0.0189 | 0.0018 | 3.7029 |
| z-values | (2.12) ** | (−1.88) * | (2.71) *** | (−0.12) | (1.69) * | (−0.52) | (1.07) | (0.53) | (0.23) | (−1.17) | (2.31) ** | (0.10) | (4.13) *** |
Note: The dependent variable is Growth. *, ** and *** indicate significance at the 10%, 5% and 1% level, respectively.
Figure A1.
Economic growth and selected stock and financial market variables’ evolution from 1989 to 2015 in Benin, Burkina Faso, Cote d’Ivoire, and Guinea Bissau. Source: Prepared by authors, based on collected data.
Figure A1.
Economic growth and selected stock and financial market variables’ evolution from 1989 to 2015 in Benin, Burkina Faso, Cote d’Ivoire, and Guinea Bissau. Source: Prepared by authors, based on collected data.

Figure A2.
Economic growth and selected stock and financial market variables’ evolution from 1989 to 2015 in Mali, Niger, Senegal, and Togo. Source: Prepared by authors, based on collected data.
Figure A2.
Economic growth and selected stock and financial market variables’ evolution from 1989 to 2015 in Mali, Niger, Senegal, and Togo. Source: Prepared by authors, based on collected data.

References
- Adamu, J. A., and I. Sanni. 2005. Stock market Development and Nigerian Economic Growth. Journal of Economic and Allied Fields 2: 116–33. [Google Scholar]
- Africa-America Institute (AAI). 2015. The State of Education in Africa: Report 2015. Available online: http://www.aaionline.org/wp-content/uploads/2015/09/AAI-SOE-report-2015-final.pdf (accessed on 28 February 2021).
- Assane, Djeto, and Bernard Malamud. 2010. Financial development and growth in sub-Saharan Africa: Does legal origin and CFA membership matter? Applied Economics 42: 2683–97. [Google Scholar] [CrossRef]
- Barcola, Makiliwe, and Leleng Kebalo. 2018. Inflation-Growth Nexus and Regional Integration in West Africa. Journal of Economics and Development Studies 6: 54–66. [Google Scholar] [CrossRef]
- Bautista, Carlos. 2003. Stock market Volatility in the Philippines. Applied Economic Letters 10: 315–18. [Google Scholar] [CrossRef]
- Ben Naceur, Samy, and Ghazouani Samir. 2007. Stock markets, Banks, and Economic Growth: Empirical Evidence from the MENA Region. Research in International Business and Finance 21: 297–315. [Google Scholar] [CrossRef]
- Breusch, Trevor, and Adrian Pagan. 1980. The Lagrange Multiplier Test and Its Application to Model Specification in Econometrics. Review of Economic Studies 47: 239–53. [Google Scholar] [CrossRef]
- Coskun Yener, Unal Seven, Hasan Murat Ertugrul, and Talat Ulussever. 2017. Capital Market and Economic Growth Nexus: Evidence from Turkey. Central Bank Review 17: 19–29. [Google Scholar] [CrossRef]
- Demirguc-Kunt, Asli, Feyen Eric, and Levine Ross. 2012. The Evolving Importance of Banks and Securities Markets. Working Paper 18004. Cambridge: NBER Program. [Google Scholar]
- Des Adom, Assande. 2012. Beyond the CFA Franc: An Empirical Analysis of the Choice of an Exchange Rate Regime in the UEMOA. Economic Issues 17: 71–93. [Google Scholar]
- Diouf, Mame Astou, and Francois Boutin-Dufresne. 2012. Financing Growth in the WAEMU through the Regional Securities Market: Past Successes and Current Challenges. IMF Working Paper WP/12/249. Dar es Salaam: African Department, IMF. [Google Scholar]
- Ecofinagency. 2021a. Benin Hits Record 31-Year Eurobond Maturity, Issuing a €1bln Bond. Available online: https://www.ecofinagency.com/public-management/1501-42253-benin-hits-record-31-year-eurobond-maturity-issuing-a-1bln-bond (accessed on 20 March 2021).
- Ecofinagency. 2021b. WAEMU: Member Countries Raised CFA 9.2 Trillion on the Local Market in 2020. Available online: https://www.ecofinagency.com/finance/1501-42255-waemu-member-countries-raised-cfa9-2-trillion-on-the-local-market-in-2020 (accessed on 20 March 2021).
- Ertugrul, Hasan, and Huseyin Ozturk. 2013. The Drivers of Credit Default Swap Prices: Evidence from Selected Emerging Market Countries. Emerging Markets Finance Trade 49: 228–49. [Google Scholar] [CrossRef]
- Ewah, Sunday, Atim E. Esang, and Jude U. Bassey. 2009. Appraisal of Capital Market Efficiency on Economic Growth in Nigeria. International Journal of Business Management 4: 219–28. [Google Scholar] [CrossRef]
- Ezeibekwe, Obinna F. 2021. Stock market Development and Economic Growth in Nigeria: Evidence from Vector Error Correction Model. Journal of Developing Areas 55: 103–18. [Google Scholar] [CrossRef]
- Fink, Gerhard, Peter Haiss, and Sirma Hristoforova. 2006. Credit, Bonds, Stocks and Growth in Seven Large Economies. EI Working Papers/Europainstitut, 70, Europainstitut. Vienna: WU Vienna University of Economics and Business. [Google Scholar]
- Francis, Bill B., and Eric Ofori. 2015. Political Regimes and Stock market Development. Eurasian Economic Review 5: 111–37. [Google Scholar] [CrossRef]
- Frees, Edward W(Jed). 1995. Assessing Cross-Sectional Correlations in Panel Data. Journal of Econometrics 64: 393–414. [Google Scholar] [CrossRef]
- Frees, Edward W(Jed). 2004. Longitudinal and Panel Data: Analysis and Applications in the Social Sciences. Cambridge: Cambridge University Press. [Google Scholar]
- Friedman, Milton. 1937. The Use of Ranks to Avoid the Assumption of Normality Implicit in the Analysis of Variance. Journal of the American Statistical Association 32: 675–701. [Google Scholar] [CrossRef]
- Friedman, Milton, and Anna J. Schwartz. 1963. A Monetary History of the United States, 1867–1960. Princeton: Princeton University Press. [Google Scholar]
- Ganti, Akhilesh. 2019. Regional Stock Exchange. Investopedia. Available online: https://www.investopedia.com/terms/r/regionalstockexchange.asp (accessed on 28 February 2021).
- Gulde, Anne Marie, and Charalambos G. Tsangarides. 2008. The CFA Franc Zone: Common Currency, Uncommon Challenges. Washington, DC: International Monetary Fund, pp. 1–24. [Google Scholar]
- Hadri, Kddour. 2000. Testing for Stationarity in Heterogeneous Panel Data. Econometrics Journal 3: 148–61. [Google Scholar] [CrossRef]
- Haque, Masudul. 2013. Impact of Stock exchange Development on Economic Growth: An Evidence from SAARC Countries. International Journal of Research in Commerce, Economics and Management 3: 15–20. [Google Scholar]
- Ian, Taylor. 2019. France à Fric: The CFA Zone in Africa and Neocolonialism. Third World Quarterly 40: 1064–88. [Google Scholar] [CrossRef]
- Ikikii, M. Stephen, and Joseph N. Nzomoi. 2013. An Analysis of the Effects of Stock exchange Development on Economic Growth in Kenya. International Journal of Economics and Finance 5: 145–51. [Google Scholar] [CrossRef]
- Im, Kyung So, M. Hashem Pesaran, and Yongcheol Shin. 2003. Testing for Unit Roots in Heterogeneous Panels. Journal of Econometrics 115: 53–74. [Google Scholar] [CrossRef]
- James, King. 2018. West Africa Stock Market Heads Regional Integration Push. Available online: https://www.thebanker.com/World/Africa/West-Africa-stock-market-heads-regional-integration-push?ct=true (accessed on 19 March 2021).
- Juodis, Arturas, Yiannis Karavias, and Vasilis Sarafidis. 2021. A Homogeneous Approach to Testing for Granger Non-Causality in Heterogeneous Panels. Empirical Economics 60: 93–112. [Google Scholar] [CrossRef]
- Kao, Chihwa. 1999. Spurious Regression and Residual-Based Tests for Cointegration in Panel Data. Journal of Econometrics 90: 1–44. [Google Scholar] [CrossRef]
- Karim, Saba, and Ghulam Mujtaba Chaudhary. 2017. Effect of Stock market Development on the Economic Growth of Major South Asian and East Asian Economies: A Comparative Analysis. Journal of Business Studies Quarterly 8: 81–88. [Google Scholar]
- Koddenbrock, Kai, and Ndongo Samba Sylla. 2019. Towards a Political Economy of Monetary Dependency: The Case of the CFA Franc in West Africa. MaxPo Discussion Paper, No. 19/2. Paris: Max Planck Sciences Po Center on Coping with Instability in Market Societies (MaxPo). [Google Scholar]
- Kolapo, Funso Tajudeen, and Anthony Olungbenga Adaramola. 2012. The Impact of the Nigerian Capital Market on Economic Growth (1990–2010). International Journal of Developing Societies 1: 11–19. [Google Scholar]
- Kónya, Laszlo. 2006. Exports and Growth: Granger Causality Analysis on OECD Countries with a Panel Data Approach. Economic Modelling 23: 978–92. [Google Scholar] [CrossRef]
- Levin, Andrew, Chien-Fu Lin, and Chia-Shang James Chu. 2002. Unit Root Tests in Panel Data: Asymptotic and Finite-Sample Properties. Journal of Econometrics 108: 1–24. [Google Scholar] [CrossRef]
- Levine, Ross, and Sara Zervos. 1998. Stock market Development and Long-Run Growth. American Economic Review 88: 537–58. [Google Scholar]
- Maku, Affor Owen. 2020. Stock market Development and Economic Growth: Empirical Evidence from an Institutional Impaired Economy. International Journal of Financial Research 11: 496–509. [Google Scholar] [CrossRef]
- Menegaki, N. Angeliki. 2019. The ARDL Method in the Energy-Growth Nexus Field; Best Implementation Strategy. Economies 7: 105. [Google Scholar] [CrossRef] [Green Version]
- McKinnon, Ronald I. 1973. Money and Capital in Economic Development. Washington, DC: Brookings Institution. [Google Scholar]
- Milka, Grbic. 2021. Stock market Development and Economic Growth: The Case of the Republic of Serbia. Post-Communist Economies 33: 484–99. [Google Scholar] [CrossRef]
- Mittal, Rishab. 2014. The Effects of Market Capitalization Ratio on GDP Growth and Capital Market Robustness in Newly Industrialized Countries. UChicago Undergraduate Business Journal 1: 1–18. [Google Scholar]
- Mohtadi, Hamid, and Sumit Agarwal. 2007. Stock exchange Development and Economic Growth: Evidence from Developing Countries. Working Paper. Milwaukee: Department of Economics, University of Wisconsin-Milwaukee. [Google Scholar]
- Morgan Stanley Capital International (MSCI). 2021. Results of MSCI 2021 Global Market Accessibility Review. Available online: https://www.msci.com/our-solutions/indexes/market-classification (accessed on 3 November 2021).
- Oke, Michael Ojo, and S. Adeusi. 2012. Impact of Capital Market Reforms on Economic Growth: The Nigerian Experience. Australian Journal of Business and Management Research 2: 20–30. [Google Scholar]
- Ouedraogo, Sayouba, and Desire Drabo. 2019. Dynamics of Integration and Economic Growth of the West African Economic and Monetary Union (WAEMU). Modern Economy 10: 1121–33. [Google Scholar] [CrossRef] [Green Version]
- Pan, Lei, and Vinod Mishra. 2018. Stock exchange Development and Economic Growth: Empirical Evidence from China. Economic Modelling 68: 661–73. [Google Scholar] [CrossRef]
- Pedroni, Peter. 1999. Critical Values for Cointegration Tests in Heterogeneous Panels with Multiple Regressors. Oxford Bulletin of Economics and Statistics 61: 653–70. [Google Scholar] [CrossRef]
- Pesaran, M. Hashem. 2004. General Diagnostic Tests for Cross-Section Dependence in Panels. Cambridge Working Papers in Economics 0435. Cambridge: University of Cambridge. [Google Scholar]
- Pesaran, M. Hashem, and Takashi Yamagata. 2008. Testing Slope Homogeneity in Large Panels. Journal of Econometrics 142: 50–93. [Google Scholar] [CrossRef] [Green Version]
- Phillips, Peter C. B., and Bruce E. Hansen. 1990. Statistical Inference in Instrumental Variables Regression with I(1) Processes. Review of Economic Studies 57: 99–125. [Google Scholar] [CrossRef]
- Proshare. 2010. West African Stock Exchanges Press Release. Available online: https://www.proshareng.com/news/Capital%20Market/West-African-Stock-Exchanges-Press-Release/9738 (accessed on 29 March 2021).
- Rao, B. Bhaskara, and Arusha Cooray. 2011. Determinants of the Long-Run Growth Rate in South-Asian Countries. Working Paper 12. Wollongong: School of Economics, University of Wollongong. [Google Scholar]
- Rioja, Felix, and Neven Valev. 2014. Stock exchanges, Banks and the Sources of Economic Growth in Low and High-Income Countries. Journal of Economics and Finance 38: 302–20. [Google Scholar] [CrossRef]
- Seven, Unal, and Hakan Yetkiner. 2016. Financial Intermediation and Economic Growth: Does Income Matter? Economic Systems 40: 39–58. [Google Scholar] [CrossRef]
- Shaw, Edward S. 1973. Financial Deepening in Economic Development. London: Oxford University Press. [Google Scholar]
- Shum, Michael. 2015. List of Frontier Markets Countries. Available online: https://www.investmentfrontier.com/2015/04/27/list-of-frontier-market-countries/ (accessed on 4 November 2021).
- Sow, Djeri, Liangsheng Du, M’baye Mamadou, Nyande Nyande, and Gnangoinyobouet Thierry Bienvenu. 2020. Institutional Quality and Financial Development in West Africa Economic and Monetary Union. Global Journal of Management and Business 20. [Google Scholar]
- Stephen, G. Cecchetti, and Kharroubi Enisse. 2012. Reassessing the Impact of Finance on Growth. Working Paper 381. Basel: Monetary and Economic Department, Bank for International Settlements. [Google Scholar]
- Stock, James H., and Mark W. Watson. 1993. A Simple Estimator of Cointegrating Vectors in Higher Order Integrated System. Econometrica 61: 783–820. [Google Scholar] [CrossRef]
- Swamy, Paravastu Aananta Venkata Bhattanda. 1970. Efficient Inference in a Random Coefficient Regression Model. Econometrica 38: 311–23. [Google Scholar] [CrossRef]
- Tadesse, Mariamawit. 2018. The CFA Franc Zones: Neocolonialism and Dependency. Available online: https://economicquestions.org/cfa-franc-neocolonialism/ (accessed on 4 November 2021).
- Westerlund, Joakim. 2005. New Simple Tests for Panel Cointegration. Econometric Reviews 24: 297–316. [Google Scholar] [CrossRef]
- Yu, Jung-Suk, M. Kabir Hassan, and Benito Sanchez. 2012. A Re-Examination of Financial Development, Stock Markets Development and Economic Growth. Applied Economics 44: 3479–89. [Google Scholar] [CrossRef]
- Zoungrana, Tibi Didier, Daouda Lawa Tan Toe, and Mamadou Toé. 2021. Covid-19 Outbreak and Stocks Returns on the West African Economic and Monetary Union’s Stock exchange: An Empirical Analysis of the Relationship Through the Event Study Approach. International Journal of Finance and Economics. [Google Scholar] [CrossRef]
Publisher’s Note: MDPI stays neutral with regard to jurisdictional claims in published maps and institutional affiliations. |
© 2021 by the author. Licensee MDPI, Basel, Switzerland. This article is an open access article distributed under the terms and conditions of the Creative Commons Attribution (CC BY) license (https://creativecommons.org/licenses/by/4.0/).
Share and Cite
MDPI and ACS Style
Zonon, B.I.P. Regional Stock Exchange Development and Economic Growth in the Countries of the West African Economic and Monetary Union (WAEMU). Economies 2021, 9, 181. https://0-doi-org.brum.beds.ac.uk/10.3390/economies9040181
AMA Style
Zonon BIP. Regional Stock Exchange Development and Economic Growth in the Countries of the West African Economic and Monetary Union (WAEMU). Economies. 2021; 9(4):181. https://0-doi-org.brum.beds.ac.uk/10.3390/economies9040181
Chicago/Turabian StyleZonon, Babatounde Ifred Paterne. 2021. "Regional Stock Exchange Development and Economic Growth in the Countries of the West African Economic and Monetary Union (WAEMU)" Economies 9, no. 4: 181. https://0-doi-org.brum.beds.ac.uk/10.3390/economies9040181
Note that from the first issue of 2016, this journal uses article numbers instead of page numbers. See further details here.