
Proteome-Wide Profiling Using Sample Multiplexing of a Human Cell Line Treated with Cannabidiol (CBD) and Tetrahydrocannabinol (THC)
 , , and
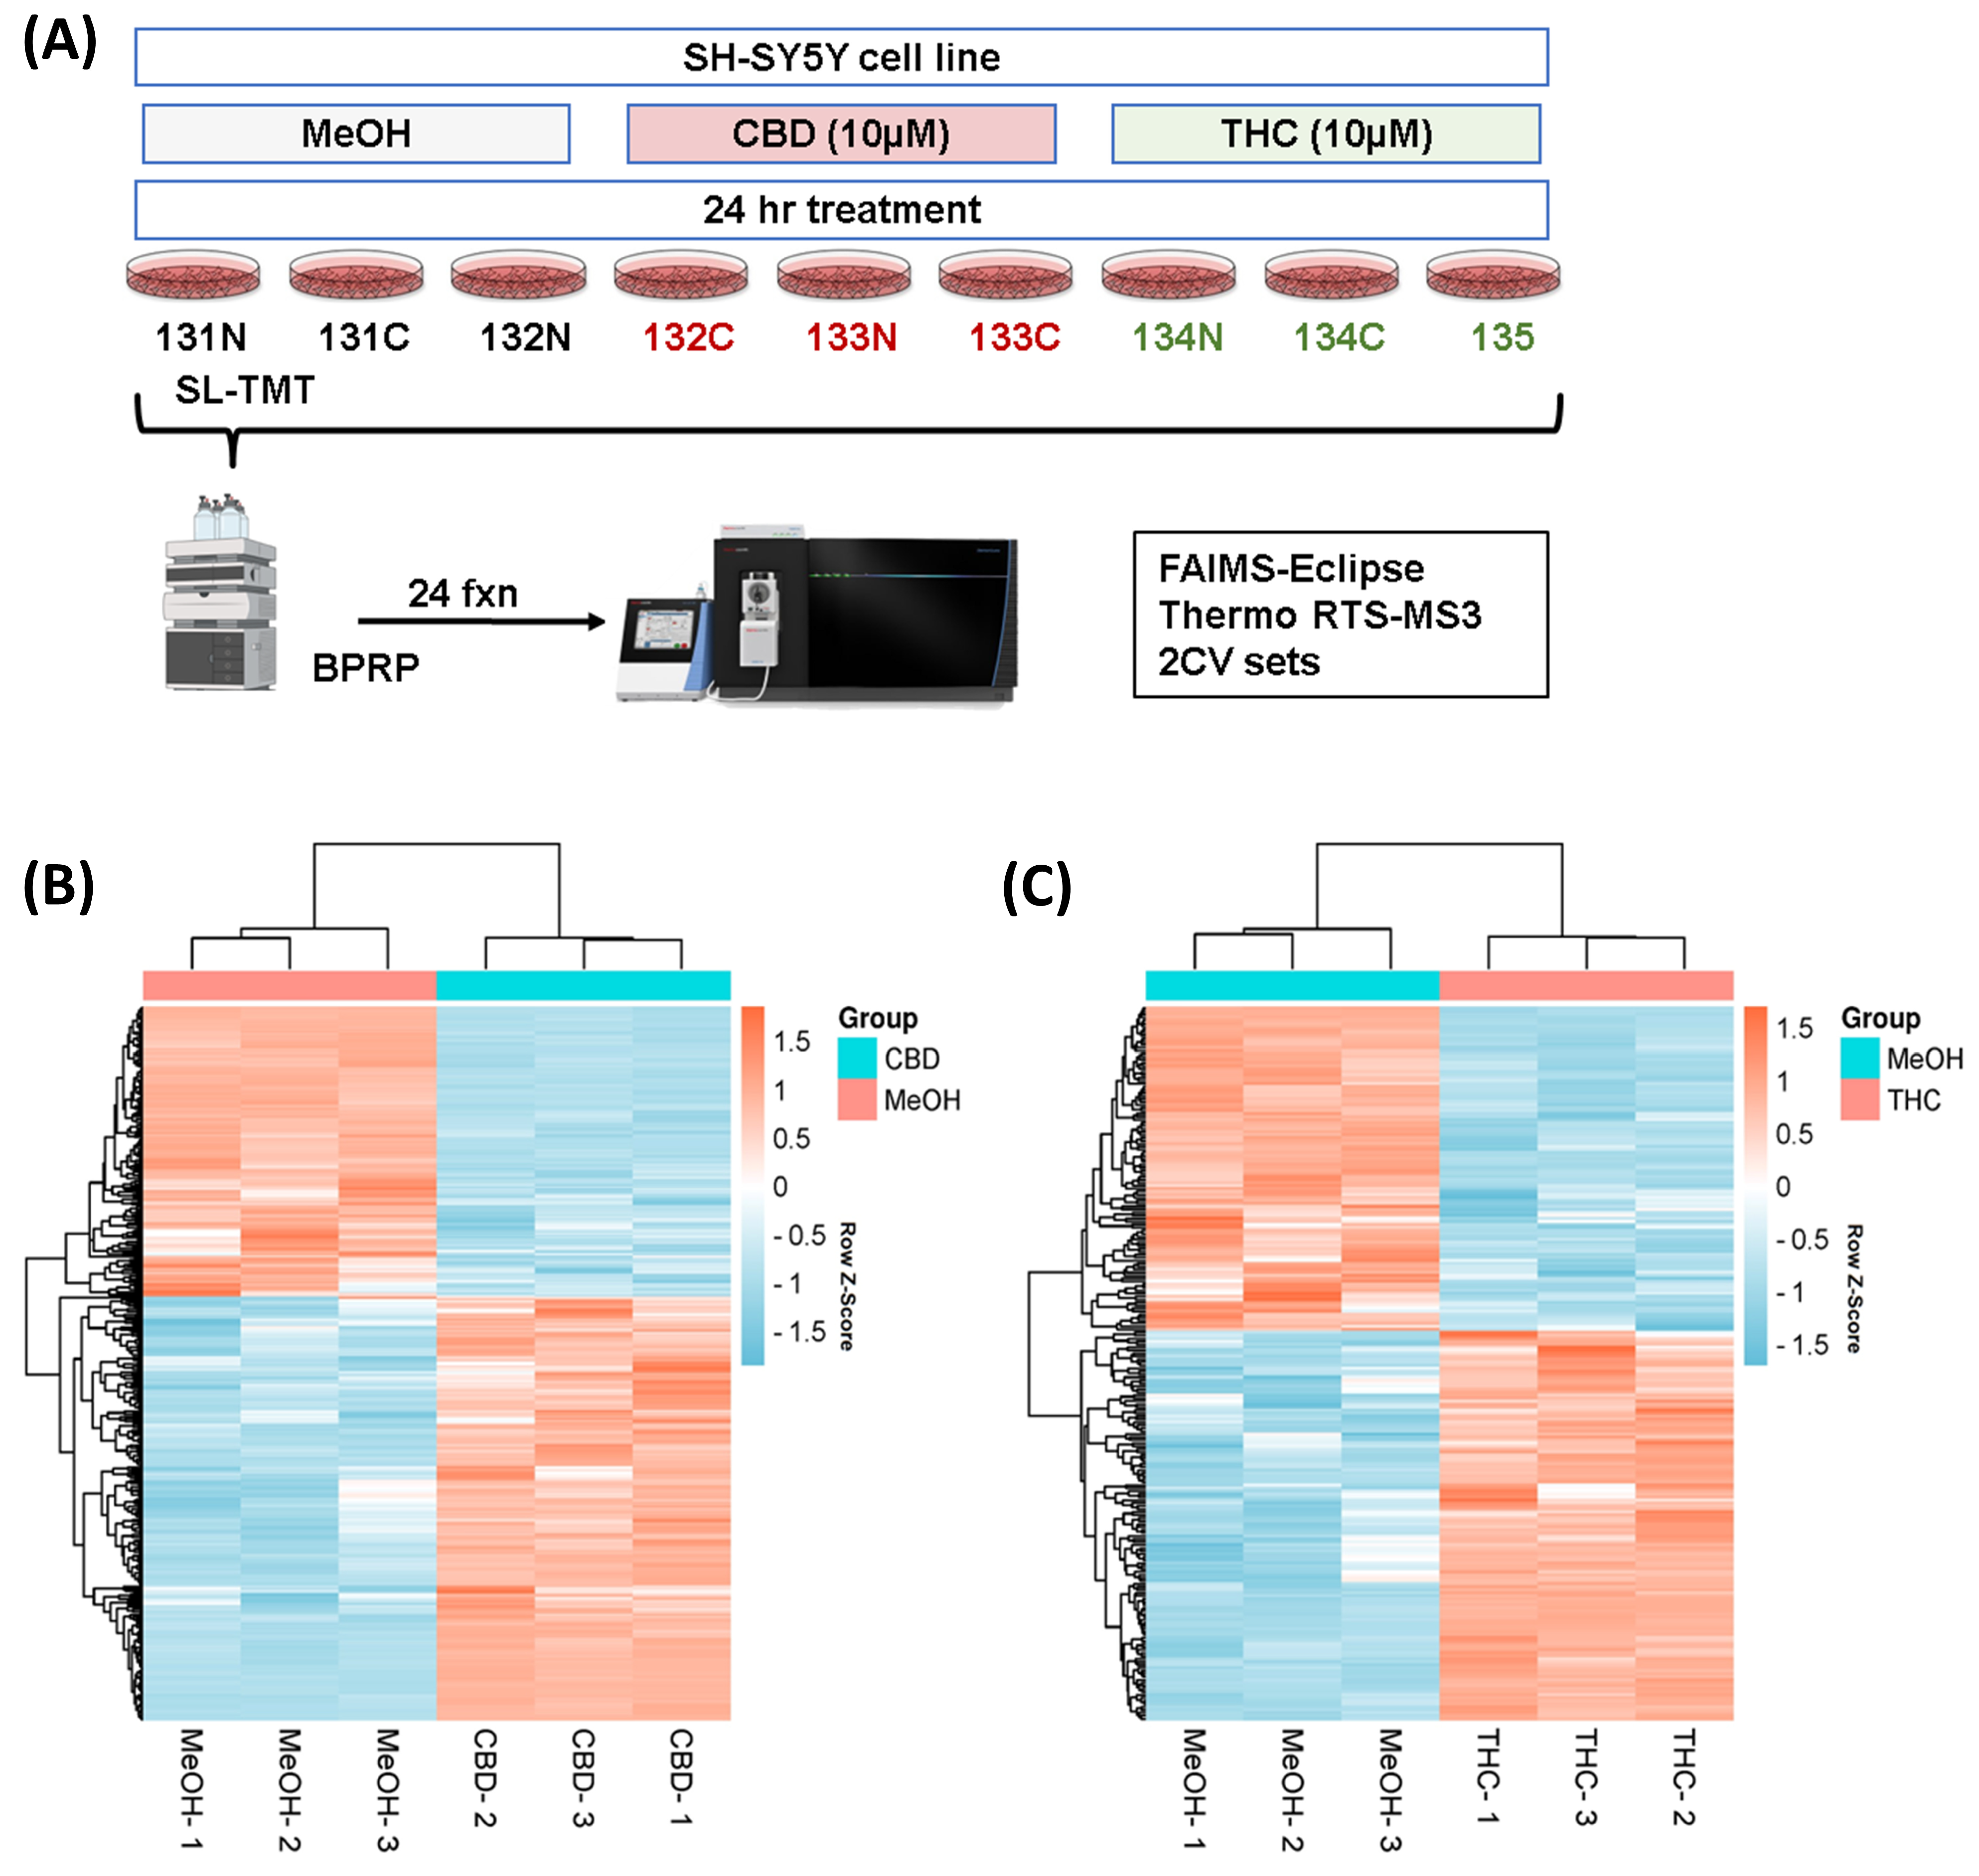
Abstract
:1. Introduction
2. Materials and Methods
2.1. Materials
2.2. Treatment of Cells with Compounds
2.3. Sample Preparation for Mass Spectrometry Analysis
2.4. Mass Spectrometry Data Acquisition and Analysis
2.5. Bioinformatics Data Analysis
2.6. Further Analysis of Differentially Expressed Proteins
3. Results
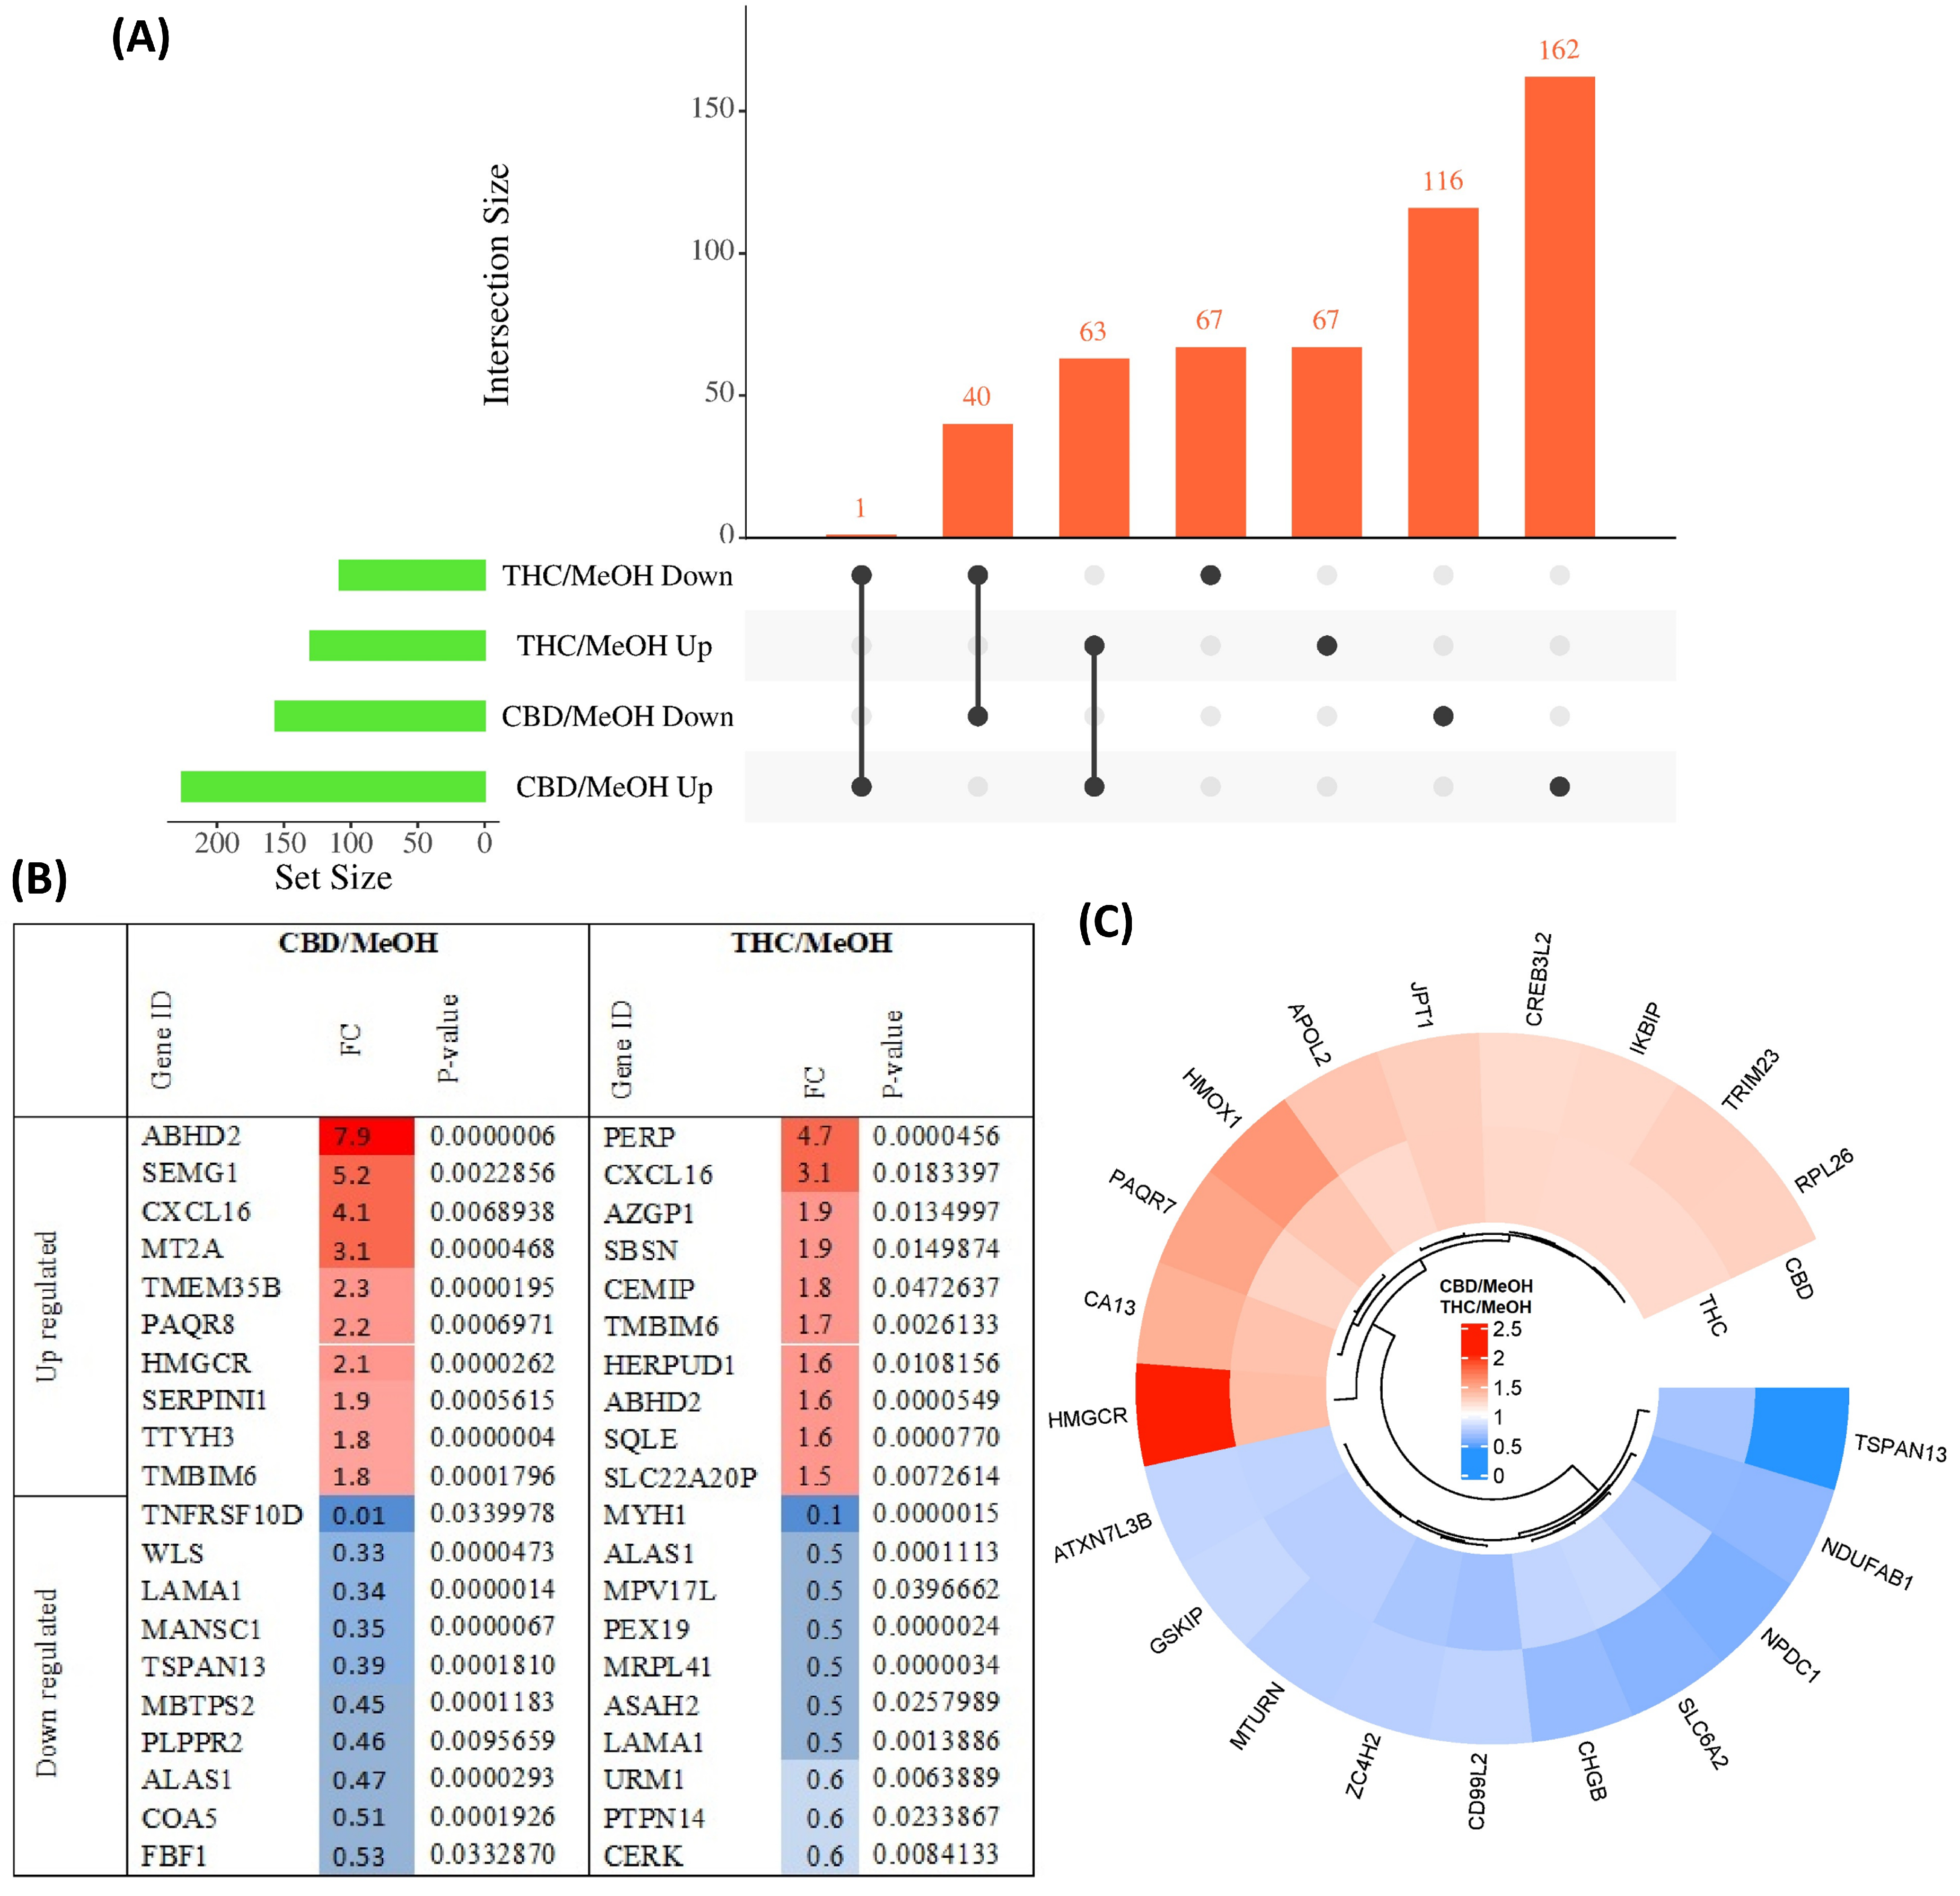
3.1. Proteome Profiling of SH-SY5Y Cells and Significantly Differentially Regulated Proteins by CBD and THC Treatments
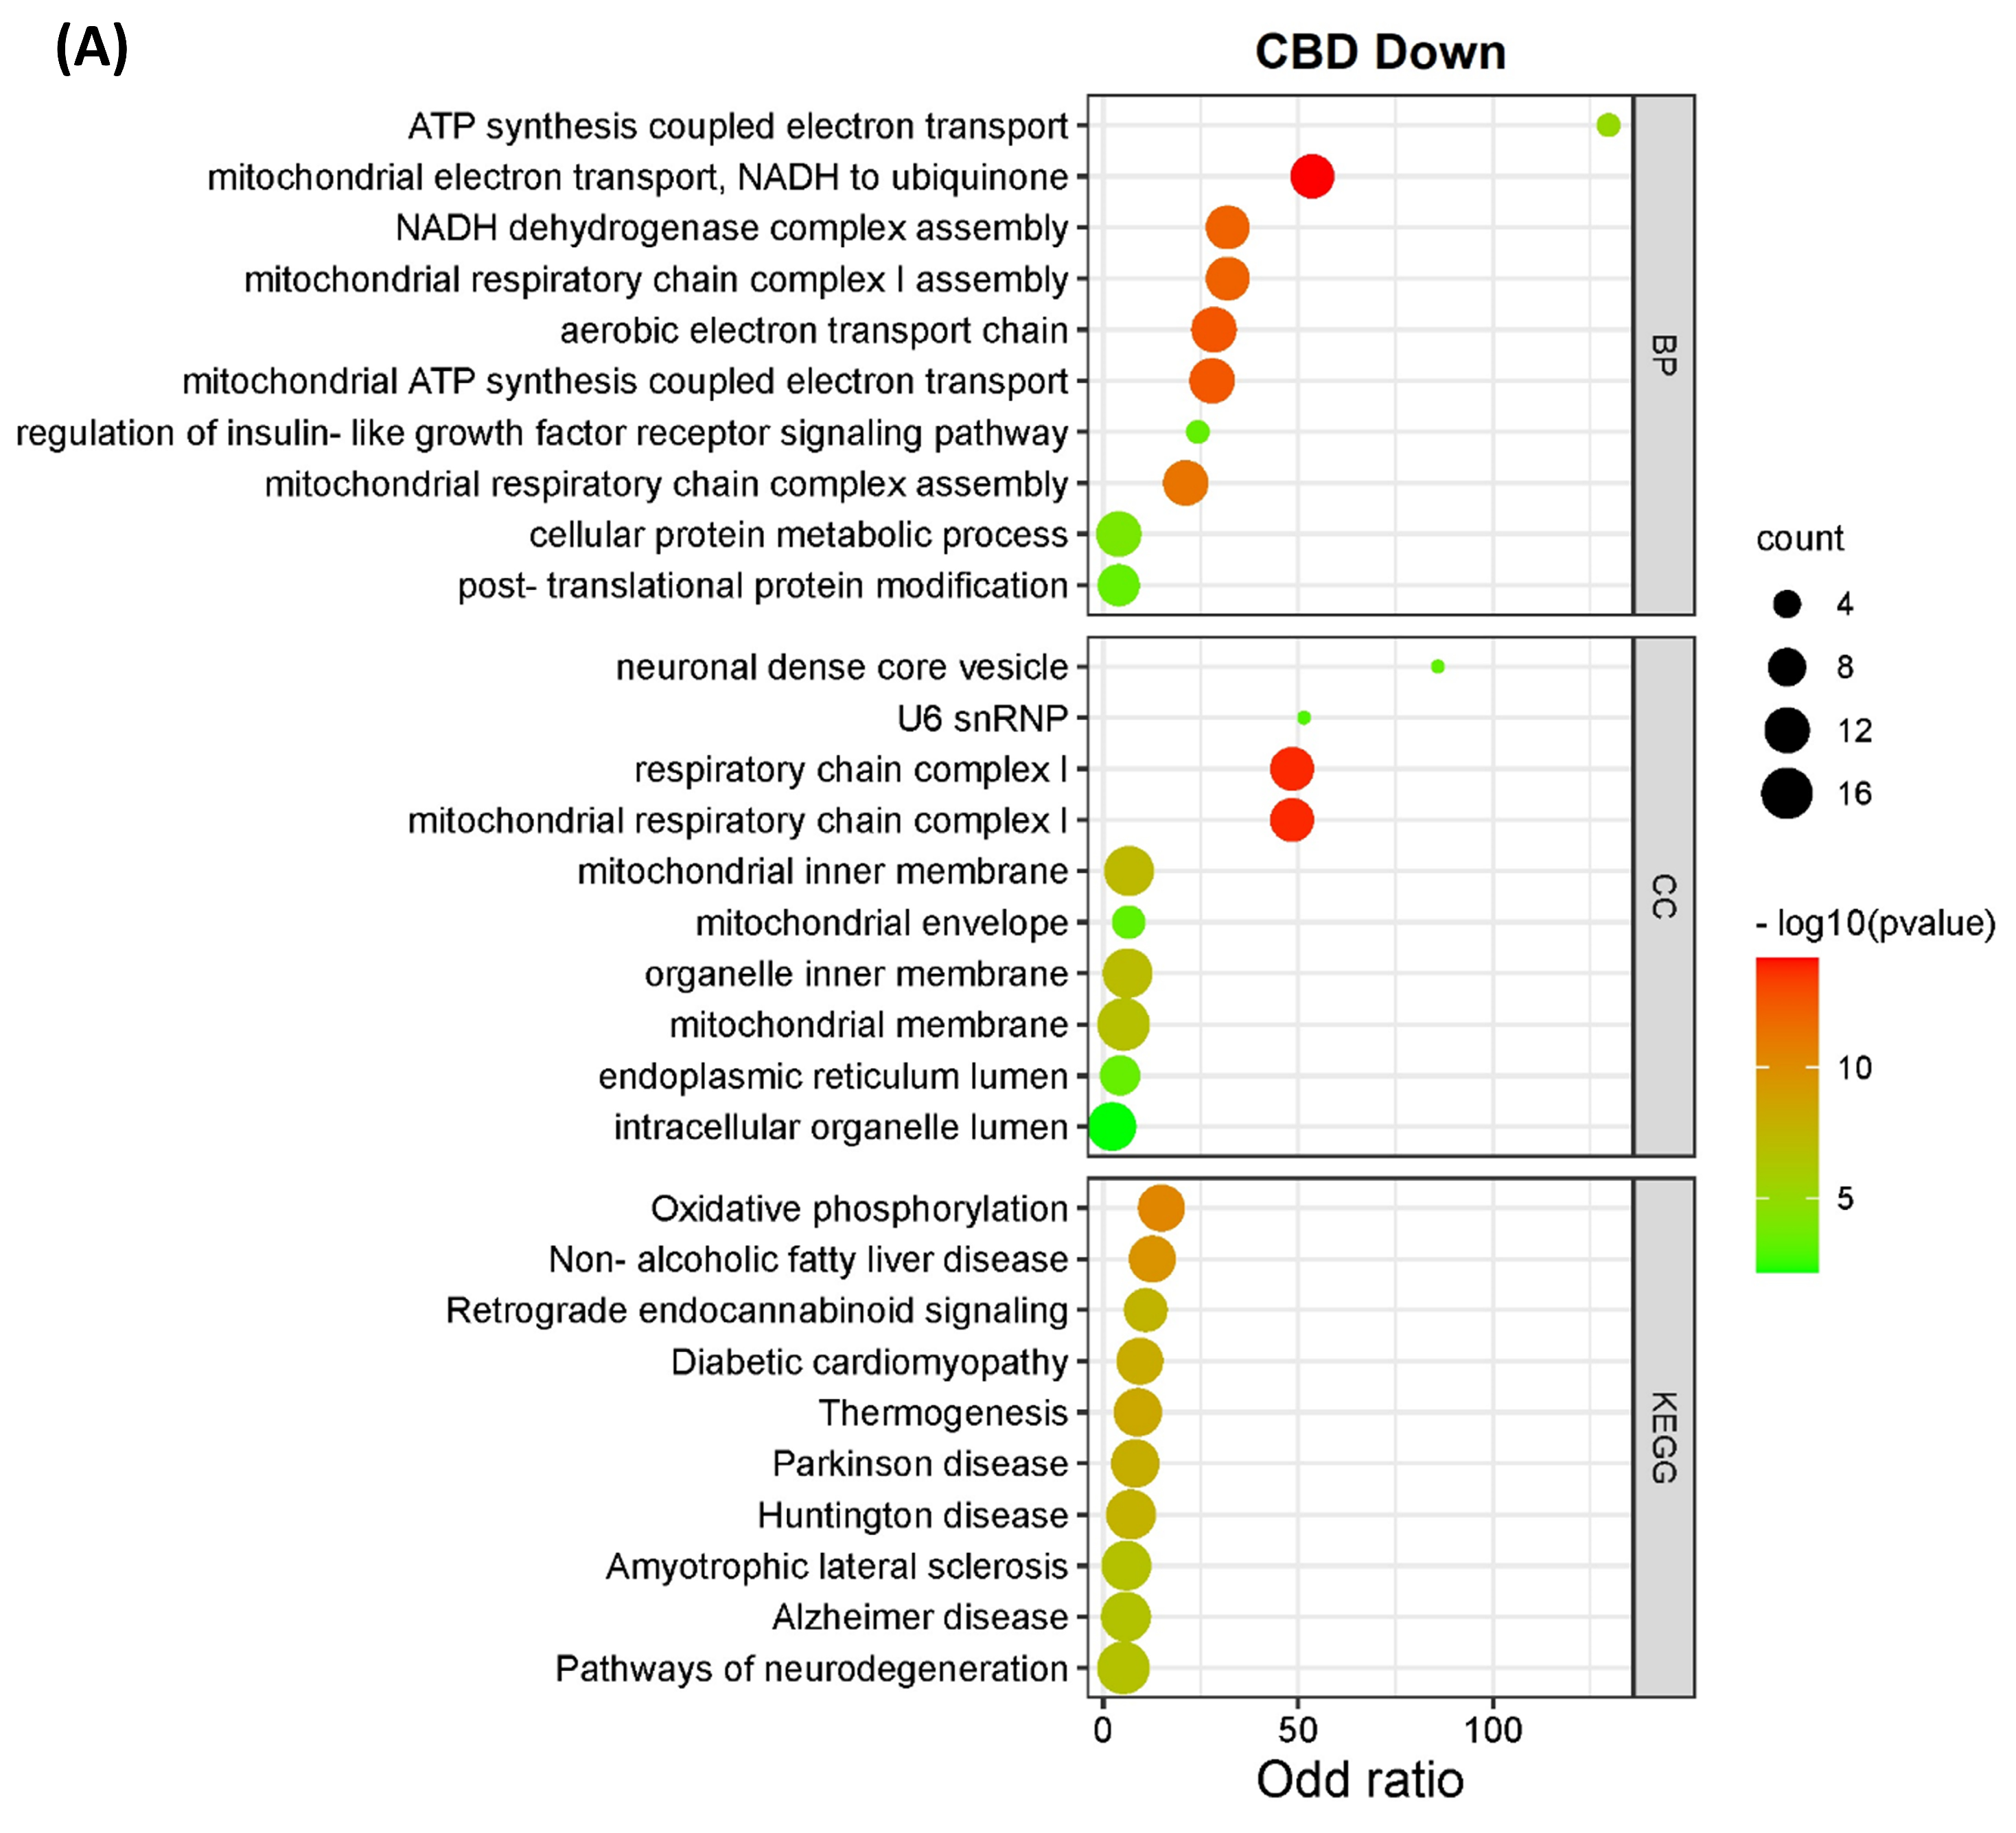
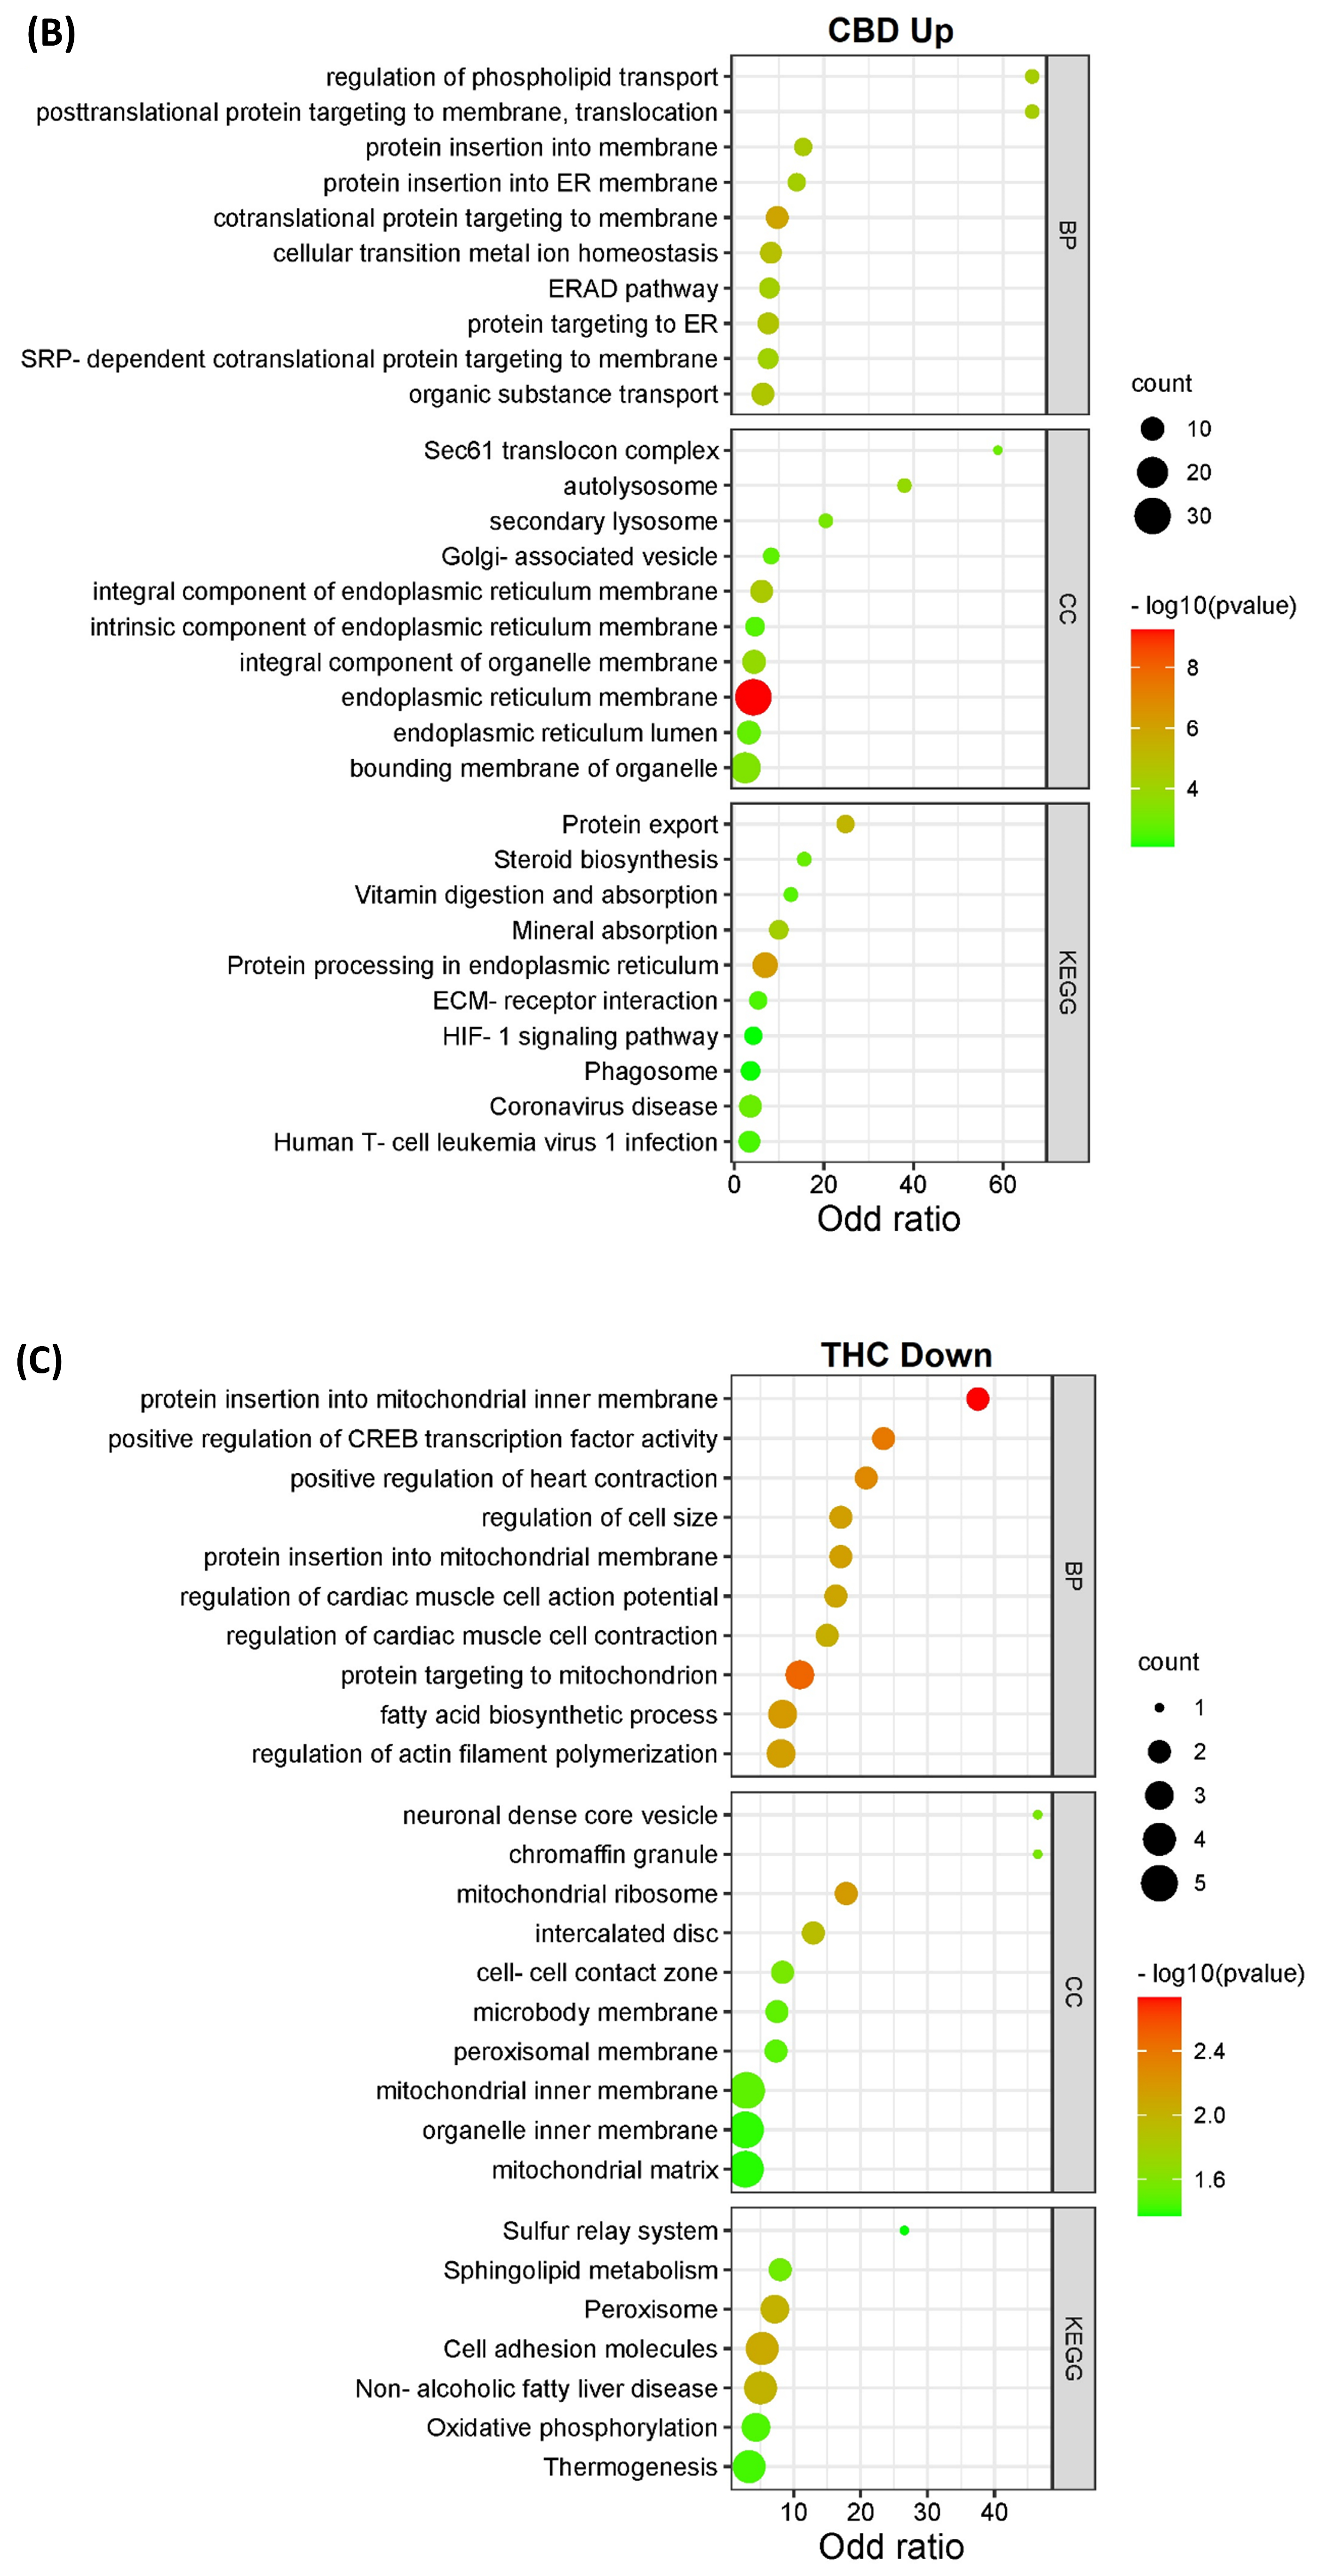
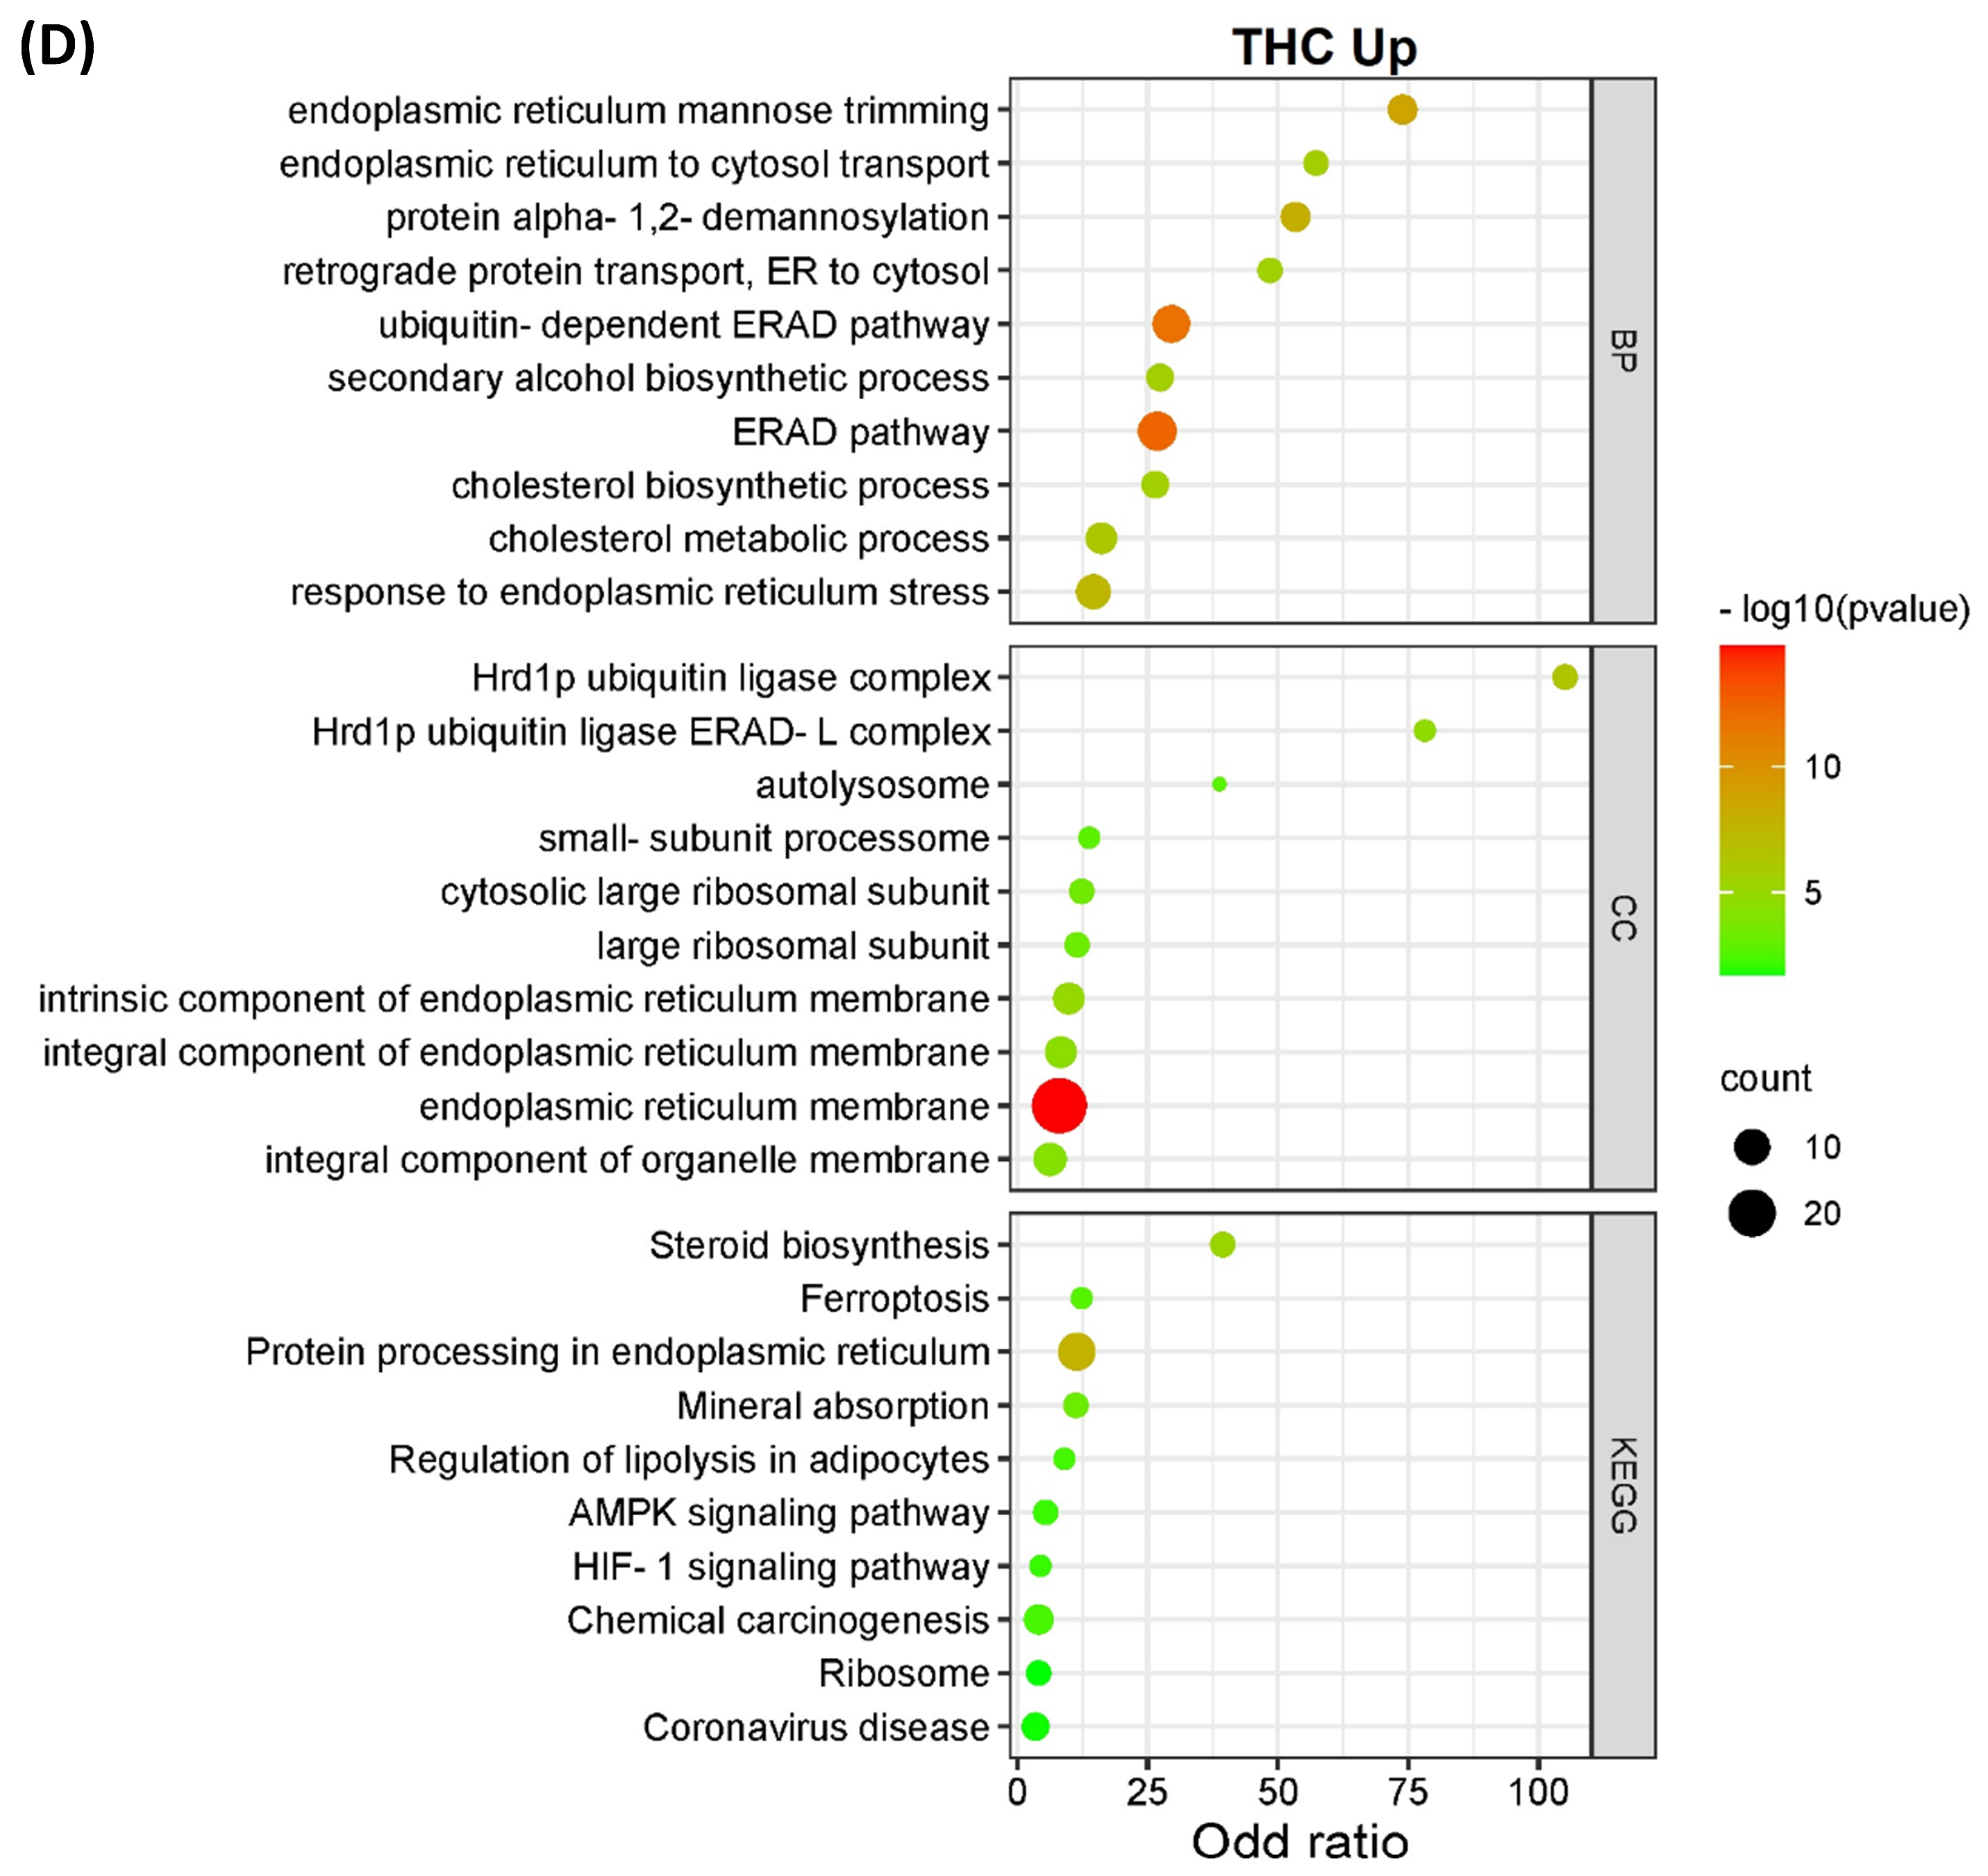
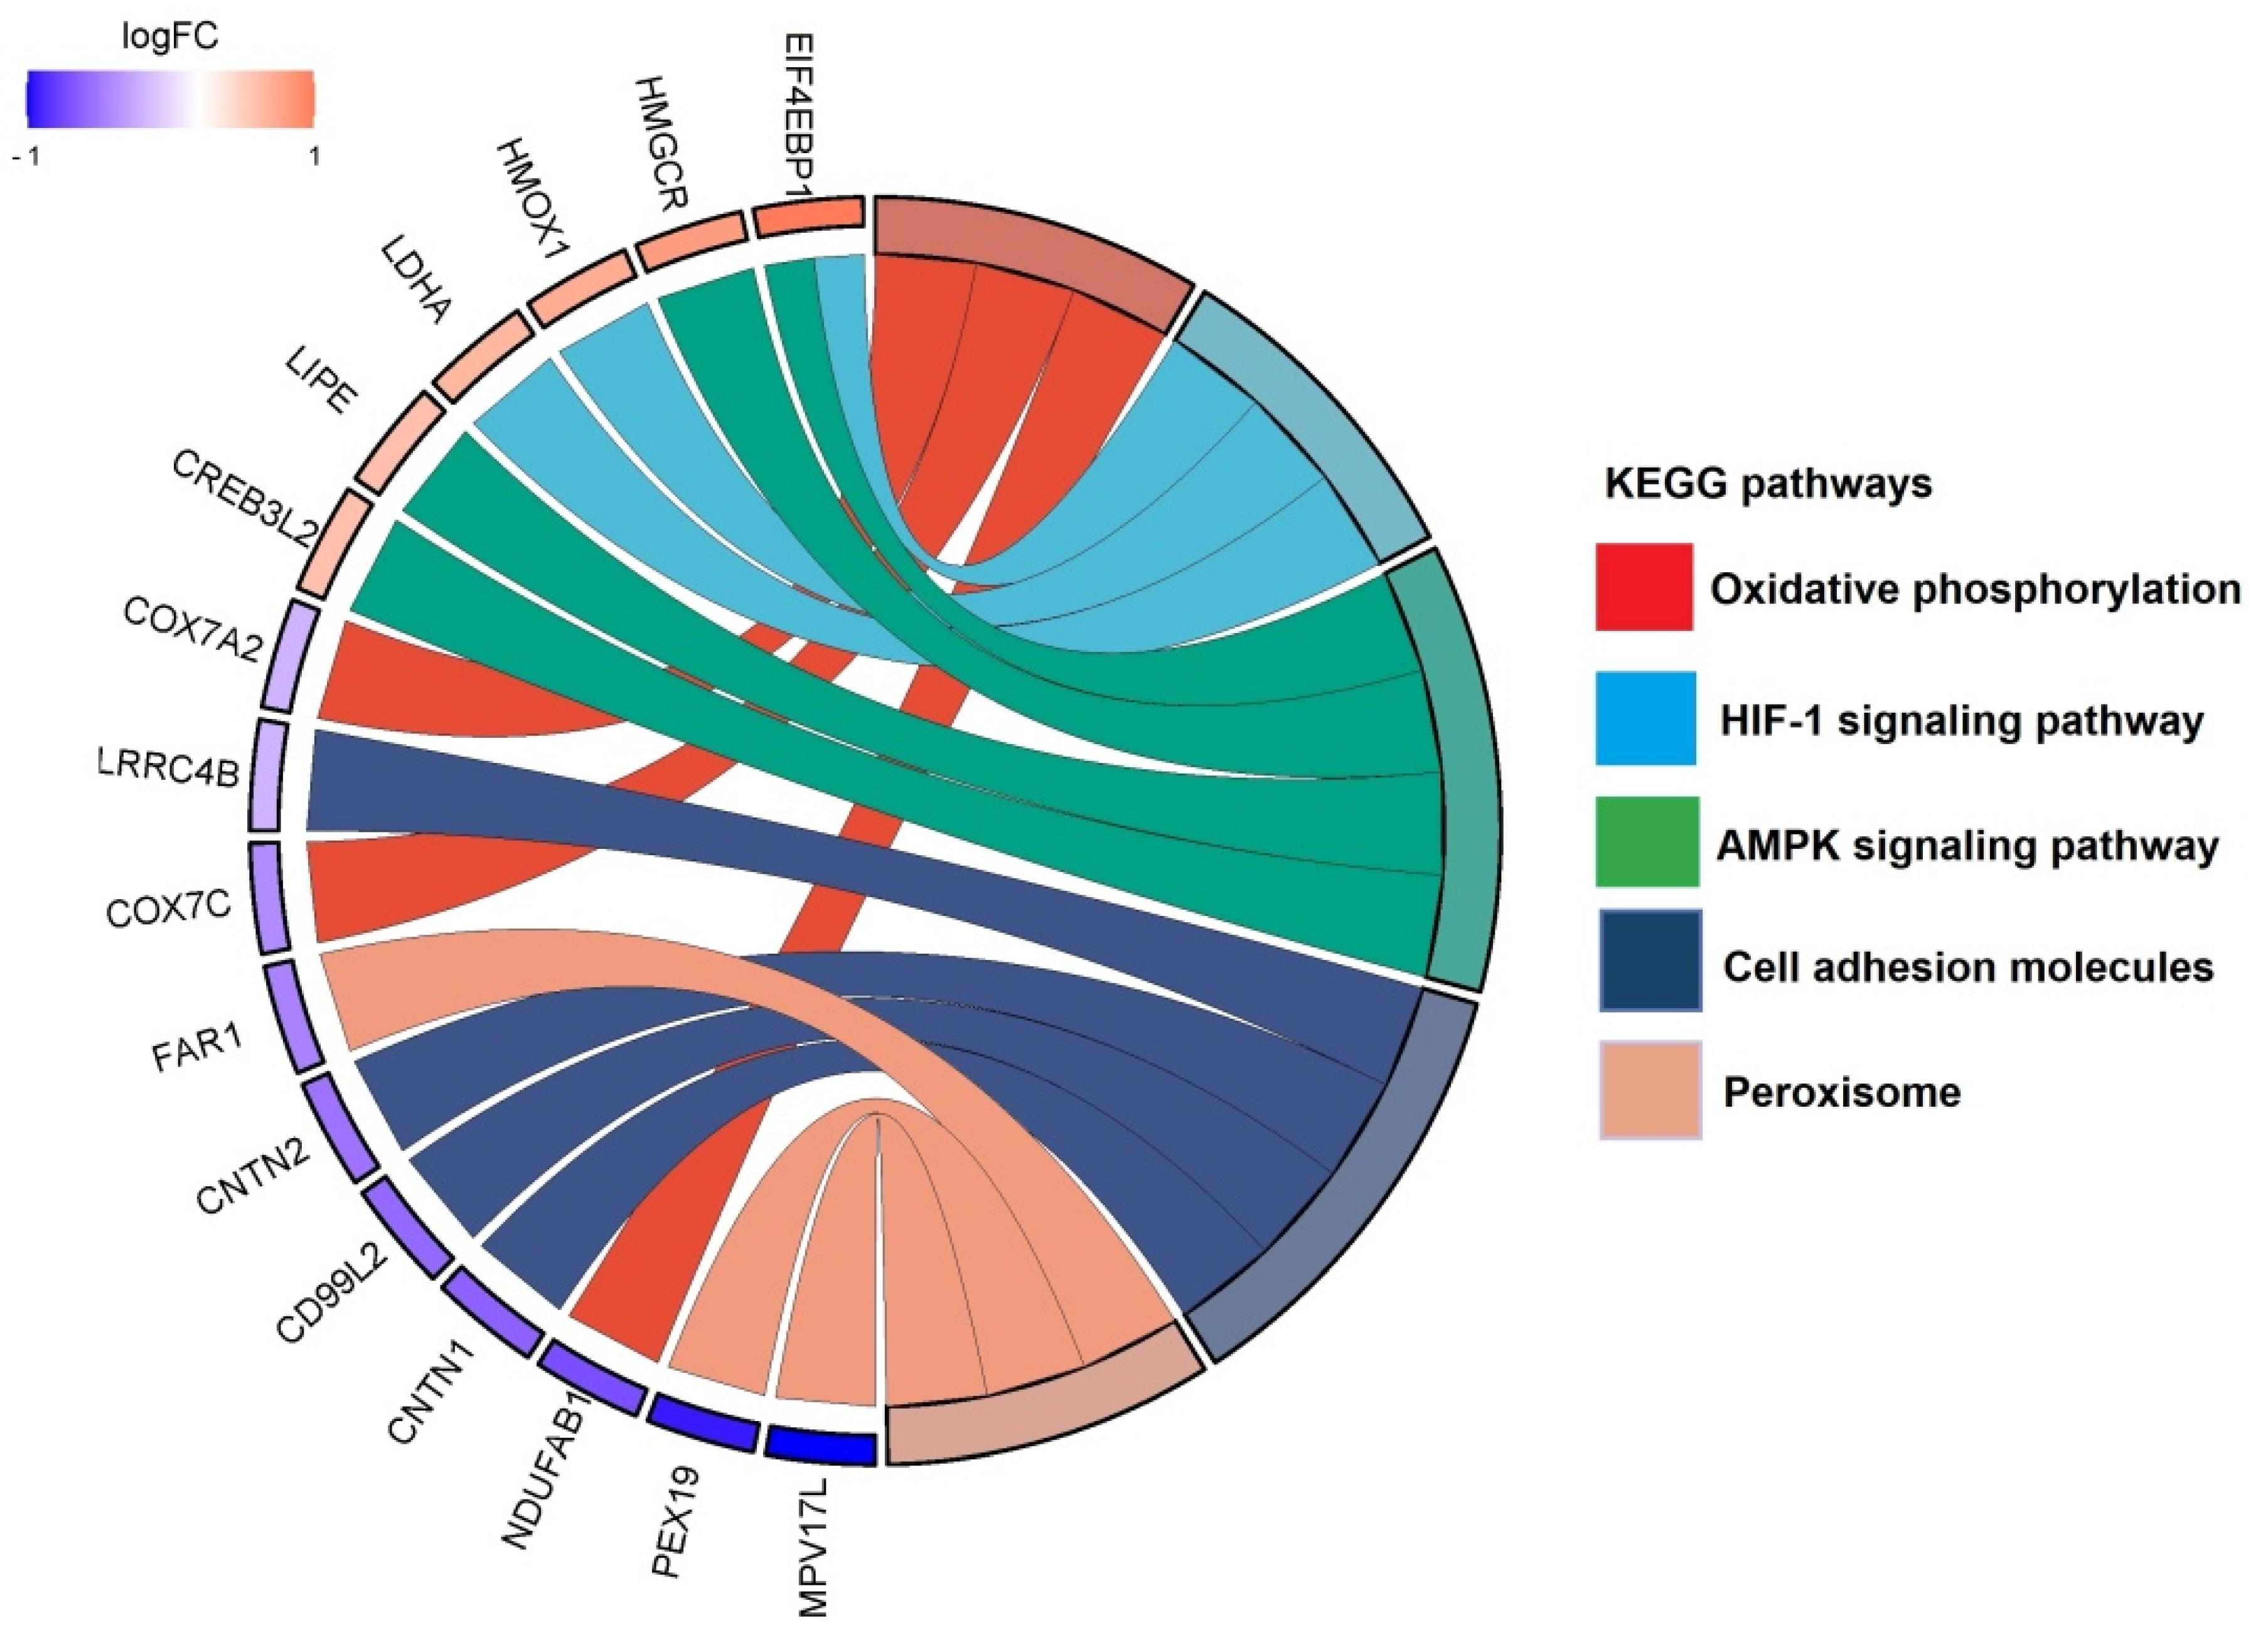
3.2. Pathway Classification of the Differentially Expressed Proteins
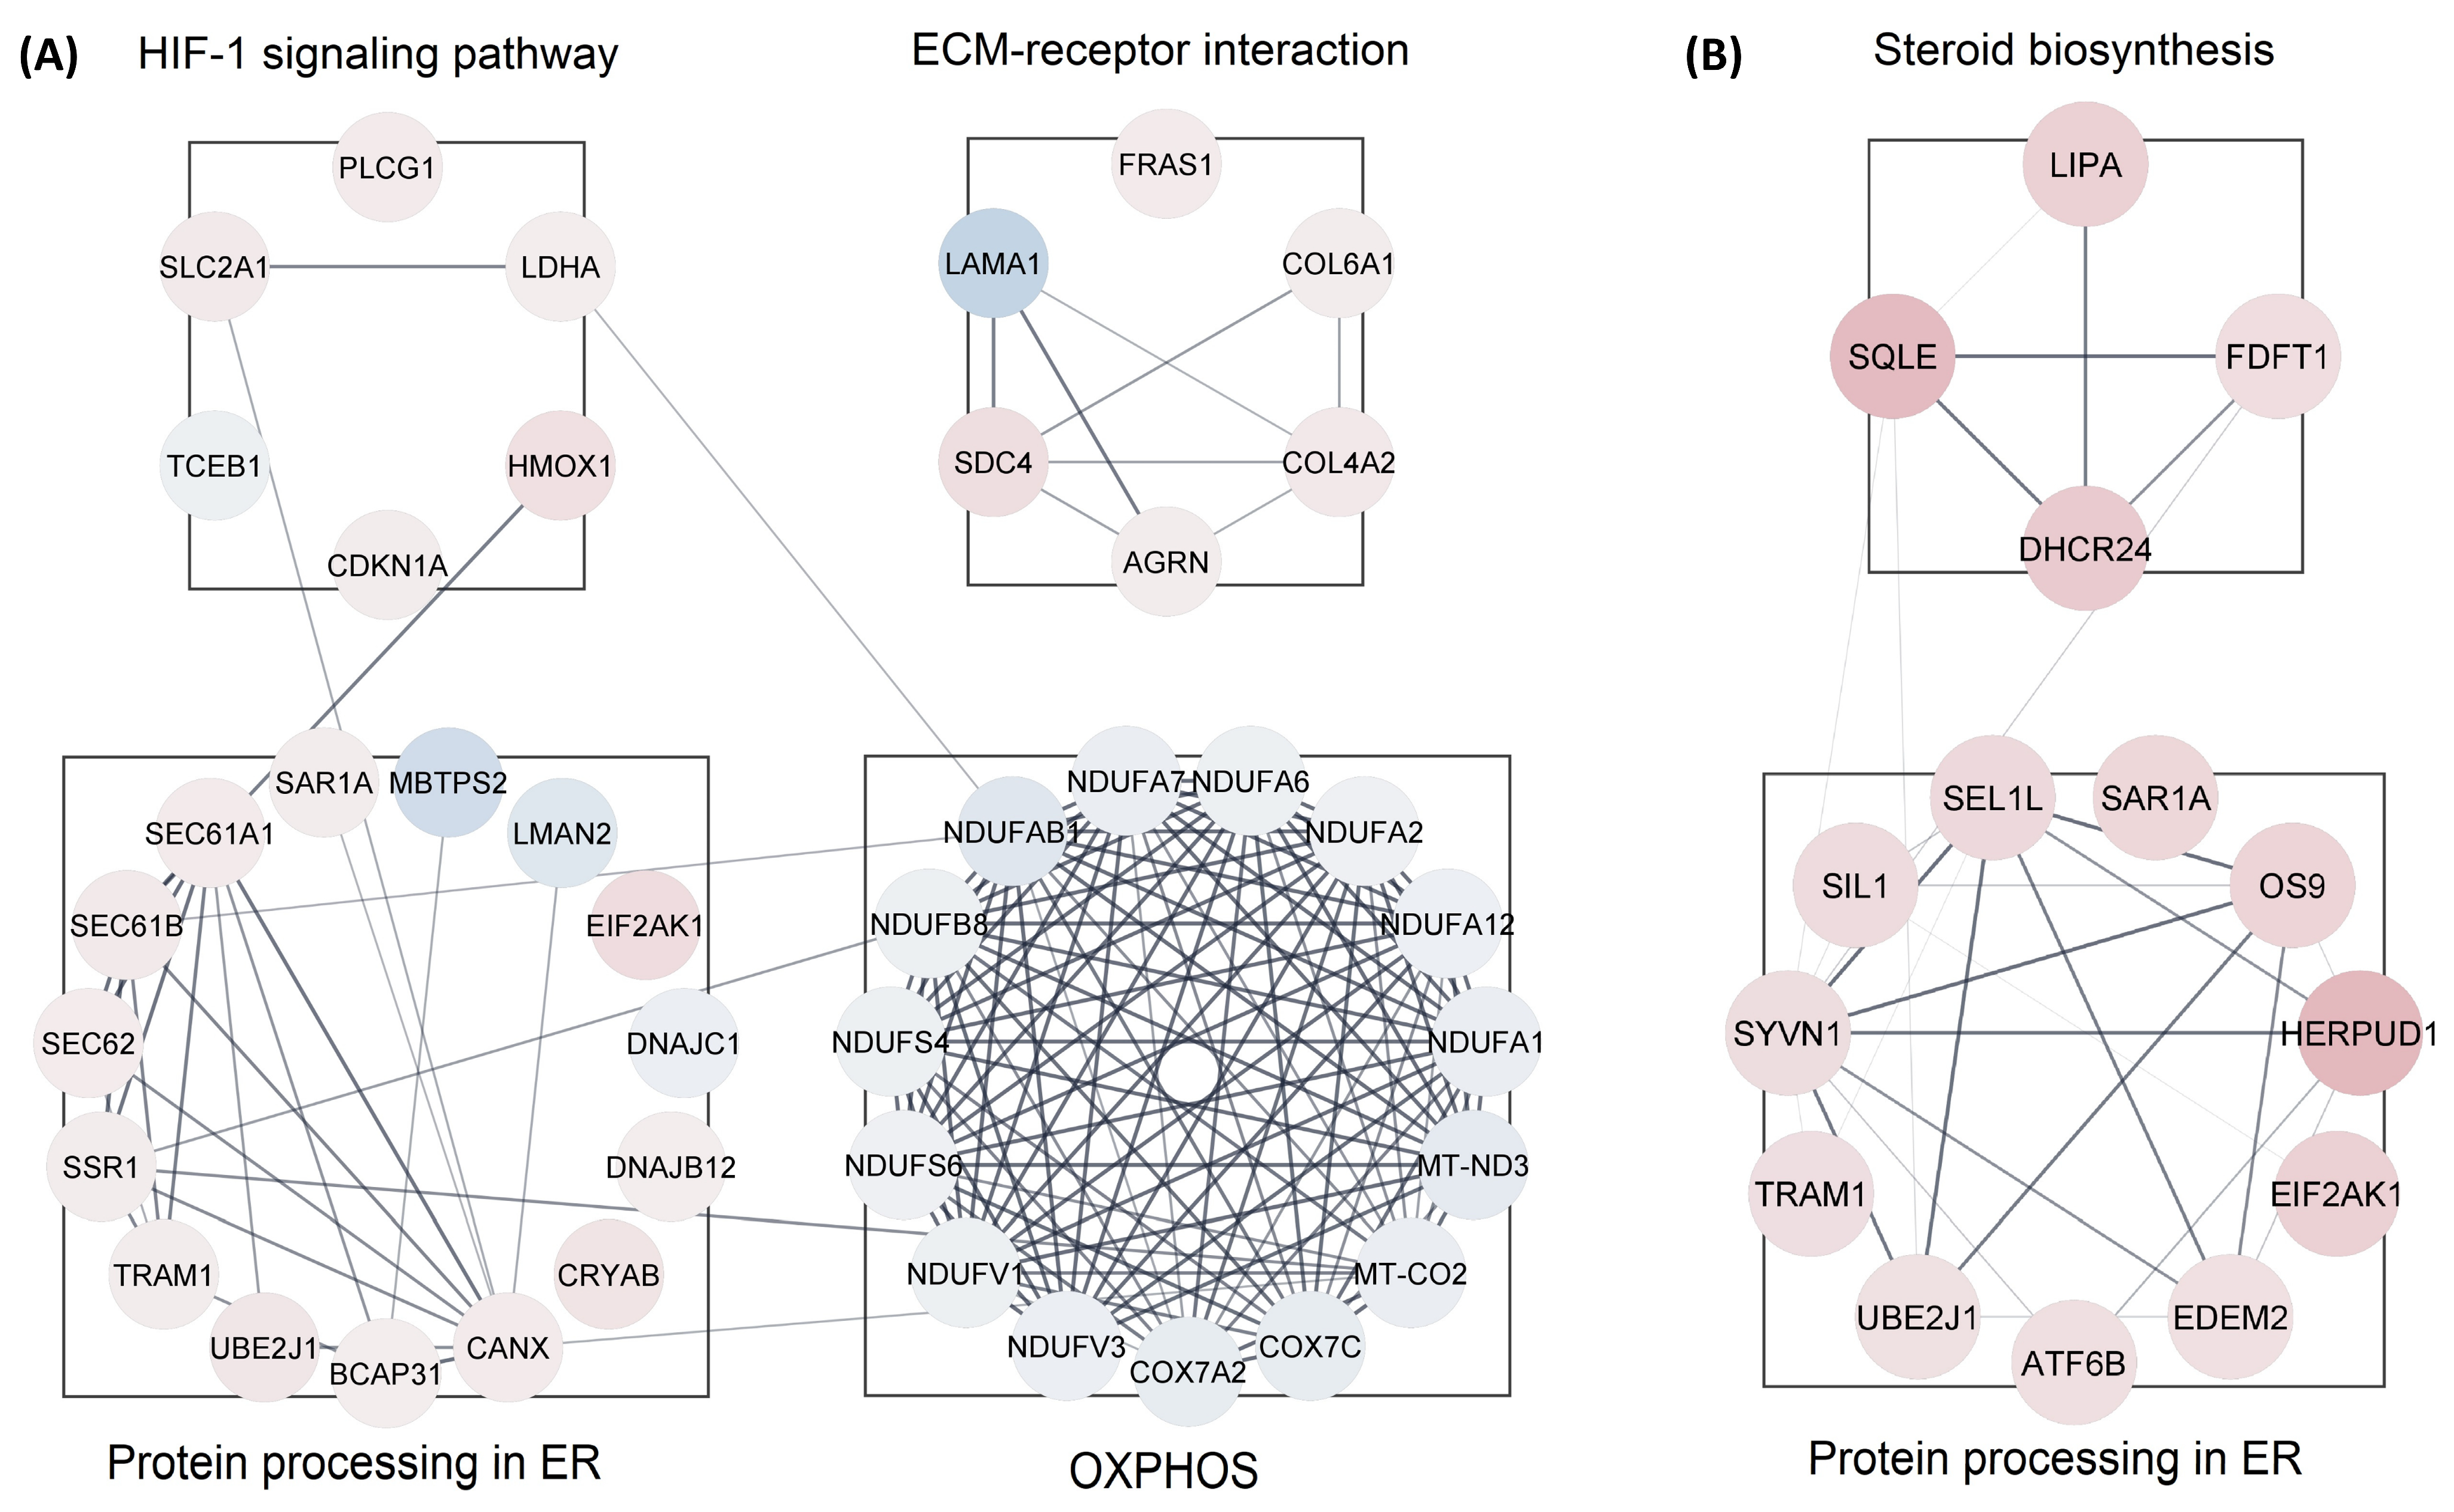
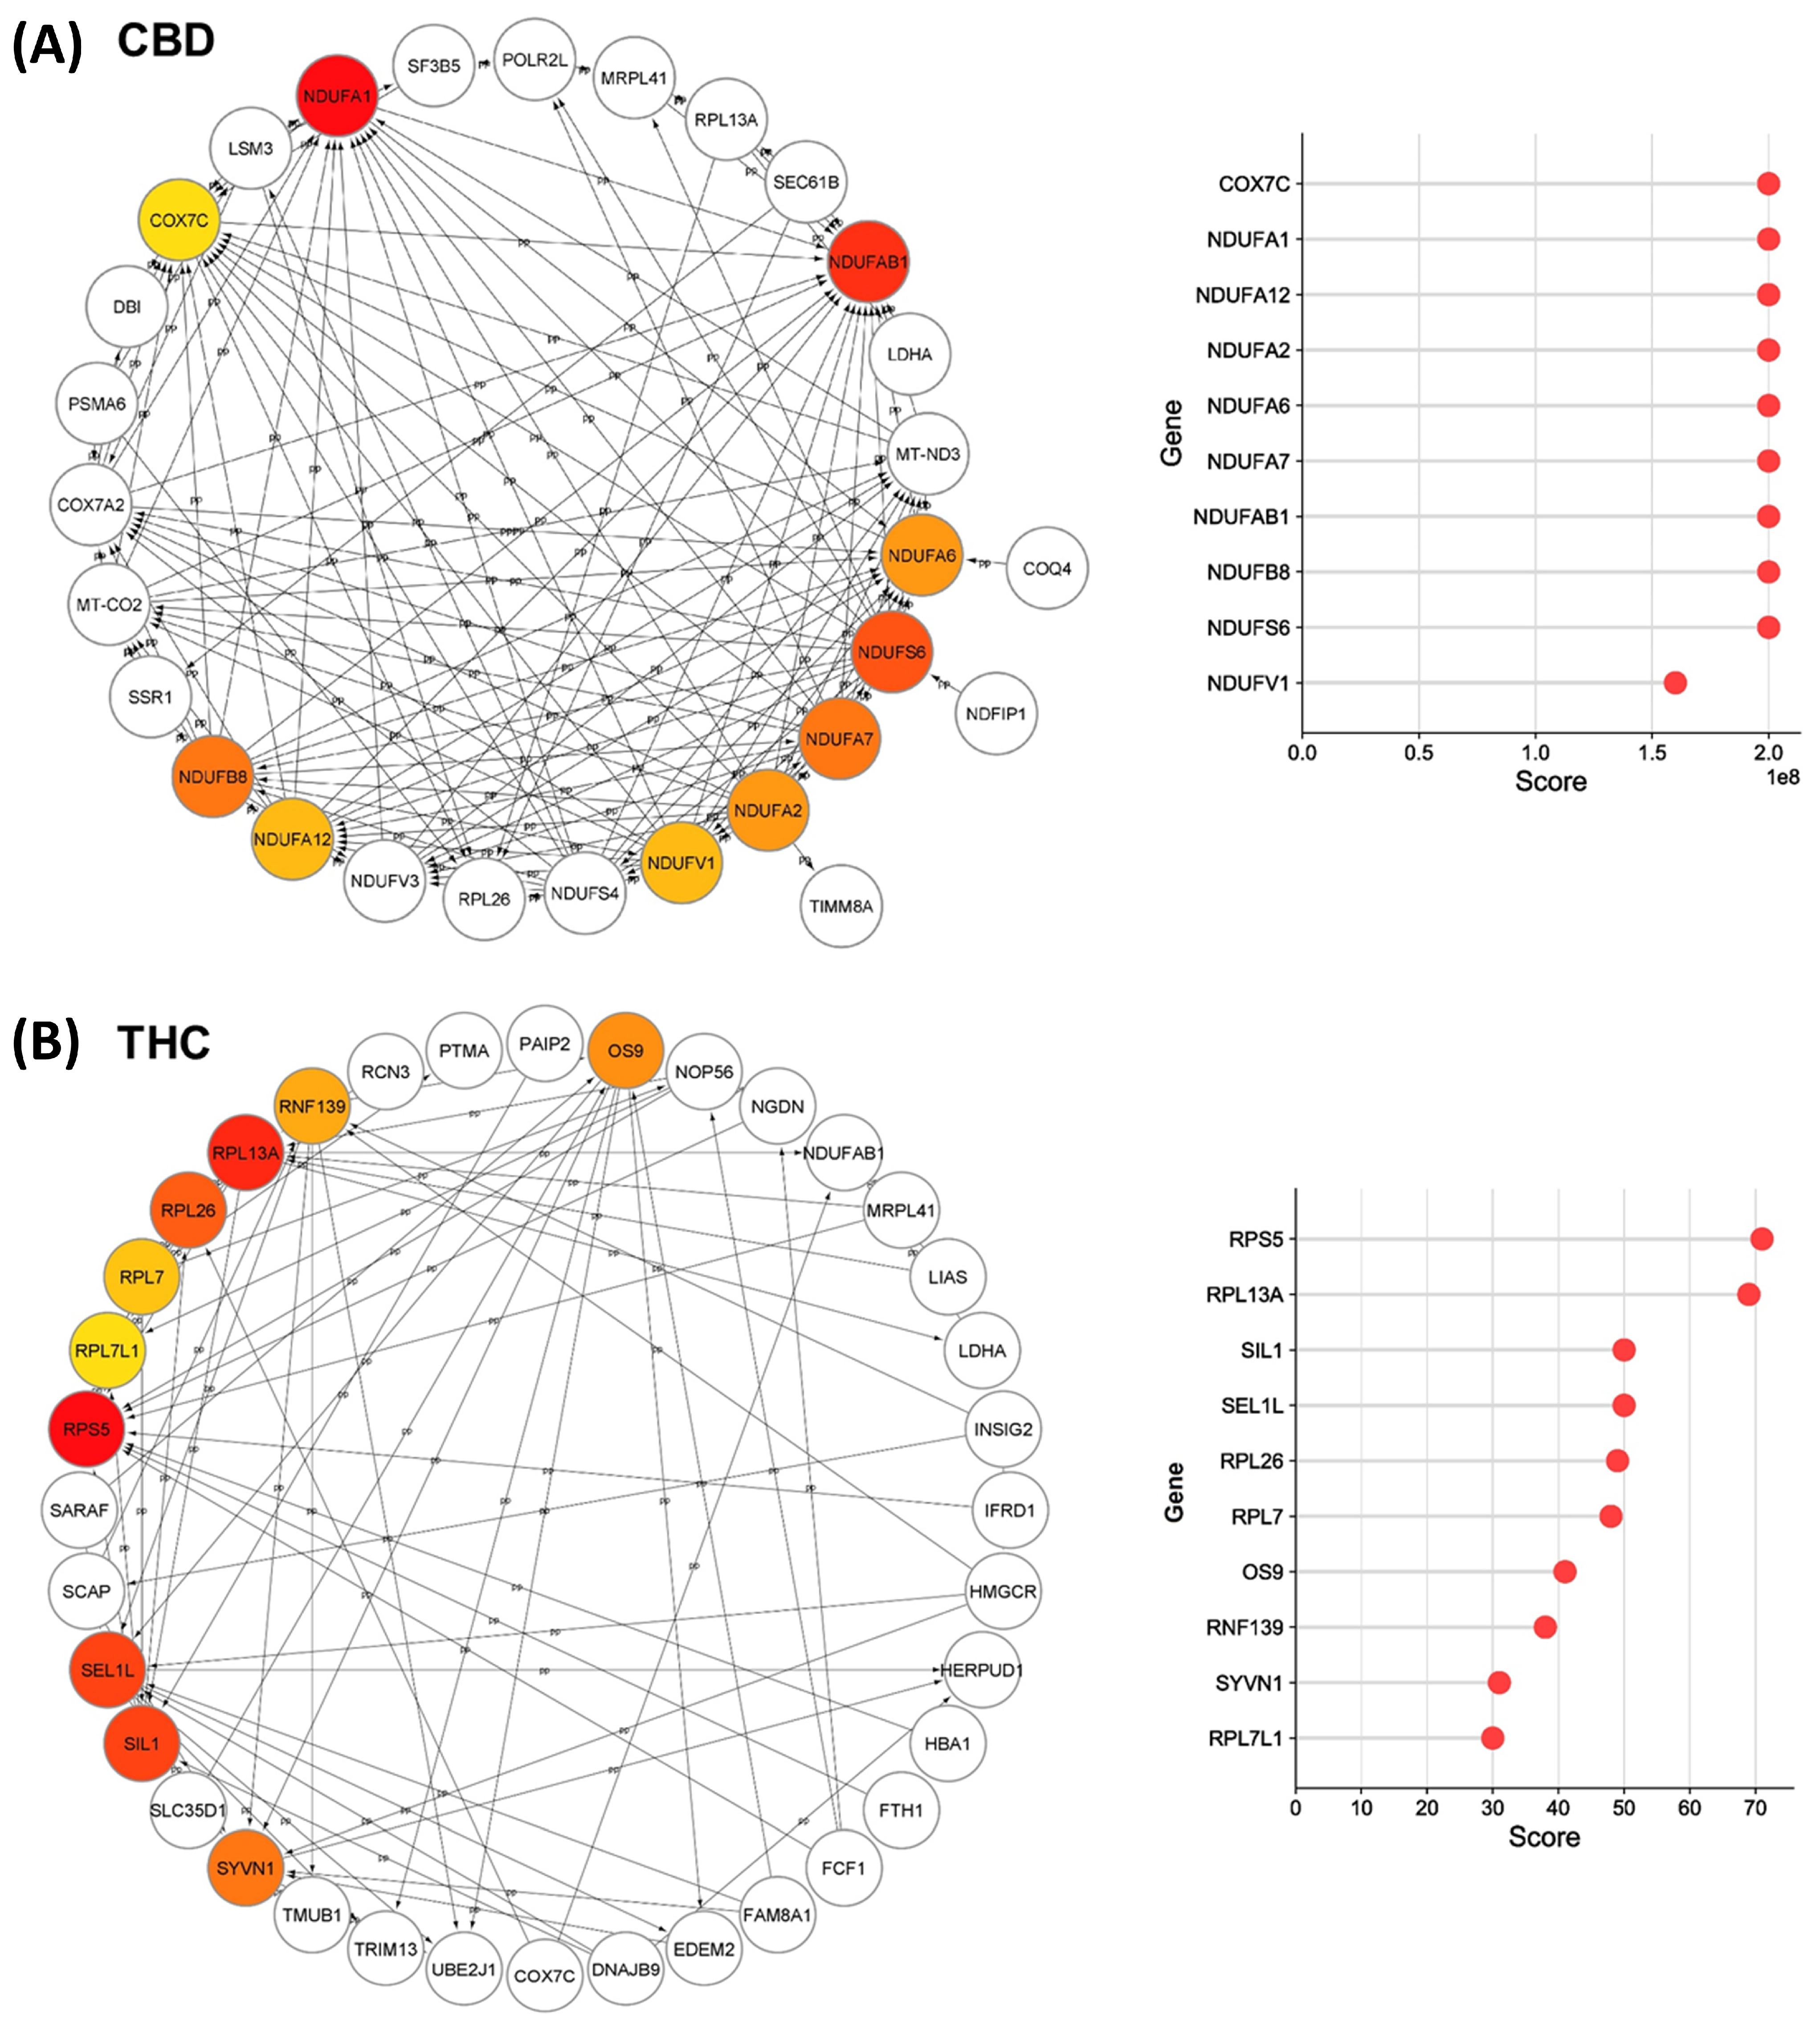
3.3. Protein-Protein Interaction (PPI) Analysis
4. Discussion
5. Conclusions
6. Limitations
Supplementary Materials
Author Contributions
Funding
Institutional Review Board Statement
Informed Consent Statement
Data Availability Statement
Acknowledgments
Conflicts of Interest
References
- Odieka, A.E.; Obuzor, G.U.; Oyedeji, O.O.; Gondwe, M.; Hosu, Y.S.; Oyedeji, A.O. The medicinal natural products of cannabis sativa linn.: A review. Molecules 2022, 27, 1689. [Google Scholar] [PubMed]
- Abyadeh, M.; Gupta, V.; Paulo, J.A.; Gupta, V.; Chitranshi, N.; Godinez, A.; Saks, D.; Hasan, M.; Amirkhani, A.; McKay, M.; et al. A proteomic view of cellular and molecular effects of cannabis. Biomolecules 2021, 11, 1411. [Google Scholar]
- Col, M.; Ruggeri, M.; Bhattacharyya, S. Unraveling the intoxicating and therapeutic effects of cannabis ingredients on psychosis and cognition. Front. Psychol. 2020, 11, 833. [Google Scholar]
- Cascio, M.G.; Gauson, L.A.; Stevenson, L.A.; Ross, R.A.; Pertwee, R.G. Evidence that the plant cannabinoid cannabigerol is a highly potent alpha2-adrenoceptor agonist and moderately potent 5ht1a receptor antagonist. Br. J. Pharmacol. 2010, 159, 129–141. [Google Scholar] [PubMed]
- Devinsky, O.; Cilio, M.R.; Cross, H.; Fernandez-Ruiz, J.; French, J.; Hill, C.; Katz, R.; Di Marzo, V.; Jutras-Aswad, D.; Notcutt, W.G.; et al. Cannabidiol: Pharmacology and potential therapeutic role in epilepsy and other neuropsychiatric disorders. Epilepsia 2014, 55, 791–802. [Google Scholar] [PubMed]
- Roser, P.; Habermeyer, B.; Scherbaum, N.; Lay, B. Cannabidiol use among patients with substance use disorders. J. Subst. Use 2022, 1–7. [Google Scholar] [CrossRef]
- Legare, C.A.; Raup-Konsavage, W.M.; Vrana, K.E. Therapeutic potential of cannabis, cannabidiol, and cannabinoid-based pharmaceuticals. Pharmacology 2022, 107, 131–149. [Google Scholar]
- Pagano, C.; Navarra, G.; Coppola, L.; Avilia, G.; Bifulco, M.; Laezza, C. Cannabinoids: Therapeutic use in clinical practice. Int. J. Mol. Sci. 2022, 23, 3344. [Google Scholar]
- Gheasuddin, Y.; Galea, G.L. Cannabidiol impairs neural tube closure in mouse whole embryo culture. Birth Defects Res. 2022, 114, 1186–1193. [Google Scholar]
- Scherma, M.; Qvist, J.S.; Asok, A.; Huang, S.C.; Masia, P.; Deidda, M.; Wei, Y.B.; Soni, R.K.; Fratta, W.; Fadda, P.; et al. Cannabinoid exposure in rat adolescence reprograms the initial behavioral, molecular, and epigenetic response to cocaine. Proc. Natl. Acad. Sci. USA 2020, 117, 9991–10002. [Google Scholar]
- Schweikle, S.; Golombek, P.; Sproll, C.; Walch, S.G.; Lachenmeier, D.W. The challenge of risk assessment of tetrahydrocannabinol (thc) in cannabidiol (cbd) oils and food supplements: An approach for deriving maximum limits. Challenges 2022, 13, 32. [Google Scholar] [CrossRef]
- Alharbi, Y.N. Current legal status of medical marijuana and cannabidiol in the united states. Epilepsy Behav. 2020, 112, 107452. [Google Scholar] [CrossRef] [PubMed]
- Brown, J.D.; Rivera Rivera, K.J.; Hernandez, L.Y.C.; Doenges, M.R.; Auchey, I.; Pham, T.; Goodin, A.J. Natural and synthetic cannabinoids: Pharmacology, uses, adverse drug events, and drug interactions. J. Clin. Pharmacol. 2021, 61 (Suppl. 2), S37–S52. [Google Scholar] [CrossRef] [PubMed]
- Abyadeh, M.; Meyfour, A.; Gupta, V.; Zabet Moghaddam, M.; Fitzhenry, M.J.; Shahbazian, S.; Hosseini Salekdeh, G.; Mirzaei, M. Recent advances of functional proteomics in gastrointestinal cancers—A path towards the identification of candidate diagnostic, prognostic, and therapeutic molecular biomarkers. Int. J. Mol. Sci. 2020, 21, 8532. [Google Scholar] [CrossRef] [PubMed]
- Beiersdorf, J.; Hevesi, Z.; Calvigioni, D.; Pyszkowski, J.; Romanov, R.; Szodorai, E.; Lubec, G.; Shirran, S.; Botting, C.H.; Kasper, S.; et al. Adverse effects of delta9-tetrahydrocannabinol on neuronal bioenergetics during postnatal development. JCI Insight 2020, 5, e135418. [Google Scholar] [CrossRef] [PubMed]
- Tortoriello, G.; Morris, C.V.; Alpar, A.; Fuzik, J.; Shirran, S.L.; Calvigioni, D.; Keimpema, E.; Botting, C.H.; Reinecke, K.; Herdegen, T.; et al. Miswiring the brain: Delta9-tetrahydrocannabinol disrupts cortical development by inducing an scg10/stathmin-2 degradation pathway. EMBO J. 2014, 33, 668–685. [Google Scholar] [CrossRef] [PubMed]
- Bindukumar, B.; Mahajan, S.D.; Reynolds, J.L.; Hu, Z.; Sykes, D.E.; Aalinkeel, R.; Schwartz, S.A. Genomic and proteomic analysis of the effects of cannabinoids on normal human astrocytes. Brain Res. 2008, 1191, 1–11. [Google Scholar] [CrossRef] [PubMed]
- O’Grady, C. Cannabis research data reveals a focus on harms of the drug. Science 2020, 369, 1155. [Google Scholar] [CrossRef] [PubMed]
- Patel, S.; Khan, S.; M, S.; Hamid, P. The association between cannabis use and schizophrenia: Causative or curative? A systematic review. Cureus 2020, 12, e9309. [Google Scholar] [CrossRef]
- Delgado-Sequera, A.; Hidalgo-Figueroa, M.; Barrera-Conde, M.; Duran-Ruiz, M.C.; Castro, C.; Fernandez-Aviles, C.; de la Torre, R.; Sanchez-Gomar, I.; Perez, V.; Geribaldi-Doldan, N.; et al. Olfactory neuroepithelium cells from cannabis users display alterations to the cytoskeleton and to markers of adhesion, proliferation and apoptosis. Mol. Neurobiol. 2021, 58, 1695–1710. [Google Scholar] [CrossRef]
- Barrera-Conde, M.; Ausin, K.; Lachen-Montes, M.; Fernandez-Irigoyen, J.; Galindo, L.; Cuenca-Royo, A.; Fernandez-Aviles, C.; Perez, V.; de la Torre, R.; Santamaria, E.; et al. Cannabis use induces distinctive proteomic alterations in olfactory neuroepithelial cells of schizophrenia patients. J. Pers. Med. 2021, 11, 160. [Google Scholar] [CrossRef] [PubMed]
- Abo Youssef, N.; Schneider, M.P.; Mordasini, L.; Ineichen, B.V.; Bachmann, L.M.; Chartier-Kastler, E.; Panicker, J.N.; Kessler, T.M. Cannabinoids for treating neurogenic lower urinary tract dysfunction in patients with multiple sclerosis: A systematic review and meta-analysis. BJU Int. 2017, 119, 515–521. [Google Scholar] [CrossRef] [PubMed]
- Nedumaran, B.; Rudra, P.; Gaydos, J.; Kumar, S.; Meacham, R.B.; Burnham, E.L.; Malykhina, A.P. Impact of regular cannabis use on biomarkers of lower urinary tract function. Urology 2017, 109, 223.e9–223.e16. [Google Scholar] [CrossRef] [PubMed]
- Mitchell, D.C.; Kuljanin, M.; Li, J.; Van Vranken, J.G.; Bulloch, N.; Schweppe, D.K.; Huttlin, E.L.; Gygi, S.P. A proteome-wide atlas of drug mechanism of action. Nat. Biotechnol. 2023, 41, 845–857. [Google Scholar] [CrossRef]
- McAlister, G.C.; Nusinow, D.P.; Jedrychowski, M.P.; Wuhr, M.; Huttlin, E.L.; Erickson, B.K.; Rad, R.; Haas, W.; Gygi, S.P. Multinotch ms3 enables accurate, sensitive, and multiplexed detection of differential expression across cancer cell line proteomes. Anal. Chem. 2014, 86, 7150–7158. [Google Scholar] [CrossRef]
- Navarrete-Perea, J.; Yu, Q.; Gygi, S.P.; Paulo, J.A. Streamlined tandem mass tag (sl-tmt) protocol: An efficient strategy for quantitative (phospho)proteome profiling using tandem mass tag-synchronous precursor selection-ms3. J. Proteome Res. 2018, 17, 2226–2236. [Google Scholar] [CrossRef]
- Ting, L.; Rad, R.; Gygi, S.P.; Haas, W. Ms3 eliminates ratio distortion in isobaric multiplexed quantitative proteomics. Nat. Methods 2011, 8, 937–940. [Google Scholar] [CrossRef]
- Gygi, J.P.; Yu, Q.; Navarrete-Perea, J.; Rad, R.; Gygi, S.P.; Paulo, J.A. Web-based search tool for visualizing instrument performance using the triple knockout (tko) proteome standard. J. Proteome Res. 2019, 18, 687–693. [Google Scholar] [CrossRef]
- Paulo, J.A.; O’Connell, J.D.; Gygi, S.P. A triple knockout (tko) proteomics standard for diagnosing ion interference in isobaric labeling experiments. J. Am. Soc. Mass. Spectrom. 2016, 27, 1620–1625. [Google Scholar] [CrossRef]
- Schweppe, D.K.; Eng, J.K.; Yu, Q.; Bailey, D.; Rad, R.; Navarrete-Perea, J.; Huttlin, E.L.; Erickson, B.K.; Paulo, J.A.; Gygi, S.P. Full-featured, real-time database searching platform enables fast and accurate multiplexed quantitative proteomics. J. Proteome Res. 2020, 19, 2026–2034. [Google Scholar] [CrossRef]
- Mirzaei, M.; Gupta, V.B.; Chick, J.M.; Greco, T.M.; Wu, Y.; Chitranshi, N.; Wall, R.V.; Hone, E.; Deng, L.; Dheer, Y.; et al. Age-related neurodegenerative disease associated pathways identified in retinal and vitreous proteome from human glaucoma eyes. Sci. Rep. 2017, 7, 12685. [Google Scholar] [CrossRef] [PubMed]
- Mirzaei, M.; Gupta, V.K.; Chitranshi, N.; Deng, L.; Pushpitha, K.; Abbasi, M.; Chick, J.M.; Rajput, R.; Wu, Y.; McKay, M.J.; et al. Retinal proteomics of experimental glaucoma model reveal intraocular pressure-induced mediators of neurodegenerative changes. J. Cell Biochem. 2020, 121, 4931–4944. [Google Scholar] [CrossRef] [PubMed]
- Mirzaei, M.; Pushpitha, K.; Deng, L.; Chitranshi, N.; Gupta, V.; Rajput, R.; Mangani, A.B.; Dheer, Y.; Godinez, A.; McKay, M.J.; et al. Upregulation of proteolytic pathways and altered protein biosynthesis underlie retinal pathology in a mouse model of alzheimer’s disease. Mol. Neurobiol. 2019, 56, 6017–6034. [Google Scholar] [CrossRef] [PubMed]
- Huang, D.W.; Sherman, B.T.; Lempicki, R.A. Systematic and integrative analysis of large gene lists using david bioinformatics resources. Nat. Protoc. 2009, 4, 44–57. [Google Scholar] [CrossRef]
- Kanehisa, M.; Furumichi, M.; Sato, Y.; Ishiguro-Watanabe, M.; Tanabe, M. Kegg: Integrating viruses and cellular organisms. Nucleic Acids Res. 2021, 49, D545–D551. [Google Scholar] [CrossRef]
- Xie, Z.; Bailey, A.; Kuleshov, M.V.; Clarke, D.J.B.; Evangelista, J.E.; Jenkins, S.L.; Lachmann, A.; Wojciechowicz, M.L.; Kropiwnicki, E.; Jagodnik, K.M.; et al. Gene set knowledge discovery with enrichr. Curr. Protoc. 2021, 1, e90. [Google Scholar] [CrossRef]
- Doncheva, N.T.; Morris, J.H.; Gorodkin, J.; Jensen, L.J. Cytoscape stringapp: Network analysis and visualization of proteomics data. J. Proteome Res. 2019, 18, 623–632. [Google Scholar] [CrossRef]
- Mirzaei, M.; Abyadeh, M.; Turner, A.J.; Wall, R.V.; Chick, J.M.; Paulo, J.A.; Gupta, V.K.; Basavarajappa, D.; Chitranshi, N.; Mirshahvaladi, S.S.O.; et al. Fingolimod effects on the brain are mediated through biochemical modulation of bioenergetics, autophagy, and neuroinflammatory networks. Proteomics 2022, 22, e2100247. [Google Scholar] [CrossRef]
- Abyadeh, M.; Tofigh, N.; Hosseinian, S.; Hasan, M.; Amirkhani, A.; Fitzhenry, M.J.; Gupta, V.; Chitranshi, N.; Salekdeh, G.H.; Haynes, P.A.; et al. Key genes and biochemical networks in various brain regions affected in alzheimer’s disease. Cells 2022, 11, 987. [Google Scholar] [CrossRef]
- Chin, C.H.; Chen, S.H.; Wu, H.H.; Ho, C.W.; Ko, M.T.; Lin, C.Y. Cytohubba: Identifying hub objects and sub-networks from complex interactome. BMC Syst. Biol. 2014, 8 (Suppl. 4), S11. [Google Scholar] [CrossRef]
- Hartl, C.L.; Ramaswami, G.; Pembroke, W.G.; Muller, S.; Pintacuda, G.; Saha, A.; Parsana, P.; Battle, A.; Lage, K.; Geschwind, D.H. Coexpression network architecture reveals the brain-wide and multiregional basis of disease susceptibility. Nat. Neurosci. 2021, 24, 1313–1323. [Google Scholar] [CrossRef] [PubMed]
- Huestis, M.A.; Solimini, R.; Pichini, S.; Pacifici, R.; Carlier, J.; Busardo, F.P. Cannabidiol adverse effects and toxicity. Curr. Neuropharmacol. 2019, 17, 974–989. [Google Scholar] [CrossRef] [PubMed]
- Zuckermann, A.M.E.; Battista, K.V.; Belanger, R.E.; Haddad, S.; Butler, A.; Costello, M.J.; Leatherdale, S.T. Trends in youth cannabis use across cannabis legalization: Data from the compass prospective cohort study. Prev. Med. Rep. 2021, 22, 101351. [Google Scholar] [CrossRef]
- Biedler, J.L.; Helson, L.; Spengler, B.A. Morphology and growth, tumorigenicity, and cytogenetics of human neuroblastoma cells in continuous culture. Cancer Res. 1973, 33, 2643–2652. [Google Scholar]
- Agholme, L.; Lindstrom, T.; Kagedal, K.; Marcusson, J.; Hallbeck, M. An in vitro model for neuroscience: Differentiation of sh-sy5y cells into cells with morphological and biochemical characteristics of mature neurons. J. Alzheimers Dis. 2010, 20, 1069–1082. [Google Scholar] [CrossRef] [PubMed]
- Branca, J.J.V.; Morucci, G.; Becatti, M.; Carrino, D.; Ghelardini, C.; Gulisano, M.; Di Cesare Mannelli, L.; Pacini, A. Cannabidiol protects dopaminergic neuronal cells from cadmium. Int. J. Environ. Res. Public. Health 2019, 16, 4420. [Google Scholar] [CrossRef] [PubMed]
- Ryan, D.; Drysdale, A.J.; Lafourcade, C.; Pertwee, R.G.; Platt, B. Cannabidiol targets mitochondria to regulate intracellular Ca2+ levels. J. Neurosci. 2009, 29, 2053–2063. [Google Scholar] [CrossRef]
- Schonhofen, P.; de Medeiros, L.M.; Bristot, I.J.; Lopes, F.M.; De Bastiani, M.A.; Kapczinski, F.; Crippa, J.A.; Castro, M.A.; Parsons, R.B.; Klamt, F. Cannabidiol exposure during neuronal differentiation sensitizes cells against redox-active neurotoxins. Mol. Neurobiol. 2015, 52, 26–37. [Google Scholar] [CrossRef]
- Vrechi, T.A.M.; Leao, A.; Morais, I.B.M.; Abilio, V.C.; Zuardi, A.W.; Hallak, J.E.C.; Crippa, J.A.; Bincoletto, C.; Ureshino, R.P.; Smaili, S.S.; et al. Cannabidiol induces autophagy via erk1/2 activation in neural cells. Sci. Rep. 2021, 11, 5434. [Google Scholar] [CrossRef]
- Alharris, E.; Singh, N.P.; Nagarkatti, P.S.; Nagarkatti, M. Role of mirna in the regulation of cannabidiol-mediated apoptosis in neuroblastoma cells. Oncotarget 2019, 10, 45–59. [Google Scholar] [CrossRef]
- Cannarsa, R.; Carretta, D.; Lattanzio, F.; Candeletti, S.; Romualdi, P. ∆9-tetrahydrocannabinol decreases nop receptor density and mrna levels in human sh-sy5y cells. J. Mol. Neurosci. 2012, 46, 285–292. [Google Scholar] [CrossRef] [PubMed]
- Carroll, C.B.; Zeissler, M.L.; Hanemann, C.O.; Zajicek, J.P. ∆9-tetrahydrocannabinol (∆9-thc) exerts a direct neuroprotective effect in a human cell culture model of parkinson’s disease. Neuropathol. Appl. Neurobiol. 2012, 38, 535–547. [Google Scholar] [CrossRef] [PubMed]
- Lew, G.M. Tau protein after delta-9-tetrahydrocannabinol in a human neuroblastoma cell line. Gen. Pharmacol. 1996, 27, 1141–1143. [Google Scholar] [CrossRef] [PubMed]
- Zeissler, M.L.; Eastwood, J.; McCorry, K.; Hanemann, C.O.; Zajicek, J.P.; Carroll, C.B. ∆9-tetrahydrocannabinol protects against mpp+ toxicity in sh-sy5y cells by restoring proteins involved in mitochondrial biogenesis. Oncotarget 2016, 7, 46603–46614. [Google Scholar] [CrossRef]
- Deng, L.; Gupta, V.; Abyadeh, M.; Chitranshi, N.; Pushpitha, K.; Wu, Y.; Gupta, V.; You, Y.; Paulo, J.A.; Graham, S.L.; et al. Oxidative stress induced dysfunction of protein synthesis in 661w mice photoreceptor cells. Proteomes 2023, 11, 12. [Google Scholar] [CrossRef]
- Hua, Z.; Zhang, J.; Cheng, W.; Wang, C.; Zhao, D. Ethanolic extract from seed residues of sea buckthorn (Hippophae rhamnoides L.) ameliorates oxidative stress damage and prevents apoptosis in murine cell and aging animal models. Foods 2023, 12, 3322. [Google Scholar] [CrossRef] [PubMed]
- Molloy, M.P.; Hill, C.; O’Rourke, M.B.; Chandra, J.; Steffen, P.; McKay, M.J.; Pascovici, D.; Herbert, B.R. Proteomic analysis of whole blood using volumetric absorptive microsampling for precision medicine biomarker studies. J. Proteome Res. 2022, 21, 1196–1203. [Google Scholar] [CrossRef] [PubMed]
- Pascovici, D.; Handler, D.C.; Wu, J.X.; Haynes, P.A. Multiple testing corrections in quantitative proteomics: A useful but blunt tool. Proteomics 2016, 16, 2448–2453. [Google Scholar] [CrossRef] [PubMed]
- Handler, D.C.; Pascovici, D.; Mirzaei, M.; Gupta, V.; Salekdeh, G.H.; Haynes, P.A. The art of validating quantitative proteomics data. Proteomics 2018, 18, e1800222. [Google Scholar] [CrossRef]
- Chan, J.Z.; Duncan, R.E. Regulatory effects of cannabidiol on mitochondrial functions: A review. Cells 2021, 10, 1251. [Google Scholar] [CrossRef]
- Sun, S.; Hu, F.; Wu, J.; Zhang, S. Cannabidiol attenuates ogd/r-induced damage by enhancing mitochondrial bioenergetics and modulating glucose metabolism via pentose-phosphate pathway in hippocampal neurons. Redox Biol. 2017, 11, 577–585. [Google Scholar] [CrossRef] [PubMed]
- Valvassori, S.S.; Bavaresco, D.V.; Scaini, G.; Varela, R.B.; Streck, E.L.; Chagas, M.H.; Hallak, J.E.; Zuardi, A.W.; Crippa, J.A.; Quevedo, J. Acute and chronic administration of cannabidiol increases mitochondrial complex and creatine kinase activity in the rat brain. Braz. J. Psychiatry 2013, 35, 380–386. [Google Scholar] [CrossRef]
- Fisar, Z.; Singh, N.; Hroudova, J. Cannabinoid-induced changes in respiration of brain mitochondria. Toxicol. Lett. 2014, 231, 62–71. [Google Scholar] [CrossRef] [PubMed]
- Singh, R.K.; Nasonkin, I.O. Limitations and promise of retinal tissue from human pluripotent stem cells for developing therapies of blindness. Front. Cell Neurosci. 2020, 14, 179. [Google Scholar] [CrossRef] [PubMed]
- Rimmerman, N.; Ben-Hail, D.; Porat, Z.; Juknat, A.; Kozela, E.; Daniels, M.P.; Connelly, P.S.; Leishman, E.; Bradshaw, H.B.; Shoshan-Barmatz, V.; et al. Direct modulation of the outer mitochondrial membrane channel, voltage-dependent anion channel 1 (vdac1) by cannabidiol: A novel mechanism for cannabinoid-induced cell death. Cell Death Dis. 2013, 4, e949. [Google Scholar] [CrossRef]
- Jeong, S.; Jo, M.J.; Yun, H.K.; Kim, D.Y.; Kim, B.R.; Kim, J.L.; Park, S.H.; Na, Y.J.; Jeong, Y.A.; Kim, B.G.; et al. Cannabidiol promotes apoptosis via regulation of xiap/smac in gastric cancer. Cell Death Dis. 2019, 10, 846. [Google Scholar] [CrossRef]
- Jeong, S.; Yun, H.K.; Jeong, Y.A.; Jo, M.J.; Kang, S.H.; Kim, J.L.; Kim, D.Y.; Park, S.H.; Kim, B.R.; Na, Y.J.; et al. Cannabidiol-induced apoptosis is mediated by activation of noxa in human colorectal cancer cells. Cancer Lett. 2019, 447, 12–23. [Google Scholar] [CrossRef]
- Olivas-Aguirre, M.; Torres-Lopez, L.; Valle-Reyes, J.S.; Hernandez-Cruz, A.; Pottosin, I.; Dobrovinskaya, O. Cannabidiol directly targets mitochondria and disturbs calcium homeostasis in acute lymphoblastic leukemia. Cell Death Dis. 2019, 10, 779. [Google Scholar] [CrossRef]
- Colombo, G.; Rusconi, F.; Rubino, T.; Cattaneo, A.; Martegani, E.; Parolaro, D.; Bachi, A.; Zippel, R. Transcriptomic and proteomic analyses of mouse cerebellum reveals alterations in rasgrf1 expression following in vivo chronic treatment with delta 9-tetrahydrocannabinol. J. Mol. Neurosci. 2009, 37, 111–122. [Google Scholar] [CrossRef]
- Filipeanu, C.M.; Guidry, J.J.; Leonard, S.T.; Winsauer, P.J. Delta9-thc increases endogenous aha1 expression in rat cerebellum and may modulate cb1 receptor function during chronic use. J. Neurochem. 2011, 118, 1101–1112. [Google Scholar] [CrossRef]
- Salgado-Mendialdua, V.; Aguirre-Plans, J.; Guney, E.; Reig-Viader, R.; Maldonado, R.; Bayes, A.; Oliva, B.; Ozaita, A. Delta9-tetrahydrocannabinol modulates the proteasome system in the brain. Biochem. Pharmacol. 2018, 157, 159–168. [Google Scholar] [CrossRef] [PubMed]
- Harkany, T.; Horvath, T.L. (S)Pot on mitochondria: Cannabinoids disrupt cellular respiration to limit neuronal activity. Cell Metab. 2017, 25, 8–10. [Google Scholar] [CrossRef] [PubMed]
- Lojpur, T.; Easton, Z.; Raez-Villanueva, S.; Laviolette, S.; Holloway, A.C.; Hardy, D.B. ∆9-tetrahydrocannabinol leads to endoplasmic reticulum stress and mitochondrial dysfunction in human bewo trophoblasts. Reprod. Toxicol. 2019, 87, 21–31. [Google Scholar] [CrossRef] [PubMed]
- Wolff, V.; Schlagowski, A.I.; Rouyer, O.; Charles, A.L.; Singh, F.; Auger, C.; Schini-Kerth, V.; Marescaux, C.; Raul, J.S.; Zoll, J.; et al. Tetrahydrocannabinol induces brain mitochondrial respiratory chain dysfunction and increases oxidative stress: A potential mechanism involved in cannabis-related stroke. Biomed. Res. Int. 2015, 2015, 323706. [Google Scholar] [CrossRef] [PubMed]
- Yoo, Y.S.; Han, H.G.; Jeon, Y.J. Unfolded protein response of the endoplasmic reticulum in tumor progression and immunogenicity. Oxid. Med. Cell Longev. 2017, 2017, 2969271. [Google Scholar] [CrossRef] [PubMed]
- Nguyen, L.C.; Yang, D.; Nicolaescu, V.; Best, T.J.; Gula, H.; Saxena, D.; Gabbard, J.D.; Chen, S.N.; Ohtsuki, T.; Friesen, J.B.; et al. Cannabidiol inhibits SARS-CoV-2 replication through induction of the host er stress and innate immune responses. Sci. Adv. 2022, 8, eabi6110. [Google Scholar] [CrossRef]
- Bao, X.; Zhang, J.; Huang, G.; Yan, J.; Xu, C.; Dou, Z.; Sun, C.; Zhang, H. The crosstalk between hifs and mitochondrial dysfunctions in cancer development. Cell Death Dis. 2021, 12, 215. [Google Scholar] [CrossRef]
- Kierans, S.J.; Taylor, C.T. Regulation of glycolysis by the hypoxia-inducible factor (hif): Implications for cellular physiology. J. Physiol. 2021, 599, 23–37. [Google Scholar] [CrossRef]
- Jo, M.J.; Kim, B.G.; Kim, W.Y.; Lee, D.H.; Yun, H.K.; Jeong, S.; Park, S.H.; Kim, B.R.; Kim, J.L.; Kim, D.Y.; et al. Cannabidiol suppresses angiogenesis and stemness of breast cancer cells by downregulation of hypoxia-inducible factors-1alpha. Cancers 2021, 13, 5667. [Google Scholar] [CrossRef]
- Ariazi, E.A.; Cunliffe, H.E.; Lewis-Wambi, J.S.; Slifker, M.J.; Willis, A.L.; Ramos, P.; Tapia, C.; Kim, H.R.; Yerrum, S.; Sharma, C.G.; et al. Estrogen induces apoptosis in estrogen deprivation-resistant breast cancer through stress responses as identified by global gene expression across time. Proc. Natl. Acad. Sci. USA 2011, 108, 18879–18886. [Google Scholar] [CrossRef]
- Sheng, X.; Arnoldussen, Y.J.; Storm, M.; Tesikova, M.; Nenseth, H.Z.; Zhao, S.; Fazli, L.; Rennie, P.; Risberg, B.; Waehre, H.; et al. Divergent androgen regulation of unfolded protein response pathways drives prostate cancer. EMBO Mol. Med. 2015, 7, 788–801. [Google Scholar] [CrossRef] [PubMed]
- Amaral, C.; Trouille, F.M.; Almeida, C.F.; Correia-da-Silva, G.; Teixeira, N. Unveiling the mechanism of action behind the anti-cancer properties of cannabinoids in ER+ breast cancer cells: Impact on aromatase and steroid receptors. J. Steroid Biochem. Mol. Biol. 2021, 210, 105876. [Google Scholar] [CrossRef] [PubMed]
- Valiente-Alandi, I.; Schafer, A.E.; Blaxall, B.C. Extracellular matrix-mediated cellular communication in the heart. J. Mol. Cell Cardiol. 2016, 91, 228–237. [Google Scholar] [CrossRef] [PubMed]
- Walker, C.; Mojares, E.; Del Rio Hernandez, A. Role of extracellular matrix in development and cancer progression. Int. J. Mol. Sci. 2018, 19, 3028. [Google Scholar] [CrossRef] [PubMed]
- Bao, Y.; Wang, L.; Shi, L.; Yun, F.; Liu, X.; Chen, Y.; Chen, C.; Ren, Y.; Jia, Y. Transcriptome profiling revealed multiple genes and ecm-receptor interaction pathways that may be associated with breast cancer. Cell Mol. Biol. Lett. 2019, 24, 38. [Google Scholar] [CrossRef] [PubMed]
- Yeh, M.H.; Tzeng, Y.J.; Fu, T.Y.; You, J.J.; Chang, H.T.; Ger, L.P.; Tsai, K.W. Extracellular matrix-receptor interaction signaling genes associated with inferior breast cancer survival. Anticancer. Res. 2018, 38, 4593–4605. [Google Scholar] [CrossRef]
- Jechorek, D.; Haeusler-Pliske, I.; Meyer, F.; Roessner, A. Diagnostic value of syndecan-4 protein expression in colorectal cancer. Pathol. Res. Pract. 2021, 222, 153431. [Google Scholar] [CrossRef]
- He, J.S.; Hong, G.; Yang, J.; Duo, Z.; Li, F.; Chen, W.C.; Luo, X.Y.; Mao, Y.S.; Ouyang, Y.W.; Yue, P.; et al. siRNA-mediated suppression of collagen type iv alpha 2 (col4a2) mrna inhibits triple-negative breast cancer cell proliferation and migration. Oncotarget 2017, 8, 2585–2593. [Google Scholar]
- Owusu-Ansah, K.G.; Song, G.; Chen, R.; Edoo, M.I.A.; Li, J.; Chen, B.; Wu, J.; Zhou, L.; Xie, H.; Jiang, D.; et al. Col6a1 promotes metastasis and predicts poor prognosis in patients with pancreatic cancer. Int. J. Oncol. 2019, 55, 391–404. [Google Scholar] [CrossRef]
- Umeda, S.; Kanda, M.; Miwa, T.; Tanaka, H.; Tanaka, C.; Kobayashi, D.; Hayashi, M.; Yamada, S.; Nakayama, G.; Koike, M.; et al. Fraser extracellular matrix complex subunit 1 promotes liver metastasis of gastric cancer. Int. J. Cancer 2020, 146, 2865–2876. [Google Scholar] [CrossRef]
- Wang, Z.Q.; Sun, X.L.; Wang, Y.L.; Miao, Y.L. Agrin promotes the proliferation, invasion and migration of rectal cancer cells via the wnt signaling pathway to contribute to rectal cancer progression. J. Recept. Signal Transduct. Res. 2021, 41, 363–370. [Google Scholar] [CrossRef] [PubMed]
- Lin, H.; Yang, Y.; Hou, C.; Zheng, J.; Lv, G.; Mao, R.; Xu, P.; Chen, S.; Zhou, Y.; Wang, P.; et al. Identification of col6a1 as the key gene associated with antivascular endothelial growth factor therapy in glioblastoma multiforme. Genet. Test. Mol. Biomarkers 2021, 25, 334–345. [Google Scholar] [CrossRef] [PubMed]
- Dombrowski, C.; Helledie, T.; Ling, L.; Grunert, M.; Canning, C.A.; Jones, C.M.; Hui, J.H.; Nurcombe, V.; van Wijnen, A.J.; Cool, S.M. Fgfr1 signaling stimulates proliferation of human mesenchymal stem cells by inhibiting the cyclin-dependent kinase inhibitors p21Waf1 and p27Kip1. Stem Cells 2013, 31, 2724–2736. [Google Scholar] [CrossRef] [PubMed]
- Kang, D.; Jung, S.H.; Lee, G.H.; Lee, S.; Park, H.J.; Ko, Y.G.; Kim, Y.N.; Lee, J.S. Sulfated syndecan 1 is critical to preventing cellular senescence by modulating fibroblast growth factor receptor endocytosis. FASEB J. 2020, 34, 10316–10328. [Google Scholar] [CrossRef] [PubMed]
- Xian, W.; Schwertfeger, K.L.; Rosen, J.M. Distinct roles of fibroblast growth factor receptor 1 and 2 in regulating cell survival and epithelial-mesenchymal transition. Mol. Endocrinol. 2007, 21, 987–1000. [Google Scholar] [CrossRef]


Disclaimer/Publisher’s Note: The statements, opinions and data contained in all publications are solely those of the individual author(s) and contributor(s) and not of MDPI and/or the editor(s). MDPI and/or the editor(s) disclaim responsibility for any injury to people or property resulting from any ideas, methods, instructions or products referred to in the content. |
© 2023 by the authors. Licensee MDPI, Basel, Switzerland. This article is an open access article distributed under the terms and conditions of the Creative Commons Attribution (CC BY) license (https://creativecommons.org/licenses/by/4.0/).
Share and Cite
Abyadeh, M.; Gupta, V.; Liu, X.; Rossio, V.; Mirzaei, M.; Cornish, J.; Paulo, J.A.; Haynes, P.A. Proteome-Wide Profiling Using Sample Multiplexing of a Human Cell Line Treated with Cannabidiol (CBD) and Tetrahydrocannabinol (THC). Proteomes 2023, 11, 36. https://0-doi-org.brum.beds.ac.uk/10.3390/proteomes11040036
Abyadeh M, Gupta V, Liu X, Rossio V, Mirzaei M, Cornish J, Paulo JA, Haynes PA. Proteome-Wide Profiling Using Sample Multiplexing of a Human Cell Line Treated with Cannabidiol (CBD) and Tetrahydrocannabinol (THC). Proteomes. 2023; 11(4):36. https://0-doi-org.brum.beds.ac.uk/10.3390/proteomes11040036
Chicago/Turabian StyleAbyadeh, Morteza, Vivek Gupta, Xinyue Liu, Valentina Rossio, Mehdi Mirzaei, Jennifer Cornish, Joao A. Paulo, and Paul A. Haynes. 2023. "Proteome-Wide Profiling Using Sample Multiplexing of a Human Cell Line Treated with Cannabidiol (CBD) and Tetrahydrocannabinol (THC)" Proteomes 11, no. 4: 36. https://0-doi-org.brum.beds.ac.uk/10.3390/proteomes11040036