
Impact of Exposure to Chronic Light–Dark Phase Shifting Circadian Rhythm Disruption on Muscle Proteome in Periparturient Dairy Cows


Abstract
:1. Introduction
2. Materials and Methods
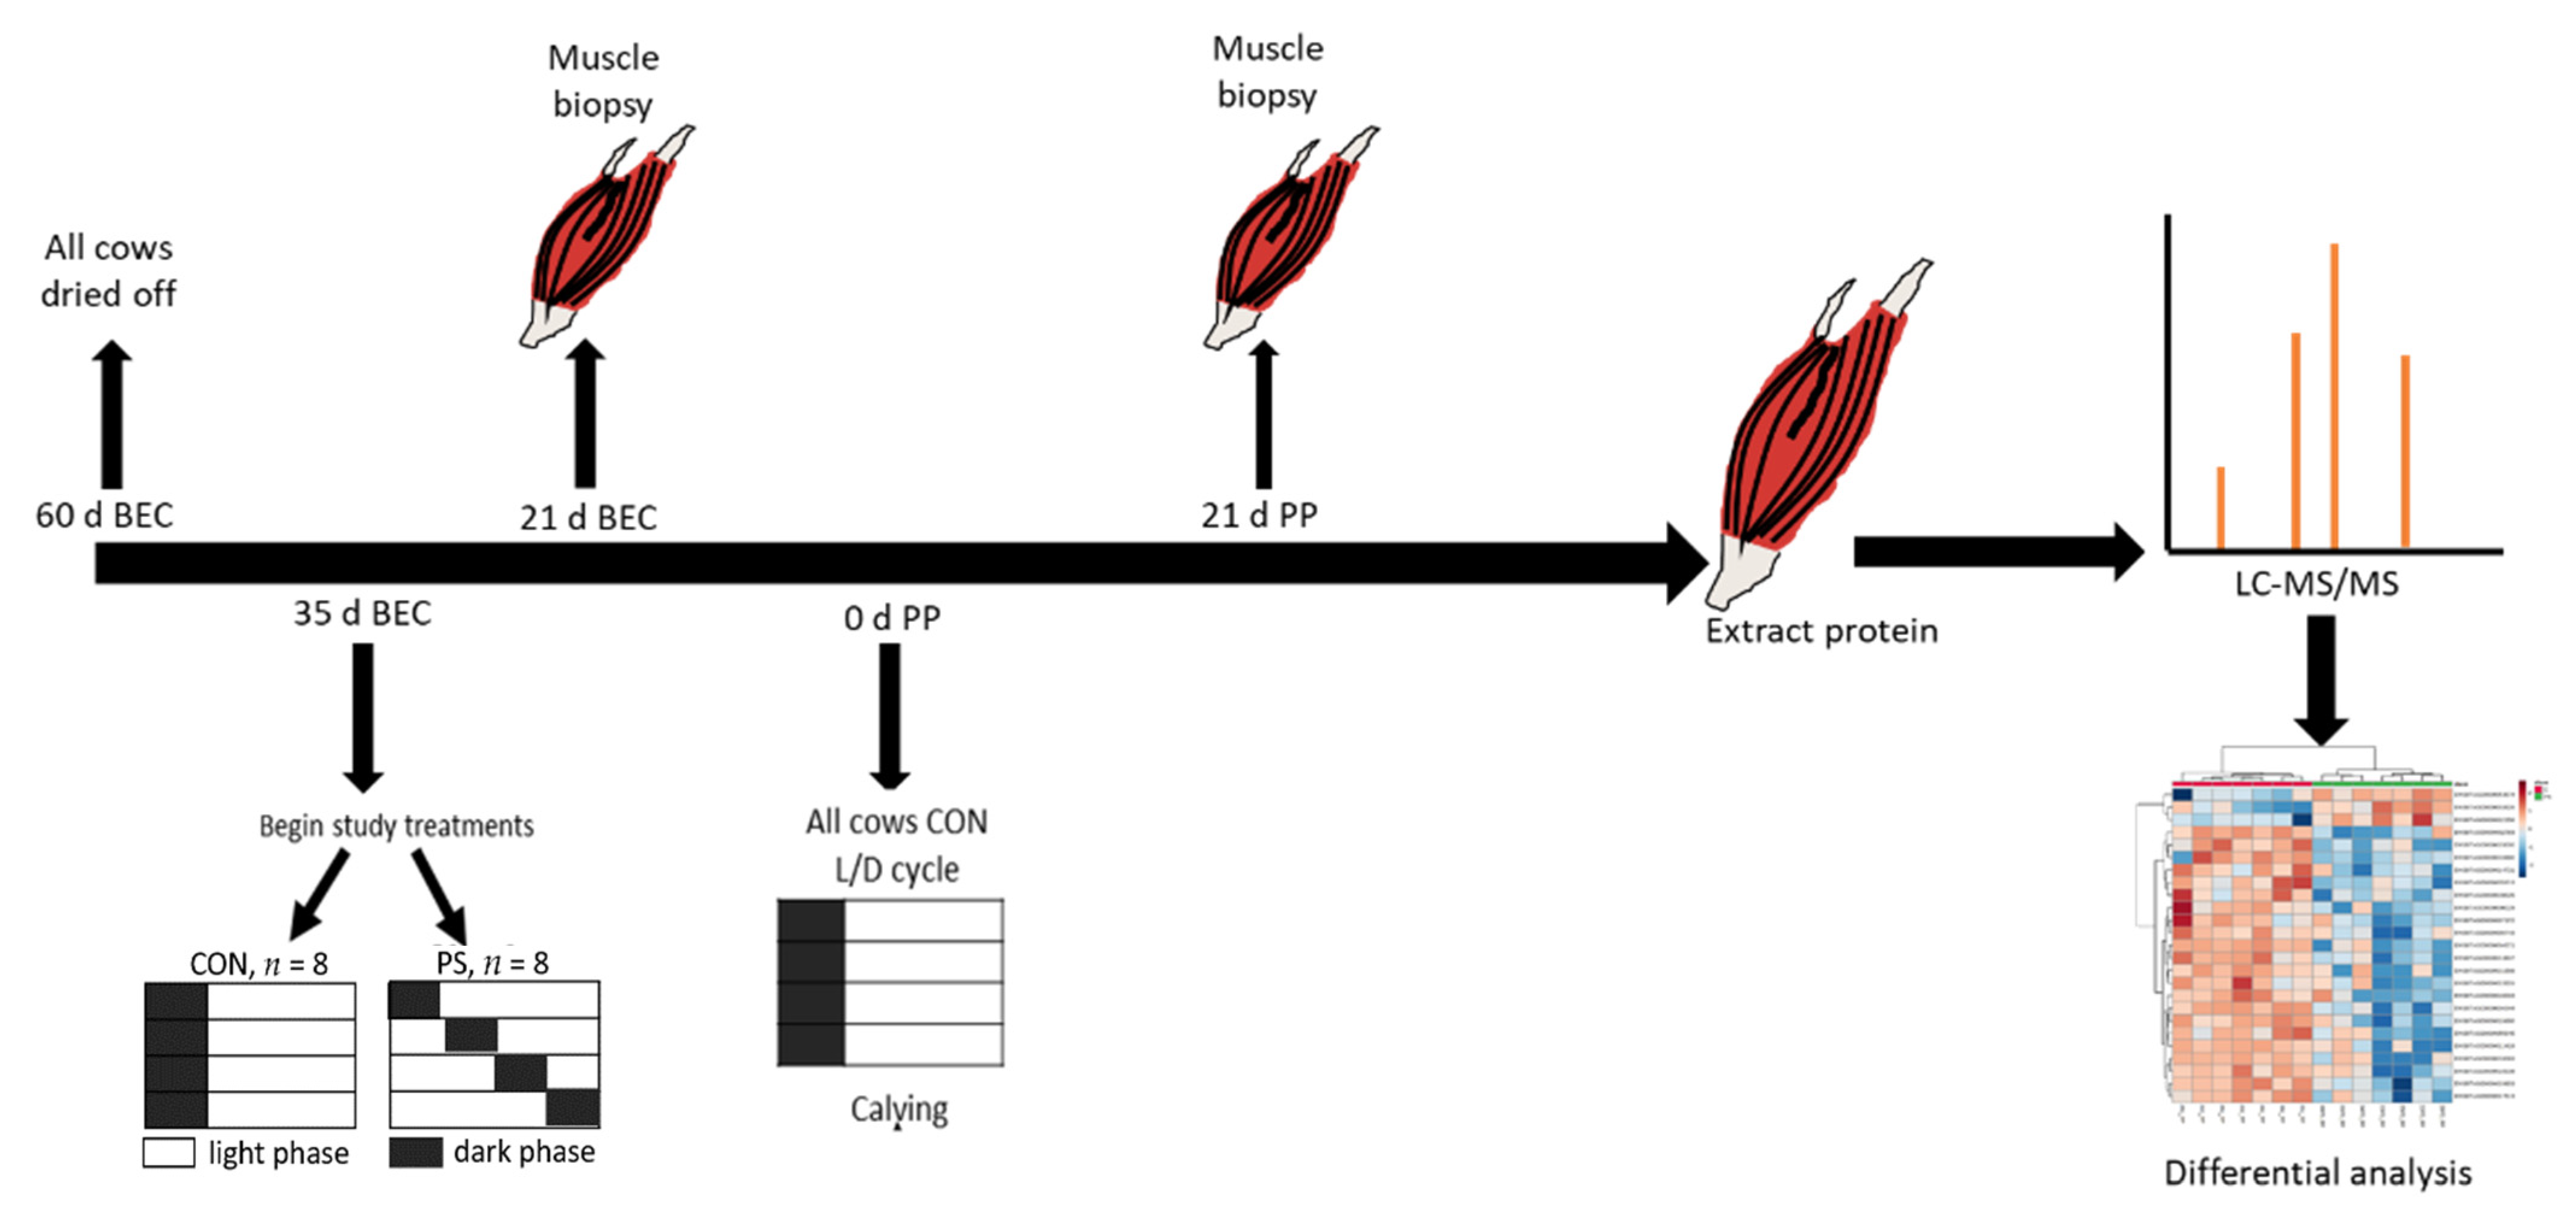
2.1. Animal Management and Experimental Design
2.2. Sample Preparation for Proteomic Analysis
2.3. LC-MS/MS Analysis for Peptide Sequencing
2.4. Data Analysis
3. Results
3.1. Number of Proteins Differentially Abundant
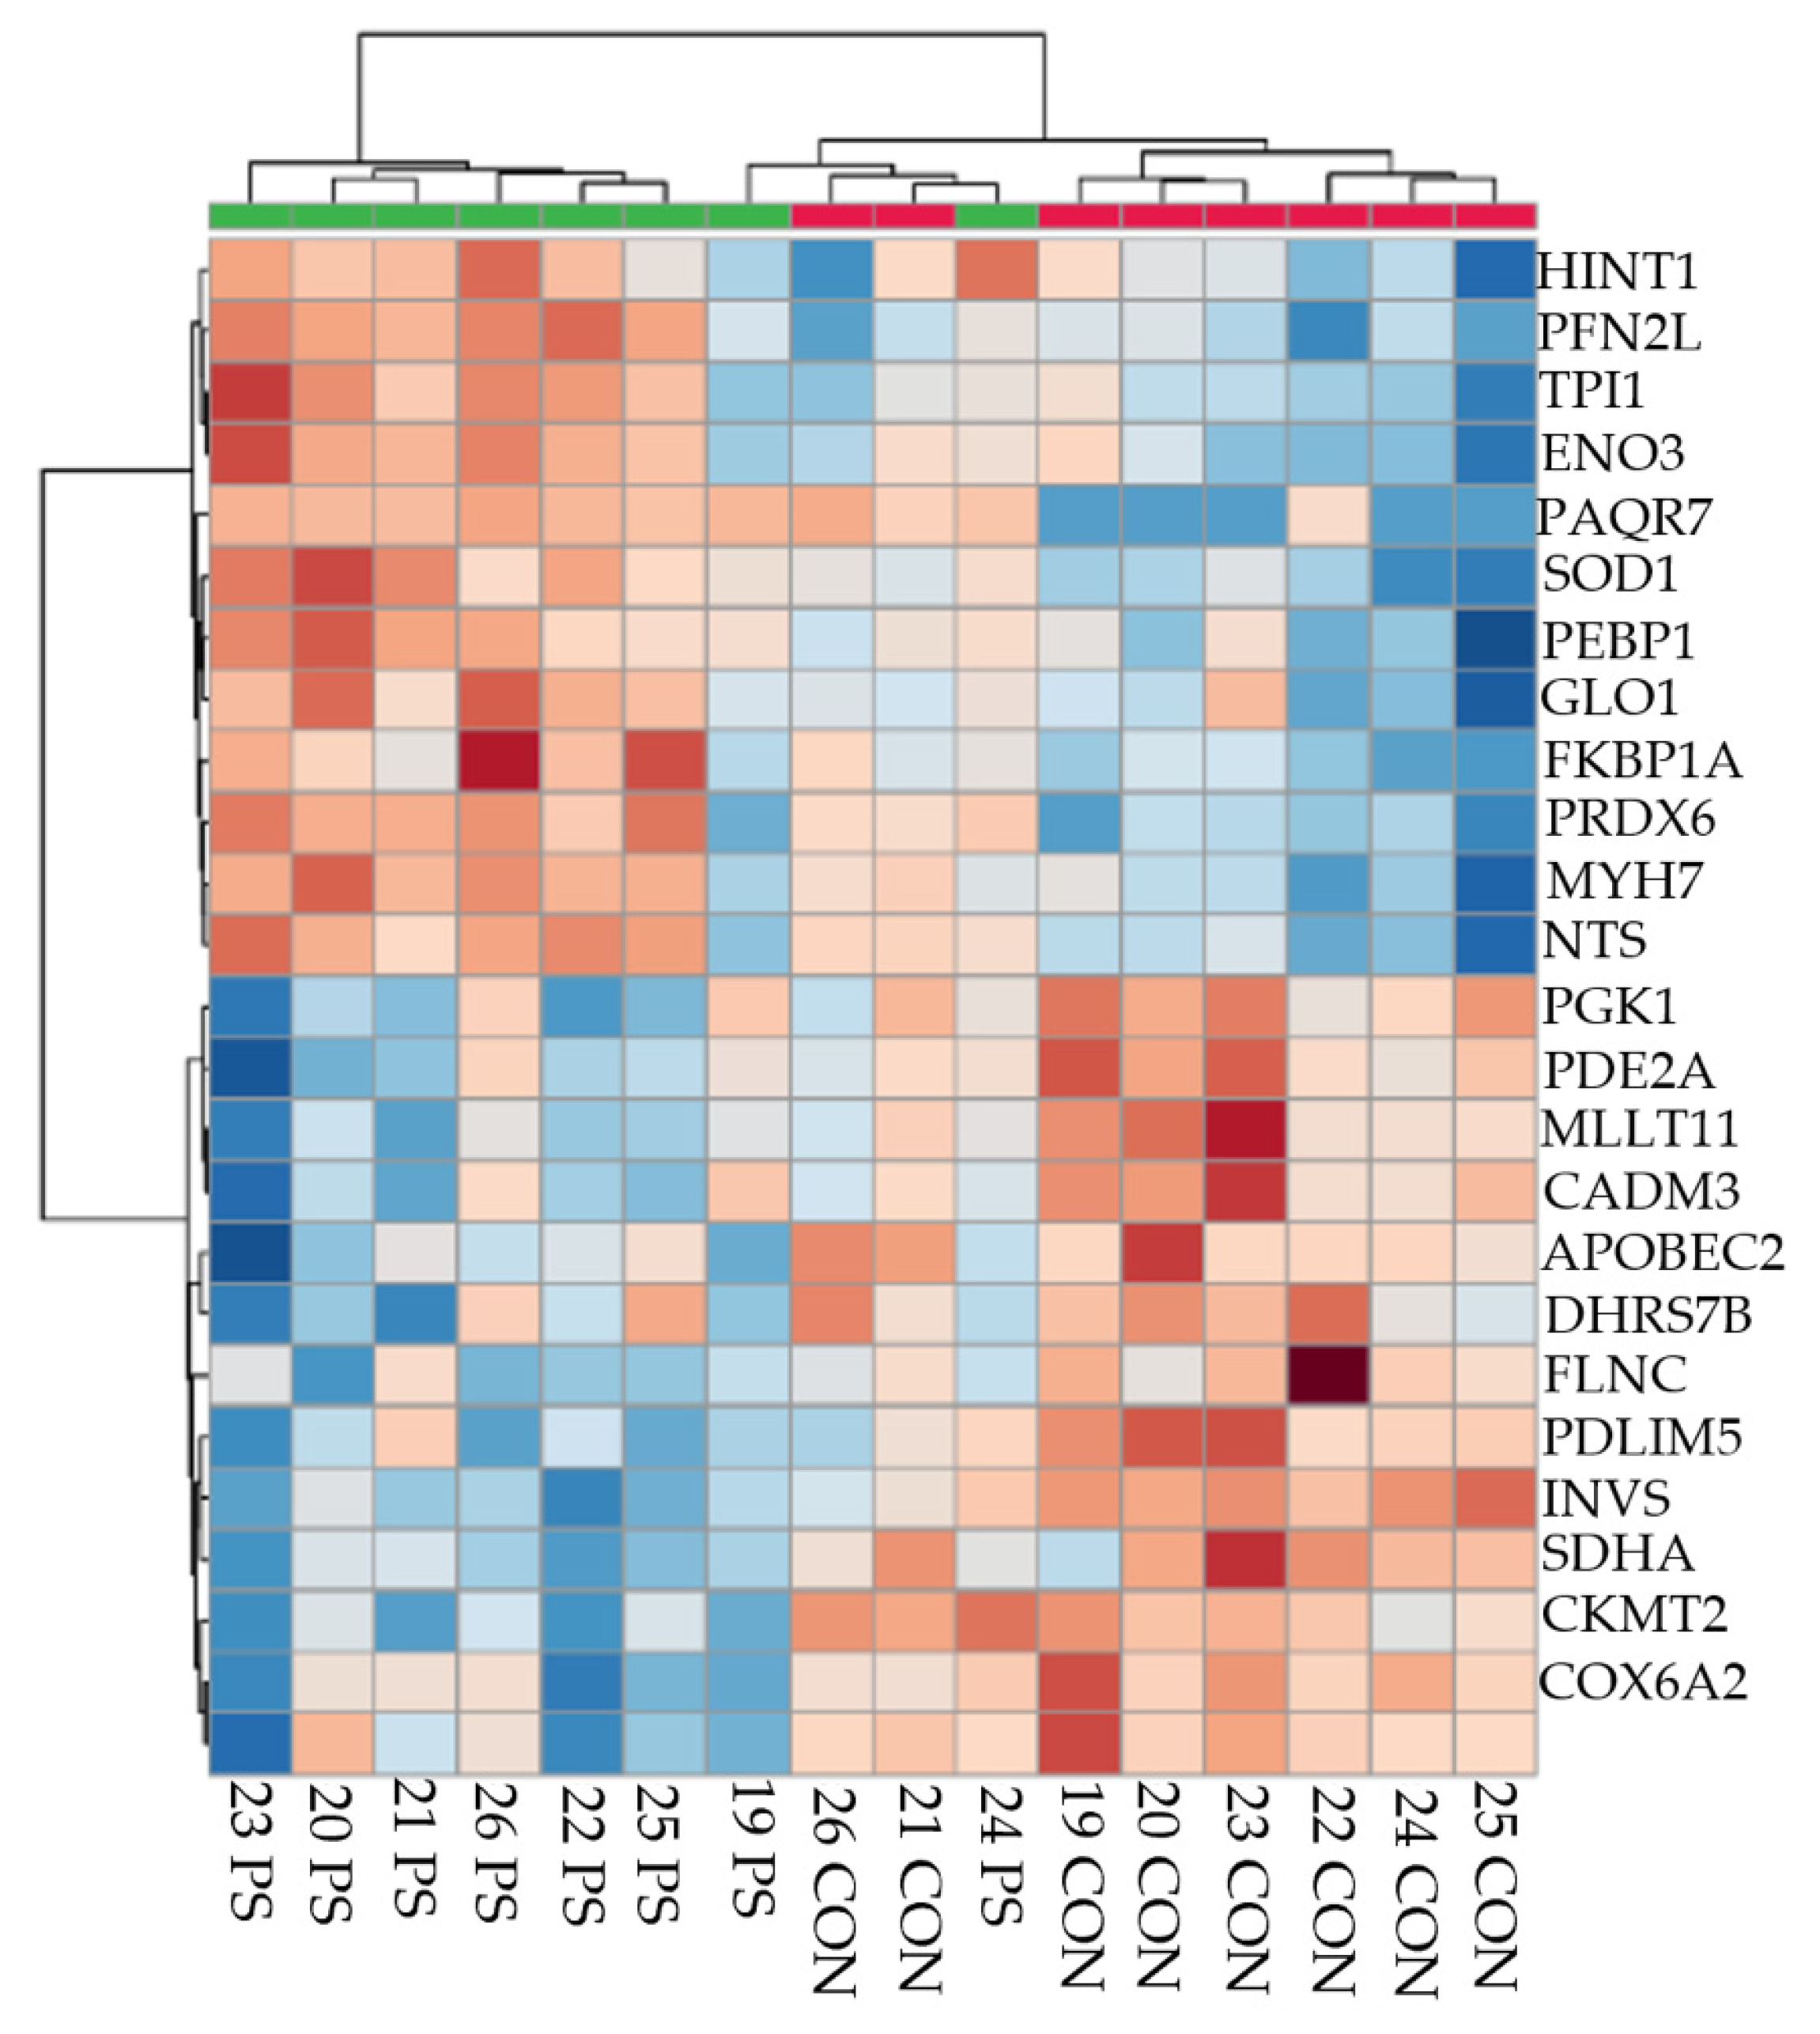
3.2. Treatment Comparisons
3.3. Physiological State Comparisons
4. Discussion
5. Conclusions
Supplementary Materials
Author Contributions
Funding
Institutional Review Board Statement
Data Availability Statement
Acknowledgments
Conflicts of Interest
References
- Bell, A.W. Regulation of organic nutrient metabolism during transition from late pregnancy to early lactation Efficiency at Pasture View project. Artic. J. Anim. Sci. 1995. [Google Scholar] [CrossRef] [PubMed]
- Bauman, D.E.; Bruce Currie, W. Partitioning of Nutrients During Pregnancy and Lactation: A Review of Mechanisms Involving Homeostasis and Homeorhesis. J. Dairy Sci. 1980, 63, 1514–1529. [Google Scholar] [CrossRef]
- Tamminga, S.; Luteijn, P.A.; Meijer, R.G.M. Changes in composition and energy content of liveweight loss of dairy cows with time after parturition. Livest. Prod. Sci. 1997, 52, 31–38. [Google Scholar] [CrossRef]
- Komaragiri, M.V.S.; Erdman, R.A. Factors affecting body tissue mobilization in early lactation dairy cows. 1. Effect of dietary protein on mobilization of body fat and protein. J. Dairy Sci. 1997, 80, 929–937. [Google Scholar] [CrossRef]
- Van der Drift, S.G.A.; Houweling, M.; Schonewille, J.T.; Tielens, A.G.M.; Jorritsma, R. Protein and fat mobilization and associations with serum β-hydroxybutyrate concentrations in dairy cows. J. Dairy Sci. 2012, 95, 4911–4920. [Google Scholar] [CrossRef] [PubMed]
- Kuhla, B.; Nürnberg, G.; Albrecht, D.; Görs, S.; Hammon, H.M.; Metges, C.C. Involvement of skeletal muscle protein, glycogen, and fat metabolism in the adaptation on early lactation of dairy cows. J. Proteome Res. 2011, 10, 4252–4262. [Google Scholar] [CrossRef]
- Mohawk, J.A.; Green, C.B.; Takahashi, J.S. Central and Peripheral Circadian Clocks in Mammals. Annu. Rev. Neurosci. 2012, 35, 445–462. [Google Scholar] [CrossRef] [Green Version]
- Nakagawa, H.; Okumura, N. Review Coordinated regulation of circadian rhythms and homeostasis by the suprachiasmatic nucleus. Proc. Jpn. Acad. Ser. B 2010, 86, 391. [Google Scholar] [CrossRef] [Green Version]
- Harfmann, B.D.; Schroder, E.A.; Esser, K.A. Circadian Rhythms, the Molecular Clock, and Skeletal Muscle. J. Biol. Rhythms 2015, 30, 84–94. [Google Scholar] [CrossRef]
- Gatford, K.L.; Kennaway, D.J.; Liu, H.; Kleemann, D.O.; Kuchel, T.R.; Varcoe, T.J. Simulated shift work disrupts maternal circadian rhythms and metabolism, and increases gestation length in sheep. J. Physiol. 2019, 597, 1889–1904. [Google Scholar] [CrossRef] [Green Version]
- McCabe, C.J.; Suarez-Trujillo, A.; Teeple, K.A.; Casey, T.M.; Boerman, J.P. Chronic prepartum light-dark phase shifts in cattle disrupt circadian clocks, decrease insulin sensitivity and mammary development, and are associated with lower milk yield through 60 days postpartum. J. Dairy Sci. 2021, 104, 2422–2437. [Google Scholar] [CrossRef]
- Greenwood, S.L.; Wright, T.C.; Purdie, N.G.; Doelman, J.; Cant, J.P.; McBride, B.W. Lactation induces upregulation of ubiquitin-mediated proteolytic pathway in skeletal muscle of dairy cows but does not alter hepatic expression. Can. J. Anim. Sci. 2009, 89, 309–313. [Google Scholar] [CrossRef]
- Mann, S.; Abuelo, A.; Nydam, D.V.; Leal Yepes, F.A.; Overton, T.R.; Wakshlag, J.J. Insulin signaling and skeletal muscle atrophy and autophagy in transition dairy cows either overfed energy or fed a controlled energy diet prepartum. J. Comp. Physiol. B 2016, 186, 513–525. [Google Scholar] [CrossRef]
- McCabe, C.J.; Suarez-Trujillo, A.; Casey, T.M.; Boerman, J.P. Relative late gestational muscle and adipose thickness reflect the amount of mobilization of these tissues in periparturient dairy cattle. Animals 2021, 11, 2157. [Google Scholar] [CrossRef]
- Barabas, A.J.; Aryal, U.K.; Gaskill, B.N. Proteome characterization of used nesting material and potential protein sources from group housed male mice, Mus musculus. Sci. Rep. 2019, 9, 17524. [Google Scholar] [CrossRef]
- Bell, A.W.; Burhans, W.S.; Overton, T.R. Protein nutrition in late pregnancy, maternal protein reserves and lactation performance in dairy cows. Proc. Nutr. Soc. 2000, 59, 119–126. [Google Scholar] [CrossRef] [Green Version]
- Komaragiri, M.V.S.; Casper, D.P.; Erdman, R.A. Factors affecting body tissue mobilization in early lactation dairy cows. 2. Effect of dietary fat on mobilization of body fat and protein. J. Dairy Sci. 1998, 81, 169–175. [Google Scholar] [CrossRef]
- De la Fuente, I.M.; Corté, J.M.; Valero, E.; Desroches, M.; Rodrigues, S.; Malaina, I.; Martínez, L. On the Dynamics of the Adenylate Energy System: Homeorhesis vs. Homeostasis. PLoS ONE 2014, 9, e108676. [Google Scholar] [CrossRef] [Green Version]
- Shennan, D.B. Mammary gland membrane transport systems. J. Mammary Gland Biol. Neoplasia 1998, 3, 247–258. [Google Scholar] [CrossRef]
- Lemor, A.; Hosseini, A.; Sauerwein, H.; Mielenz, M. Transition period-related changes in the abundance of the mRNAs of adiponectin and its receptors, of visfatin, and of fatty acid binding receptors in adipose tissue of high-yielding dairy cows. Domest. Anim. Endocrinol. 2009, 37, 37–44. [Google Scholar] [CrossRef]
- Bhatti, J.S.; Bhatti, G.K.; Reddy, P.H. Mitochondrial dysfunction and oxidative stress in metabolic disorders—A step towards mitochondria based therapeutic strategies. Biochim. Biophys. Acta Mol. Basis Dis. 2017, 1863, 1066–1077. [Google Scholar] [CrossRef]
- Sordillo, L.M.; Raphael, W. Significance of metabolic stress, lipid mobilization, and inflammation on transition cow disorders. Vet. Clin. N. Am. Food Anim. Pract. 2013, 29, 267–278. [Google Scholar] [CrossRef]
- Wilking, M.; Ndiaye, M.; Mukhtar, H.; Ahmad, N. Circadian rhythm connections to oxidative stress: Implications for human health. Antioxid. Redox Signal. 2013, 19, 192–208. [Google Scholar] [CrossRef] [Green Version]
- Veres-Székely, A.; Bernáth, M.; Pap, D.; Rokonay, R.; Szebeni, B.; Takács, I.M.; Lippai, R.; Cseh, Á.; Szabó, A.J.; Vannay, Á. PARK7 Diminishes Oxidative Stress-Induced Mucosal Damage in Celiac Disease. Oxid. Med. Cell. Longev. 2020, 2020. [Google Scholar] [CrossRef]
- Seyed Almoosavi, S.M.M.; Ghoorchi, T.; Naserian, A.A.; Khanaki, H.; Drackley, J.K.; Ghaffari, M.H. Effects of late-gestation heat stress independent of reduced feed intake on colostrum, metabolism at calving, and milk yield in early lactation of dairy cows. J. Dairy Sci. 2021, 104, 1744–1758. [Google Scholar] [CrossRef]
- Pires, J.A.A.; Delavaud, C.; Faulconnier, Y.; Pomiès, D.; Chilliard, Y. Effects of body condition score at calving on indicators of fat and protein mobilization of periparturient Holstein-Friesian cows. J. Dairy Sci. 2013, 96, 6423–6439. [Google Scholar] [CrossRef]
- Ghaffari, M.H.; Schuh, K.; Dusel, G.; Frieten, D.; Koch, C.; Prehn, C.; Adamski, J.; Sauerwein, H.; Sadri, H. Mammalian target of rapamycin signaling and ubiquitin-proteasome–related gene expression in skeletal muscle of dairy cows with high or normal body condition score around calving. J. Dairy Sci. 2019, 102, 11544–11560. [Google Scholar] [CrossRef]
- Desvergne, A.; Friguet, B. Circadian Rhythms and Proteostasis in Aging. In Circadian Rhythms and their Impact on Aging; Springer: Cham, Switzerland, 2017; Volume 7, pp. 163–191. [Google Scholar]
- Guo, D.; Zhu, Y.; Wang, H.; Wang, G.; Wang, C.; Ren, H. E3 ubiquitin ligase HRD1 modulates the circadian clock through regulation of BMAL1 stability. Exp. Ther. Med. 2020, 2639–2648. [Google Scholar] [CrossRef]
- Kondratov, R.V.; Kondratova, A.A.; Gorbacheva, V.Y.; Vykhovanets, O.V.; Antoch, M.P. Early aging and age-related pathologies in mice deficient in BMAL1, the core component of the circadian clock. Genes Dev. 2006, 20, 1868–1873. [Google Scholar] [CrossRef] [Green Version]
- Caster, S.Z.; Castillo, K.; Sachs, M.S.; Bell-Pedersen, D. Circadian clock regulation of mRNA translation through eukaryotic elongation factor eEF-2. Proc. Natl. Acad. Sci. USA 2016, 113, 9605–9610. [Google Scholar] [CrossRef] [Green Version]
- Parnell, A.A.; De Nobrega, A.K.; Lyons, L.C. Translating around the clock: Multi-level regulation of post-transcriptional processes by the circadian clock. Cell. Signal. 2021, 80, 109904. [Google Scholar] [CrossRef] [PubMed]
- Algers, B.; Bertoni, G.; Broom, D.; Hartung, J.; Lidfors, L.; Metz, J.; Munksgaard, L.; Nunes Pina, T.; Oltenacu, P.; Rehage, J.; et al. Scientific report on the effects of farming systems on dairy cow welfare and disease. EFSA J. 2009, 7, 1–38. [Google Scholar] [CrossRef]
- Plaut, K.; Casey, T. Does the circadian system regulate lactation? Animal 2012, 6, 394–402. [Google Scholar] [CrossRef] [PubMed] [Green Version]


| Proteins Differentially Abundant between CON and PS Cows at the Prepartum and Postpartum Timepoints | |||||||
|---|---|---|---|---|---|---|---|
| Proteins per Comparison | Lower Abundance in PS | Greater Abundance in PS | |||||
| p-Value Cutoff | - | p < 0.01 | p < 0.05 | p < 0.10 | p < 0.01 | p < 0.05 | p < 0.10 |
| 3 weeks BEC | 470 | 13 | 29 | 42 | 13 | 52 | 74 |
| 3 weeks PP | 312 | 3 | 3 | 8 | 22 | 72 | 113 |
| Proteins Differentially Abundant between Prepartum and Postpartum Timepoints within Treatments | |||||||
| Proteins per Comparison | Lower Abundance in PP | Greater Abundance in PP | |||||
| p-Value Cutoff | - | p < 0.01 | p < 0.05 | p < 0.10 | p < 0.01 | p < 0.05 | p < 0.10 |
| CON treatment | 462 | 10 | 26 | 42 | 25 | 64 | 92 |
| PS treatment | 315 | 6 | 12 | 19 | 50 | 103 | 126 |
| Lower Abundance in PS versus CON at 3 weeks BEC | ||||
|---|---|---|---|---|
| Category | Number | Percent | p-Value | Proteins |
| Proteasome | 4 | 10.26 | 1.45 × 10⁻⁴ | PSMA1, PSMA2, PSMA3, PSMA7 |
| Translation elongation factor activity | 4 | 10.26 | 1.51× 10⁻⁵ | EIF5A, EEF1D, EEF2, EEF1A2 |
| Glycolysis | 3 | 7.69 | 0.0013 | TPI1, PGK1, ENO3 |
| Greater Abundance in PS versus CON at 3 weeks BEC | ||||
| Category | Number | Percent | p-Value | Proteins |
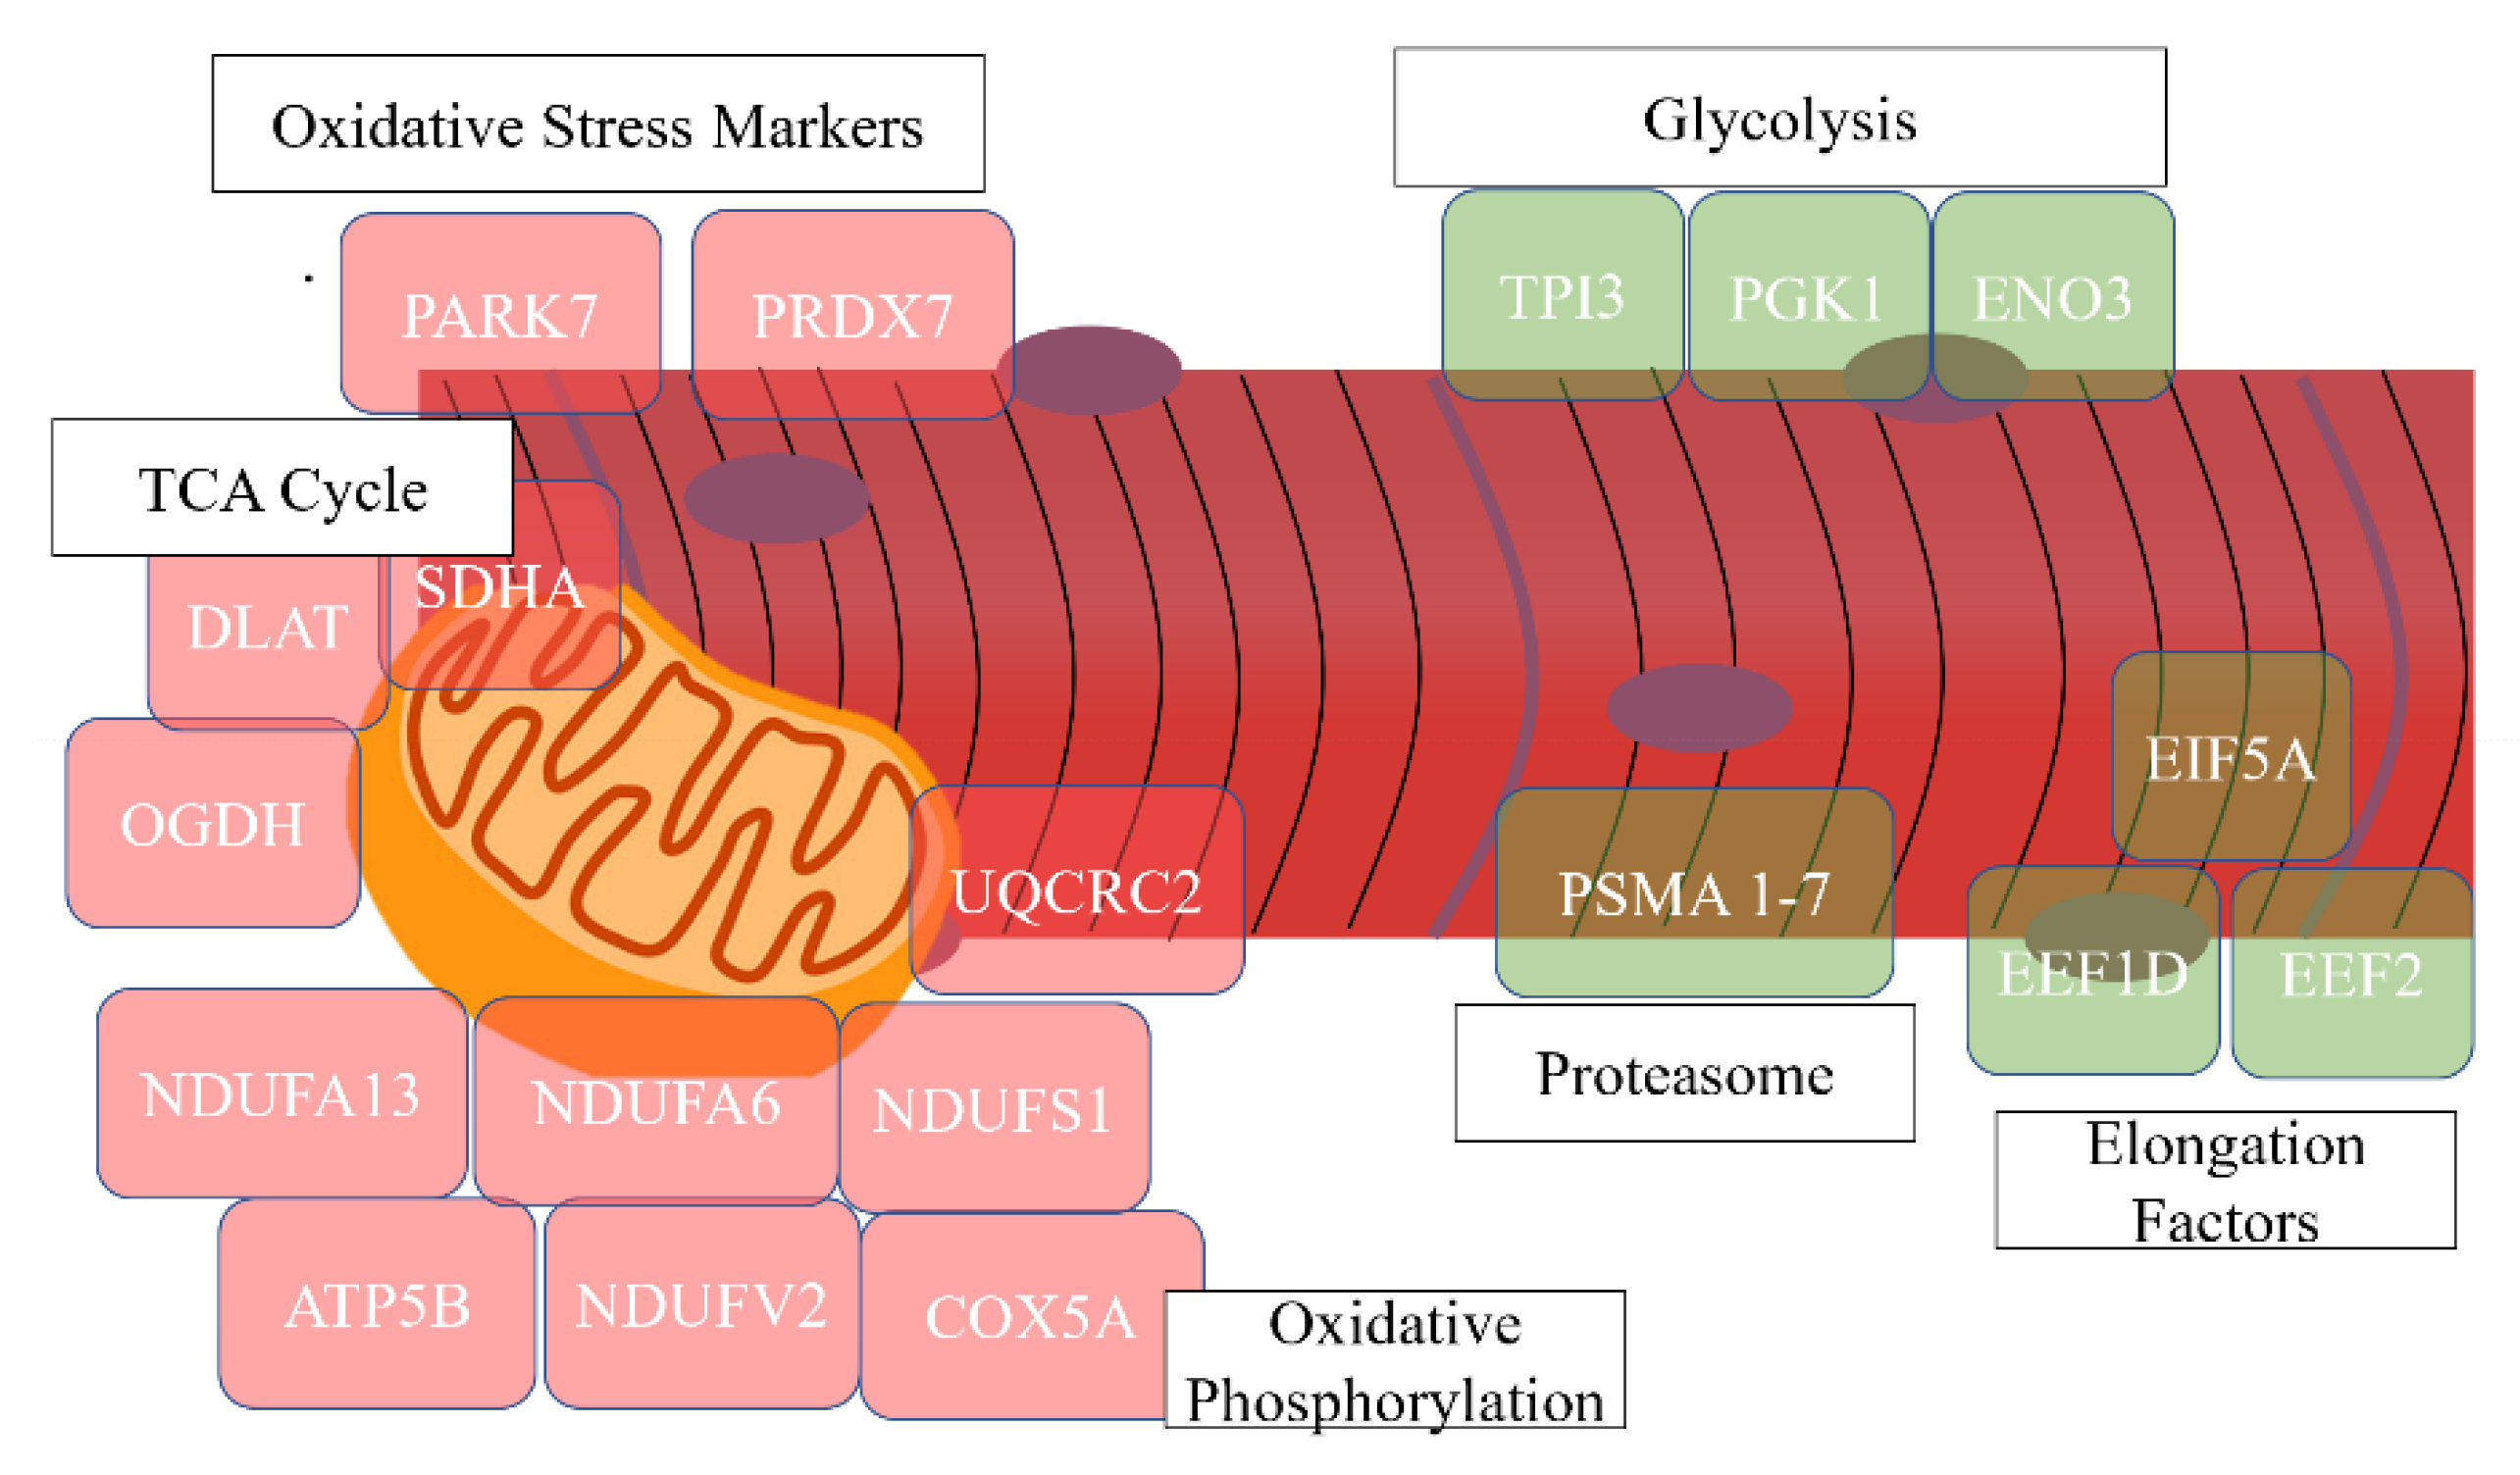
| Oxidative phosphorylation | 14 | 20.00 | 1.97 × 10⁻¹³ | ATP5B, NDUFV2, NDUFA9, SDHA, NDUFS1, UQCRFS1, UQCRC2, NDUFA13, NDUFA6, COX5A, ATP5O, COX5B, COX6A2, CYC1 |
| Skeletal muscle contraction | 5 | 7.14 | 8.92 × 10⁻⁷ | TNNT1, TNNI1, MYH7, TNNC1, TNNI2 |
| Actin-binding | 9 | 12.86 | 4.21 × 10⁻⁸ | MYH4, TPM2, ACTN4, MYH7, ACTN1, MYH2, TPM3, FLNC, ACTN2 |
| Tricarboxylic acid cycle | 3 | 4.29 | 0.0062 | SDHA, OGDH, DLAT |
| Lower Abundance in PS versus CON at 3 weeks PP | ||||
| Category | Number | Percent | p-Value | Proteins |
| None | ||||
| Greater abundance in PS at 3 weeks PP | ||||
| Category | Number | Percent | p-Value | Proteins |
| Tricarboxylic acid cycle | 11 | 10.68 | 4.97 × 10⁻¹⁶ | MDH1, SUCLG1, CS, PDHB, ACO2, SDHB, SDHA, FH, OGDH, DLST, PDHA1 |
| Glycolysis/gluconeogenesis | 13 | 12.62 | 4.71 × 10⁻¹³ | PGAM2, GAPDH, LDHA, PDHB, ALDH2, GPI, PFKM, TPI1, PGK1, PKM, LDHB, FBP2, PDHA1 |
| Oxidative phosphorylation | 11 | 10.68 | 8.00 × 10⁻⁷ | NDUFS3, ATP5B, ATP5J2, ATP5H, NDUFA9, NDUFS1, SDHB, SDHA, ATP5I, ATP5J, ATP5F1 |
| Fatty acid beta-oxidation | 4 | 3.88 | 0.0012 | ACAA2, ACAT1, HADHB, HADHA |
| Nucleotide phosphate-binding region:NAD | 7 | 6.80 | 1.83 × 10⁻⁵ | MDH1, GAPDH, LDHA, NNT, ALDH2, LDHB, ALDH1A1 |
| Electron transport | 6 | 5.83 | 1.44 × 10⁻⁴ | NDUFS3, NDUFA9, ETFA, NDUFS1, SDHB, SDHA |
| Heat shock protein 70 | 3 | 2.91 | 0.0030 | HSPA8, HSPA9, HSPA1A |
| Proteins that Decreased in Abundance between 3 weeks BEC and 3 weeks PP in CON Cows | ||||
| Category | Number | Percent | p-Value | Proteins |
| Nucleosome core | 3 | 8.11 | 0.015 | H2AFV, HIST2H2BE, H3F3A |
| Proteins that Increased in Abundance between 3 weeks BEC and 3 weeks PP in CON Cows | ||||
| Category | Number | Percent | p-Value | Proteins |
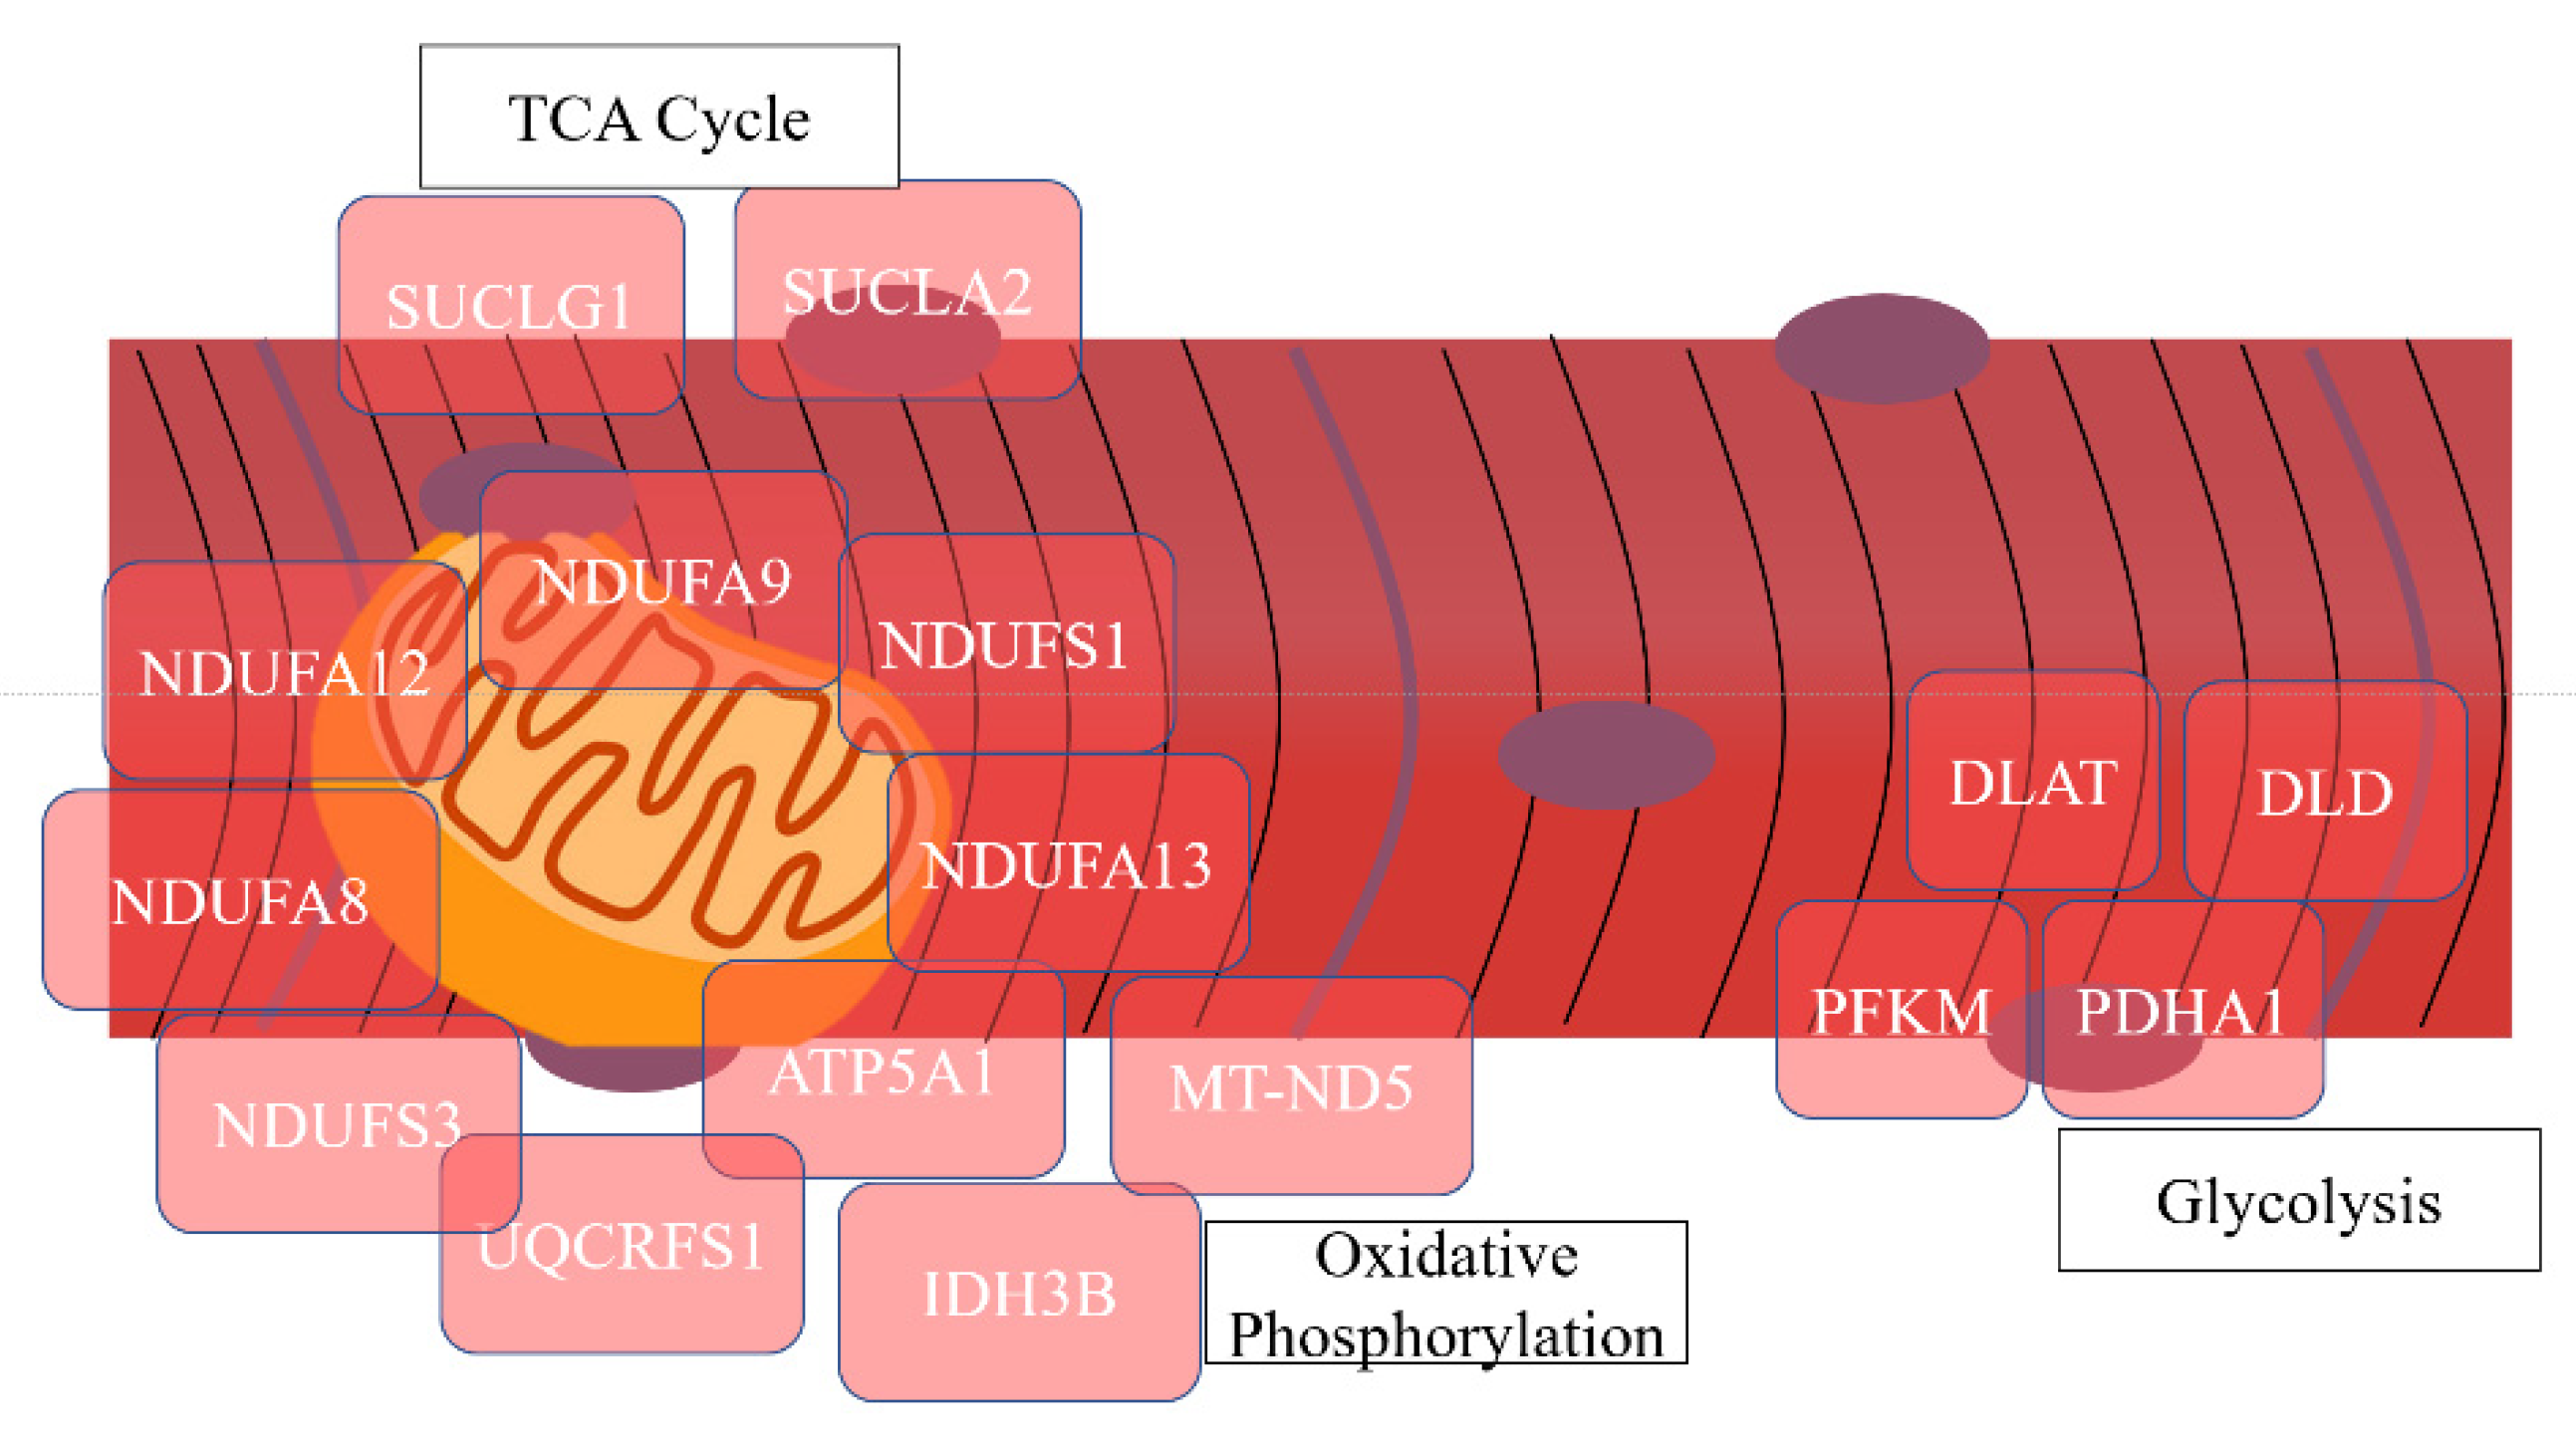
| Oxidative phosphorylation | 23 | 26.14 | 5.76 × 10⁻²² | NDUFA12, NDUFA9, NDUFS1, NDUFA7, NDUFV1, UQCRFS1, ATP5F1, NDUFA8, NDUFB10, ND5, NDUFA5, UQCRC2, NDUFS3, NDUFA13, NDUFA6, COX4I1, COX5A, ATP5O, ATP5A1, COX5B, COX6A2, CYC1 |
| NAD | 11 | 12.50 | 3.58 × 10⁻¹⁰ | NDUFS3, NNT, IDH3B, VDAC2, NDUFS1, NDUFV1, GPD1, IDH3A, DLD, MT-ND5, VDAC1 |
| Mitochondrial respiratory chain complex IV | 5 | 5.68 | 7.42 × 10⁻⁷ | NDUFA4, COX5A, COX4I1, COX5B, COX6A2 |
| Tricarboxylic acid cycle | 8 | 9.09 | 7.68 × 10⁻¹² | SUCLG1, CS, IDH3B, SUCLA2, IDH2, IDH3A, PDHA1, DLAT |
| Glycolysis/gluconeogenesis | 4 | 4.55 | 0.020 | DLD, PFKM, PDHA1, DLAT |
| ATP-binding | 13 | 14.77 | 7.49 × 10⁻⁴ | OBSCN, MYLK2, MYH4, PHKG1, HSPA9, PFKM, AP2A1, COQ8A, CKMT2, SUCLA2, VCP, MYH2, ATP5A1 |
| Proteins that Decreased in Abundance between 3 weeks BEC and 3 weeks PP in PS Cows | ||||
| Category | Number | Percent | p-Value | Proteins |
| None | ||||
| Proteins that Increased in Abundance between 3 weeks BEC and 3 weeks PP in CON Cows | ||||
| Category | Number | Percent | p-Value | Proteins |
| Glycolysis/gluconeogenesis | 16 | 13.22 | 1.18 × 10⁻¹⁵ | PGAM2, GAPDH, LDHA, PDHB, ALDH2, ALDOA, ENO3, GPI, PFKM, PGM1, TPI1, PGK1, PKM, LDHB, FBP2, PDHA1 |
| Tricarboxylic acid cycle | 9 | 7.44 | 8.65 × 10⁻¹³ | SUCLG1, MDH2, CS, PDHB, ACO2, SUCLA2, SDHB, DLST, PDHA1 |
| Oxidative phosphorylation | 21 | 17.36 | 5.53 × 10⁻¹⁶ | NDUFA4, ATP5B, ATP5J2, ATP5H, NDUFA9, NDUFS1, SDHB, NDUFV1, ATP5F1, NDUFA10, NDUFB10, NDUFA5, NDUFS2, NDUFS3, UQCRB, NDUFA6, UQCRC1, COX4I1, COX5A, ATP5I, ATP5J |
| NAD | 14 | 11.57 | 1.45 × 10⁻¹⁶ | HSD17B10, GAPDH, LDHA, NNT, MDH2, VDAC2, DHRS7B, ALDH2, NDUFS1, NDUFV1, NDUFS2, NDUFS3, GPD1, LDHB |
| Mitochondrial proton-transporting ATP synthase complex | 4 | 3.31 | 3.18 × 10⁻⁵ | ATP5H, ATP5I, ATP5J, ATP5F1 |
| Fatty acid degradation | 7 | 5.79 | 1.28 × 10⁻⁵ | HADH, ACAT1, ACADVL, ACSL1, HADHB, HADHA |
Publisher’s Note: MDPI stays neutral with regard to jurisdictional claims in published maps and institutional affiliations. |
© 2021 by the authors. Licensee MDPI, Basel, Switzerland. This article is an open access article distributed under the terms and conditions of the Creative Commons Attribution (CC BY) license (https://creativecommons.org/licenses/by/4.0/).
Share and Cite
McCabe, C.J.; Aryal, U.K.; Casey, T.; Boerman, J. Impact of Exposure to Chronic Light–Dark Phase Shifting Circadian Rhythm Disruption on Muscle Proteome in Periparturient Dairy Cows. Proteomes 2021, 9, 35. https://0-doi-org.brum.beds.ac.uk/10.3390/proteomes9030035
McCabe CJ, Aryal UK, Casey T, Boerman J. Impact of Exposure to Chronic Light–Dark Phase Shifting Circadian Rhythm Disruption on Muscle Proteome in Periparturient Dairy Cows. Proteomes. 2021; 9(3):35. https://0-doi-org.brum.beds.ac.uk/10.3390/proteomes9030035
Chicago/Turabian StyleMcCabe, Conor John, Uma K. Aryal, Theresa Casey, and Jacquelyn Boerman. 2021. "Impact of Exposure to Chronic Light–Dark Phase Shifting Circadian Rhythm Disruption on Muscle Proteome in Periparturient Dairy Cows" Proteomes 9, no. 3: 35. https://0-doi-org.brum.beds.ac.uk/10.3390/proteomes9030035