1. Introduction
Dengue fever is considered the most rapidly transmitted arboviral disease in recent years [
1]. It is mainly transmitted by two species of female mosquitoes, Aedes aegypti and Aedes albopictus [
2]. Four distinctive virus serotypes can cause dengue fever: DEN-1, DEN-2, DEN-3, and DEN-4 [
3]. Originally, the dengue virus was only recurrent in tropical and sub-tropical regions, but today it can be encountered in 128 countries, including the nations in the European and North American continents, both of which are predominantly non-tropical regions. Recent studies estimate that 3.9 billion people are at risk of being infected every year. It has also been reported that 390 million dengue infections occur every year, resulting in 500,000 hospitalizations and 20,000 deaths due to severe complications [
4]. Besides adopting conventional preventive measurements to combat the vector mosquitoes and surveillance practices [
5], the World Health Organization also recommends the application of vaccines, especially in areas that are described as highly endemic [
3].
The economic burden caused by dengue fever epidemics has considerably impacted many countries. In the Americas, the aggregate annual cost, combining ambulatory and hospitalized cases, reached US
$ 2.1 billion during the period 2000–2007 [
6]. In order to counteract these losses, a more effective allocation of patients and medical resources is required along with well-established health policy priorities and the implementation of disease control technologies [
7].
In recent years, many optimization methods have been implemented to solve problems involving the allocation of patients and medical resources, such as scheduling of operation rooms, allocation of emergency patients and allocation of healthcare facilities. Burdett et al. [
8] discussed a mixed linear programming approach to assess hospital resources and capacity. Their method aimed to help hospitals with diverse capacity planning and resource allocation activities. Zhou et al. [
9] presented another multi-objective model that focused on the allocation of hospital wards considering revenue and equity factors. The objective of the stochastic programming model was to maximize both factors considered in the model. For operating room scheduling, Molina-Pariente et al. [
10] presented a mixed integer linear programming model that solved problems integrating operating room planning and scheduling with surgical teams based on the surgeons’ experience and skills. Beroule et al. [
11] introduced a series of meta-heuristic methods to resolve a more subject-specific operating room scheduling that dealt with medical device sterilization.
A more extensive study conducted by Steiner et al. [
12] covered a case in Parana, Brazil that aimed to improve the existing healthcare system in the region. The multi-objective approach was set to maximize population homogeneity in designated microregions within the state, to maximize the variety of medical procedures offered in each area, and to minimize the distance travelled by patients between regions. Heshmat et al. [
13] used clustering and mathematical programming to solve the scheduling of appointments in outpatient chemotherapy clinics.
Studies on the management of allocation of emergency medical services have also been conducted. Shahriari et al. [
14] presented a model that minimized the total time of casualties being transferred from an incident spot to a medical facility, considering the uncertainties of the demand points. Anparasan and Lejeune [
15] proposed an integer linear programming model to determine the number, size, and location of treatment facilities, deploy critical medical staff, locate ambulances to triage points, and organize the transportation of severely ill patients. They also developed an algorithmic procedure using hierarchical constraints and valid inequalities to reduce the solution time. Devi et al. [
16] proposed a mixed-integer linear programming model to design the topology of health care facility networks. Their model considers minimizing the total cost of establishing and operating temporary testing laboratories and minimizing the maximum travel time from a patient node to a testing facility. Esra Büyüktahtakın et al. [
17] introduced an epidemics–logistics mixed-integer programming model to determine the optimal amount, timing and location of resources. Their model aims to minimize the total number of infections and fatalities under a limited budget over a multi-period planning horizon. Liu et al. [
18] modified the Esra Büyüktahtakın et al. [
17] model by changing capacity constraint, and then applied it to control the 2009 H1N1 outbreak in China. Liu et al. [
18] formulated the problem as a mixed-integer non-linear programming model and determined when to open the new isolated wards and when to close the unused isolated wards.
Recently, the rapid outbreak of the coronavirus has attracted increasing attentions from researchers to apply mathematical techniques for solving resource allocation problems in healthcare system. Different mathematical models are constructed by [
19,
20,
21,
22,
23,
24,
25] to optimally allocate critical hospital supplies to treat COVID-19 patients. For instances, [
22,
23] considered an optimal allocation of ICU beds (intensive care unit beds) and personal protective equipment, respectively, under the scarcity of available resources. A binary integer optimization model is developed to find the best allocation for ICU beds, considering candidate patients with suspected/confirmed COVID-19 [
22]. Santini [
24] proposed an Integer Programming formulation to maximize the number of tests a country can perform and validated their approach on both real-life data from Italy and synthetic instances. Jordan et al. [
26] provided a comprehensive review of optimization in the context of COVID-19 prediction and control.
Additionally, the Internet of Things (IoT) can create innovative applications in healthcare. IoT-based real-time patient-generated medical data that can be collected from wearable networked sensor-based devices are used to predict and control infectious diseases [
27,
28,
29]. During the COVID-19 pandemic, healthcare providers in the areas where dengue is endemic or who are treating patients with recent travel history to the coronavirus pandemic areas need to consider dengue and COVID-19 in the differential diagnosis of acute febrile illnesses. Several studies [
30,
31,
32] focused on stress-related psychiatric disorders, clinically significant depression, and elevated anxiety symptoms among medical personnel providing care to COVID-19 patients.
The extension of allocation models can be generally classified into long-term, short-term, and medium-term based on the entire scheduling time period considered in the optimization approaches. Currently, the literature concerning medium-term planning allocation models is more limited. Medium-term planning models cope with situations that take longer than a few days, but less than years. Epidemics and pandemics fall into this category. There are many diseases that can cause these events, for examples, influenza, dengue fever, chikungunya, and yellow fever. Patient and resource allocation among medical facilities during a pandemic influenza outbreak was investigated by Sun et al. [
33].
Epidemic and pandemic events, topics treated in this paper, have become more recurrent in the past two centuries. An increase in global population, surpassing 7 billion inhabitants, and the fast speed of globalization have contributed to the increase in infectious diseases, not to mention the effect of natural disasters, human conflicts, and high levels of poverty in some areas. Fortunately, advances in technology and science have forged a new path for the analysis and response toward these events. Today, in the 21st century, the systematical combination of modern epidemiology, new field-based rapid diagnostic tools, vaccinations, clinical care standards, communication, and real-time training allow to provide a more efficient response to the reappearance of old threats, as well as the introduction of new ones [
34].
Paraguay is a high-endemicity country for the dengue disease. Since 2009, dengue fever has emerged as a critical health problem in Paraguay with periodic significant epidemic outbreaks [
35,
36]. Due to the dengue epidemic, which has a significantly negative impact on population health and economic development in Paraguay, it is necessary to develop appropriate mechanisms of response to face the dengue outbreak. One of the major issues is how to allocate infected patients in different hospitals to receive appropriate care. Although mathematical modelling is an effective technique for resource allocation, few studies in the literature focused on patient allocation problem in a dengue outbreak in Paraguay. Therefore, this study intends to apply mathematical modelling for solving this problem in Paraguay that have not been intensively treated in the past. The aim of this study is to provide an effective mechanism for the management of medical facilities and resources during a dengue fever epidemic. The models intended to help decision makers to order and distribute additional resources for the most appropriate areas, optimizing the occupancy of hospitals, the usage of medical resources, and the working hours of medical personnel. By combining the factors mentioned above, three models were utilized to analyze a dengue fever epidemic.
The rest of the paper is organized as follows.
Section 2 describes the case of a privately run health insurance cooperative in Ciudad del Este, Paraguay and defines the three mathematical models used in this paper. In
Section 3, an analysis of the empirical results is summarized to present the most relevant findings of this paper.
Section 4 presents a discussion and clarifies the practical contributions of this paper. The final section,
Section 5, contains the conclusions and some important remarks.
2. Materials and Methods
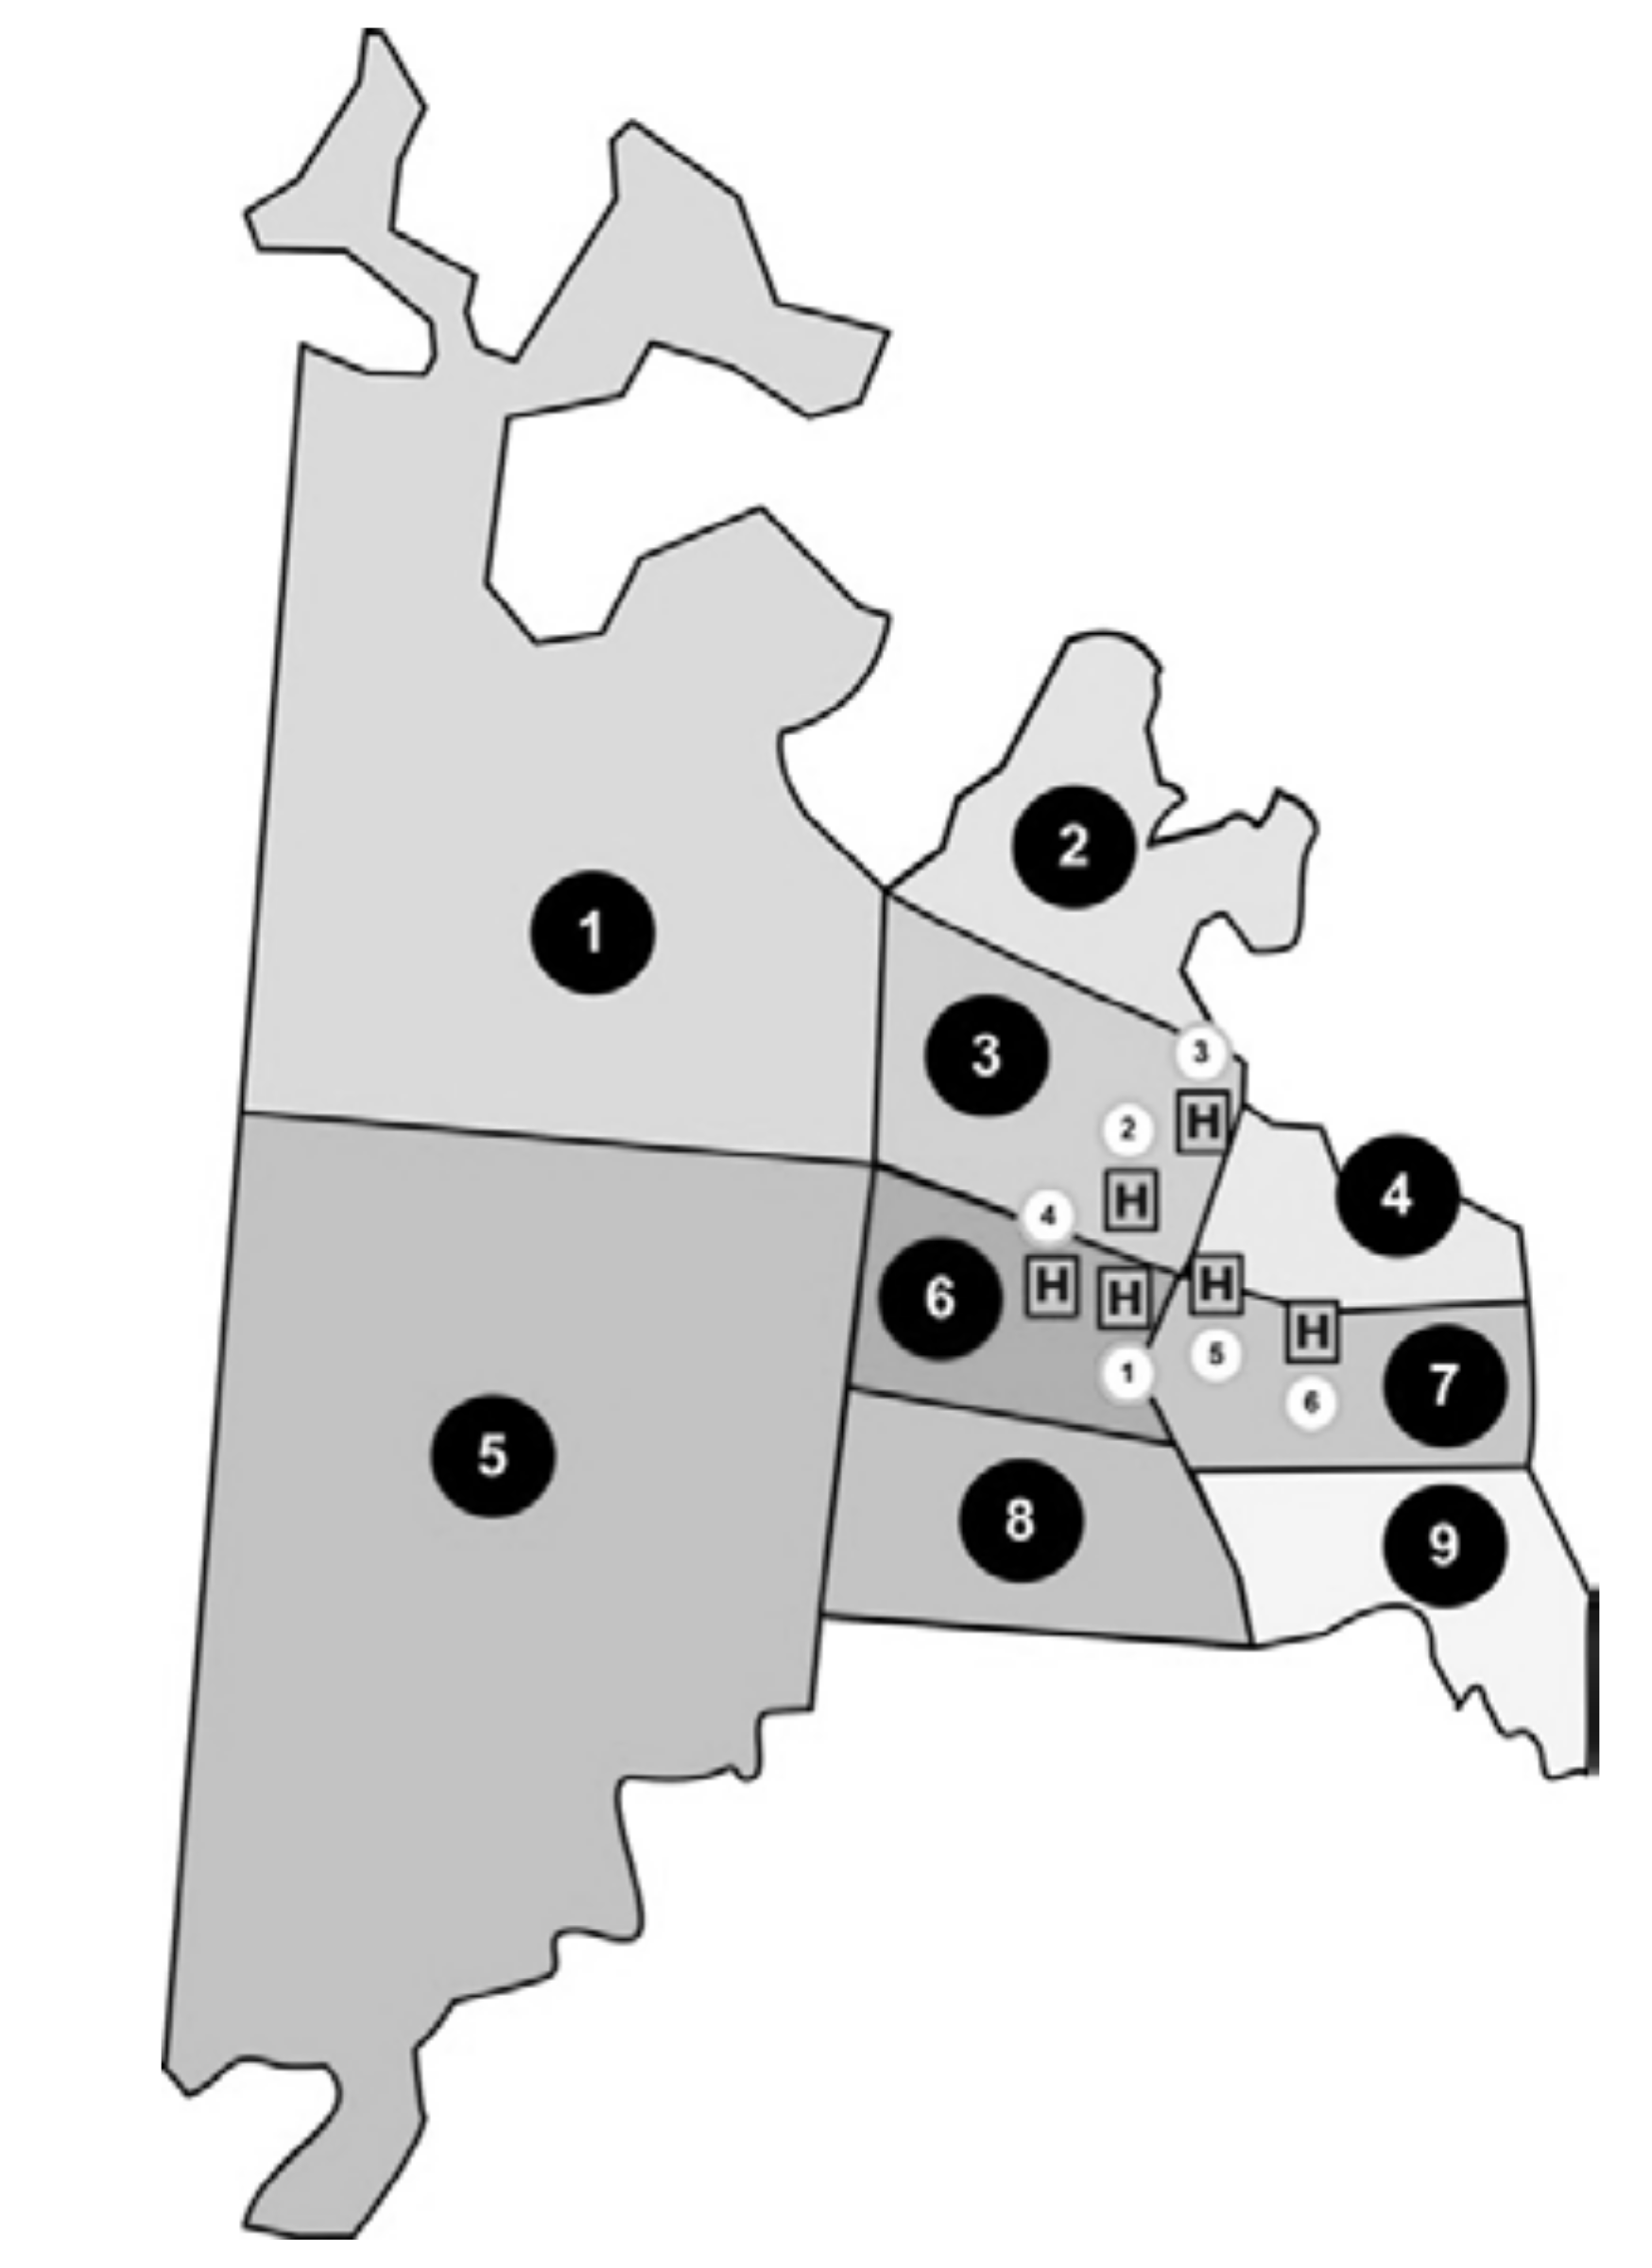
Study area. Ciudad del Este is a city located on the east side of the Paraguay Oriental Region. The empirical study in this paper was performed using data provided by a privately run health care cooperative in Ciudad del Este. A total of six hospitals located within the territory of Ciudad del Este are considered in this study. In 2018, the estimated population was 299,255 inhabitants [
37]. The total area of Ciudad del Este can be divided into nine sections based on an estimated number of inhabitants per section.
Figure 1 indicates the nine population areas along with the location of six hospitals that provided medical coverage to approximately 37,000 people under the health care cooperative. The distances between the polygon centroids of the nine population areas and six hospitals are shown in
Table 1.
The numbers of non-ICU beds, ICU beds, and doctors and nurses available during epidemics in the six hospitals are listed in
Table 2. Nurses took rounds of 12 h a day, while doctors’ rounds per day were extended throughout 24 h. Two types of patients were taken into consideration: type 1 (P1) patients admitted into non-ICU beds, requiring 15 min of medical assistance provided by doctors and 30 min of assistance provided by nurses, and type 2 (P2) patients hospitalized in ICU beds that required 15 min of assistance provided by doctors and 40 min by nurses per day. The length of stay for P1 and P2 patients was 3 and 6 days, respectively.
Table 3 and
Table 4 list the estimated demand data per population area during six weeks of a dengue fever epidemic in Ciudad del Este, Paraguay. The estimated demand is based on the historical data of the number of patients suffering from dengue fever in the areas most affected by the epidemic. The demand of non-ICU beds will be higher in areas A2, A3, and A5 than other areas. The demand of ICU beds will be higher in areas A2, A5, and A9 than other areas. Both demands of non-ICU beds and ICU beds will reach a high level in week 4.
The methodology presented in this study was based on algorithms formulated by Sun et al. [
33], using concepts of linear programming.
2.1. Model 1–Single Objective Function and Planning Horizon
Model 1 allocates patients based on a single objective function that minimizes the total distance travelled by all patients to reduce cost. It involves a single planning horizon, also referred to as the current planning horizon. The first requirement of the model is to define the distance between each population area and hospital. The demand of patients of each type is also established along with the resources that the patient needs and the length of stay required before the patient is discharged. The initial capacity of each resource is recorded at the beginning of the current planning horizon to oversee its future availability. Patients who are hospitalized before the current planning horizon and released patients who are admitted in previous planning horizons are further considered in the model for potential implications related to occupancy.
This model does not consider the medical personnel involved in the hospitalization and treatment process; it only deals with material resources. The parameters and variables used in this study are introduced as follows.
Sets
A: set of population areas
H: set of hospitals
P: set of patient types
R: set of medical equipment types
T: set of time periods in the current planning horizon
Sr: set of patient types requiring medical equipment type r
Parameters
Distancea,h: distance from population area a to hospital h
Demandp,a,t: demand of patient type p from population area a on day t
IniCapacityr,h: initial capacity of medical resource r in hospital h
LOSp: length of stay of patient type p
InitialPatientsp,h: number of patients of type p at hospital h from previous planning horizon
ReleasedPatientsp,h,t: number of patients of type p at hospital h from previous planning horizon who are discharged on day t
Variables
NoPatientsp,h,t: number of patients of type p at hospital h on day t
Xp,a,h,t: number of patients of type p from population area a assigned to hospital h on day t
The patient allocation optimization problem, referring from Sun et al. [
33], can be formulated as follows.
The objective function (1) aims to minimize the total distance travelled by all patients to a hospital. Constraint (2) deals with the demand of patients, ensuring that every patient is admitted into a hospital. Constraints (3) and (4) are related to the intermediate variable for the number of patients, assuming conditions on the first day and the following days, respectively. Constraint (5) ensures the availability of resources, and constraint (6) specifies that the decision variables have to be greater than or equal to zero.
2.2. Model 2–Multiple Objective Function and Planning Horizon Including Medical Personnel Working Hours
Model 2 introduces a bi-objective function and multiple planning horizons to enhance capabilities and flexibility. A second objective that minimizes the total distance travelled by each patient is incorporated. Moreover, considering multiple planning horizons in Model 2 that can define the length of periods and accept data modification is more applicable to epidemics, especially because the scenarios during these events may vary radically from one day to another. The additional parameters and variables are introduced as follows.
Additional Sets
T′: set of time periods on the next planning horizon
S: set of medical personnel types (i.e., doctor, nurses)
Ss: set of patient types requiring the assistance of medical personnel type s
Additional Parameters
StaffHoursp,s: staff hours required for patient type p of staff type s
StaffCapacitys,h,t: staff capacity in hours of staff type s at hospital h on day t
ResourceShortager,t: shortage of medical resource r on day t
StaffHrsShortages,t: shortage of staff hours s on day t
M: A large number
Additional Variables
ReleasedPatientsp,h,t: number of patients of type p who are admitted in a previous planning horizon and will be released from hospital h on day t of the current planning horizon
NextReleasedPatientsp,h,t: number of patients of type p who are admitted in current planning horizon but will be released from hospital h on day t′ of the next planning horizon
Ya,h: equals 1 if patients are admitted in hospital h, otherwise 0
D: maximum distance from patient to assigned hospital
The bi-objective function is
By adding the following constraints (12)~(14), the second objective in objective function (7) is considered in the constraint set. After transforming the bi-objective function into a single objective function, the patient allocation optimization problem that minimizes the total distance travelled by each patient factoring in multiple planning horizons, referring from Sun et al. [
33], can be formulated as follows.
Model 2 is based on a bi-objective function presented in (7). Equation (8) presents a single objective function transformed from (7). In order to increase the flexibility of the algorithm, a dummy hospital h’ is introduced for dealing with the patients who may be rejected due to the lack of enough resources. The second set of summations referred to the dummy hospital where the expression ensures that patients were assigned to the dummy hospital as the last way to resolve the model, minimizing the second objective. Constraint (10) involves the number of patients who will be released in the next planning horizon. Medical personnel capacity is referred to in constraint (11). Constraints (12)–(14) are the constraints related to the second objective. Equations (15) and (16) are incorporated to predict when resource shortage and shortage of staff hours occur.
2.3. Model 3–Multiple Objective Function and Planning Horizon Including Additional Resources
Model 3 investigates the advantage of allocating additional resources of all types. Using the improvements made in Model 2, Model 3 optimizes the model considering additional medical resources and medical personnel working hours. The additional parameters and variables are introduced as follows.
Additional Parameters
AddResourcesr,t: number of additional resource r available on day t
AddPersResourcess,t: working hours of additional personnel resource s on day t
Additional Variables:
AddRAllocationr,h,t: number of resource r allocated to hospital h on day t
AddPRAllocations,h,t: working hours of medical personnel type s allocated to hospital h on day t
The patient allocation optimization problem that minimizes the total distance travelled by each patient considering in multiple planning horizons and considers additional medical resources and medical personnel working hours, referring from Sun et al. [
33], can be formulated as follows.
Constraints (17) and (18) ensure that the allocation of additional medical resources and additional working hours of medical personnel, respectively, does not exceed the available additional capacity. Model 3 can help decision makers identify areas where these resources could be allocated.
3. Results
This study used the data provided by a privately run health care cooperative in Ciudad del Este to investigate the patient allocation optimization problem. In order to provide an efficient response to the outbreak, all beds in each hospital shown in
Table 2 were assumed to be available. Data belonging to week 1 was set as the only input for Model 1.
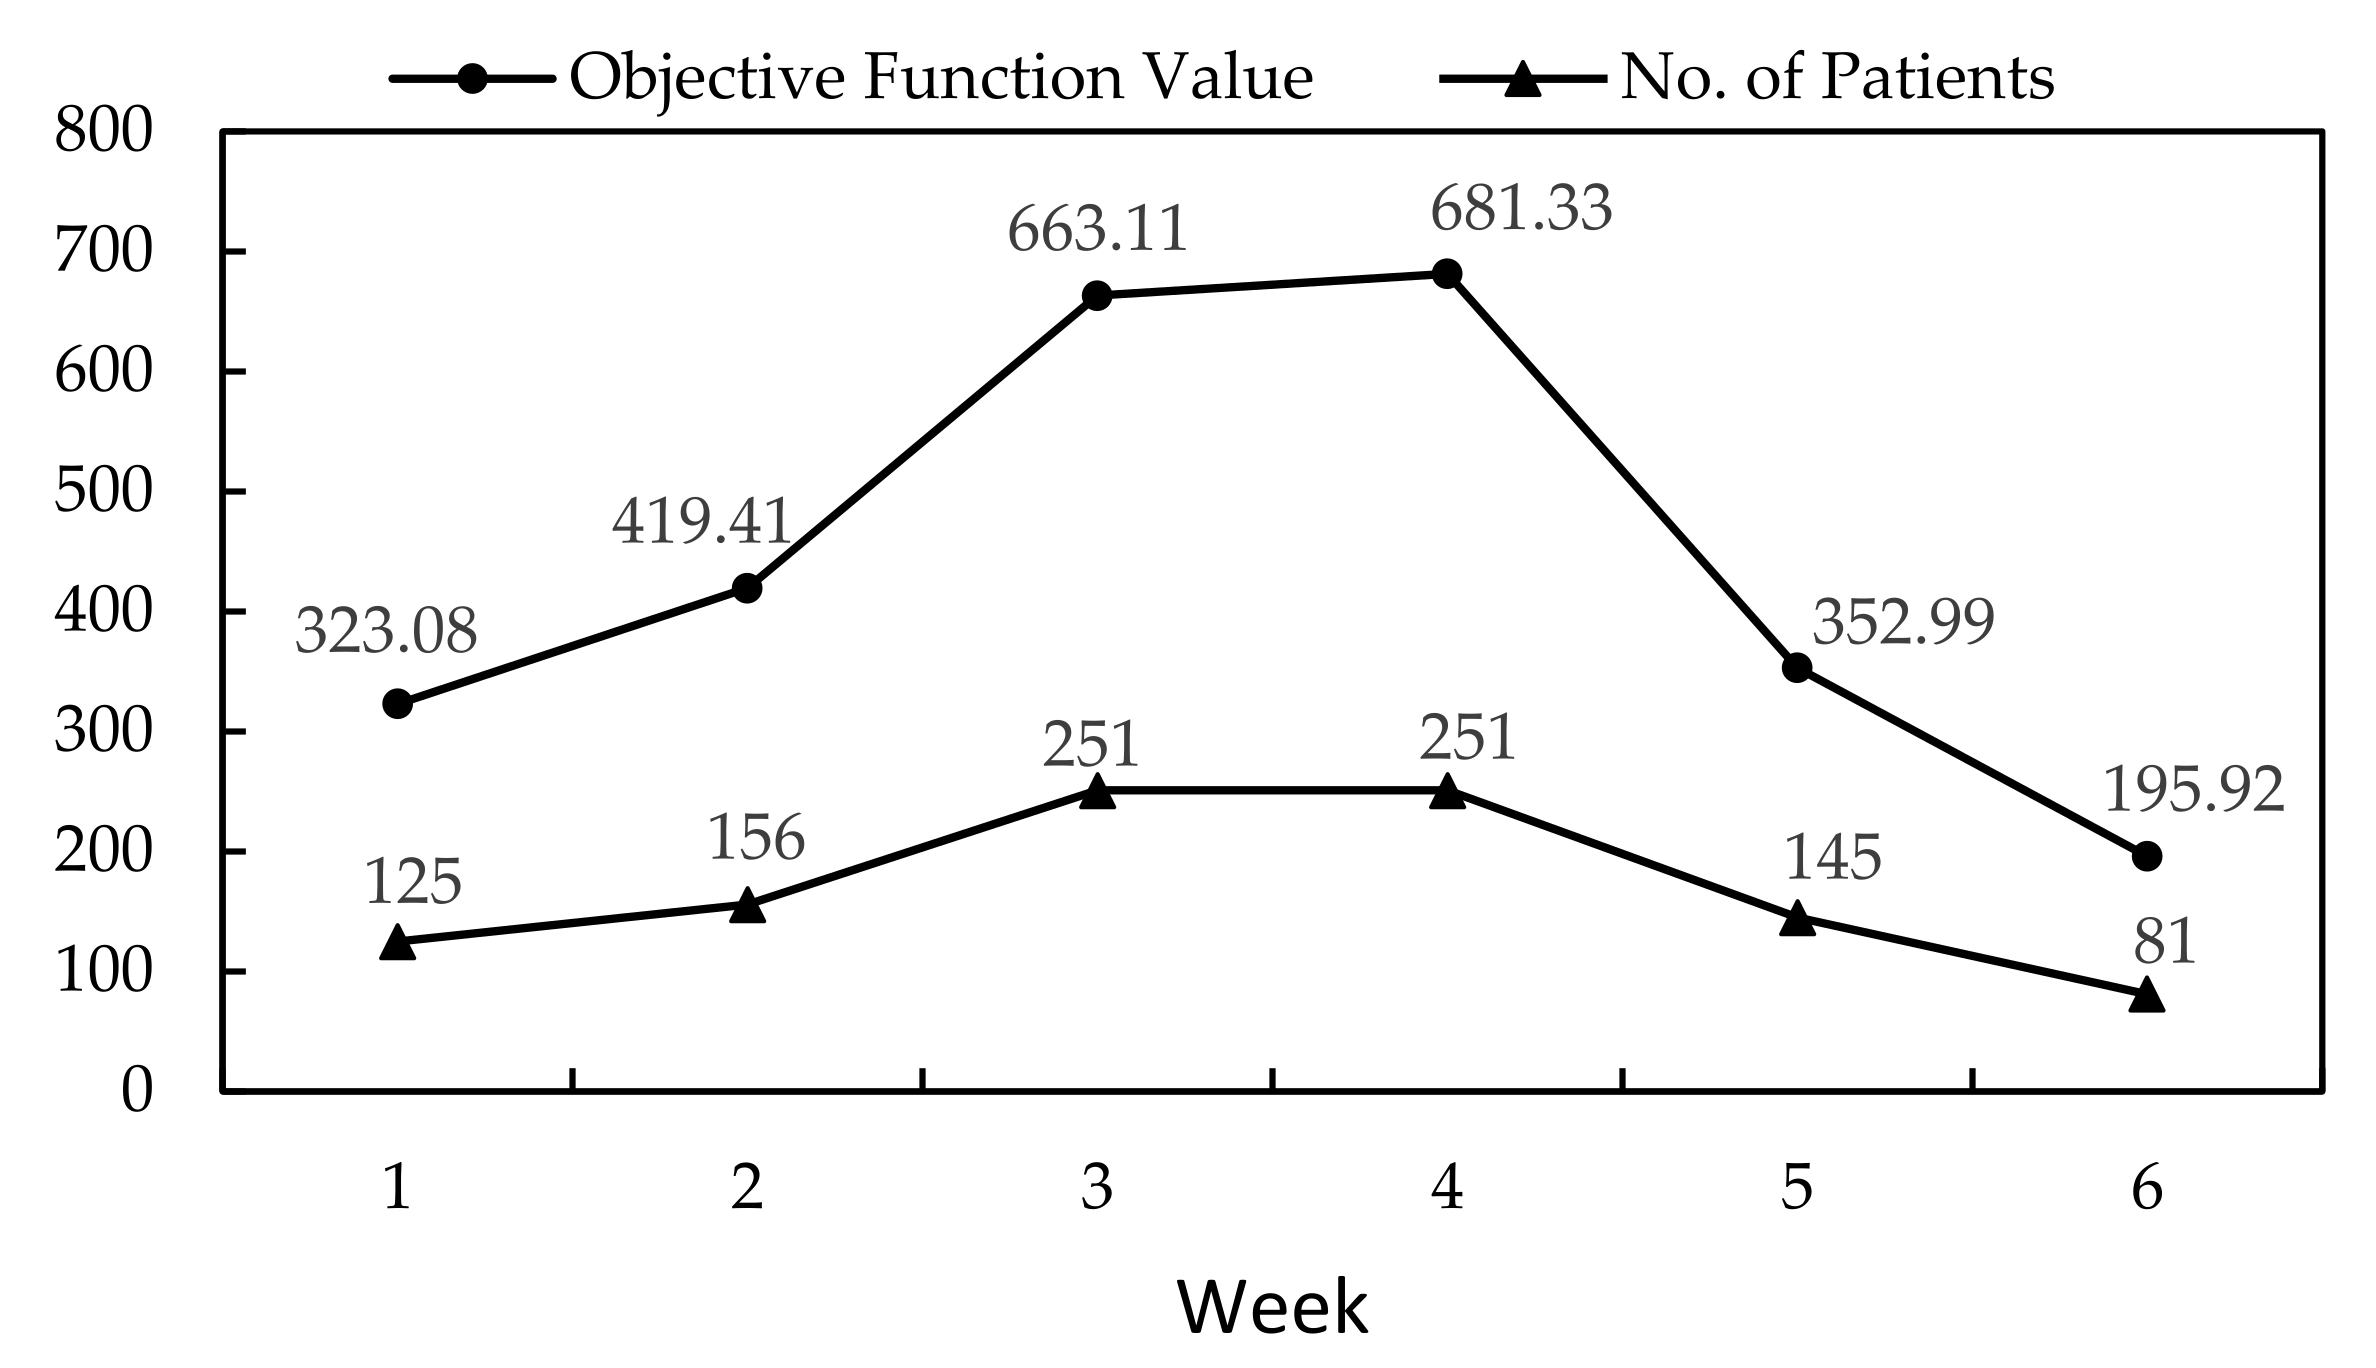
Table 5 shows the allocation of patients from the results of Model 1. More than one value in a box meant patients were allocated in more than one hospital. The objective function value was 323.08, accounting for 125 patients.
In order to solve the multiple objective model, the -constraint method was applied. In this study, an upper limit with respect to patient travel distance to a hospital was set to 9. The total patient travel distance was identified as 7.11 km and remained unchanged when the upper limit was larger than 7.5 km. However, the solution became infeasible when the upper limit was fixed at 7 km or below. The results from Model 1 and Model 2 were mostly similar for week one. Week 2 represented the second planning horizon in Model 2. The values from in week 1 were used as in week 2, and the values were also based on the results of week 1. At the end of week 2, no medical resources were exhausted, and all patients were allocated to existing medical facilities. The objective function value stood at 419.41 for a total number of 156 patients.
As the number of patients seeking medical assistance continued to grow, week 3 was identified as the first week in which medical resources were not sufficient.
Table 6 shows the allocation of patients during week 3.
Resource shortage was observed when patients were allocated in the dummy hospital represented by H7. The model showed that there was no medical personnel shortage, but there was a shortage of both non-ICU and ICU beds.
Table 7 shows the medical resource shortage during week 3 obtained from constraints (15) and (16).
Similarly, a variation on medical personnel availability was involved to demonstrate personnel resource shortage. Previous results were performed using the entire number of medical personnel hours. Data from week 1 was further analyzed considering availability of 50%, 30%, 10%, 9%, and 8%. Results remained unchanged at availability of 50% and 30%; however, when only 10% and 9% of all available hours were considered, the optimal solution increased to 329.59. When the staff capacity was lowered to 8%, the solution became infeasible.
From the results of Model 2, the existing medical equipment was insufficient to satisfy the demand of new admissions during week 3.
Table 7 shows that the maximum shortage for non-ICU beds is 34 and the maximum shortage for ICU beds is 23 during week 3. By using these values, Model 3 distributed additional resources such that all patients were successfully allocated in the existing hospitals. The distribution of additional resources is displayed in
Table 8. The total numbers of additional non-ICU beds and ICU beds that can cover the shortage listed in
Table 7 are 34 and 23, respectively. Model 3 allocated the additional resources in appropriate hospitals. The objective function value for week 3 was 663.11.
After allocating the newly available medical resources listed in
Table 8, the results of week 4 obtained from Model 3 showed that another medical resource shortage event occurred. However, the medical personnel working hours were sufficient. Model 3 was used to find the optimal distribution of resources and to rearrange the allocation of patients in the existing hospitals. The model reallocated the patients and produced an objective value of 681.33 for all 251 patients. As the last two weeks proceeded, the number of admissions per day continued to decrease. Therefore, the available resources were able to cover all the requirements.


