
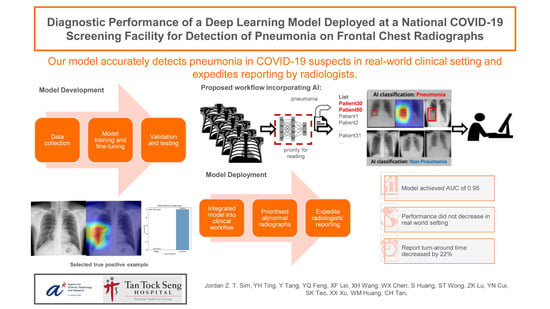
Diagnostic Performance of a Deep Learning Model Deployed at a National COVID-19 Screening Facility for Detection of Pneumonia on Frontal Chest Radiographs
 , ,
, ,
Abstract
:
1. Introduction
2. Materials and Methods
2.1. Datasets
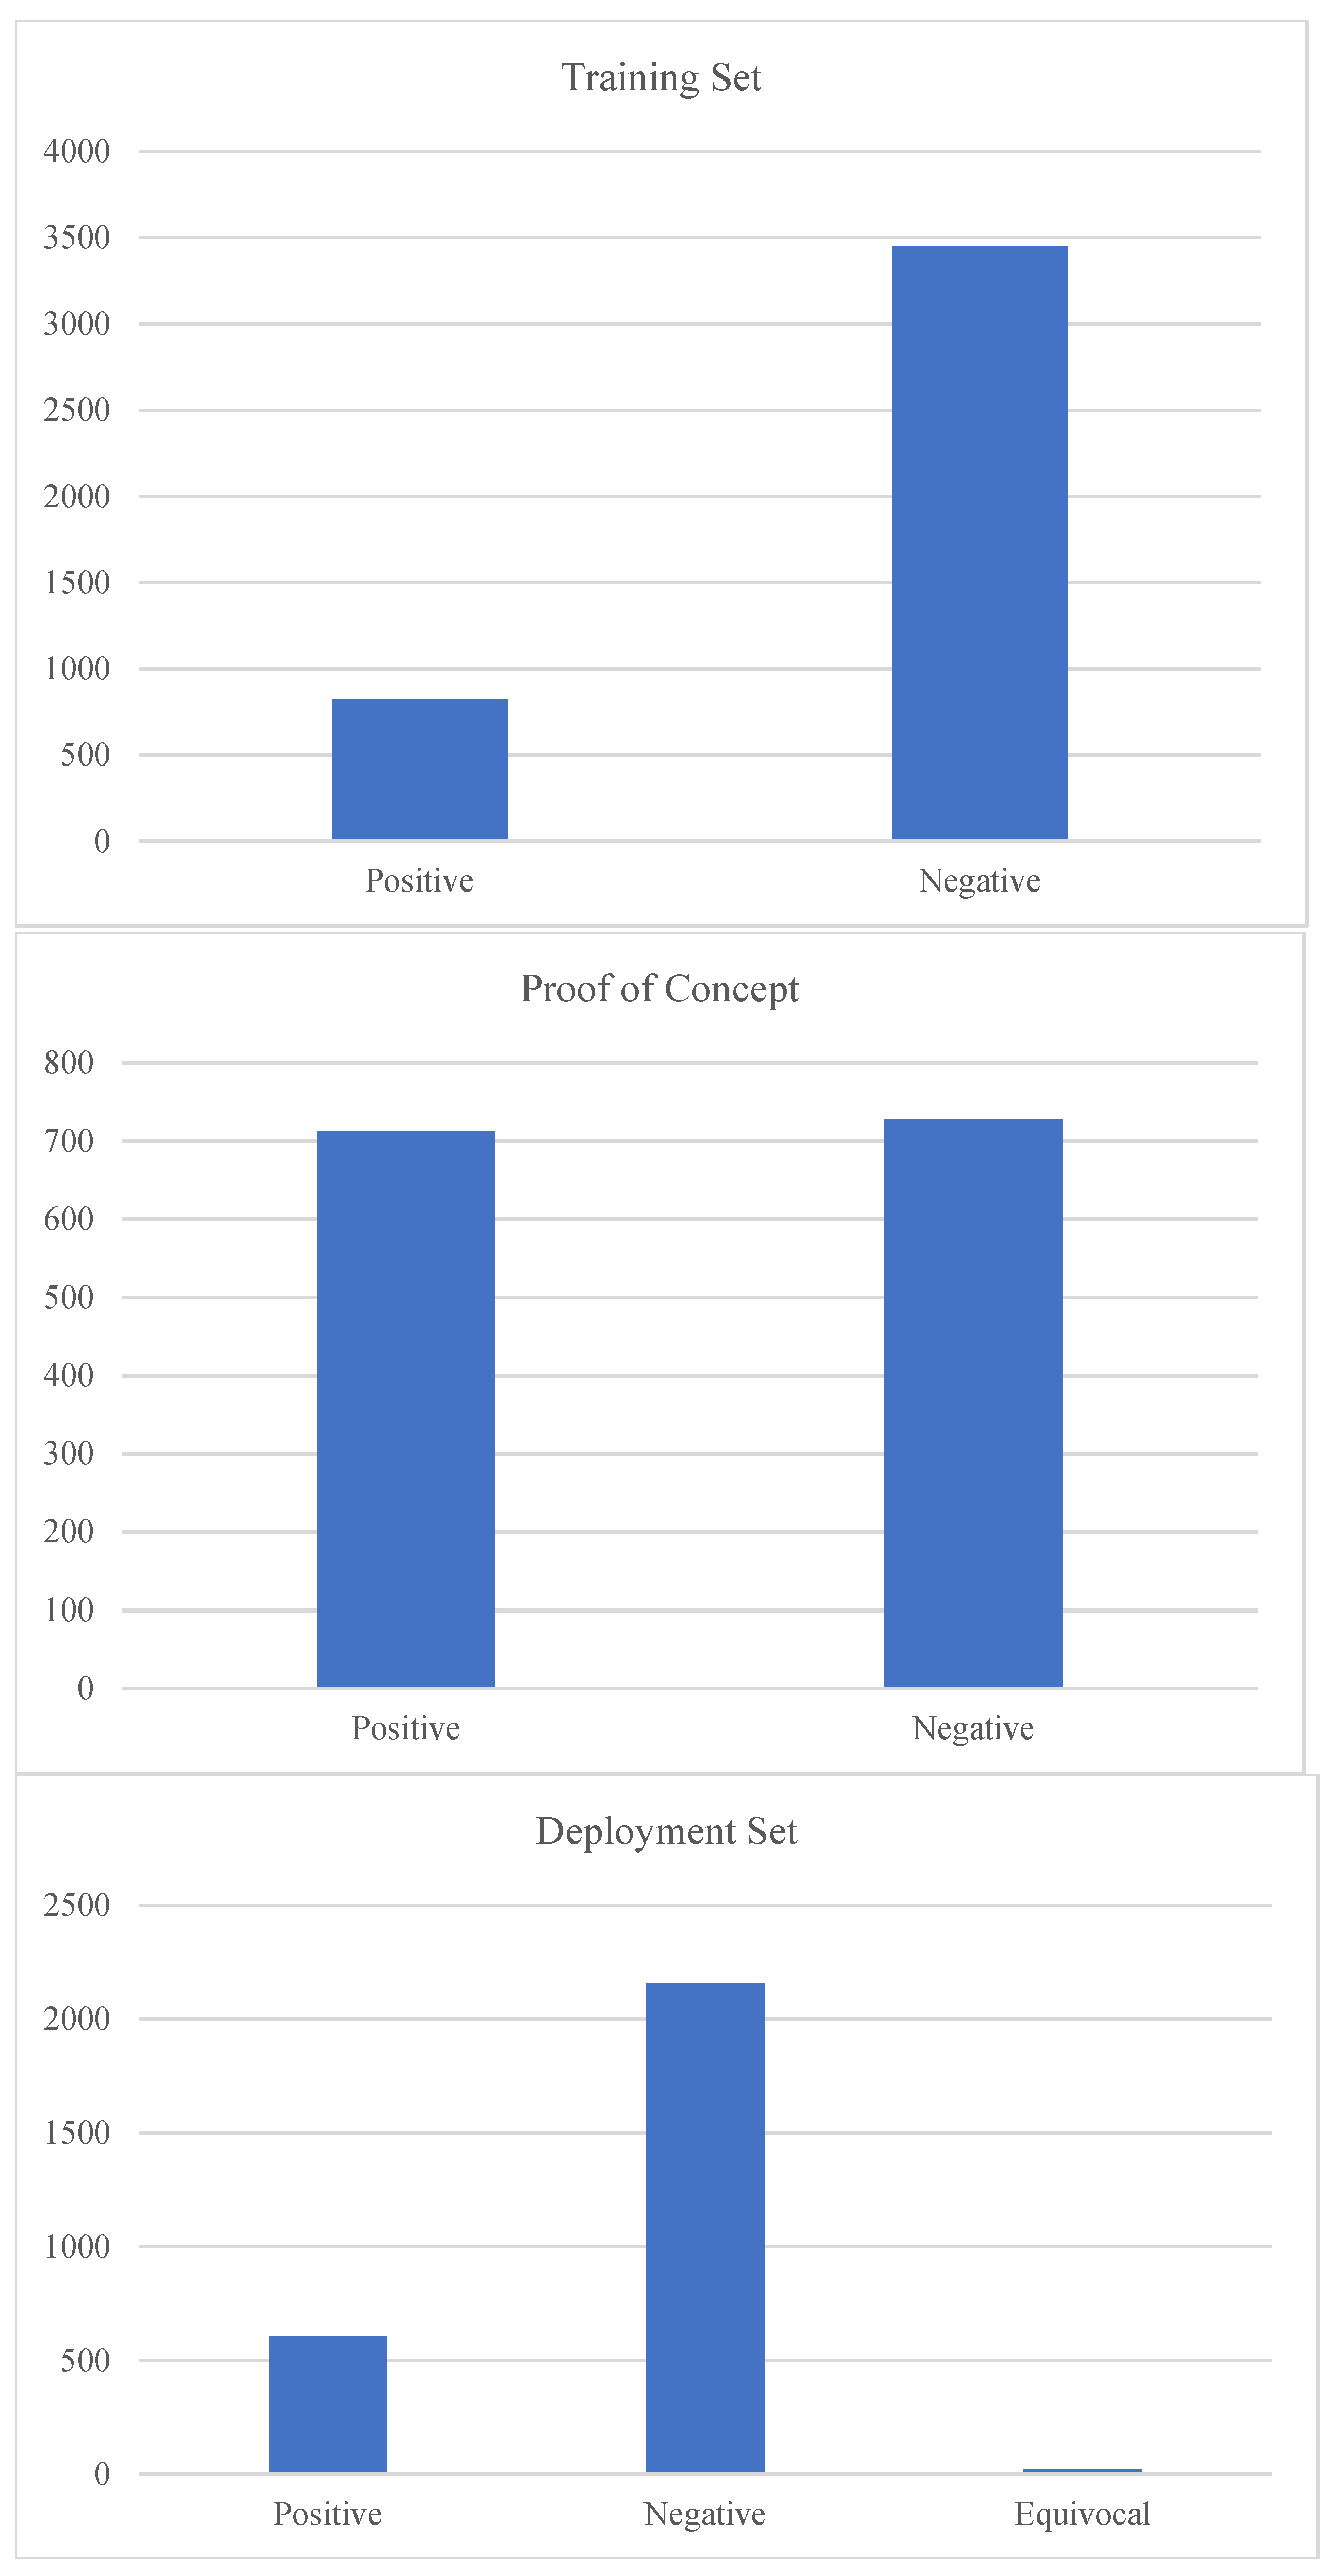
2.1.1. Training Set
2.1.2. Proof-of-Concept (POC) Offsite Test Set
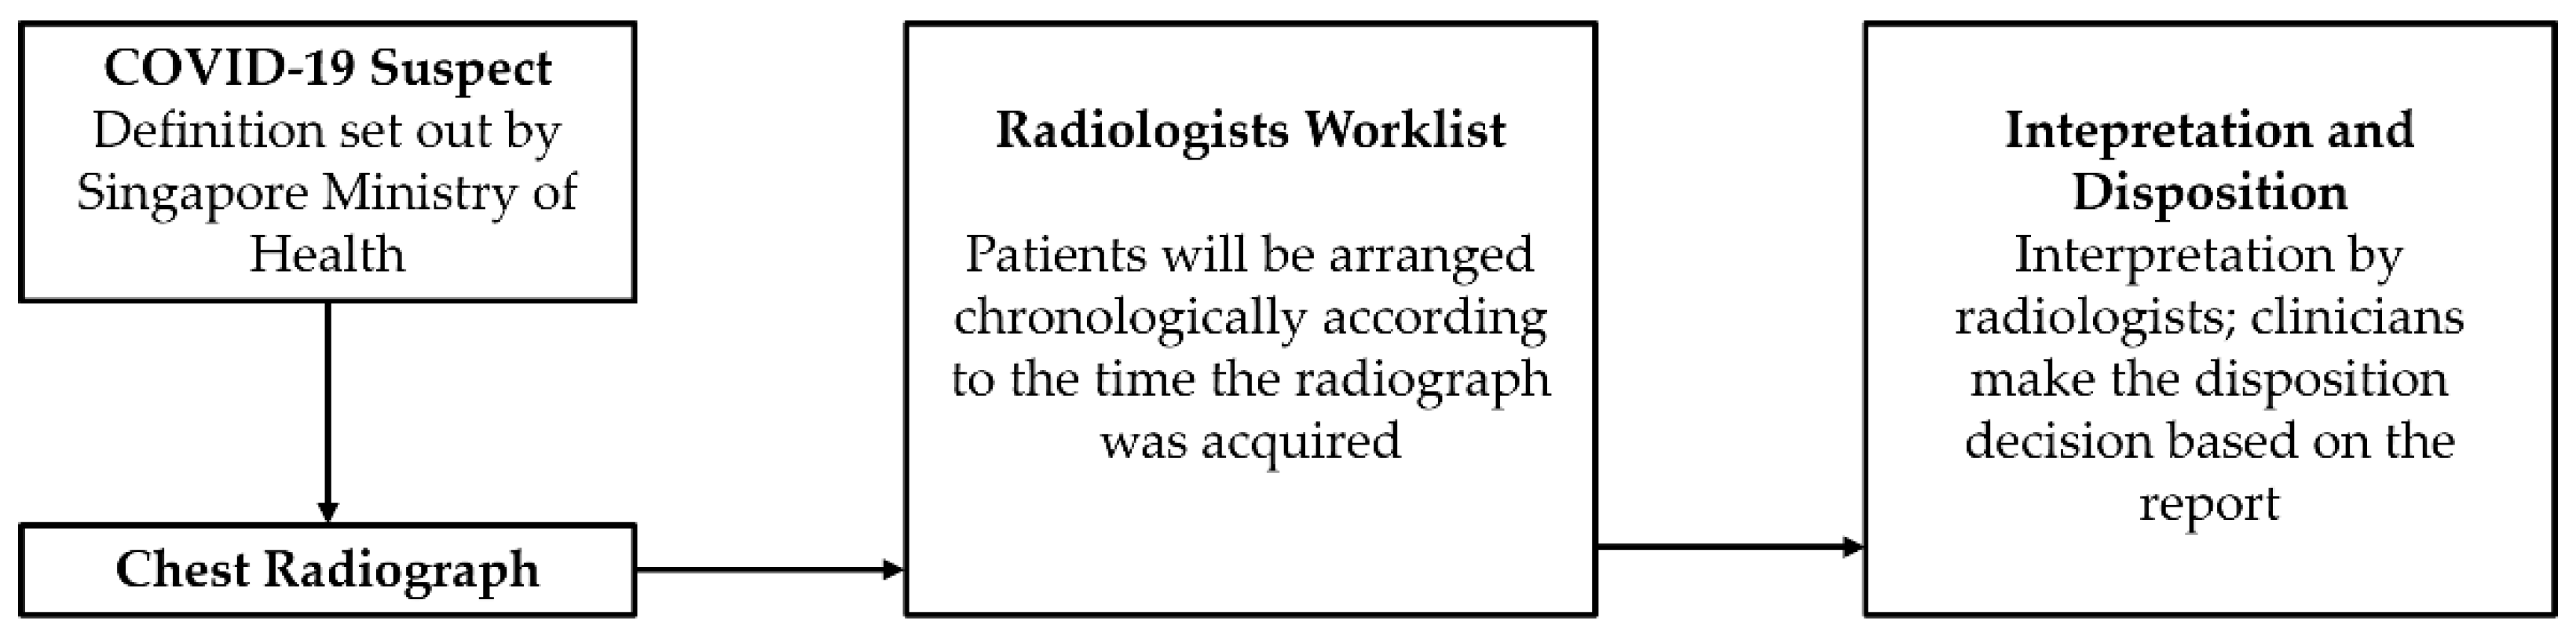
2.1.3. Clinical Deployment Set
2.2. Development of the Deep Learning Model
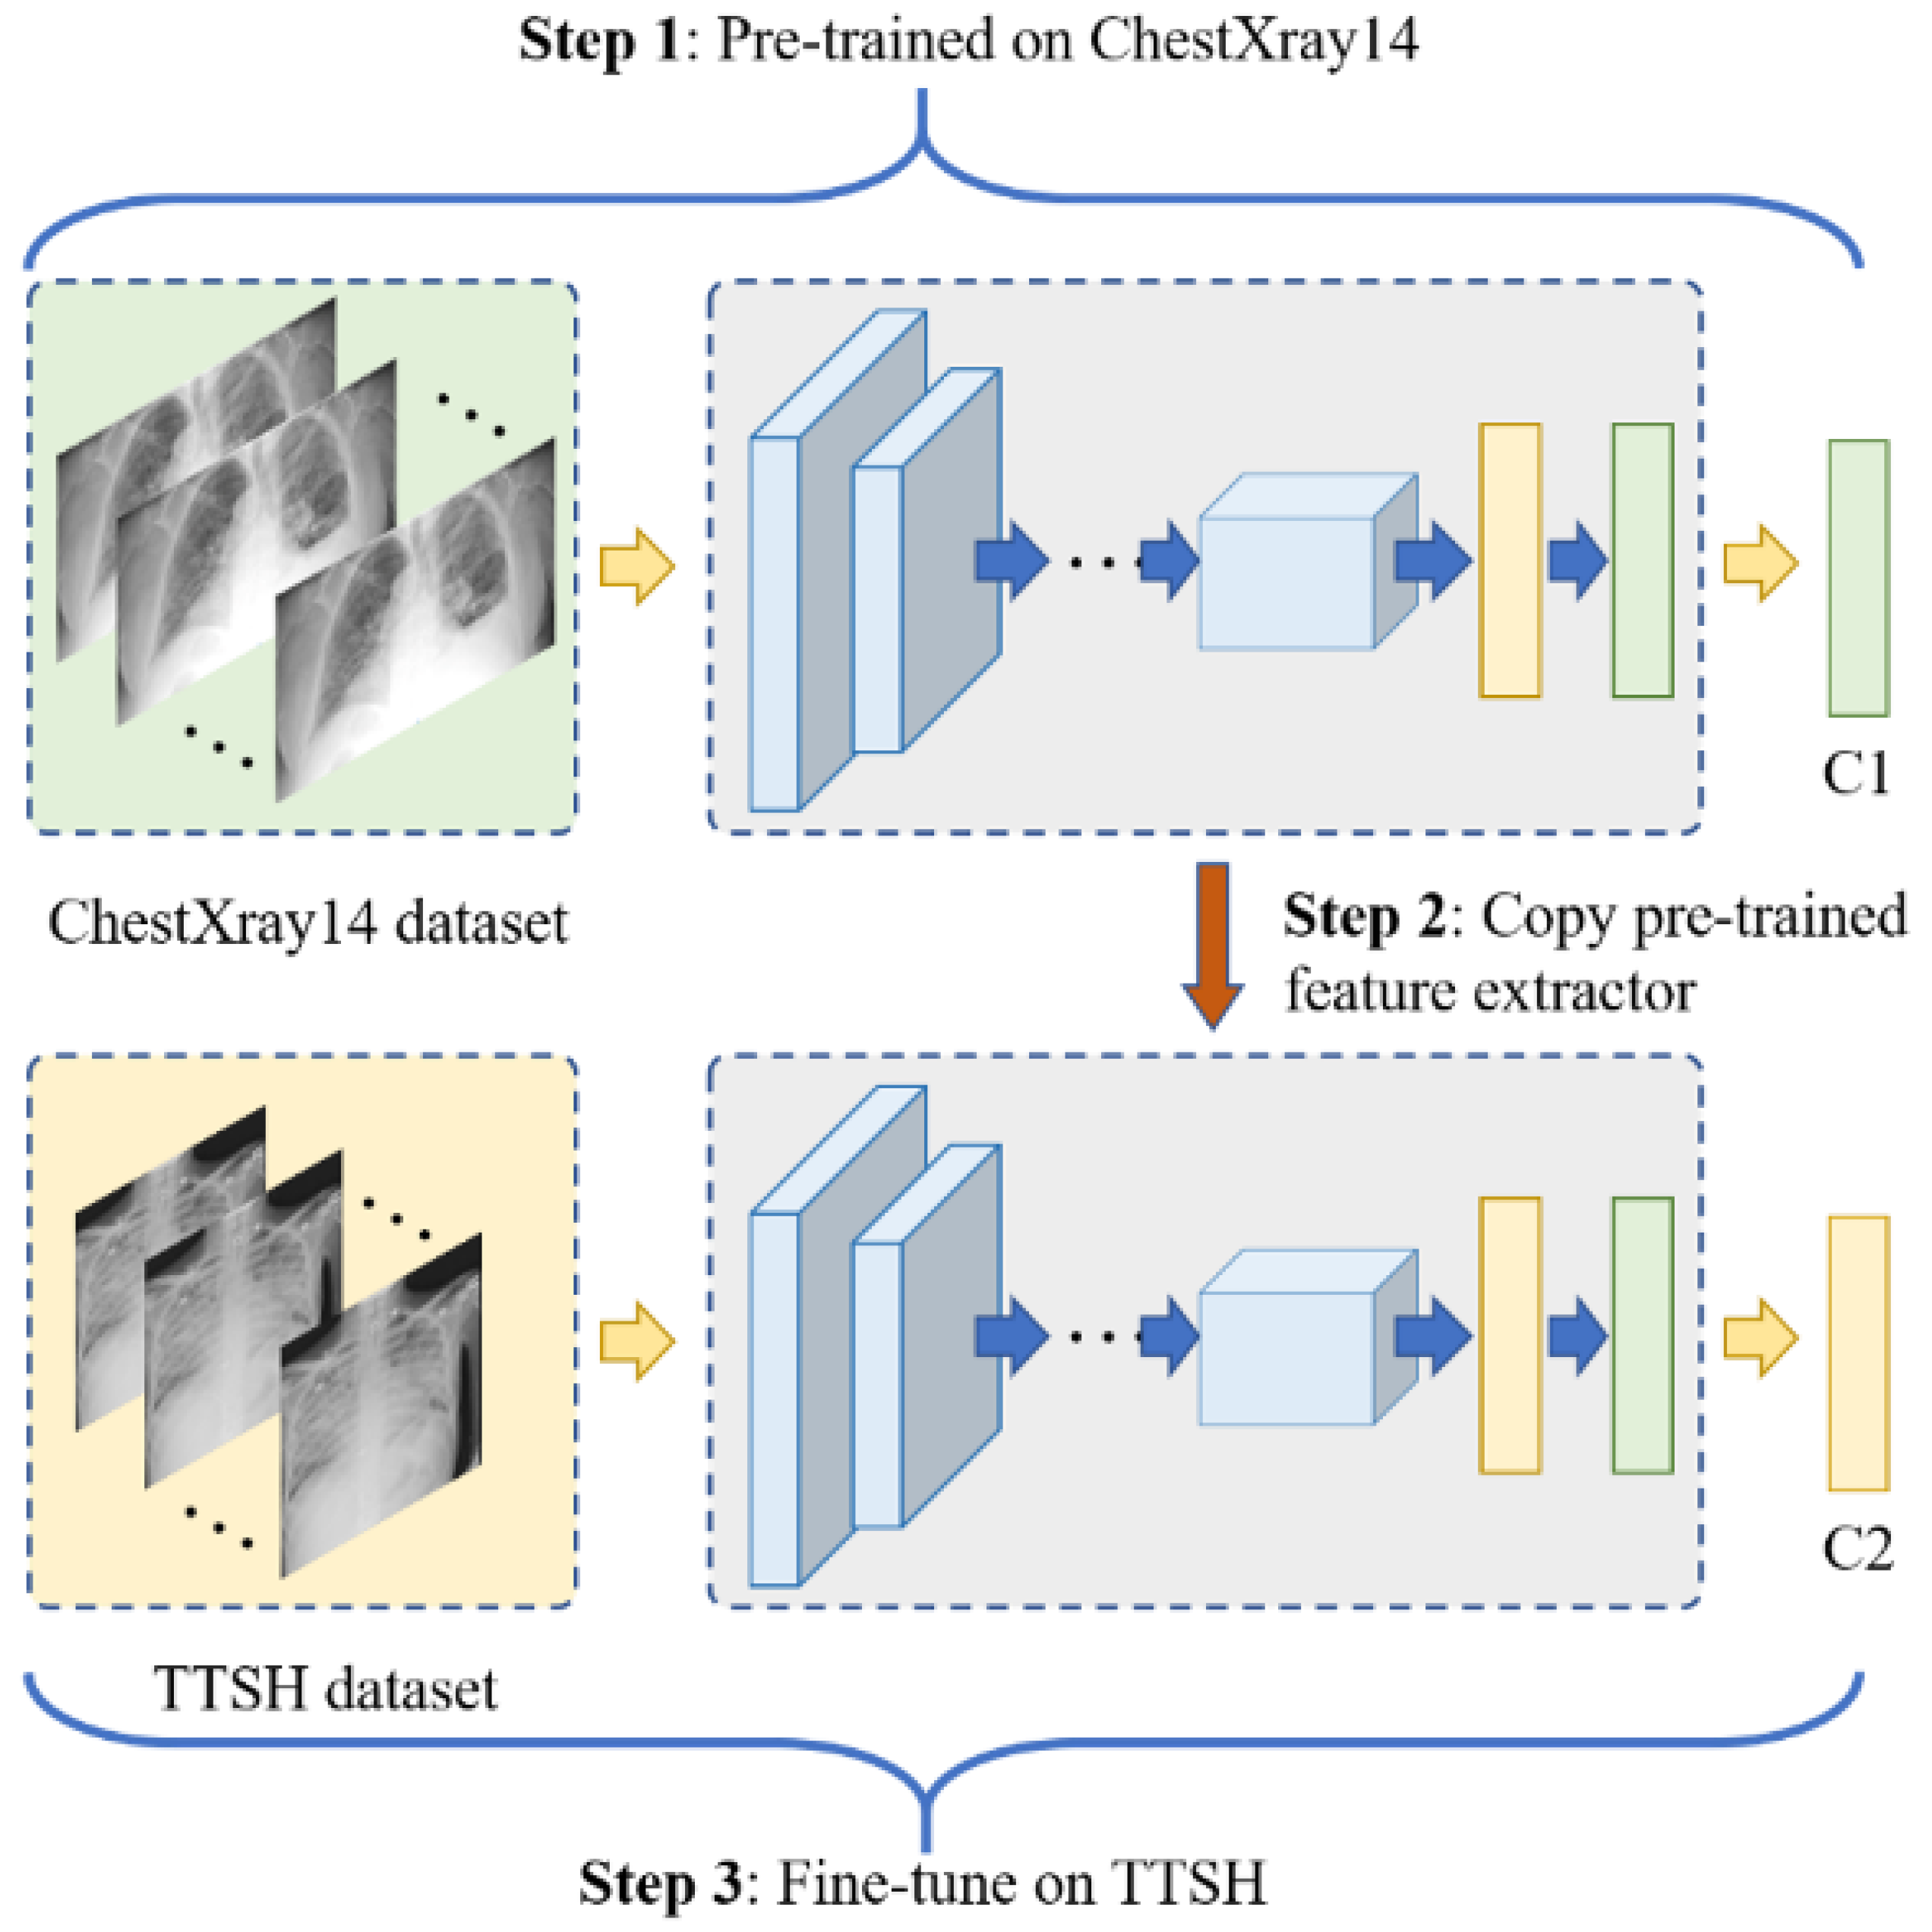
2.2.1. Transfer Learning on Deep Neural Networks
2.2.2. Network Architectures
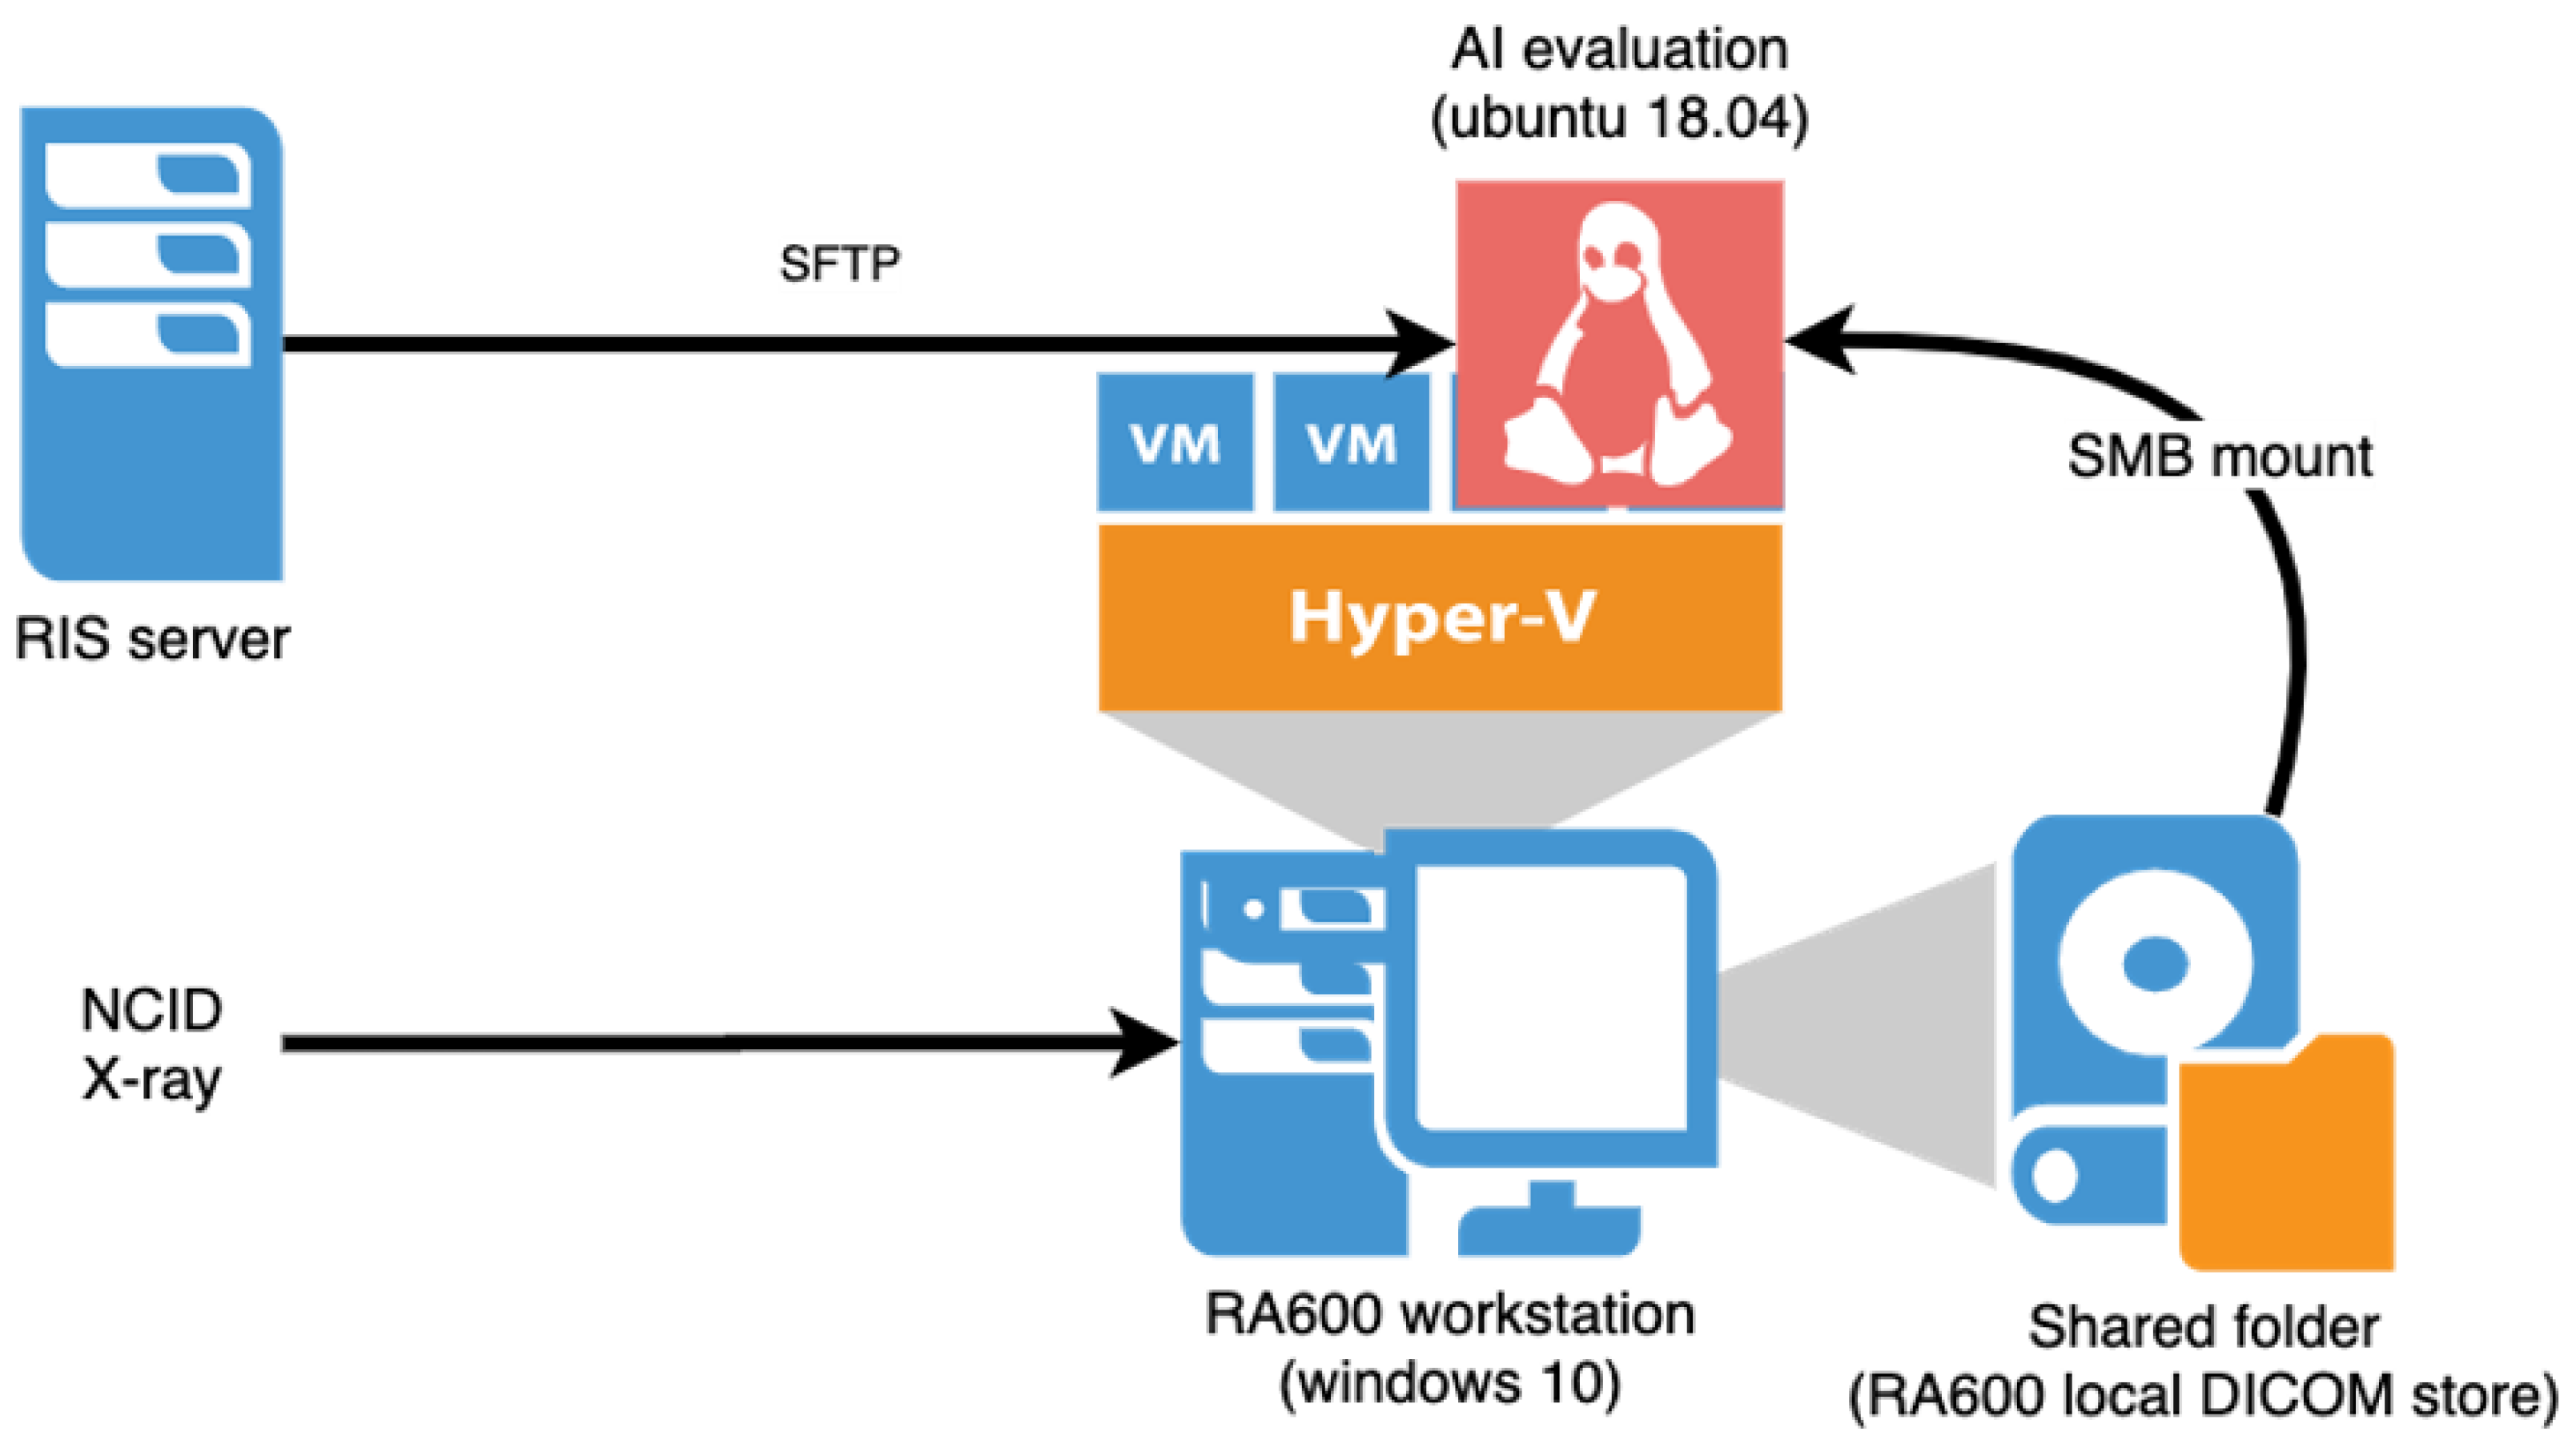
2.3. Deployment of Model Ensemble
2.4. Proof of Concept (POC)—Offsite Test
2.5. Statistical Analysis
3. Results
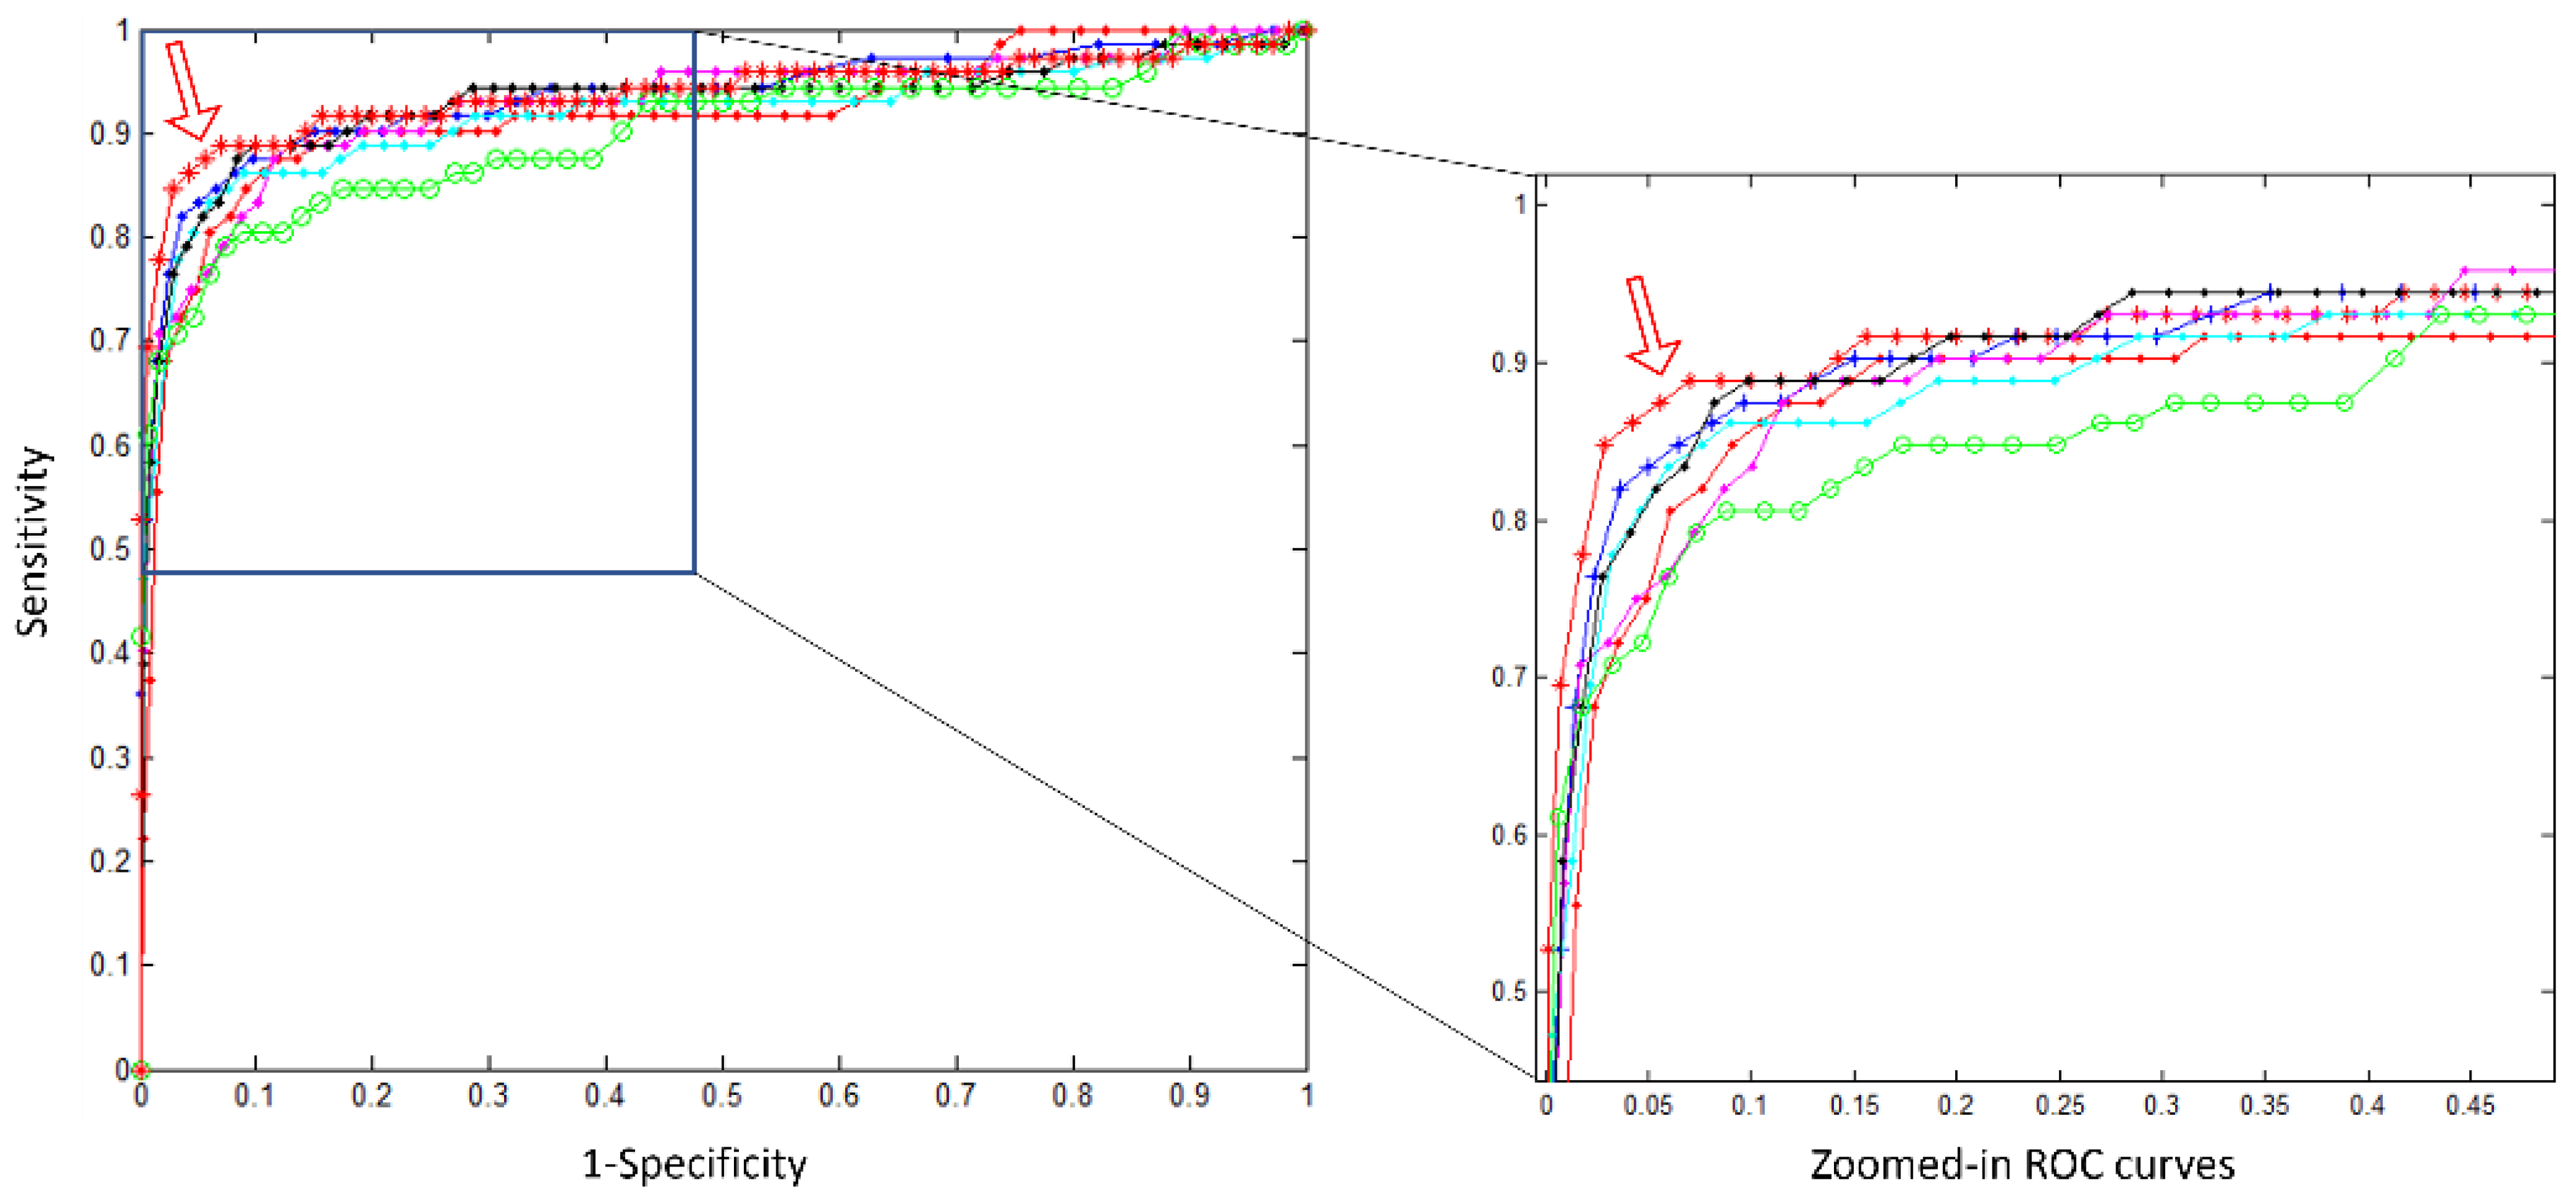
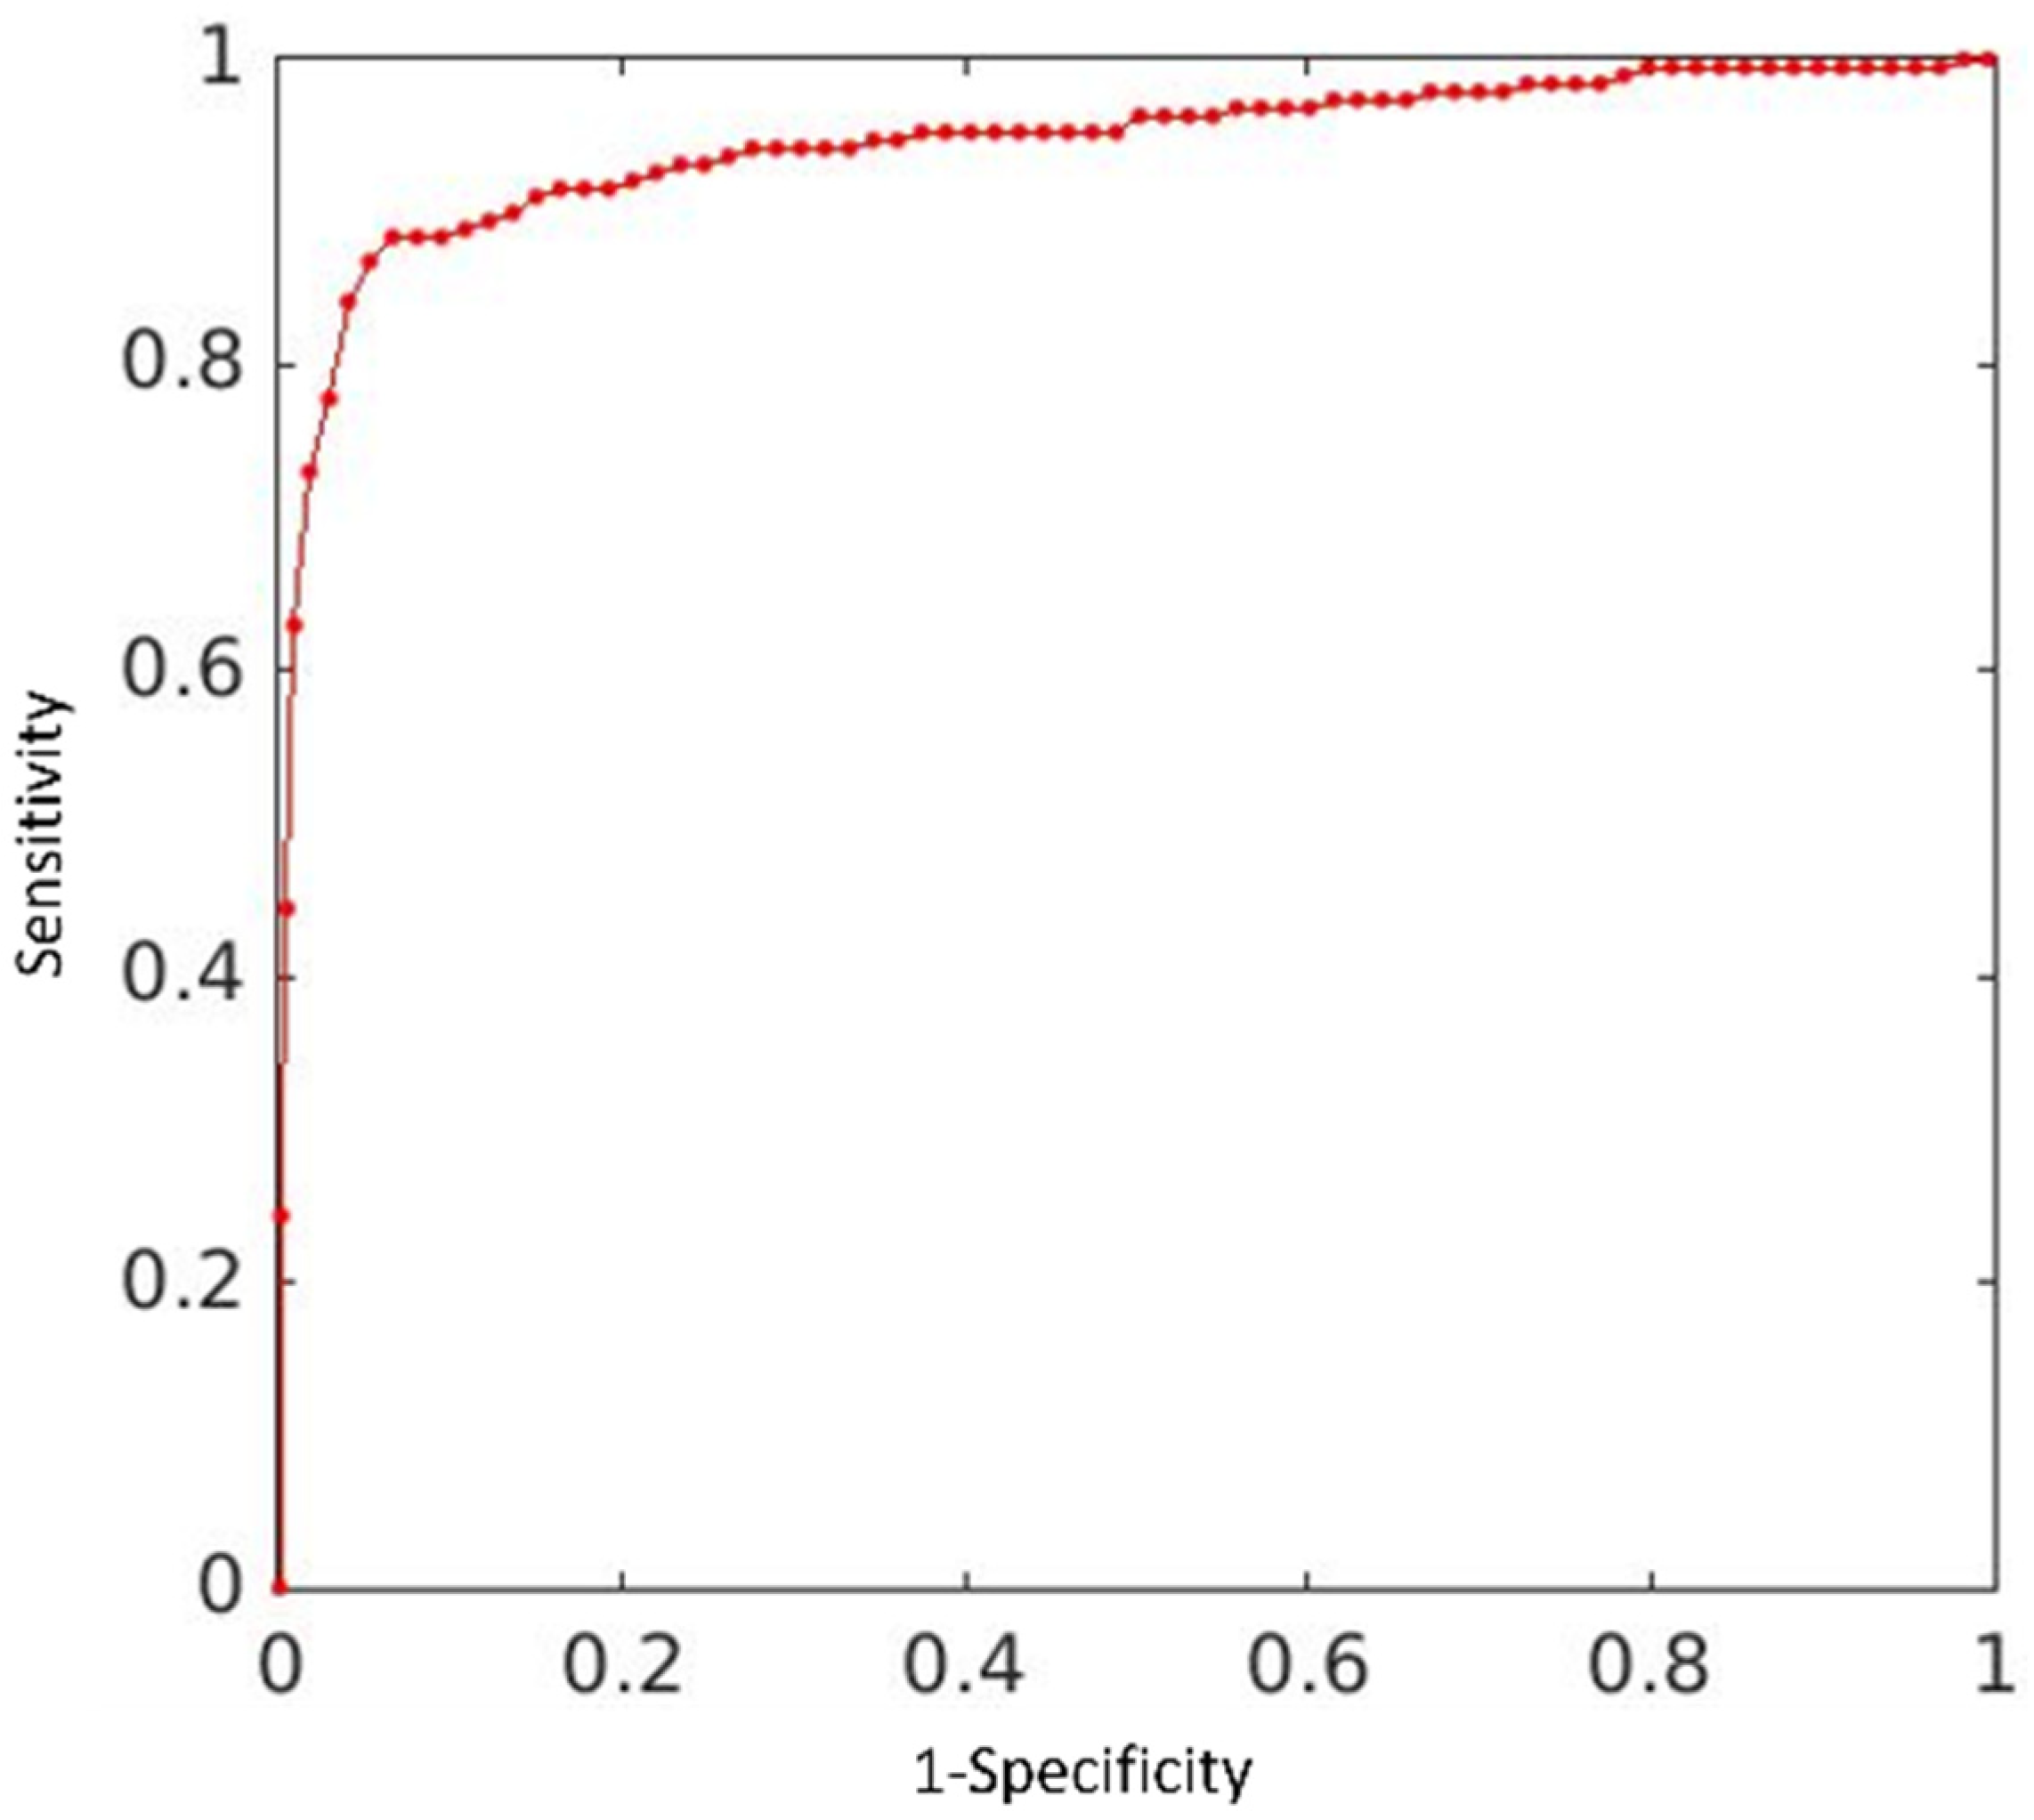
3.1. Results from Proof of Concept—Offsite Test Set
3.2. Results from Clinical Deployment
3.3. Turnaround Time
4. Discussion
5. Conclusions
Author Contributions
Funding
Institutional Review Board Statement
Informed Consent Statement
Data Availability Statement
Conflicts of Interest
Appendix A. Distribution of SARS-CoV-2 RT-PCR Test Results of All Three Datasets

Appendix B. Technical Details of the Network Architecture and Performance Matrix
Pre-Training and Fine-Tuning
- TP: true prediction on positive cases,
- TN: true prediction on negative cases,
- FN: false prediction on positive cases,
- FP: false prediction on negative cases,
- Sensitivity = TP/(TP + FN),
- Specificity = TN/(TN + FP),
- F1 is the harmonic mean of Sensitivity and Specificity,
- F1 = 2 × Sensitivity × Specificity/(Sensitivity + Specificity), and
- Accuracy = (TP + TN)/(TP + FN + TN + FP).
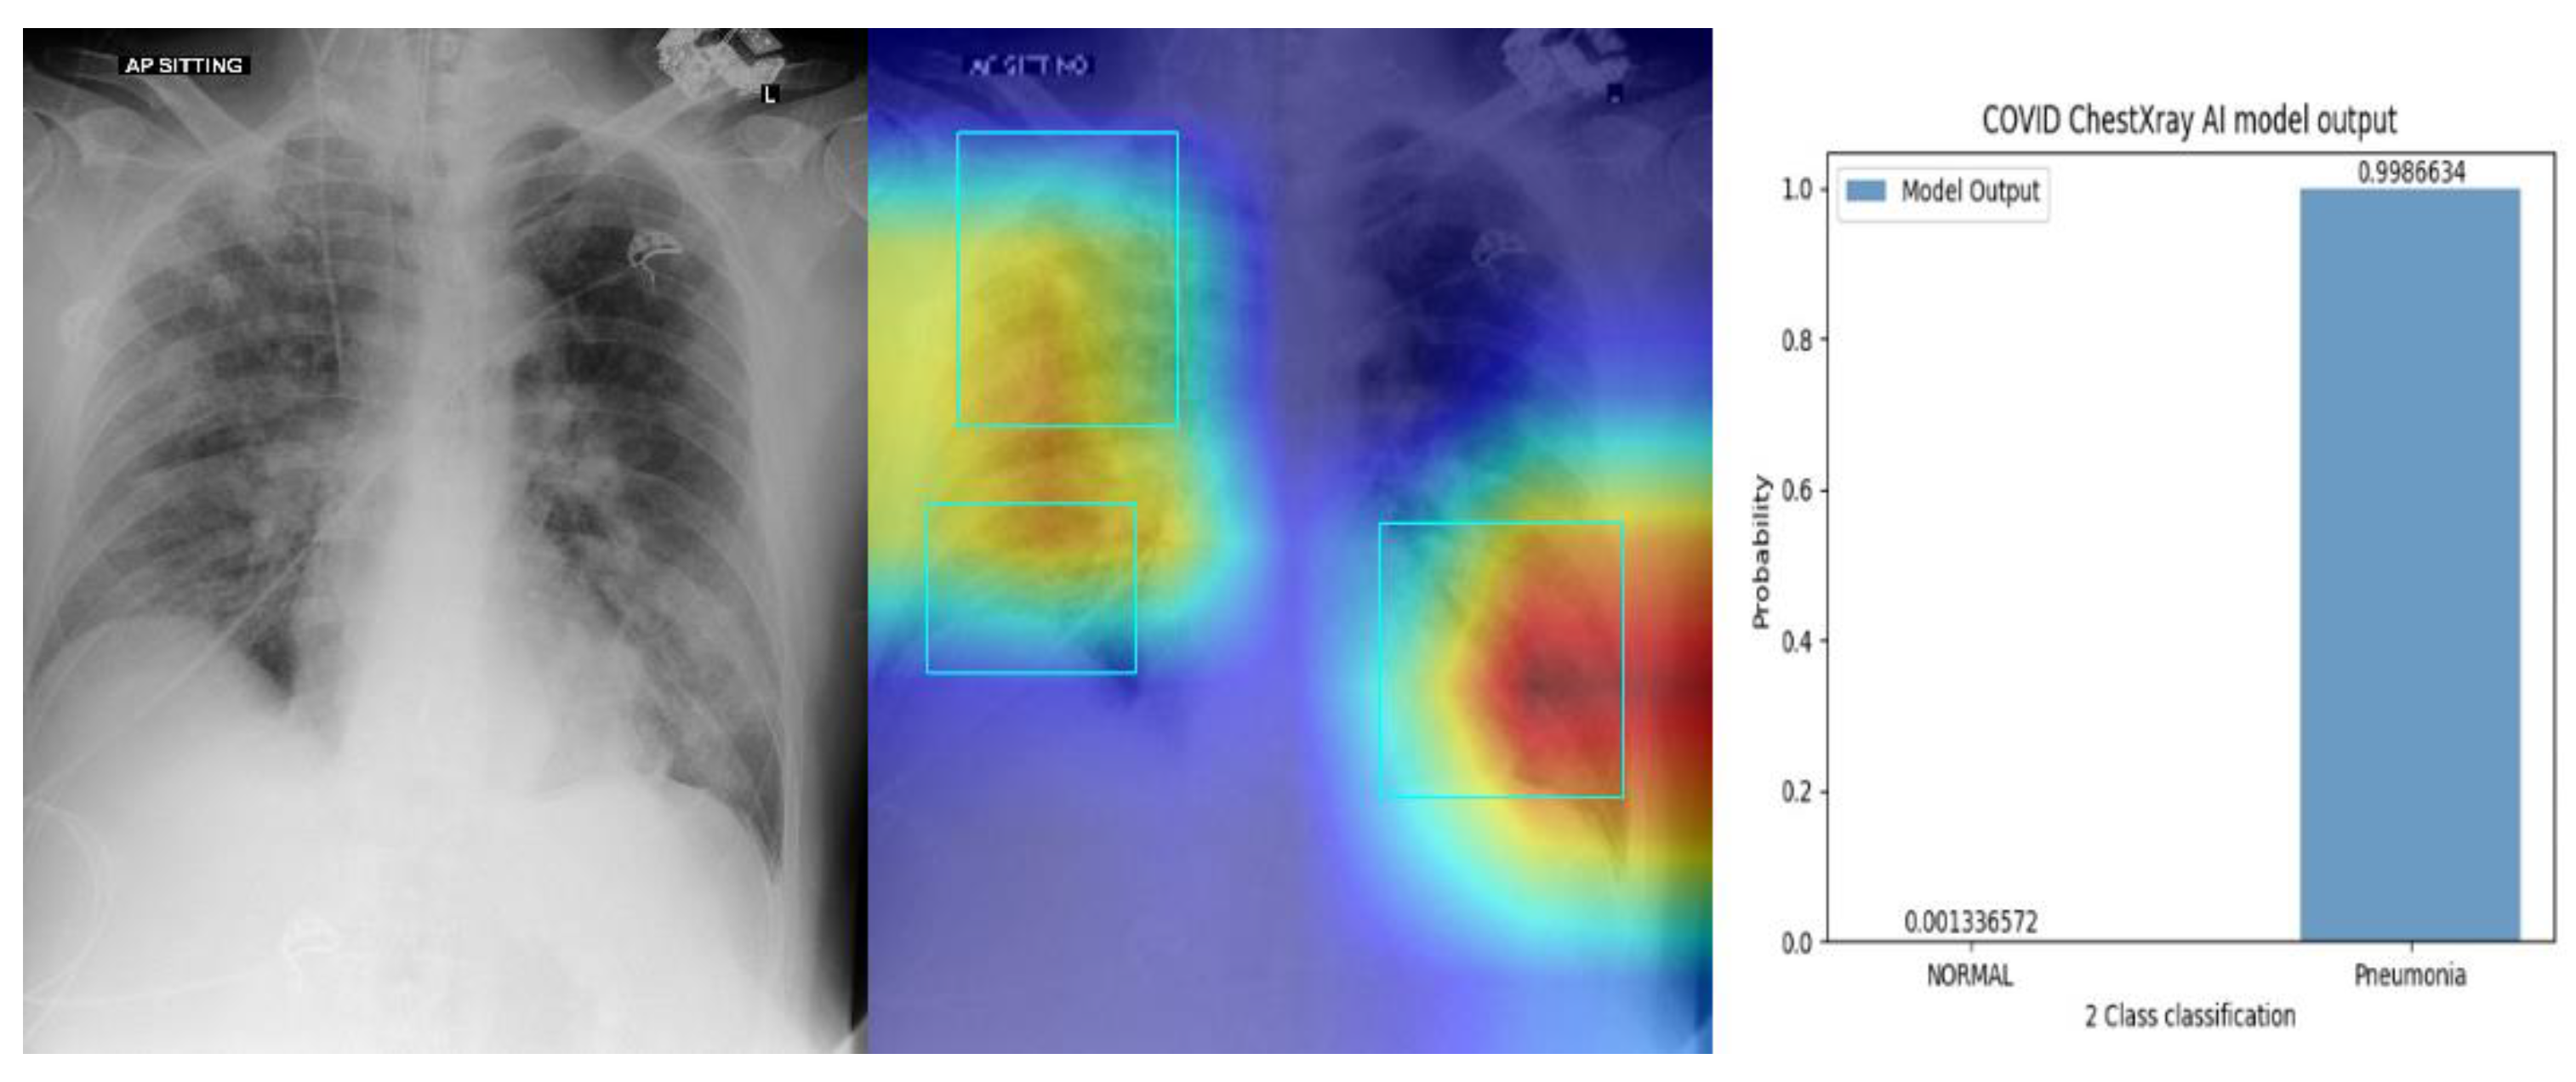
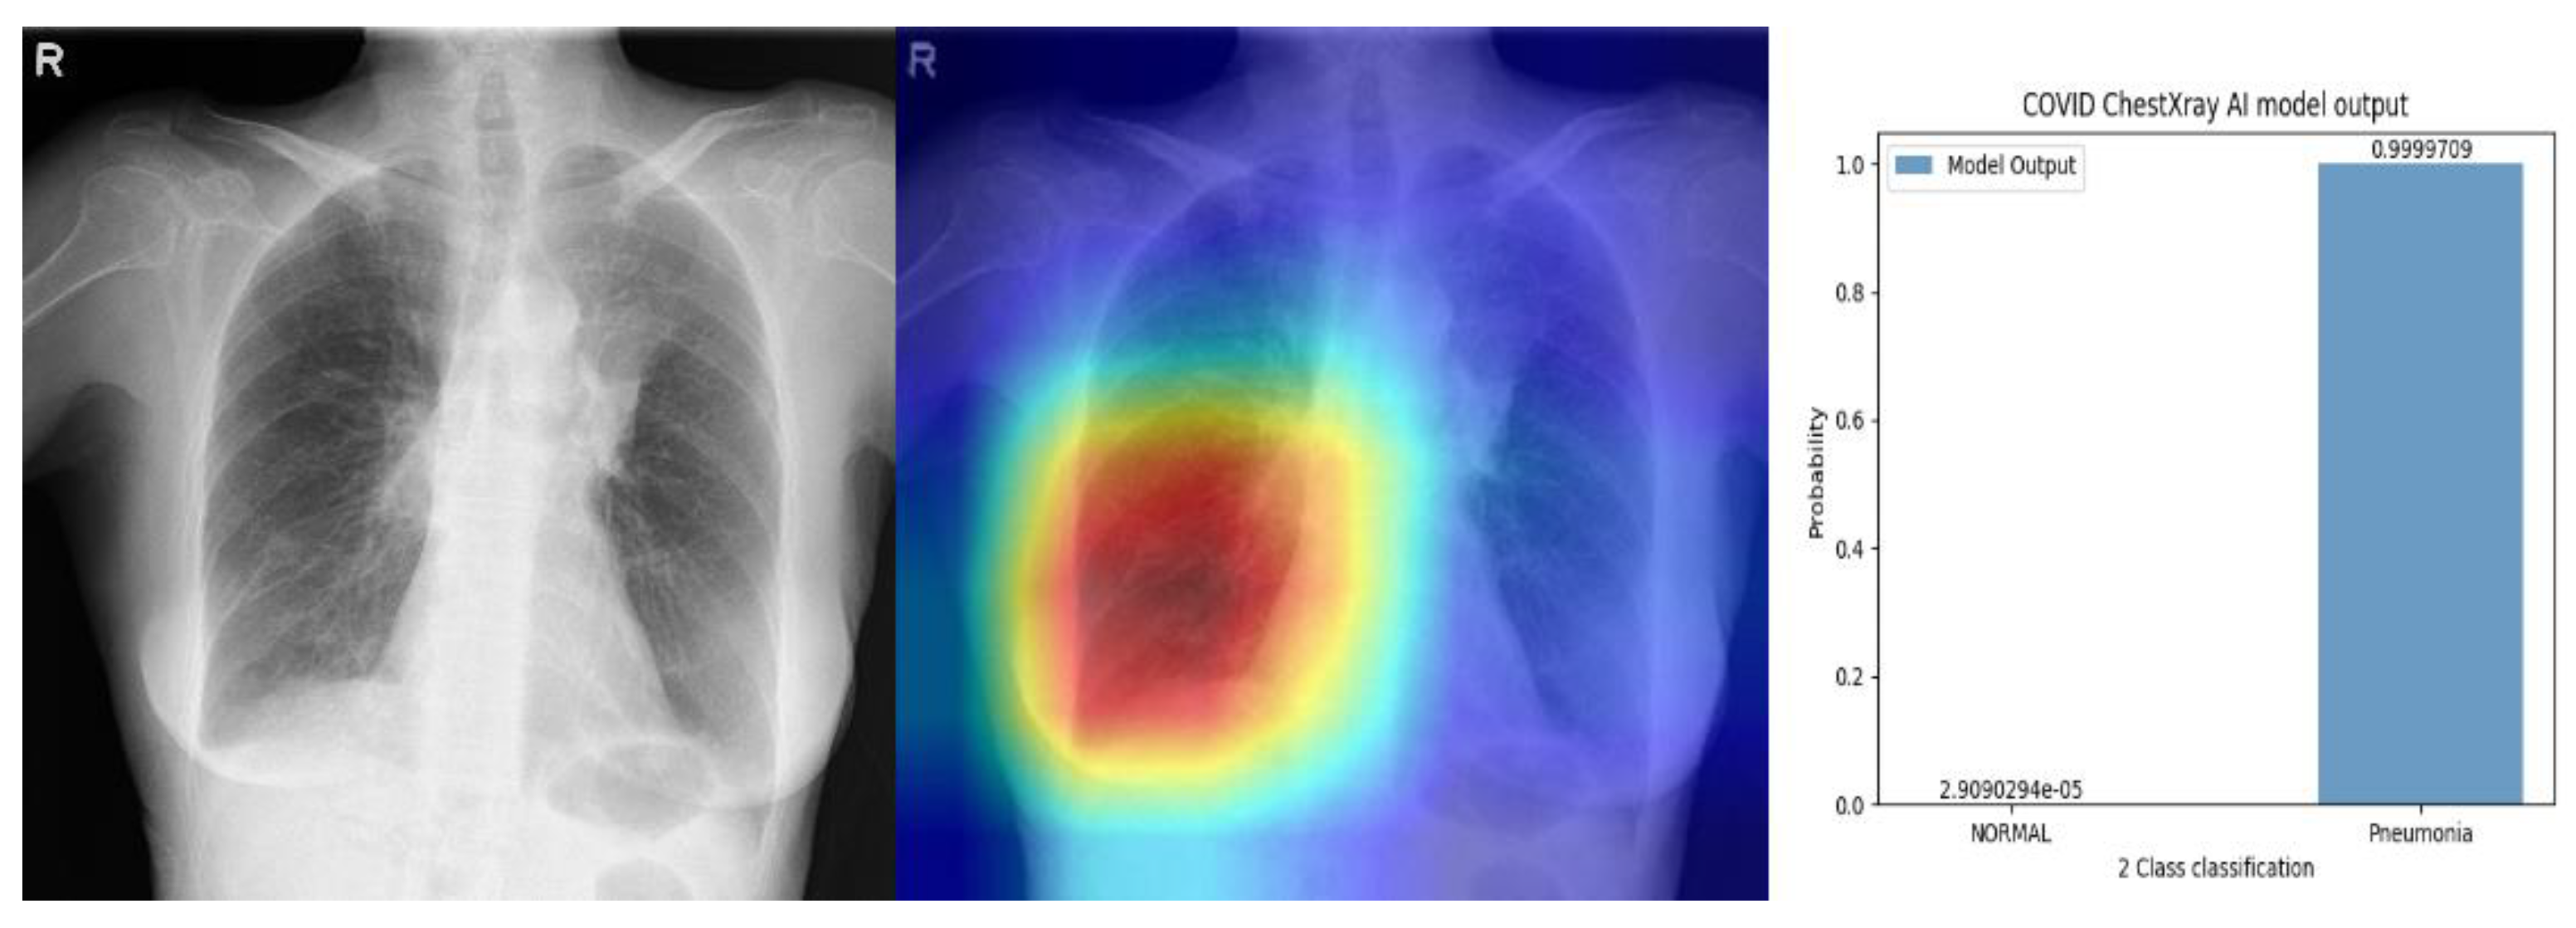
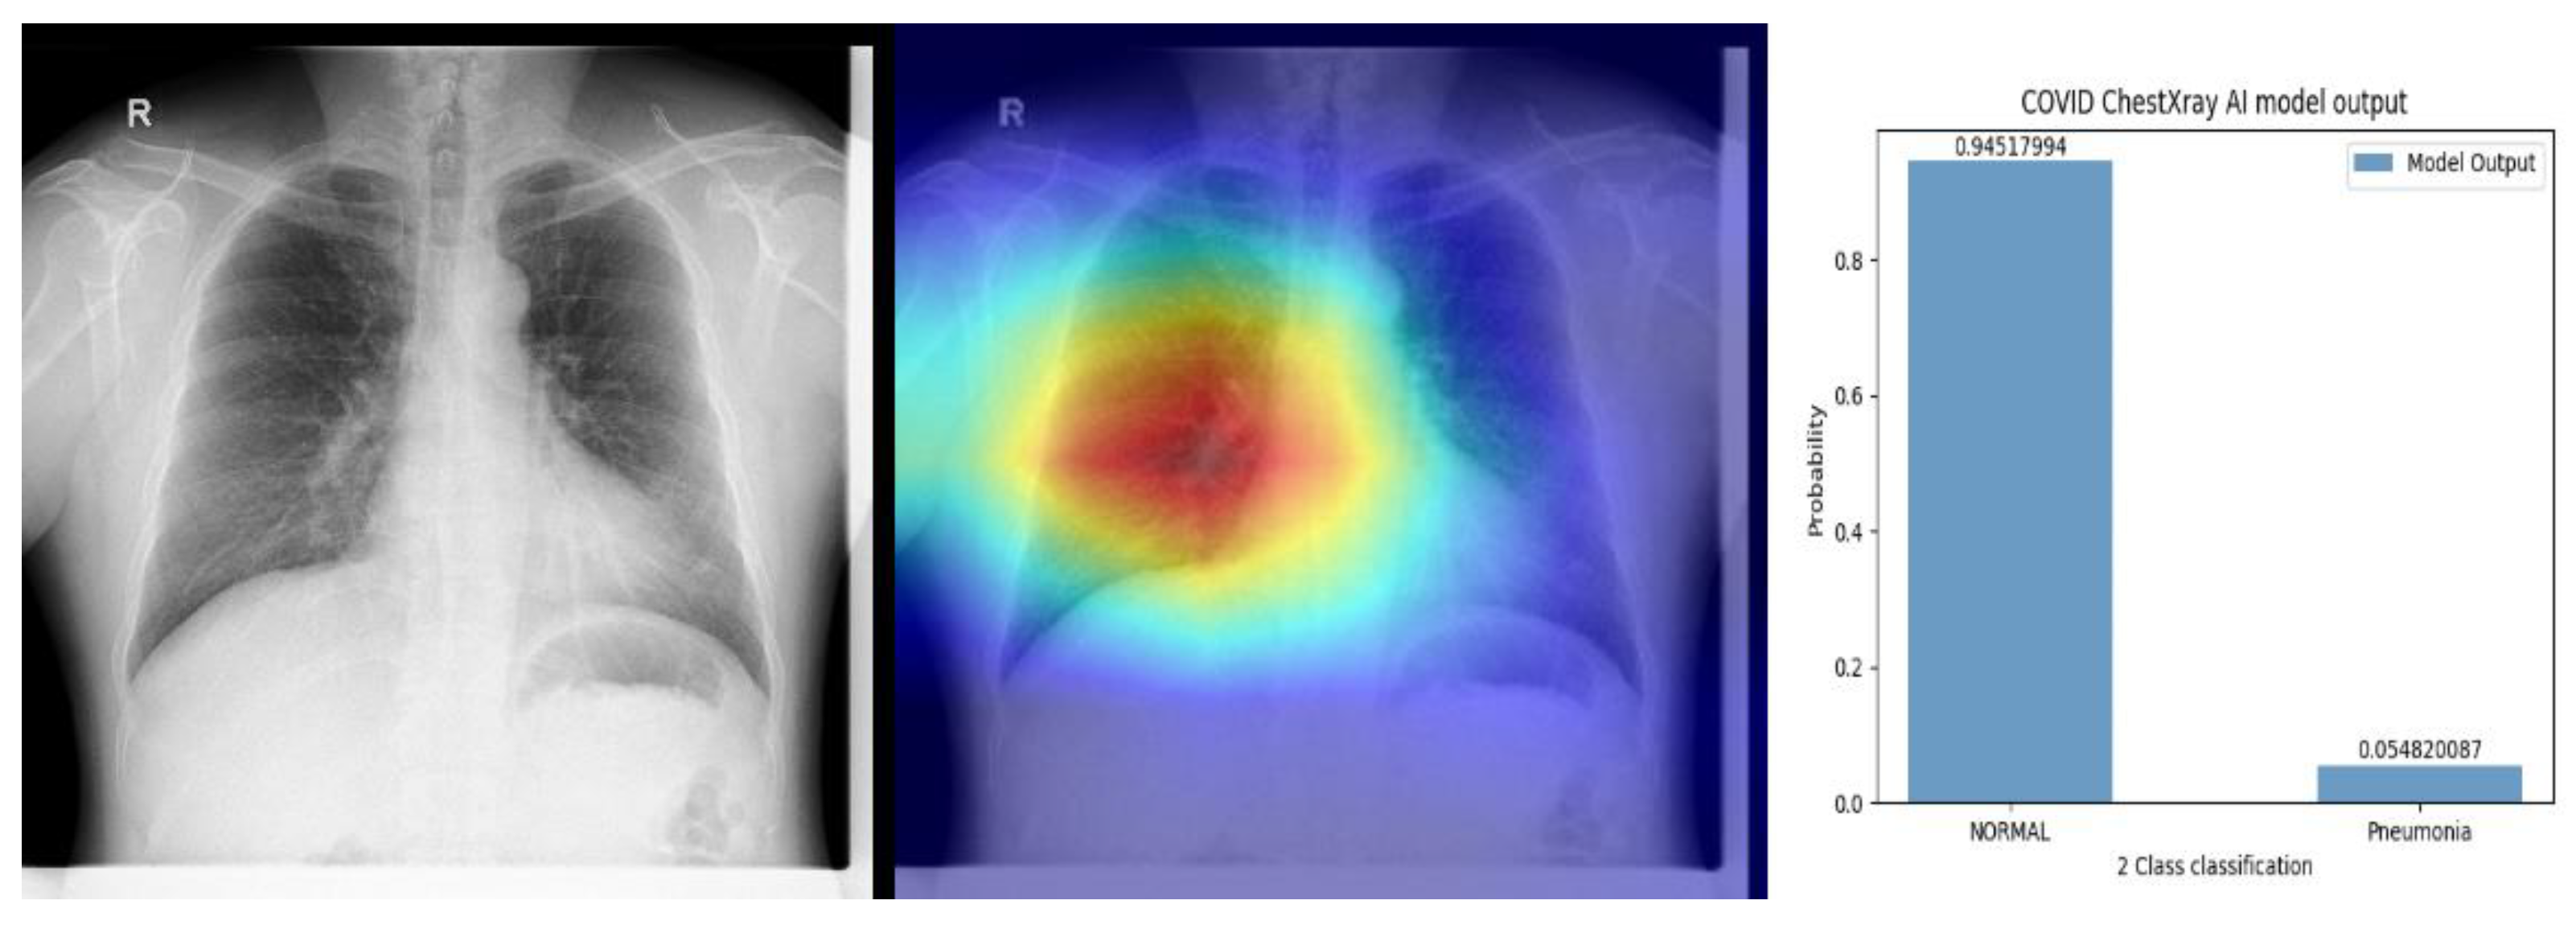
Appendix C. Examples Using Saliency Maps and Probability Output


References
- Chen, N.; Zhou, M.; Dong, X.; Qu, J.; Gong, F.; Han, Y.; Qiu, Y.; Wang, J.; Liu, Y.; Wei, Y.; et al. Epidemiological and clinical characteristics of 99 cases of 2019 novel coronavirus pneumonia in Wuhan, China: A descriptive study. Lancet 2020, 395, 507–513. [Google Scholar] [CrossRef] [Green Version]
- WHO. WHO Director-General’s Opening Remarks at the Media Briefing on COVID-19—11 March 2020. 2020. Available online: https://www.who.int/dg/speeches/detail/who-director-general-s-opening-remarks-at-the-media-briefing-on-covid-19---11-march-2020 (accessed on 2 April 2020).
- Goh, T. Coronavirus: Singapore’s Testing Rate Is Tops in Asean, with Over 1 m Swabs Done, the Straits Times. 2020. Available online: https://www.straitstimes.com/singapore/health/spores-testing-rate-is-tops-in-asean-with-over-1m-swabs-done (accessed on 31 July 2020).
- Tracking Singapore’s COVID-19 Vaccination Progress | The Straits Times, the Straits Times. Available online: https://www.straitstimes.com/multimedia/graphics/2021/06/singapore-covid-vaccination-tracker/index.html?shell (accessed on 18 December 2021).
- Ministry of Health. Updates on COVID-19 (Coronavirus Disease 2019) Local Situation. Available online: https://www.moh.gov.sg/covid-19 (accessed on 26 October 2021).
- Ai, T.; Yang, Z.; Hou, H.; Zhan, C.; Chen, C.; Lv, W.; Tao, Q.; Sun, Z.; Xia, L. Correlation of Chest CT and RT-PCR Testing in Coronavirus Disease 2019 (COVID-19) in China: A Report of 1014 Cases. Radiology 2020, 296, E32–E40. [Google Scholar] [CrossRef] [Green Version]
- Wang, M.; Xia, C.; Huang, L.; Xu, S.; Qin, C.; Liu, J.; Cao, Y.; Yu, P.; Zhu, T.; Zhu, H.; et al. Deep learning-based triage and analysis of lesion burden for COVID-19: A retrospective study with external validation. Lancet Digit Health 2020, 2, e506–e515. [Google Scholar] [CrossRef]
- Jaiswal, A.; Gianchandani, N.; Singh, D.; Kumar, V.; Kaur, M. Classification of the COVID-19 infected patients using DenseNet201 based deep transfer learning. J. Biomol. Struct. Dyn. 2020, 39, 5682–5689. [Google Scholar] [CrossRef]
- Voulodimos, A.; Protopapadakis, E.; Katsamenis, I.; Doulamis, A.; Doulamis, N. Deep learning models for COVID-19 infected area segmentation in CT images. In Proceedings of the 14th PErvasive Technologies Related to Assistive Environments Conference, New York, NY, USA, 29 June 2021–2 July 2021; pp. 404–411. [Google Scholar] [CrossRef]
- Alakus, T.B.; Turkoglu, I. Comparison of deep learning approaches to predict COVID-19 infection. Chaos Solitons Fractals 2020, 140, 110120. [Google Scholar] [CrossRef]
- American College of Radiology. ACR Recommendations for the Use of Chest Radiography and Computed Tomography (CT) for Suspected COVID-19 Infection. 2020. Available online: https://www.acr.org/Advocacy-and-Economics/ACR-Position-Statements/Recommendations-for-Chest-Radiography-and-CT-for-Suspected-COVID19-Infection (accessed on 22 March 2020).
- Zandehshahvar, M.; van Assen, M.; Maleki, H.; Kiarashi, Y.; de Cecco, C.N.; Adibi, A. Toward understanding COVID-19 pneumonia: A deep-learning-based approach for severity analysis and monitoring the disease. Sci. Rep. 2021, 11, 1–10. [Google Scholar] [CrossRef]
- Dayan, I.; Roth, H.R.; Zhong, A.; Harouni, A.; Gentili, A.; Abidin, A.Z.; Liu, A.; Costa, A.B.; Wood, B.J.; Tsai, C.-S.; et al. Federated learning for predicting clinical outcomes in patients with COVID-19. Nat. Med. 2021, 27, 1735–1743. [Google Scholar] [CrossRef]
- Wynants, L.; van Calster, B.; Collins, G.S.; Riley, R.D.; Heinze, G.; Schuit, E.; Bonten, M.M.J.; Dahly, D.L.; Damen, J.A.; Debray, T.P.A.; et al. Prediction models for diagnosis and prognosis of COVID-19: Systematic review and critical appraisal. BMJ 2020, 369, 26. [Google Scholar] [CrossRef] [Green Version]
- Rubin, G.; Ryerson, C.; Haramati, L. The Role of Chest Imaging in Patient Management during the COVID-19 Pandemic: A Multinational Consensus Statement from the Fleischner Society. Radiology 2020, 296, 172–180. [Google Scholar] [CrossRef] [Green Version]
- Revel, M.P.; Parkar, A.P.; Prosch, H.; Silva, M.; Sverzellati, N.; Gleeson, F.; Brady, A. COVID-19 patients and the radiology department—Advice from the European Society of Radiology (ESR) and the European Society of Thoracic Imaging (ESTI). Eur. Radiol. 2020, 30, 4903–4909. [Google Scholar] [CrossRef] [PubMed] [Green Version]
- Hammoudi, K.; Benhabiles, H.; Melkemi, M.; Dornaika, F.; Arganda-Carreras, I.; Collard, D.; Scherpereel, A. Deep Learning on Chest X-ray Images to Detect and Evaluate Pneumonia Cases at the Era of COVID-19. J. Med. Syst. 2020, 45, 75. Available online: https://arxiv.org/abs/2004.03399v1 (accessed on 26 October 2021).
- Al-Waisy, A.S.; Mohammed, M.A.; Al-Fahdawi, S.; Maashi, M.S.; Garcia-Zapirain, B.; Abdulkareem, K.H.; Mostafa, S.A.; Kumar, N.M.; Le, D.N. COVID-DeepNet: Hybrid Multimodal Deep Learning System for Improving COVID-19 Pneumonia Detection in Chest X-ray Images. Comput. Mater. Contin. 2021, 67, 2409–2429. [Google Scholar] [CrossRef]
- Nayak, S.R.; Nayak, D.R.; Sinha, U.; Arora, V.; Pachori, R.B. Application of deep learning techniques for detection of COVID-19 cases using chest X-ray images: A comprehensive study. Biomed. Signal Process. Control. 2021, 64, 102365. [Google Scholar] [CrossRef] [PubMed]
- Zhang, J.; Xie, Y.; Li, Y.; Shen, C.; Xia, Y. COVID-19 Screening on Chest X-ray Images Using Deep Learning based Anomaly Detection. arXiv 2020, arXiv:2003.12338. [Google Scholar]
- Borkowski, A.; Viswanadhan, N.; Thomas, B.; Guzman, R.D.; Deland, L.A.; Mastorides, S.M. Using Artificial Intelligence for COVID-19 Chest X-ray Diagnosis. Fed. Pract. 2020, 19, 398–404. [Google Scholar] [CrossRef] [PubMed]
- Basu, S.; Mitra, S.; Saha, N. Deep Learning for Screening COVID-19 using Chest X-ray Images. In Proceedings of the 2020 IEEE Symposium Series on Computational Intelligence (SSCI), Canberra, ACT, Australia, 1–4 December 2020; pp. 2521–2527. [Google Scholar] [CrossRef]
- Yoo, S.H.; Geng, H.; Chiu, T.L.; Yu, S.K.; Cho, D.C.; Heo, J.; Choi, M.S.; Choi, I.H.; Van, C.C.; Nhung, N.V.; et al. Deep Learning-Based Decision-Tree Classifier for COVID-19 Diagnosis from Chest X-ray Imaging. Front. Med. 2020, 7, 427. [Google Scholar] [CrossRef]
- Kitamura, G.; Deible, C. Retraining an open-source pneumothorax detecting machine learning algorithm for improved performance to medical images. Clin. Imaging. 2020, 61, 15–19. [Google Scholar] [CrossRef]
- Cleverley, J.; Piper, J.; Jones, M.M. The role of chest radiography in confirming COVID-19 pneumonia. BMJ 2020, 370, m2426. [Google Scholar] [CrossRef]
- Horry, M.J.; Chakraborty, S.; Paul, M.; Ulhaq, A.; Pradhan, B.; Saha, M.; Shukla, N. COVID-19 Detection through Transfer Learning Using Multimodal Imaging Data. IEEE Access 2020, 8, 149808–149824. [Google Scholar] [CrossRef]
- Maghdid, H.S.; Asaad, A.T.; Ghafoor, K.Z.; Sadiq, A.S.; Khan, M.K. Diagnosing COVID-19 Pneumonia from X-ray and CT Images using Deep Learning and Transfer Learning Algorithms. arXiv 2020, arXiv:2004.00038. [Google Scholar]
- Thrun, S.; Pratt, L. Learning to Learn; Springer Science & Business Media: Berlin/Heidelberg, Germany, 2012. [Google Scholar]
- Torrey, L.; Shavlik, J. Handbook of Research on Machine Learning Applications and Trends: Algorithms, Methods, and Techniques; IGI Global: Hershey, PA, USA, 2010. [Google Scholar]
- Huang, G.; Weinberger, K.Q. Densely Connected Convolutional Networks. arXiv 2016, arXiv:1608.06993. [Google Scholar]
- Wang, X.; Peng, Y.; Lu, L.; Lu, Z.; Bagheri, M.; Summers, R.M. ChestX-ray8: Hospital-scale Chest X-ray Database and Benchmarks on Weakly-Supervised Classification and Localization of Common Thorax Diseases. Proc. IEEE Conf. Comput. Vis. Pattern Recognit. 2017. arXiv2017, arXiv:1705.02315.
- Yang, W.; Sirajuddin, A.; Zhang, X.; Liu, G.; Teng, Z.; Zhao, S. The role of imaging in 2019 novel coronavirus pneumonia (COVID-19). Eur. Radiol. 2020, 15, 1–9. [Google Scholar] [CrossRef] [PubMed] [Green Version]
- Manauis, C.M.; Loh, M.; Kwan, J.; Mingzhou, J.C.; Teo, H.J.; Peng, D.T.K.; Sushilan, S.V.; Leo, Y.S.; Hou, A. Bracing for impact: Operational upshots from the National Centre for Infectious Diseases Screening Centre (Singapore) during the COVID-19 outbreak. J. Am. Coll. Emerg. Phys. Open. 2020, 19, 549–556. [Google Scholar] [CrossRef]
- DiCicio, T.J.; Efron, B. Bootstrap confidence intervals. Stat. Sci. 1996, 11, 189–228. [Google Scholar] [CrossRef]
- Oh, Y.; Park, S.; Ye, J.C. Deep Learning COVID-19 Features on CXR using Limited Training Data Sets. IEEE Trans. Med. Imaging 2020, 39, 2688–2700. [Google Scholar] [CrossRef] [PubMed]
- Chen, K.; Wang, J.; Pang, J.; Cao, Y.; Xiong, Y.; Li, X.; Zhu, C.; Cheng, T.; Zhao, Q.; Li, B.; et al. MMDetection: Open MMLab Detection Toolbox and Benchmark. arXiv 2019, arXiv:1906.07155v1. [Google Scholar]
- Ozturk, T.; Talo, M.; Yildirim, E.A.; Baloglu, U.B.; Yildirim, O.; Acharya, U.R. Automated detection of COVID-19 cases using deep neural networks with X-ray images. Comput. Biol. Med. 2020, 121, 103792. [Google Scholar] [CrossRef]
- Minaee, S.; Kafieh, R.; Sonka, M.; Yazdani, S.; Soufi, G.J. Deep-COVID: Predicting COVID-19 from chest X-ray images using deep transfer learning. Med. Image Anal. 2020, 65, 101794. [Google Scholar] [CrossRef]
- Torjesen, I. COVID-19: Delta variant is now UK’s most dominant strain and spreading through schools. BMJ 2021, 373, n1445. [Google Scholar] [CrossRef]
- Bolze, A.; Cirulli, E.T.; Luo, S.; White, S.; Cassens, T.; Jacobs, S.; Nguyen, J.; Iii, J.M.R.; Sandoval, E.; Wang, X.; et al. Rapid displacement of SARS-CoV-2 variant B.1.1.7 by B.1.617.2 and P.1 in the United States. MedRxiv 2021, 2021.06.20.21259195. [Google Scholar] [CrossRef]
- Yasin, R.; Gouda, W. Chest X-ray findings monitoring COVID-19 disease course and severity. Egypt. J. Radiol. Nucl. Med. 2020, 51, 193. [Google Scholar] [CrossRef]
- Bernheim, A.; Mei, X.; Huang, M.; Yang, Y.; Fayad, Z.A.; Zhang, N.; Diao, K.; Lin, B.; Xiqi, Z.; Li, K.; et al. Chest CT findings in Coronavirus Disease 2019 (COVID-19): Relationship to Duration of Infection. Radiology 2020, 295, 685–691. [Google Scholar] [CrossRef] [Green Version]
- Prokop, M.; van Everdingen, W.; Vellinga, T.V.; van Ufford, H.Q.; Stöger, L.; Beenen, L.; Geurts, B.; Gietema, H.; Krdzalic, J.; Schaefer-Prokop, C.; et al. CO-RADS: A Categorical CT Assessment Scheme for Patients Suspected of Having COVID-19-Definition and Evaluation. Radiology 2020, 296, E97–E104. [Google Scholar] [CrossRef] [PubMed]
- Murphy, K.; Smits, H.; Knoops, A.J.; Korst, M.B.; Samson, T.; Scholten, E.T.; Schalekamp, S.; Schaefer-Prokop, C.M.; Philipsen, R.H.; Meijers, A. COVID-19 on the Chest Radiograph: A Multi-Reader Evaluation of an AI System. Radiology 2020, 296, 201874. [Google Scholar] [CrossRef]
- Brunese, L.; Mercaldo, F.; Reginelli, A.; Santone, A. Explainable Deep Learning for Pulmonary Disease and Coronavirus COVID-19 Detection from X-rays. Comput. Methods Programs Biomed. 2020, 196, 105608. [Google Scholar] [CrossRef] [PubMed]
- Zhang, R.; Tie, X.; Qi, Z.; Bevins, N.B.; Zhang, C.; Griner, D.; Song, T.K.; Nadig, J.D.; Schiebler, M.L.; Garrett, J.W.; et al. Diagnosis of COVID-19 Pneumonia Using Chest Radiography: Value of Artificial Intelligence. Radiology 2020, 298, 202944. [Google Scholar] [CrossRef]
- Wehbe, R.M.; Sheng, J.; Dutta, S.; Chai, S.; Dravid, A.; Barutcu, S.; Wu, Y.; Cantrell, D.R.; Xiao, N.; Allen, B.D.; et al. DeepCOVID-XR: An artificial intelligence algorithm to detect COVID-19 on chest radiographs trained and tested on a large U.S. Clinical data set. Radiology 2021, 299, E167–E176. [Google Scholar] [CrossRef] [PubMed]
- Bai, H.X.; Wang, R.; Xiong, Z.; Hsieh, B.; Chang, K.; Halsey, K.; Tran, T.M.L.; Choi, J.W.; Wang, D.-C.; Shi, L.-B.; et al. AI Augmentation of Radiologist Performance in Distinguishing COVID-19 from Pneumonia of Other Etiology on Chest CT. Radiology 2020, 296, E156–E165. [Google Scholar] [CrossRef]
- Wong, H.Y.F.; Lam, H.Y.S.; Ho-Tung Fong, A.; Leung, S.T.; Chin, T.W.; Lo, C.S.Y.; Lui, M.M.; Lee, J.C.Y.; Chiu, K.W.; Chung, T.; et al. Frequency and Distribution of Chest Radiographic Findings in COVID-19 Positive Patients. Radiology 2020, 296, E72–E78. [Google Scholar] [CrossRef] [Green Version]
- Salehi, S.; Abedi, A.; Balakrishnan, S.; Gholamrezanezhad, A. Coronavirus disease 2019 (COVID-19): A systematic review of imaging findings in 919 patients. Am. J. Roentgenol. 2020, 215, 87–93. [Google Scholar] [CrossRef] [PubMed]
- Lu, X.; Zhang, L.; Du, H.; Zhang, J.; Li, Y.Y.; Qu, J. SARS-CoV-2 Infection in Children. N. Engl. J. Med. 2020, 382, 1663–1665. Available online: https://www.nejm.org/doi/pdf/10.1056/NEJMc2005073?articleTools=true (accessed on 18 December 2021).
- Kingma, D.P.; Ba, J. Adam: A method for stochastic optimization. arXiv 2014, arXiv:1412.6980. [Google Scholar]
- Rajpurkar, P.; Irvin, J.; Zhu, K.; Yang, B.; Mehta, H.; Duan, T.; Ding, D.; Bagul, A.; Ball, R.L.; Langlotz, C.; et al. CheXNet: Radiologist-Level Pneumonia Detection on Chest X-Rays with Deep Learning. arXiv 2017, arXiv:1711.05225v3. [Google Scholar]
- Lin, T.; Goyal, P.; Girshick, R.; He, K.; Dollar, P. Focal Loss for Dense Object Detection. IEEE Trans. Pattern Anal. Mach. Intell. 2020, 42, 318–327. [Google Scholar] [CrossRef] [PubMed] [Green Version]
- Mason, D.L. Pydicom: An Open Source DICOM Library. 2008. Available online: https://github.com/pydicom/pydicom (accessed on 18 December 2021).


| Model | 1 | 2 | 3 | 4 | 5 | 6 | 7 | Ensemble |
|---|---|---|---|---|---|---|---|---|
| AUC | 0.9185 | 0.9120 | 0.9355 | 0.9265 | 0.9163 | 0.9286 | 0.8976 | 0.9369 |
| F1 | 0.8835 | 0.8587 | 0.8938 | 0.8867 | 0.8906 | 0.8981 | 0.8558 | 0.9120 |
| ROC AUC | Max F1 Score | |
|---|---|---|
| Oh et al. (Patch-based) [35] | 0.9144 | 0.8544 |
| Chen et al. (MMDetection) [36] | 0.8685 | 0.8110 |
| Ozturk et al. (Darknet) [37] | 0.9051 | 0.8344 |
| Minaee et al. (SqueezeNet) [38] | 0.9002 | 0.8464 |
| Best performing single DenseNet121 network | 0.9355 | 0.8981 |
| Ensemble of seven models | 0.9369 | 0.9120 |
| AI Prediction | Positive | Negative |
|---|---|---|
| Ground Truth | ||
| CXR Positive | 149 | 40 |
| CXR Negative | 103 | 3422 |
Publisher’s Note: MDPI stays neutral with regard to jurisdictional claims in published maps and institutional affiliations. |
© 2022 by the authors. Licensee MDPI, Basel, Switzerland. This article is an open access article distributed under the terms and conditions of the Creative Commons Attribution (CC BY) license (https://creativecommons.org/licenses/by/4.0/).
Share and Cite
Sim, J.Z.T.; Ting, Y.-H.; Tang, Y.; Feng, Y.; Lei, X.; Wang, X.; Chen, W.-X.; Huang, S.; Wong, S.-T.; Lu, Z.; et al. Diagnostic Performance of a Deep Learning Model Deployed at a National COVID-19 Screening Facility for Detection of Pneumonia on Frontal Chest Radiographs. Healthcare 2022, 10, 175. https://0-doi-org.brum.beds.ac.uk/10.3390/healthcare10010175
Sim JZT, Ting Y-H, Tang Y, Feng Y, Lei X, Wang X, Chen W-X, Huang S, Wong S-T, Lu Z, et al. Diagnostic Performance of a Deep Learning Model Deployed at a National COVID-19 Screening Facility for Detection of Pneumonia on Frontal Chest Radiographs. Healthcare. 2022; 10(1):175. https://0-doi-org.brum.beds.ac.uk/10.3390/healthcare10010175
Chicago/Turabian StyleSim, Jordan Z. T., Yong-Han Ting, Yuan Tang, Yangqin Feng, Xiaofeng Lei, Xiaohong Wang, Wen-Xiang Chen, Su Huang, Sum-Thai Wong, Zhongkang Lu, and et al. 2022. "Diagnostic Performance of a Deep Learning Model Deployed at a National COVID-19 Screening Facility for Detection of Pneumonia on Frontal Chest Radiographs" Healthcare 10, no. 1: 175. https://0-doi-org.brum.beds.ac.uk/10.3390/healthcare10010175