Article

The Prevalence of Vitamin and Mineral Deficiencies and High Levels of Non-Essential Heavy Metals in Saudi Arabian Adults

by
Omar Albalawi
1,*,
Rasha Almubark
1,
Abdulrahman Almarshad
2 and
Amani S. Alqahtani
1
1
Research & Studies, Saudi Food and Drug Authority, Riyadh 13513, Saudi Arabia
2
Project Management Office, Saudi Food and Drug Authority, Riyadh 13513, Saudi Arabia
*
Author to whom correspondence should be addressed.
Submission received: 16 October 2022 / Revised: 21 November 2022 / Accepted: 22 November 2022 / Published: 30 November 2022
(This article belongs to the Special Issue Nutrition and Public Health 2.0)

Abstract

:
Although the micronutrient status of a population is of high national priority, as it critically impacts public health, limited data is available for quantifying the micronutrient status in Saudi Arabia. We aimed to provide comprehensive, epidemiological, descriptive data regarding micronutrient levels in Saudi adults. This cross-sectional study included 3432 adults aged ≥18 years (mean age, 37.7 ± 11.7 years; women, 51.2%) across all 13 Saudi administrative regions (March 2019–November 2021). Laboratory data for 14 micronutrients (8 vitamins, 4 minerals, and 2 nonessential heavy metals) were characterized using descriptive analysis. Vitamin D deficiency (64.3%) was the most prevalent, followed by vitamin B2 (44.9%) and A (9.6%) deficiencies. Among minerals, iron deficiency was the most prevalent (23.2%), followed by zinc (15.3%) and copper (8.7%) deficiencies. Most Saudi adults exhibited normal arsenic (99.7%) and mercury (99.9%) levels. Men exhibited significantly higher vitamin B2, B9, and D deficiencies than women, while women exhibited higher vitamin A, B12, iron, and zinc deficiencies than men. Younger adults demonstrated a significantly higher prevalence of vitamin D and iron deficiencies, whereas older adults exhibited a higher prevalence of vitamin B1 and magnesium deficiencies. As micronutrient deficiencies are a public health concern, health policies and programs need to be developed and implemented to address them.

1. Introduction

Micronutrients comprise a major nutrient group, representing vitamins and minerals [1]. They act as cofactors, optimizing health and preventing or treating diseases [2]. The nutritional status of a micronutrient is determined using a continuum scale ranging from deficiency to excess [3,4,5]. Micronutrient deficiencies, also called hidden hunger, are more common than their excess (i.e., toxicities), approximately affecting two billion people worldwide [4]. The most common micronutrient deficiencies include those of iron, iodine, folate (vitamin B9), vitamin A, zinc, and, to a lesser extent, vitamin B12 and other B vitamins [6]. Poor dietary habits constitute the primary factor that can precipitate micronutrient deficiencies [4]. Micronutrient deficiencies are associated with several health conditions and can be detrimental to health if left untreated [1,4].
Furthermore, alongside micronutrient deficiencies, heavy metal exposure in high doses might have harmful effects on humans, which is a major global health concern [7]. Arsenic and mercury are well-known toxic nonessential heavy metals, exhibiting either acute or chronic toxicity [8]. Arsenic-contaminated groundwater is found worldwide, with the highest prevalence in Asia [9,10]. In Saudi Arabia, the consumption of rice irrigated with arsenic-contaminated groundwater [9] constitutes the primary risk factor for arsenic exposure [11]. Mercury is one of the top 10 chemicals associated with significant public health concerns [12]. Fish consumption is a critical source of human exposure to mercury alongside dental amalgam use or occupational exposure [12,13]. A previous study reported that consuming fish from the Red Sea and Arabian Gulf potentially poses a health risk because of mercury bioaccumulation [14]
Research regarding the prevalence of micronutrient deficiencies in Saudi adults appears limited, mainly focusing on vitamin D [15]. To the best of our knowledge, only one study has been conducted at the national level in Saudi Arabia, which used a cutoff of ≤28 ng/mL for vitamin D (25[O.H.]D) deficiency and found an overall vitamin D deficiency among 62.65% and 40.6% of females and males aged 15 years and older, respectively [16]. Thus, national studies examining micronutrient status and heavy metal levels among the Saudi population are sparse.
This study aimed to provide a comprehensive, epidemiological, descriptive overview of the micronutrient status of Saudi adults, examining several vitamins (A, B1, B2, B6, B9, B12, D, and E) and minerals (copper, zinc, magnesium, and iron). Furthermore, we assessed the levels of two well-known toxic heavy metals, arsenic, and mercury, in the Saudi Arabian population. These insights could provide holistic evidence for the present burden of vitamin and mineral deficiencies and heavy metal levels among Saudi adults and aid policymakers in developing early interventions to tackle these issues.

2. Materials and Methods

2.1. Study Design

This nationwide cross-sectional study included Saudi adults (≥18 years of age) living across the 13 administrative regions of Saudi Arabia (Riyadh, Makkah Al Mukaramah, Eastern Region, Northern Borders, Madinah, Jezan, Asir, Najran, Qassim, Tabuk, Hail, Al-Jouf, and Al-Baha) and was conducted between September 2019 and June 2021, with interruptions in data collection from March to November 2020 because of the COVID-19 pandemic.

2.2. Sampling and Sample Size

The quota sampling technique was used to achieve an equal distribution of respondents. The participants were stratified by age based on the Saudi Arabia median age of 37 years [17]. Following additional stratification by sex (men and women), a total of 52 quotas were created for this study (i.e., 4 quotas in each administrative region). The sample size was determined based on a medium effect size of ~0.3, with 80% power and a 95% confidence interval. Thus, each quota comprised a sample size of 68 participants, and the total targeted sample was 3536 participants.

2.3. Participants and Recruitment Method

The following eligibility criteria were applied: age (≥18 years of age), residency status (currently living in Saudi Arabia), and citizenship status (i.e., Saudi Arabian citizen).
A list of random phone numbers based on age and sex information derived from different governmental databases was generated to ensure sample size diversity. A trained data collection team recruited the participants via a phone call survey using a computer-assisted telephone interview to determine the respondents who fit in the stratum quota, who were then invited to complete the study.
The eligible participants were recruited through two phases: phase I (survey) and phase II (laboratory measurements).

2.3.1. Phase I (Survey)

A research team comprising a nutritionist, pharmacist, and public health expert developed the questionnaire used in this study. The questionnaire was then reviewed and revised by other experts (a clinical laboratory technician and a medical doctor). Linguistic validation was performed with a focus group comprising 15 participants, who were selected from different backgrounds to ensure the clarity, intelligibility, and appropriateness as well as the cultural relevance of the study questions. In addition, a pilot study was conducted among 100 participants to test the entire study protocol and questionnaire design, which were updated accordingly.
Once selected, the individuals were contacted, and verbal consent was obtained. The participants were asked to provide their demographic information (nationality, age, sex, and region) to confirm the participant met the eligibility requirements. Subsequently, the interviewer delivered a structured questionnaire including questions regarding tobacco use status, diagnosed chronic conditions, and dietary supplement and medication use. Respondents were considered tobacco users if they participated in any form of nicotine smoking (cigarettes, water pipes, or e-cigarettes) and were classified as current smokers, former smokers, or never smoked.
For participants with chronic diseases lasting 1 year or more and requiring ongoing medical attention, morbidity was classified based on the four primary chronic disease categories defined by the World Health Organization (WHO): cardiovascular diseases (such as heart disease or stroke), cancers, chronic respiratory diseases, and diabetes [18]. In addition, we considered chronic mental health conditions (depression), similar to previous national studies [19]. Hence, health conditions were classified into three mutually exclusive groups (no condition, one condition, and more than two conditions).

2.3.2. Phase II (Laboratory Measurements)

Within 3 days of completing the survey, a blood test was performed for each participant, for which they were referred to contracted medical laboratories across the nation. For this phase, a written consent form was obtained from each participant. Blood samples were collected from the median cubital and cephalic veins and tested for serum vitamin (A, B1, B2, B6, B9, D, and E), mineral (copper, ferritin, manganese, and zinc), and heavy metal (arsenic and mercury) levels. The results of each test item for vitamins and minerals were categorized as deficient or not deficient based on the reference range of each item. The laboratory findings of heavy metal levels were categorized as normal or level (Appendix A Table A1).

2.4. Data Analysis

All continuous biomarkers presented here were dichotomized as deficient or not deficient based on the baseline reference range for descriptive purposes (Appendix A Table A1). Chi-squared tests were used to compare the prevalence of micronutrient outcomes between sex and age groups. The calculated p-values were two-tailed, and p < 0.05 was considered significant. Fisher’s exact tests were used for any expected values less than one. A poststratification adjustment was performed based on 2018 Saudi Arabia census data defined by administrative regions, ensuring that the joint distribution of regions in the weighted sample matched the known Saudi Arabian population’s joint distribution [17]. Data analyses were performed using the Statistical Package for Social Sciences (SPSS, Armonk, NY, USA).

2.5. Ethical Considerations

This study was approved by the Institutional Review Board of the Saudi Food & Drug Authority (SFDA) (approval no. 0008-19). Verbal consent to participate was obtained during study phase I, and written consent was obtained during study phase II.

3. Results

3.1. Demographic and Health Characteristics

Overall, 3432 adults were recruited across the 13 regions of Saudi Arabia, of whom 51.2% were women and the mean age was 37.7 ± 11.7 (range: 18–87) years. In total, 20.3% of the participants were current smokers, and 25.2% had used a dietary supplement in the past 7 days. More details about the demographic and health characteristics of the participants are presented in Table 1.

3.2. Prevalence of Micronutrient Deficiencies

3.2.1. Vitamin Deficiencies

The most prevalent vitamin deficiency was that of vitamin D (25 [O.H.] D) (64.3%) at ≤20 ng/mL, followed by vitamin B2 (44.8%) and vitamin A (9.6%). The lowest vitamin deficiency reported was that of vitamin B1 (2.3%), followed by vitamin B6 (2.4%) and vitamin B9 (3.5%) deficiencies (Table 2).

Vitamin Deficiencies by Sex

Vitamin D deficiency prevalence was higher in men (68.2%) than in women (59.2%), similar to vitamin B2 deficiency (Table 2). Conversely, vitamin A deficiency was more common among women than men (10.7% and 4.8%, respectively).

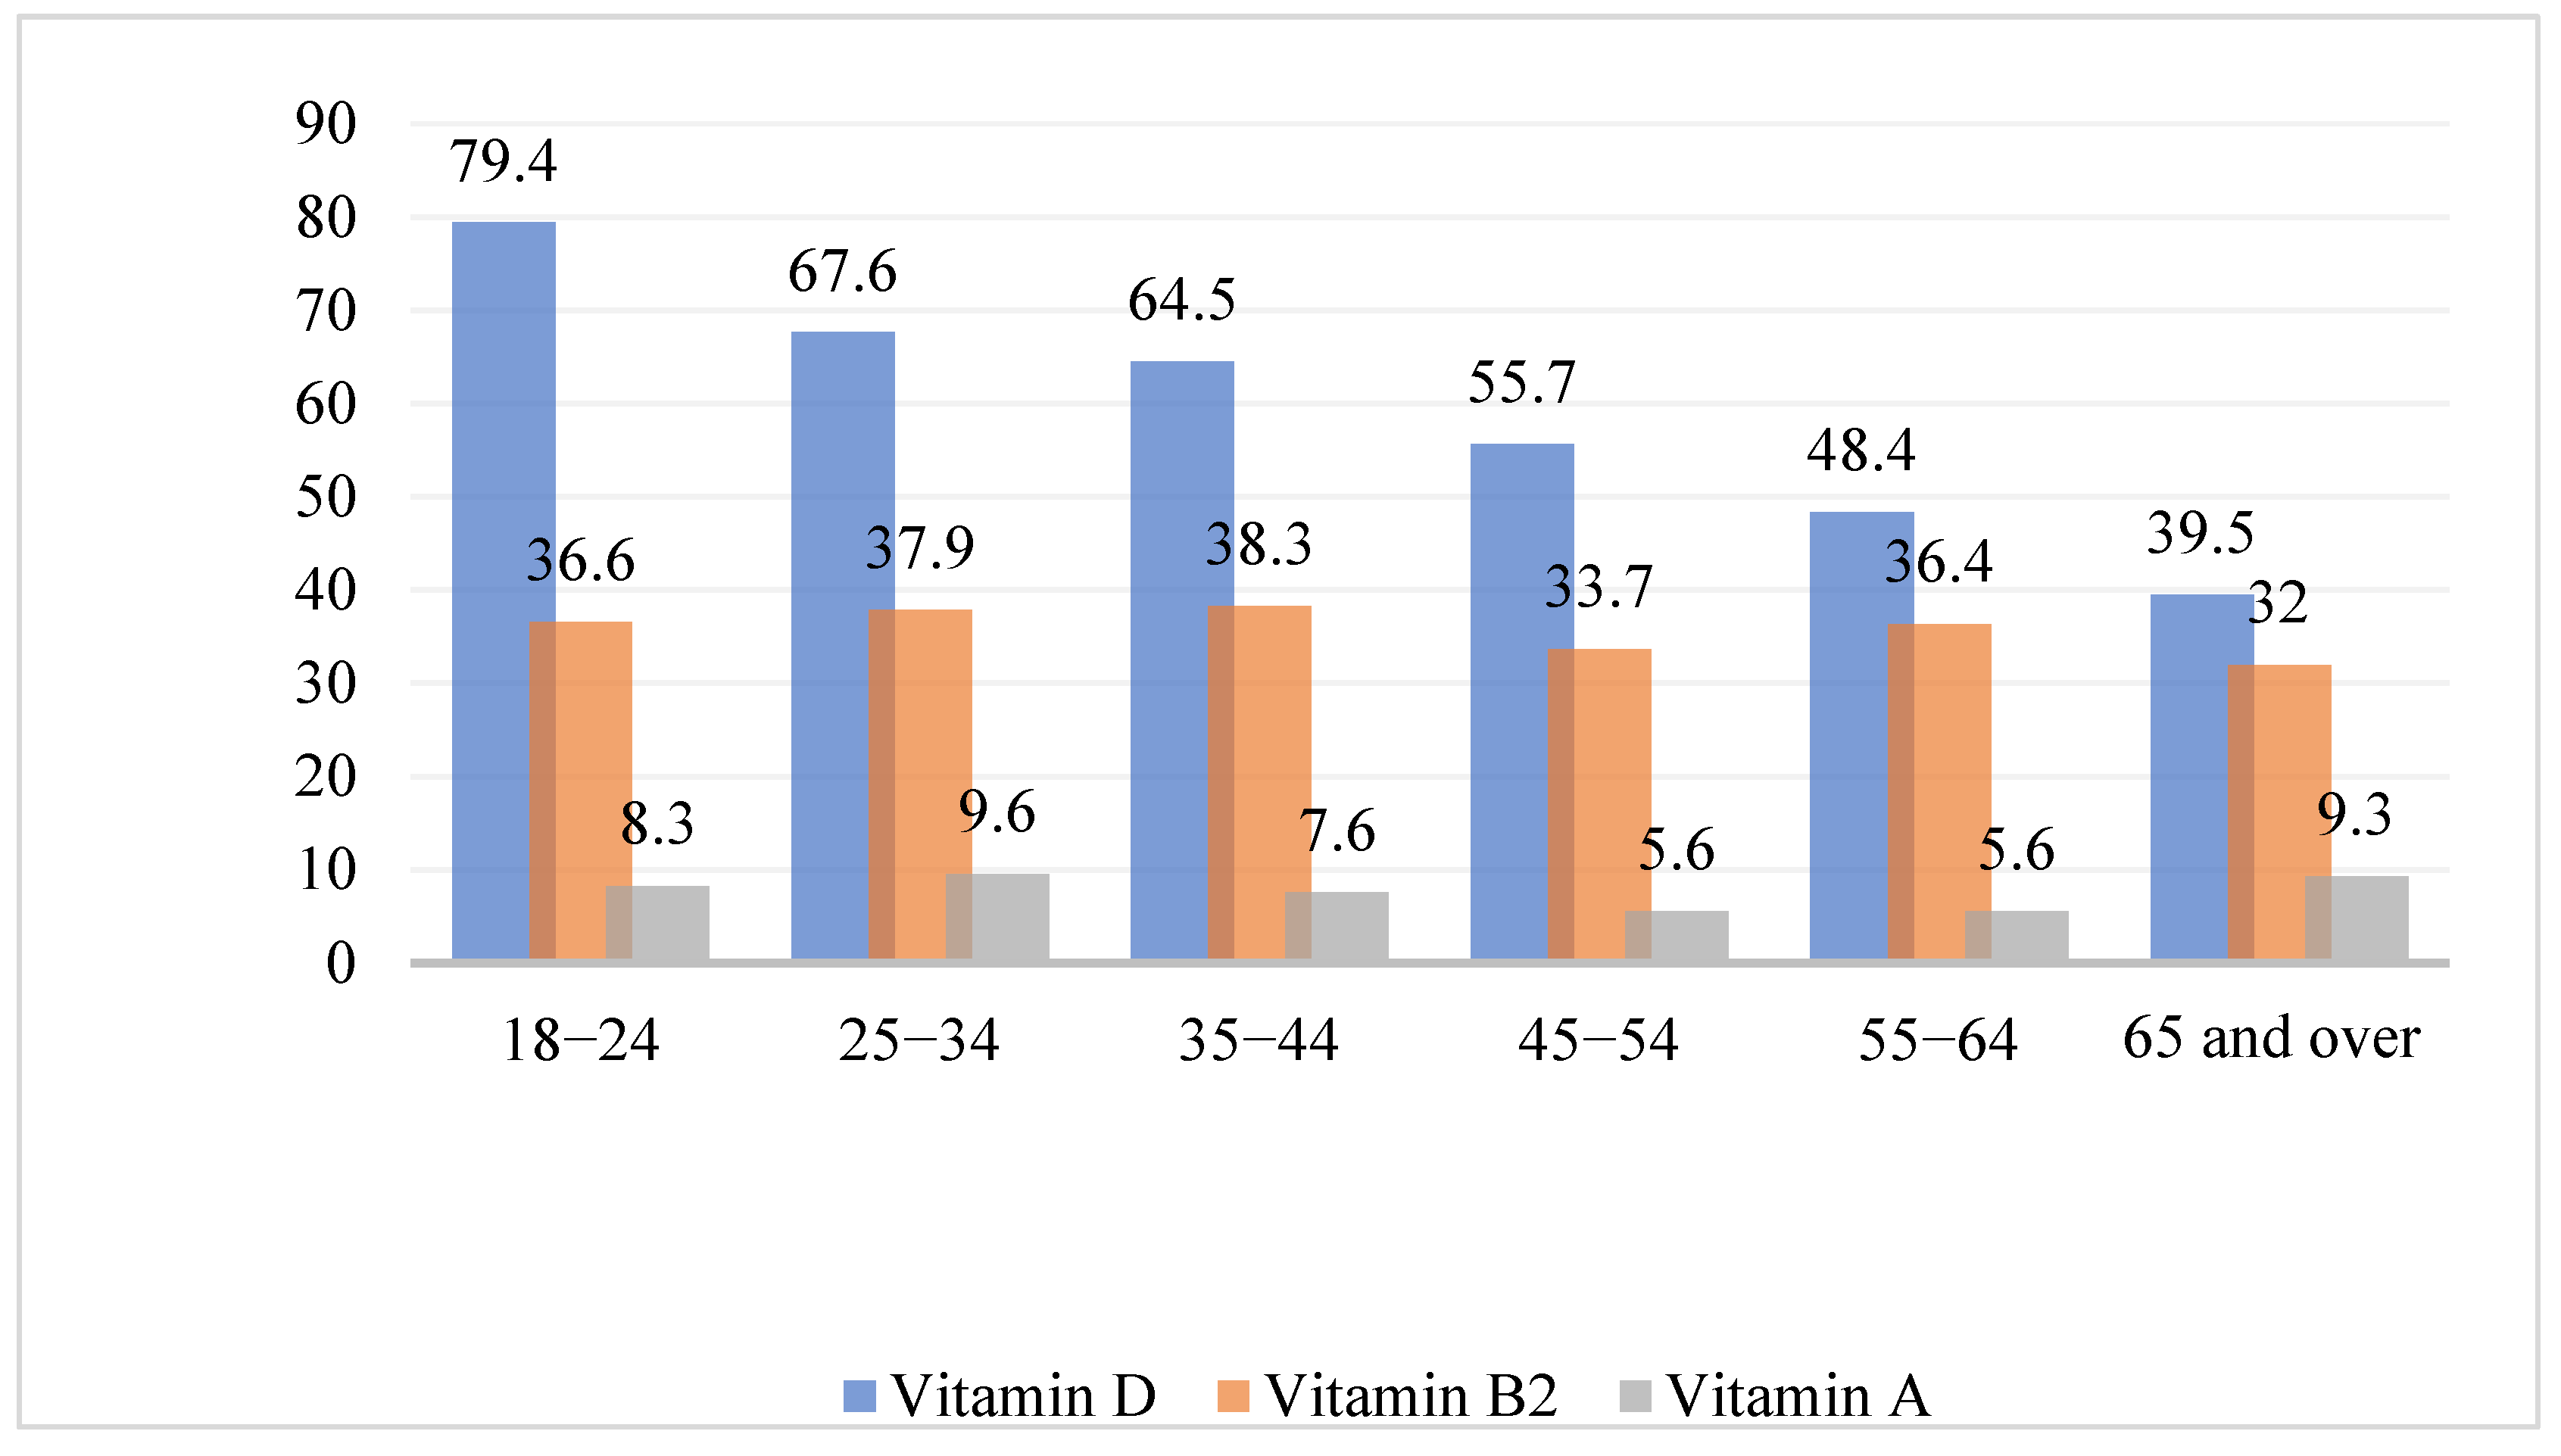
Vitamin Deficiencies by Age Group

Those in the 18–24- and 25–34-years age groups exhibited the highest prevalence of vitamin D deficiency (79.4% and 67.5%, respectively; Figure 1). Age differences were also observed in vitamin B1 deficiency, with the highest reported prevalence among those in the 35–44-years age group (4.6%), followed by the 25–34-years age group (3.0%), while the lowest prevalence was observed in the ≥65-years age group (1.3%). This difference was significant (p < 0.048). Age differences in the prevalence and patterns of the other vitamins were nonsignificant (Appendix A Table A2).

3.2.2. Mineral Deficiencies

In terms of the nutritional status of minerals, iron deficiency was the most prevalent (23.2%), followed by zinc (15.3%) and copper (8.7%) deficiencies (Table 3). Most participants exhibited normal magnesium levels (0.96%).

Mineral Deficiencies by Sex

Iron deficiency prevalence was significantly higher in women (39.2%) than in men (11.3%) (p < 0.001). Similar sex differences were observed for zinc deficiency, which was higher in women than in men (14.5% vs. 8.9%, p < 0.001). However, copper deficiency was more common in men than in women (12.6% vs. 4.9%; p < 0.001) (Table 4).

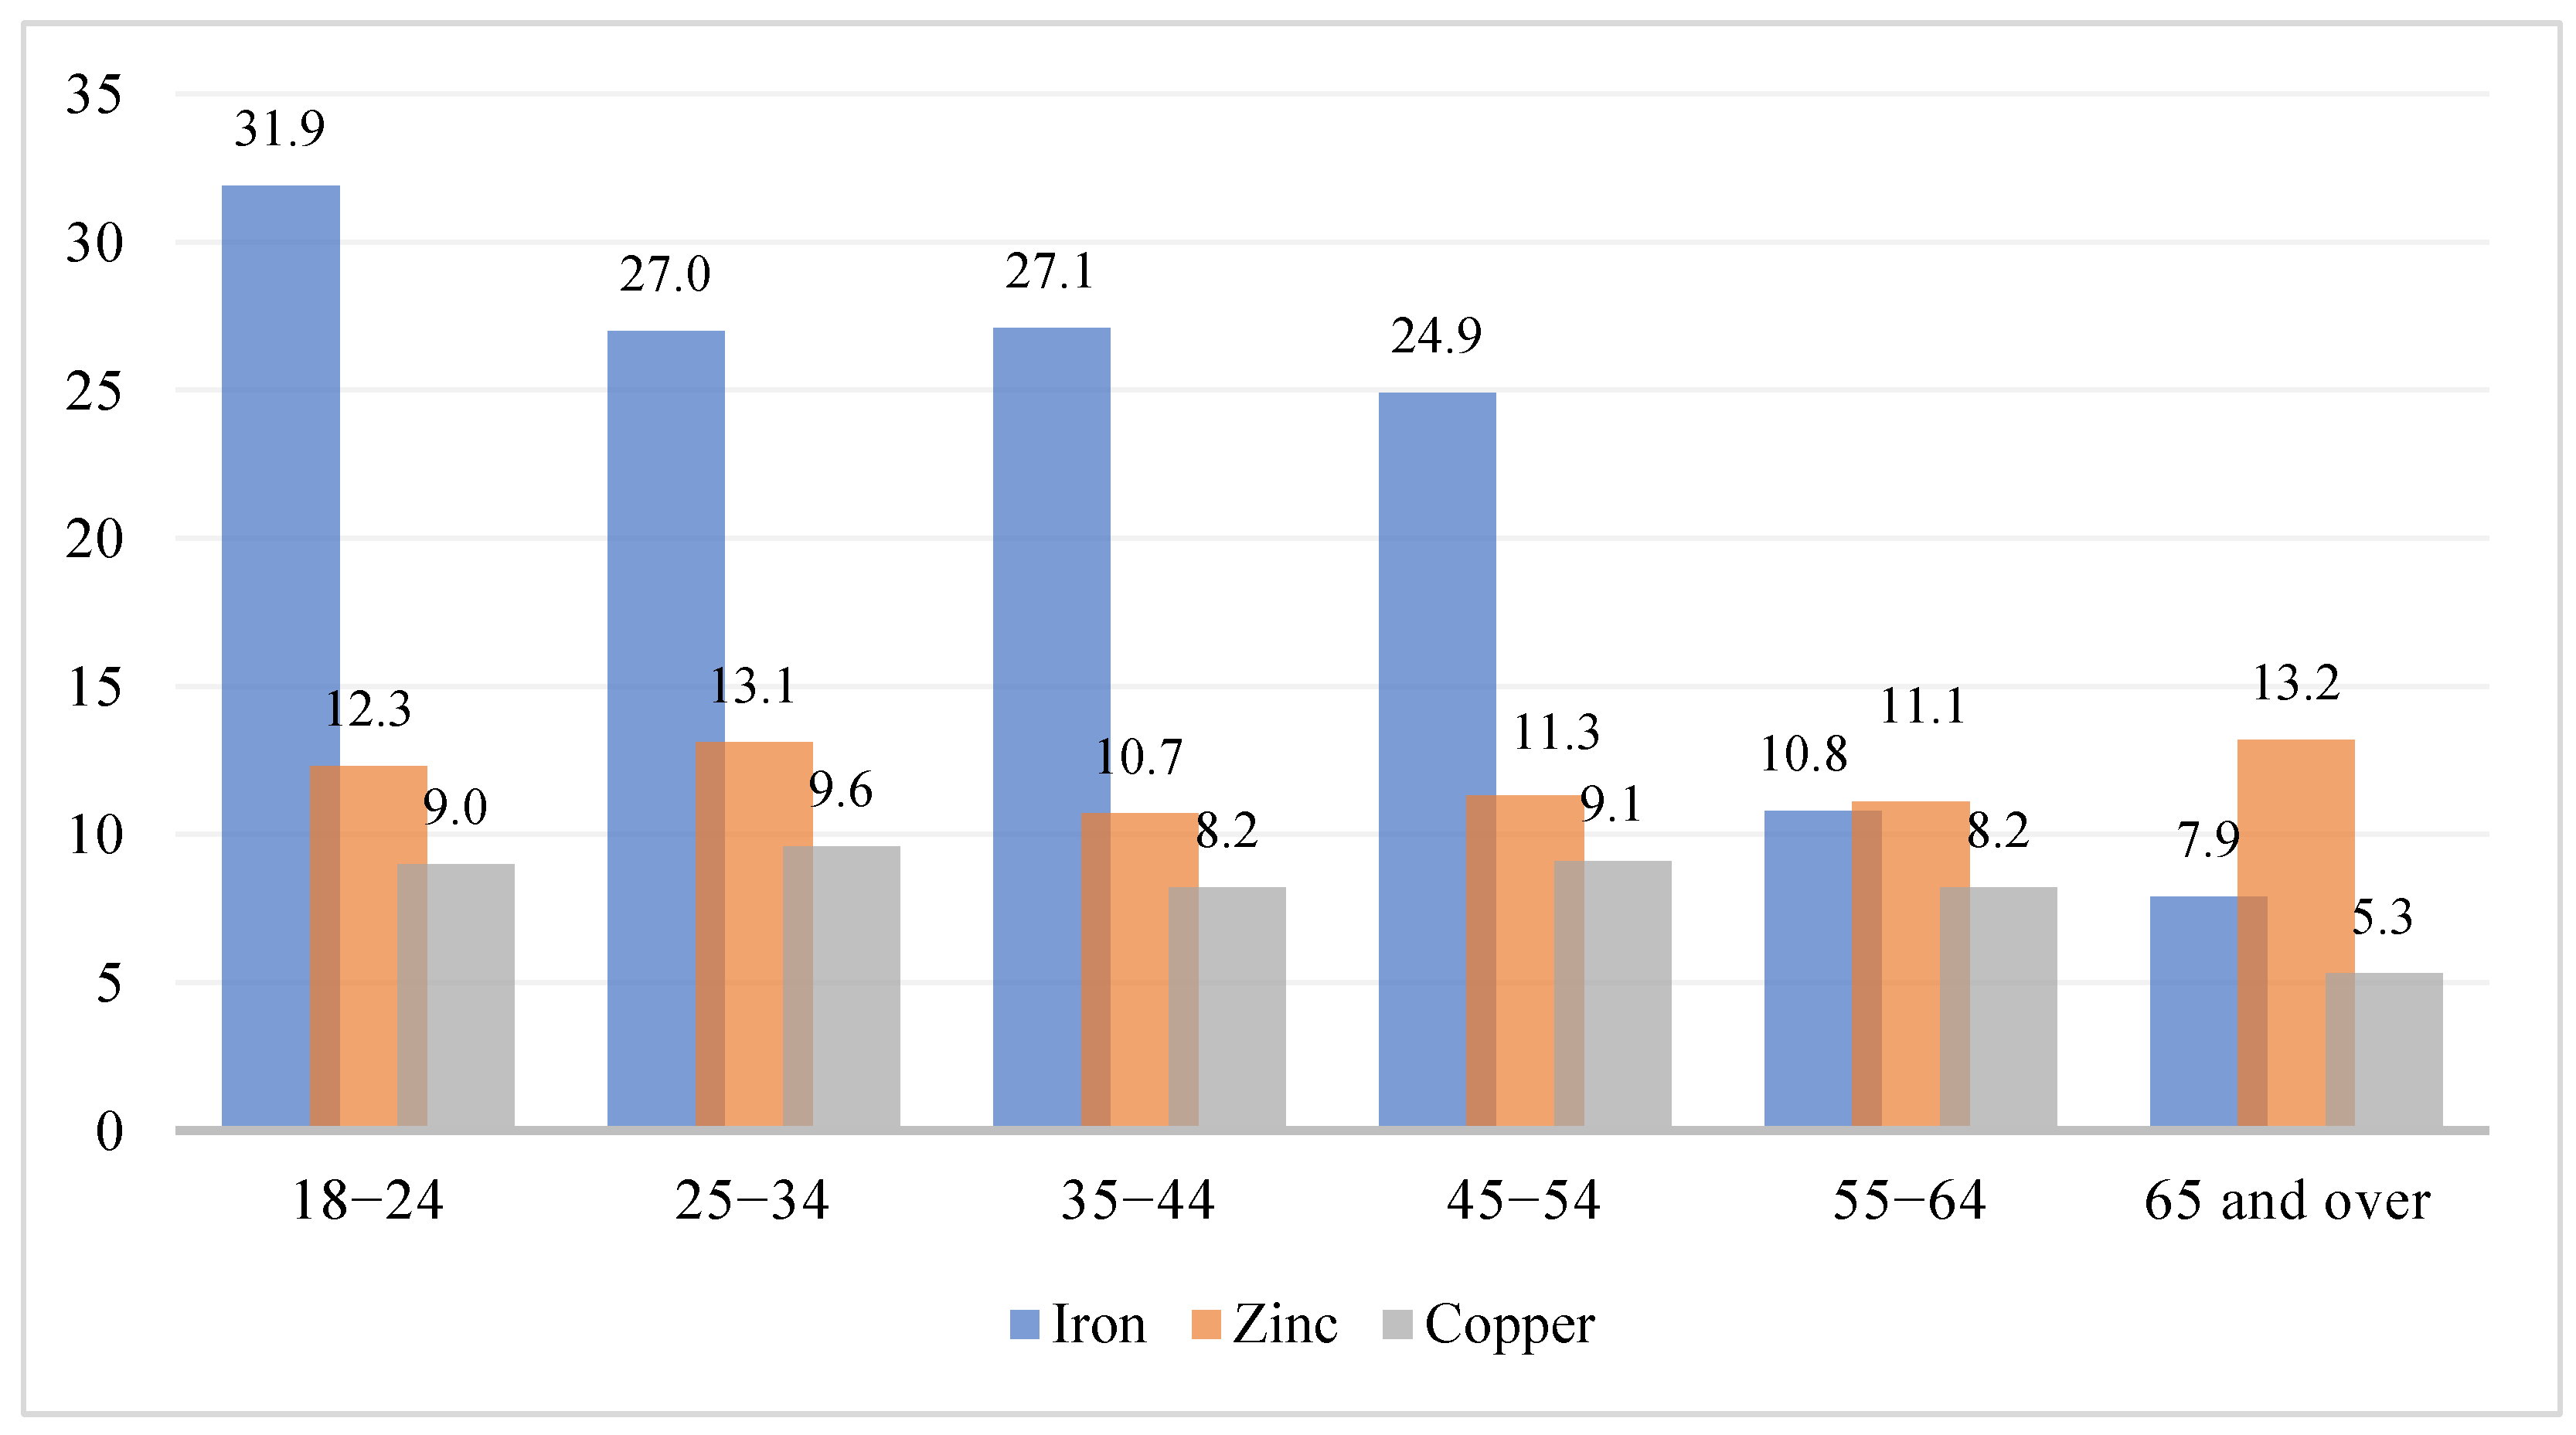
Mineral Deficiencies by Age Group

Among the age groups, the 18–24- and 35–44-years age groups exhibited the highest prevalence of iron deficiency (31.9% and 27.1%, respectively; Figure 2), significantly higher compared with that of other groups (p < 0.001). Age differences were also observed in magnesium deficiency, with the highest reported prevalence among those in the 55–64-years age group (2.4%), followed by the ≥65-years age group (1.3%), while the lowest prevalence was observed in the 45–54-years age group (0.2%). This difference was significant (p < 0.008). Age differences in the prevalence of all the other mineral deficiencies were nonsignificant (Appendix A Table A2).

3.3. Heavy Metals

The measured levels of arsenic (99.7%) and mercury (99.9%) for most Saudi adults were within the normal ranges (Table 4).

3.3.1. Heavy Metals by Sex

Men more commonly exhibited abnormal arsenic levels (0.3%) than women (0.1%); however, the difference was not statistically significant (p = 380). Similarly, abnormal mercury levels tended to be more common among men (0.4%) than among women (0.2%); however, the difference was not statistically significant (p = 0.476).

3.3.2. Heavy Metals by Age Group

The 55–64 age group exhibited the highest prevalence of abnormal arsenic levels (0.4%), followed by the 35–44 (0.3%) age group; however, the difference was not statistically significant (p = 0.653). The highest prevalence of abnormal mercury levels was exhibited by the 18–24 age group (0.6%), followed by the 35–44 age group (0.5%); however, the difference was not statistically significant (p = 0.426). Appendix A Table A3 includes details regarding the prevalence of abnormal arsenic and mercury levels based on age group.

4. Discussion

To the best of our knowledge, this is the first study to comprehensively evaluate the nutritional status of Saudi adults on a national level, particularly focusing on quantifying the micronutrient levels. Our results revealed that micronutrient deficiencies constitute a public health concern for Saudi adults, as at least 10% of the adults participating in the study exhibited four micronutrient deficiencies (vitamin D, vitamin B2, iron, and zinc). These results are largely consistent with earlier findings by the WHO Regional Office for the Eastern Mediterranean population [20] and those observed at the global level [6]. However, the arsenic and mercury levels observed in our population were not concerning.
Several vitamin shortfalls were evident, with deficiencies in vitamins D and B2 being the most prevalent. Although the definition of vitamin D deficiency is controversial [21], we applied the most common cutoff of vitamin D deficiency (25[O.H.]D ≤ 20 ng/mL) [21], which showed that the prevalence of vitamin D deficiency in the present study affected two-thirds of the study population. This is largely consistent with the results of a recent meta-analysis involving 16 studies conducted among 20,787 Saudi adults [22]. On comparing the prevalence of this deficiency in Saudi adults with the populations of neighboring countries, a lower prevalence was observed in Saudi Arabia than in Qatar (71.4%) [23], Oman (87.5%) [24], and Kuwait (83%) [25]. Internationally, however, the prevalence of this deficiency was higher in Saudi Arabia than in the United States (US) (41.6%) [26] and Europe (40.4%) [27]. The prevalence of vitamin D deficiency varied according to the age and sex of the participants, with younger adults and men exhibiting a higher vitamin D deficiency prevalence than older participants and women, which is consistent with the results found in the literature [28]. In contrast, our findings contradicted the only study conducted at the national level in Saudi Arabia, which revealed that older adults and women exhibited a higher prevalence of vitamin D deficiency [16]. This contradiction might be due to heterogeneity between both studies regarding age-predefined inclusion criteria and the vitamin cutoff used.
Extensive evidence highlighted that limited sunlight exposure is a chief contributor to vitamin D deficiency globally [29], as well as in Saudi Arabia [16,22,30]. Notably, several factors have been highlighted by minimal sun exposure, including the production of vitamin D due to skin pigmentation and minimal outdoor sun exposure due to the hot climate [16,31].
Studies on vitamin B2 deficiency are relatively limited [32], making comparison difficult owing to several factors, such as variation in age, population groups, or biochemical measurements [32,33,34,35]. Overall, our results indicate that 44.9% of Saudi adults exhibit vitamin B2 deficiency, which is lower than that reported in the United Kingdom (UK) (69%) [32] but higher than the estimated prevalence in the Korean population (21%) [34]. Generally, vitamin B2 deficiency is common in developing countries owing to the inadequate intake of riboflavin-rich products, such as milk and meat [32]. Other risk factors include various health conditions and metabolic disorders, smoking, pregnancy, lactation, and using hormonal contraceptives [32,36]. Vitamin B2 deficiency symptoms are nonspecific and vary from mild to severe, including skin disorders, hyperemia, mouth and throat edema, hair loss, migraine headache, heart failure, hypertension, brain dysfunction, and microcytic anemia [32,37].
Our findings indicate that approximately one-third of Saudi adults exhibit iron deficiency (23.2%), consistent with that reported in the literature [38], but higher than the global estimates [4,38]. Hwalla et al. [15] reported that in the Middle East the second highest prevalence of anemia in women of childbearing age was found in Saudi Arabia (40%), followed by Egypt (47.2%). In our findings, iron deficiency significantly differed based on age and sex, with women exhibiting a higher prevalence of iron deficiency than men (41.2% vs. 10.9%, respectively). This result was observed nationally [38], regionally [15], and internationally [4]. Furthermore, age differences exist in iron deficiency prevalence, particularly demonstrating a higher prevalence in young than in older adults; this is consistent with the results of other studies [4,15,39,40,41]. Risk factors associated with iron deficiency include the inadequate intake of iron-rich foods, blood loss (primarily menstrual or gastrointestinal), pregnancy, various health diseases, metabolic disorders, and older age [42]. Iron deficiency increases the risk of impaired immunity and anemia [42].
Zinc deficiency is widespread worldwide [4], especially in developing countries, where its prevalence reaches up to 30% [43]. The national estimate of zinc deficiency in Saudi Arabia is 15.3%, which is slightly lower than the estimated prevalence worldwide (≤17.3%) [43]. Zinc deficiency was characterized by sex differences, with women exhibiting a higher prevalence than men. These observations are consistent with Saudi and international studies [44,45]. Zinc deficiency has several risk factors, such as zinc loss or inadequate absorption and various chronic health conditions [46,47], and can engender growth retardation, respiratory infection, and impaired immune function [4].
Our study revealed no concerns regarding heavy metal levels (arsenic and mercury) among the Saudi Arabian adult population. Overall, regulatory agencies, such as the SFDA, implement monitoring programs to assess the levels of heavy metals, pesticides, and contaminants as well as their potential exposure and risk in manufactured goods and food [48]. A recent study involving food samples from Saudi markets reported that heavy metal content was within the permissible limits set by SFDA standards [11]. In addition, the SFDA regulates cosmetics, ensuring that cosmetic products manufactured in and imported to Saudi Arabia are free from heavy metals [49]. Thus, the low heavy metal levels observed in this study might be attributed to the implementation of such public health policies.
The high prevalence of several micronutrient deficiencies warrants urgent and effective public health interventions, including making healthy food more affordable and accessible and food fortification [4]. Fruits and vegetables are rich sources of numerous vitamins and minerals [50]. There is overwhelming evidence regarding the importance of food affordability in shaping food consumption behavior [51,52]. Multiple evidence-based practices are available to make food more affordable [53,54], several of which are suitable for this context. One study reported that only a small percentage of Saudi adults meet the dietary recommendations, especially for the intake of fruits (5.2%), vegetables (7.5%), and dairy products (26.2%) [55]. Fruits and vegetables can be made more accessible by reducing custom duty rates and subsidizing their price [56]. Other interventions could include food fortification [4,15,57,58], which is a safe and cost-effective strategy for improving diets and managing micronutrient deficiencies [4,15]. National strategies regarding micronutrient fortification are warranted to prevent micronutrient deficiency in Saudi Arabia and achieve a substantial public health benefit across the population. Unfortunately, a systematic review of food fortification implementation highlighted its ineffectiveness in managing micronutrient deficiency in most Middle Eastern countries [41]. Furthermore, a comparative study regarding the implementation of food fortification between Saudi Arabia and the US highlighted that current food fortification implementation methods in Saudi Arabia need to be improved [59].
A strength of this study is the fact that it involved a national sample, and, thus, the results are generalizable to the adult Saudi Arabian population Another strength is that this is the first study in Saudi Arabia aimed at determining vitamin and mineral deficiency prevalence and heavy metal levels among adults at a national level. However, it has some limitations. For example, study recruitment was suspended for over 9 months owing to the COVID-19 lockdown, which might have affected the dietary behavior and micronutrient status of the participants. Second, the study population primarily included individuals from urban cities across the 13 administrative regions of Saudi Arabia because of the availability of laboratories. Social desirability and recall bias could have affected the responses. However, the present data were chiefly based on laboratory findings. Finally, although the target sample size was 3536, only a sample size of 3432 was reached. This reflects the many challenges of achieving the target sample size, including difficulties in recruiting participants in some border regions. Generally, the actual sample size is close to the target sample size, at 3.0% lower than the target.

5. Conclusions

Our research yielded relevant, important, and timely findings regarding micronutrient deficiency status in Saudi adults at the national level. Several micronutrient deficiencies were identified. The most frequent ones include those of vitamins (vitamin B2 and D) and minerals (iron and zinc), which affect at least 1 in 10 Saudi adults. Strategies to prevent deficiencies are imperative and should be a high priority for health policymakers to improve the health of the population.

Author Contributions

Conceptualization, O.A., R.A. and A.S.A.; visualization, O.A.; methodology, O.A., R.A. and A.S.A.; data curation, O.A., R.A., A.A. and A.S.A.; coordination, A.A.; analysis, O.A.; writing––original draft, O.A.; writing––review, R.A.; writing––review and editing, A.S.A. and A.A. All authors have read and agreed to the published version of the manuscript.

Funding

This research was partly supported by Abbott (Agreement–27/01/1440) and PepsiCo (Agreement–1440). The funders had no role in the design and conduct of the study; the collection, management, analysis, and interpretation of the data; the preparation, review, or approval of the manuscript; or the decision to submit the manuscript for publication.

Institutional Review Board Statement

The study was conducted according to the guidelines of the Declaration of Helsinki and approved by the Institutional Review Board of the Saudi Food & Drug Authority (0008-19).

Informed Consent Statement

Informed consent was obtained from all subjects involved in the study.

Data Availability Statement

Not applicable.

Acknowledgments

We are grateful to all volunteers (over 130 surveyors for +5000 h) for their sincere generosity with their participation, time, effort, and commitment. We express our sincere gratitude to all the Directorate for Research Operation members for their continuous support and valuable contribution throughout the project period (Dalal Albarakah, Somaya Alkelaibi, Fahad AL-Abdulkarim, and Faisal Al-Rowais). We are thankful to our colleagues (Salwa Almomen, Lulu Al Mutairi, Tahrir Aldhirgham, Nouf Alammari, and Aljoharah Algabbani), who contributed to data collection. We gratefully acknowledge our colleague (Radwan Hafiz) who revised the consent form language to improve readability and understanding. We express our deep gratitude for the support and efforts exercised by our colleagues at the Executive Directorate for Communication and Awareness.

Conflicts of Interest

The authors declare no conflict of interest. Conclusions reached in this article are based on the personal scientific interpretations of the authors and do not necessarily represent the opinion of the Saudi Food & Drug Authority (SFDA).

Appendix A

Table A1. List of Laboratory Tests Conducted.
TypeMicronutrientMethodologyInstrumentMeasured
Compound
Ref. Range
VitaminAHigh-performance
liquid chromatography (HPLC)
Waters HPLC
Ultimate 3000 HPLC (Thermo Scientific) UV detector
Vitamin A
(Retinol)
30–70 μg/dL
B1High-performance
liquid chromatography (HPLC)
Waters HPLC
Ultimate 3000 HPLC (Thermo Scientific) Fluorescence detector
Vitamin B1
(Thiamine pyrophosphate)
28–85 μg/L
B2High-performance
liquid chromatography (HPLC)
Waters HPLC
Ultimate 3000 HPLC
(Thermo Scientific) Fluorescence detector
Riboflavin2.3–14 μg/L
B6High-performance
liquid chromatography (HPLC)
Waters HPLC
Ultimate 3000 HPLC (Thermo Scientific) Fluorescence detector
Vitamin B6
(pyridoxal-5′- phosphate)
8.7–27.2 μg/L
B9
(Folic acid)
Binding assayCobas e6000Serum folate4.6–18.7 ng/mL
B12Two-step immunoassay using chemiluminescent microparticle immuno assay (CMIA) technology with flexible assay
protocols, referred to as Chemiflex
Architect 2000Vitamin B 12
(Cyanocobalamin)
187–883 pg/mL
DDirect competitive
chemiluminescence
immunoassay (CLIA)
Liaison XL25-OH vitamin D (Total)20–100 ng/mL
EHigh-performance
liquid chromatography (HPLC)
Waters HPLC
Ultimate 3000 HPLC (Thermo Scientific) UV detector
α-Tocopherol5.7–19.9 mg/L
MineralCopperAtomic absorption
spectrometry
Thermo Scientific E3000 seriesCopper (Cu)70–175 μg/dL
ZincAtomic absorption
spectrometry
Thermo Scientific E3000 seriesZinc (Zn)60–130 μg/dL
MagnesiumColorimetric method with chlorophosphonazo IIICobas c501Magnesium1.6–2.6 mg/dL
FerritinColorimetric assayCobas c501IronWomen: 13–150 ng/mL
Men: 30–400 ng/mL
Heavy metalArsenicInductively coupled plasma/mass spectrometry (ICP/MS)Outsourced to Quest DiagnosticsArsenic<12 μg/L
MercuryInductively coupled plasma/mass spectrometry (ICP/MS)Outsourced to Quest DiagnosticsMercury≤8 μg/L
Table A2. Distribution of the Vitamin Deficiencies Categorized by Age Group, Saudi Arabia.
Age GroupVitamin AVitamin B1Vitamin B2Vitamin B6Vitamin B9Vitamin B12Vitamin DVitamin E
n (%)n (%)n (%)n (%)n (%)n (%)n (%)n (%)
18–2429 (8.3)6 (1.7)229 (36.6)2 (0.6)10 (2.8)36 (10.7)281 (79.4)5 (1.4)
25–34108 (9.6)34 (3.0)426 (37.9)16 (1.4)45 (4.0)72 (7.0)760 (67.6)35 (3.1)
35–4478 (7.6)48 (4.6)396 (38.3)26 (2.5)41 (4.0)90 (8.7)664 (64.5)39 (3.6)
45–5433 (5.6)15 (2.5)199 (33.7)8 (1.4)18 (3.1)35 (5.9)327 (55.7)19 (3.2)
55–6414 (5.6)7 (2.8)90 (36.4)4 (1.6)7 (2.8)17 (6.8)120 (48.4)6 (2.4)
≥657 (9.3)1 (1.3)24 (32.0)1 (1.3)3 (4.0)2 (2.6)30 (39.5)3 (3.9)
p-value0.510.0480.4530.1580.7710.530.0010.362
Table A3. Distribution of the Mineral Deficiencies and Heavy Metal Levels Categorized by Age Group, Saudi Arabia.
Age GroupCopperIronMagnesiumZincArsenicMercury
DeficientDeficientDeficientDeficientNormalNormal
n (%)n (%)n (%)n (%)n (%)n (%)
18–2431 (9.0)113 (31.9)1 (0.3)43 (12.3)354 (100)352 (99.4)
25–34107 (9.6)304 (27.0)6 (0.5)147 (13.1)1124 (99.8)1121 (99.7)
35–4483 (8.2)279 (27.1)7 (0.7)110 (10.7)1126 (99.7)1028 (99.5)
45–5452 (9.1)146 (24.9)1 (0.2)66 (11.3)591 (100)591 (100)
55–6420 (8.2)27 (10.8)6 (2.4)27 (11.1)248 (99.6)249 (100)
≥654 (5.3)6 (7.9)1 (1.3)10 (13.2)76 (100)76 (100)
p-value0.7310.0010.0080.6420.6530.426

References

  1. Whitney, E.; Rolfes, S.R. Understanding Nutrition, 2nd ed.; Cengage Learning: Melbourne, VIC, Australia, 2018. [Google Scholar]
  2. Shenkin, A. The key role of micronutrients. Clin. Nutr. 2006, 25, 1–13. [Google Scholar] [CrossRef] [PubMed]
  3. World Health Organization. Malnutrition. 2021. Available online: https://www.who.int/health-topics/malnutrition#tab=tab_1 (accessed on 15 September 2022).
  4. Bailey, R.L.; West, K.P.; Black, R.E. The epidemiology of global micronutrient deficiencies. Ann. Nutr. Metab. 2015, 66, 22–33. [Google Scholar] [CrossRef]
  5. Godswill, C.; Somtochukwu, V. Nutritional Diseases and Nutrient Toxicities: A Systematic Review of the Diets and Nutrition for Prevention and Treatment. Int. J. Adv. Acad. Res. Sci. 2020, 6, 1–46. [Google Scholar]
  6. Muthayya, S.; Rah, J.H.; Sugimoto, J.D.; Roos, F.F.; Kraemer, K.; Black, R.E. The Global Hidden Hunger Indices and Maps: An Advocacy Tool for Action. PLoS ONE 2013, 8, e67860. [Google Scholar] [CrossRef] [PubMed] [Green Version]
  7. Peraza, M.A.; Ayala-Fierro, F.; Barber, D.S.; Casarez, E.; Rael, L.T. Effects of Micronutrients on Metal Toxicity. Environ. Health Perspect. 1998, 106 (Suppl. S1), 203–216. [Google Scholar]
  8. Balali-Mood, M.; Naseri, K.; Tahergorabi, Z.; Khazdair, M.R.; Sadeghi, M. Toxic Mechanisms of Five Heavy Metals: Mercury, Lead, Chromium, Cadmium, and Arsenic. Front. Pharmacol. 2021, 12, 643972. [Google Scholar] [CrossRef]
  9. Shaji, E.; Santosh, M.; Sarath, K.V.; Prakash, P.; Deepchand, V.; Divya, B.V. Arsenic contamination of groundwater: A global synopsis with focus on the Indian Peninsula. Geosci. Front. 2021, 12, 101079. [Google Scholar] [CrossRef]
  10. World Health Organization. Arsenic. 2018. Available online: https://www.who.int/news-room/fact-sheets/detail/arsenic (accessed on 15 September 2022).
  11. Almutairi, M.; Alsaleem, T.; Jeperel, H.; Alsamti, M.; Alowaifeer, A.M. Determination of inorganic arsenic, heavy metals, pesticides and mycotoxins in Indian rice (Oryza sativa) and a probabilistic dietary risk assessment for the population of Saudi Arabia. Regul. Toxicol. Pharmacol. 2021, 125, 104986. [Google Scholar] [CrossRef]
  12. World Health Organization. Mercury and Health. 2017. Available online: https://www.who.int/news-room/fact-sheets/detail/mercury-and-health (accessed on 16 September 2022).
  13. Tchounwou, P.B.; Yedjou, C.G.; Patlolla, A.K.; Sutton, D.J. Heavy Metals Toxicity and the Environment. Mol. Clin. Environ. Toxicol. 2012, 101, 133–164. [Google Scholar] [CrossRef] [Green Version]
  14. Hakami, O. Risk Assessment of Heavy Metals in Fish in Saudi Arabia. Am. J. Environ. Sci. 2016, 2, 341–357. [Google Scholar] [CrossRef] [Green Version]
  15. Hwalla, N.; Al Dhaheri, A.S.; Radwan, H.; Alfawaz, H.A.; Fouda, M.A.; Al-Daghri, N.M. The prevalence of micronutrient deficiencies and inadequacies in the middle east and approaches to interventions. Nutrients 2017, 9, 229. [Google Scholar] [CrossRef] [PubMed] [Green Version]
  16. Tuffaha, M.; El Bcheraoui, C.; Daoud, F.; Al Hussaini, H.A.; Alamri, F.; Al Saeedi, M. Deficiencies under plenty of sun: Vitamin D status among adults in the Kingdom of Saudi Arabia, 2013. N. Am. J. Med. Sci. 2015, 7, 467–475. [Google Scholar] [CrossRef]
  17. General Authority for Statistics. Statistical Yearbook of 2017; General Authority for Statistics: Riyadh, Saudi Arabia, 2017. [Google Scholar]
  18. World Health Organization. Noncommunicable Diseases. Available online: https://www.who.int/news-room/fact-sheets/detail/noncommunicable-diseases (accessed on 17 September 2022).
  19. Algabbani, A.; Alqahtani, A.; BinDhim, N. Prevalence and determinants of non-communicable diseases in Saudi Arabia. Food Drug Regul. Sci. J. 2019, 2, 1. [Google Scholar] [CrossRef]
  20. WHO Regional Office for the Eastern Mediterranean. Regional Strategy on Nutrition 2010–2019. 2009. Available online: https://apps.who.int/iris/handle/10665/116694 (accessed on 18 September 2022).
  21. Amrein, K.; Scherkl, M.; Hoffmann, M.; Neuwersch-Sommeregger, S.; Köstenberger, M.; Tmava Berisha, A. Vitamin D deficiency 2.0: An update on the current status worldwide. Eur. J. Clin. Nutr. 2020, 74, 1498–1513. [Google Scholar] [CrossRef] [PubMed]
  22. Al-Alyani, H.; Al-Turki, H.A.; Al-Essa, O.N.; Alani, F.M.; Sadat-Ali, M. Vitamin D deficiency in Saudi Arabians: A reality or simply hype: A meta-analysis (2008–2015). J. Fam. Community Med. 2018, 25, 1–4. [Google Scholar] [CrossRef]
  23. Zainel, A.J.A.L.; Qotba, H.; Al Nuaimi, A.; Syed, M. Vitamin D status among adults (18–65 years old) attending primary healthcare centres in Qatar: A cross-sectional analysis of the Electronic Medical Records for the year 2017. BMJ Open 2019, 9, e029334. [Google Scholar] [CrossRef] [Green Version]
  24. Abiaka, C.; Delghandi, M.; Kaur, M.; Al-Saleh, M. Vitamin D Status and Anthropometric Indices of an Omani Study Population. Sultan Qaboos Univ. Med. J. 2013, 13, 224–231. [Google Scholar] [CrossRef] [Green Version]
  25. Zhang, F.F.; Al Hooti, S.; Al Zenki, S.; Alomirah, H.; Jamil, K.M.; Rao, A. Vitamin D deficiency is associated with high prevalence of diabetes in Kuwaiti adults: Results from a national survey Chronic Disease epidemiology. BMC Public Health 2016, 16, 100. [Google Scholar] [CrossRef] [Green Version]
  26. Forrest, K.Y.Z.; Wendy, S.L. Prevalence and correlates of vitamin D deficiency in US adults. Nutr. Res. 2011, 31, 48–54. [Google Scholar] [CrossRef] [PubMed]
  27. Cashman, K.D.; Dowling, K.G.; Škrabáková, Z.; Gonzalez-Gross, M.; Valtueña, J.; De Henauw, S. Vitamin D deficiency in Europe: Pandemic? Am. J. Clin. Nutr. 2016, 103, 1033–1044. [Google Scholar] [CrossRef] [PubMed] [Green Version]
  28. AlQuaiz, A.J.M.; Kazi, A.; Fouda, M.; Alyousefi, N. Age and gender differences in the prevalence and correlates of vitamin D deficiency. Arch. Osteoporos. 2018, 13, 49. [Google Scholar] [CrossRef]
  29. Nair, R.; Maseeh, A. Vitamin D: The sunshine vitamin. J. Pharmacol. Pharmacother. 2012, 3, 118–126. [Google Scholar] [CrossRef]
  30. Alshahrani, F.M.; Almalki, M.H.; Aljohani, N.; Alzahrani, A.; Alsaleh, Y.; Holick, M.F. Vitamin D: Light side and best time of sunshine in Riyadh, Saudi Arabia. Dermatoendocrinology 2013, 5, 177–180. [Google Scholar] [CrossRef] [Green Version]
  31. Zareef, T.A.; Jackson, R.T. Knowledge and attitudes about vitamin D and sunlight exposure in premenopausal women living in Jeddah, and their relationship with serum vitamin D levels. J. Health Popul. Nutr. 2021, 40, 38. [Google Scholar] [CrossRef] [PubMed]
  32. The National Institutes of Health. Riboflavin: Fact Sheet for Health Professionals. 2021. Available online: https://ods.od.nih.gov/factsheets/Riboflavin-HealthProfessional/ (accessed on 4 October 2022).
  33. Whitfield, K.; McCann, A.; Karakochuk, C.; Talukder, A.; Ward, M.; McNulty, H.; Green, T. High rates of riboflavin deficiency in women of childbearing age in Cambodia and Canada (1041.12). FASEB J. 2014, 4 (Suppl. S1), 2469–2475. [Google Scholar] [CrossRef]
  34. Choi, J.Y.; Kim, Y.N.; Cho, Y.O. Evaluation of riboflavin intakes and status of 20–64-year-old adults in South Korea. Nutrients 2015, 7, 253–264. [Google Scholar] [CrossRef] [Green Version]
  35. Beverley, B.; Alison, L.; Ann, P.; Chris, B.; Polly, P.; Sonja, N. National Diet and Nutrition Survey: Results from Years 1, 2, 3 and 4 (Combined) of the Rolling Programme (2008/2009–2011/2012); Public Health England and Food Standards Agency: London, UK, 2014. [Google Scholar]
  36. Leblanc, J.G.; Laiñ, J.E.; Juarez Del Valle, M.; Vannini, V.; Van Sinderen, D.; Taranto, M.P. B-Group vitamin production by lactic acid bacteria-current knowledge and potential applications. J. Appl. Microbiol. 2011, 111, 1297–1309. [Google Scholar] [CrossRef] [PubMed]
  37. Thakur, K.; Tomar, S.; Singh, A.K.; Mandal, S.; Arora, S. Riboflavin and health: A review of recent human research. Crit. Rev. Food Sci. Nutr. 2017, 57, 3650–3660. [Google Scholar] [CrossRef]
  38. Owaidah, T.; Al-Numair, N.; Al-Suliman, A.; Zolaly, M.; Hasanato, R.; Al Zahrani, F. Iron Deficiency and Iron Deficiency Anemia Are Common Epidemiological Conditions in Saudi Arabia: Report of the National Epidemiological Survey. Anemia 2020, 2020, 6642568. [Google Scholar] [CrossRef]
  39. Chueh, H.W.; Jung, H.L.; Shim, Y.J.; Choi, H.S.; Han, J.Y. High anemia prevalence in Korean older adults, an advent healthcare problem: 2007–2016 KNHANES. BMC Geriatr. 2020, 20, 509. [Google Scholar] [CrossRef]
  40. Patel, K.V. Epidemiology of Anemia in Older Adults. Semin. Hematol. 2008, 45, 210–217. [Google Scholar] [CrossRef] [PubMed] [Green Version]
  41. Mirmiran, P.; Golzarand, M.; Serra-Majem, L.; Azizi, F. Iron, iodine and vitamin a in the Middle East: A systematic review of deficiency and food fortification. Iran J. Public Health 2012, 41, 8–19. [Google Scholar] [PubMed]
  42. Abbaspour, N.; Hurrell, R.; Kelishadi, R. Review on iron and its importance for human health. J. Res. Med. Sci. 2014, 19, 164. [Google Scholar] [PubMed]
  43. Wessells, K.R.; Brown, K.H. Estimating the Global Prevalence of Zinc Deficiency: Results Based on Zinc Availability in National Food Supplies and the Prevalence of Stunting. PLoS ONE 2012, 7, e50568. [Google Scholar] [CrossRef] [Green Version]
  44. Abiaka, C.; Olusi, S.; Al-Awadhi, A. Reference Ranges of Copper and Zinc and the Prevalence of Their Deficiencies in an Arab Population Aged 15–80 Years. Biol. Trace Elem. Res. 2003, 91, 33–43. [Google Scholar] [CrossRef]
  45. Ghasemi, A.; Zahediasl, S.; Hosseini-Esfahani, F.; Azizi, F. Reference Values for Serum Zinc Concentration and Prevalence of Zinc Deficiency in Adult Iranian Subjects. Biol. Trace Elem. Res. 2012, 149, 307–314. [Google Scholar] [CrossRef]
  46. Prasad, A.S. Reviews from ASN EB 2012 Symposia Discovery of Human Zinc Deficiency: Its Impact on Human Health and Disease 1–3. J. Trace Elem. Med. Biol. 2014, 28, 357–363. [Google Scholar] [CrossRef]
  47. National Institutes of Health (NIH). Zinc: Fact Sheet for Health Professionals. 2021. Available online: https://ods.od.nih.gov/factsheets/Zinc-HealthProfessional/ (accessed on 5 October 2022).
  48. Saudi Food And Drug Authority. Overview. 2022. Available online: https://www.sfda.gov.sa/en/overview (accessed on 5 October 2022).
  49. Saudi Food and Drug Authority. SFDA Warns about Cosmetics Containing High Percentage of Lead. 2011. Available online: https://www.sfda.gov.sa/en/news/48727 (accessed on 6 October 2022).
  50. Yahia, E.M.; García-Solís, P.; MaldonadoCelis, M.E. Contribution of fruits and vegetables to human nutrition and health. In Postharvest Physiology and Biochemistry of Fruits and Vegetables; Woodhead Publishing: Sawston, UK, 2019; pp. 19–45. [Google Scholar] [CrossRef]
  51. Steenhuis, I.H.; Waterlander, W.E.; De Mul, A. Consumer food choices: The role of price and pricing strategies. Public Health Nutr. 2011, 14, 2220–2226. [Google Scholar] [CrossRef] [PubMed] [Green Version]
  52. Eyles, H.; Mhurchu, C.N.; Nghiem, N.; Blakely, T. Food Pricing Strategies, Population Diets, and Non-Communicable Disease: A Systematic Review of Simulation Studies. PLoS Med. 2012, 9, e1001353. [Google Scholar] [CrossRef] [Green Version]
  53. Just, D.R.; Byrne, A.T. Evidence-based policy and food consumer behaviour: How empirical challenges shape the evidence. Eur. Rev. Agric. Econ. 2020, 47, 348–370. [Google Scholar] [CrossRef]
  54. Choi, S.E.; Seligman, H.; Basu, S. Cost Effectiveness of Subsidizing Fruit and Vegetable Purchases Through the Supplemental Nutrition Assistance Program. Am. J. Prev. Med. 2017, 52, e147–e155. [Google Scholar] [CrossRef] [PubMed]
  55. Moradi-Lakeh, M.; El Bcheraoui, C.; Afshin, A.; Daoud, F.; AlMazroa, M.A.; Al Saeedi, M. Diet in Saudi Arabia: Findings from a nationally representative survey. Public Health Nutr. 2022, 20, 1075–1081. [Google Scholar] [CrossRef] [PubMed] [Green Version]
  56. Mokdad, A.; El Bcheraoui, C.; Basulaiman, M.; AlMazroa, M.; Tuffaha, M.; Daoud, F. Fruit and vegetable consumption among adults in Saudi Arabia, 2013. Nutr. Diet. Suppl. 2015, 7, 41–49. [Google Scholar] [CrossRef] [Green Version]
  57. Lips, P.; Cashman, K.D.; Lamberg-Allardt, C.; Bischoff-Ferrari, H.A.; Obermayer-Pietsch, B.; Bianchi, M.L. Current Vitamin D status in European and Middle East countries and strategies to prevent Vitamin D deficiency: A position statement of the European Calcified Tissue Society. Eur. J. Endocrinol. 2019, 180, P23–P54. [Google Scholar] [CrossRef] [Green Version]
  58. Mannar, M.G.V.; Hurrell, R.F. Food fortification: Past experience, current status, and potential for globalization. In Food Fortification in a Globalized World; Academic Press: Cambridge, MA, USA, 2018; pp. 3–11. [Google Scholar] [CrossRef]
  59. Sadat-Ali, M.; Al Elq, A.; Al-Farhan, M.; Sadat, N. Fortification with vitamin D: Comparative study in the Saudi Arabian and US markets. J. Fam. Community Med. 2013, 20, 49–52. [Google Scholar] [CrossRef]
Figure 1. Distribution of vitamin D, B2, and A deficiencies based on age group.
Healthcare 10 02415 g001
Figure 2. Prevalence of iron, zinc, and copper deficiencies based on age group.
Healthcare 10 02415 g002
Table 1. Demographic and health characteristics of the study participants.
CharacteristicMenWomenTotalTotal
(Weighted%)
n (%)n (%)n (%)
Sample size1674 (48.8)1758 (51.2)3432 (100)100
Age group
18–24130 (7.8)224 (12.7)354 (10.3)13.9
25–34579 (34.6)547 (31.1)1126 (21.8)30.1
35-44555 (33.2)481 (27.4)1036 (30.2)29.0
45–54259 (15.5)332 (18.9)591 (17.2)17.0
55–64118 (7.0)131 (7.5)249 (7.3)7.9
≥6533 (2.0)43 (2.4)76 (2.2)2.1
Smoking and tobacco use status
Never smoked897 (56.8)1646 (95.4)2543 (76.9)75.3
Previous smoker151 (9.6)11 (0.6)162 (4.9)4.4
Current smoker532 (318)68 (3.9)600 (18.2)20.3
Dietary supplements
Had taken supplements within the past 7 days341 (20.4)495 (28.7)836 (25.3)25.2
History of chronic condition diagnoses
Diabetes155 (9.3)143 (8.1)298 (9.0)8.5
Heart disease24 (1.4)15 (0.9)39 (1.1)1.2
Respiratory disease48 (2.9)60 (3.4)108 (3.1)3.6
Depression20 (1.4)32 (18)52 (1.6)2.9
History of morbidity
Morbidity (≥1 chronic condition)327 (20.7)341 (19.8)668 (20.2)22.1
Multimorbidity (≥2 chronic conditions)127 (7.6)197 (11.2)324 (9.8)11.7
Table 2. Prevalence of vitamin deficiencies among Saudi adults.
Vitamin Deficiency VariablesMenWomenp-ValueTotalTotal
(Weighted%)
n (%)n (%) n (%)
Sample size1674 (48.8)1758 (51.2) 3432 (100)100
A81 (4.8)188 (10.7)<0.001269 (7.9)9.6
B154 (3.2)57 (3.2)0.974111 (3.2)2.3
B2662 (39.5)602 (34.2)<0.0011264 (36.9)44.8
B620 (1.2)37 (2.1)0.5757 (1.7)2.4
B987 (5.2)37 (2.1)<0.001124 (3.6)3.5
B1299 (5.9)160 (9.1)<0.001259 (7.5)8.1
D1141 (68.2)1041 (59.2)<0.0012182 (63.8)64.3
E50 (3.0)57(3.3)0.666107 (3.1)4.9
Table 3. Prevalence of mineral deficiencies among Saudi adults.
Mineral Deficiency VariablesMenWomenp-ValueTotalTotal
(Weighted%)
n (%)n (%) n (%)
Sample size1674 (48.8)1758 (51.2) 3432 (100)100
Copper211 (12.6)86 (4.9)<0.001297 (8.8)8.7
Iron188 (11.3)687 (39.2)<0.001875 (25.6)23.2
Magnesium10 (0.6)12 (0.7)0.75322 (0.6)0.4
Zinc149 (8.9)254 (14.4)<0.001403 (11.9)15.3
Table 4. Prevalence of arsenic and mercury levels among Saudi adults.
Heavy Metals Classification MenWomenp-ValueTotalTotal
(Weighted%)
n (%)n (%)n (%)
ArsenicNormal 1670 (99.8)1756 (99.8)0.3803426 (99.8)99.7
High 4 (0.3)2 (0.1)6 (0.2)0.3
MercuryNormal 1664 (99.6)1752 (97.8)0.4763416 (99.7)99.9
High 6.0 (0.4)4 (0.2)10 (0.3)0.1
Publisher’s Note: MDPI stays neutral with regard to jurisdictional claims in published maps and institutional affiliations.

