
Comparing Idiopathic Chronic Fatigue and Myalgic Encephalomyelitis/Chronic Fatigue Syndrome (ME/CFS) in Males: Response to Two-Day Cardiopulmonary Exercise Testing Protocol


Abstract
:1. Introduction
2. Materials and Methods
2.1. Participants
2.2. Cardiopulmonary Exercise Testing (CPET)
2.3. Statistical Analysis
3. Results
3.1. Baseline Characteristics
3.2. Results of the 2-Day Cardiopulmonary Exercise Test Protocol
4. Discussion
4.1. Cardiopulmonary Exercise Testing in Idiopathic Chronic Fatigue: Comparison to Literature
4.2. Limitations
5. Conclusions
Author Contributions
Funding
Institutional Review Board Statement
Informed Consent Statement
Data Availability Statement
Acknowledgments
Conflicts of Interest
Appendix A
Methodology of the Cardiopulmonary Exercise Test

References
- Carruthers, B.M.; van de Sande, M.I.; DEMeirleir, K.L.; Klimas, N.G.; Broderick, G.; Mitchell, T.; Staines, D.; Powles, A.C.P.; Speight, N.; Vallings, R.; et al. Myalgic encephalomyelitis: International consensus criteria. J. Intern. Med. 2011, 270, 327–338. [Google Scholar] [CrossRef] [Green Version]
- Clayton, E.W. Beyond myalgic encephalomyelitis/chronic fatigue syndrome: An IOM report on redefining an illness. JAMA 2015, 313, 1101–1102. [Google Scholar] [CrossRef]
- Fukuda, K.; Straus, S.E.; Hickie, I.; Sharpe, M.C.; Dobbins, J.G.; Komaroff, A. The chronic fatigue syndrome: A comprehensive approach to its definition and study. Ann. Intern. Med. 1994, 121, 953–959. [Google Scholar] [CrossRef]
- Institute Of Medicine (IOM) (Ed.) Beyond Mayalgic Encephalomyelitis/Chronic Fatigue Syndrome: Redefining an Illness; The National Academies Press: Washington, DC, USA, 2015. [Google Scholar]
- Jones, D.E.; Hollingsworth, K.G.; Taylor, R.; Blamire, A.M.; Newton, J.L. Abnormalities in pH handling by peripheral muscle and potential regulation by the autonomic nervous system in chronic fatigue syndrome. J. Intern. Med. 2010, 267, 394–401. [Google Scholar] [CrossRef]
- Paul, L.; Wood, L.; Behan, W.M.; Maclaren, W.M. Demonstration of delayed recovery from fatiguing exercise in chronic fatigue syndrome. Eur. J. Neurol. 1999, 6, 63–69. [Google Scholar] [CrossRef] [PubMed]
- Fulle, S.; Pietrangelo, T.; Mancinelli, R.; Saggini, R.; Fano, G. Specific correlations between muscle oxidative stress and chronic fatigue syndrome: A working hypothesis. J. Muscle Res. Cell Motil. 2007, 28, 355–362. [Google Scholar] [CrossRef] [PubMed]
- Gur, A.; Oktayoglu, P. Central nervous system abnormalities in fibromyalgia and chronic fatigue syndrome: New concepts in treatment. Curr. Pharm. Des. 2008, 14, 1274–1294. [Google Scholar] [CrossRef] [PubMed]
- McCully, K.K.; Malucelli, E.; Iotti, S. Increase of free Mg2+ in the skeletal muscle of chronic fatigue syndrome patients. Dyn. Med. 2006, 5, 1. [Google Scholar] [CrossRef] [PubMed] [Green Version]
- McCully, K.K.; Smith, S.; Rajaei, S.; Leigh, J.S.; Natelson, B.H., Jr. Blood flow and muscle metabolism in chronic fatigue syndrome. Clin. Sci. 2003, 104, 641–647. [Google Scholar] [CrossRef] [Green Version]
- Siemionow, V.; Fang, Y.; Calabrese, L.; Sahgal, V.; Yue, G.H. Altered central nervous system signal during motor performance in chronic fatigue syndrome. Clin. Neurophysiol. 2004, 115, 2372–2381. [Google Scholar] [CrossRef]
- Wong, R.; Lopaschuk, G.; Zhu, G.; Walker, D.; Catellier, D.; Burton, D.; Koon, T.; Collins-Nakai, R.; Montague, T. Skeletal muscle metabolism in the chronic fatigue syndrome. In vivo assessment by 31P nuclear magnetic resonance spectroscopy. Chest 1992, 102, 1716–1722. [Google Scholar] [CrossRef]
- De Becker, P.; Roeykens, J.; Reynders, M.; McGregor, N.; De Meirleir, K. Exercise capacity in chronic fatigue syndrome. Arch. Intern Med. 2000, 160, 3270–3277. [Google Scholar] [CrossRef]
- Fulcher, K.Y.; White, P.D. Strength and physiological response to exercise in patients with chronic fatigue syndrome. J. Neurol. Neurosurg. Psychiatry 2000, 69, 302–307. [Google Scholar] [CrossRef] [Green Version]
- Hodges, L.D.; Nielsen, T.; Baken, D. Physiological measures in participants with chronic fatigue syndrome, multiple sclerosis and healthy controls following repeated exercise: A pilot study. Clin. Physiol Funct. Imaging 2018, 38, 639–644. [Google Scholar] [CrossRef] [PubMed]
- Jammes, Y.; Steinberg, J.G.; Mambrini, O.; Bregeon, F.; Delliaux, S. Chronic fatigue syndrome: Assessment of increased oxidative stress and altered muscle excitability in response to incremental exercise. J. Intern. Med. 2005, 257, 299–310. [Google Scholar] [CrossRef]
- Keller, B.A.; Pryor, J.L.; Giloteaux, L. Inability of myalgic encephalomyelitis/chronic fatigue syndrome patients to reproduce VO(2)peak indicates functional impairment. J. Transl. Med. 2014, 12, 104. [Google Scholar] [CrossRef] [Green Version]
- Sargent, C.; Scroop, G.C.; Nemeth, P.M.; Burnet, R.B.; Buckley, J.D. Maximal oxygen uptake and lactate metabolism are normal in chronic fatigue syndrome. Med. Sci. Sports Exerc. 2002, 34, 51–56. [Google Scholar] [CrossRef] [PubMed]
- Sisto, S.A.; LaManca, J.; Cordero, D.L.; Bergen, M.T.; Ellis, S.P.; Drastal, S.; Boda, W.L.; Tapp, W.N.; Natelson, B.H. Metabolic and cardiovascular effects of a progressive exercise test in patients with chronic fatigue syndrome. Am. J. Med. 1996, 100, 634–640. [Google Scholar] [CrossRef]
- Snell, C.R.; Stevens, S.R.; Davenport, T.E.; Van Ness, J.M. Discriminative validity of metabolic and workload measurements to identify individuals with chronic fatigue syndrome. Phys. Ther. 2013, 93, 1484–1492. [Google Scholar] [CrossRef] [PubMed] [Green Version]
- Vanness, J.M.; Snell, C.R.; Stevens, S.R. Diminished cardiopulmonary capacity during post-exertional malaise. J. Chronic Fatigue Syndr. 2007, 14, 77–85. [Google Scholar] [CrossRef]
- Vermeulen, R.C.; Kurk, R.M.; Visser, F.C.; Sluiter, W.; Scholte, H.R. Patients with chronic fatigue syndrome performed worse than controls in a controlled repeated exercise study despite a normal oxidative phosphorylation capacity. J. Transl. Med. 2010, 11, 93. [Google Scholar] [CrossRef] [PubMed] [Green Version]
- Vermeulen, R.C.; Vermeulen van Eck, I.W. Decreased oxygen extraction during cardiopulmonary exercise test in patients with chronic fatigue syndrome. J. Transl. Med. 2014, 12, 20. [Google Scholar] [CrossRef] [Green Version]
- Wallman, K.E.; Morton, A.R.; Goodman, C.; Grove, R. Physiological responses during a submaximal cycle test in chronic fatigue syndrome. Med. Sci. Sports Exerc. 2004, 36, 1682–1688. [Google Scholar] [CrossRef] [PubMed]
- Cureton, K.; Bishop, P.; Hutchinson, P.; Newland, H.; Vickery, S.; Zwiren, L. Sex difference in maximal oxygen uptake. Effect of equating haemoglobin concentration. Eur. J. Appl. Physiol. Occup. Physiol. 1986, 54, 656–660. [Google Scholar] [CrossRef]
- Fletcher, G.F.; Balady, G.J.; Amsterdam, E.A.; Chaitman, B.; Eckel, R.; Fleg, J.; Froelicher, V.F.; Leon, A.S.; Piña, I.L.; Rodney, R.; et al. Exercise standards for testing and training: A statement for healthcare professionals from the American Heart Association. Circulation 2001, 104, 1694–1740. [Google Scholar] [CrossRef] [Green Version]
- Sharma, H.B.; Kailashiya, J. Gender difference in aerobic capacity and the contribution by body composition and haemoglobin concentration: A study in young indian national hockey players. J. Clin. Diagn. Res. 2016, 10, CC09–CC13. [Google Scholar] [CrossRef]
- Wheatley, C.M.; Snyder, E.M.; Johnson, B.D.; Olson, T.P. Sex differences in cardiovascular function during submaximal exercise in humans. Springerplus 2014, 3, 445. [Google Scholar] [CrossRef] [Green Version]
- Nelson, M.J.; Buckley, J.D.; Thomson, R.L.; Clark, D.; Kwiatek, R.; Davison, K. Diagnostic sensitivity of 2-day cardiopulmonary exercise testing in Myalgic Encephalomyelitis/Chronic Fatigue Syndrome. J. Transl. Med. 2019, 17, 80. [Google Scholar] [CrossRef]
- van Campen, C.L.M.C.; Rowe, P.C.; Visser, F.C. Validity of 2-day cardiopulmonary exercise testing in male patients with myalgic encephalomyelities/chronic fatigue syndrome. Adv. Phys. Education. 2020, 10, 68–80. [Google Scholar] [CrossRef] [Green Version]
- Del Core, M.A.; Ahn, J.; Wukich, D.K.; Liu, G.T.; Lalli, T.; VanPelt, M.D.; Raspovic, K.M. Gender differences on SF-36 patient-reported outcomes of diabetic foot disease. Int. J. Low Extrem. Wounds. 2018, 17, 87–93. [Google Scholar] [CrossRef] [PubMed]
- Elmariah, S.; Goldberg, L.R.; Allen, M.T.; Kao, A. Effects of gender on peak oxygen consumption and the timing of cardiac transplantation. J. Am. Coll Cardiol. 2006, 47, 2237–2242. [Google Scholar] [CrossRef] [Green Version]
- Faro, M.; Saez-Francas, N.; Castro-Marrero, J.; Aliste, L.; Fernandez de Sevilla, T.; Alegre, J. Gender differences in chronic fatigue syndrome. Reum. Clin. 2016, 12, 72–77. [Google Scholar] [CrossRef] [PubMed]
- Lai, N.; Martis, A.; Belfiori, A.; Tolentino-Silva, F.; Nasca, M.M.; Strainic, J.; Cabrera, M.E. Gender differences in V O2 and HR kinetics at the onset of moderate and heavy exercise intensity in adolescents. Physiol Rep. 2016, 4, e12970. [Google Scholar] [CrossRef] [PubMed]
- van Campen, C.L.M.C.; Visser, F.C. Validity of 2-day cardiopulmonary exercise testing in female patients with myalgic encephalomyelitis/chronic fatigue syndrome. Int. J. Curr. Res. 2020, 12, 10436–10442. [Google Scholar]
- van Campen, C.L.M.C.; Rowe, P.C.; Visser, F.C. Two-Day cardiopulmonary exercise testing in females with a severe grade of myalgic encephalomyelitis/chronic fatigue syndrome: Comparison with patients with mild and moderate disease. Healthcare 2020, 8, 192. [Google Scholar] [CrossRef]
- Lien, K.; Johansen, B.; Veierod, M.B.; Haslestad, A.S.; Bohn, S.K.; Melsom, M.N.; Kardel, K.R.; Iversen, P.O. Abnormal blood lactate accumulation during repeated exercise testing in myalgic encephalomyelitis/chronic fatigue syndrome. Physiol. Rep. 2019, 7, e14138. [Google Scholar] [CrossRef] [PubMed]
- Nijs, J.; de Meirleir, K.; Duquet, W. Kinesiophobia in chronic fatigue syndrome: Assessment and associations with disability. Arch. Phys. Med. Rehabil. 2004, 85, 1586–1592. [Google Scholar] [CrossRef]
- Martina, J.R.; Westerhof, B.E.; van Goudoever, J.; de Beaumont, E.M.; Truijen, J.; Kim, Y.S.; Immink, R.V.; Jöbsis, D.A.; Hollmann, M.W.; Lahpor, J.R.; et al. Noninvasive continuous arterial blood pressure monitoring with Nexfin(R). Anesthesiology 2012, 116, 1092–1103. [Google Scholar] [CrossRef] [PubMed] [Green Version]
- Glaser, S.; Koch, B.; Ittermann, T.; Schaper, C.; Dorr, M.; Felix, S.B.; Henry, V.; Ewert, R.; Hansen, J.E. Influence of age, sex, body size, smoking, and beta blockade on key gas exchange exercise parameters in an adult population. Eur. J. Cardiovasc. Prev. Rehabil. 2010, 17, 469–476. [Google Scholar] [PubMed]


| Male ME/CFS (n = 26) | Male ICF (n = 25) | p-Value | |
|---|---|---|---|
| Age (years) | 44 (12) | 43 (10) | 0.63 |
| Height (cm) | 183 (7) | 184 (8) | 0.73 |
| Weight (kg) | 85 (15) | 81 (11) | 0.31 |
| BMI (kg/m2) | 25.5 (4.0) | 224.2 (2.9) | 0.18 |
| BSA (m2) | 1.7 (0.2) | 1.6 (0.2) | 0.40 |
| Disease duration (years) | 12 (8) | 12 (9) | 0.97 |
| Disease severity grade ½ * | 10/16 (38/62%) | 16/9 (64/36%) | 0.07 * |
| Fibromyalgia present * | 7 | 0 | 0.005 |
| ME/CFS Males (n = 26) | ICF Males (n = 25) | |||||
|---|---|---|---|---|---|---|
| Peak Exercise | CPET-1 | CPET-2 | p-Value | CPET-1 | CPET-2 | p-Value |
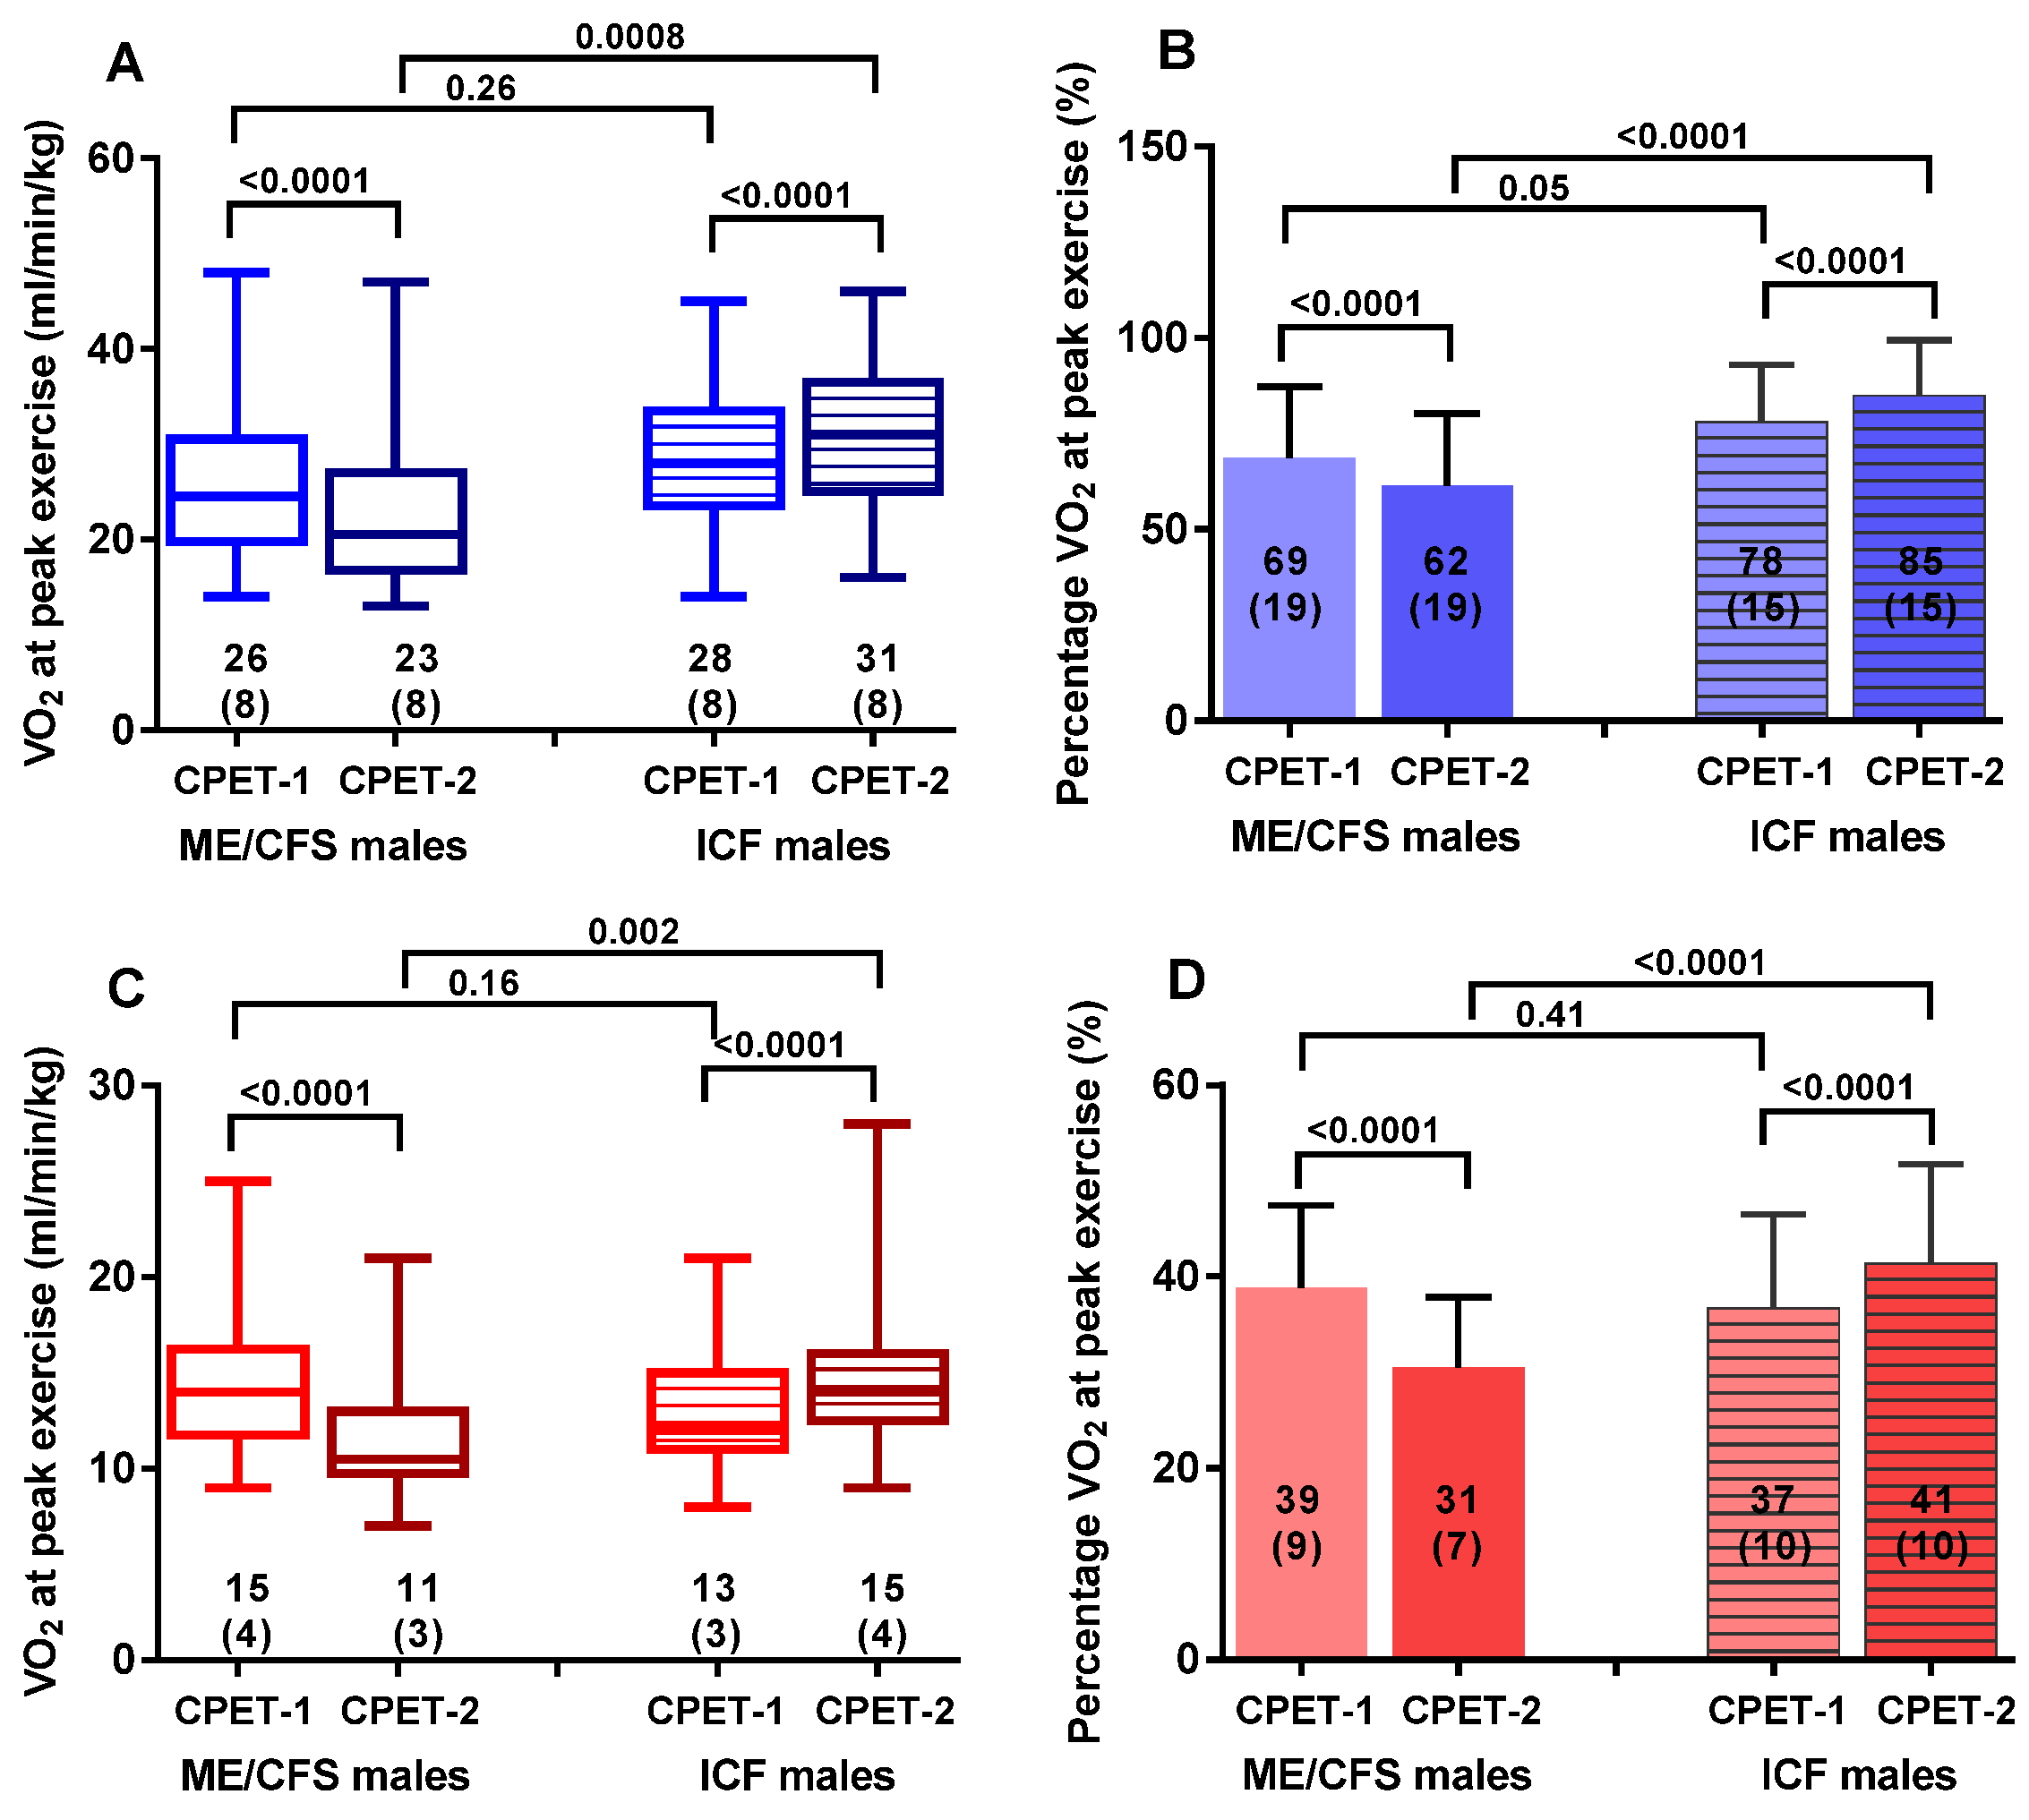
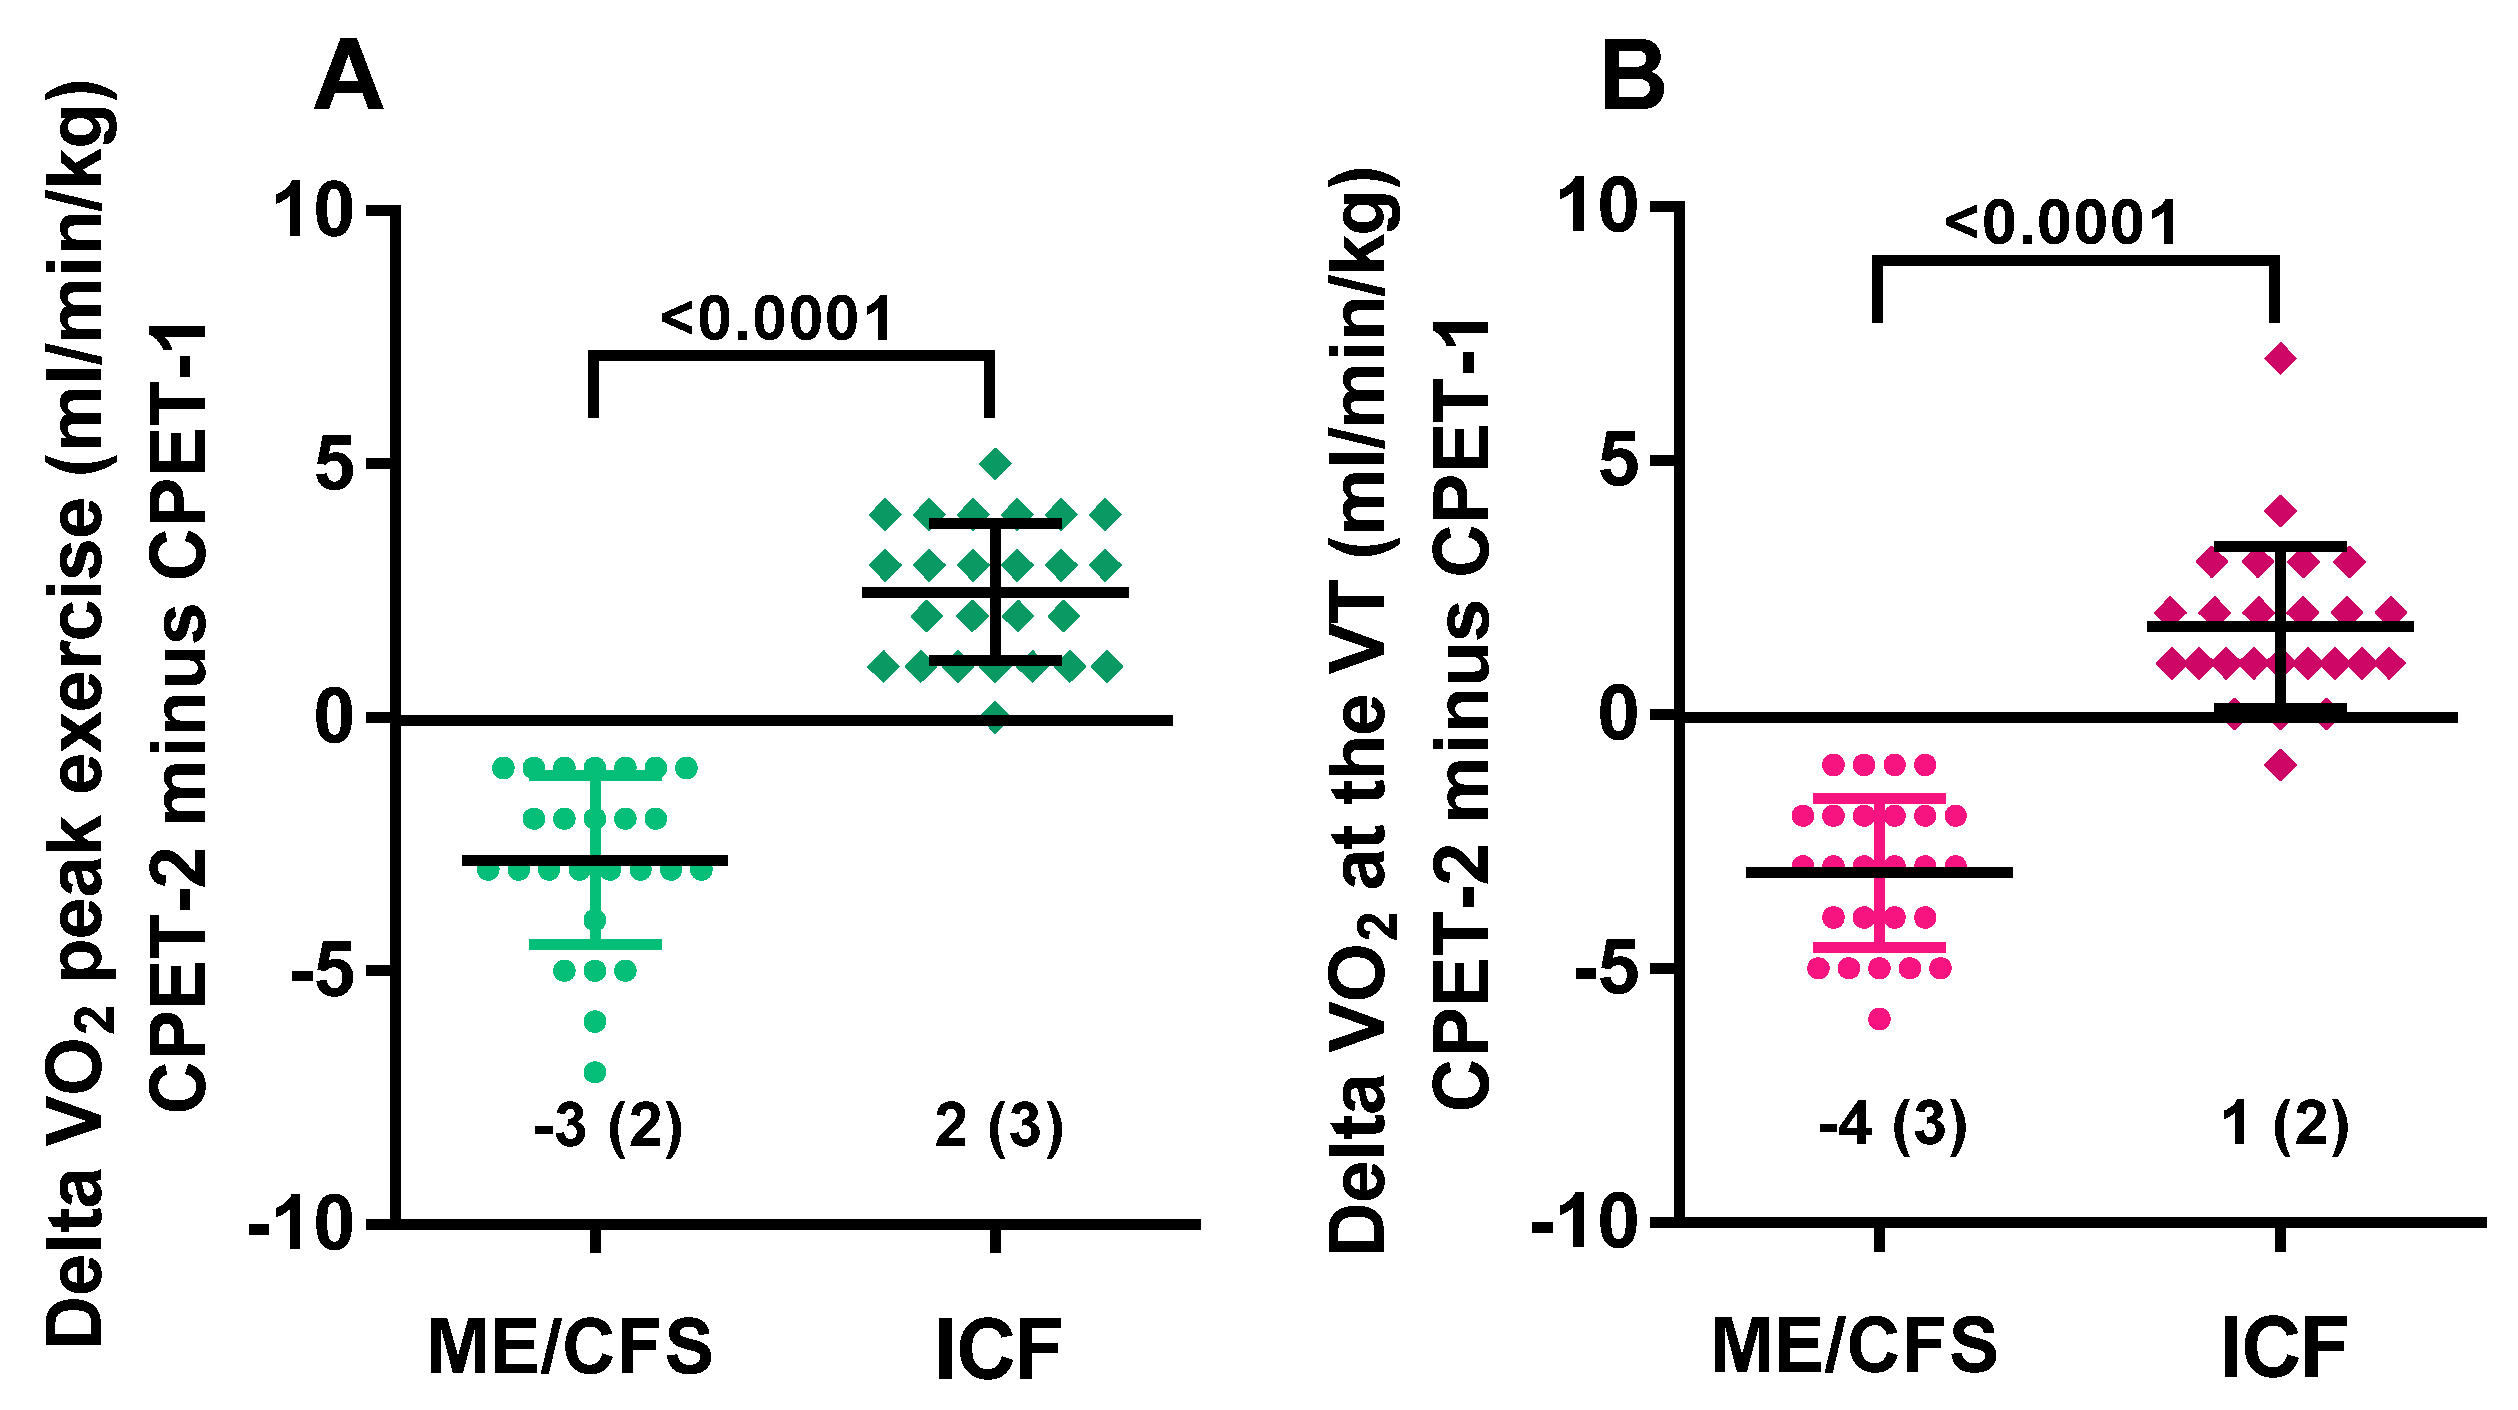
| VO2 peak (mL/min/kg) | 26 (8) | 23 (8) | <0.0001 | 28 (8) | 31 (8) | <0.0001 |
| %pred VO2 peak | 69 (19) | 62 (19) | <0.0001 | 78 (15) | 85 (15) | <0.0001 |
| HR rest (bpm) | 79 (12) | 78 (10) | 0.53 | 83 (11) | 83 (13) | 0.76 |
| HR peak (bpm) | 148 (23) | 138 (24) | <0.0001 | 160 (22) | 165 (20) | 0.002 |
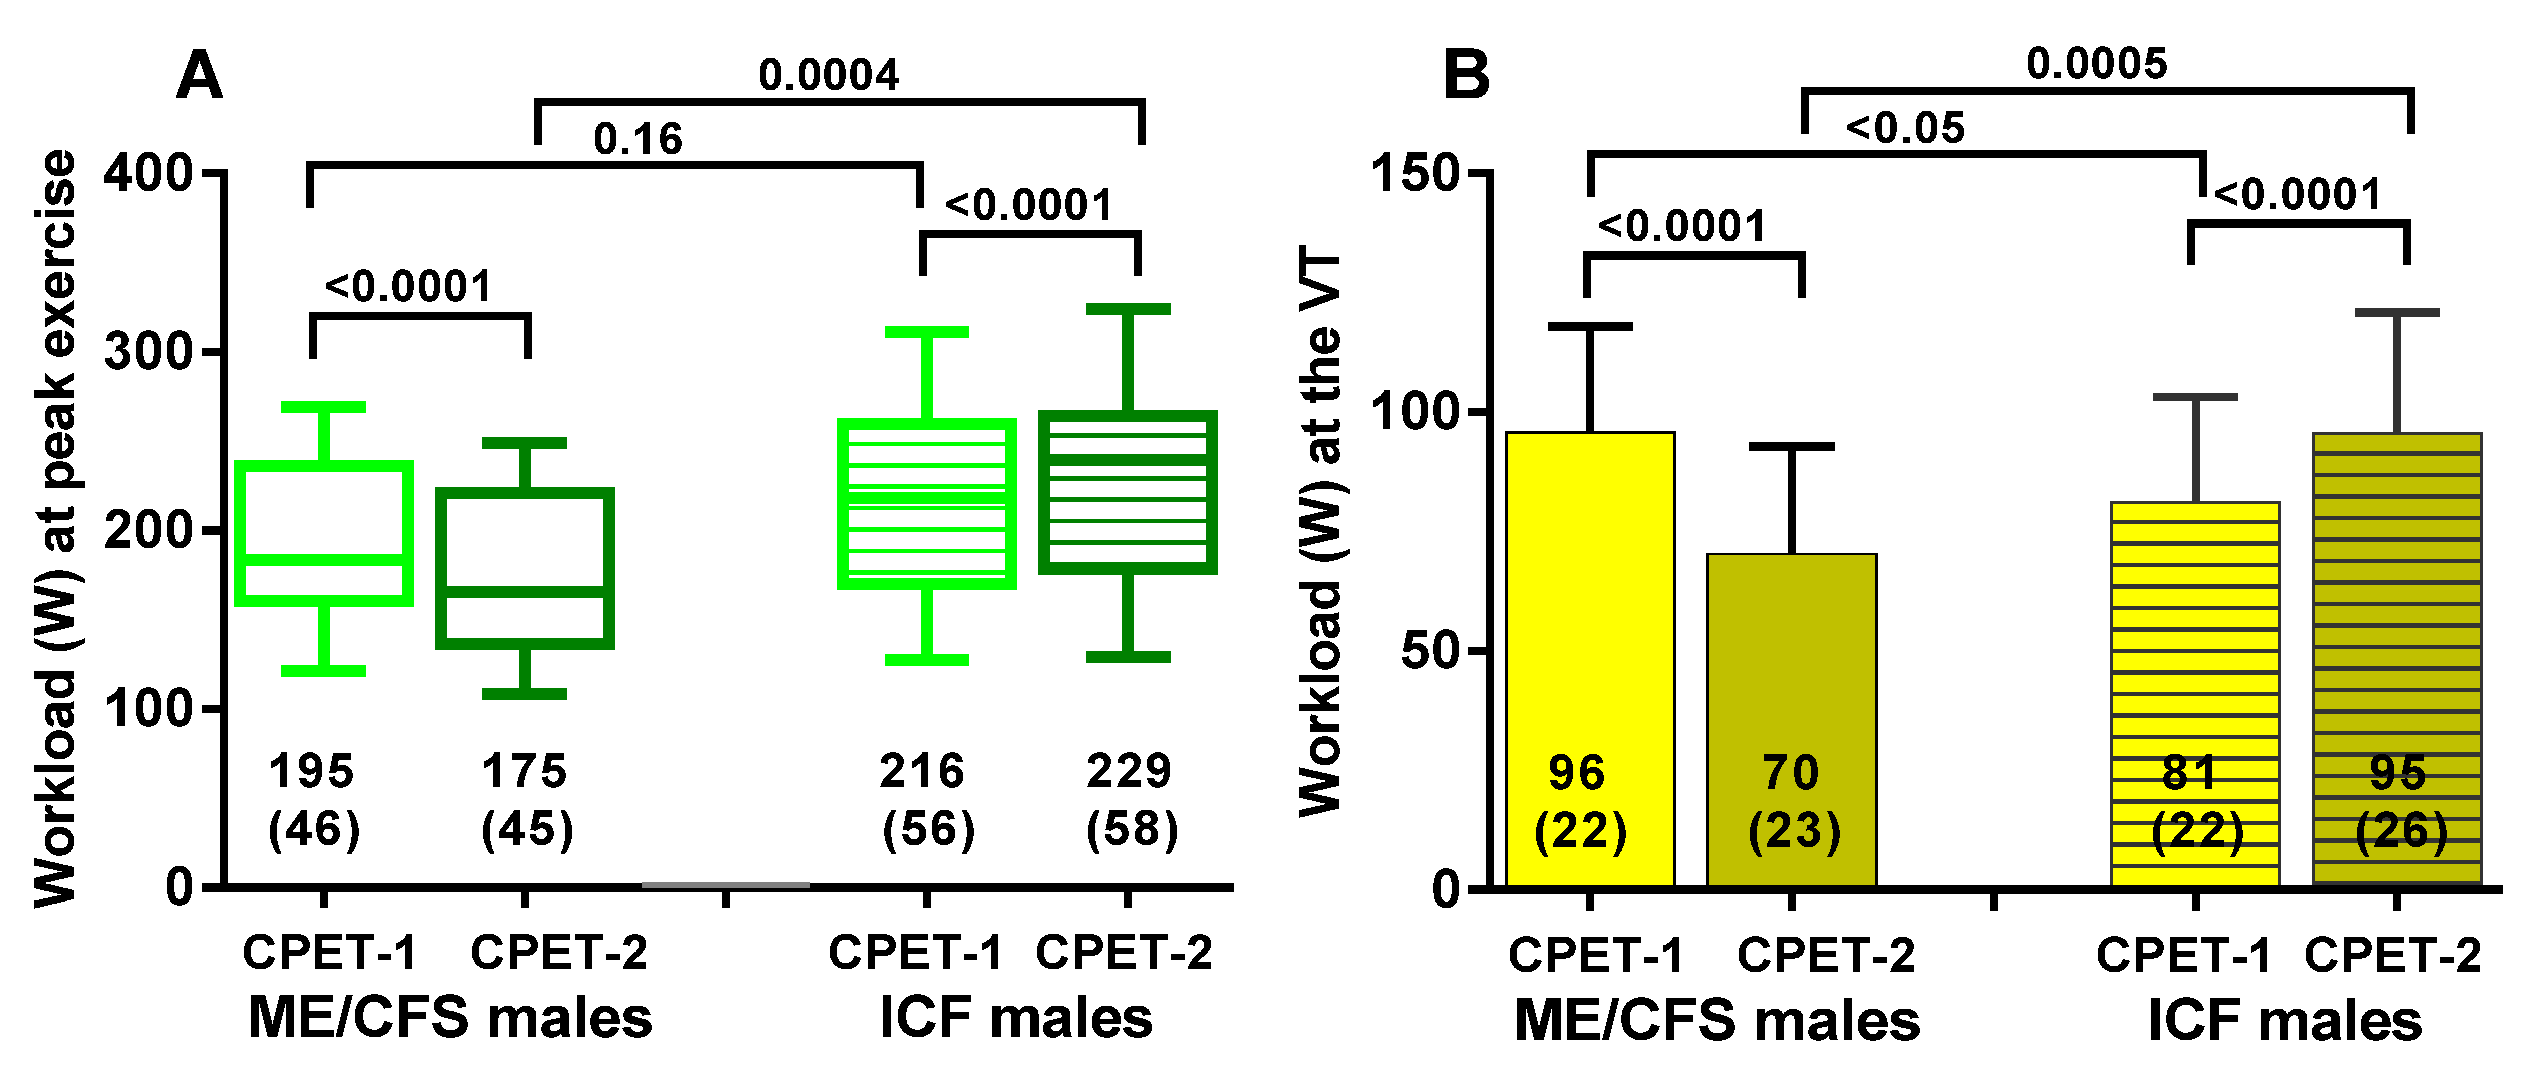
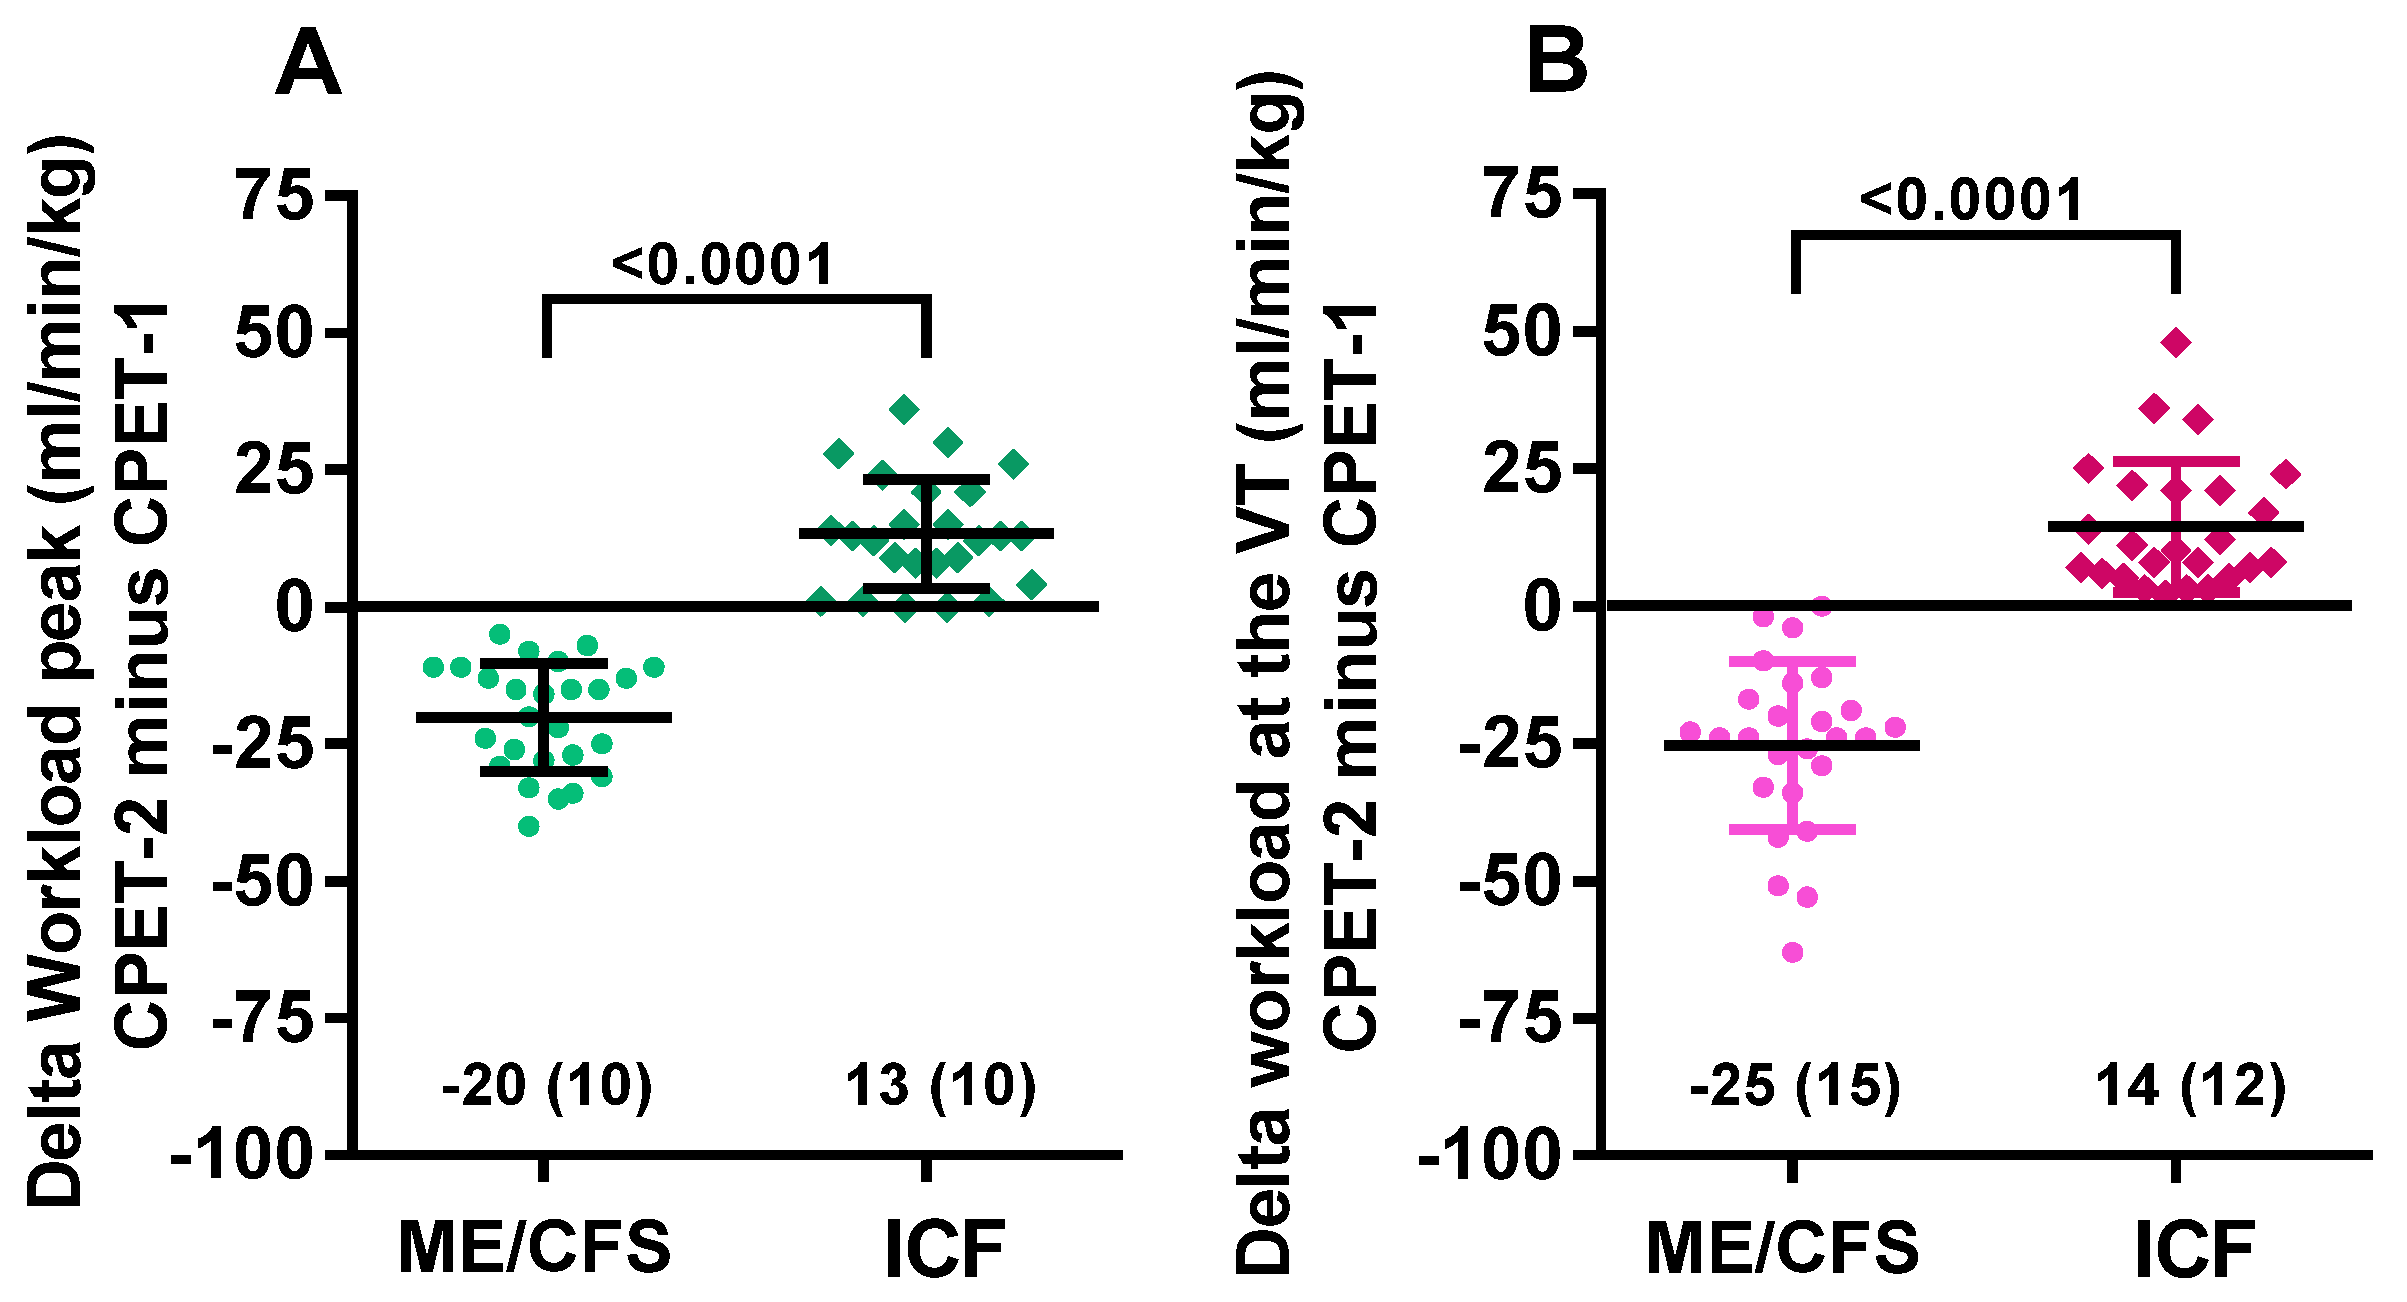
| Workload peak (Watts) | 195 (46) | 175 (45) | <0.0001 | 216 (56) | 229 (58) | <0.0001 |
| RER peak | 1.1 (0.1) | 1.1 (0.1) | 0.08 | 1.2 (0.1) | 1.2 (0.1) | 0.31 |
| Ventilatory Threshold | CPET-1 | CPET-2 | p-Value | CPET-1 | CPET-2 | p-Value |
| VO2 VT (mL/min/kg) | 15 (4) | 11 (3) | <0.0001 | 13 (3) | 15 (4) | <0.0001 |
| %pred VO2 VT | 39 (9) | 31 (7) | <0.0001 | 37 (10) | 41 (10) | <0.0001 |
| HR VT (bpm) | 109 (15) | 96 (12) | <0.0001 | 103 (12) | 109 (14) | 0.0002 |
| Workload VT (Watts) | 96 (22) | 70 (23) | <0.0001 | 81 (22) | 95 (26) | <0.0001 |
| Cpet Day-1 | Cpet Day-2 | |||||
|---|---|---|---|---|---|---|
| Peak Exercise | ME/CFS | ICF | p-Value | ME/CFS | ICF | p-Value |
| VO2 peak (mL/min/kg) | 26 (8) | 28 (8) | <0.0001 | 23 (8) | 31 (8) | 0.0008 |
| %pred VO2 peak | 69 (19) | 78 (15) | 0.05 | 62 (19) | 85 (15) | <0.0001 |
| HR rest (bpm) | 79 (12) | 83 (11) | 0.21 | 78 (10) | 83 (13) | 0.07 |
| HR peak (bpm) | 148 (23) | 160 (22) | 0.07 | 138 (24) | 165 (20) | <0.0001 |
| Workload peak (Watts) | 195 (46) | 216 (56) | 0.16 | 175 (45) | 229 (58) | 0.0004 |
| RER peak | 1.1 (0.1) | 1.2 (0.1) | 0.08 | 1.1 (0.1) | 1.2 (0.1) | 0.002 |
| Ventilatory Threshold | ME/CFS | ICF | p-Value | CPET-1 | CPET-2 | p-Value |
| VO2 VT (mL/min/kg) | 15 (4) | 13 (3) | 0.16 | 11 (3) | 15 (4) | 0.002 |
| %pred VO2 VT | 39 (9) | 37 (10) | 0.41 | 31 (7) | 41 (10) | <0.0001 |
| HR VT (bpm) | 109 (15) | 103 (12) | 0.13 | 96 (15) | 109 (14) | 0.001 |
| Workload VT (Watts) | 96 (22) | 81 (22) | <0.05 | 70 (23) | 95 (26) | 0.0005 |
Publisher’s Note: MDPI stays neutral with regard to jurisdictional claims in published maps and institutional affiliations. |
© 2021 by the authors. Licensee MDPI, Basel, Switzerland. This article is an open access article distributed under the terms and conditions of the Creative Commons Attribution (CC BY) license (https://creativecommons.org/licenses/by/4.0/).
Share and Cite
van Campen, C.M.C.; Visser, F.C. Comparing Idiopathic Chronic Fatigue and Myalgic Encephalomyelitis/Chronic Fatigue Syndrome (ME/CFS) in Males: Response to Two-Day Cardiopulmonary Exercise Testing Protocol. Healthcare 2021, 9, 683. https://0-doi-org.brum.beds.ac.uk/10.3390/healthcare9060683
van Campen CMC, Visser FC. Comparing Idiopathic Chronic Fatigue and Myalgic Encephalomyelitis/Chronic Fatigue Syndrome (ME/CFS) in Males: Response to Two-Day Cardiopulmonary Exercise Testing Protocol. Healthcare. 2021; 9(6):683. https://0-doi-org.brum.beds.ac.uk/10.3390/healthcare9060683
Chicago/Turabian Stylevan Campen, C. (Linda) M. C., and Frans C. Visser. 2021. "Comparing Idiopathic Chronic Fatigue and Myalgic Encephalomyelitis/Chronic Fatigue Syndrome (ME/CFS) in Males: Response to Two-Day Cardiopulmonary Exercise Testing Protocol" Healthcare 9, no. 6: 683. https://0-doi-org.brum.beds.ac.uk/10.3390/healthcare9060683