Article

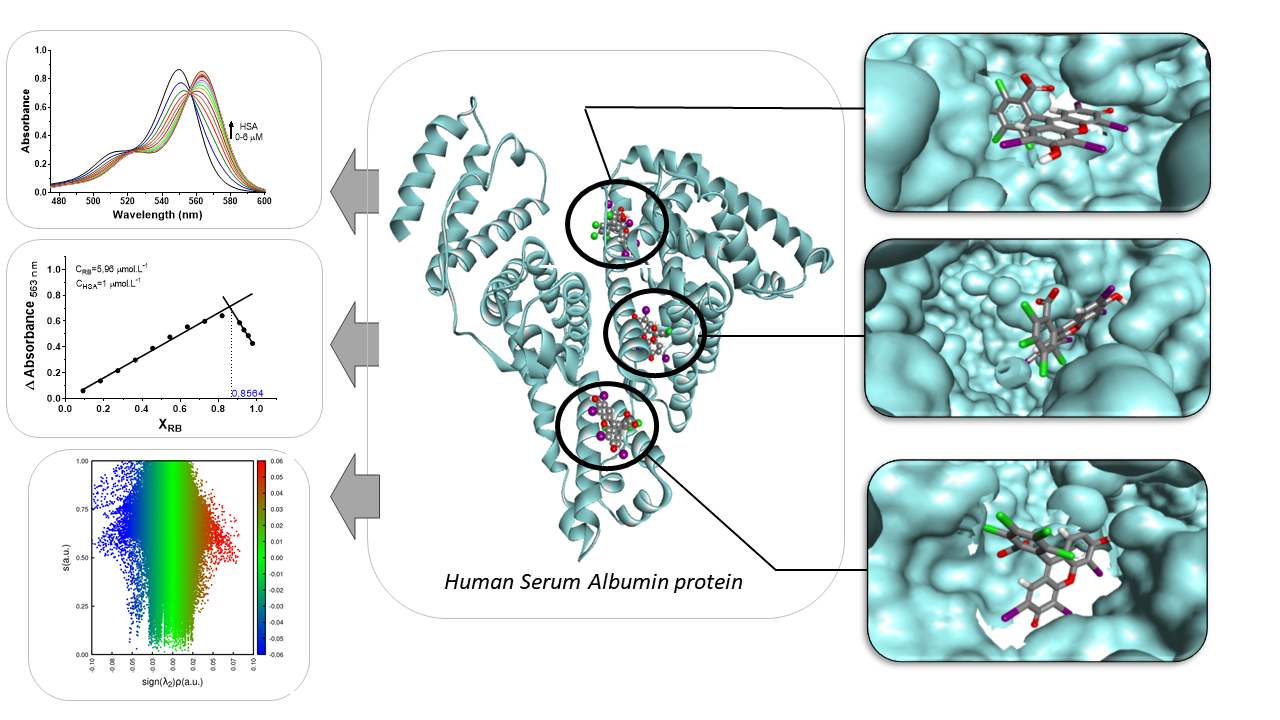
Studies on the Interaction of Rose Bengal with the Human Serum Albumin Protein under Spectroscopic and Docking Simulations Aspects in the Characterization of Binding Sites

by
Maurício I. Yoguim
1,*,
Giulia S. Grandini
1,
Luiza de C. Bertozo
1,
Ignez Caracelli
2,
Valdecir F. Ximenes
1 and
Aguinaldo R. de Souza
1
1
Department of Chemistry, Faculty of Sciences, São Paulo State University, Av. Luiz Edmundo Carrijo Coube 14-01, Bauru 17033-360, Brazil
2
Department of Physics, Biomat, Federal University of São Carlos, Rod. Washington Luiz, km 235, s/n, São Carlos 13565-905, Brazil
*
Author to whom correspondence should be addressed.
Submission received: 28 September 2022 / Revised: 17 October 2022 / Accepted: 20 October 2022 / Published: 25 October 2022

Abstract

:
Rose Bengal (RB) is a xanthene dye used as a sensitizer to convert triplet (3O2) to singlet oxygen (1O2). This photophysical property makes it one of the most used dyes in photodynamic therapy. Thus, understanding its interaction with biomacromolecules can provide helpful information about its mode of action and application. The protein chosen for this study was human serum albumin (HSA), which has nine binding sites for fatty acids (FA), and at least three sites for interactions of drugs (DS). The complexation of HSA with RB caused a maximum bathochromic shift in its absorption. From this displacement and the application of the Benesi–Hildebrand model, the ligand–protein association constant (3.90 ± 0.08 × 10⁵ M−1) was obtained. Applying the Job’s Plot method resulted in a 6:1 (ligand-protein) stoichiometry. The determination of preferred binding sites was performed by measuring the association constant in the presence of drugs for which their binding sites in HSA are already well established, such as warfarin (DS1), ibuprofen (DS2 and FA6), digitoxin (DS3), diazepam (DS2), and diflunisal (DS2 and FA6). From these studies, it was found that RB is able to bind at DS1, DS3, and FA6 sites but not at DS2. Subsequently, molecular docking studies using the 2BX8 and 2BXE crystallographic structures were performed and corroborated the experimental results. The lowest energy poses were −52.13, −58.79, and −67.55 kcal mol−1 at DS1, DS3, and FA6, respectively. Conversely, DS2 was the lower affinity binding site. In conclusion, HSA has a high affinity for RB, being able to bind up to six dye molecules.

Graphical Abstract

1. Introduction

2,3,4,5-tetrachloro-6-(3-hydroxy-2,4,5,7-tetraiodo-6-oxo-xanthen-9-yl)benzoic acid, known as Rose of Bengal (RB) or acid red 94 (Figure 1), is a tetraiodo-substituted anhydrous salt belonging to the class of xanthenes present in the molecules of fluorescein and rhodamine, and derivatives [1,2]. The structure of xanthene has a relative orientation between planes with benzene and is close to an orthogonal orientation, making the two parts of the molecule almost independent, as the photophysical characteristics of RB are related to the xanthene moiety [3,4]. RB has been widely applied as a sensitizer for the photogeneration of singlet oxygen (1O2), used in photochemical reactions and photodynamic therapy in medicine [5,6,7,8]. Due to its various properties, RB has assumed a peculiar role in different fields, mainly in the medical field, in which it is widely used in ophthalmological diagnoses of the pathology known as “dry eye”. Recent studies report the use of the dye in therapies involving cancer cells [9]. Studies of the interaction between biological macromolecules, such as proteins and drugs, are of great relevance, as they provide valuable information that allows understanding of the formation of molecular complexes, enabling the proposition of reaction mechanisms, recognition and identification of sites of connection, and determination of the interactions involved.
One of the main biological macromolecules in our body is the human serum albumin protein (HSA). This protein has properties such as maintaining oncotic pressure and pH in the bloodstream. One of its primary functions in the body is interacting with various endogenous and exogenous compounds such as bilirubin, fatty acids, and drugs, respectively. The HSA protein also plays a crucial role in the pharmacokinetics and toxicokinetic of drugs and toxins [10,11,12].
HSA is organized into three domains, called I, II, and III, where each domain comprises two subdomains: A and B. There are three main binding sites for drugs (Figure 2a): Sudlow I site, or Drug Site 1 (DS1), located in subdomain IIA; Sudlow II site, or Drug Site 2 (DS2), in subdomain IIIA; and site III (DS3) located in the IB subdomain. In the classification for binding sites corresponding to fatty acids, nine regions result (Figure 2b).
In the present work, the association constant (Ka) of the RB-HSA complex was determined. The predominant conformer for each binding site was studied using molecular docking techniques.

2. Materials

2.1. Experimental Studies

The chemical compounds used in this work were: Rose Bengal (RB), human serum albumin (HSA), ibuprofen, warfarin, diflunisal, diazepam, digitoxin, and biliverdin all from Sigma-Aldrich Chemical Co. (St. Louis, MO, USA).

2.2. Molecular Docking Studies

Molecular docking studies were performed using the Genetic Optimization for Ligand Docking 5.5 (GOLD) software, developed by Cambridge Crystallographic Data Center (CCDC). The Coordination for the Improvement of Higher Education Personnel (Capes) made the software available. The protein crystal structures and ligands were analyzed in the Discovery Studio Visualizer 2019 (DS) software, developed by Dassault System. RMSD calculations were determined using Chimera 1.15 software, developed by UCSF Resource for Biocomputing, Visualization, and Informatics. Interaction studies were performed using the NCIplot software and visualized using the Visual Molecular Dynamics (VMD) software.

3. Methodologies

3.1. Experimental Studies

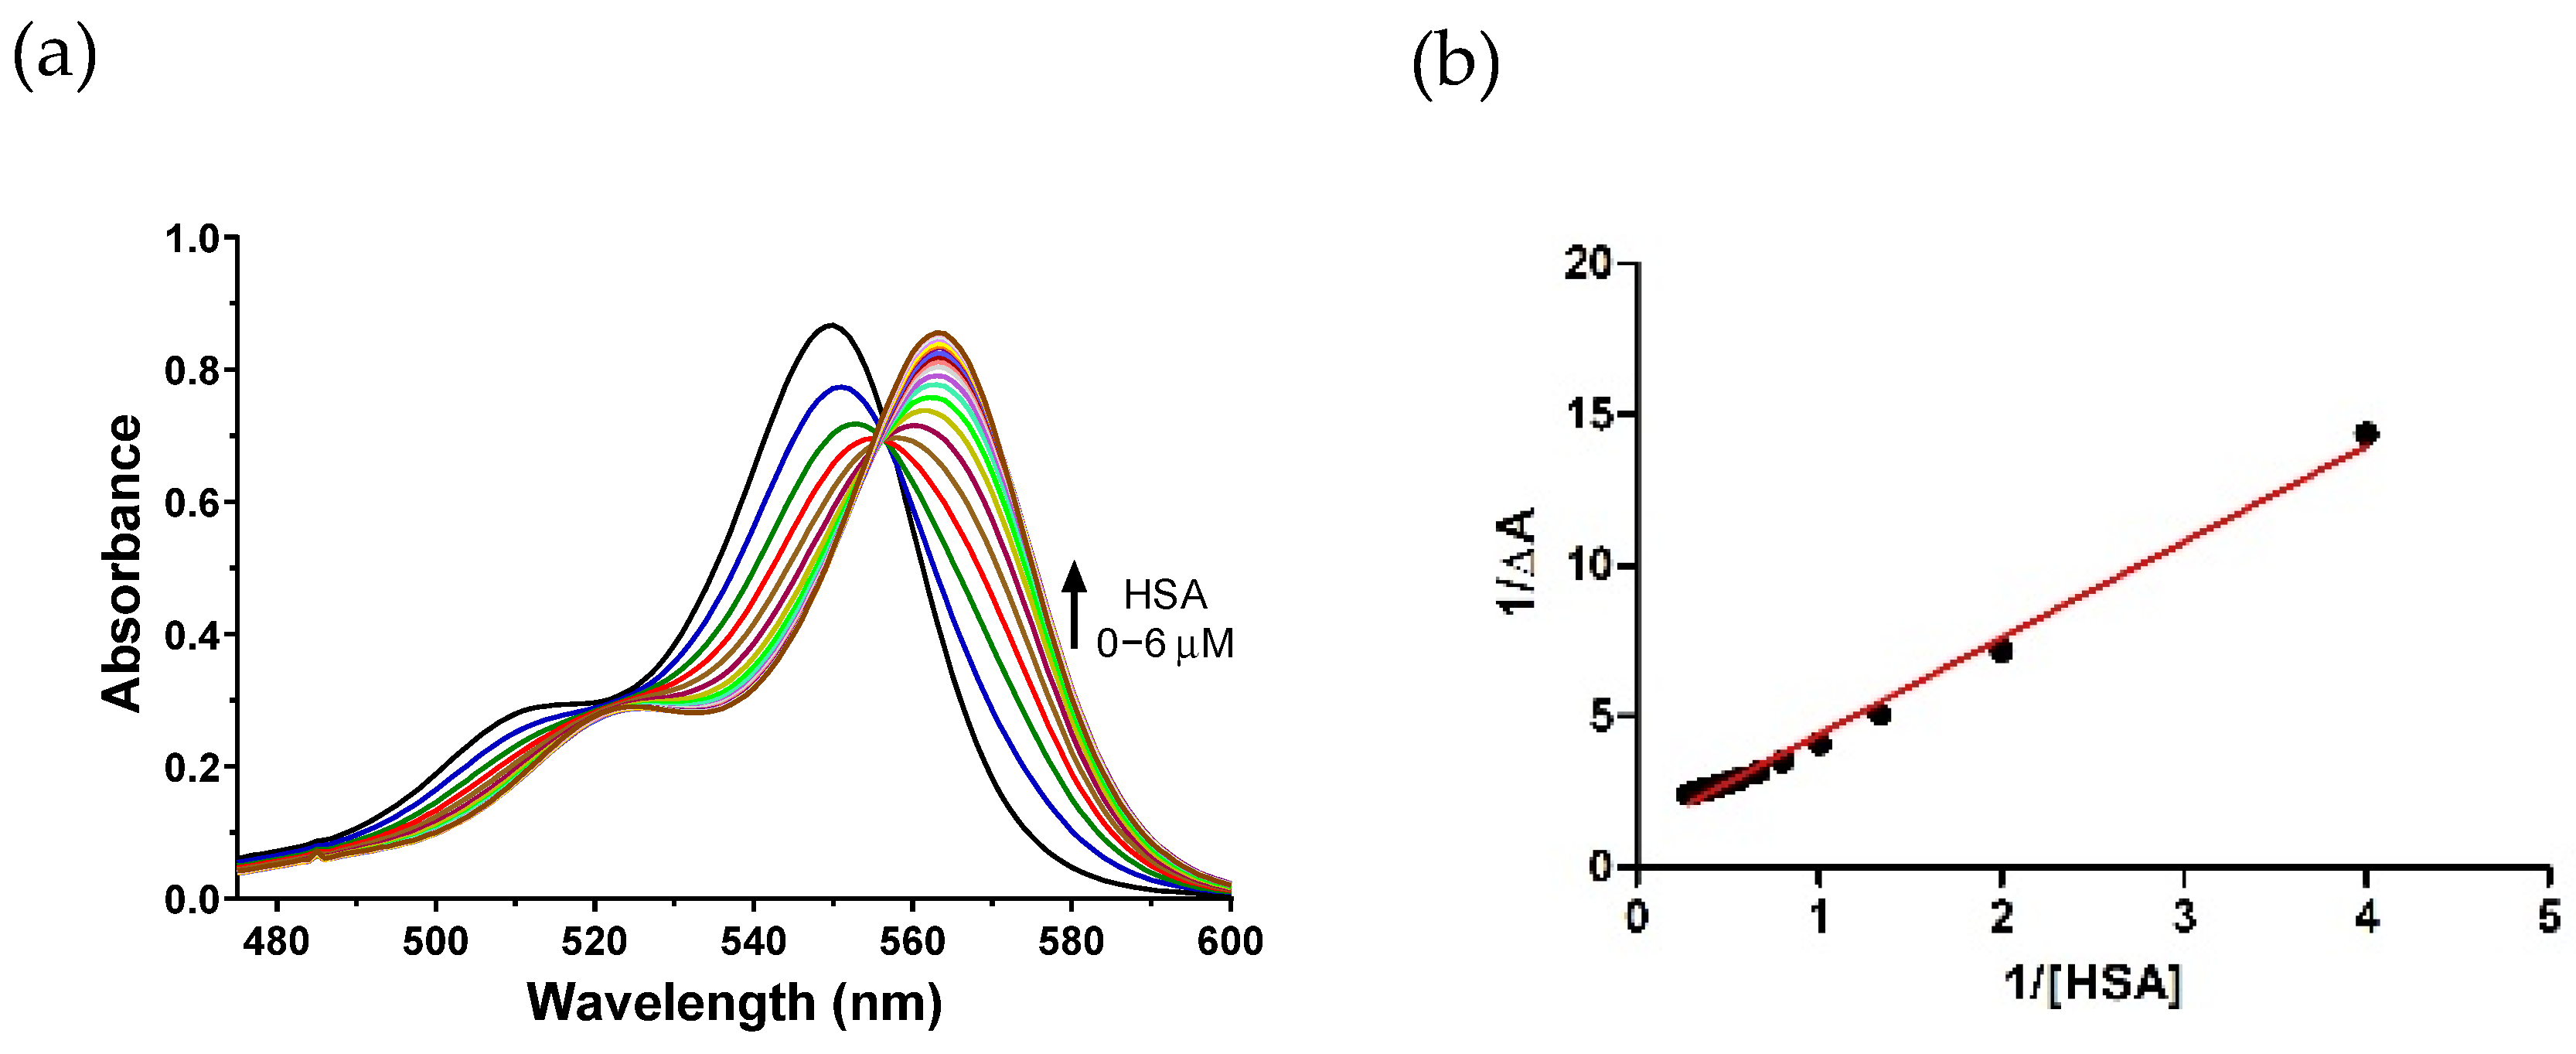
3.1.1. Determination of the Binding Constant

The ultraviolet spectrum was measured in a Cary 8454 ultraviolet equipment (Agilent Technologies — Santa Clara, CA, USA) coupled to the R1 stirring equipment (Grant) and also used a quartz cuvette (3.0 mL) with an optical path of 10.0 nm. The ultraviolet spectra of the RB dye were studied in the presence and absence of the HSA protein (room temperature), being analyzed at a wavelength from 450 to 600 nm. In the experiment, the concentration of RB remained constant (10.0 μM), and the concentration of HSA gradually increased (0 to 6.0 μM, with intervals of 0.25 μM).

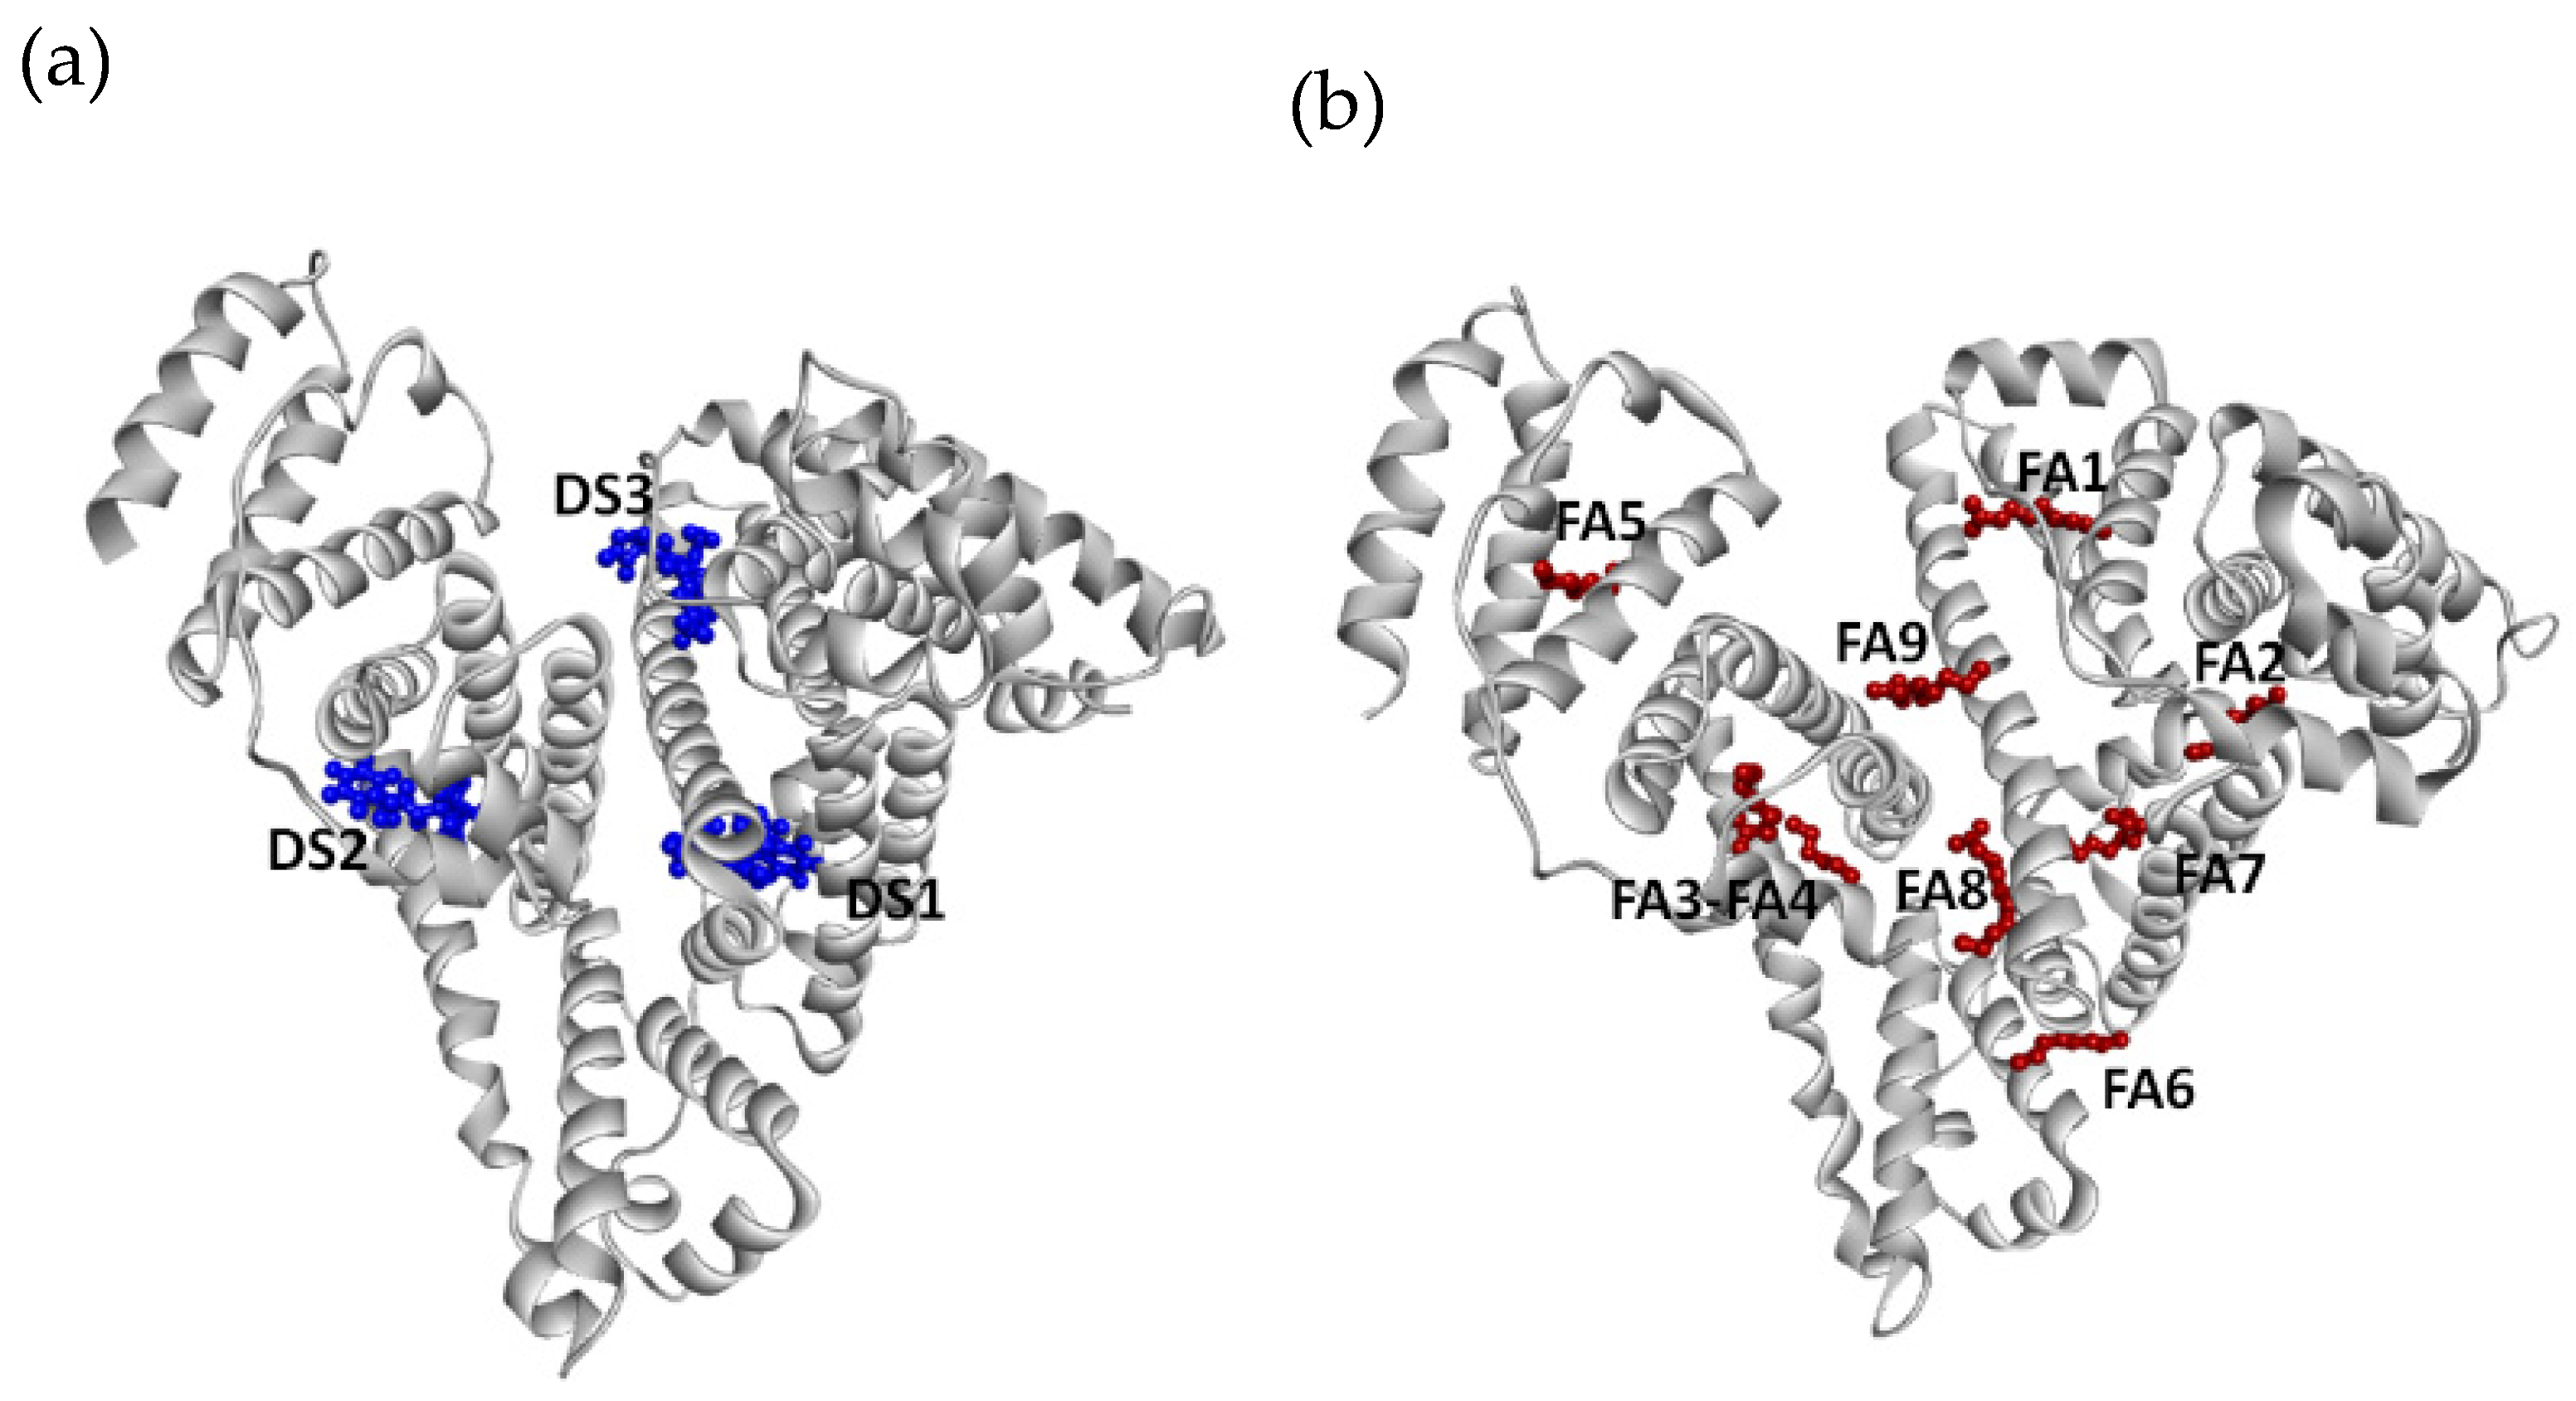
3.1.2. Determination of the Binding Site in the HSA

This technique to determine the preferred site of the RB dye to the HSA protein involves a competition between the specific drug at each site and the dye. Thus, the following drugs were used: Warfarin (DS1); Ibuprofen, Diflunisal, Diazepam (DS2); Digitoxin and Biliverdin (DS3), and Ibuprofen and Diflunisal also have a second interaction region (FA6) [14,15,16]. Initially, the spectrum of 20 μL of the RB dye (1.0 mM) was obtained. Then, 20 μL of the drug (1.0 mM) and a two-minute interval were allowed to perform the spectral analysis again. Then, the addition of the protein was started (aliquots of 2.5 μL of HSA), and after each addition and incubation for two minutes, the spectra were obtained.

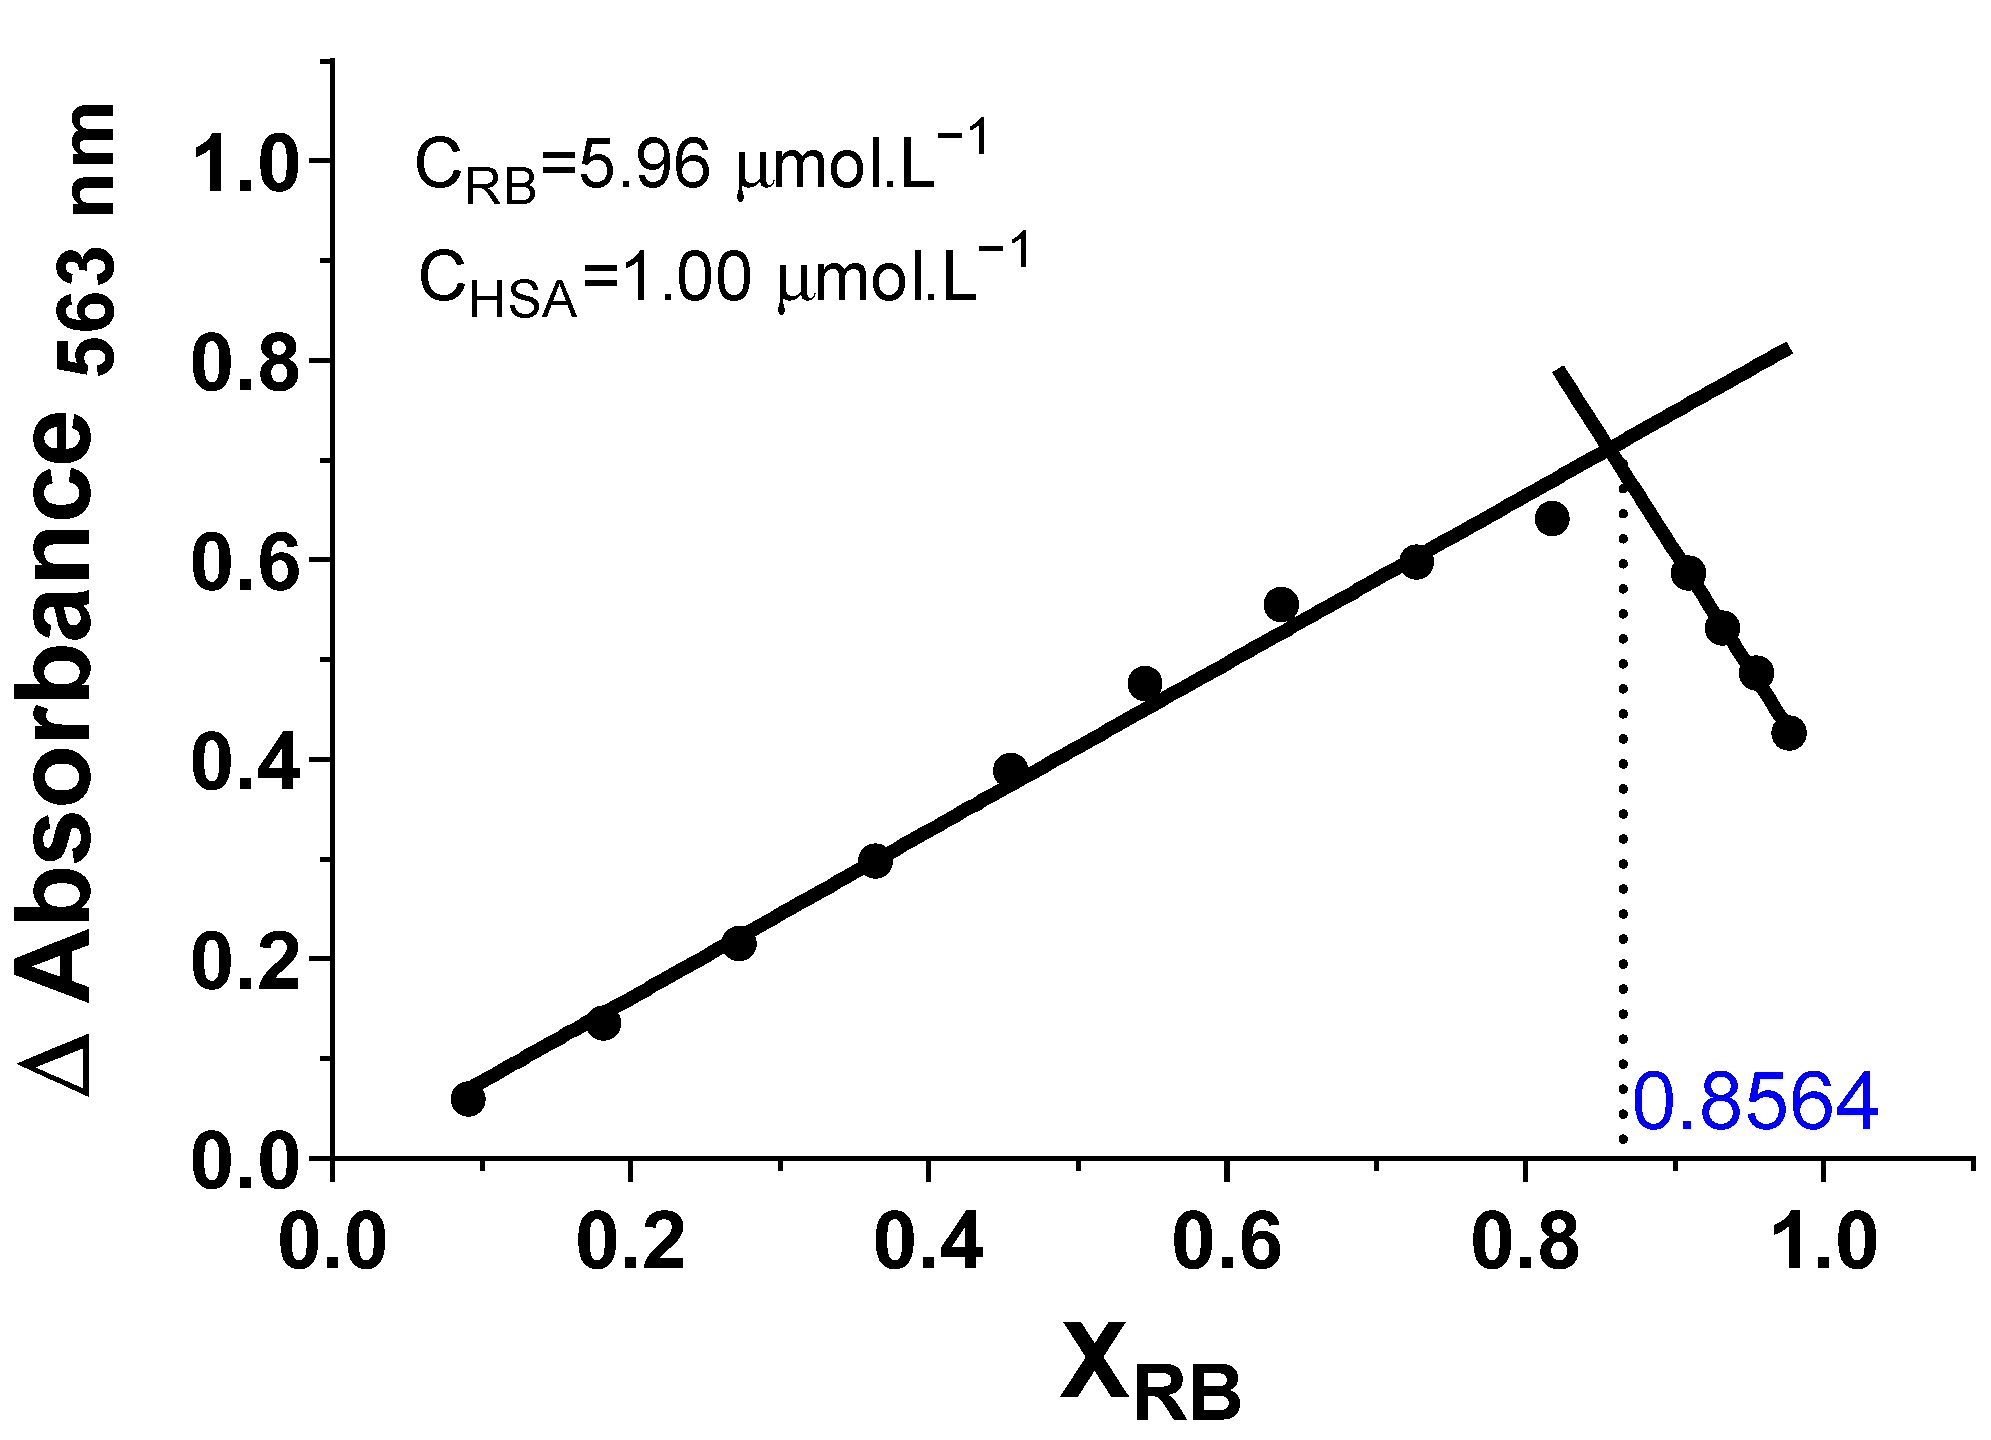
3.1.3. Determination of the Proportional Amount between Ligand and Protein

The technique used to determine the proportion of RB dye bound in the HSA protein was the Job’s Plot method. Thirteen solutions were prepared, varying the concentrations of the RB dye and the HSA protein. This variation in the ligand and protein concentrations followed the requirement of keeping the sum of their concentration constant at 11.0 M.

3.2. Molecular Docking Studies

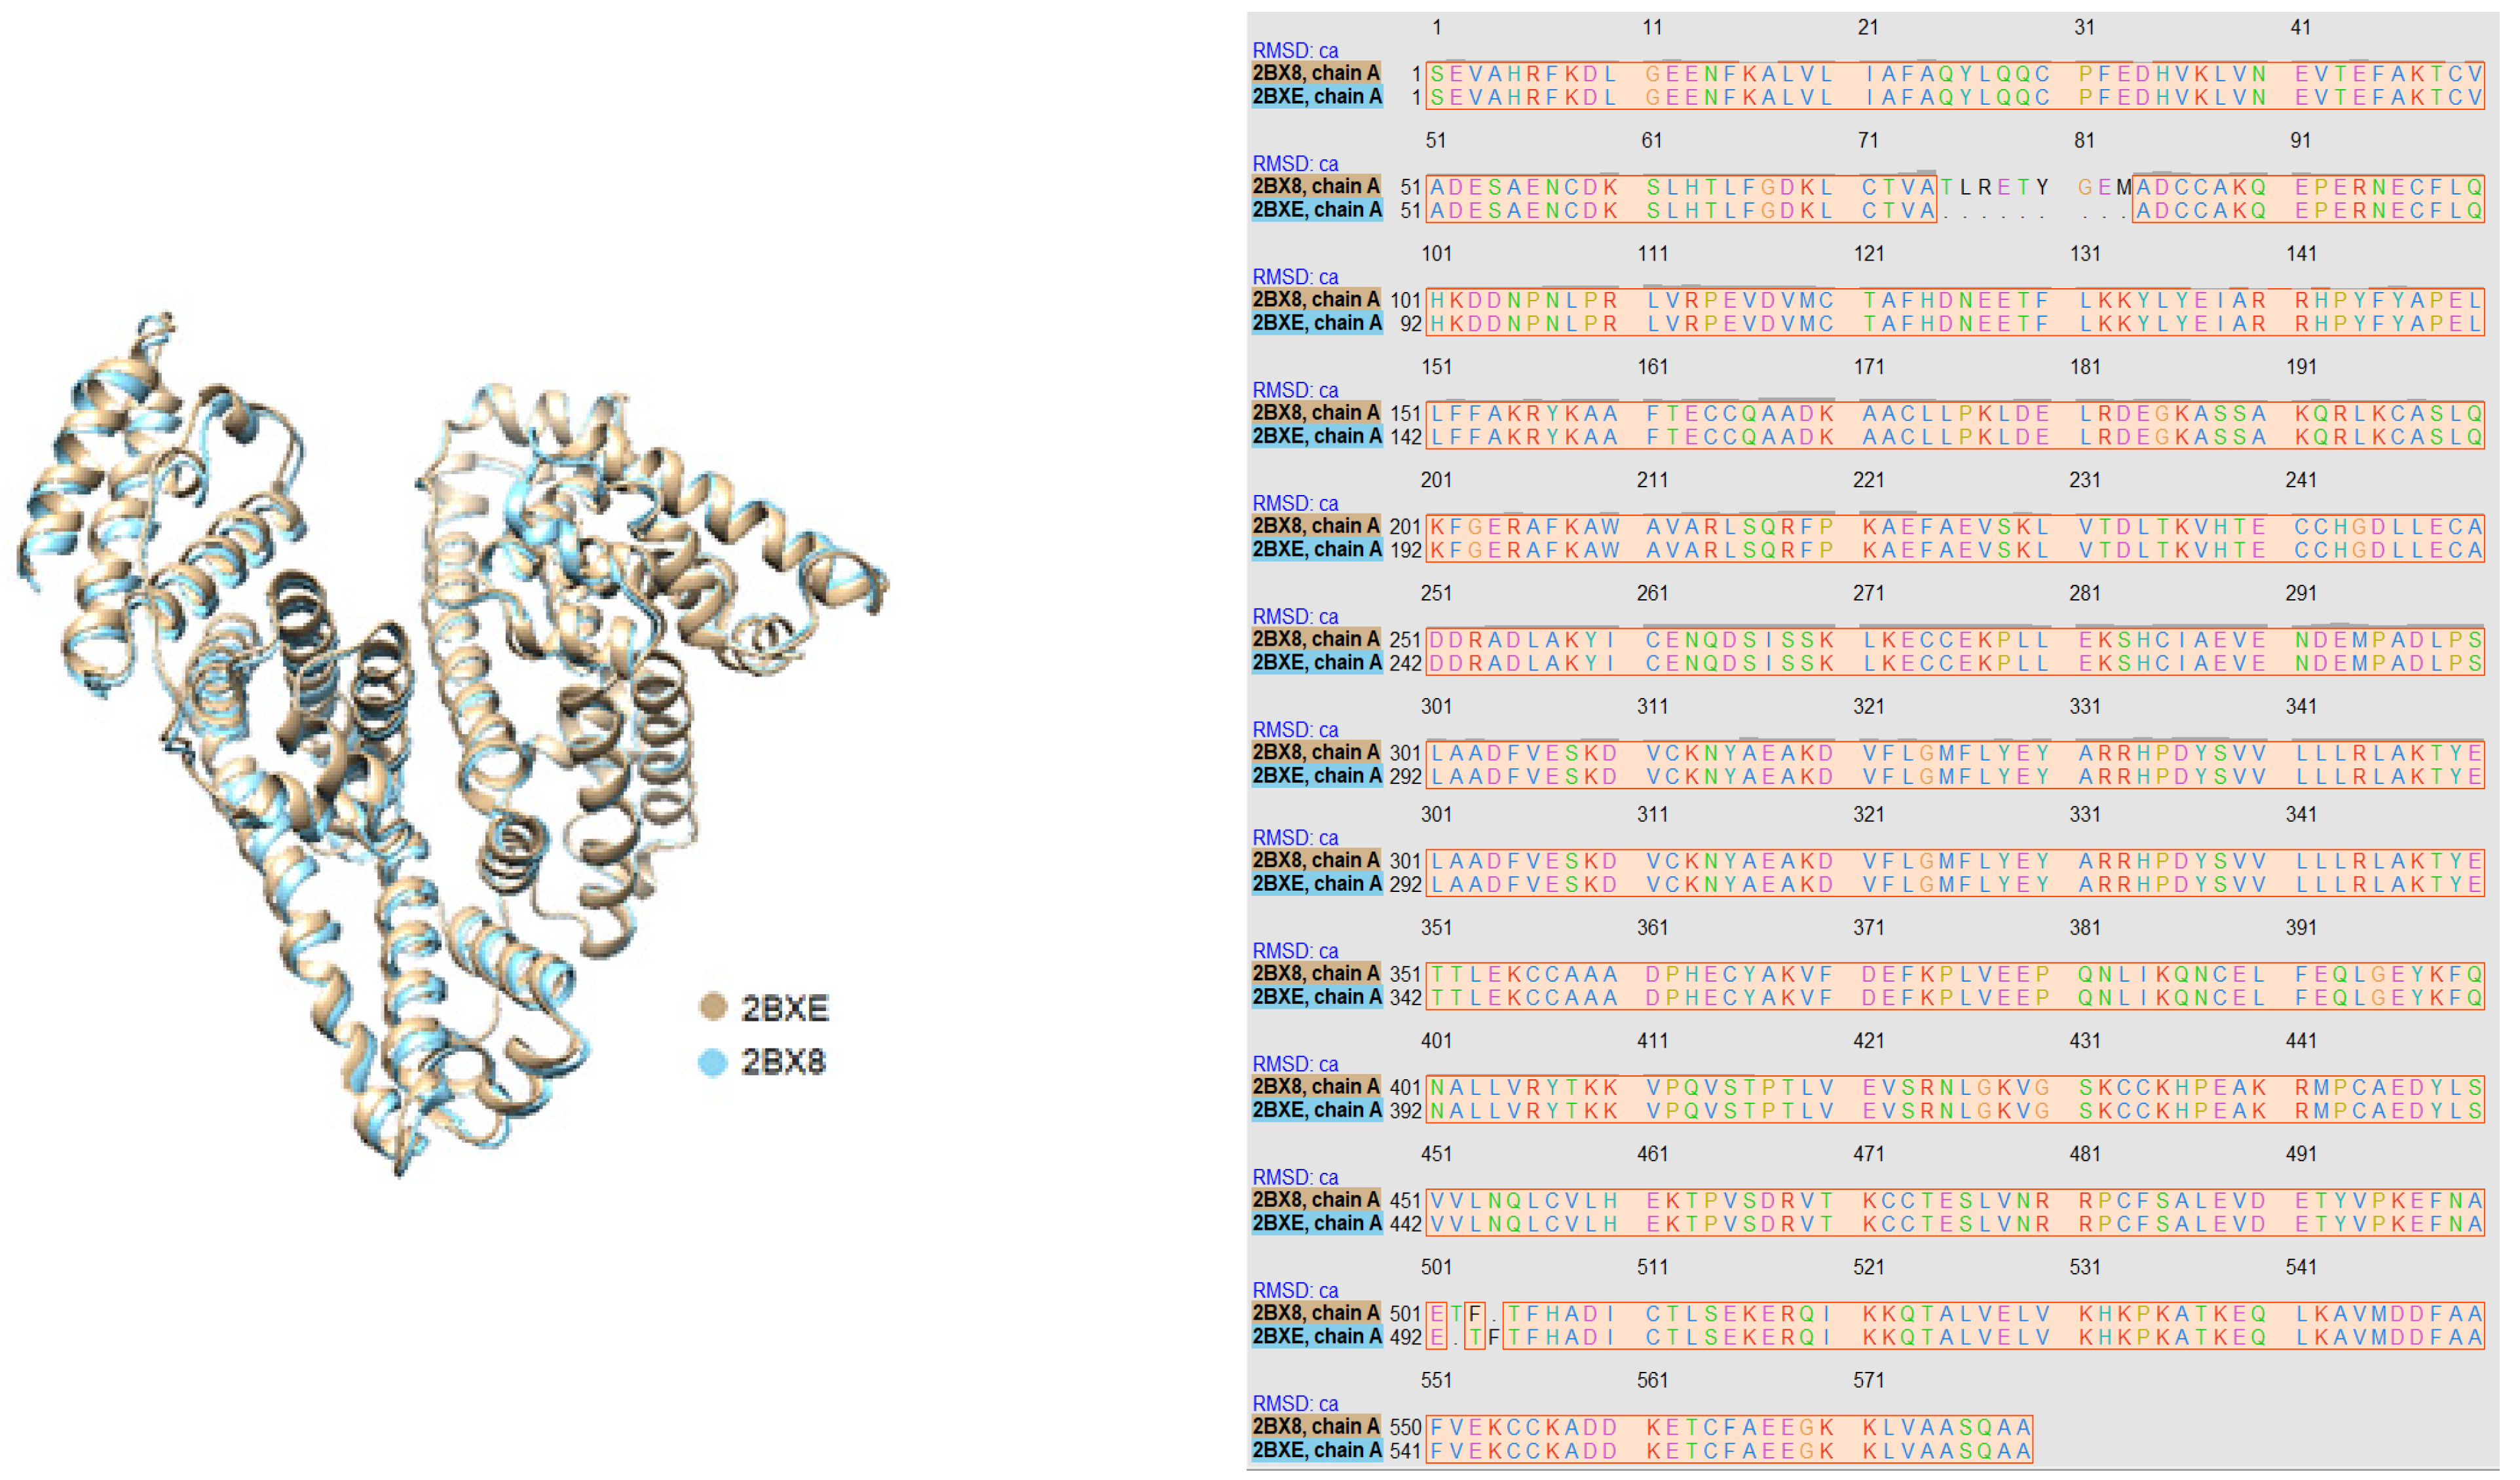
3.2.1. Protein Database

Two HSA structures were used in the simulations. The first has the azapropazone ligand at the DS1 and DS3 sites (PDB 2BX8) [14], with a resolution of 2.70 Å. The second is a structure of the HSA with the diflunisal ligand at the DS1, DS2, and FA6 sites (PDB 2BXE) [14], with a resolution of 2.95 Å. Due to the structures present in the ligands in the crystalline structure sites, there is a need to carry out the molecular redocking process.

3.2.2. Molecular Redocking

The molecular redocking process aims to reconstruct the protein-ligand complex that was in the crystallographic structure of HSA. In the DS software, all the water molecules present in the HSA structure were removed and then, in the GOLD 5.5, the hydrogen atoms were added. The molecular docking study was performed on PDBs 2BX8 and 2BXE, at the sites that will be studied in each crystal structure. For each one, the molecular redocking calculation was performed in ten runs, using the chemscore_kinase parameters, with a GoldScore scoring function, and under a study radius on the ligand of 6.0 Å. The results obtained from the molecular redocking study were analyzed in the DS software in relation to the visualization of the poses and also in relation to the energy scores of each conformer.

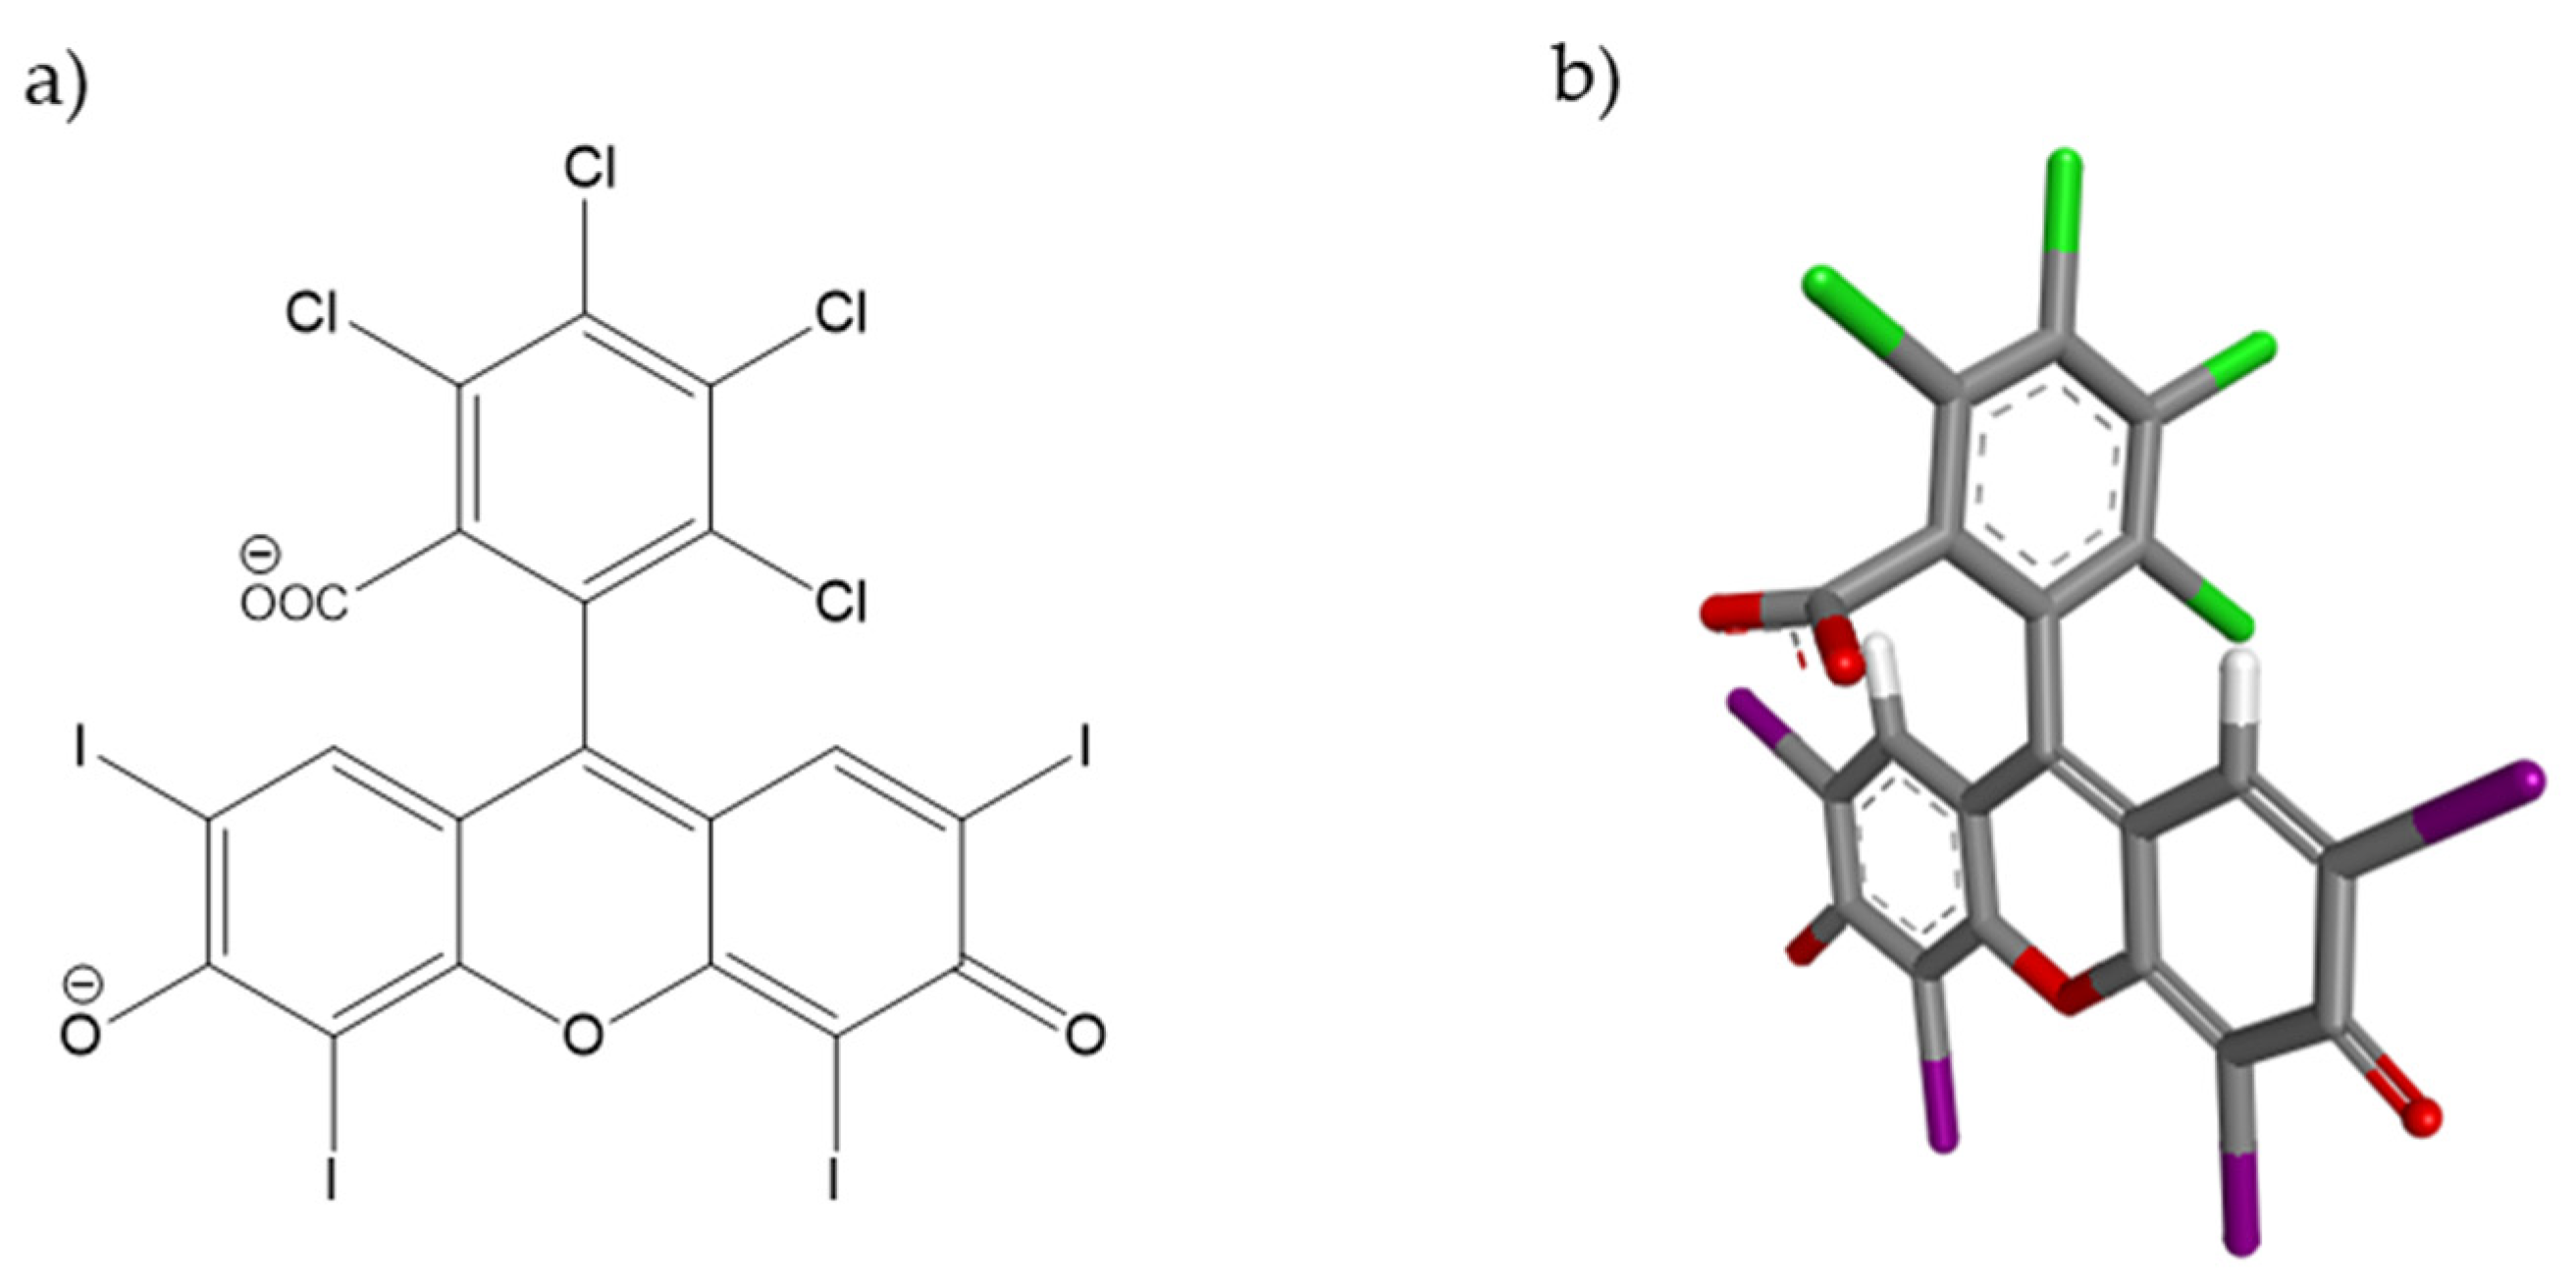
3.2.3. Conformational Structure of Rose Bengal Dye

The structure of the RB dye used in the molecular docking calculations was acquired from the PubChem website database. The chosen structure has the CID 25474 and is dated 26 March 2005.

3.2.4. Molecular Docking

After the analysis of the molecular redocking studies, the molecular docking studies continued. Thus, with the conformational structures of the ligand (obtained from Pubchem) and of the HSA protein (PDB), the appropriate procedures were carried out in GOLD 5.5 to study and verify which sites the RB dye has affinities. At each study site, hydrogen atoms were added and the GoldScore scoring function was used, which is based on Equation (1), where S (hb_ext) represents the LH energy of the ligand protein; S (vdw_ext), the energy of the protein-ligand van der Waals interactions, and S (int) is a penalty for not encouraging internal ligand interactions [17,18].
Fit function = S (hb_ext) + 1.3750 × S (vdw_ext) + S (int)
The analysis of the molecular docking results was carried out in two stages, the first being an analysis of the energy values corresponding to each conformer obtained in the study. The second step was performed with the help of the DS software, in which the poses obtained in the study were analyzed. Finally, the two pieces of information were correlated to obtain a better understanding of the results.
With the best results obtained by molecular docking, it was verified whether there would be the possibility of improving them; therefore, it involved studies with the amino acids of the side chains of each binding site, and this practice involves the process of protonating, flexing, or rotating the amino acids of the side chains. In this study, the same conditions prevailed as for the parameters previously adopted. With the new results, the same energy and pose analyzes were performed to then certify, by comparative analysis, which was the best condition that obtained the best results.

3.3. Studies to Determine the Attractive and Repulsive Interactions of the Interaction between the RB Dye and the HSA Protein

NCIplot software was used to study non-covalent interactions and stability between the molecule of interest and its binding site on the target protein [19,20,21]. NCIplot uses four algorithms to calculate non-covalent interactions based on electron density (ρ) and its reduced gradient (s). The inputs used in the calculations were the coordinates of RB (ligand) and HSA (protein) previously obtained in molecular docking studies. The keyword LIGAND indicates the algorithm that the density must be obtained in promolecular mode (promolecular mode). In promotional mode, a radius around the ligand is determined, so that interactions with the receptor are only computed within this radius. this type of calculation is recommended for very large systems, such as proteins, so that the density in the promolecular mode is an approximation of the electronic density [22]. NCIplot uses the external coordinates of the ligand to compute interactions from it up to a specified radius [23]. In the case of this work, the radius used was 5 Å.

4. Results and Discussions

4.1. Calculation of Ka in the Formation of the RB-HSA Complex

In Figure 3a, we can see that the RB dye has affinities to HSA because, in the aqueous medium, the RB dye (black line) has an absorption band with a maximum at 549 nm and, with the addition of HSA, it caused a bathochromic shift to 563 nm. We can also observe the formation of the isosbestic point, in which the wavelengths of the solutions have the same absorbance value [24], thus indicating the formation of the binding protein complex.
Still in Figure 3a, we can see that there is a saturation point (A), representing that the entire ligand is interacting with the protein [25], and this state was reached when a concentration of around 2.5 μM of HSA was obtained. From the absorbance values referring to λ = 563 nm of the spectra in Figure 3a, some relationships were determined based on the Benesi–Hildebrand equation (Equation (2). In this way, the values of the inverse relationship of the difference in the variation of the absorbance of the samples (presence of HSA-absence of HSA) were determined to plot a graph (Figure 3b) between the relationships of these values to the inverse of the protein concentration in each solution.
1 A A 0 = 1 A A 0 + 1 K a A A 0 × 1   P r o t e i n
There is a relationship between the absorbance values (A: experimental; A0: tending to the origin; A: tending to infinity), binding constant (Ka), and the concentration of the protein used. In the graph of Figure 3b, we can find the values of the angular and linear coefficients to then relate to the Benesi–Hildebrand equation (Equation (2) to calculate the Ka value of the RB-HSA complex, which was around 3.90 ± 0.08 (× 105) M. From these initial analyses, we can verify that the RB dye interacts with the HSA protein. This characteristic is of enormous importance, as HSA is considered the most abundant protein in the bloodstream, and it also has the characteristic of transporting nutrients and drugs in the human body. Based on the need to better understand this interaction between the dye and the protein, studies were continued to determine the preferential binding site for the formation of this complex.

4.2. Determination of the Binding Site

The choices of drugs used in this experiment were due to the knowledge, in the literature, of their regions of interactions in the HSA protein. The site competition methodology is based on the verification and comparison of Ka values referring to the formation of the complex in the presence and absence of another drug, which may have, or not, a decay in its value. The decay of the Ka value indicates that there was a competition between the RB dye and the drug, thus indicating that less complex RB-HSA structures are formed. Therefore, RB has affinities in the same region as the studied drug, and, if there was no change in the Ka value, it would indicate that the presence of this drug would not influence the interaction between the dye and the protein, remembering that Ka is determined by the equilibrium state of the concentration ratio of the complexed form by the free form (Equation (4)).
A + B A B  
K a =   A B A · B =   c o m p l e x e d   s t r u c t u r e   f r e e   s t r u c t u r e
Table 1 shows the Ka values referring to the interaction of the RB dye with HSA in the absence and presence of drugs. So, for studies with the presence of warfarin, we can say that the RB dye has an affinity for the DS1 site of the HSA protein, as there is a decrease in the Ka value, when it is compared to the value of native HSA. This is due to the fact that, probably, the warfarin structures would be hindering the binding of RB to the HSA protein in the DS1 region, thus causing this decrease in the Ka value.
In the experiment performed on DS2, three analyses were performed since initially it was performed in the presence of the drug ibuprofen, however, it was observed that this drug has two sites of interactions, the first being on DS2 and the second on FA6 [14,15,16]. Thus, the decay of the Ka value obtained in the presence of this drug could be correlated to the DS2 and/or FA6 site(s). With the difficulty of properly interpreting the results obtained in the presence of ibuprofen, we carried out studies with other drugs: diazepam and diflunisal. Diazepam is a specific drug for DS2, and diflunisal for DS2 and FA6 (same behavior as ibuprofen) [14,15,16]. Thus, we will be able to elucidate the result obtained from the decay of the Ka value in the experiment with ibuprofen. In the presence of diazepam, it was observed that the value of Ka did not change significantly, thus indicating that the RB dye has a low affinity for this region. In the presence of diflunisal, results similar to the ibuprofen experiment were observed, therefore, the decay of the Ka value obtained indicates that the dye has an affinity for FA6.
Therefore, the experimental results of site competition show us that the RB dye has affinities to the DS1, DS3 and FA6 sites, as there was a decrease in the Ka value found in the presence of warfarin, ibuprofen, diflunisal and digitoxin when compared to the Ka value of native HSA (absence of drugs). This ligand has a low affinity for DS2, due to the fact that the Ka value does not change in the presence of diazepam.
The results referring to the DS1 and DS2 sites were already to be expected, as there are results in the literature that demonstrate this behavior of RB in the HSA protein [26]. Due to the studies being focused only on these two sites, there is a claim that the RB dye has a preferred site, DS1. However, in the previous results, we can verify that it was not possible to identify a site preference for the formation of the complex.

4.3. Ratio between Binding Protein

In site competition experiments, it was observed that the RB dye has affinities at different sites of the HSA protein, thus making it difficult to identify a preferential site for the formation of the complex. Therefore, the proportional amount of dye that is binding to the protein was investigated and, for this, we used the Job’s Plot experiment. The Job’s Plot experiment involves changing the molar fraction ratio between the RB and the protein, with the sum of the two fractions having to be equal to 1, referring to the total percentage (100%) of the resulting solution.
Figure 4 represents a graph with the absorption values at λ = 563 nm per molar fraction of the RB; to then perform the linear averages of these points, there is a need to determine this linearity for the increasing results and also for the decreasing ones, because in this way we can determine the ratio of the molar amount of dye that is interacting in a protein.
To determine the proportional relationship of the molar amount of ligand interacting in the protein, firstly, the molar fraction referring to the RB obtained from the intersection of the half lines must be verified, as shown in Figure 4, and this then has the value of 0.8564, being that this value will be used in Equation (5) to determine the proportional amount of probe that is interacting with a single protein.
x P = C L C L + C P
We can verify that the calculation performed with Equation (5) reveals that the ratio of RB to protein is 6:1, indicating that there are six molecular structures of the probe interacting at the same time in a single protein.

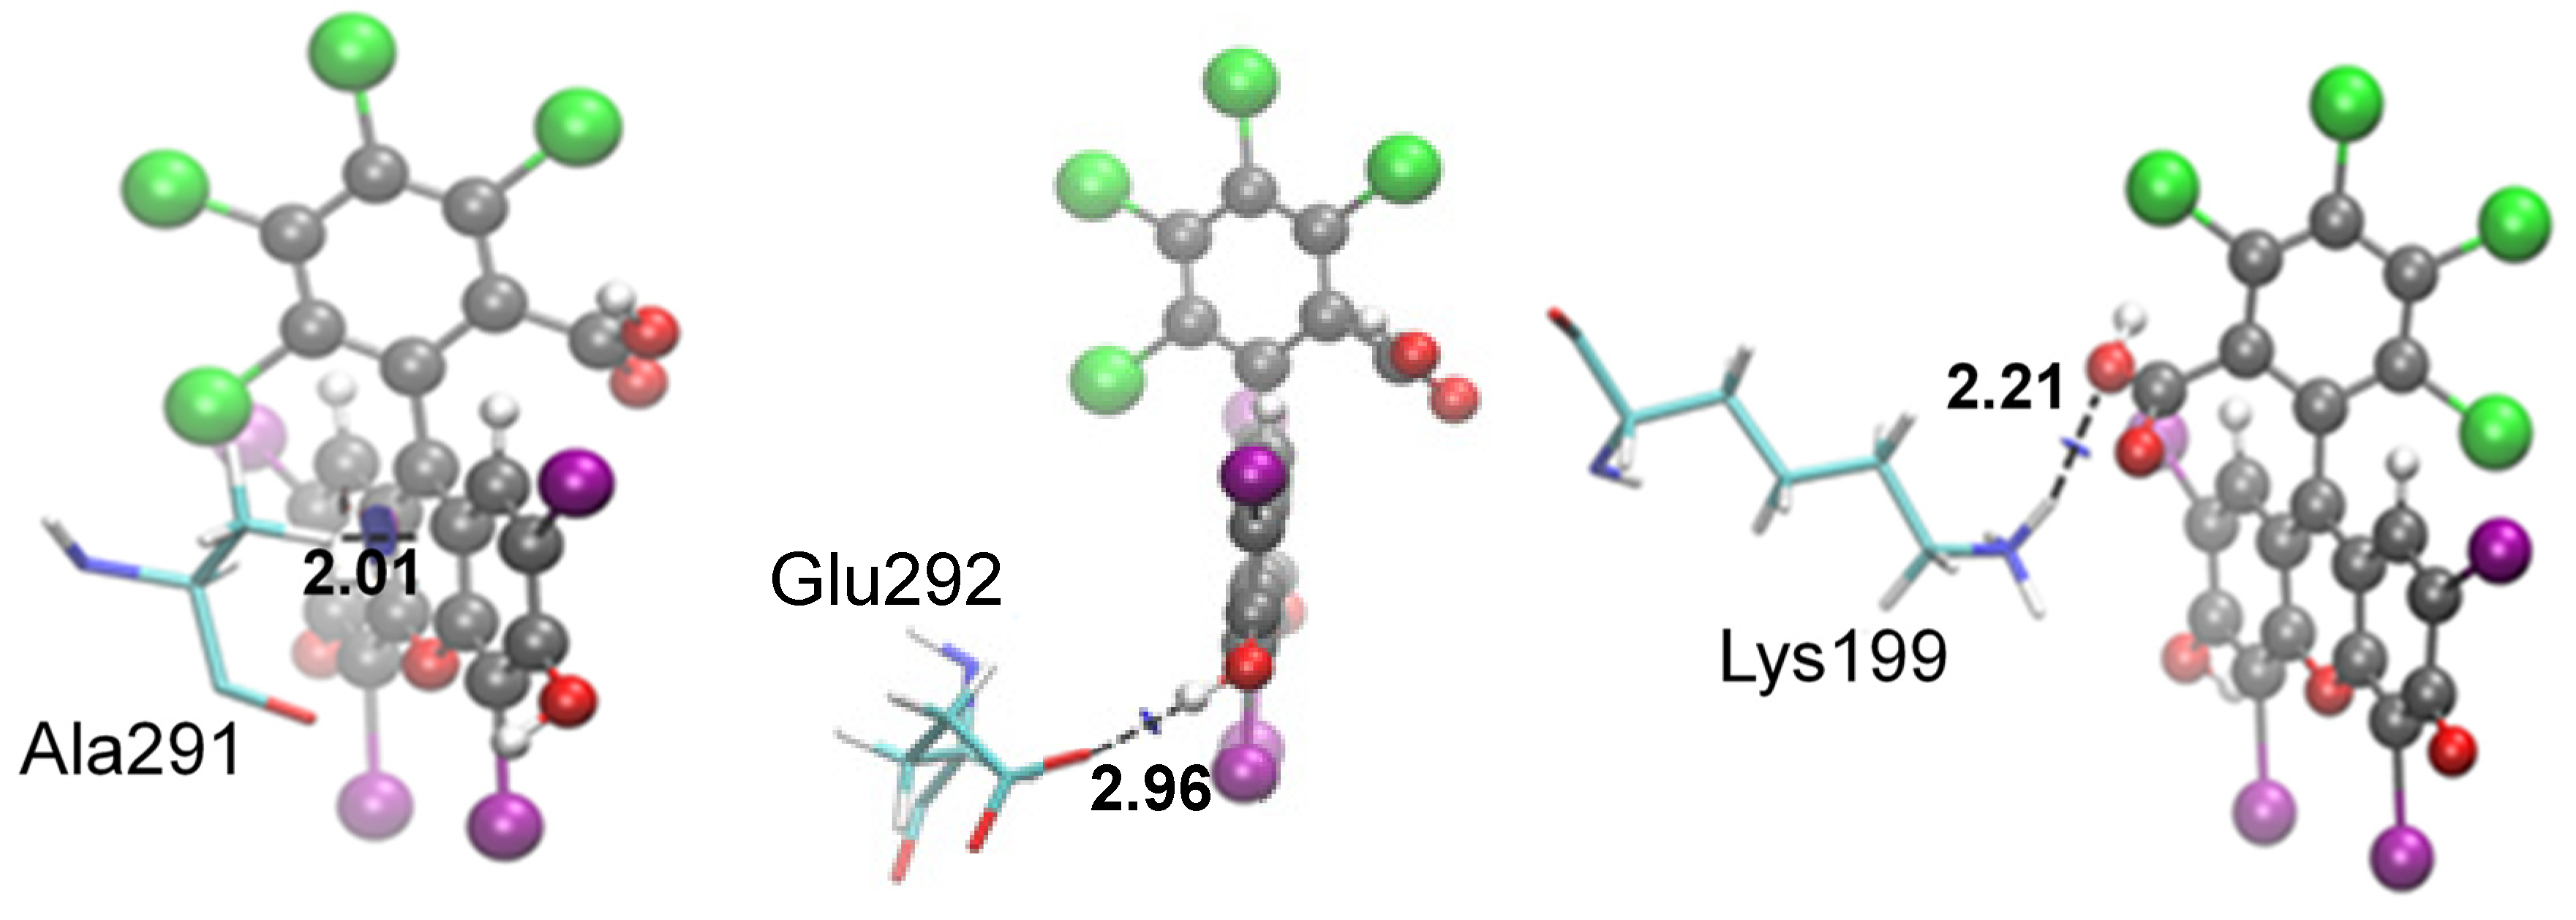
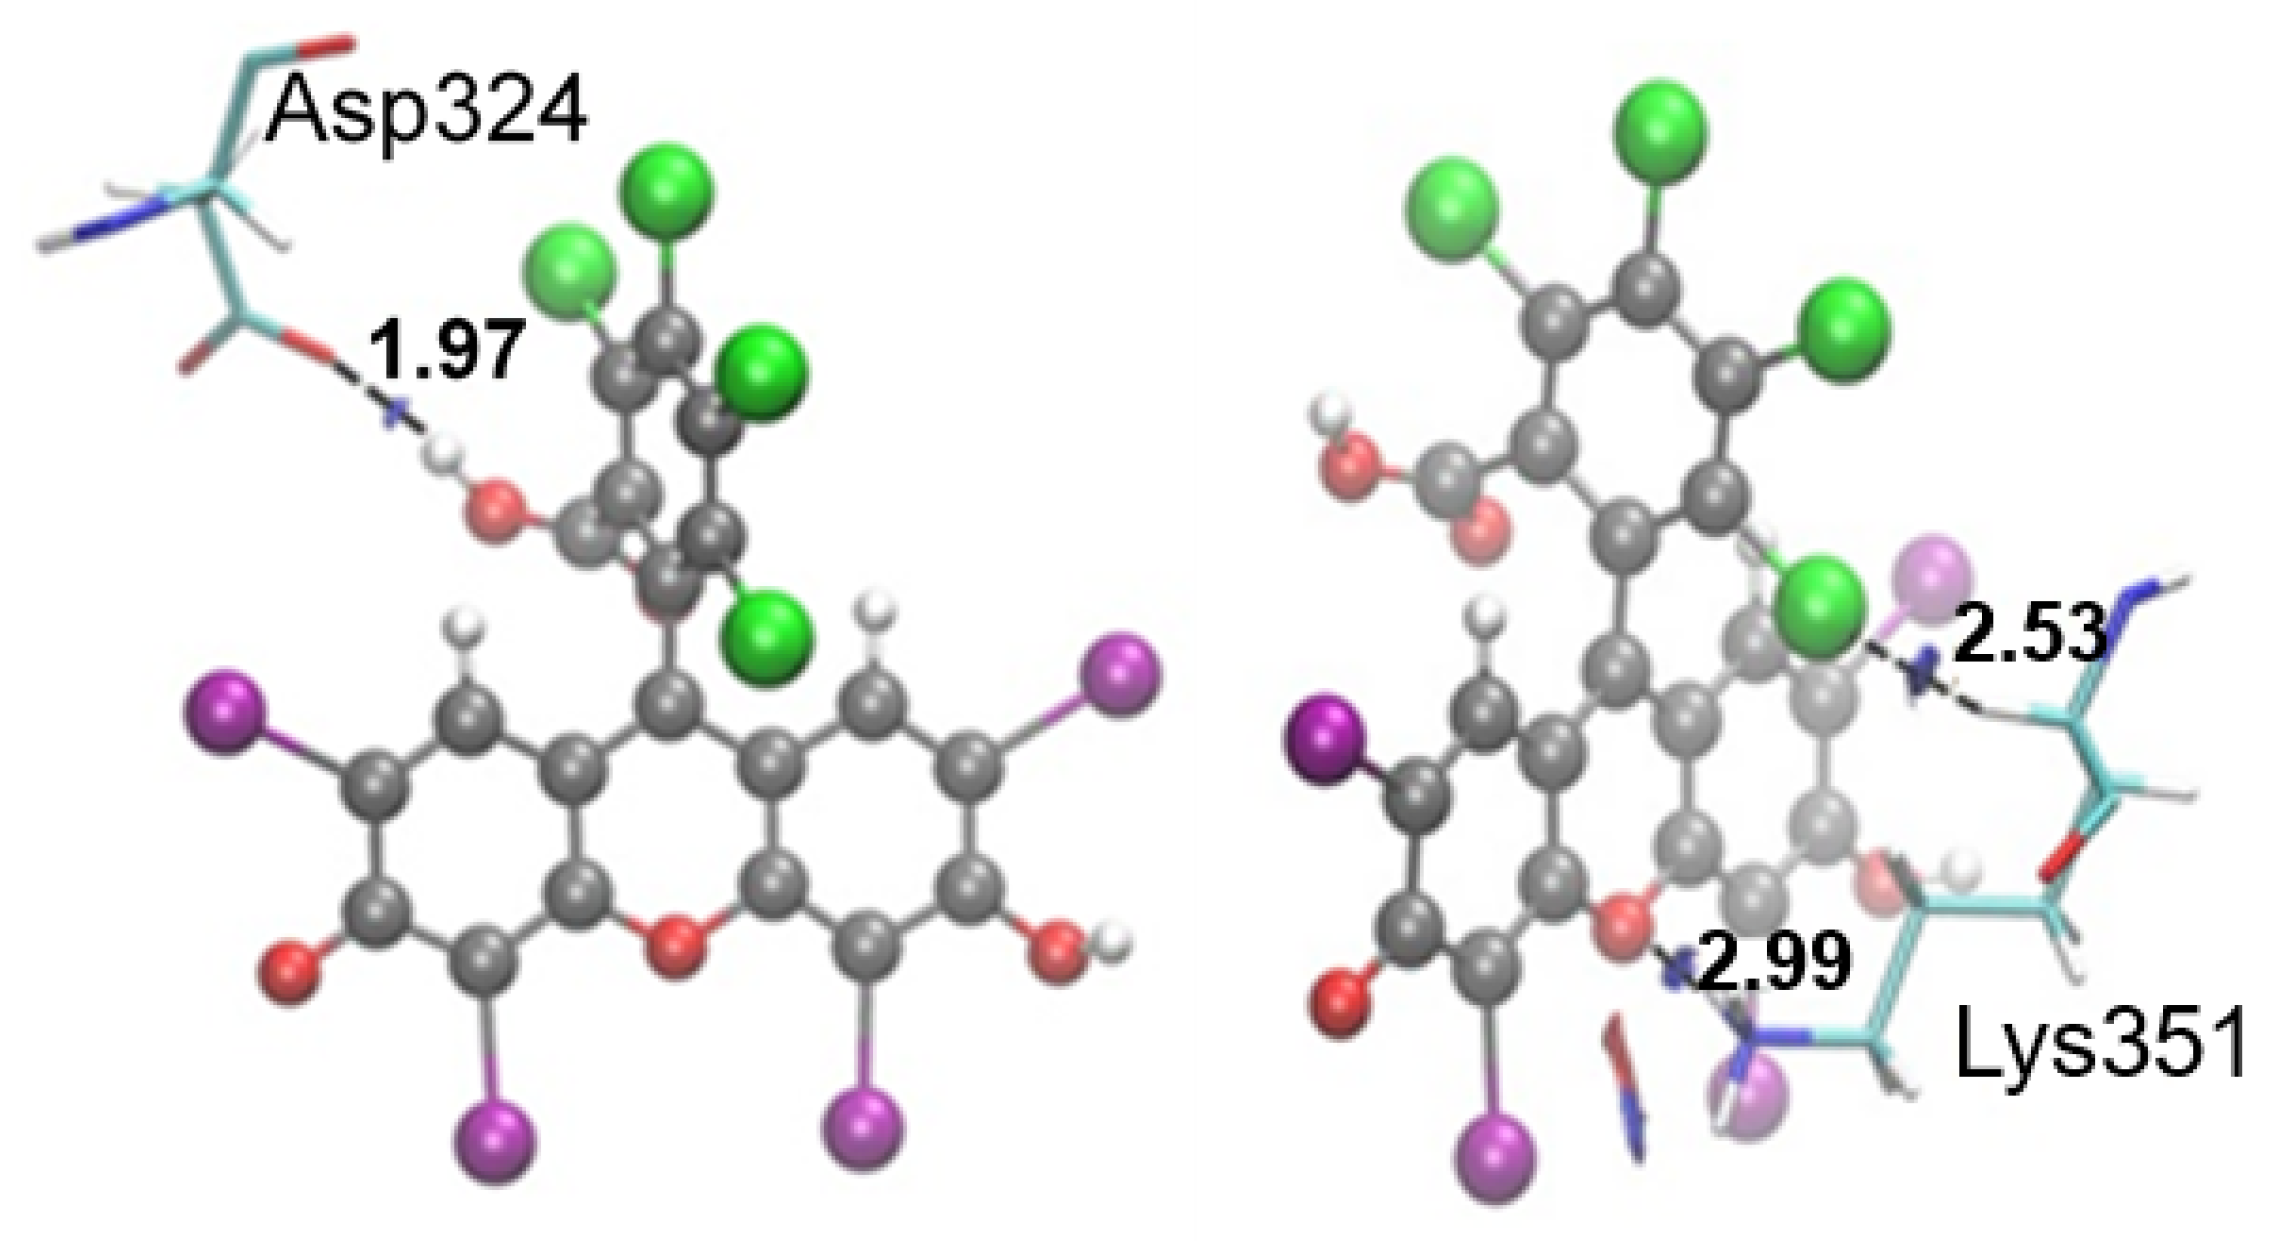
4.4. Molecular Docking

As they are structures of different PDBs, there is a need to carry out studies to certify whether they are similar so that we can compare the results obtained. To verify the conformity of the structures, we used the calculations of the root-mean-square deviation (RMSD), in which, if a value of up to 3.0 is obtained, it indicates that the structures are homologous [26,27]. The superposition of the structures and their respective RMSD calculation were performed using the Chimera 1.15 software. Thus, we obtained a low value of RMSD, around 0.752, thus indicating that the structures have a similarity, and, in this way, we can compare and complement the results (Figure 5).
The results of molecular docking studies are shown in Table 2. The results for DS1 and DS3 were obtained using PDB 2BX8, while for DS2 and FA6, PDB 2BXE was used. We can observe that, for DS2, Table 2 is not filled, indicating that, for this site, the results were not adequate, resulting in the RB dye having low affinity. We recall that, in experimental studies, the RB dye showed the same behavior.
In the GOLD software the binding site can be defined by specifying the approximate center of the binding site and taking all atoms that are within a specified radius of this point [18,28]. So, it was possible to find out which is the best for each site. We can then observe in Table 2 that the radius varied for each site, being 6 Å for DS1, 5 Å for DS2, and 10 Å for FA6. The conditions at FA6 were different from the other sites studied, as the best conditions were necessary to obtain the most stable conformer, leaving the amino acids Arg209, Glu354 and Asp483 flexible. While for the other sites the best approach was to consider the structure of the static HSA (amino acids were not flexible).
The energetic values are very close, making it difficult to determine if there is any preferential site for the formation of the complex. For now, we can be sure that the RB dye has affinities for DS1, DS3, and FA1. The conformers obtained by molecular docking were analyzed using the DS software. Thus, it was possible to verify the poses and possible interactions (Table 2) that the RB dye is performing with the amino acids present in the protein site. The non-covalent interactions of the same conformers were also studied in the NCIplot software. NCIplot was used to verify the attractive and repulsive interactions, so the surfaces were colored only blue (attraction) and red (repulsion) without emphasis on the type of bond. The entire visualization of the results was performed using the Visual Molecular Dynamics (VMD) software [28,29]. In DS1, we verified that, through the analysis of the DS software, there are four interactions, two of the LH type and two of the π type. However, when using the NCIplot results and analyzed in the VMD software (Figure 6), we see that the RB dye has only three interactions, two of the LH type with lysine 199 (2.21 Å) and glutamic acid 292 (1.86 Å), and a π-type interaction with alanine 291 (2.01 Å).
In DS3, we can observe that, in the NCIplot studies, there are three LH interactions with the amino acids arginine 117 (2.12 Å), arginine 145 (2.07 Å), and arginine 186 (2.26 Å), while the analyses performed in the DSV they showed only a single interaction with the amino acid arginine 117 (2.11 Å). The VMD analyses showed four interactions of vdw with the amino acids arginine 117 (2.88 Å), tyrosine 138 (2.62 Å), arginine 145 (2.50 Å), and arginine 186 (2.38 Å), as shown in Figure 7.
In FA6, there was also a difference in the results presented by the DSV software, and in the results calculated by the NCIplot and analyzed by the VMD, we observed that there are only three interactions, two of the LH type [Asp324 (1.97 Å) and Lys351 (2.99 Å)], and there is also a vdw-type interaction with lysine 351, with a distance of 2.53 Å (Figure 8).
In order to further assess the non-covalent interactions, scatter-type graphs (Figure 9) were prepared for the RB dye conformers obtained from the results of molecular docking studies at the DS1, DS3, and FA6 sites.
As previously observed, at the DS1 site, we can see two saddle points between the values −0.08 and 0.00, indicating the presence of a strong attractive interaction, corroborating the surfaces found between the Rose Bengal and the amino acids lysine 199 and glutamine 292. At DS3, there are three saddle points between −0.1 and −0.05, referring to the hydrogen bonds of Rose of Bengal and arginine 117, arginine 145, and arginine 186. In the FA6 site, saddle points between −0.03 and 0.00, in color greenish, demonstrate only the existence of weak interactions, so that points referring to hydrogen bonds were not observed.
The results obtained in the molecular docking studies partially corroborated those of Alarcón (2009) [26], showing that the RB dye does not have affinities with the DS2 site, but affinities with the DS1 site. This is due to the fact that Alarcón only investigated the possibility of the RB having interactions at the DS1 and DS2 sites, thus resulting in the distinction, in part, of the results presented by him and in this work. Due to this fact, the distinction is made in relation to DS1 not being the only region that the RB dye can bind to and, thus, it would not be correct to say that this region is the preferred site for the formation of the complex.

5. Conclusions

The RB dye binds to the HSA protein, and the value for the formation of this complex corresponds to 3.90 ± 0.08 × 10⁵ M−1, from the analysis of the fluorescence spectra, together with the calculations of the Benesi–Hildebrand. Due to the fact that the RB dye has an affinity for the HSA protein, the region where this complex is formed was determined from experimental studies of site competition. The results reveal that the dye has affinities for DS1, FA1, and FA6 sites and no affinity for DS2 in HSA. However, in the studies on DS2, it was necessary to carry out a control test, since the initial studies on this binding site were with the substance ibuprofen which, according to the literature, has two regions of affinities. Two tests were then performed, one with the substance diazepam to prove the non-affinity of the RB dye to this site, and the second experiment was with the substance diflunisal, to prove that the results obtained with ibuprofen correspond to the affinity of the RB dye to the FA6 site. Due to the high affinity of the RB dye to the HSA protein, the proportional amount of RB interacting with the HSA was investigated. For this study, the Job’s Plot protocols were adopted, thus, it was determined that six molecular structures of RB are interacting with a single structure of the HSA protein. However, the results obtained in the experimental studies of site competition were matched with the theoretical studies. Thus, in molecular docking, it was observed that the RB dye has affinity for the DS1, FA1, and FA6 sites in the HSA protein. The DS2 site was characterized as a region in which the RB dye has low affinity, since the results obtained in this region were not satisfactory. Given these considerations, the RB dye has a very interesting feature in the fact that it has a high affinity for the HSA protein. This particularity has a positive side, for example, in the medical field, for the identification and/or treatment of some pathology. The RB dye can be used in the presence of other drugs, as their presence does not significantly affect the binding of the dye to the protein.

Author Contributions

Conceptualization, M.I.Y.; methodology, L.d.C.B., V.F.X. and A.R.d.S.; software, M.I.Y., G.S.G., I.C. and A.R.d.S.; validation, M.I.Y., L.d.C.B., I.C., V.F.X. and A.R.d.S.; formal analysis, M.I.Y.; investigation, M.I.Y.; resources, V.F.X. and A.R.d.S.; data curation, M.I.Y.; writing—original draft preparation, M.I.Y. and G.S.G.; writing—review and editing, M.I.Y.; visualization, V.F.X. and A.R.d.S.; supervision, V.F.X. and A.R.d.S.; project administration, A.R.d.S.; funding acquisition, V.F.X. and A.R.d.S. All authors have read and agreed to the published version of the manuscript.

Funding

This research received no external funding.

Institutional Review Board Statement

Not applicable. Human serum albumin (HSA) used in this work was obtained from Sigma-Aldrich Chemical Co. (St. Louis, MO, USA).

Informed Consent Statement

Not applicable.

Data Availability Statement

The data presented in this study are available on request from the corresponding author. The data are not publicly available due to privacy concerns.

Conflicts of Interest

The authors declare no conflict of interest.

References

  1. Lamberts, J.J.M.; Neckers, D.C. Rose Bengal and Non-Polar Derivatives: The Birth of Dye Sensitizers for Photooxidation+. Z. Nat. Sect. B J. Chem. 1984, 39, 474–484. [Google Scholar] [CrossRef]
  2. Zeyada, H.M.; Youssif, M.I.; El-Ghamaz, N.A.; Aboderbala, M.E.O. Spectral, structural, optical and dielectrical studies of UV irradiated Rose Bengal thin films prepared by spin coating technique. Phys. B Condens. Matter 2017, 506, 75–82. [Google Scholar] [CrossRef]
  3. Zhang, X.F.; Zhang, I.; Liu, L. Photophysics of halogenated fluoresceins: Involvement of both intramolecular electron transfer and heavy atom effect in the deactivation of excited states. Photochem. Photobiol. 2010, 86, 492–498. [Google Scholar] [CrossRef] [PubMed]
  4. Pereira, P.C.S.; Costa, P.F.A.; Pellosi, D.S.; Calori, I.R.; Vilsinski, B.H.; Estevão, B.M.; Hioka, N.; Caetano, W. Photophysical properties and interaction studies of Rose Bengal derivatives with biomimetic systems based in micellar aqueous solutions. J. Mol. Liq. 2017, 230, 674–685. [Google Scholar] [CrossRef]
  5. Vanerio, N.; Stijnen, M.; de Mol, B.A.J.M.; Kock, L.M. Biomedical Applications of Photo- and Sono-Activated Rose Bengal: A Review. Photobiomodulation Photomed. Laser Surg. 2019, 37, 383–394. [Google Scholar] [CrossRef] [Green Version]
  6. Kochevar, I.E.; Lambert, C.R.; Lynch, M.C.; Tedesco, A.C. Comparison of photosensitized plasma membrane damage caused by singlet oxygen and free radicals. Biochim. Biophys. Acta 1996, 1280, 223–230. [Google Scholar] [CrossRef] [Green Version]
  7. Prieto-Montero, R.; Prieto-Castañeda, A.; Sola-Llano, R.; Agarrabeitia, A.R.; García-Fresnadillo, D.; López-Arbeloa, I.; Villanueva, A.; Ortiz, M.J.; de la Moya, S.; Martínez-Martínez, V. Exploring BODIPY Derivatives as Singlet Oxygen Photosensitizers for PDT. Photochem. Photobiol. 2020, 96, 458–477. [Google Scholar] [CrossRef]
  8. Turbay, M.B.E.; Rey, V.; Argañaraz, N.M.; Vieyra, F.E.M.; Aspée, A.; Lissi, E.A.; Borsarelli, C.D. Effect of dye localization and self-interactions on the photosensitized generation of singlet oxygen by rose bengal bound to bovine serum albumin. J. Photochem. Photobiol. B Biol. 2014, 141, 275–282. [Google Scholar] [CrossRef]
  9. Wang, S.; Wang, M.; Liu, Y.; Hu, D.; Hu, L.; Fei, X.; Zhang, J. Effect of Rapamycin Microspheres in Sjögren Syndrome Dry Eye: Preparation and Outcomes. Ocul. Immunol. Inflamm. 2019, 27, 1357–1364. [Google Scholar] [CrossRef]
  10. Gundry, R.L.; Fu, Q.; Jelinek, C.A.; Eyk, J.E.V.; Cotter, R.J. Investigation of an albumin-enriched fraction of human serum and its albuminome. Proteom. Clin. Appl. 2007, 1, 73–88. [Google Scholar] [CrossRef]
  11. Moreira, M.B.; Franciscato, D.S.; Toledo, K.C.F.; de Souza, J.R.B.; Nakatani, H.S.; de Souza, V.R. Investigação da supressão de fluorescência de soro albumina bovina e humana por complexo de rutênio. Quim. Nova 2015, 38, 227–232. [Google Scholar]
  12. Ascenzi, P.; di Masi, A.; Fanali, G.; Fasano, M. Heme-based catalytic properties of human serum albumin. Cell Death Discov. 2015, 1, 1–7. [Google Scholar] [CrossRef] [PubMed] [Green Version]
  13. Bhattacharya, A.A.; Grüne, T.; Curry, S. Crystallographic Analysis Reveals Common Modes of Binding of Medium and Long-chain Fatty Acids to Human Serum Albumin. J. Mol. Biol. 2000, 303, 721–732. [Google Scholar] [CrossRef] [PubMed]
  14. Ghuman, J.; Zunszain, P.A.; Petitpas, I.; Bhattacharya, A.A.; Otagiri, M.; Curry, S. Structural Basis of the Drug-binding Specificity of Human Serum Albumin. J. Mol. Biol. 2005, 353, 38–52. [Google Scholar] [CrossRef] [PubMed]
  15. Esmaeili, S.; Almasi, M.; Vaisi-Raygani, A.; Moradi, S.; Ashrafi-Kooshk, M.R.; Shahlaei, M.; Khodarahmi, R. Explorin the interaction between “site-markers, aspirin and esterase-like activity” ternary systems on the human sérum albumin: Direct evidence for modulation of catalytic activity of the protein in different inhibition modes. J. Iran Chem. Soc. 2018, 15, 555–573. [Google Scholar] [CrossRef]
  16. Manjushree, M.; Revanasiddappa, H.D. Interpretation of the binding interaction between bupropion hydrochloride with human serum albumin: A collective spectroscopic and computational approach Spectrochim. Acta A Mol. Biomol. Spectrosc. 2019, 209, 264–273. [Google Scholar]
  17. Cambridge Crystallographic Data Centre Software. GOLD Configuration File User Guide: A Component of the CSD-Discovery Suite; Cambridge Crystallographic Data Centre Software: Cambridge, UK, 2019; pp. 1–80. [Google Scholar]
  18. de Souza, A.R.; Boza, I.A.F.; Ximenes, V.F.; Yoguim, M.I.; Rodriguez, M.J.D.; Morgon, N.H.; Caracelli, I. Elucidação da quiralidade induzida na molécula dansilglicina na complexação com a proteína albumina do soro humano (HSA). Quím. Nova 2019, 42, 135–142. [Google Scholar] [CrossRef]
  19. Boto, R.; Peccati, F.; Laplaza, R.; Quan, C.; Carbone, A.; Piquemal, J.P.; Maday, Y.; Contreras-García, J. A new step towards a fast quantification of noncovalent interactions. ChemRxiv. 2020, 6498, 1–31. [Google Scholar]
  20. Contreras-García, J.; Johnson, E.R.; Keinan, S.; Chaudret, R.; Piquemal, J.P.; Beratan, D.N.; Yang, W. NCIPLOT: A program for plotting non-covalent interaction regions. J. Chem. Theory Comput. 2012, 7, 625–632. [Google Scholar] [CrossRef]
  21. Johnson, E.R.; Keinan, S.; Mori-Sánchez, P.; Contreras-García, J.; Cohen, A.J.; Yang, W. Revealing Noncovalent Interactions. J. Am. Chem. Soc. 2010, 132, 6498–6506. [Google Scholar] [CrossRef] [Green Version]
  22. Contreras-Garcia, J.; Johnson, E.R.; Keinan, S.; Yang, W.; de-la-Roza, A.O.; Quang, C.; Laplaza, R.; Boto, R.A. Nciplot4 Manual. Available online: https://www.lct.jussieu.fr/pagesperso/contrera/NCIPLOT4_MANUAL.pdf (accessed on 2 July 2022).
  23. Kozuch, S.; Martin, J.M.L. Halogen bonds: Benchmarks and theoretical analysis. J. Chem. Theory Comput. 2013, 9, 1918–1931. [Google Scholar] [CrossRef] [PubMed]
  24. Zhang, L.; Liu, Y.; Wang, Y.; Xu, M.; Hu, X. UV–Vis spectroscopy combined with chemometric study on the interactions of three dietary flavonoids with copper ions. Food Chem. 2018, 263, 208–215. [Google Scholar] [CrossRef] [PubMed]
  25. Sahu, R.; Vaishanav, S.K.; Yadav, T.; Sinha, S.; Tiwari, S.; Satnami, M.L.; Ghosh, K.K. Antidepressant drug-protein interactions studied by spectroscopic methods based on fluorescent carbon quantum dots. Heliyon 2019, 5, 1–9. [Google Scholar]
  26. Alarcón, E.; Edwards, A.M.; Aspee, A.; Moran, F.E.; Borsarelli, C.D.; Lissi, E.A.; Gonzalez-Nilo, D.; Poblete, H.; Scaiano, J.C. Photophysics and photochemistry of dyes bound to human serum albumin are determined by the dye localization. Photochem. Photobiol. Sci. 2010, 9, 93–102. [Google Scholar] [CrossRef] [PubMed]
  27. Kufareva, I.; Abagyan, R. Methods of protein structure comparison. Methods Mol. Biol. 2012, 857, 231–257. [Google Scholar]
  28. Si, D.; Moritz, S.A.; Pfab, J.; Hou, J.; Cao, R.; Wang, L.; Wu, T.; Cheng, J. Deep Learning to Predict Protein Backbone Structure from High-Resolution Cryo-EM Density Maps. Sci. Rep. 2020, 10, 1–22. [Google Scholar] [CrossRef] [Green Version]
  29. Humphrey, W.; Dalke, A.; Schulten, K. VMD: Visual Molecular Dybamics. J. Mol. Graph. 1996, 14, 33–38. [Google Scholar] [CrossRef]
Figure 1. Chemical structure of Rose Bengal. (a) Structure 2D. (b) Structure 3D.
Chemosensors 10 00440 g001
Figure 2. Sites of HAS protein interaction. (a) Sites for drugs. (b) Sites for fatty acids. (Source: PDB 1E7E [13]—modified).
Chemosensors 10 00440 g002
Figure 3. Result of the interaction between the RB dye and the HSA protein. (a) UV-vis spectrum of the RB with the addition of HSA protein (0 to 6 μL). (b) Graph (Benesi-Hildebrand plot) of the inverse values of absorbance (1/∆A) by the inverse of the concentration of the protein that was added (1/g [HSA]).
Chemosensors 10 00440 g003
Figure 4. Result of the Job’s Plot test referring to the values of the molar fractions of the RB dye (λ = 563 nm).
Chemosensors 10 00440 g004
Figure 5. Overlay of PDB 2BX8 and PDB 2BXE structures performed in Chimera 1.15 software and representation of the sequence of the amino acid alignment of the structures.
Chemosensors 10 00440 g005
Figure 6. Interactions of RB dye to HSA DS1 obtained in NCIplot studies and analyzed by VMD software.
Chemosensors 10 00440 g006
Figure 7. Interactions of RB dye to HSA DS3 obtained in NCIplot studies and analyzed by VMD software.
Chemosensors 10 00440 g007
Figure 8. Interactions of RB dye to FA6 of HSA obtained in NCIplot studies and analyzed by VMD software.
Chemosensors 10 00440 g008
Figure 9. Scatter plot of non-covalent interactions, by color, as a function of the second Hessian matrix and electron density. Left: DS1 site. In the center: DS3 site. Right: FA6 site.
Chemosensors 10 00440 g009
Table 1. Values of the association constant of the RB and the effect of pharmaceutical drugs.
Ka (μM)Site [14,15,16]
HSA(3.90 ± 0.08) × 105
+WARFARIN(2.42 ± 0.95) × 105DS1
+IBUPROFEN(1.35 ± 0.42) × 105DS2 or FA6
+DIFLUNISAL(0.86 ± 0.06) × 105DS2 or FA6
+DIAZEPAM(3.05 ± 0.53) × 105DS2
+DIGITOXIN(2.06 ± 0.59) × 105DS3
Table 2. Molecular docking results for PDBs, 2BX8, and 2BXE.
SiteRadius(Å)Energy(kcal mol−1) Interactions
DS16−52.13HB.Lys199 (2.21 Å); Glu292 (1.86 Å)
πHis242 (2.79 Å); Ala291 (2.28 Å)
DS2--
DS35−58.79HB.Arg117 (2.11 Å)
vdwTyr138 (2.48 Å); Arg145 (2.50 Å); Arg186 (3.15 Å); Ser193 (3.01 Å)
πArg186 (3.57 Å); Arg186 (3.48 Å)
FA610(flex) *−67.55H.B.Arg209 (1.48 Å); Lys351 (1.58 Å); Asp324 (1.97 Å)
vdwArg209 (2.40 Å)
πLys315 (2.78 Å); Lys351 (2.41 Å)
* Amino acid: Arg 209, Glu 354 and Asp 483.
Publisher’s Note: MDPI stays neutral with regard to jurisdictional claims in published maps and institutional affiliations.

