Next Article in Journal
Solid Fluorescence pH Sensors Based on 1,8-Naphthalimide Copolymers Synthesized by UV Curing
Next Article in Special Issue
Development of a Portable and Modular Gas Generator: Application to Formaldehyde Analysis
Previous Article in Journal
A Peptide-Based Trap for Metal Ions Studied by Electron Paramagnetic Resonance
Previous Article in Special Issue
Development of Electrochemical Sensors/Biosensors to Detect Natural and Synthetic Compounds Related to Agroalimentary, Environmental and Health Systems in Argentina. A Review of the Last Decade
 
 
Correction published on 5 March 2024, see Chemosensors 2024, 12(3), 41.
Article

A Novel Truncated DNAzyme Modified Paper Analytical Device for Point-of-Care Test of Copper Ions in Natural Waters

1
Key Laboratory of Advanced Mass Spectrometry and Molecular Analysis of Zhejiang Province, Institute of Mass Spectrometry, School of Material Science and Chemical Engineering, Ningbo University, Ningbo 315211, China
2
College of Biology and Environment, Zhejiang WanLi University, Ningbo 315211, China
*
Authors to whom correspondence should be addressed.
Submission received: 18 December 2021 / Revised: 25 January 2022 / Accepted: 1 February 2022 / Published: 10 February 2022 / Corrected: 5 March 2024
(This article belongs to the Special Issue Advances in Chemosensors Technologies for Monitoring and Diagnostics)

Abstract

:
On-site determination of trace copper ions in natural waters is of great significance to environmental monitoring, and how to develop accurate and specific point-of-care test methods is one critical issue. In the study, a paper-based analytical device (PAD) being modified with a new truncated DNAzyme (CLICK-T, which was derived from a reported DNAzyme-CLICK-17) was developed for Cu ions detection. The detection mechanism was based on Cu(II)-catalyzed azide-alkyne cycloaddition (Cu(II)AAC) reaction. It can directly conduct on-site analysis of Cu(II) ions based on fluorescent signals detected using a mobile phone. In the assay, the CLICK-T was firstly modified on the PADs. Then, water samples containing Cu ions mixed with 3-azido-7-hydroxycoumarin and 3-butyn-1-ol were instantly dripped on PADs and incubated for 20 min. Finally, the PADs were excited at 365 nm and emitted fluorescence which could be analyzed on site using smart phones. The Cu(II) concentration could be quantified through RGB analysis with the aid of iPhone APP software. The limit of detection is 0.1 µM by the naked eye due to the fact that CLICK-T exhibited a good catalytic effect on Cu(II)AAC. The Cu(II) concentration could also be directly detected without using reductant, such as ascorbic acid, which is prone to be oxidized in air. This simplifies the PDA detection process improves its efficiency. The PAD is convenient for the on-site analysis of Cu ions in natural waters.

1. Introduction

Although copper is an essential trace element in living organisms, an excess amount of copper accumulated in the body would be a threat to human health [1]. A high level of copper could exhibit obvious toxicity to human organism, which adversely affects its immune system and reduces its resilience for adapting to the environment [2]. Excessive Cu accumulation can cause Wilson’s disease, Alzheimer’s disease and other neurodegenerative diseases [3]. Therefore, the development of a sensitive Cu(II) detection method suitable for the on-site detection of Cu ions was crucial for environmental monitoring.
Up to now, there were many kinds of analytical methods for Cu ions, including inductively coupled plasma mass spectroscopy (ICP-MS) [4], atomic absorption spectroscopy (AAS) [5] and electrochemistry [6], etc. Although many of them were sensitive, some of them could not satisfy the demand of on-site detection due to inevitable usage of expensive and cumbersome instruments, complex and long-time pre-processing procedures, etc. Recently, Cu(I)-catalyzed azide-alkyne cycloaddition (CuAAC), the representative reaction of modern “click chemistry”, has been usually employed in organic synthesis, bio-labeling, and surface functionalization [7,8]. CuAAC could also be employed to detect Cu ions in environmental or biological samples [9]. Some of the colorimetric assays were fabricated for on-site and specific detection of Cu ions because only Cu ions could catalyze CuAAC [10]. Zheng et al. demonstrated a graphene oxide (GO)-based system for Cu by mixing alkyne-functionalized alkynyl-GO and azido-Rho, where the detection limit (LOD) can reach up to 1 µM [11]. Hua et al. described a colorimetric method for the detection of Cu by using azide-tagged AuNPs and 1,4-diethynylbenzene (DEB) to form [1,2,3]-triazole-linked aggregates with LOD of 0.5 µM [12]. However, many of these colorimetric methods are difficult to monitor copper concentration lower than 1 µM by the naked eye; thus, they could not meet the demands of on-field detection of trace Cu ions in natural waters [13]. Moreover, conventional CuAAC employed Cu(I) ions for the reaction; thus, the reductant was necessary to reduce Cu(II) to Cu(I). The most available reductant was sodium ascorbic acid (NaAsc) [14,15,16,17,18,19,20,21,22,23,24]. However, it could be easily oxidized in air and must be prepared instantly before each measurement. Thus, it was not convenient for on-site detection and limited its application in copper detection. Instead, it would save time and be more efficient to directly determine Cu(II) by CuAAC without using reductant.
Recently, Liu et al. [15] has selected one kind of DNAzyme named CLICK-17, a long single-stranded DNA with 79 bases (79-nt), which could catalyze Cu(II) for Cu(II)AAC without using the reductive reagent. This meant Cu(II) could be directly determined without being reduced into Cu+ [7]. All these could largely facilitate the detection procedures. However, CLICK-17’s fabrication cost is a bit expensive due to its 79 bases. Moreover, the long chain may easily entangle together in the biosensing interface to reduce its catalytic effects [15]. Based on CLICK-17 DNAzyme, we found one truncated fragment of CLICK-17 which owns 18 bases (18-nt, named as CLICK-T) and also exhibited high catalytic effects of Cu(II)AAC. Because 18-nt CLICK-T is much shorter than 79-nt CLICK-17, its fabrication cost could be obviously reduced. Moreover, the entangle event maybe more reduced. All these made CLICK-T liable to detect Cu(II) on site. During the past few years, paper-based analytical devices (PADs) have attracted great attention, based on which a number of point-of-care test (POCT) protocols have been developed [16]. Compared with conventional materials such as glass, quartz, and polymeric substrates that are used to fabricate micro-analytical devices, filter paper exhibited distinctive features of being light-weight, low-cost and biodegradable [17]. In order to avoid the problem of the spot diameter too large and uneven color distribution caused by free diffusion of solution, Zhang et al. explored the conversion of off-the-shelf laboratory filter paper into superhydrophobic substrate via silanization reactions [18].
Based on the above assumption, the determination of copper on two DNAzyme (CLICK-T and CLICK-17)-modified PAD was designed for comparison of their detection effects. In this experiment, the hydrophilic PADs were firstly modified with different DNAzyme. Then, the water samples containing Cu(II) and 3-azido-7-hydroxycoumarin (AHC) and 3-butyn-1-ol (BOL) in 4-(2-hydroxyethyl)-1-piperazineethanesulfonic acid (HEPES) buffer, was dripped on the PADs and incubated for 20 min. Based on the fast kinetic DNAzyme assisted CuAAC, the tri-azole product could emit a visual fluorescence which could be observed by the naked eye and quantified using the App in a smart phone (Figure 1). The PDA’s fabrication process including the DNAzyme modification was also shown in Figure 1.

2. Materials and Methods

2.1. Materials and Instruments

Glassy microfiber filter papers (Whatman TM grade GF/A) were purchased from Sigma-Aldrich (St. Louis, MO, USA). 3-azido-7-hydroxycoumarin (98%) from Zhenzhu Biotechnology Co., Ltd. (Shanghai, China); aminopropyltriethoxysilane (APTES, 99%) methyltrichlorosilane (MTS, 99%), sodium ascorbate (crystalline, 98%), CuSO4·5H2O (98%), HEPES (4-(2-hydroxyethyl)-1-piperazineethane-sulfonic acid, 99.5%), 3-butyn-1-ol (97%) and 5-Hexyn-1-ol (96%) were all from Sigma-Aldrich (St. Louis, MO, USA), Toluene, hydrochloric acid (37%), MgCl2·H2O, NaOH·H2O, NaCl and KCl (all ≥ 99%) were from Aladin Co., Ltd. (Shanghai, China). The DNAzyme sequence for CuAAC was as follows:
CLICK-17:
5′-GGA TCG TCA GTG CAT TGA GAT TA TTA TGC AAC TCTAT GGG TCC ACT CTG TGA ATG TGA CGG TGG TAT CCG CAA CGG GTA-3′
Random DNA sequence (RAND-42):
5′-ATC TAC GAA TTC ATC AGG GCT AAA GAG TGC AGA GTT ACT TAG-3′-C6-NH2-3′.
CLICK-T: 5′-TTA TTA TGC AAC TCTAT G-C6-NH2-3′
All reagents are of AR grade unless otherwise specified. The Pixolor App software for reading RGB values was downloaded from App Store from iPhone 7.
Surface morphology observation was performed on a S-3400N scanning electron microscope (SEM) (Hitachi, Tokyo, Japan). All fluorescence measurements were obtained on a RF-6000 fluorescence spectrophotometer (Shimadzu, Tokyo, Japan).

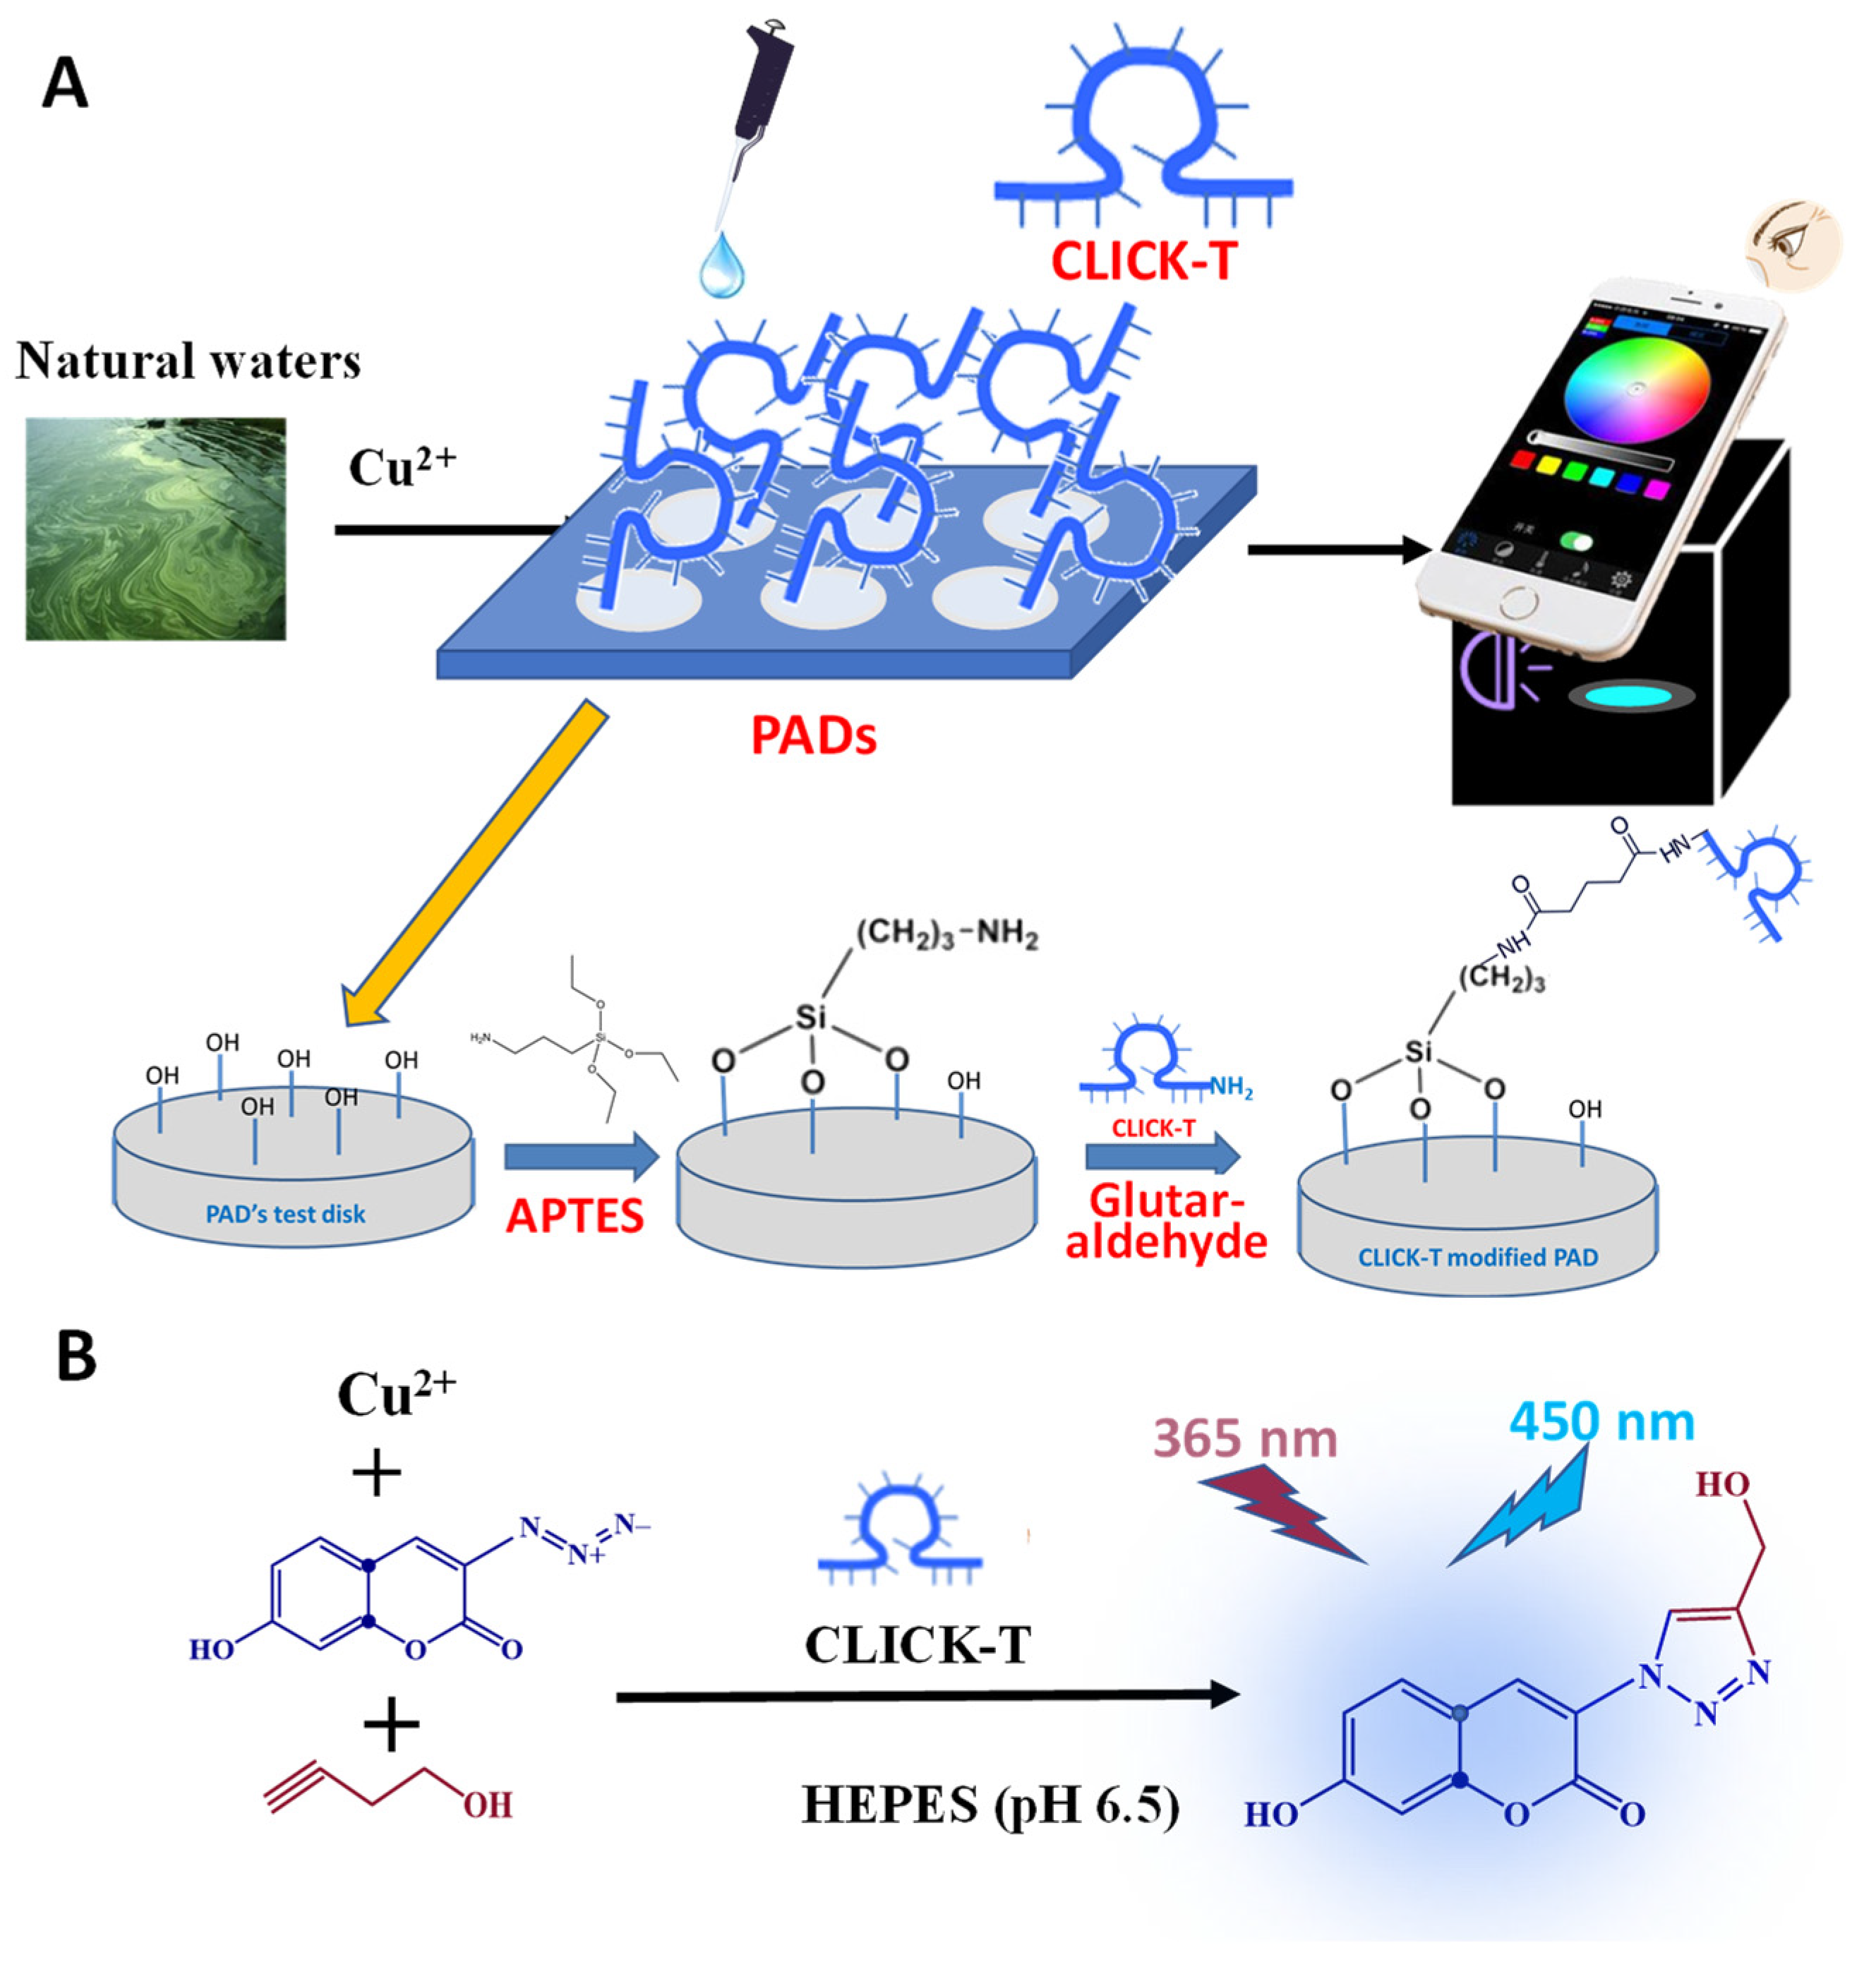
2.2. The Fabrication of PAD Arrays

The detection disks of PADs with 0.7 cm diameter were made by punching the glass fiber filter paper. Then, the PADs were soaked in 10.0 mL of toluene solution, which contained 100 µL APTES and HCl (37%). The reaction lasted for 10 min, and the above disks were taken out and air-dried naturally. An amount of 4.0 µM CLICK-T with amino group [15] was modified on the disks using 2.5% glutaraldehyde in ddH2O for 2 h. The sequence of CLICK-T DNAzyme and other DNA with random sequence were shown in Table S1. Moreover, the glass microfiber filter, after removing disks, were soaked into 10.0 µL MTS and HCl (37%) for 30 min and washed by water then air-dried. Finally, the disks were inserted into the holes of the filter papers to fabricate the PADs arrays. The illustration of hydrophobic non-detection area (A) and CLICK-T modified PDA’s hydrophilic area for detection copper ion was shown in Figure S1.

2.3. Copper Ions Detection in Natural Waters by the PADs

Before detection, the PAD disks modified with DNAzyme were firstly heated to 100 °C in pH 6.5, 25 mM HEPES containing 300 mM NaCl and 20 mM MgCl2, then cooled to room temperature with natural cooling-off process. After then, 100 µL of water samples with different Cu(II) concentration was mixed with 100 µL the above HEPES buffer containing 100 µM 3-azido-7-hydroxycoumarin and 3-butyn-1-ol. The mixture was subsequently dripped onto the PADs. After reacting for 20 min, the fluorescent photo images were captured with a smartphone (e.g., iPhone 7) under a handheld UV lamp (365 nm) in a black box (length × width × height: 20 × 20 × 30 cm3).
The lamp is placed at an angle of 45° above the PAD, and the straight-line distance is 10 cm. The power is 15 W. The fluorescence could be observed directly by the naked eye and the RGB values were analyzed using the Pixolor App installed on the iPhone smartphone, or Color Collect App for the Android users, for quantification of Cu ions.

2.4. Cyclic Voltammetry (CV)

The buffer solution for all the CV detection was as follows: pH 7.4 20 mM HEPES together with 20 mM MgCl2. The dissolved DNA was folded as described above. All of the measurement system was firstly degassed to remove oxygen with nitrogen. The copper ions were incubated for 5 min before measurements. A three-electrode system together with a 10 mL beak were employed for detection. A CHI 660B Electrochemical Analyzer from Chenhua Co., Ltd. (Shanghai, China) was used for detection. A platinum bar and an Ag|AgCl electrode were used as counter electrode and reference electrode, respectively. The glassy carbon electrode was employed as the working electrode. The scan rate for all CV measurements was maintained at 100 mV/s.

3. Results

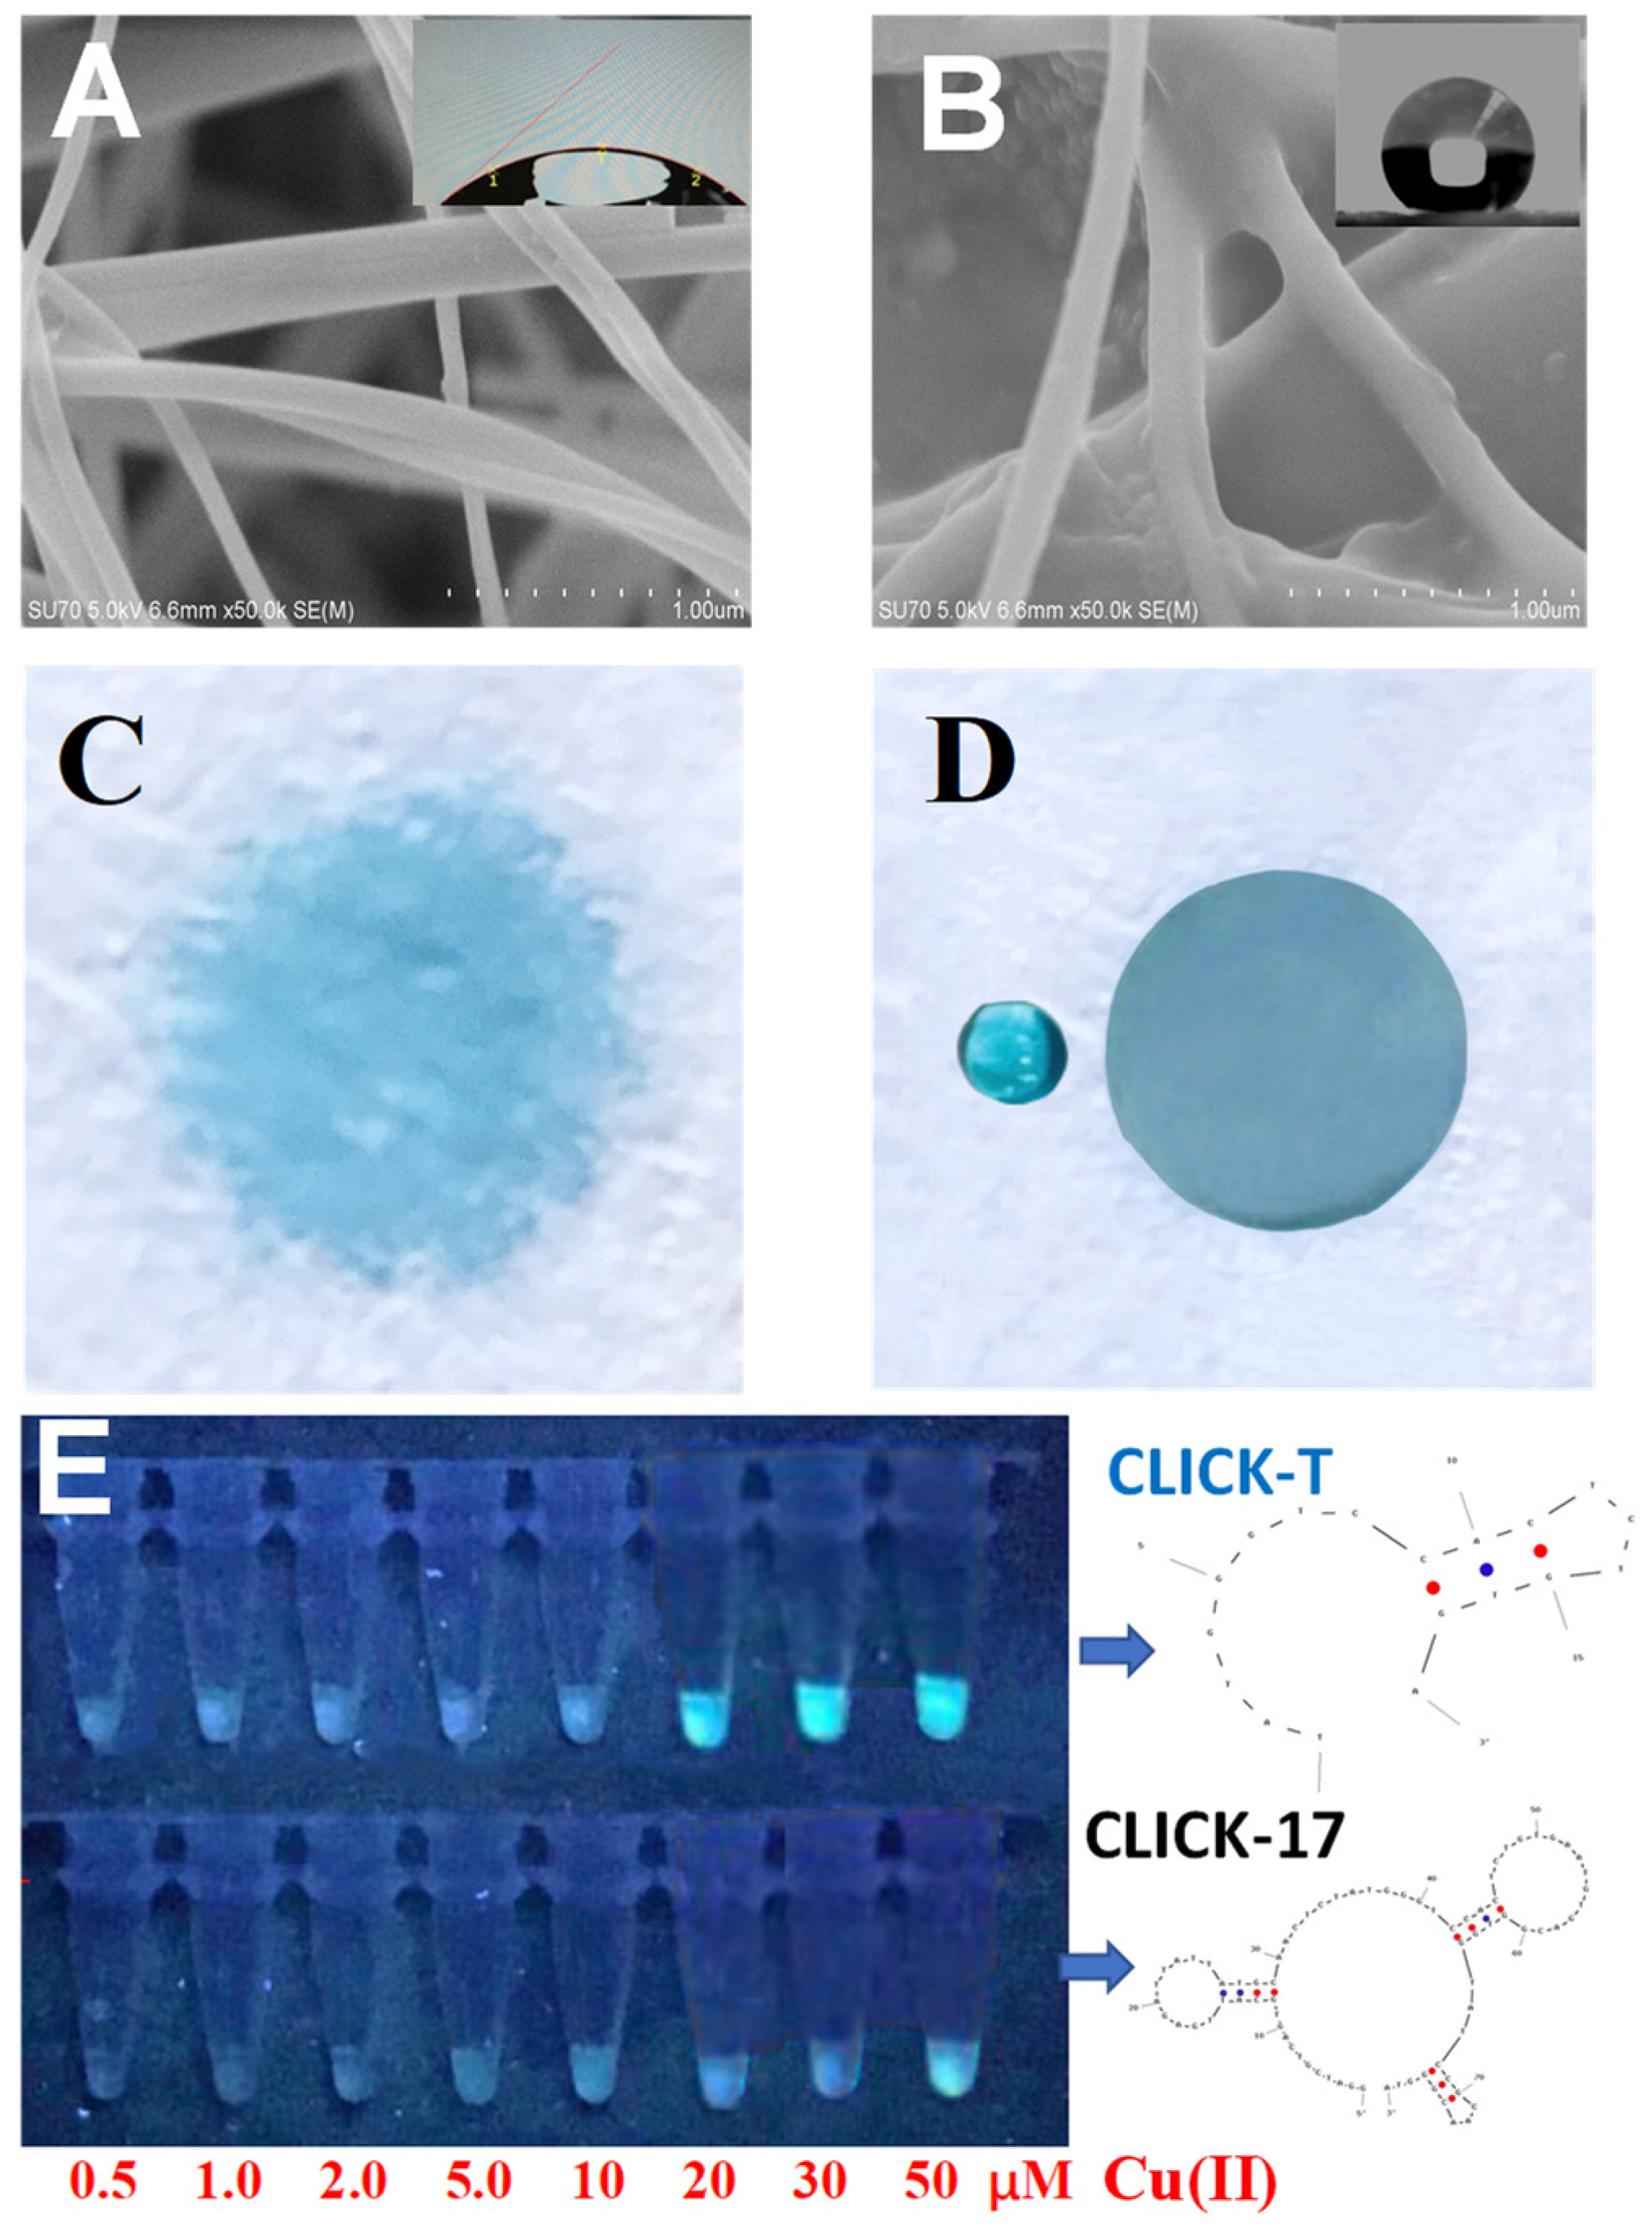
3.1. The Feasibility of Copper Detection by the CLICK-T Modified PADs

In the present work, the copper detection was performed based on the reaction of Cu(II)AAC between 3-butyn-1-ol (BOL) and 3-azide-7-hydroxycoumarin (AHC), which was catalyzed by CLICK-T DNAzyme on detection disks of PADs (Figure 1). Due to the electron richness of the azido group on the 3-position of AHC, its fluorescence is largely quenched; upon reacting with BOL, the fluorescence would be significantly increased by forming the triazole ring structure [11]. The scanning electron microscopy images and contact angles were determined to characterize the PADs’ surface (Figure 2A,B). The enlarged contact angle and rougher surface indicated that the outer area of PAD is hydrophobic after silanization treatment.
We dripped 30 µL dye solution on the normal glass filter paper (Figure 2C) and PAD arrays including hydrophilic (for detection) and hydrophobic (for preventing water drop diffusion) regions (Figure 2D). When the water was dripped on the untreated (without salinization) filter paper, it could be found that the dye drops quickly spread into a large circle with uneven color distribution. While the dye was dripped on the hydrophobic area outside the PAD area (Figure 2D), a round water drop without diffusion will be formed. When the dye was dripped on the hydrophilic area in PAD disk, it would rapidly diffuse from the center and penetrate the entire area. The blue color was more evenly distributed on the hydrophilic area than the untreated filter paper. In order to effectively restrict and guide the liquid flow in the design area, we tried to change the filter paper outside the PDA detection area from hydrophilic to hydrophobic. It has been reported that MTS can react with the hydroxyl groups on the filter paper’s surface to form a three-dimensional structure, which increases the roughness of the paper base. As shown in Figure S5, MTS molecules not only react with the hydroxyl groups on the surface, but also aggregate into a 3D nanonetwork. It has been reported that on glass and silicon surfaces, superhydrophobicity is the result of aggregated nanostructures (formed from facile hydrolysis and condensation reactions of MTS) [18]. It could also be found that the solution of 100 µM 3-azido-7-hydroxycoumarin and 3-butyn-1-ol (AHC-BOL) exhibited fluorescence signal in the presence of Cu(II) and DNAzyme (CLICK-T or CLICK-17). The fluorescence light was more intensive for CLICK-T than CLCIK-17 in the presence of same concentration of Cu(II).
We also used the gel electrophoresis to compared CLICK-17 and CLICK-T’s catalytic effects for Cu(II) detection. Streptavidin labeled with azide group was employed to react with CLICK-T and CLICK-17 labeled with alkyne group in the presence of Cu(II). In Figure 3, it could be found that both CLICK-T and CLICK-17 exhibited a pure band in gel electrophoresis image. While in the presence of certain concentration of Cu(II), CLICK-T and CLICK-17 with alkyne group could react with streptavidin labeled with azide group. The complex with large molecular weight would produce a band that appeared later. It could be found that the complex’s peak appeared in the presence of 1 μM Cu(II) and 4 μM CLICK-T, while the band could only appear in the presence of 20 μM Cu(II) and CLICK-17. All these demonstrated that CLICK-T has higher catalytic effects towards Cu(II)AAC than CLICK-17. The reasons maybe due to that CLICK-T has shorter length and could be easier to contact and combine with the analyte [25].

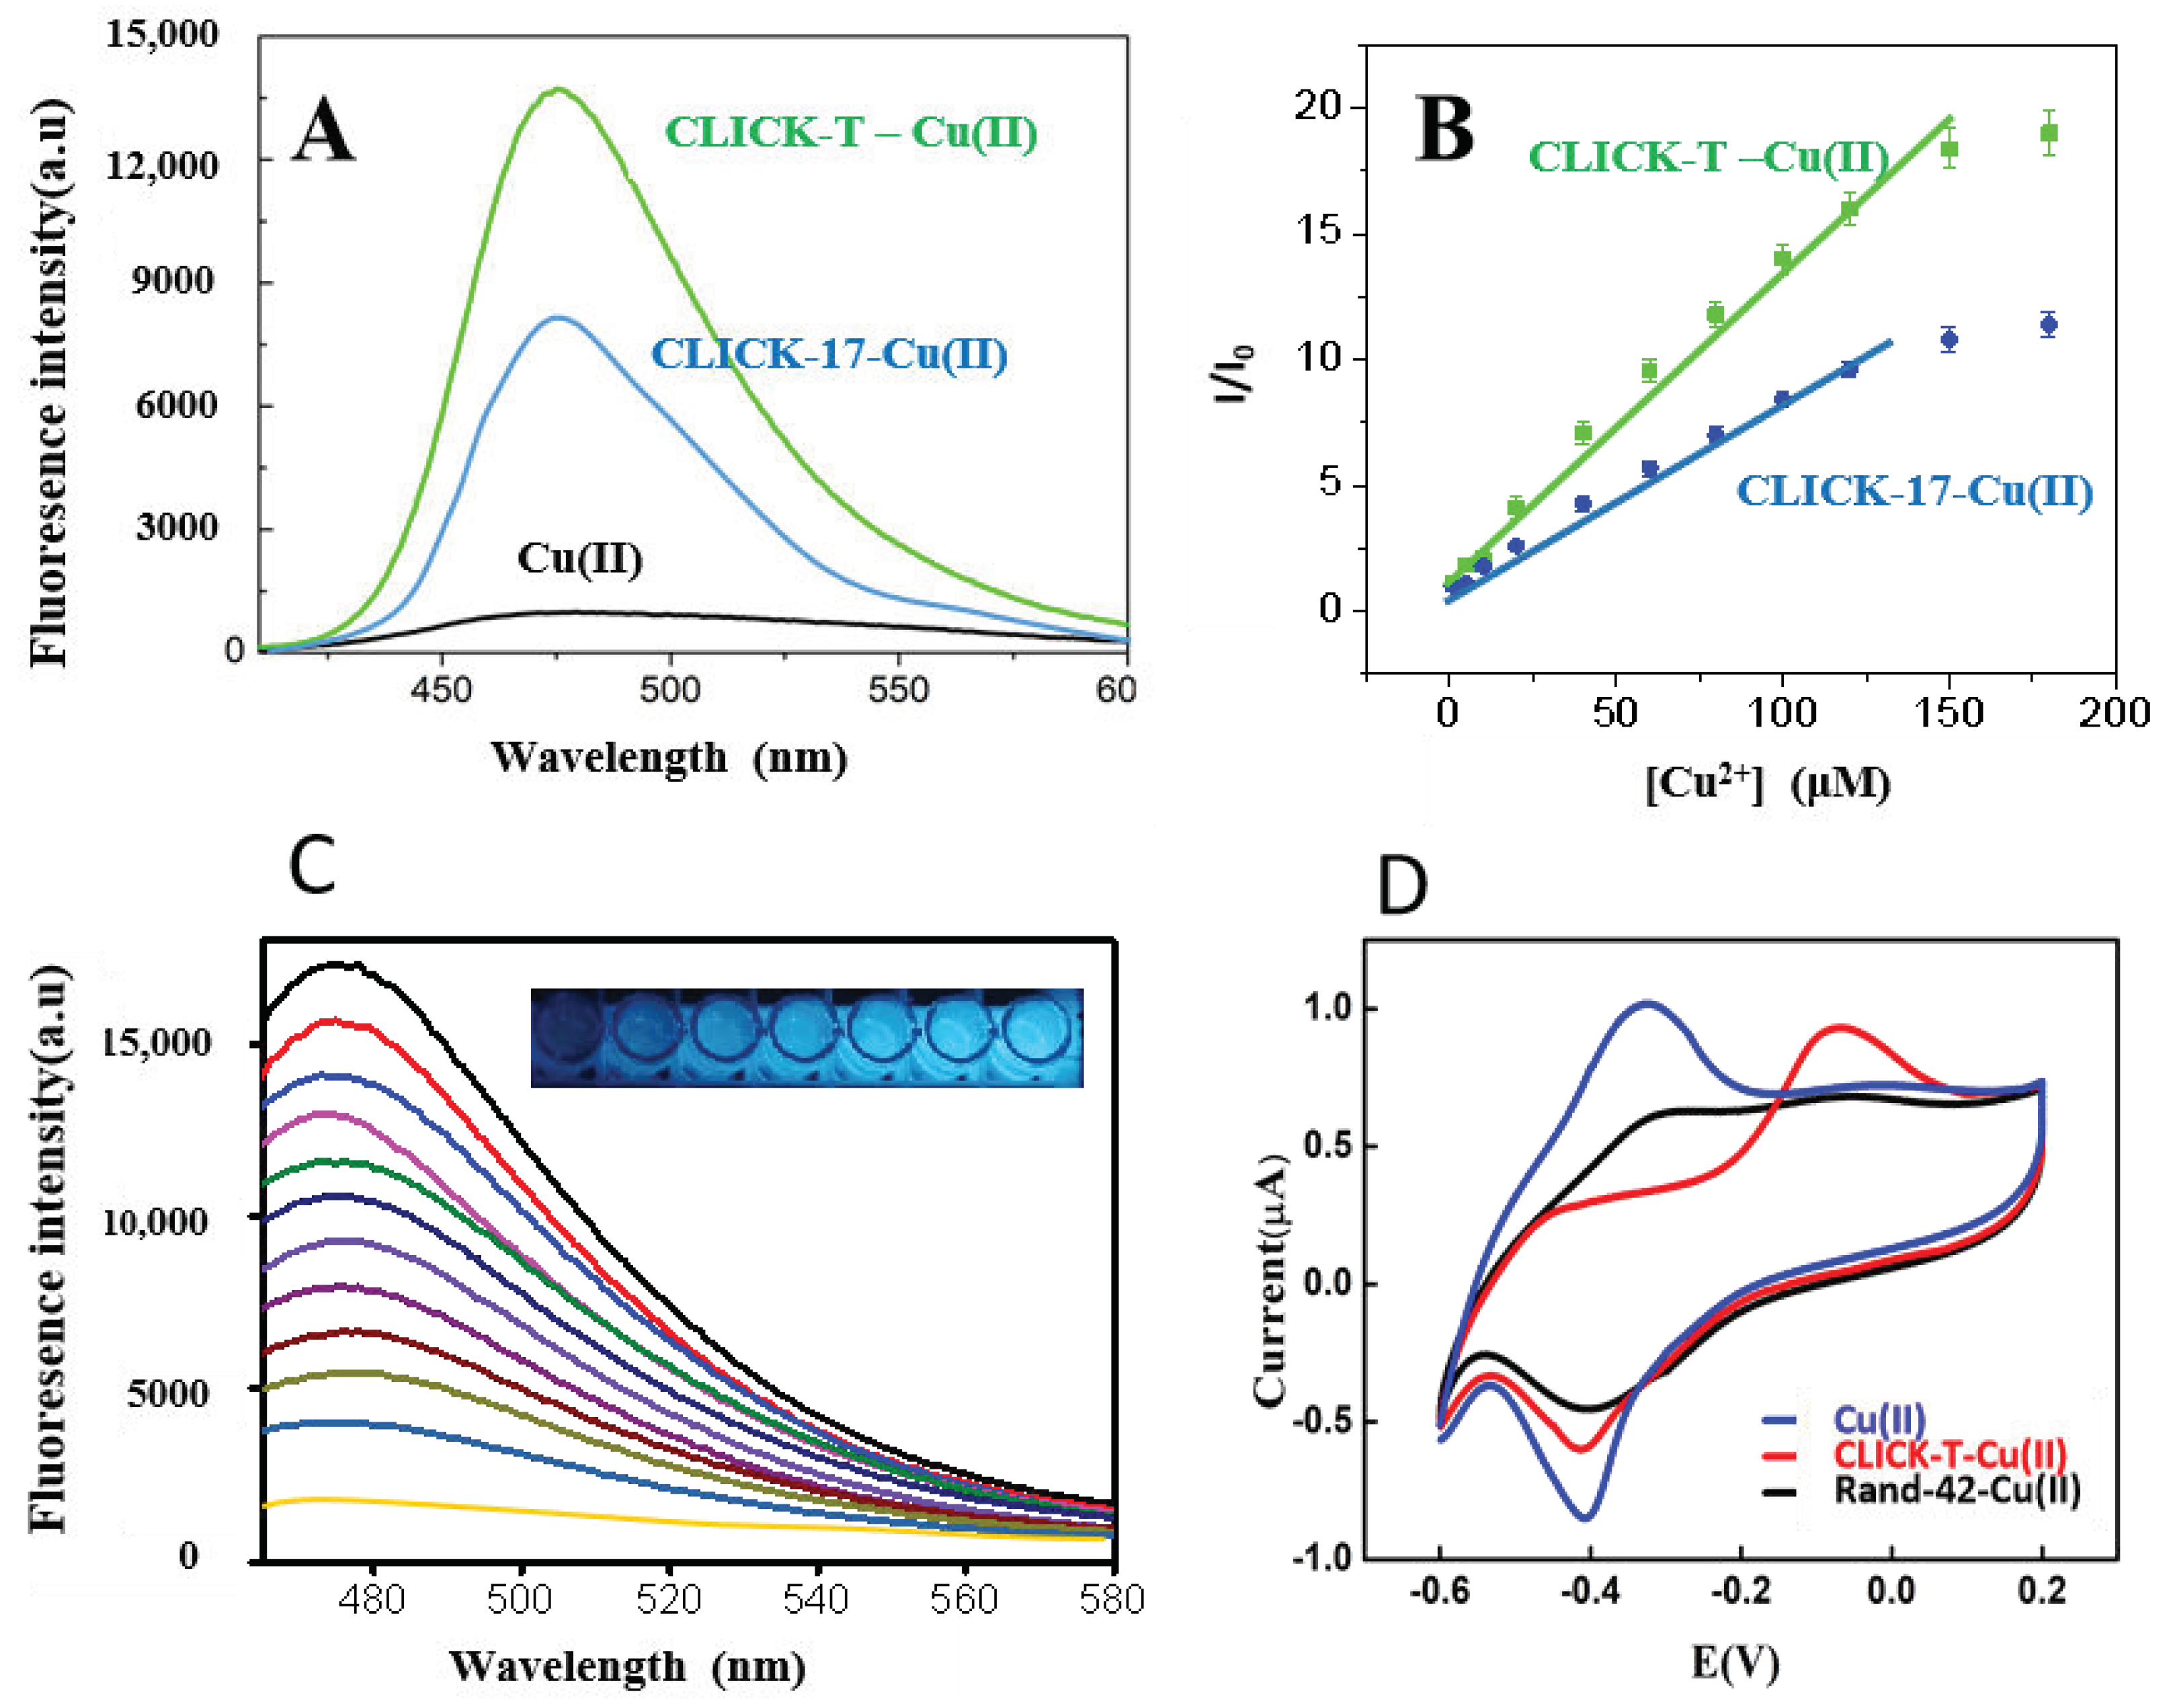
3.2. The Detection Effects and Mechanism of Cu(II) on CLICK-T Modified PADs

As shown of the fluorescent spectrum in Figure 4A, the solution of AHC-BOL exhibited very weak fluorescence (FL) signal without Cu(II). While the FL intensity increases dramatically after the addition of Cu(II) and CLICK-T and CLICK-17. The strong emission light at 470 nm (Ex = 365 nm) confirmed that CLICK-T has higher catalysis effect than CLICK-17 to trigger Cu(II)AAC. The relationship between the copper concentration and the increased fluorescence intensity were also reflected by the normalized intensities of a series of standard solutions containing different concentrations of Cu(II) (0–180 µM) (I/I0, I is the signal of AHC-BOL system at certain concentration of Cu ions, I0 is the initial signal of AHC-BOL without Cu ions). As shown in Figure 4B—blue curve—the FL signal, in the presence of CLICK-17, increases linearly with the concentration of Cu(II) ions in the range of 5 µM to 120 µM before saturation, while the linear range of Cu(II) using CLICK-T assisted CuAAC was from 1 µM to 150 µM, which was wider than CLICK-17 (green curve). The FL spectrums from CLICK-T system were exhibited in Figure 4C. All the results demonstrated that CLICK-T can be employed to catalyze Cu(II)AAC using a fluorescent signal. Based on the linear fit to experimental data, the detection limit of Cu(II) was calculated to be 2.0 ± 0.2 µM Cu(II) based on CLICK-17, while 0.3 ± 0.08 µM for CLICK-T.
In order to explain the possible catalytic mechanism of DNAzyme, cyclic voltammetry (CV) experiments were carried out in the HEPES buffer using Cu(II) together with CLICK-T or DNA strand with random sequence (we called it RAND-42; the sequence was shown in Section 2.1). Figure 4D showed, in the presence of DNAzyme (CLICK-T), the redox property of the Cu(II)/Cu(I) couple could be significantly influenced. In the blue curve, there were a pair of redox peaks corresponding to Cu(II)/Cu(I). While there are no discernible changes of potential in either the reduction or oxidation peak after 4 µM other DNA was added (black curve), only the peaks’ current was lowered. While CLICK-T was introduced into the detection system, the oxidation peak of Cu(II)/Cu(I) was positively shifted by 180 mV. This meant the stability of Cu(I) was much more improved. In addition, the much larger separation between the oxidation and reduction peaks indicated slower electron-transfer rates between the Cu(II) and Cu(I) as well. The above results demonstrated that Cu(I)/Cu(II) species could be stably bind to CLICK-T DNAzyme other than to DNA stands with a random sequence. That may be why CLICK-T showed good catalytic effects to Cu(II)AAC.

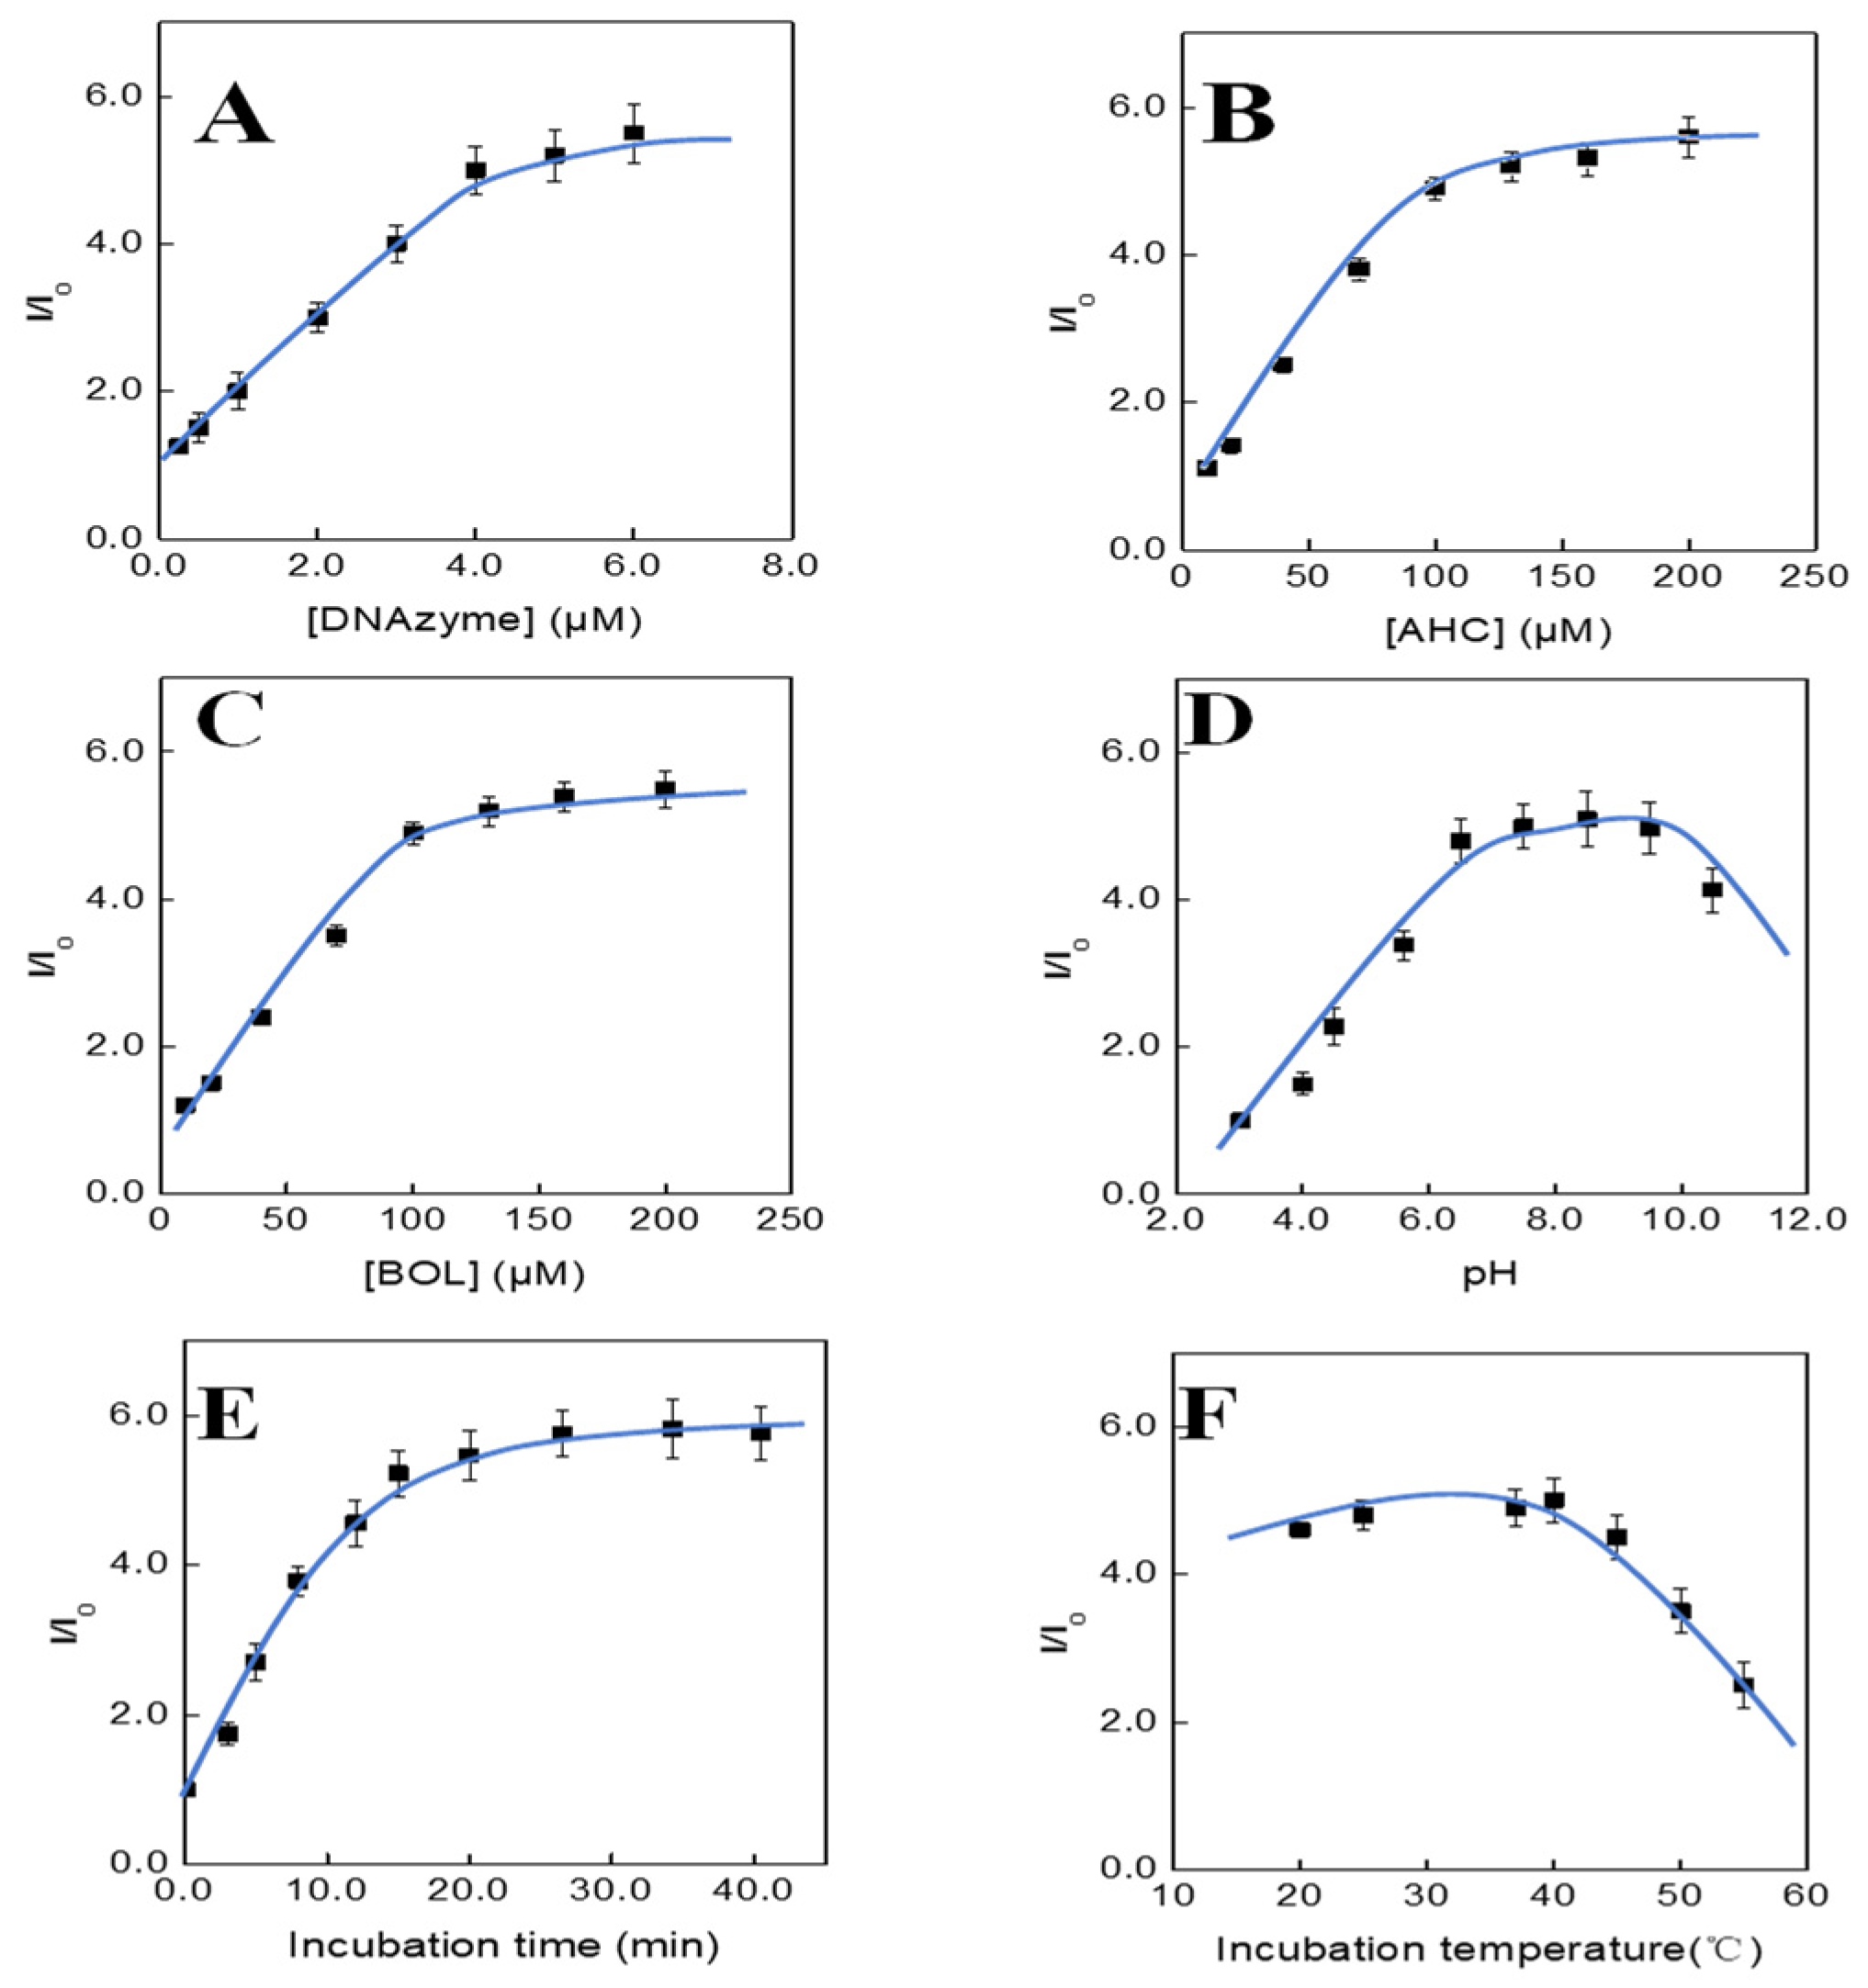
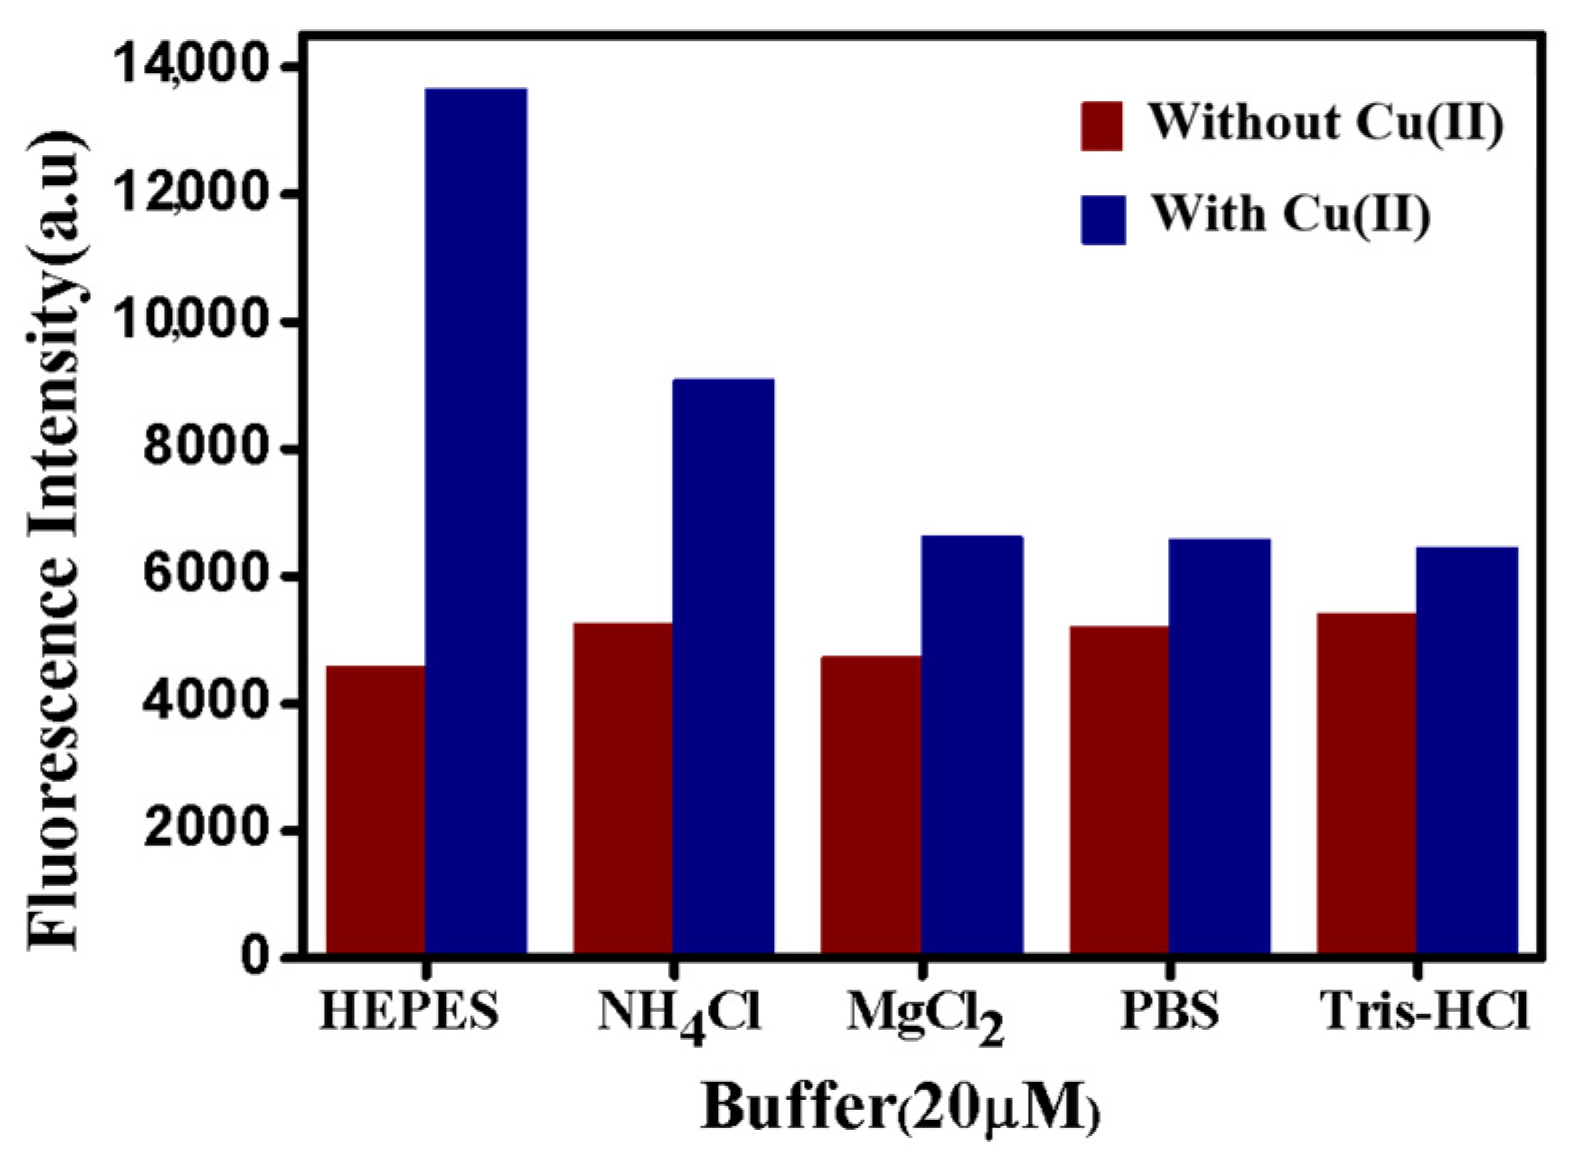
3.3. Optimization of the Assay

A series of conditions were explored to optimize the copper detection by the PADs. The optimized amount of CLICK-T was evaluated by detecting 25 µM Cu(II). The obtained results are presented in Figure 5A. As the concentration of CLICK-T was set from 0.5 to 4.0 µM, an increase in the fluorescence light (FL) signal was observed. When the concentration of CLICK-T increased afterwards, the signal did not increase significantly. Considering reducing the cost, the optimum concentration of CLICK-T (4.0 µM) as the lowest amount of probes modified on PADs was used for the test. To optimize the assay, we have further investigated the effect of AHC and BOL concentration in the presence of HEPES. As depicted in Figure 5B,C, both of them played important roles in detection. The FL signal increased with the concentration of them and reached the highest value at the concentration of 100 µM. This could be ascribed to the fact that the reaction reached the equilibrium after the concentration. After then, the reagent on the paper could aggregate and impede the subsequent click reaction at the paper surface. As displayed in Figure 5D, the CLICK-T could also be used between pH 6.5 and 7.5 at room temperature, which normally appeared in nature water most cases. Moreover, the incubation time was also optimized; the largest FL signal was obtained was obtained at 20 min (Figure 5E). After then, prolonging the reaction time would not bring obvious signal incensement. From Figure 5F, it also could be found that the PAD could emit stable FL signal within 25 to 40 °C, then the signal would decrease as the temperature increases. This was because the DNAzyme would lose reactivity at higher temperature. We also optimized different buffer solutions for the CuAAC system (Figure 6). It was found that 25 mM HEPES at pH 6.5 was the optimized buffer. According to Zhang’s work [14], we selected non-fluorescent” 3-azide-7-hydroxycoumarin to react with different alkyne alcohol in the presence of Cu(II) and forms the fluorescent triazole product. We optimized different alkyne alcohol for the detection. The optimized alkyne alcohol was 3-butyn-1-ol and the data was shown in Figure S6. Indeed, many fluorescent dyes with azide group can be used for Cu ion detection, and we will further select them in the future work.
In summary, the detection of Cu(II) ions could be performed in DNAzyme-modified PAD at pH 6.5–7.5 and room temperature within 20 min, and other optimized conditions are 4 µM DNAzyme, 100 µM AHC and BOL. Moreover, no reductive reagents are needed. All these made the assay suitable for the point-of-care testing for Cu ions in water samples.
In Figure 7A, the FL images of CLICK-T- and CLICK-17-modified PADs were exhibited under a handheld UV lamp (365 nm), together with different Cu(II) concentrations. It was clear that the disks became gradually brighter with the increase in concentrations of Cu(II) or Cu+. According to the Pixolor App software, each color intensity (RGB value) was obtained. It was found that the G channels correlate with the tested copper concentrations, and showed high intensities. The G/G0 were is proportional to the copper concentration with a lower background. It could be found in Figure 7B, where the maximum detection concentration of Cu(II) reached 150 µM (c) for CLICK-17, while it was 100 µM (d) for CLICK-T. While the sensitivity (slope of calibration line) of CLICK-T (0.01898) was 1.5 fold higher than CLICK-17 (0.01225), the best linear fit of PADs yields a R2 value as high as 0.997 (CLICK-T) and 0.998 (CLICK-17). The determined detection limit, 0.1 ± 0.05 M, was comparable to the spectrophotometry measurement (Figure 4B). All these confirmed that DNAzyme-modified PADs could satisfy the detection requirement, in comparison with the standard fluorescence spectrophotometric measurements in solution.
The quantitation of copper in environmental monitoring and biomedical diagnosis were summarized in Table 1. Many different methods were listed. Among them, most commercial copper detection kits rely on either colorimetric or fluorometric readout in 96-well plates or tubes [19], with linear response range of about 1 µM to 50 µM and 30 to 60 min. Without particular optimization, the detection limit of the PADs is obviously lower (0.1 µM), and the measurement time was comparably shorter than commercial kits, while the selectivity of the assay based on Cu(II)AAC was higher than the commercial ones, which were based on colorimetric reaction. From the above results, it could be found that the fabricated DNAzyme-based chemosensor could meet the need for a copper ion detection limit (30 µM) in drinking water, set by the World Health Organization. It also can be used to detect human serum copper (10–20 μM) [20]. As it was well known [19], the free copper ion in natural water is basically Cu(II), while Cu(I) is unstable and it is difficult for it to exist in this environment. Thus, the assay is suitable for copper ions detection in natural waters.

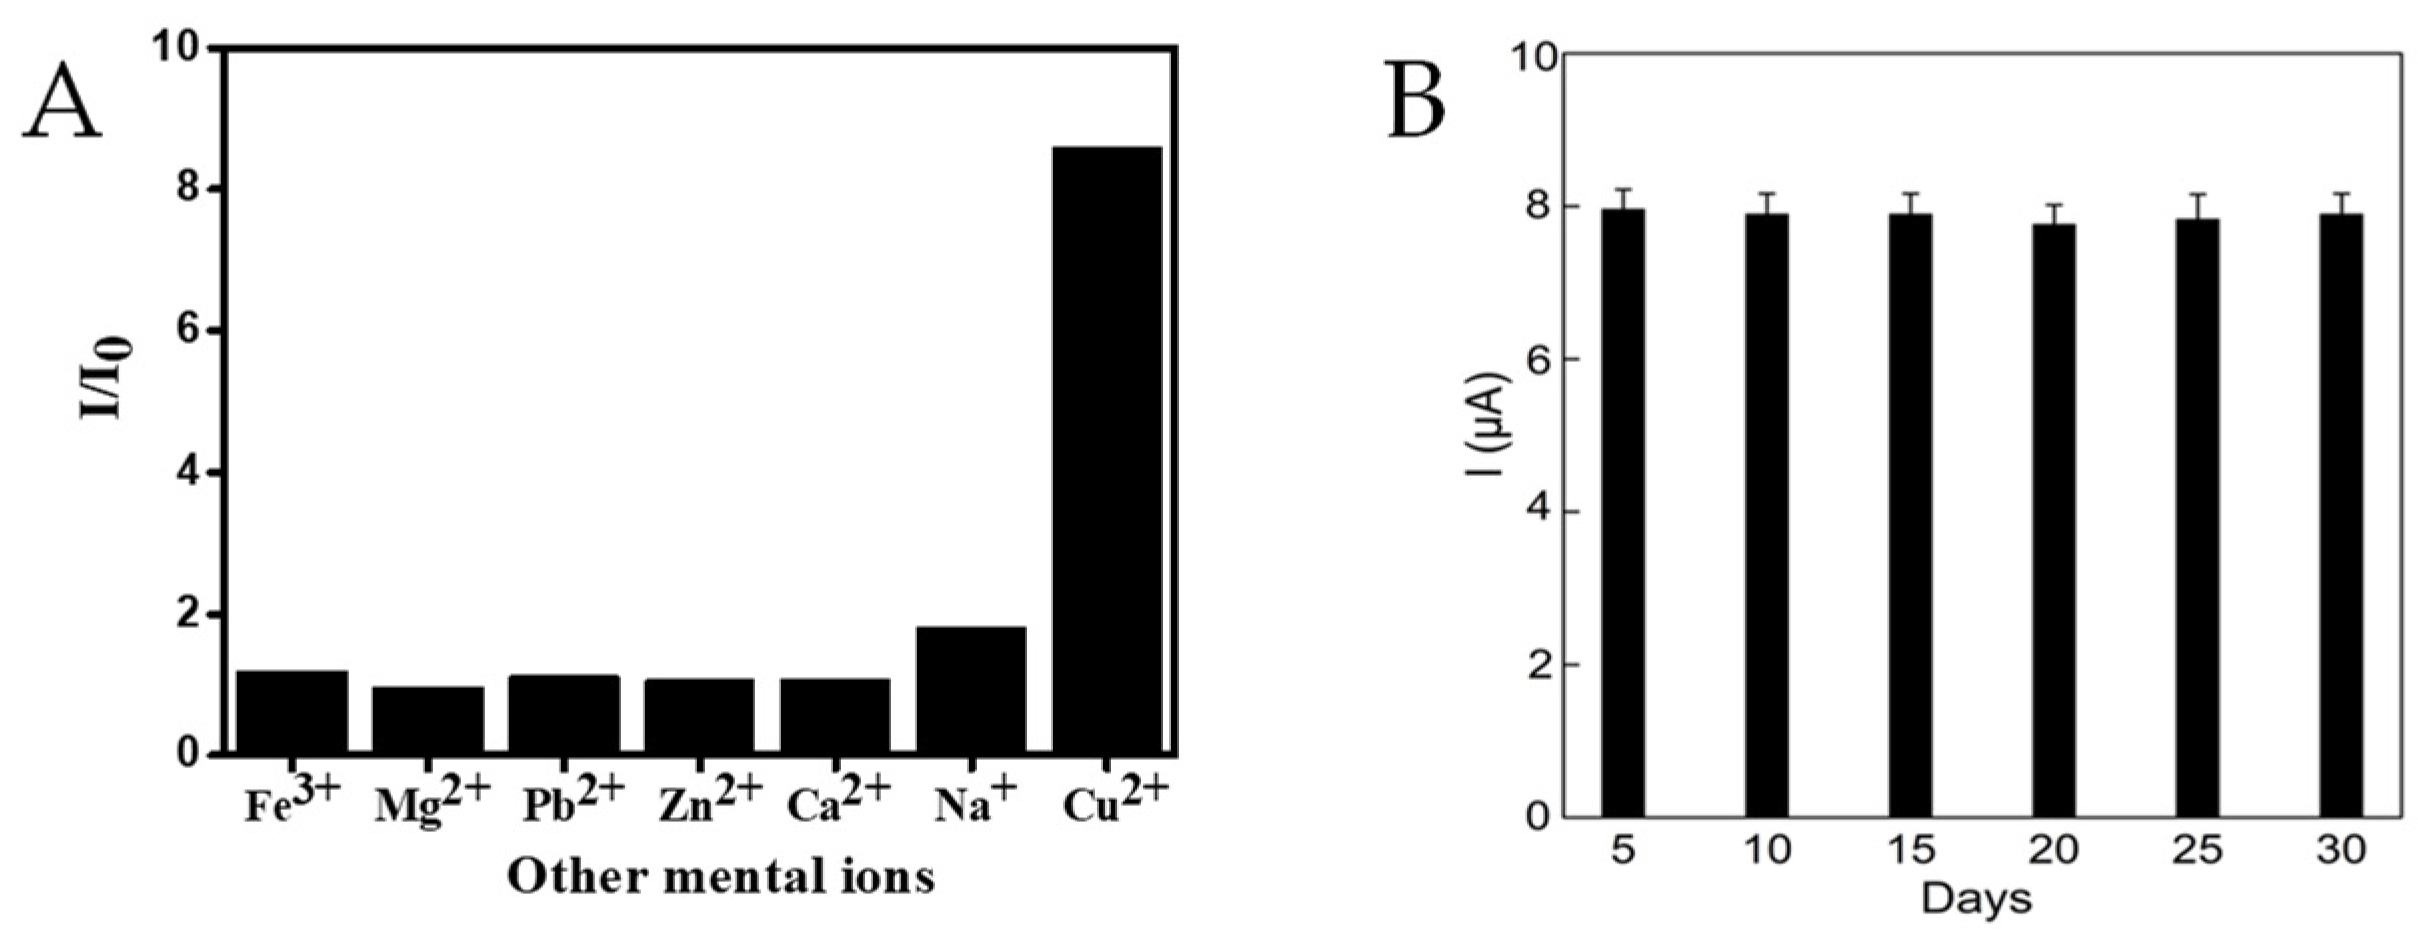
3.4. Reproducibility, Selectivity and Stability of the Assay

Under the above conditions, the selectivity of the µPAD towards Cu ion detection were shown in Figure 8A. It could be found that there was negligible FL signal in the matrix samples. The presence of 50 µM Cu(II) and some common metal ions (500µM Fe3+, Mg2+, Pb2+, Zn+, Ca2+, Na+) in natural waters were detected by the DNAzyme-based sensor. In Figure 8A, it can easily be found that only the solution containing Cu ions showed more intensive FL signals, while negligible signals were observed for other metals. According to these experiments, the interference of other common metal ions in waters could be ignorable.
Furthermore, we investigated the sensor’s precision using 5 and 50 µM Cu(II). The RSD % is 4.7% and 5.4% for ten successive assays, respectively. The stability was furthermore studied in Figure 8B. The signals for 50 µM Cu(II) hardly changed. All these demonstrated the DNAzyme-based sensor exhibited satisfied reproducibility and stability for being used in real water samples.

3.5. Detection of Copper Ions in Real Water Samples

Furthermore, the PADs were employed to detect the Cu ions in real natural samples. The results were compared with standard ICP-AES method and listed in Table 2. It could be found that the assay has the same accuracy for copper detection comparing with ICP-AES, and acceptable recoveries between 89–102% were obtained. Additionally, the RSD% was between 1.3 and 5.8%. All these meant the assay could be employed for detecting Cu ions in real waters.

4. Conclusions

In the study, a kind of paper-based fluorescent device-modified DNAzyme (CLICK-T and CLICK-17) was designed to analyze Cu ions via point-of-care test with high sensitivity and specificity. We found a new truncated DNAzyme—CLICK-T—exhibited higher catalytic effects comparing with the reported CLICK-17 DNAzyme. More importantly, the sample was only needed to be dripped on the surface of DNAzyme modified PADs, which can generate visual fluorescence after 20 min, and the data in the PAD in the black box can be read by mobile phone for quantification. The employment of black box and G/G0 ratio detection strategy meant the signal was not interfered with by environmental light. This method is very simple and portable, and can realize real-time online analysis of copper ions. Compared with laboratory testing, it greatly simplifies the detection steps and shortens the time, and exhibits good practical application effect.

Supplementary Materials

The following supporting information can be downloaded at: https://0-www-mdpi-com.brum.beds.ac.uk/2227-9040/10/2/72/s1, Figures S1–S4: The detection of copper ion by the CLICK-T-modified PDA, Figure S5: Schematic diagram of paper-based hydrophobization reaction, Figure S6: (A) Cu+ catalyzed the click reaction of 3-azide-7-hydroxycoumarin-hexynol. (B) Cu+ catalyzed the click reaction of 3-azide-7-hydroxycoumarin-butynol. The concentrations of AHC was 100 µM in pH 6.5 25 mM HEPES buffer and reacted for 20 min, Table S1: The base sequence of CLICK-17 and other DNA with random sequence, Table S2: Sequence and dissociation constants (Kd) for the studied DNAzyme, Table S3: The pH, dissolved oxygen, ion concentrations of the water samples.

Author Contributions

Conceptualization, writing—original draft, J.W.; investigation, validation, H.H.; investigation, validation, J.L.; writing—review and editing, M.W.; methodology, conceptualization, supervision, writing and funding acquisition, N.G.; supervision, writing and funding acquisition, W.B. All authors have read and agreed to the published version of the manuscript.

Funding

This work was supported by the Natural Science Foundation of China (21974074), Ningbo Public Welfare Technology Plan Project of China (202002N3112), Ningbo City Major Scientific and Technological Program of China(20211ZDYF020179), Zhejiang Province Welfare Technology Applied Research Project (2020C02023, LGC20B050006, LGC19B070003) and K. C. Wong Magna Fund in Ningbo University.

Institutional Review Board Statement

Not applicable.

Informed Consent Statement

Not applicable.

Acknowledgments

We would like to express our gratitude to Huang-Zhong Yu and Kun Liu in the Department of Chemistry at Simon Fraser University (Canada) for their helpful discussions on the design and decoration of the CLICK-17 DNAzyme.

Conflicts of Interest

The authors declare no conflict of interest.

References

  1. Wang, Q.; Li, T.; Fang, D.; Li, X.; Fang, L.; Wang, X.; Mao, C.; Wang, F.; Wan, M. Micromotor for removal/detection of blood copper ion. Microchem. J. 2020, 158, 105125. [Google Scholar] [CrossRef]
  2. Dugandžić, V.; Kupfer, S.; Jahn, M.; Henkel, T.; Weber, K.; Cialla-May, D.; Popp, J. A SERS-based molecular sensor for selective detection and quantification of copper(II) ions. Sens. Actuators B Chem. 2018, 279, 230–237. [Google Scholar] [CrossRef]
  3. Ge, C.; Luo, Q.; Wang, D.; Zhao, S.; Liang, X.; Yu, L.; Xing, X.; Zeng, L. Colorimetric detection of copper(II) ion using click chemistry and hemin/G-quadruplex horseradish peroxidase-mimicking DNAzyme. Anal. Chem. 2014, 86, 6387–6392. [Google Scholar] [CrossRef] [PubMed]
  4. Cao, Y.; Feng, J.; Tang, L.; Yu, C.; Mo, G.; Deng, B. A highly efficient introduction system for single cell- ICP-MS and its application to detection of copper in single human red blood cells. Talanta 2020, 206, 120174. [Google Scholar] [CrossRef] [PubMed]
  5. Baghban, N.; Yilmaz, E.; Soylak, M. Nanodiamond/MoS2 nanorod composite as a novel sorbent for fast and effective vortex-assisted micro solid phase extraction of lead(II) and copper(II) for their flame atomic absorption spectrometric detection. J. Mol. Liq. 2017, 234, 260–267. [Google Scholar] [CrossRef]
  6. Chedia, B.A.H.; Meriem, B.; Houcine, B.; Nicole, J. Copper(II) Electrochemical Sensor Based on Aluminon as Chelating Ionophore. IEEE Sens. J. 2019, 19, 8605–8611. [Google Scholar]
  7. Gan, N.; Liu, K.; Qi, L.; Zhang, G.; Guo, Y.; Dipankar, S.; Yu, H.Z. DNAzyme-Catalyzed Click Chemistry for Facilitated Immobilization of Redox Functionalities on Self-Assembled Monolayers. J. Phys. Chem. C 2020, 124, 19083–19090. [Google Scholar] [CrossRef]
  8. Situ, B.; Zhao, J.; Lv, W.; Liu, J.; Li, H.; Li, B.; Chai, Z.; Cao, N.; Zheng, L. Naked-eye detection of copper(II) ions by a “clickable” fluorescent sensor. Sens. Actuators B Chem. 2017, 240, 560–565. [Google Scholar] [CrossRef]
  9. Tarnowska, M.; Krawczyk, T. Click chemistry as a tool in biosensing systems for sensitive copper detection. Biosens. Bioelectron. 2020, 169, 112614. [Google Scholar] [CrossRef] [PubMed]
  10. Jennah, O.; Beniazza, R.; Lozach, C.; Jardel, D.; Molton, F.; Duboc, C.; Buffeteau, T.; Kadib, A.E.; Lastécouères, D.; Lahcini, M.; et al. Photoredox Catalysis at Copper(II) on Chitosan: Application to Photolatent CuAAC. Adv. Synth. Catal. 2018, 360, 4615–4624. [Google Scholar] [CrossRef]
  11. Zheng, W.; Li, H.; Chen, W.; Zhang, J.; Wang, N.; Guo, X.; Jiang, X. Rapid Detection of Copper in Biological Systems Using Click Chemistry. Small 2018, 14, 1703857. [Google Scholar] [CrossRef]
  12. Hua, C.; Zhang, W.H.; De Almeida, S.R.; Ciampi, S.; Gloria, D.; Liu, G. A novel route to copper(II) detection using ‘click’ chemistry-induced aggregation of gold nanoparticles. Analyst 2012, 137, 82–86. [Google Scholar] [CrossRef] [PubMed]
  13. Evgeniy, M.; Israel, A.; Yonatan, H.; Medrano, S.L.; Arezoo, D.; Jörg, B.; Rafael, G.; Gianaurelio, C.; Mattan, H.; Shlomo, Y. Copper Induced Conformational Changes of Tripeptide Monolayer Based Impedimetric Biosensor. Sci. Rep. 2017, 7, 9498. [Google Scholar]
  14. Zhang, L.; Kwok, H.; Li, X.; Yu, H.Z. Superhydrophobic substrates from off-the-shelf laboratory filter paper: Simplified preparation, patterning, and assay application. ACS Appl. Mater. Interfaces 2017, 9, 39728–39735. [Google Scholar] [CrossRef] [PubMed]
  15. Liu, K.; Kumar, L.P.; Zhong, Y.; Dipankar, S. CLICK-T, a DNA enzyme that harnesses ultra-low concentrations of either Cu+ or Cu2+ to catalyze the azide-alkyne ‘click’ reaction in water. Nucleic Acids Res. 2020, 48, 7356–7370. [Google Scholar] [CrossRef] [PubMed]
  16. Baharfar, M.; Rahbar, M.; Tajik, M.; Liu, G. Engineering strategies for enhancing the performance of electrochemical paper-based analytical devices. Biosens. Bioelectron. 2020, 167, 112506. [Google Scholar] [CrossRef] [PubMed]
  17. Yamada, K.; Suzuki, K.; Citterio, D. Text-Displaying Colorimetric Paper-Based Analytical Device. ACS Sens. 2017, 2, 1247–1254. [Google Scholar] [CrossRef] [PubMed]
  18. Zhang, L.; Chen, K.S.; Yu, H.-Z. Superhydrophobic Glass Microfiber Filter as Background-Free Substrate for Quantitative Fluorometric Assays. ACS Appl. Mater. Interfaces 2020, 12, 7665–7672. [Google Scholar] [CrossRef]
  19. Saleh, S.M.; Ali, R.; Alminderej, F.; Ali, I.A. Ultrasensitive Optical Chemosensor for Cu(II) Detection. Int. J. Anal. Chem. 2019, 2019, 7381046. [Google Scholar] [CrossRef] [PubMed]
  20. Yao, Z.; Yang, Y.; Chen, X.; Hu, X.; Zhang, L.; Liu, L.; Zhao, Y.; Wu, H. Visual detection of copper(II) ions based on an anionic polythiophene derivative using click chemistry. Anal. Chem. 2013, 85, 5650–5653. [Google Scholar] [CrossRef]
  21. Sanji, T.; Nakamura, M.; Tanaka, M. Fluorescence ‘turn-on’ detection of Cu2+ ions with aggregation-induced emission-active tetraphenylethene based on click chemistry. Tetrahedron Lett. 2011, 52, 3283–3286. [Google Scholar] [CrossRef]
  22. Shen, Q.; Tang, S.; Li, W.; Zhou, N.; Liu, Z.; Huang, Y.; Yao, S. A novel DNA-templated click chemistry strategy for fluorescent detection of copper(II) ions. Chem. Commun. (Camb. Engl.) 2012, 48, 281–283. [Google Scholar] [CrossRef]
  23. Qiu, S.; Li, X.; Xiong, W.; Xie, L.; Guo, L.; Lin, Z.; Qiu, B.; Chen, G. A novel fluorescent sensor for mutational p53 DNA sequence detection based on click chemistry. Biosens. Bioelectron. 2013, 41, 403–408. [Google Scholar] [CrossRef]
  24. Copper Assay Kit; Cat. No. KA1615; Abnova: California, CA, USA, 2019.
  25. Sun, Y.; Duan, N.; Ma, P.; Liang, Y.; Zhu, X.; Wang, Z. Colorimetric aptasensor based on truncated aptamer and trivalent DNAzyme for Vibrio parahemolyticus determination. J. Agric. Food Chem. 2019, 67, 2313–2320. [Google Scholar] [CrossRef]
Figure 1. (A) 3-azide-7-hydroxycoumarin reacts with 3-butyn-1-ol (BOL) in the presence of Cu(II) on CLICK-T-modified PADs to emit the fluorescence light whose intensity could be observed by the naked eye and quantified by the smartphone; (B) The fluorescent light development mechanism.
Chemosensors 10 00072 g001
Figure 2. The scanning electron microscopy (SEM) of (A) unmodified glass fiber filter paper with contact angle of 36 ± 2° and (B) CLICK-T DNA modified filter paper with contact angle of 138 ± 2°. (C) The water-soluble dye under natural light in untreated PDA, and on (D) silanized area and DNAzyme modified area of PADs. (E) The fluorescent light of AHC-BOL solution in the presence of Cu(II) and 4 μM DNAzyme (CLICK-T or CLICK-17).
Chemosensors 10 00072 g002
Figure 3. (A) CLICK-T- and (B) CLICK-17-assisted CuAAC reaction triggered by (1, 2, 5, 10, 20, 50, 100 μM of Cu(II)) in the presence of 4 μM CLICK-17 and CLICK-T labeled with alkyne groups and 100 μM Streptavidin with azide group in pH 6.5, 25 mM HEPES.
Chemosensors 10 00072 g003
Figure 4. (A) Fluorescence spectra of the “click reaction” mixture measured before (black line) and after adding 50 µM Cu(II) or after adding 50 µM Cu(II) and 4 µM CLICK-T (green line) or CLICK-17 (blue line). (B) The fluorescence intensity increase (I/I0) as a function of the copper concentration with CLICK-T + Cu(II) (green line). (C) The fluorescence signal ranging from 0, 0.5, 1, 5, 10, 20, 40, 60, 80, 100, 120, 150 μM Cu(II) and CLICK-T. The insert image is the photo images from 0, 0.5, 1, 5, 10, 20, 40 μM Cu(II). (D) Cyclic voltammetry of 0.2 mM CuSO4 in 25 mM HEPES buffer (blue line); 0.2 mM CuSO4 with 0.1 mM CLICK-T (red line); 0.2 mM CuSO4 with 0.1 mM other DNA (black line).
Chemosensors 10 00072 g004
Figure 5. Optimization of experimental parameters including (A) concentration of CLICK-T, (B) concentration of AHC, (C) concentration of BOL, (D) the incubation pH, (E) the incubation time, and (F) the incubation temperature.
Chemosensors 10 00072 g005
Figure 6. The effect of different buffer solutions (pH 6.5) on the fluorescence intensity for CLICK-T triggered Cu(II)AAC. The detection conditions were same as that of Figure 4.
Chemosensors 10 00072 g006
Figure 7. (A) The fluorescent photo of (a) CLICK-17- or (b) CLICK-T-modified PADs, which catalyze different concentration of Cu(II) under UV lamp (365 nm), the diameter of test disk of PAD is 0.7 cm. (B) Normalized green intensity (G/G0, G0 is the green light signal without Cu(II)) versus the copper concentration on the (c) CLICK-17- or (d) CLICK-T-modified PADs. Other conditions were as same as Figure 4.
Chemosensors 10 00072 g007
Figure 8. (A) The interference of other metal ions; (B) the stability of PADs to 50 µM Cu(II).
Chemosensors 10 00072 g008
Table 1. Comparison of the assay with other assay for copper detection.
Detection MethodReaction TimeLinear Range &
Detection Limit
Reference
Fluorometric detection in solution using fluorescence spectrometer1 h0–20 µM, 1.0 µM[21]
Fluorometric detection in solution using fluorescence spectrometer2 h0.5–10 µM, 0.29 µM[22]
Colorimetric detection in solution using a UV/Vis spectrophotometer1 h1.8–200 µM, 1.8 µM[12]
Color changes monitored by the naked eye40 min3 µM (visual detection),
0.8 µM (fluorescence spectrometer)
[20]
Fluorometric detection in solution using a fluorescence spectrometer30 min5.0–50 µM, 2 µM[22]
Colorimetric detection in solution using a UV/vis spectrophotometer40 min0.5–50 µM, 0.3 µM[23]
Copper and Iron Test Strip Kit (2994) 4.7–47 μM[24]
The fluorescence PADs20 min0.3–150 µM, 0.1 µMThis work
Table 2. Detection of copper ions in water samples by the assay and ICP-AES (n = 5).
SampleSpiked (µM)Measured (µM)Recovery of the Assay (%)ICP-AES (µM)
Fenghua river00.18 ± 0.030.21 ± 0.04
0.50.67 ± 0.0394.4 ± 4.50.78 ± 0.03
Yuyao river-10ND0.07 ± 0.02
0.50.48 ± 0.0296.0 ± 4.20.58 ± 0.04
Yong river-202.2 ± 0.071.91 ± 0.08
2.03.96 ± 0.0589.0 ± 1.34.01 ± 0.05
Ningbo university01.32 ± 0.051.40 ± 0.10
2.03.21 ± 0.0691.6 ± 1.93.41 ± 0.09
Baixi reservoir0ND0.05 ± 0.02
0.50.51 ± 0.03102 ± 5.80.60 ± 0.03
Publisher’s Note: MDPI stays neutral with regard to jurisdictional claims in published maps and institutional affiliations.

