1. Introduction
The use of nanoparticle-based materials is nowadays gaining a great deal of attention due to their interesting properties and functionalities. Particularly, there is an increasing interest in the development of chemical sensors based on nanoparticles, such as graphene and metal-oxides, due to their high electron mobility [
1]. For example, the combination of reduced graphene oxide (rGO) and ZnO has been explored for developing gas sensors with a sensor response (defined as the change of the electrical resistance) of around 25% [
2]. Furthermore, the development of carbon nanotube (CNT)-based polydimethylsiloxane (PDMS) nanocomposites showed a great potential for the detection of methylparaben (MePRB), a representative preservative for cosmetics [
3]. In addition, graphene has been used as a base material for field-effect transistor sensors, showing a high sensitivity [
4], and its use for the detection of volatile organic compounds (VOCs) has been also explored, showing its capability for VOCs detection in a selective way [
5]. Furthermore, their use as chemiresistors for the detection of NO
2 have been also explored, reaching very high chemi-resistive responses [
6].
Another interesting functionality of these nanoparticle-based composites is the development of electromechanical sensors. In this regard, it is important to point out that, to date, there is an increasing interest in the development of novel inspection techniques and wearable sensors for Structural Health Monitoring (SHM) applications. In this context, a SHM technique must be able to detect, locate and quantify the damage that can occur inside a material.
There are multiple SHM methods. Some of them are based on guided waves, Fiber Bragg Grating sensors (FBGs) or Acoustic Emission (AE) technology [
7,
8]. Although there are important efforts in the development of these techniques, they usually give local, but not overall, information regarding the damage and involve the use of complex mathematical and statistical tools, making the signals produced sometimes difficult to understand and process [
9,
10].
In this context, the development of nanorreinforced polymers, also called nanocomposites, is now gaining much attention. The basis of this type of materials for SHM application lies in the fact that the addition of conducting nanoparticles, such as graphitic nanofillers (CNTs or graphene nanoplatelets, GNPs) promotes the creation of conducting networks inside the insulating media. These conducting networks, when above a critical volume fraction, called the percolation threshold, promote a drastic increment of several orders of magnitude of the electrical conductivity [
11,
12]. Therefore, when applying a mechanical strain or in the presence of some damage, these networks are affected, leading to significant changes in the overall electrical behavior of the nanocomposite. Moreover, the volume fraction needed to ensure the creation of these sensitive electrical networks is often very low, ranging from 0.01–0.1 wt.% for CNTs to 5–15% for GNPs, due to their lower aspect ratio [
13,
14].
For these reasons, the use of nanocomposites for SHM applications are now of wide interest. On the one hand, there are many research studies dealing with numerical and analytical solutions for predicting the electromechanical behavior of these materials, taking some aspect such as the geometry or the dispersion degree reached in the final nanocomposite into account [
15,
16]. In this regard, it is widely known that the most prevalent conducting mechanism governing the electromechanical response is the tunneling effect between neighboring particles [
17]. Accordingly, it has been proven that there is a linear-exponential correlation between the distance between the particles, also called tunneling distance, and the associated electrical resistance [
18,
19]. Therefore, the higher the interparticle distance, the higher the electromechanical sensitivity is. Furthermore, it has been proven that the geometry of the nanofillers also plays a dominant role in the electromechanical response of the nanocomposite. For example, GNPs show a higher Gauge Factor (GF), defined as the change of the normalized resistance divided by the applied strain, than CNTs. The reason lies in the fact that the 2D nature of these particles promotes a higher tunneling area, and thus, the interparticle distance can be increased, leading to an increase of the sensitivity. Many studies have proven this fact, with GF values above 10–50 in the case of GNPs and around 3–5 when using CNTs [
16,
20]. However, in any case, the GF values are above those obtained for conventional metallic strain gauges (typically, around 2), so their use in a wide range of strain sensing applications is gaining a great deal of attention.
To date, most of studies dealing with nanocomposite-based sensors were focused on structural applications. Therefore, the resins involved are quite brittle and stiff, so their range of application is limited to low strains. In this regard, there is also an increasing interest in the development of wearable sensors. To achieve this purpose, it is necessary to study the effect of nanoparticle addition in flexible resins. Some studies have proven the promising properties of these polymer-based wearable sensors for human motion monitoring [
21,
22,
23]. More specifically, the monitoring of fingers, feet and even small facial movements have been successfully achieved [
24,
25]. The effect of temperature via Joule’s heating effect in the sensitive response of flexible nanocomposite has been also studied via a wireless monitoring technique [
26]. Nevertheless, there are some crucial aspects in this kind of sensors that remain to be investigated. For example, the presence of some cracks may alter the electrical response and compromise the adequate use of these sensors. The effect of crack propagation in the electromechanical response has been widely studied in structural resins [
27,
28]. However, its effect in flexible resins, where the crack propagation may occur in a different way, remains as a subject of investigation.
Therefore, this study aimed to explore the effect of crack propagation in the electromechanical response of wearable sensors made of GNP-reinforced PDMS. The main objective was to identify the electrical mechanisms governing this kind of tests as well as investigating the effect of the GNP content. In addition, the robustness of the developed sensors was also analyzed. To achieve this purpose, the manufactured sensors were subjected to cycling load while their electrical response was simultaneously measured. In this way, the effect of the cycling mechanical strain was studied, allowing to characterize the adequate use range in terms of applied strain. Finally, a proof-of-concept of high and small human movements was achieved, to prove the applicability of the developed nanocomposites as wearable skin-mountable sensors.
2. Materials and Methods
2.1. Materials
The matrix used in this study was polydimethylsiloxane (PDMS), a silicone elastomer supplied by Dow Chemical Company® (Midland, MI, USA) with the commercial denomination of SYLGARD 184TM. This colorless silicone elastomer is manufactured from two components: the base monomer, with a viscosity of 5100 mPa·s, and the curing agent, with a viscosity of 3500 mPa·s at room temperature. The base monomer and the curing agent were used in a ratio of 10:1 wt.%.
The nanoreinforcements used in this study were Graphene Nanoplatelets (GNPs), purchased from XG-Sciences® (Lansing, MI, USA) with the commercial name M25. They have an average lateral size of 25 μm and a thickness ranging from 6 to 10 nm. Their intrinsic electrical conductivity is ∼102 S/m in the transversal direction and ∼107 S/m parallel to the in-plane surface.
2.2. Manufacturing of GNP-PDMS Sensors
GNP-PDMS nanocomposites were manufactured with 5, 7, 9 and 11 wt.% GNP. The GNP contents were selected in order to guarantee that the nanocomposites are electrically conductive, based on the percolation threshold values obtained in previous studies (5 wt.%), whereas higher GNP contents provide higher values of electrical conductivity that are adequate for strain monitoring purposes (9 and 11 wt.%).
GNPs were dispersed in the silicone elastomer matrix by a three-roll milling process using an EXAKT 80E three-roll milling machine (EXAKT Technologies, Oklahoma City, OK, USA). This technique causes the disaggregation of GNP agglomerates due to the high shear forces induced on the mixture because of progressive reduction of the gaps between rolls rotating at different speeds. The parameters of the three-roll milling process were based on a previous study [
29] and are shown in
Table 1. It consisted of a unique cycle because it was proven that increasing the number of cycles promoted a possible damage to the GNPs.
Following the three-roll milling dispersion procedure, the mixtures were degasified with the aim of removing some possible entrapped air. In this regard, the degassing step was carried out under vacuum conditions at 80 °C for 20 min, inducing a decrease of the mixture viscosity and promoting the air outlet. After that, the curing agent was added in a 10:1 mass ratio and mixed at room temperature. Finally, the mixture was placed in a corresponding steel mold previously smeared with two layers of a release agent based on polyvinyl alcohol (Castro Composites®, Pontevedra, Spain) and cured in an oven at 125 °C for 20 min, one of the curing cycles shown on the commercial silicone elastomer data sheet.
2.3. Sensor Characterization
2.3.1. Electrical Conductivity
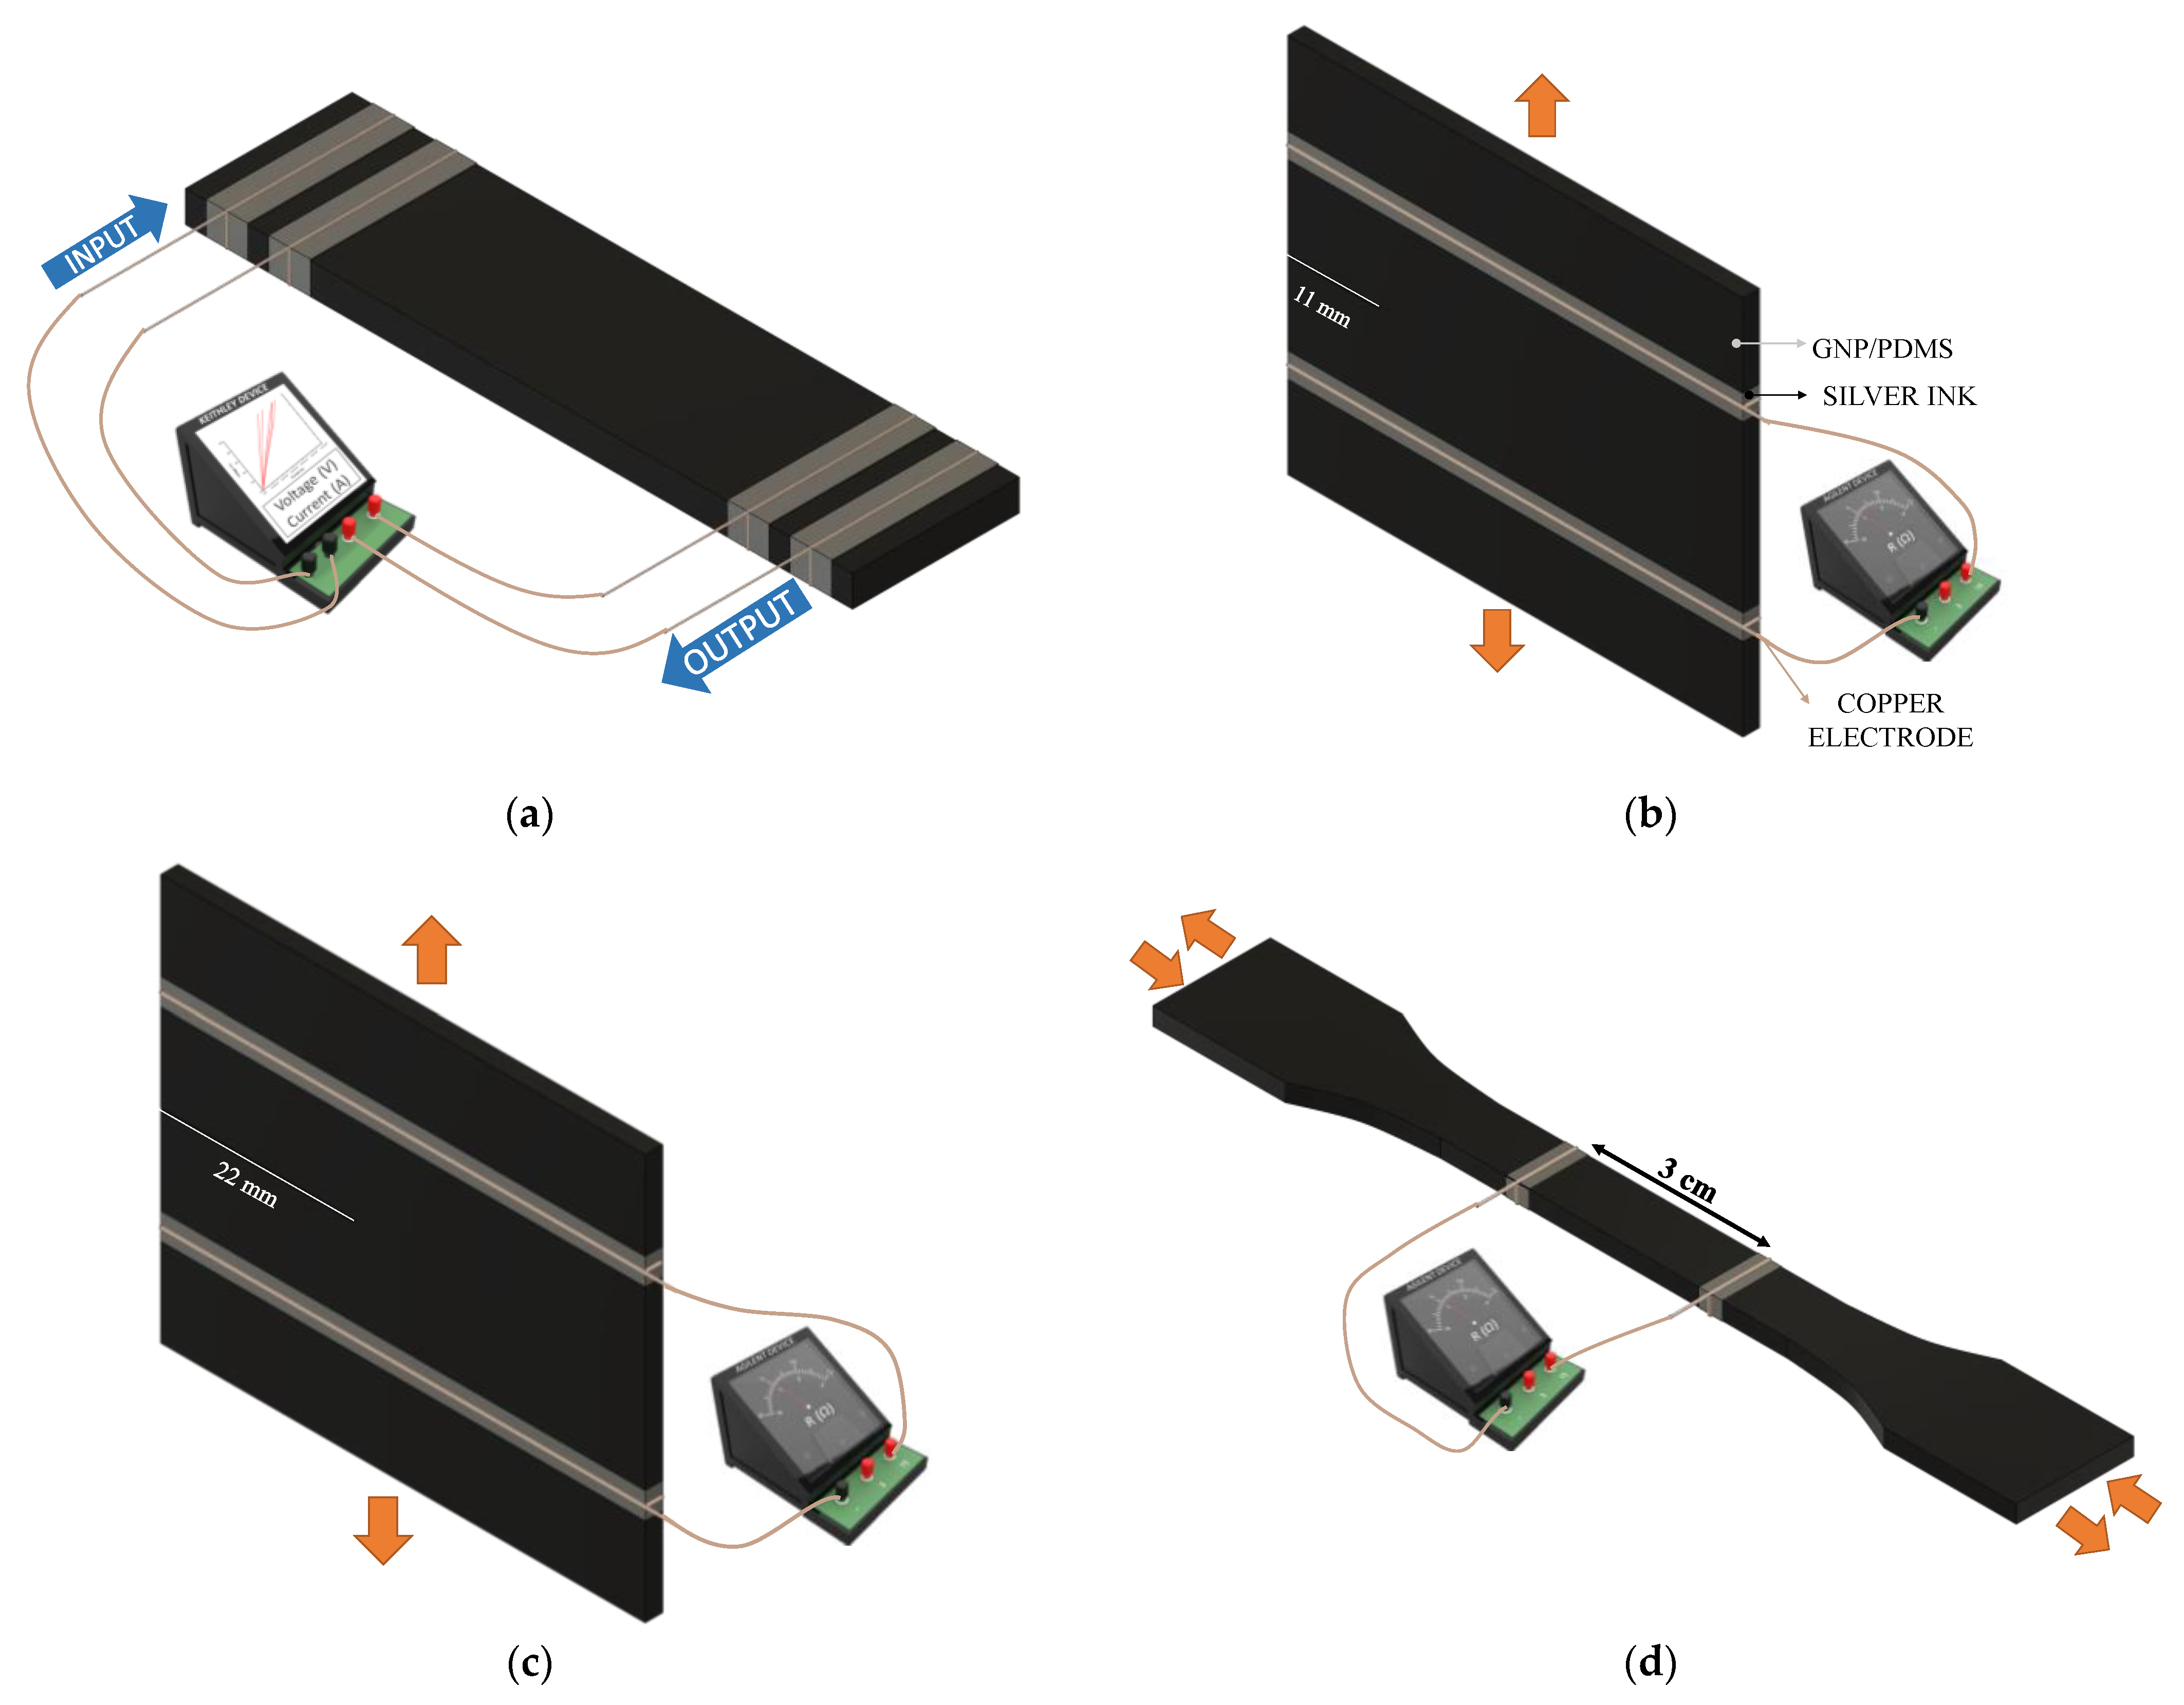
The electrical volume conductivity was measured using the source meter unit instrument KEITHLEY 2410 (Cleveland, OH, USA). Three samples with 75 × 17.5 × 6 mm
3 dimensions were tested per each nanocomposite. For these tests, four copper electrodes were attached to the sample surface using conductive silver ink to minimize the contact resistance, as shown
Figure 1a. The electrical resistance was determined in four-probe measurement mode by calculating the slope of the current–voltage characteristic curve at 0–100 V for 5 wt.% GNPs and at 0–10 V for 7, 9, 11 wt.% GNPs, due to the higher electrical conductivity achieved in the last ones.
2.3.2. Crack Growth Test Monitoring
Crack growth tests were carried out in a Zwick (Ulm, Germany) universal tensile machine equipped with a load cell of 500 N at a test rate of 10 mm/min. Samples with 60 × 60 × 1.5 mm
3 with a lateral pre-crack with lengths of 11 and 22 mm were manufactured for each condition, based on another study focused on the measurement of fracture energy for flexible resins [
30]. The samples were placed in the tensile machine with an initial grip-to-grip separation of 20 mm, the crack being equidistant to both grips. Moreover, beveled tabs made of fiberglass were bonded to the ends of the specimens to prevent gripping damage and sliding.
Crack growth monitoring was carried out during tensile tests by means of simultaneous electrical resistance measurements between two copper wire electrodes attached with silver ink to the substrate near the grips. The electrical response was measured using an Agilent 34410A (Santa Clara, CA, USA) module at an acquisition frequency of 10 Hz. The isolation of the specimens from the metallic grips was achieved with the mentioned beveled tabs that are made of fiberglass.
This test allows to characterize the sensitivity under crack propagation, which is an important element to check the applicability of the sensors. The schemes of specimens used in these tests are shown in
Figure 1b,c. Additionally, a
Supplementary Video (Video S1) shows the experimental setup and an example of the electromechanical response of a crack growth monitoring test.
2.3.3. Cycling Test Monitoring
Cycling tests were conducted in the same universal tensile machine as described in the previous section. At least two tensile specimens of each GNP content were tested according to ISO 527-1:2019 for 30 cycles up to 1, 3 and 5% strain levels, at a fixed rate of 40 mm/min and a preload of 2 N. Simultaneously to this mechanical test, the strain monitoring was carried out by means of electrical resistance measurements between two electrodes attached to the substrate. Electrical response was recorded by the same module as the previous experiment.
For the monitoring tests, two electrodes made of copper wire were attached to the nanocomposite using conductive silver ink to minimize the contact resistance, with a distance between electrodes of 30 mm, as shown in
Figure 1d. Furthermore, specimens were isolated from the grips by applying an adhesive layer at the ends of the sample.
The Gauge Factor (
GF), which is a critical parameter to determine the sensitivity of the sensor, was calculated following Equation (1):
where Δ
R/R0 is the change of the normalized electrical resistance, and
ε is the mechanical strain applied to the strain sensor. Here, the
GF was calculated at 1, 3 and 5% strain levels for each sensor in the second cycle of the electromechanical cycling test.
2.3.4. Proof-of-Concept
Finally, a proof-of-concept of large and small human movements was carried out, to prove the applicability of the developed sensors for this kind of application. In this regard, the sensor with 7 wt.% GNP was used for wrist, neck and small facial movements, as it is the optimum condition for maximizing the electrical sensitivity under mechanical deformation. This sensor was cut with 50 × 10 × 1 mm3 dimensions and fixed to the areas of the human body of interest with an adhesive layer. Here, the placement of the electrodes followed the same logic as that mentioned in previous experimental procedures.
3. Results and Discussion
This section provides an analysis of electrical conductivity measurements for the different GNP contents as well as the electromechanical properties under crack propagation. The robustness of the manufactured sensors was studied under cycling loading, exploring the sensitivity achieved for each condition. Finally, a proof of concept of wrist, neck and small facial movements was carried out to prove the applicability of the proposed materials.
3.1. Electrical Conductivity Measurements
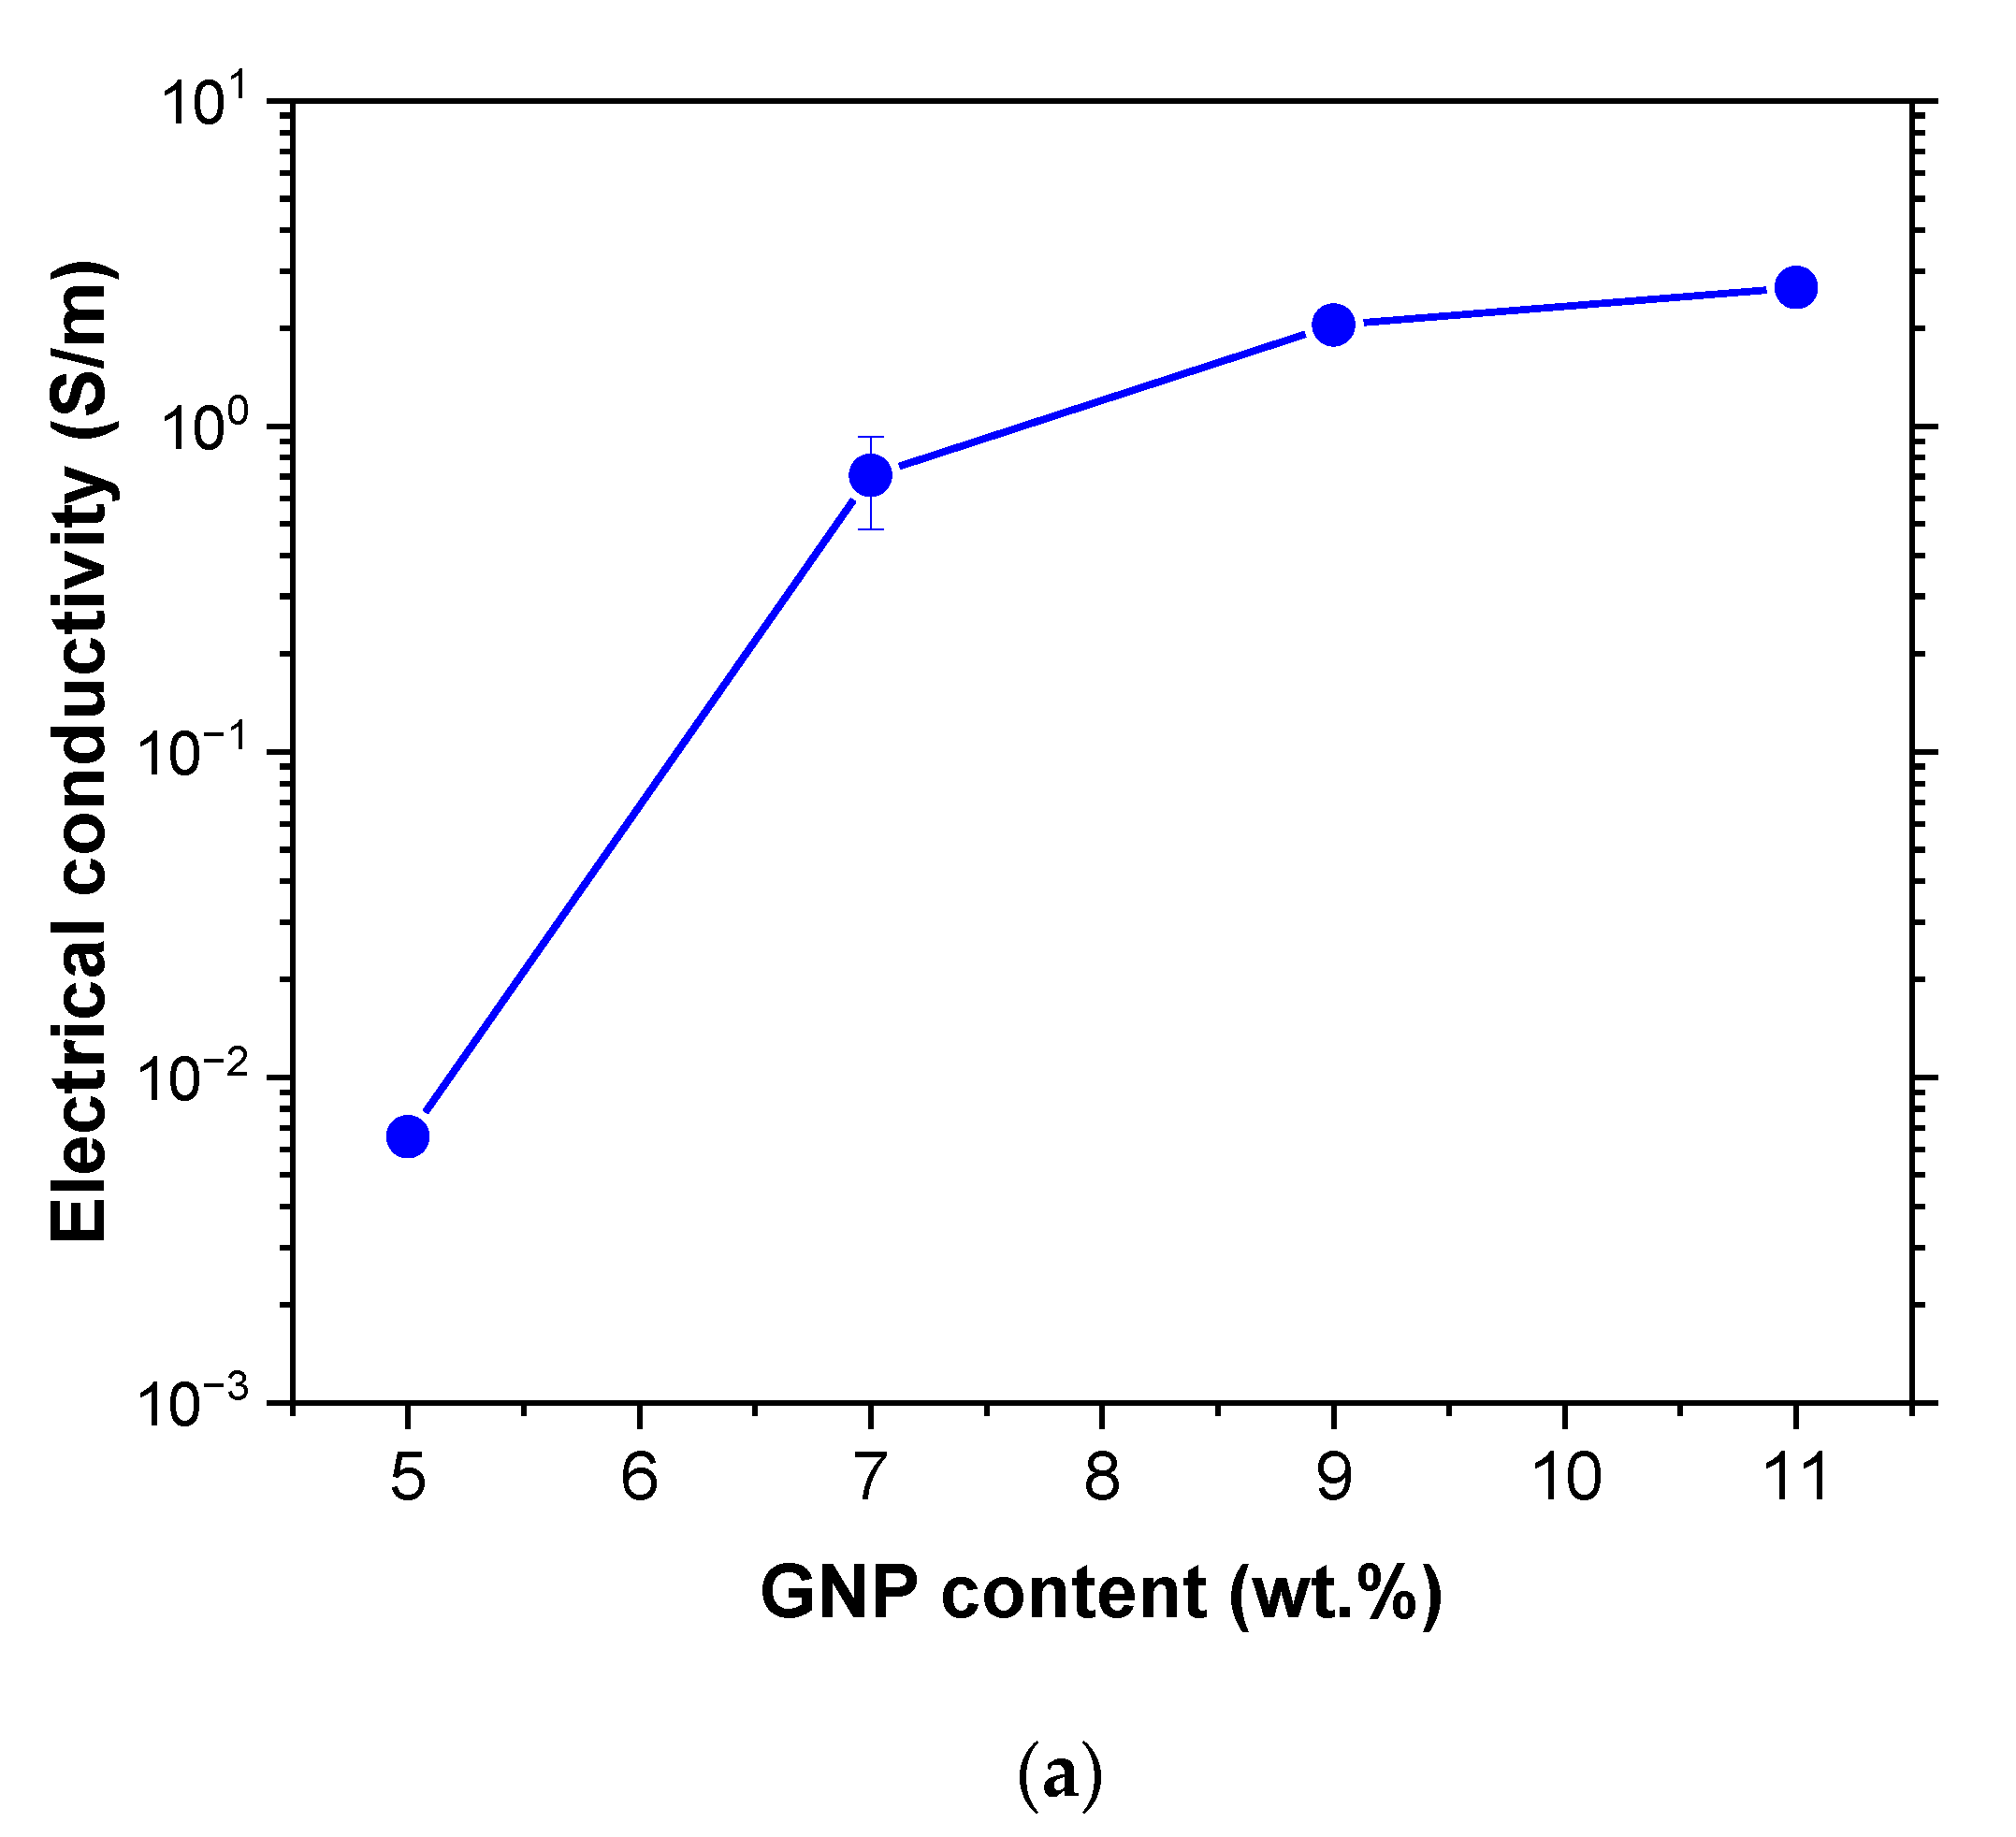
The electrical conductivity measurements are shown in the graph of
Figure 2a. It can be observed that the electrical conductivity increased with GNP content, as expected, due to the creation of more prevalent electrical pathways due to the higher number of nanoparticles. More specifically, the conductivity values at higher contents (9 and 11 wt.% GNP) were well above 1 S/m, indicating appropriate electrical properties for strain sensing applications. In addition, it was also observed that at these higher GNP contents, the increase of the electrical conductivity was less prevalent. This is an expected behavior and is explained by the effectiveness of the dispersion procedure. Although the three-roll milling process is more effective when increasing the viscosity of the mixture, due to the higher prevalence of the shear forces involved during the dispersion procedure, a very high GNP concentration could lead to a very aggressive disaggregation of these nanoparticles, inducing a partial breakage of themselves and affecting the effectiveness of the dispersion procedure. This effect has been widely explored in other studies using the sample dispersion procedure and nanofillers, showing a reduction on the lateral size of the GNPs of around 30% from 8 to 12 wt.% samples. For this reason, no further GNP contents were manufactured. In any case, it is worth to highlight that the electrical conductivity values obtained are in the range of those obtained in other studies dealing with GNPs and structural resins [
20], indicating the good effectiveness of the dispersion procedure followed to manufacture these sensors.
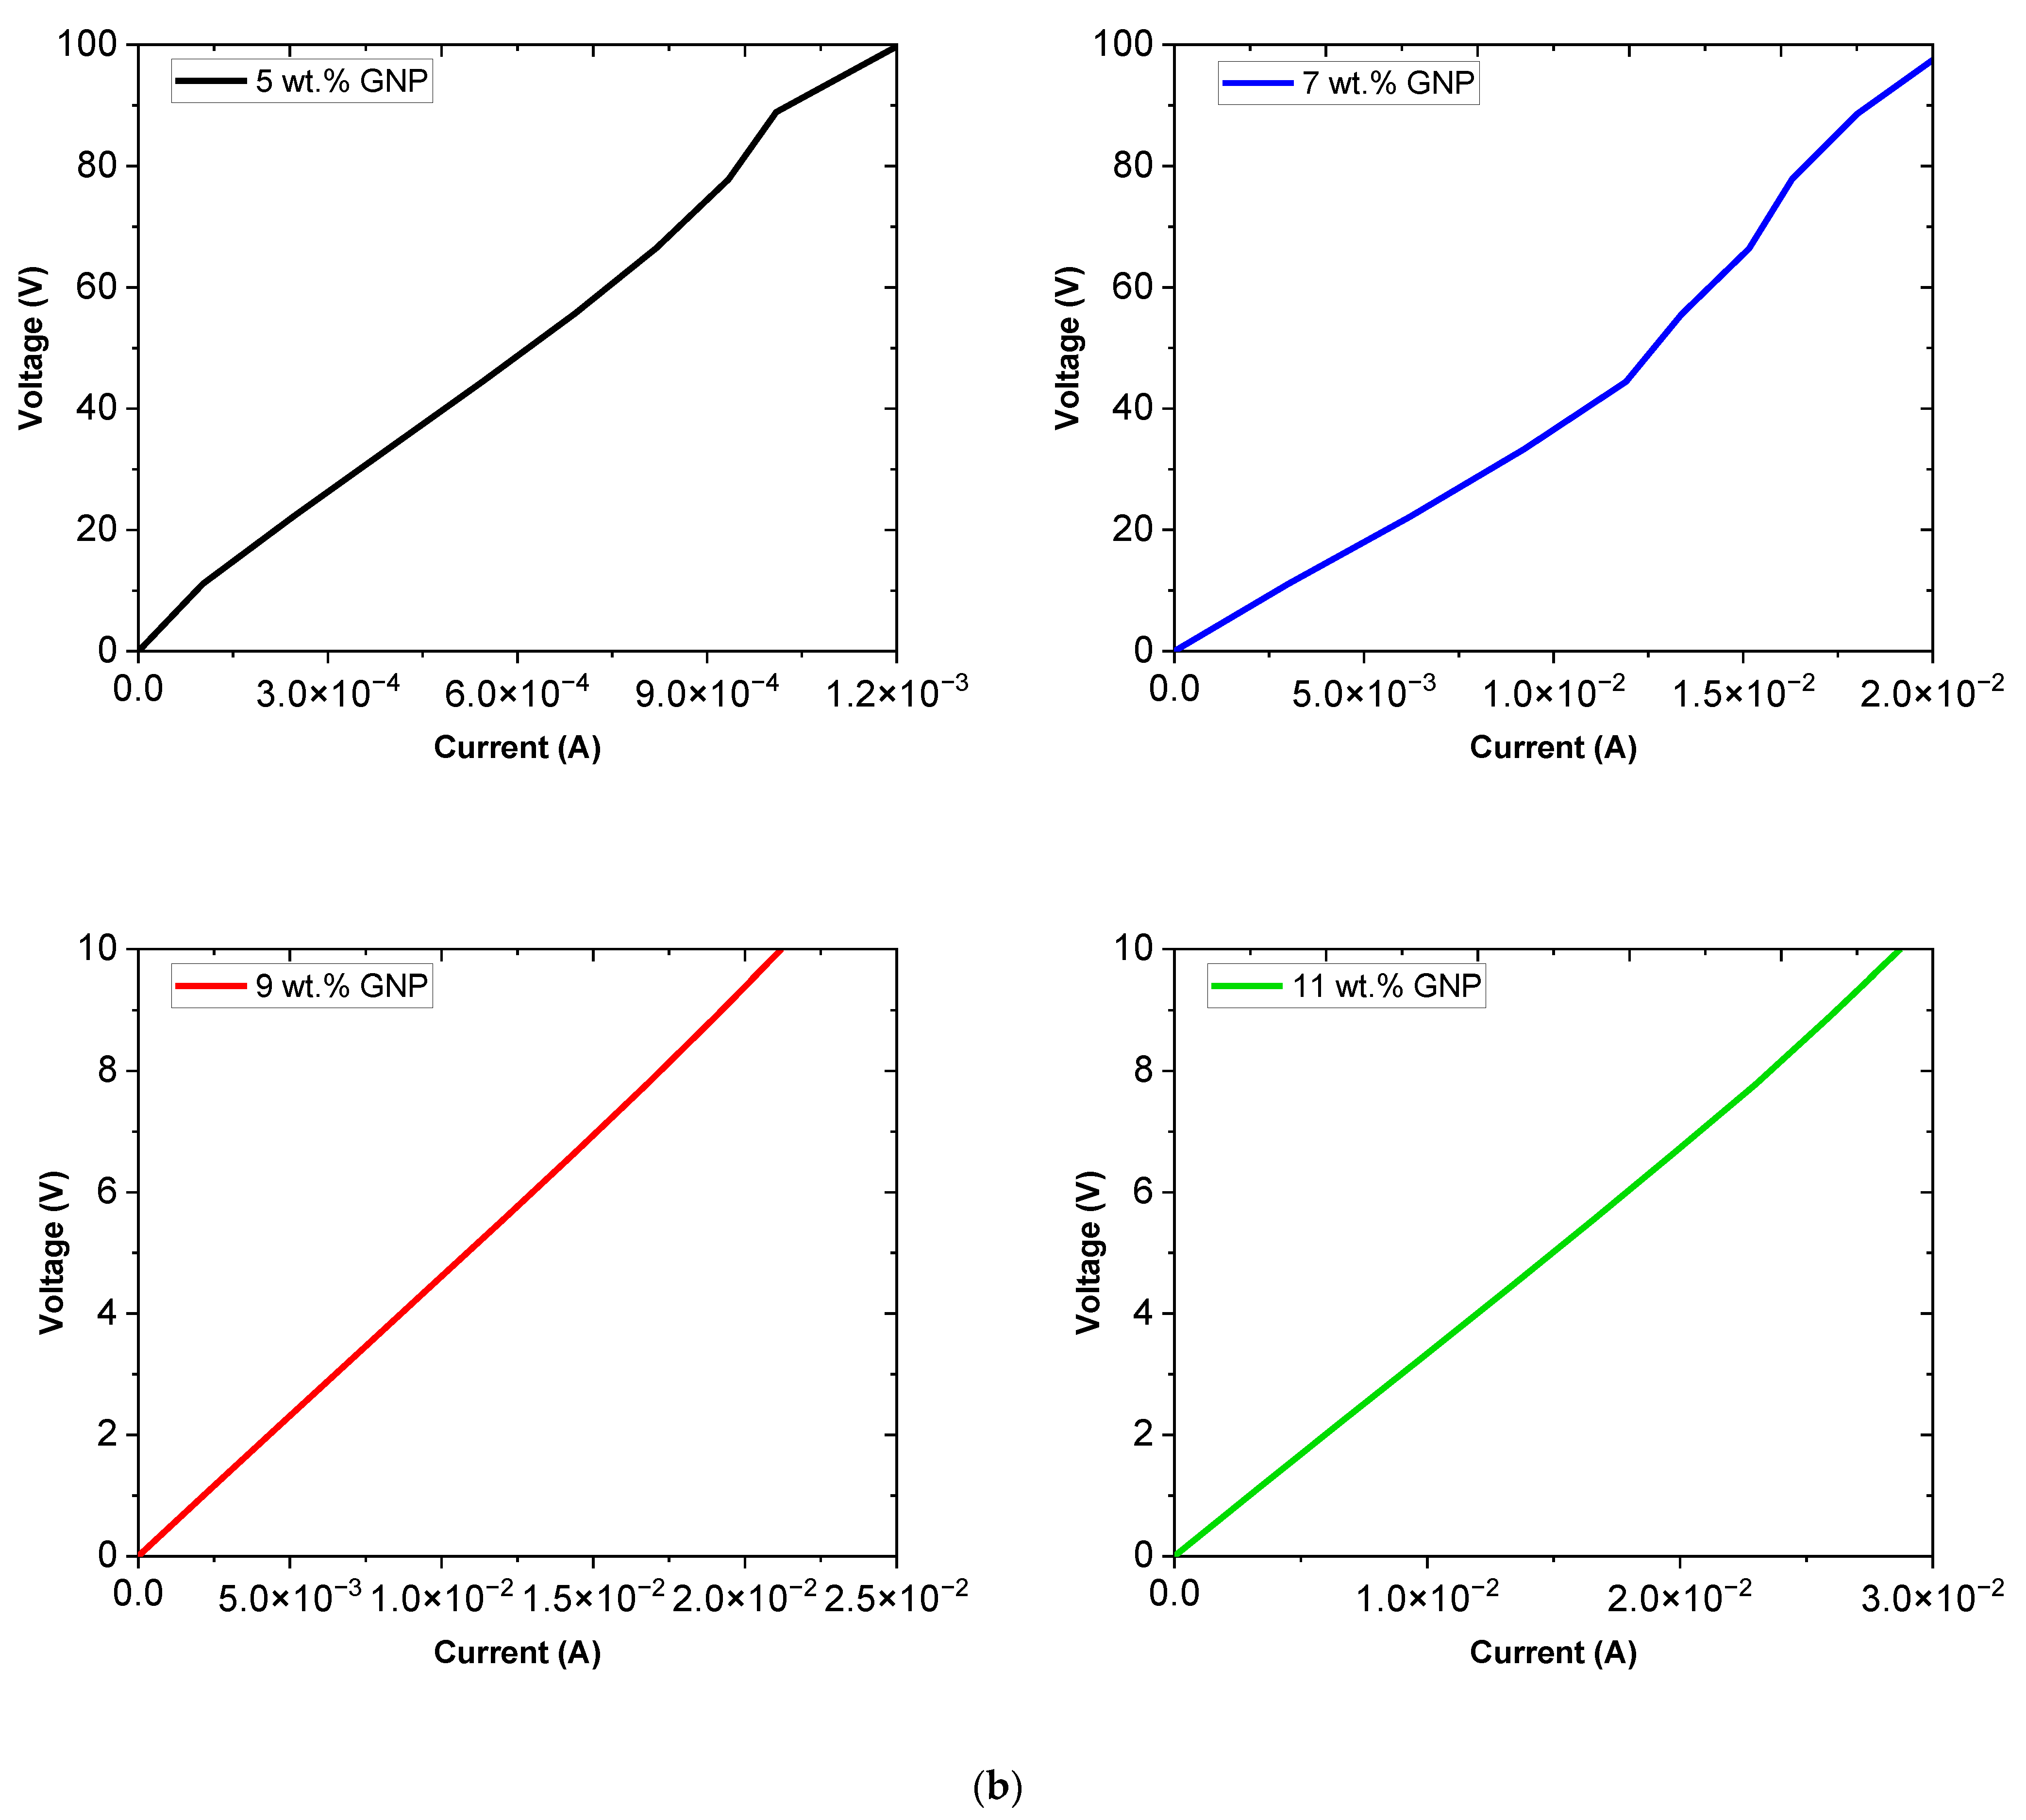
It can be also observed that there is a total linear correlation between the voltage and the current at higher contents (9 and 11 wt.%), as shown in the C-V curves of
Figure 2b. Therefore, the electrical conductivity would remain almost constant regardless of the voltage applied, so no hooping conduction mechanisms are taking place and the manufactured nanocomposites follow an ohmic behavior. However, in case of low content samples, some exponential effects can be observed. This might be explained by the lower conductivity values reached in the samples, which may cause a prevalence of hopping conduction mechanisms, due to a more semi-conductive behavior. However, in any case, the electrical response remains almost linear in the range of voltage that would be applied for monitoring tests.
Finally, it is important to point out that, although all of the nanocomposites were electrically conductive, the sample with 5 wt.% GNP showed very low values of the electrical conductivity, not enough for a proper strain monitoring, as the electrical resistance values were above the limits of the measurement device. For this reason, only 7, 9 and 11 wt.% samples were tested for SHM applications.
3.2. Crack Growth Monitoring
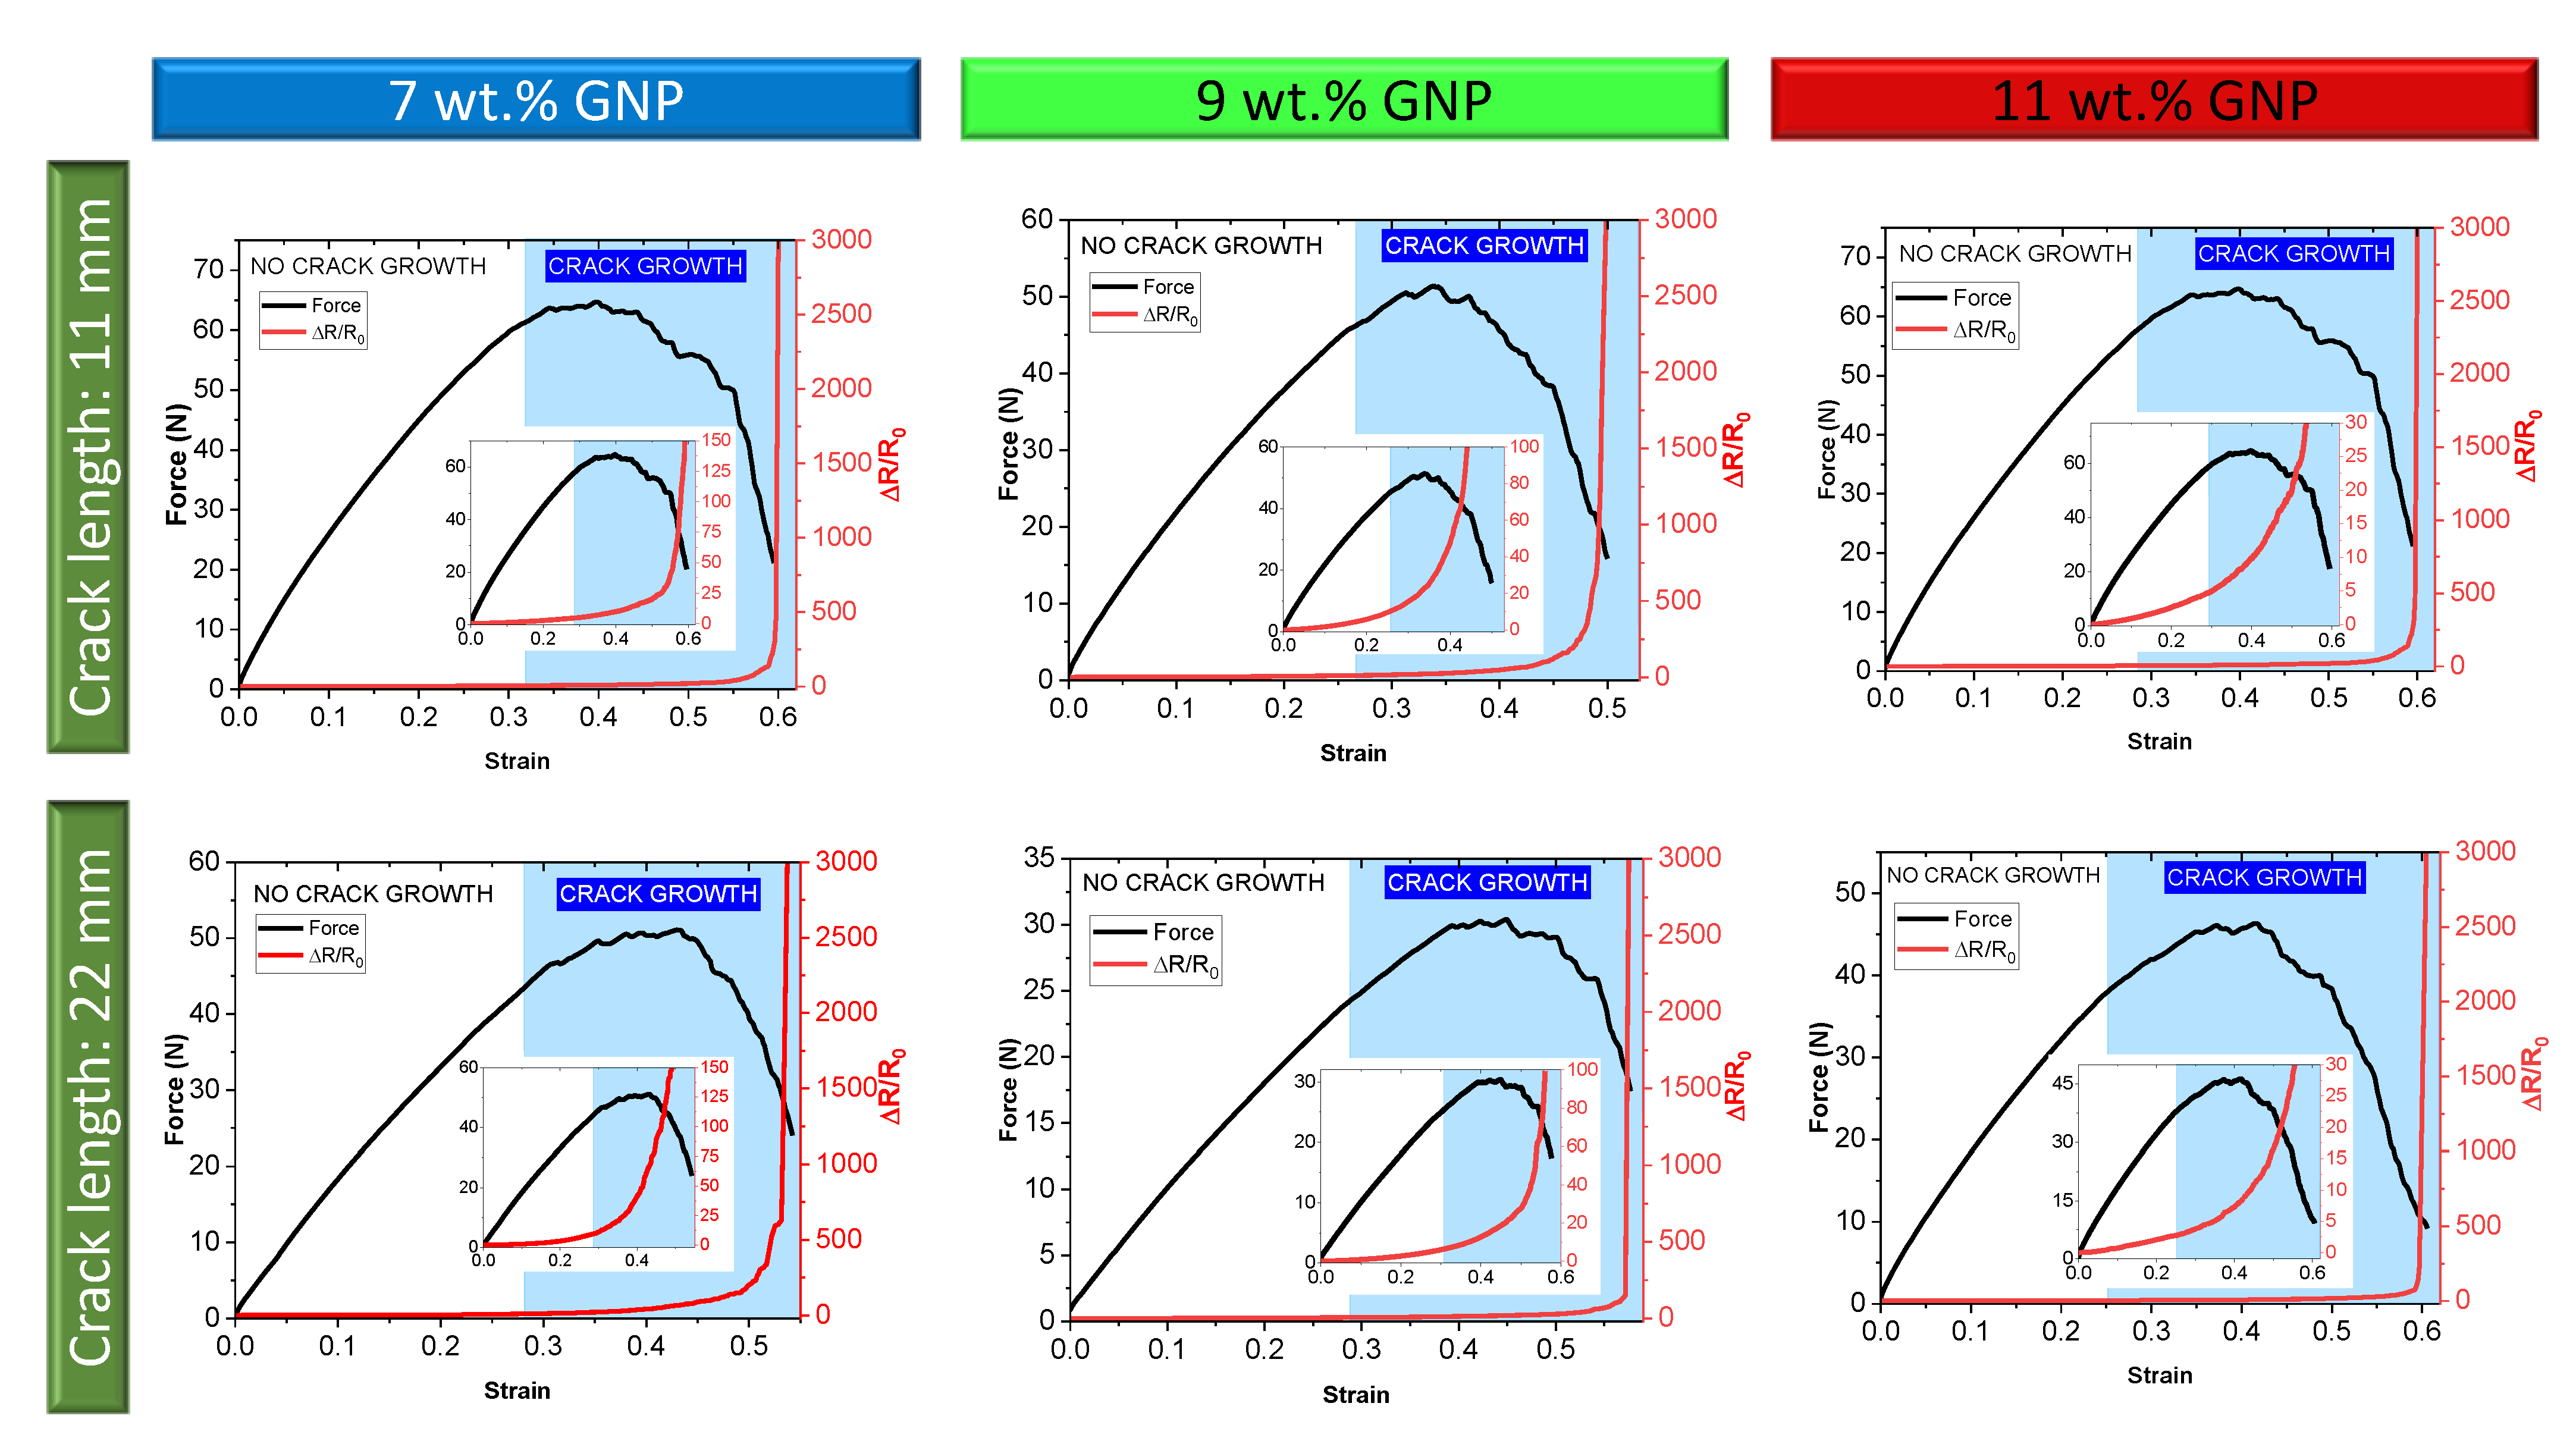
Figure 3 shows the electromechanical curves of the GNP-PDMS sensors under the presence of an initial pre-crack with two different lengths, 11 and 22 mm. As commented before, the aim was to characterize the sensitivity under crack propagation, which is a very important fact to ensure the applicability of the developed sensors for human motion monitoring.
In this regard, the graphs shown in
Figure 3 describe the overall electromechanical behavior during the whole test and the detailed electromechanical response during the first stages of crack propagation. It can be observed that the electrical response follows a very exponential behavior with the applied strain, calculated as the vertical displacement divided by the initial separation between the grips. This exponential variation can be explained by the combined effect of the tunneling resistance and the crack propagation.
On the one hand, the tunneling resistance, accordingly to Simmons’s formula [
18], varies in a linear-exponential way with the tunneling distance between neighboring nanoparticles and thus with the applied strain, as commented before. This is the main electromechanical mechanism in the first stages of the test, where crack propagation is not taking place, whose detailed response can be observed in the zoomed images of
Figure 3. Here, it can be observed that the sensitivity, defined as the change of the normalized resistance divided by the applied strain, increases with decreasing of the GNP content. More specifically, the samples with 7 wt.% GNP showed a resistance variation of 1000% at a strain of 0.25, where this resistance change decreased to 500% and 300% at the same strain level for the 9 and 11 wt.% GNP samples, respectively. This behavior is in total agreement with most of studies, where an increase of the nanoparticle content induced a decrease in the sensitivity, as the distance between neighboring nanoparticles is reduced and, thus, the tunneling resistance prevalence is lower [
31].
On the other hand, the last stages of the test were dominated by the effect of crack propagation, marked by a blue region in the electromechanical curves of
Figure 3. More specifically, this crack propagation starts when a drop of the slope of the mechanical curve is observed. Here, a sudden breakage of the electrical pathways takes place as the crack propagates. This effect was observed in the electromechanical curves, where there was a sudden increase of the electrical resistance, with a much higher exponential effect, as indicated in a more detailed way in the
Supplementary Video (Video S1) in the specimen of the 11 wt.% GNP sample with an 11 mm pre-crack. In this case, as the breakage effect is the most dominant mechanism governing the electromechanical response of the nanocomposites, no significant differences in terms of sensitivity were observed among the different GNP contents. Here, it is important to point out that the crack propagation took places in a uniform and stable way, as observed in
Video S1, with no stick–slip artifacts. For this reason, there are no sudden increases but rather a stable exponential increase of the electrical response. This can be explained by the flexible nature of the PDMS, which allows this more stable crack propagation. Furthermore, when comparing the samples with an initial pre-crack of 11 mm and those with a pre-crack of 22 mm, no significant variability was observed, except for the maximum mechanical load before the crack started to propagate, which was generally reduced when increasing the pre-crack length, as expected.
3.3. Cycling Test Monitoring
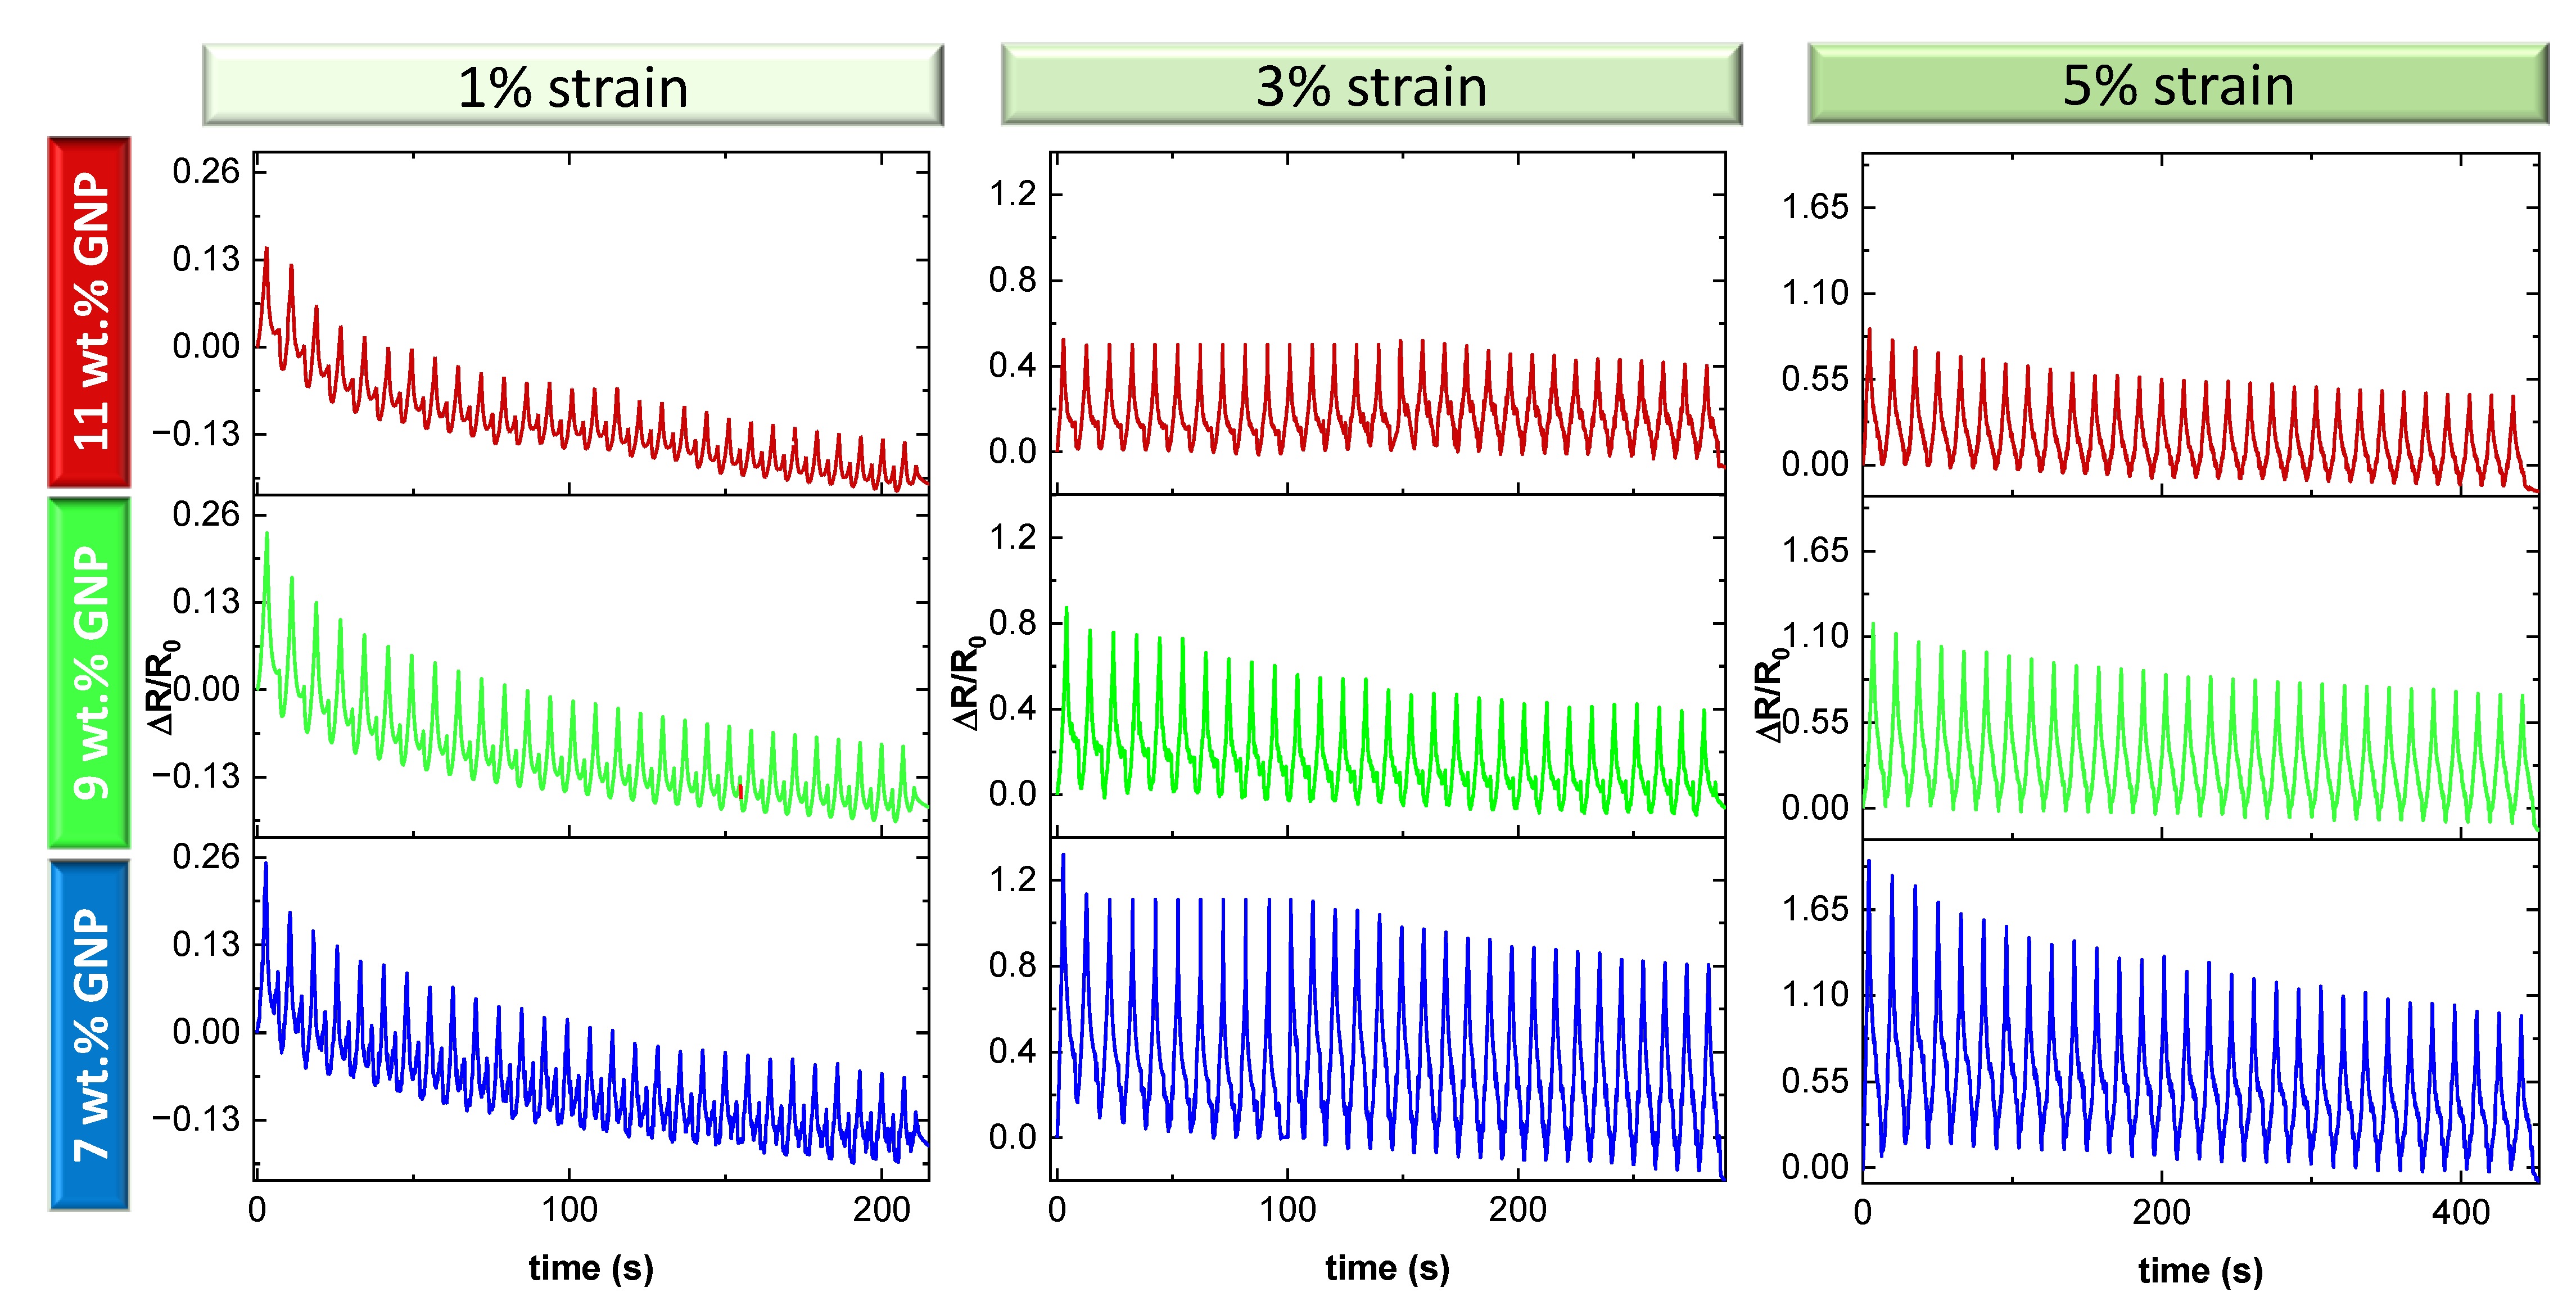
Figure 4 shows the electromechanical response of the GNP-PDMS sensors under cycling loading. Here, several facts can be stated accordingly to the results obtained.
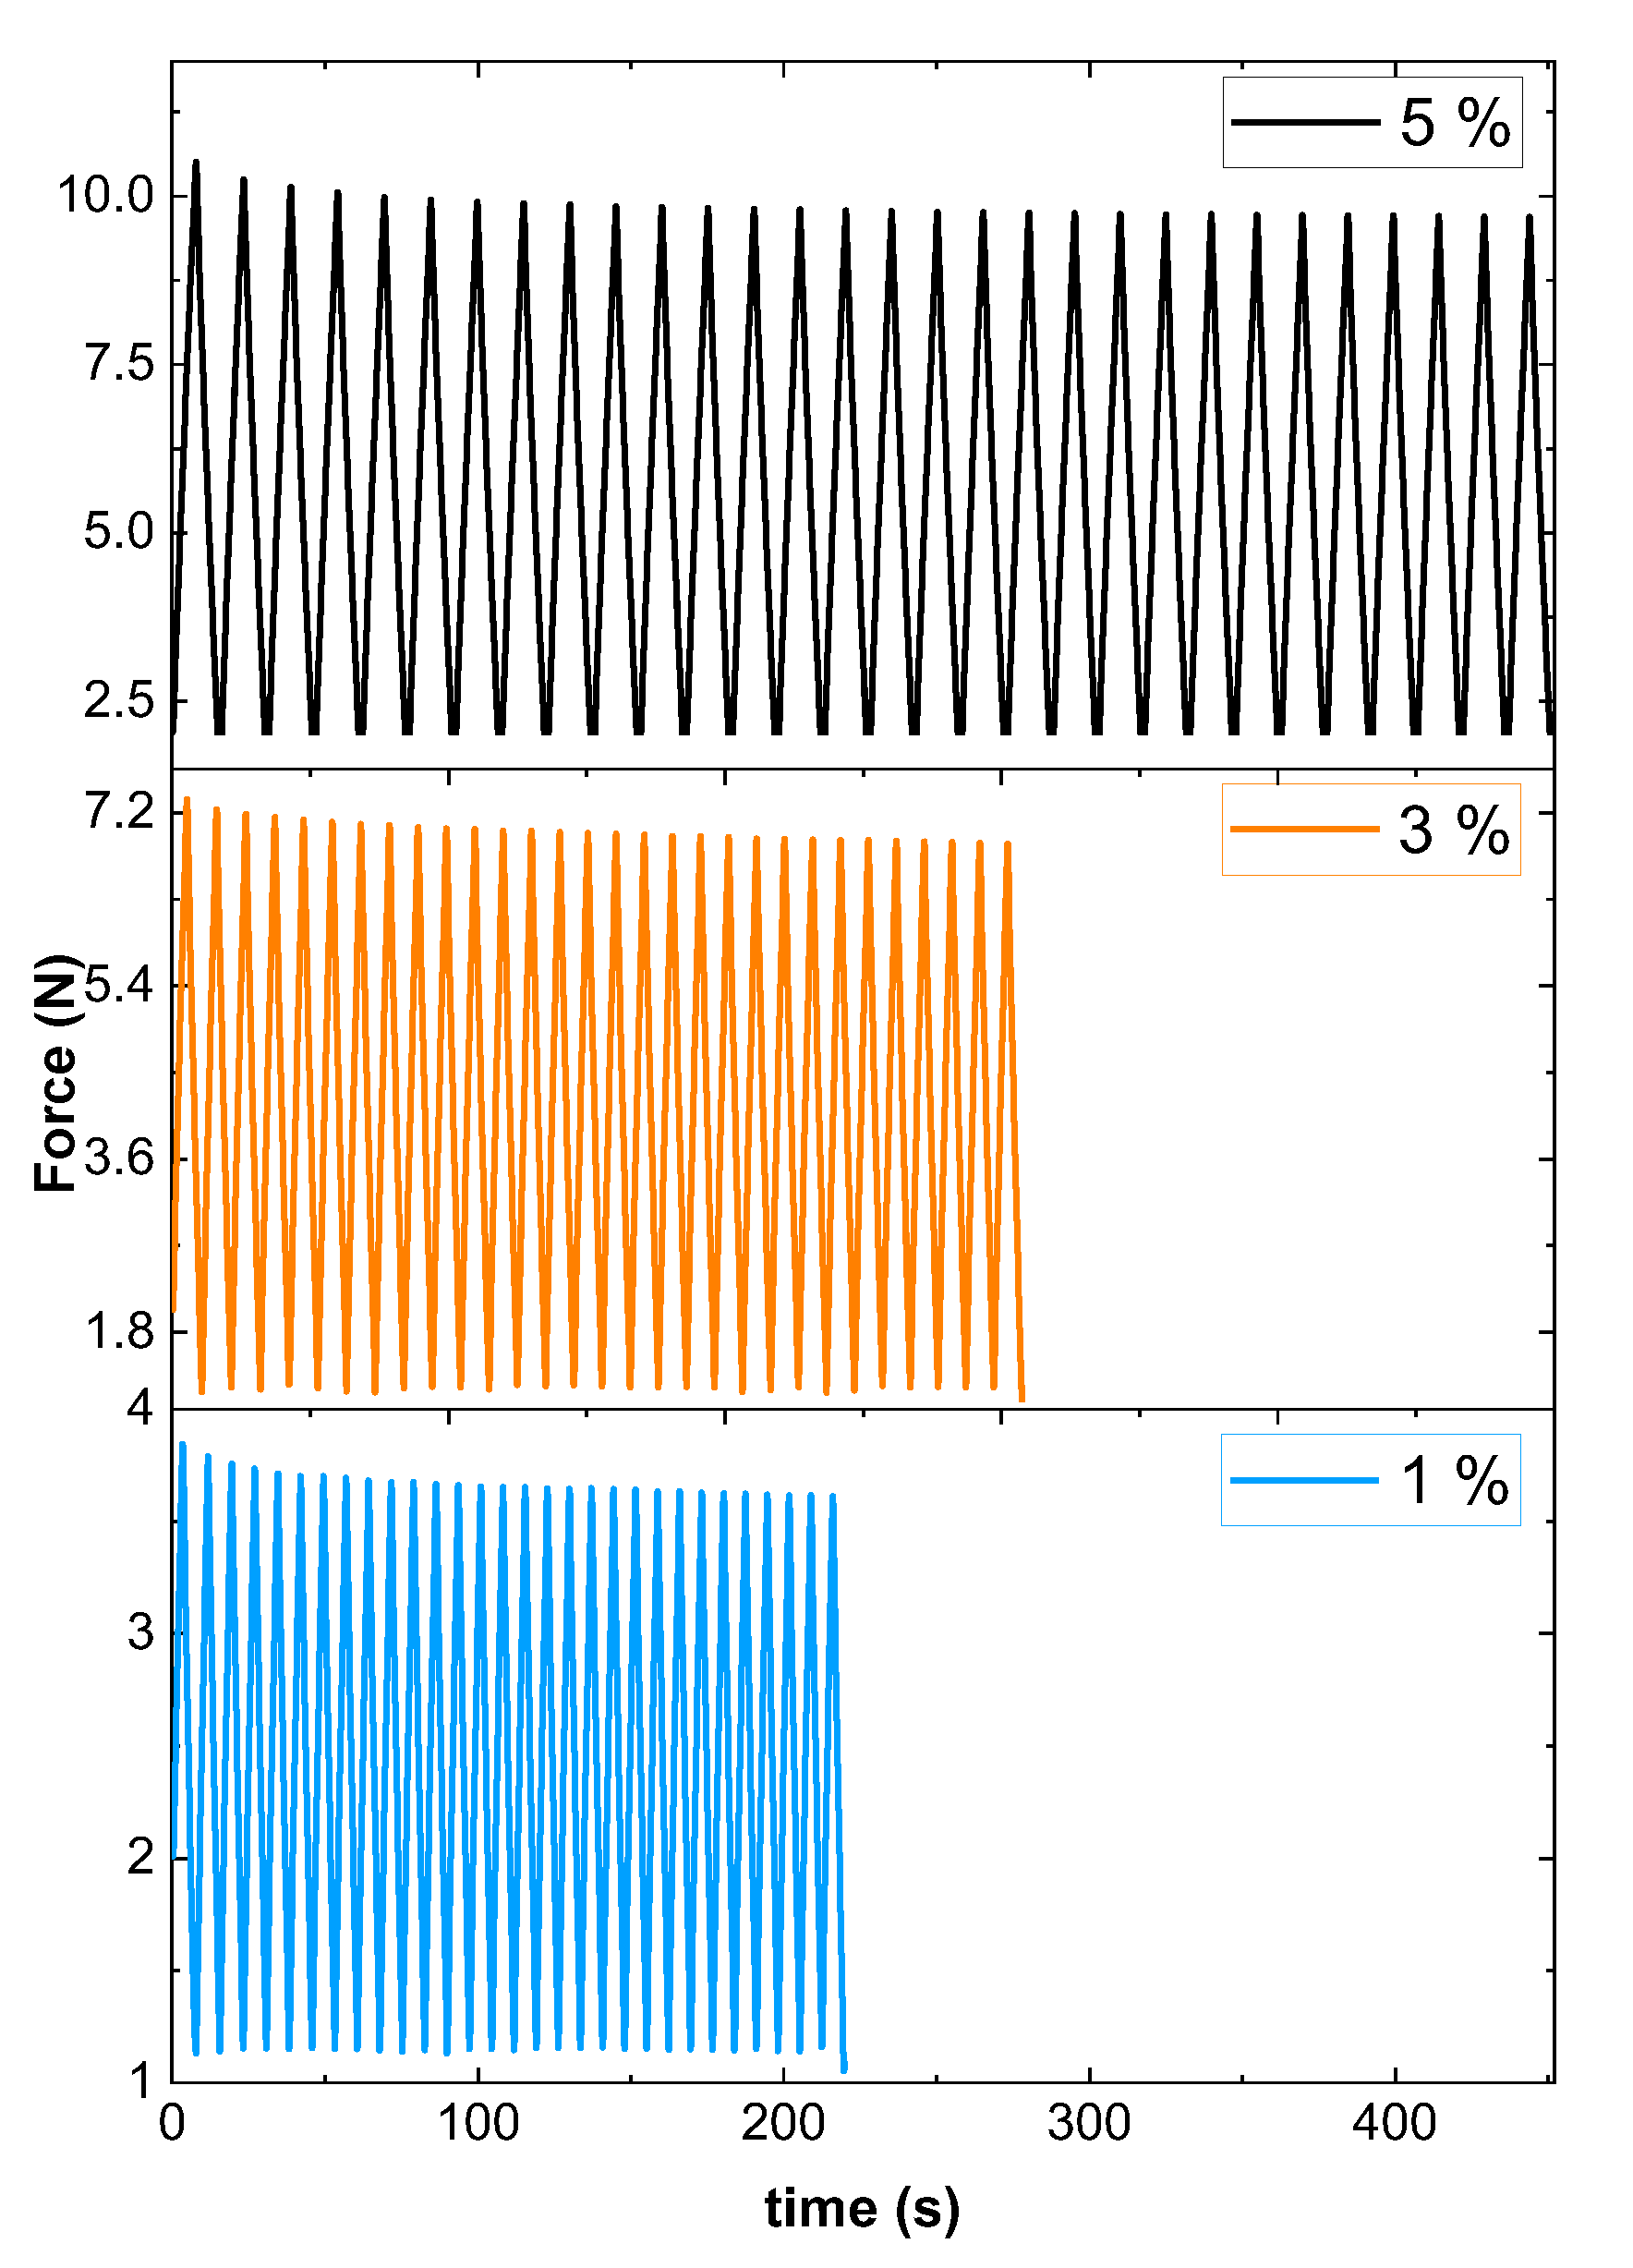
On the one hand, it can be observed that there is a slight irreversibility in the peak and baseline values of the electrical resistance under consecutive cycles, especially at low strain levels. This irreversibility is stated in a reduction of the peak and baseline values when increasing the number of load cycles. This decrease was explained accordingly to the viscoelastic behavior of the PDMS that induces a delayed mechanical response and, thus, the reported electrical response. In this regard,
Figure 5 shows the mechanical load response under cycling testing in 7 wt.% GNP nanocomposites. It can be observed that the maximum load was reduced when increasing the number of cycles due to the delayed viscoelastic response, which affects the electrical resistance measurements. In addition, it is important to point out that this peak and baseline variation of the electrical resistance is reduced when increasing the strain level.
On the other hand, it can be noticed that the sensitivity of each cycle, given by the change of the normalized resistance, increased when decreasing the GNP content, as previously observed. More specifically, the GF values were around 15 and 25 at the 1% strain level for the 11 and 7 wt.% samples, respectively. These GF values are quite above those found for conventional metallic strain gauges (which are in the range of 2) and significantly above other nanoparticle-based strain sensors based on graphene nanoparticles, where GF values of 2 to 6 for small to high strains have been achieved [
32]. Therefore, the proposed GNP-PDMS sensors show a very high sensitivity for strain monitoring applications.
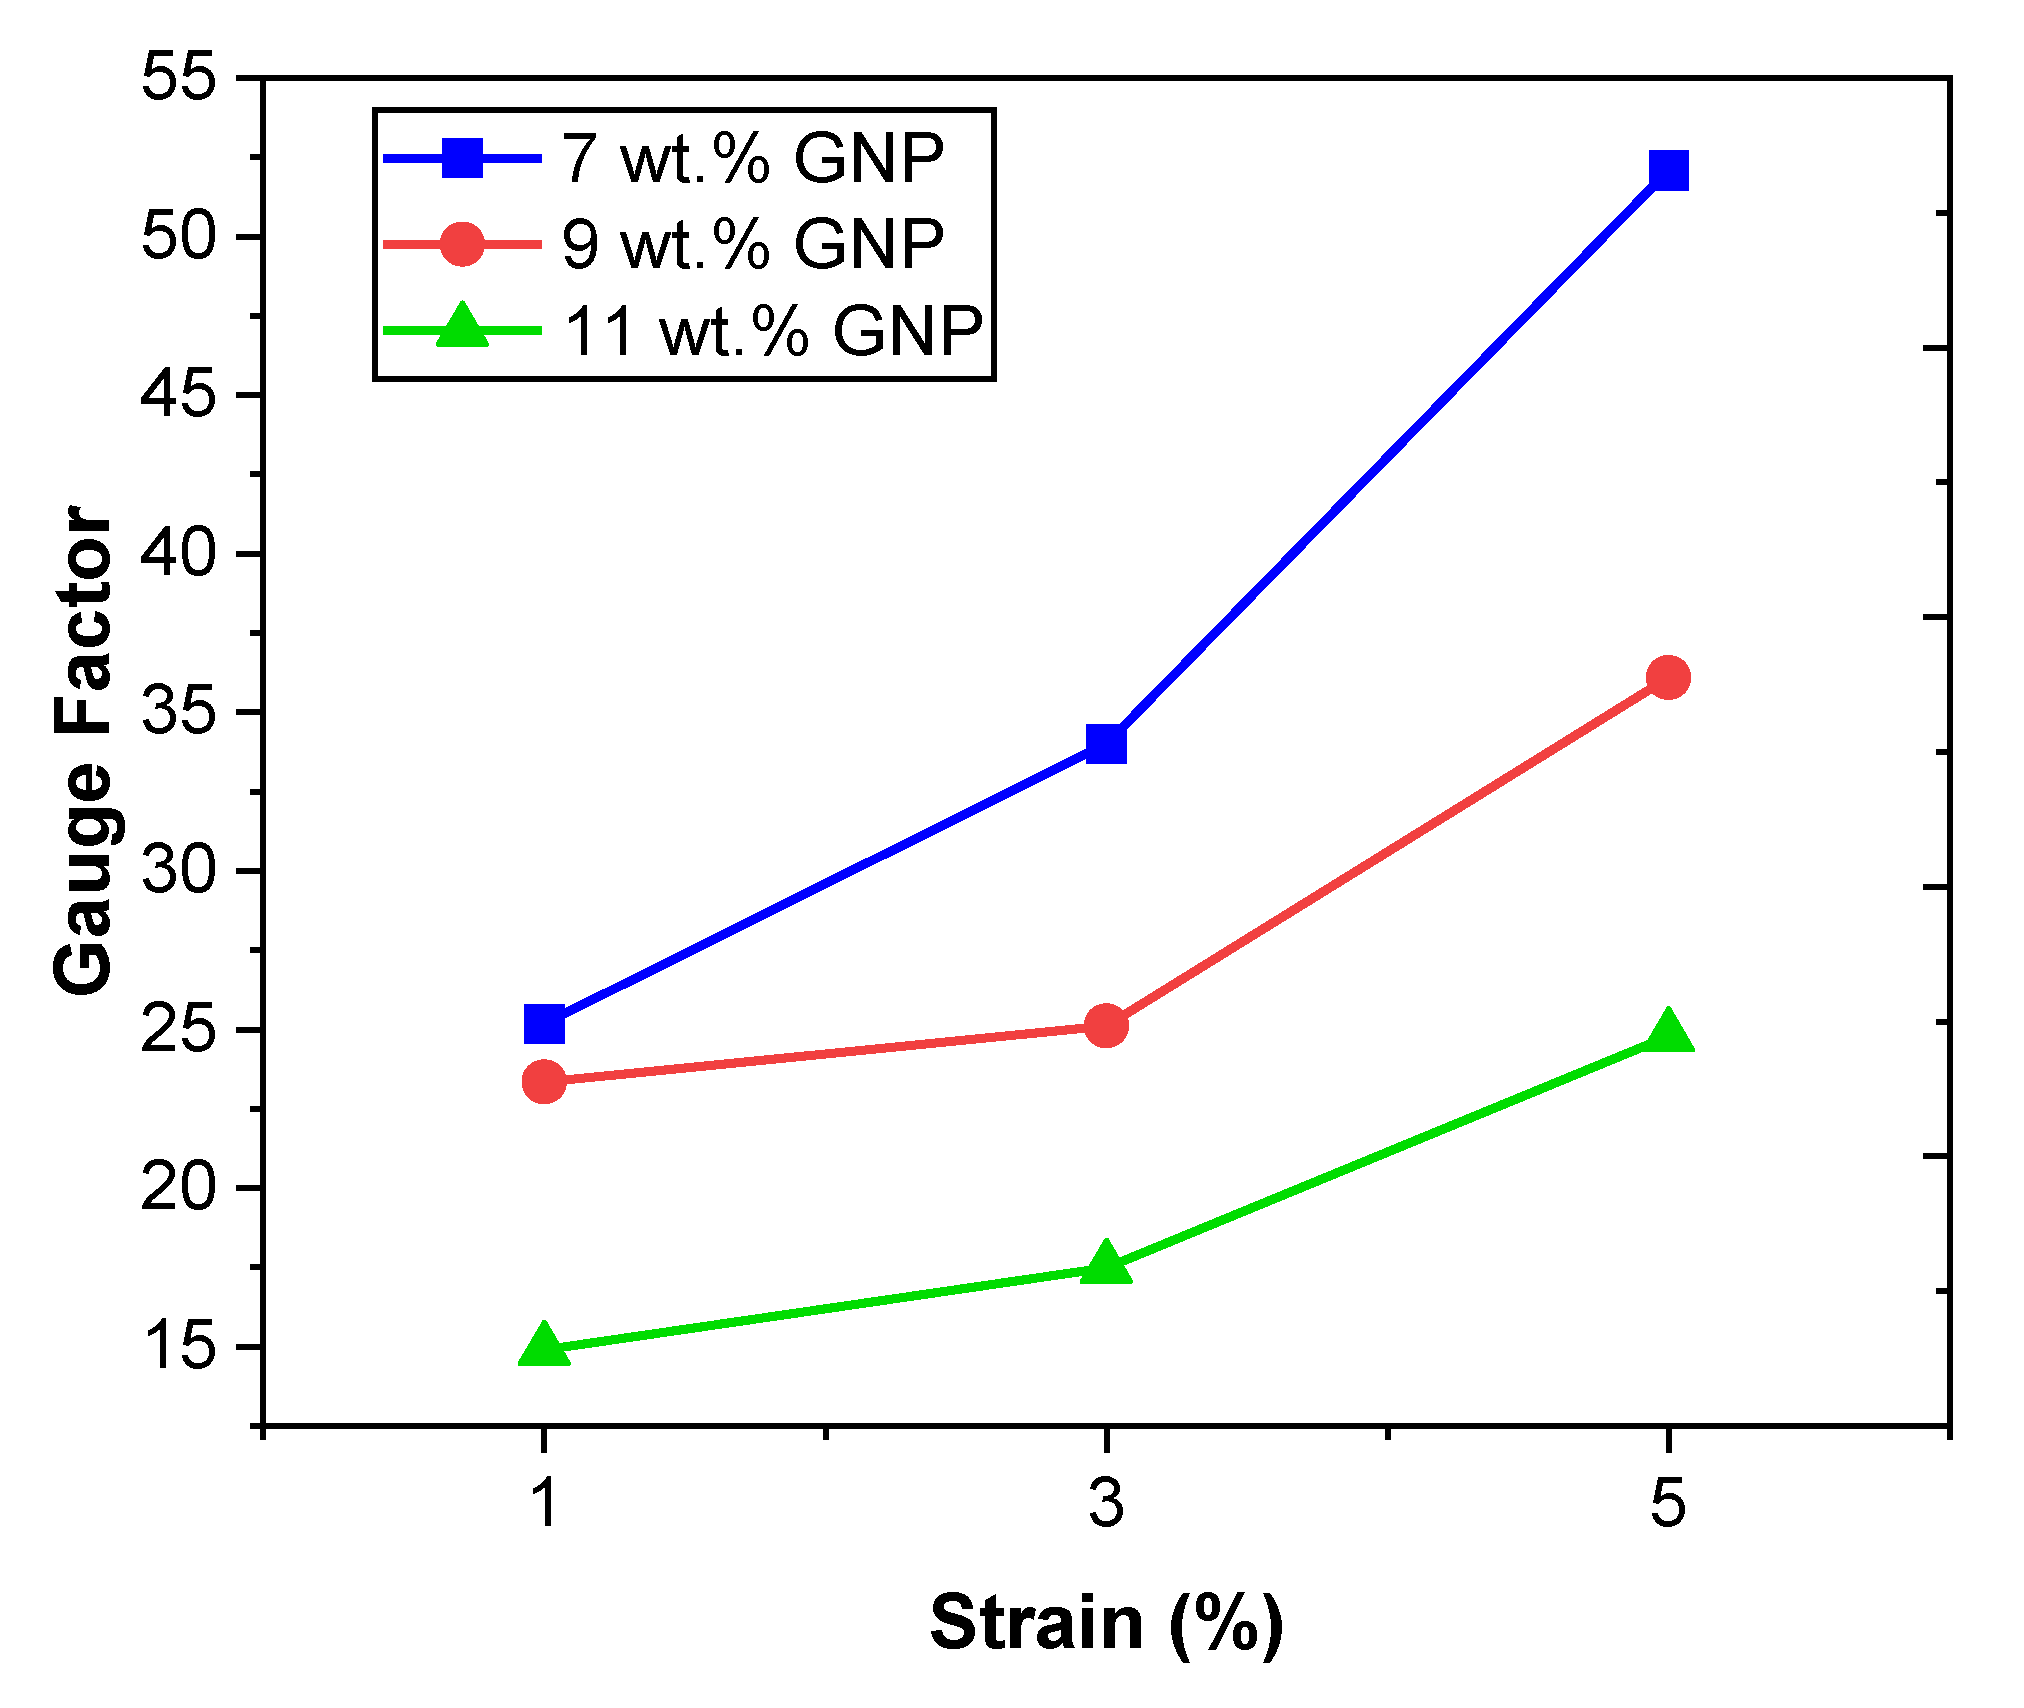
Furthermore, the sensitivity also increases with the strain level, as observed in the graph of
Figure 6. This is in good agreement with the previously mentioned linear-exponential behavior with applied strain. Therefore, the higher the applied strain, the higher the prevalence of tunneling mechanisms and, thus, the sensitivity. In particular, the GF values were found to be around 25 and 50 for the 11 and 7 wt.% GNP samples, respectively.
The state-of-the-art is shown in some previous work with strain sensors based on GNP. Lee et al. manufactured a sensor made of sprayed GNP (2.5 wt.%) encapsulated by PDMS films that reached a GF of 1.55 at 50% strain [
33]. Hu et al. developed a porous structured GNP-PDMS sensor, in which a self-sacrificing templating method was employed to configurate the segregated conductive network. Their optimal sensor contained 5 wt.% GNP and achieved a GF of 17.5, between 0 and 10% strain levels [
34]. Xu et al. manufactured a GNP-based strain sensor using a cost-effective gap coating, which reached a GF of 3.5 [
35]. Soe et al. proposed a GNP-PDMS strain sensor manufactured using a modified polyol method with a GF of 15.69 at 10% [
36]. In our work, our best sensor (7 wt.% GNP) reached GF values higher than previously reported at low strain levels, i.e., 25 at 1% and 53 at 5% strain.
Considering the results presented above, it can be concluded that the GNP-PDMS sensors present a high sensitivity to strain and crack propagation and high robustness with a maintained electromechanical response under consecutive cycles. Therefore, their applicability as proof-of-concept of human motion monitoring systems is explored in the next section.
3.4. Human Motion Monitoring Proof-of-Concept
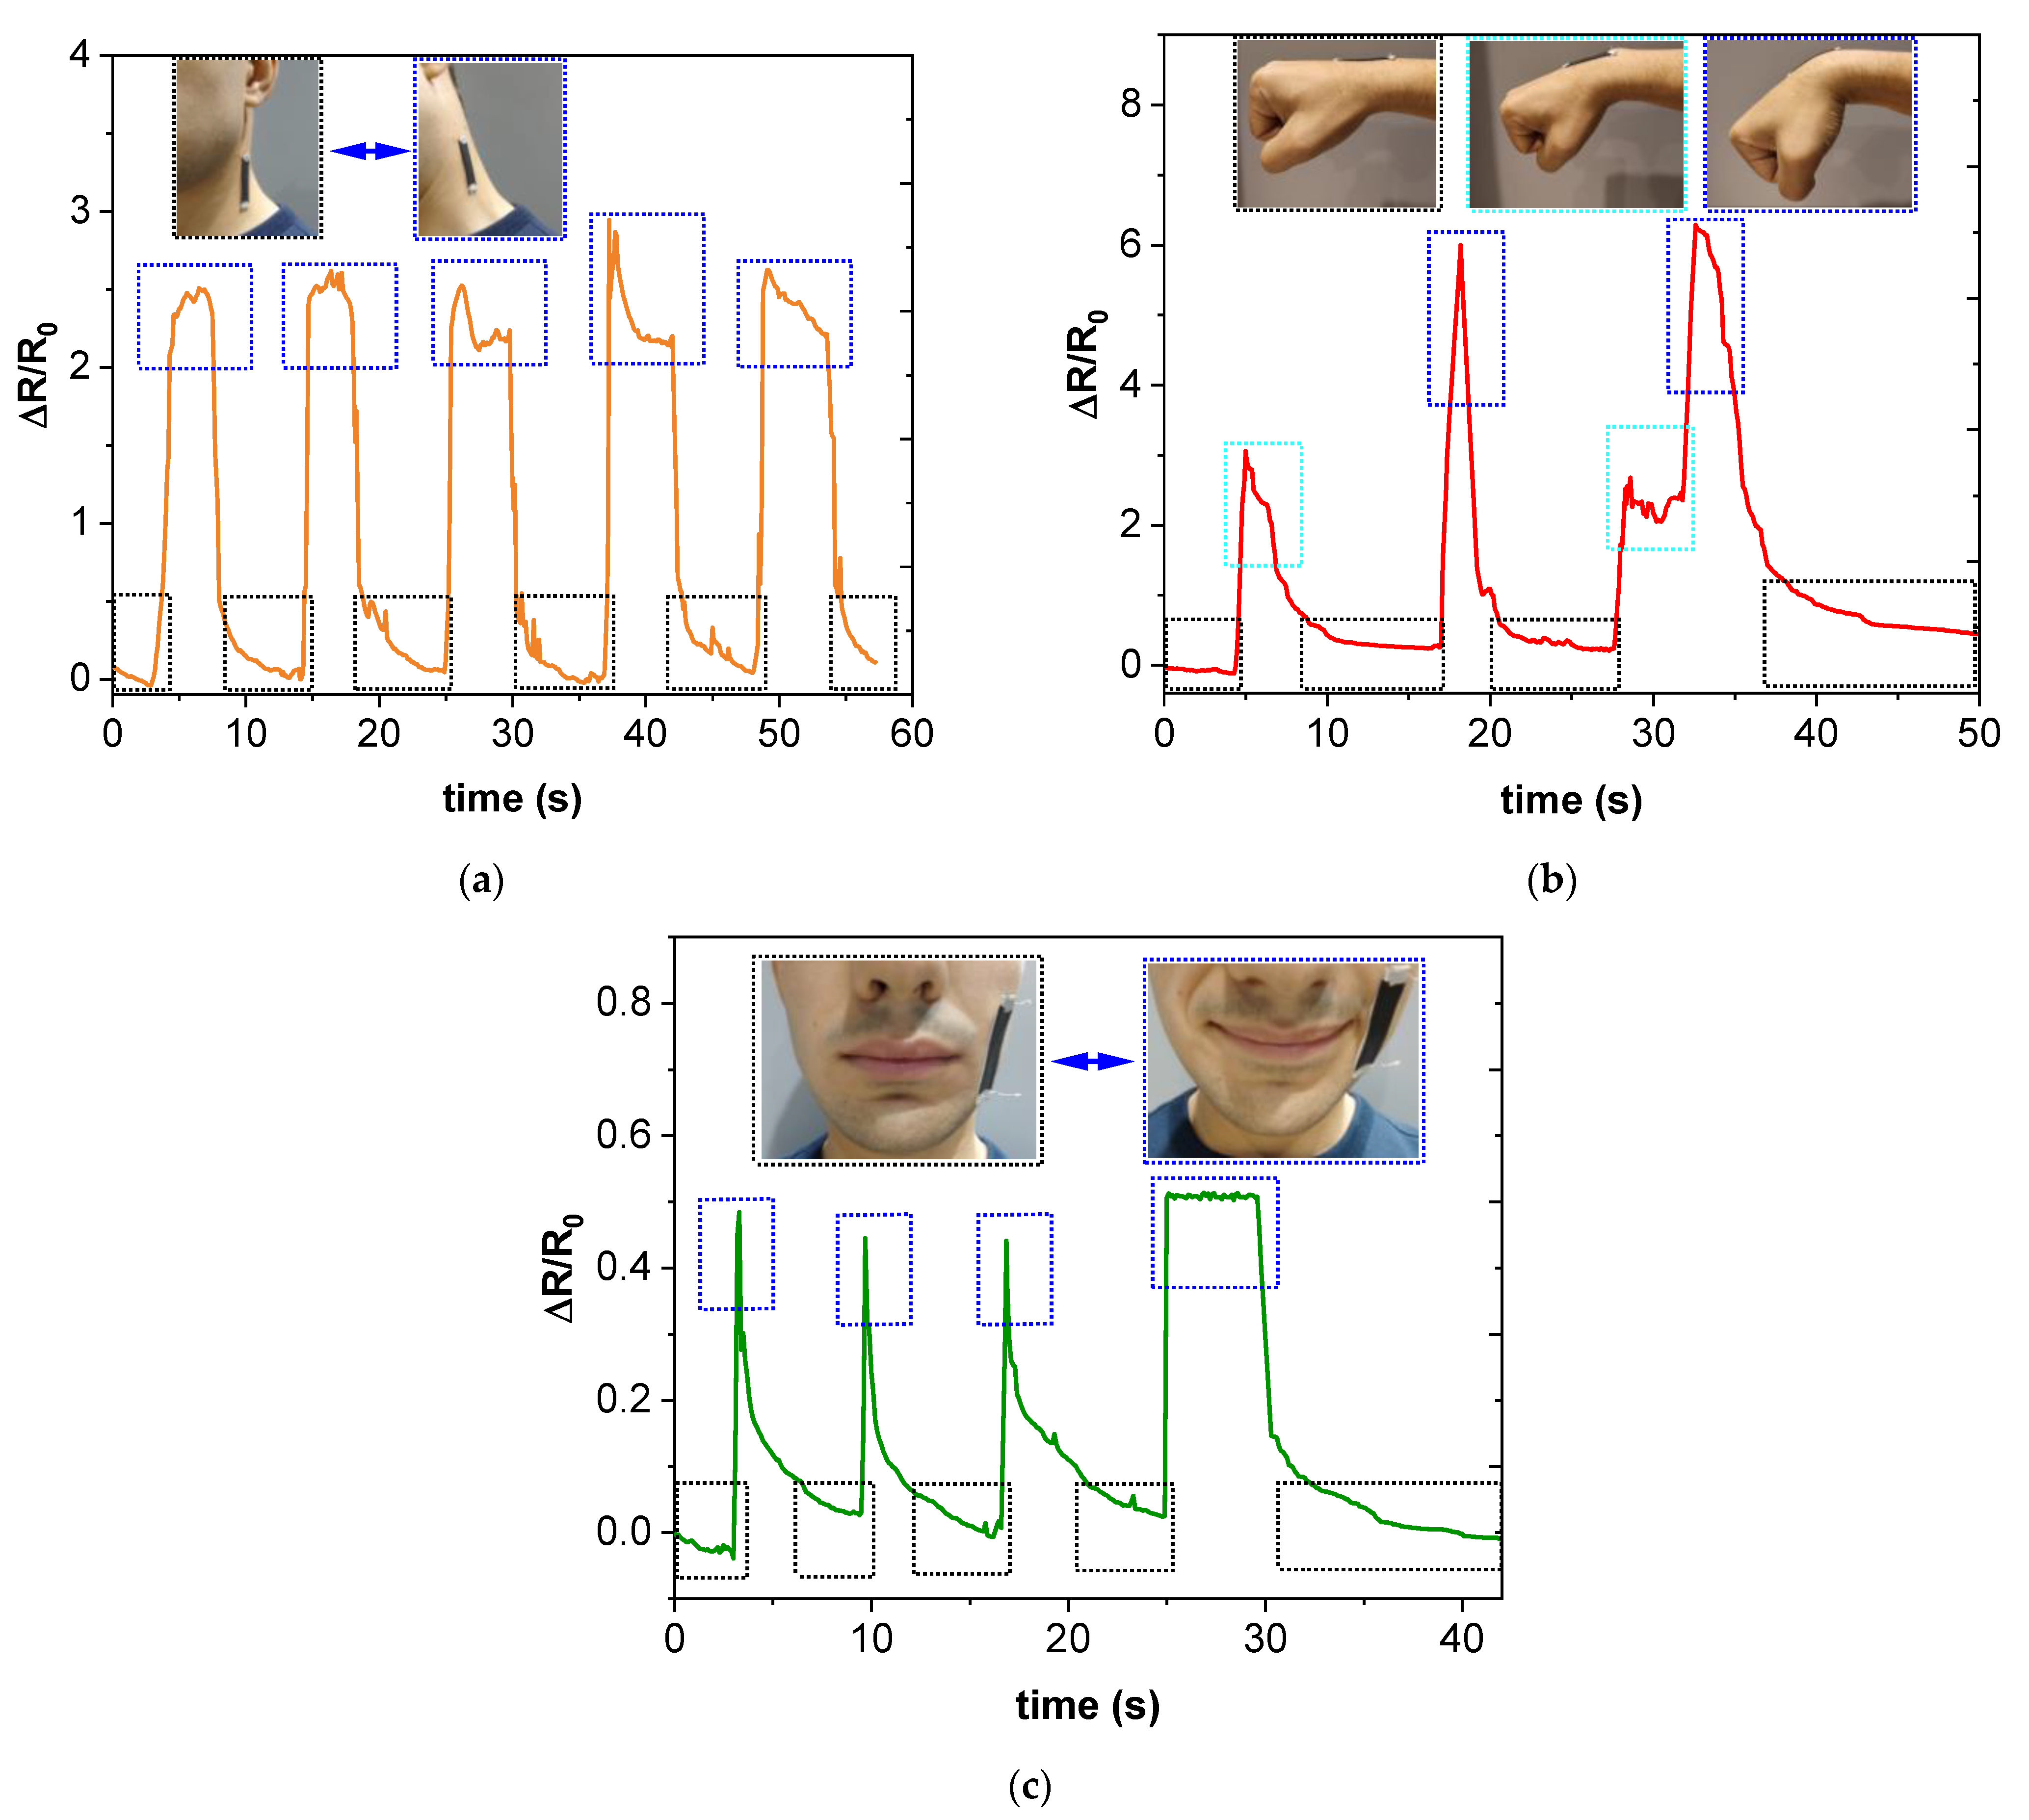
The applicability of the proposed sensors for wrist, neck and small facial movements is shown in the graphs of
Figure 7. First, it is important to point out that the 7 wt.% GNP samples were selected for this proof-of-concept, as this condition was the one with the highest electromechanical sensitivity.
Figure 7a shows the electrical response under neck motion. It can be observed that the electrical resistance increased with neck bending, whereas it recovered its initial value when the neck was stretched. These movements were repeated several times, guaranteeing the robustness of the developed sensors.
On the other hand,
Figure 7b shows the electrical response under wrist motion. It can be observed that the electrical resistance increased with wrist bending angle, recovering the initial value in the stretched condition. Furthermore, a two-step wrist movement showed that the electrical resistance increased as the wrist was bent, and then it remained constant as the wrist remained in a constant bending angle and subsequently increased when the bending angle of the wrist was again increased, recovering its initial value when the wrist was stretched. Therefore, these sensos can provide an instantaneous response of the wrist motion.
Finally,
Figure 7c shows the electrical response under some facial movements, such as smiling. Again, the sensors were robust enough to properly monitor the muscle movements associated with smiling, with increasing electrical resistance when smiling and recovering of the initial value.
Therefore, the electromechanical results obtained during human motion monitoring proved the outstanding sensitivity and robustness of the proposed sensors, being a promising solution for strain monitoring applications and, more specifically, for the monitoring of body injuries, for example.
4. Conclusions
Wearable sensors for human motion monitoring made of GNP-based PDMS nanocomposites have been developed.
It was observed that the electrical conductivity ranges from 10−3 to 1 S/m for 5 to 11 wt.% samples, respectively. There is a saturation effect in the electrical response at higher contents due to the lower effectiveness of the dispersion procedure, as it can induce a breakage of the nanoparticles themselves, affecting their electrical properties.
In addition, the crack growth monitoring response was also widely explored. It was noticed that there is a very high exponential behavior of the electrical response with the vertical displacement. This exponential behavior was affected, in the first stages of the test, by the increasing tunneling resistance between adjacent nanoparticles, which is the main conducting mechanism, especially at lower GNP contents. The last stages of the test were dominated by the crack propagation, inducing a sudden breakage of preferential pathways and leading, thus, to a sudden increase of the electrical resistance as the crack propagated.
The electromechanical response at cycling loads was also investigated. Here, an overall reduction of the peak and baseline levels of the electrical resistance was observed. This decrease was explained as due to the viscoelastic behavior of the PDMS, which induces a delayed mechanical and, thus, electrical response. This delay was reduced when increasing the strain level and the number of cycles. In addition, the gauge factor values were found to be around 15–25 and 25–50 for low and high strain levels, respectively, and increased when decreasing the GNP content, as expected. In every case, the values were markedly above those found for conventional metallic gauge- or other carbon nanoparticle-based sensors, especially made with CNTs.
Finally, a proof-of-concept of human motion monitoring has been carried out. To achieve this purpose, wrist, neck and facial movements were monitored using the 7 wt.% GNP sensors, as they were the most sensitive. In every case, the electrical resistance changed in good agreement with the mechanical response, proving the robustness and the applicability of the developed sensors for this kind of applications and opening a way to further explore them in a variety of fields such as biomedicine.


