Article

Carbocyanine-Based Fluorescent and Colorimetric Sensor Array for the Discrimination of Medicinal Compounds

by
Anna V. Shik
,
Irina A. Stepanova
,
Irina A. Doroshenko
,
Tatyana A. Podrugina
and
Mikhail K. Beklemishev
*
Department of Chemistry, Lomonosov Moscow State University, 119991 Moscow, Russia
*
Author to whom correspondence should be addressed.
Submission received: 29 January 2022 / Revised: 16 February 2022 / Accepted: 17 February 2022 / Published: 19 February 2022
(This article belongs to the Special Issue Chemometrics for Multisensor Systems and Artificial Senses)

Abstract

:
Array-based optical sensing is an efficient technique for the determination and discrimination of small organic molecules. This study is aimed at the development of a simple and rapid strategy for obtaining an optical response from a wide range of low-molecular-weight organic compounds. We have suggested a colorimetric and fluorimetric sensing platform based on the combination of two response mechanisms using carbocyanine dyes: aggregation and oxidation. In the first one, the analyte forms ternary aggregates with an oppositely charged surfactant wherein the dye is solubilized in the hydrophobic domains of the surfactant accompanied with fluorescent enhancement. The second mechanism is based on the effect of the analyte on the catalytic reaction rate of dye oxidation with H2O2 in the presence of a metal ion (Cu2+, Pd2+), which entails fluorescence waning and color change. The reaction mixture in a 96-well plate is photographed in visible light (colorimetry) and the near-IR region under red light excitation (fluorimetry). In this proof-of-concept study, we demonstrated the feasibility of discrimination of nine medicinal compounds using principal component analysis: four cephalosporins (ceftriaxone, cefazolin, ceftazidime, cefotaxime), three phenothiazines (promethazine, promazine, chlorpromazine), and two penicillins (benzylpenicillin, ampicillin) in an aqueous solution and in the presence of turkey meat extract. The suggested platform allows simple and rapid recognition of analytes of various nature without using spectral equipment, except for a photo camera.

Graphical Abstract

1. Introduction

Optical sensing and sensor arrays have been intensively developing in recent years [1,2,3,4,5,6,7,8,9,10]. Simple and rapid detection and discrimination of inert organic compounds (colorless and not prone to forming colored complexes, featuring no intrinsic fluorescence and not interacting directly with fluorophores by energy or electron transfer mechanisms) comprises a challenge to researchers. Therefore, the interest is maintained to new sensing techniques covering the widest possible range of analytes. Most optical analytical methods are based on direct sensing, i.e., probe–analyte interaction, such as in fluorophore (chromophore)–spacer–receptor, displacement assay-based sensors, and similar approaches [11]. Indirect sensing is an alternative strategy that does not involve binding of the analyte with the fluorophore (chromophore) or its complexing moiety. The value of indirect techniques lies in their ability to reach analytes of various nature. An example of indirect methodology is aggregation-based [1] and self-assembly sensing [2,3,4,5]. Most popular are the methods based on the aggregation of nanoparticles (primarily, silver and gold) [6,7,8,9]; these processes are extensively used in optical sensing. However, problems can arise with the stability of nanoparticles, effects of ionic strength, and multiplexity of detection [10]. Different types of aggregation events are also applicable for developing sensors: formation of surfactant micelles encapsulating a hydrophobic fluorophore [12,13,14]; or joint micelles of the fluorophore and analyte [15], aggregation-induced emission [16,17], and other processes [18].
We described a variant of aggregation-based sensing using hydrophobic carbocyanine dyes whose fluorescence is quenched in water [19]. If the analyte can form an aggregate (more specifically, a nanoparticle) with an oppositely charged ion containing hydrocarbon chains (a surfactant), the formed nanoparticle will have hydrophobic domains that are able to solubilize the dye. In the hydrocarbon environment of the domain, fluorescence of the dye is turned on, which serves as the analytical signal. A selective response is observed to large hydrophilic ions forming several ionic or hydrogen bonds. We observed fluorescence enhancement of carbocyanine dyes with aminoglycosides, cephalosporins, penicillins, and other compounds in the presence of cetyltrimethylammonium bromide (CTAB) or sodium dodecyl sulfate (DDS). These surfactants proved to be the most efficient in aggregation-based determinations [19]. The signal intensity differs with the particular analyte.
Carbocyanine dyes are near-IR (NIR) emitting fluorophores which are extensively used in bioimaging techniques and sensing [20,21,22]. The interest in the NIR dyes was aroused by the analysis of natural samples. Advantageously, the far-red exciting light and NIR emitted light of these dyes is weakly absorbed by biological tissues. The emission bands of pentamethine and heptamethine carbocyanines are located near 700 and 800 nm, respectively, and their fluorescence can be conveniently excited by the light-emitting diodes (LED) at 660 nm. Besides the aggregational behavior mentioned above, the carbocyanines can be easily oxidized, which makes them indispensable reagents for indirect sensing.
Oxidation of dyes can serve as an indicator reaction in fluorescent and colorimetric catalymetric sensing. Traditional non-enzymatic kinetic methods were developed for the determination of analytes of different nature, including small organic molecules [23,24]. In kinetic methods, the analytes can change the indicator reaction rate by various mechanisms: via catalysis, binding the catalyst, or affecting the rate of radical chain indicator reaction. The exact mechanism is only rarely known. Most of kinetic methods are based on redox reactions, such as the oxidation of dyes with peroxides and peracids [25]. Being rapid and simple, the kinetic methods are presently used in sensing. In the past decade, catalytically active magnetic nanoparticles (MNPs) were used as catalase or oxidase mimics [26]. Methods were developed for sensing pesticides, phenols, strong reducing agents, and analytes complexing Fe2+ and Fe3+ ions on the surface of the MNPs. The indicator reactions used in these systems included the oxidation of 3,3′,5,5′-tetramethylbenzidine (TMB), 2,2′-azino-bis(3-ethylbenzothiazoline-6-sulfonic acid) (ABTS) and other chromogenic compounds [26]. Metal–organic frameworks (MOF) can operate as catalysts in redox reactions for the detection of antibiotics [27]. Uncatalyzed oxidation of chromogenic substrates was also applied in colorimetric sensing [28]. Overall, various types of redox reactions, including catalytic ones, can be used in sensing of small molecules. The selectivity of detection can be governed by various complexation constants of analytes with the metal ions in catalytic indicator reactions and different catalytic activity of these complexes.
A popular indicator reaction in kinetic methods of analysis is the oxidation of various reducing agents (e.g., hydroquinone) with hydrogen peroxide. Copper(II) is a catalyst in this reaction, and amino compounds can affect its rate by influencing the catalytic activity [29,30]. Earlier, we explored the feasibility of oxidizing a carbocyanine dye by H2O2 using Cu2+ as a catalyst for the discrimination of sulfanilamides and detection of the signals of pharmaceuticals of various nature [31]. In the present study, we explored an array based on this indicator reaction using several dyes and catalysts. The potential of this array has been studied with respect to pharmaceutical compounds.
A large number of methods for the determination of medicinal compounds by colorimetric and fluorimetric methods was developed [32,33]. More than 40 pharmaceuticals were authenticated in 96-well plates using a seven-sensor colorimetric array [34]. A penicillin antibiotic ampicillin was detected using colorimetric [35,36,37] and fluorimetric [38,39,40] techniques. Aggregational, enzymatic, and immune methods with colorimetric detection were developed for another penicillin compound, benzylpenicillin [32,41]. Cephalosporins were also successfully determined colorimetrically [42,43,44] and in some cases fluorimetrically [45]. Few methods of colorimetric [46] and fluorimetric determination of phenothiazines [47] have been reported. Phenothiazines were determined in urine using a chemiluminescent sensor array [48].
Discrimination and classification tasks are efficiently solved using sensor arrays. Operation of an array is based on the pattern recognition of the responses of several low-specific receptors; the combined data is subjected to chemometric analysis in order to construct a recognition model. Optical sensor arrays were extensively used to detect and discriminate small organic molecules, for example, 15 volatile organic solvents with a three-fluorophore array [49], four medicinal compounds and their mixtures with a blend of 4–5 fluorophores [50], and all essential amino acids using a fluorescent quantum dot [51]. Aminoglycoside antibiotics were discriminated using two fluorophores in the presence of surfactant micelles [15]. Poly(p-phenylene-ethynylene) fluorescent polymers of various structure (sometimes with added transition metal ions or surfactants) were used to recognize different compounds: non-steroidal drugs [52], amino acids [53], explosives [54], saccharides [55], and antibiotics: penicillins, cephalosporins, aminoglycosides, quinolons, and others [56]. It can be seen that the recognition of small molecules, including pharmaceutical compounds, was performed using various optical arrays. The classification of pharmaceuticals thus can be used as a test for the recognition ability of the sensor array prior to its application to real-world samples.
The sensing platform designed in this study combines the two mentioned response principles: the aggregation-based fluorescence enhancement [19] and the effect of analyte on the redox reaction rate [31], both processes involving carbocyanine dyes (Scheme 1). The purpose of this feasibility study was to demonstrate the potential of the suggested methodology by discrimination of several model compounds of various nature, including structurally related ones. The selected model analytes included four cephalosporins (ceftriaxone, cefazolin, cefotaxime, cefotaxime), three phenothiazines (promethazine, promazine, chlorpromazine), and two penicillins (benzylpenicillin, ampicillin).
Both penicillins and cephalosporins are prone to oxidation at the sulfur(2–) atom to form the corresponding sulfones [57]. The beta-lactam ring of cephalosporins and penicillins can be cleaved by primary amines. Cephalosporins demonstrate lower reactivity in this reaction, as they have a dihydrothiazine ring rather than a thiazolidine ring in penicillins. Moreover, cephalosporins yield no stable product of amine addition, forming a mixture of degradation products [58]. Similar to beta-lactams, phenothiazines can be oxidized to form sulfoxides, but this process occurs under milder conditions [59]. As organic bases, they form ionic associates with anionic dyes and metal complexes. Phenothiazines exhibit electron-donor properties and can form charge-transfer complexes with electron acceptors [59]. A common property of the compounds belonging to the beta-lactam and phenothiazine groups is their ability to form complexes with transition metal ions [57,59], which was employed in this study. Our purpose was to evaluate the discrimination ability of the sensor array and assess the suitability of the designed strategy.

2. Materials and Methods

2.1. Reagents and Materials

Carbocyanine dyes 1 and 4 (Scheme 2) were obtained following previously reported procedures [19,60], whereas the synthesis route for dyes 2 and 3 is depicted in Scheme 3. The detailed protocols and characterization data are given in the Supplementary Information.
Other reagents and analytes were purchased from Sigma−Aldrich and used as received. Acetate (pH 3−5), phosphate (pH 6−8), and borate (pH 9−10) buffer solutions were used to maintain pH values. CuSO4·5H2O was dissolved in water and PdCl2 in 0.1 M HCl at 0.1 M concentrations with subsequent dilution to 1 mM before use. Analytes (Scheme 2) were dissolved in water at 5 mM and stored at 4 °C.

2.2. Instrumentation

Absorbance spectra were measured using an SF-102 spectrophotometer (Interphotophysica, Moscow, Russia), fluorescence spectra were obtained using a “Fluorat-02 Panorama” spectrofluorimeter (Lumex, S.-Petersburg, Russia) in 1-cm quartz cells. Fluorescence in the NIR region in 96-well polystyrene plates (Nunc F96 MicroWell, white, cat. no. 136101, Thermo Fisher Scientific, Waltham, MA, USA) was registered using a visualizer [19] (Figure S1 in ESI) consisting of a light source (11 3-Wt red LEDs with an emission maximum of 660 nm, Minifermer, Moscow, Russia) and a NIR digital camera (modernized Nikon D80 (Nikon, Tokyo, Japan) with a filter transmitting light with wavelengths above 700 nm). Visible photographs were taken by a smartphone Google Pixel 2 camera.

2.3. Procedures

Only the reactions for full spectrum measurements were conducted in the quartz 1-cm cells, other reactions were conducted in fluorimetric plates. For the redox reactions, the following solutions were pipetted into the well of the plate in the indicated order (using multichannel pipettes for a large number of samples): (1) buffer (in the final protocol it was phosphate buffer, pH 7.4, 0.067 M), 30 μL; (2) water (up to the total volume of 300 μL); (3) cetyltrimethylammonium bromide (CTAB), 1 mM, or sodium dodecyl sulfate (SDS), 8 mM, 30 μL; (4) analyte 5 mM, 30 μL (or water for blank runs); (5) dye, 0.1 g/L in water (in ethanol for dye 2), 30 μL; (6) CuSO4, 1 mM (for the oxidation of dye 4, 0.5 mM), 30 μL. For the oxidation of dye 1, PdCl2 solution was used (0.1 mM), 60 μL; (7) H2O2 1 M, 30 μL (0.5 M for the oxidation of dye 1). The moment of adding hydrogen peroxide was taken as the reaction start.
For the aggregation-type reaction, the following solutions were mixed in the plate: (1) buffer pH 7.4, 30 μL; (2) water 180 μL (up to the volume of 300 μL); (3) CTAB 1 mM, 30 μL; (4) analyte 5 mM, 30 μL; (5) dye 1, 0.025 g/L colloidal solution in water, 30 μL.
Digital photographs in visible light and under 660-nm LED light illumination were obtained for the 96-well plates every several minutes for the redox reactions of dyes 14 and only once for the aggregation-type reaction of dye 1.

Operations with Turkey Meat Extract

Turkey meat was purchased locally, ground in a home meat grinder, and frozen. To 5.07 g of thawed ground turkey, 10 mL of water was added and the suspension was heated at about boiling temperature for 15 min. The mixture was allowed to cool and centrifuged at 3000 rpm for 3 min to remove the denatured proteins. Three milliliters of the supernatant were transferred into another 15-mL test tube, and 2.5 mL of water and 9.5 mL of 95% ethanol were added to precipitate the remaining proteins. After stirring, 2 mL portions of the solution were placed in Eppendorf-type plastic tubes and centrifuged at 7000 rpm for 2 min. The concentration of solids in the resulting supernatant was approximately 10 mg/mL (by gravimetry) and the ethanol concentration was 60% (v/v).
In the analytical cycle, turkey extract was added to the reaction mixture instead of the major part of water in the volume of 100 μL. Otherwise, the protocol was the same as for the reaction without turkey.

2.4. Data Treatment

Absorbance and fluorescence intensities of the reaction mixtures were characterized by the photographic images of the 96-well plates. To split an RGB image into separate red (R), green (G), and blue (B) channels, ImageJ software (Fiji) was used. For some of the reactions, only the average RGB intensity (R + G + B)/3 was obtained. The intensities were represented as numbers in the range of 0–255.
Four to six parallel runs were performed for each model analyte or blank. Out of the six parallels, the four or five most consistent runs were selected for the subsequent principal component analysis (PCA) treatment. PCA reduces the dimensionality of initial data: the intensities measured for every indicator process (up to 16 data columns) for each analyte in several parallel runs are substituted for the three columns of the first three principal components (PC); a greater number of PCs is usually meaningless. The data then can be conveniently viewed in the scores plots as PC2 vs. PC1 and PC3 vs. PC1. Covariance type PCA was performed in XLSTAT (Addinsoft, New York, NY, USA) or Unscrambler X (Camo Software, Oslo, Norway). Correlations between variables and factors were visualized in the form of circular factor diagrams. Confidence ellipses in the score plots were built using a 95% confidence level. The quality of discrimination was evaluated as the number of intersections of the confidence ellipses according to a known approach [61] and by estimating accuracy as (Nn)/N × 100%, where N is the total number of points (40 for the basic data set without turkey extract and 50 with turkey extract) and n is the number of points belonging to multiple classes (unclassified). This value was estimated as the number of points inside the crossed portions of confidence ellipses both in PC1–PC2 and PC1–PC3 coordinates.

3. Results and Discussion

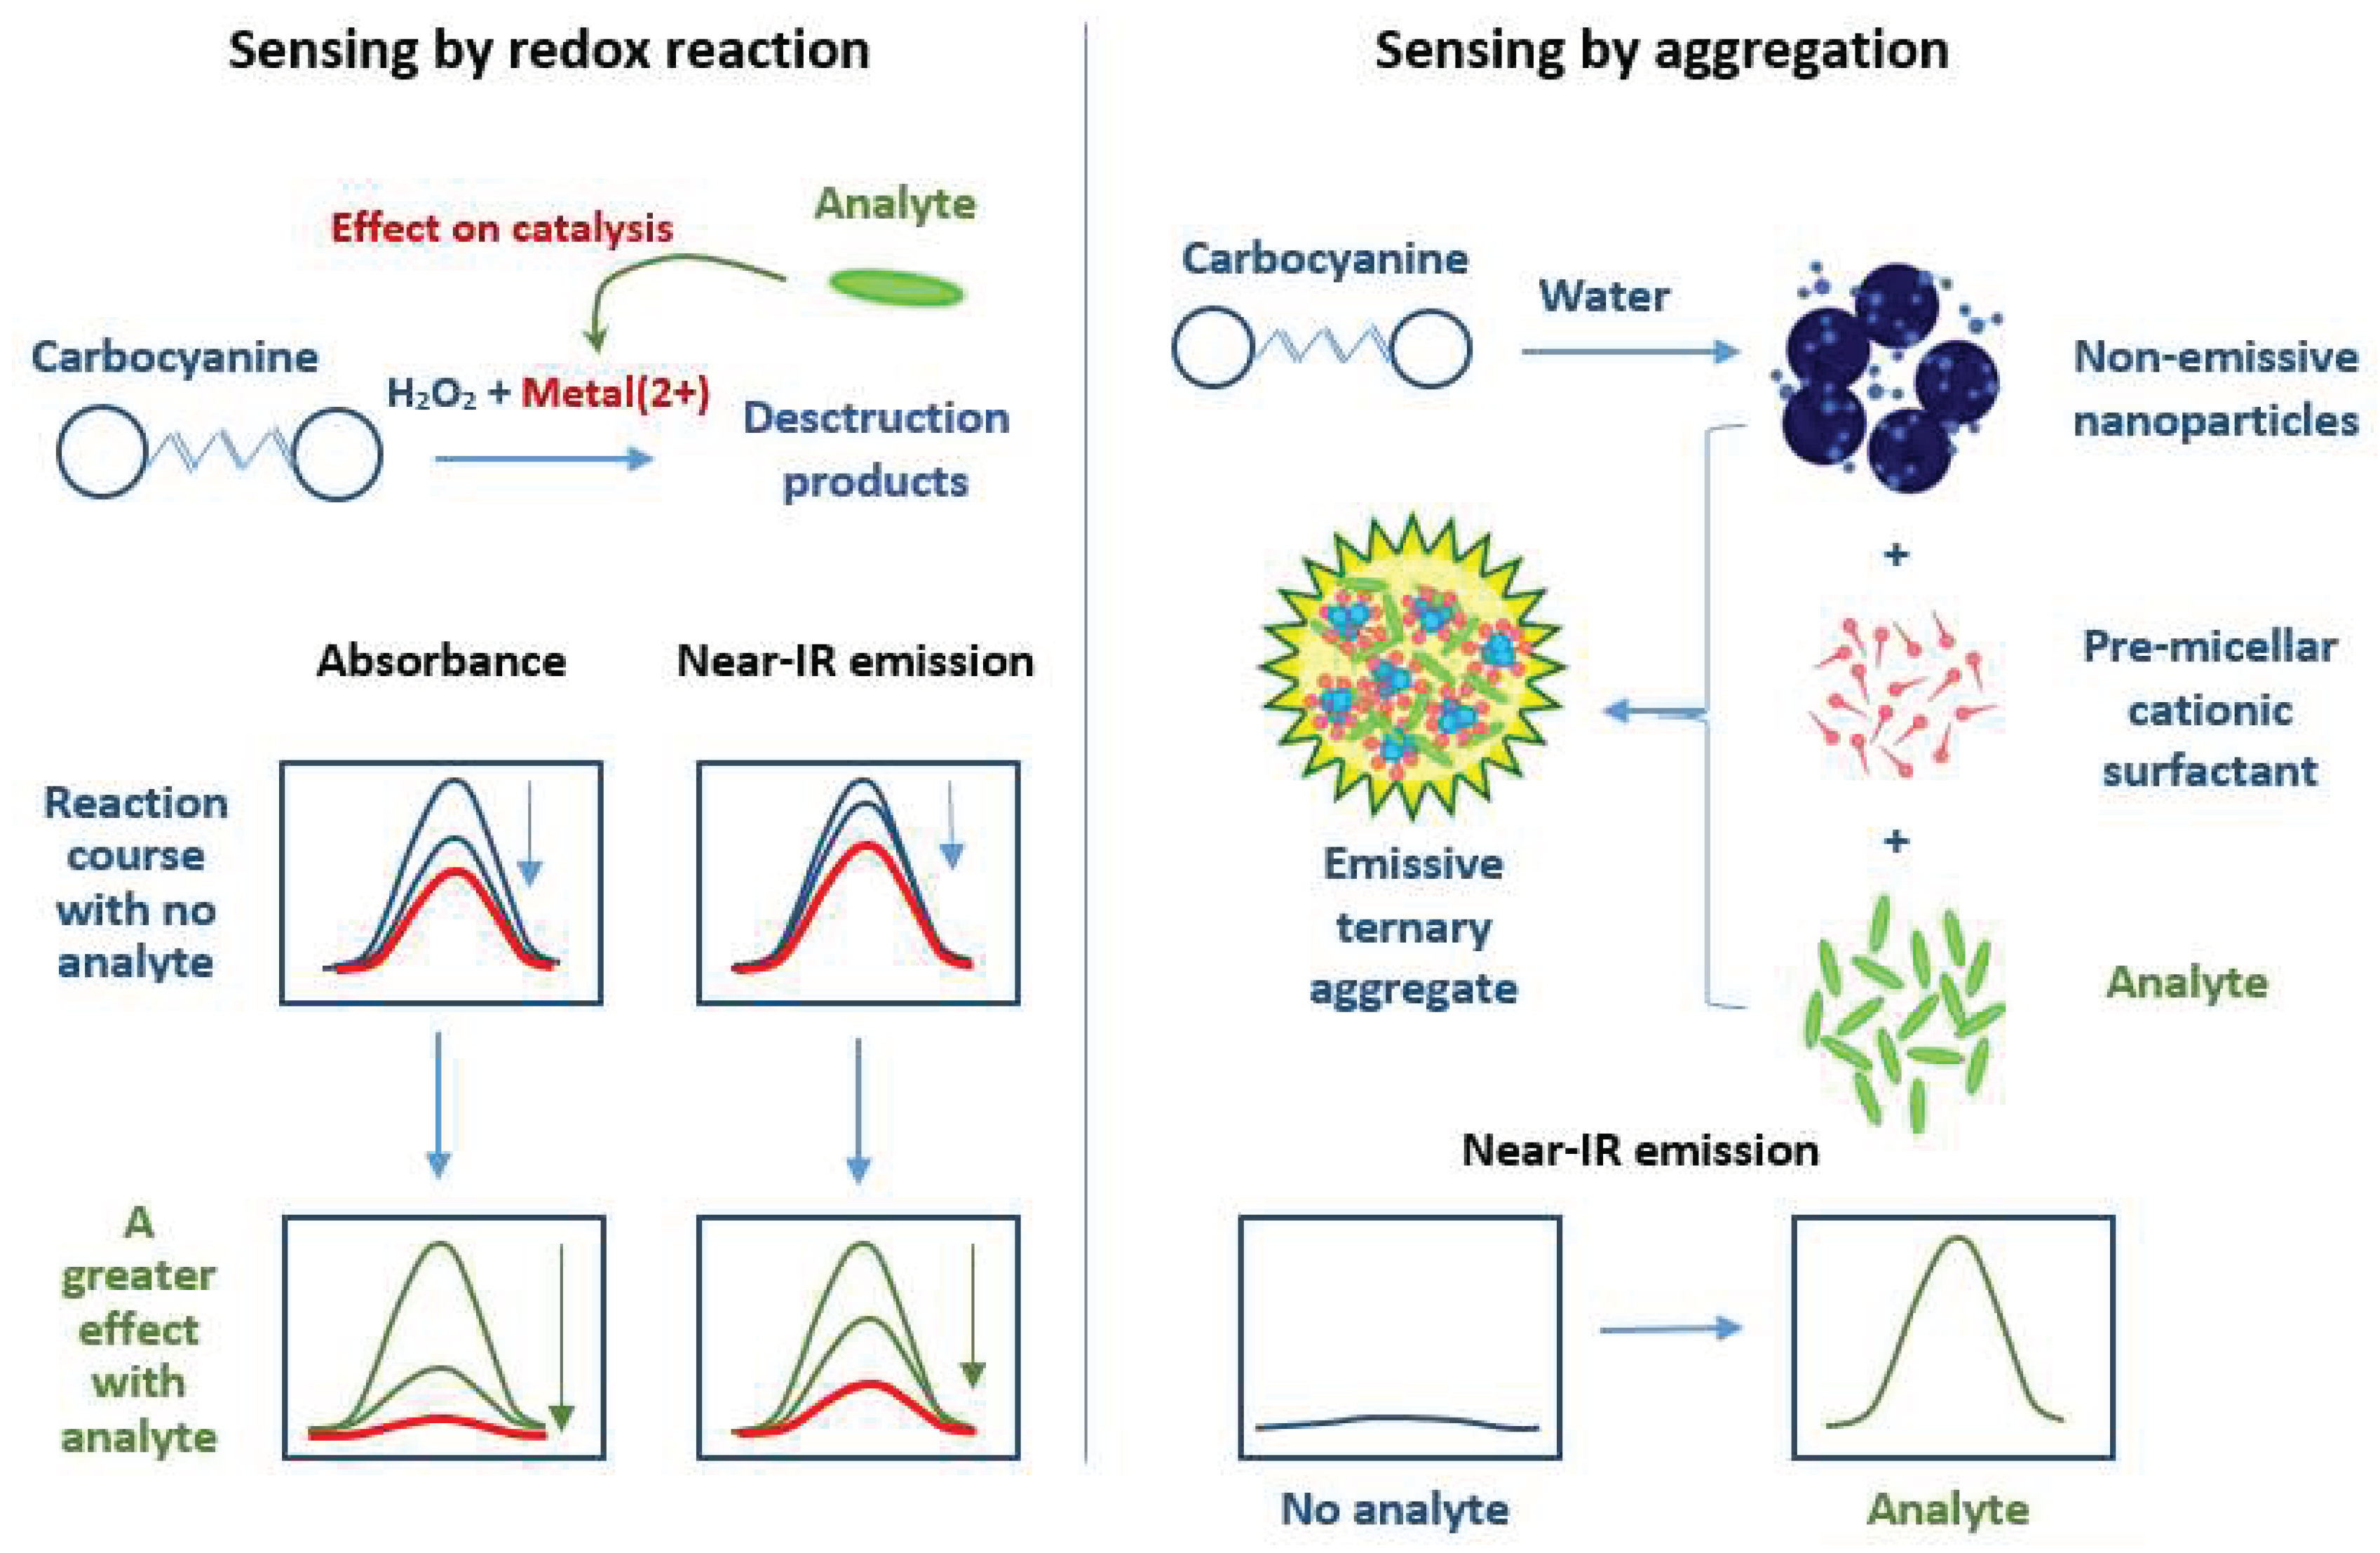
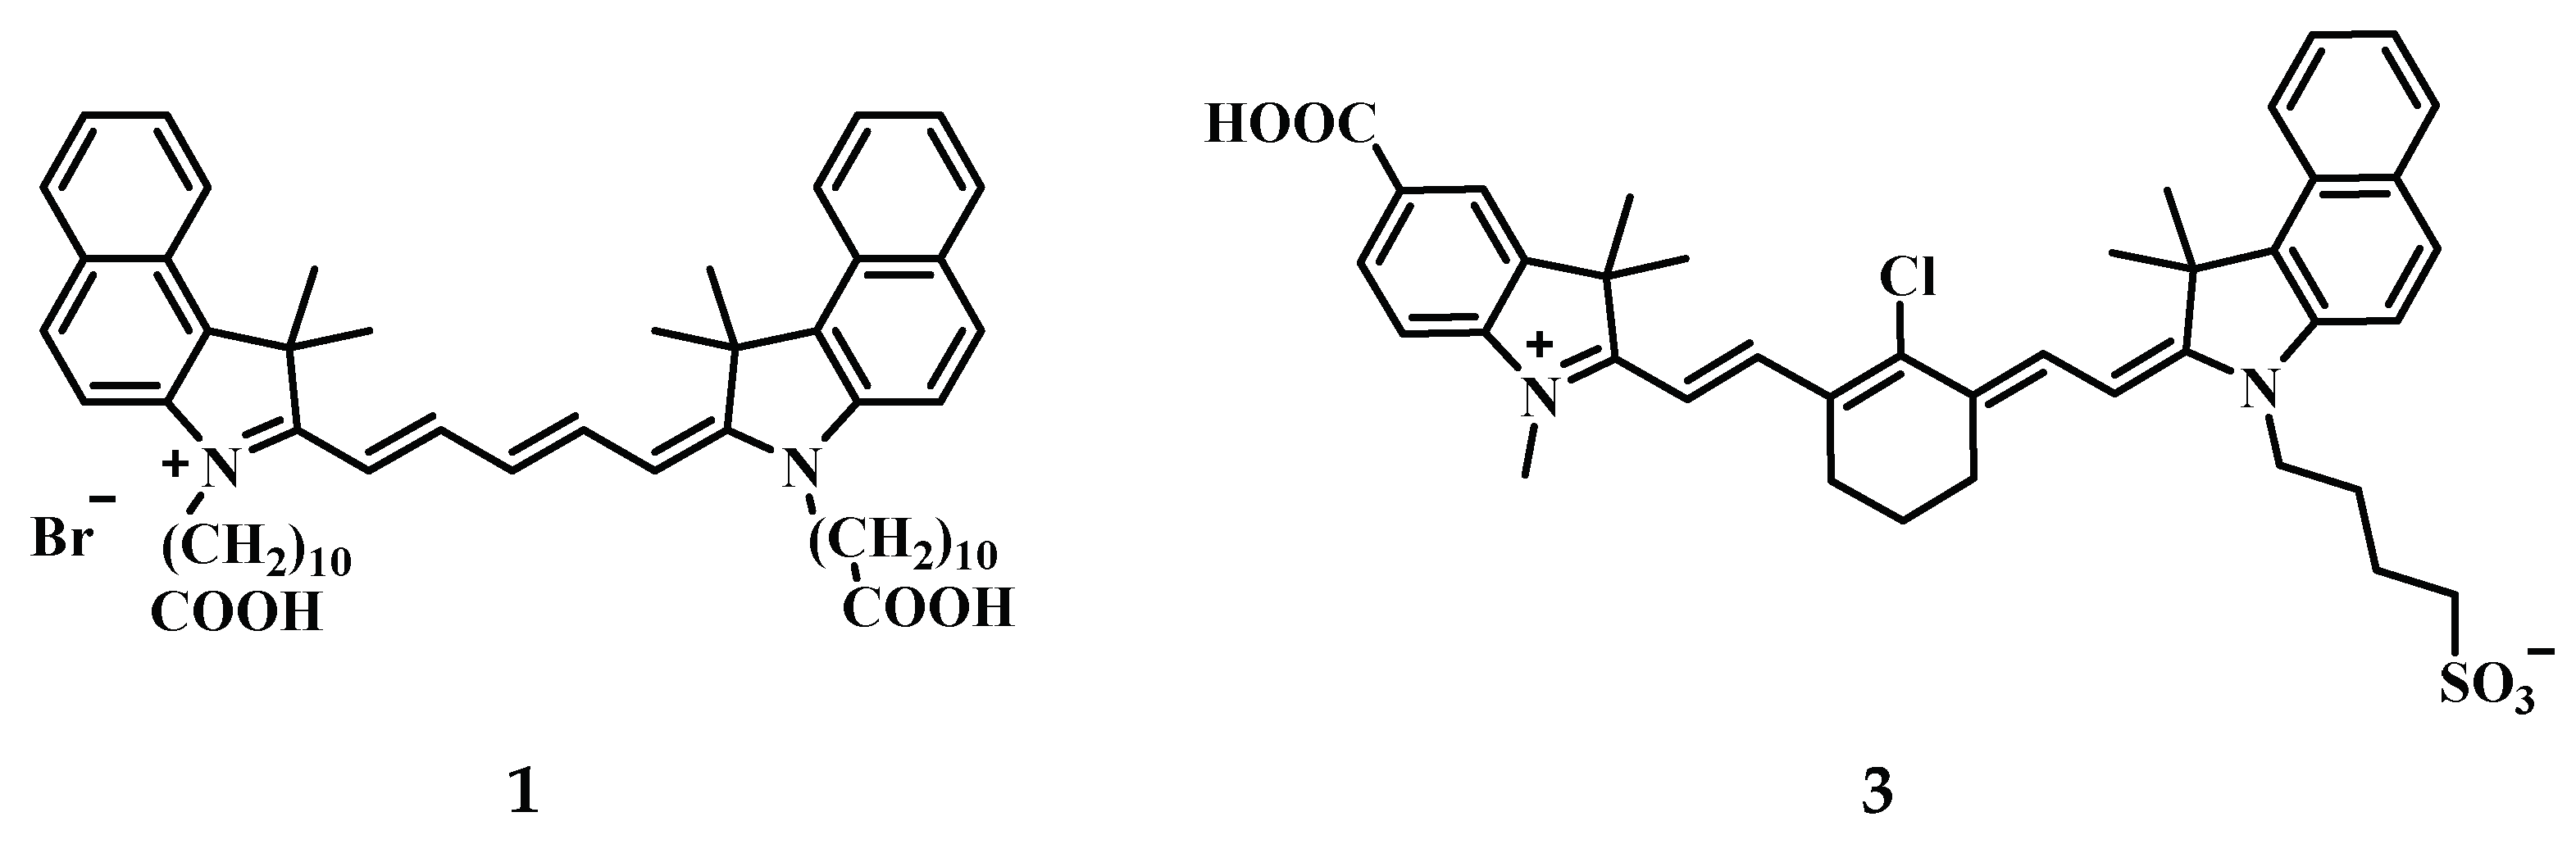
3.1. Selection of Indicator Systems and Reaction Conditions

Two types of indicator systems are used in this study: based on aggregation phenomena and on redox reactions (Scheme 1). Overall, five reactions were used, four of which are the oxidation reactions of dyes 14 with H2O2 and one reaction (with dye 1) is based on the aggregation principle of response.
For the aggregation-based system, a hydrophobic dye 1 was used (for n-octanol–water, logP = 9.7 for dye 1; for dyes 24 logP values did not exceed 3.2). Dye 1 enhances its NIR emission in the presence of anionic analytes and CTAB as a cationic surfactant [19]. Under these conditions, dye 1 was expected to yield responses to anionic cephalosporins and penicillins but not phenothiazines. The general reaction conditions were similar to paper [19]: submicellar CTAB (0.1 mM), pH 7.4, 0.025 g/L dye 1. The effect of an analyte on the fluorescence intensity and absorbance of dye 1 is exemplified by cefazolin in Figure 1. It can be seen that spectral differences are caused by cefazolin and benzylpenicillin in 0.1–0.2 mM CTAB, which is typical for the aggregational mechanism of ‘turn-on’ fluorescence in these systems: the anionic analyte forms an association complex with the cationic surfactant, and the hydrophobic dye enters the hydrocarbon domains of the aggregate with a considerable fluorescence enhancement [19].
The redox reaction-based systems rely on our results [31] stating that the oxidation of pentamethine indolenine carbocyanine dyes with hydrogen peroxide catalyzed by Cu2+ can be used for the detection of various small molecules (e.g., cephalosporins, penicillins, phenothiazines and sulfanilamides) by their effect on the reaction rate. Oxidative destruction of the dye resulted in discoloration and fluorescence waning. To obtain diverse responses of analytes in this work, we chose the dyes of different structures (24). To additionally diversify the effects of analytes, palladium(2+) was used instead of copper(2+) as a catalyst in the oxidation reaction of dye 4.
Generally, the redox reaction conditions found in paper [31] could be used in the present study. The same pH value of 7.4 was used, as it provided an acceptable oxidation rate and diverse effect of the analytes (Figures S2 and S3). The concentration conditions were to be selected so as to ensure the reaction rates convenient for the measurement. This goal was achieved by using the concentrations of the oxidizer (hydrogen peroxide) and metal ions on the order of 0.1 M and 0.1 mM for most dyes (see Figure S4 for the concentration–signal plots).
Surfactants (CTAB and DDS) were added to the redox systems for the following reasons. Hydrophobic dyes 14 are readily soluble in alcohols and tend to form nanoparticles when introduced into an aqueous medium. As we hypothesized in [19], based on the light scattering data, the surfactant can bind with the nanoparticles of the free dye (for CTAB the possible bond type is n–π), which can stabilize the suspension of nanoparticles from sedimentation in the course of the redox reaction. In this regard, a submicellar concentration of CTAB or DDS (~0.1 CMC) was added to the reaction mixture.
The UV–vis (absorbance) and emission spectra for the oxidation reactions (Figure 2) show a decrease in intensity with time in the presence of the oxidizer. When an analyte is present, the rate of this decrease changes, which implies a feasibility of obtaining an analytical response (some examples of kinetic curves for dye 3 are given in Figure 3). Oxidation of the dye results in waning of the absorption band around 700 nm and increasing the role of the spectral features of the red region, which determines the different colors of the products in the presence of different analytes, especially phenothiazines (Figure 4).
To avoid measuring full spectra and using full-scale spectral equipment, we obtained the photographic images of the 96-well plates using a NIR photo camera (for fluorescence) and a smartphone (for absorbance) with subsequent digitalization. Images of the plates with dye 2 and 4 are shown in Figure 4 and Figure S5 as examples. From the viewpoint of discrimination tasks, it is important that the signals vary for different analytes. For example, the products of dye 2 oxidation are colored differently in the presence of different phenothiazines (Figure 4). Theoretically, all data received could be subjected to PCA treatment, but such an operation would be excessively laborious. For this reason, we only used the selected time points at which the model analytes yielded the most diverse responses (Table 1).
Dye 1 did not demonstrate any noticeable color changes during oxidation in visible light, and we only registered its NIR emission. Dye 4 did not show any visible spectrum change with time, for which reason only the general intensity was obtained from its visible images. The NIR photo camera has certain spectral sensitivity and produced NIR intensity of different wavelengths as different conditional colors (for example, yellow for 700–800 nm and gray for >800 nm, Figure S2); for these reasons, RGB splitting of the NIR images was also performed. Thus, the RGB splitting of the images relating to dyes 2 and 3 gave us 6 columns of data for each dye. Overall, we obtained 16 columns of data (basic dataset, Table 1). Some additional data (17 columns) were obtained by treatment of other time points of the kinetic curves and later used in an additional experiment (Section 3.2).

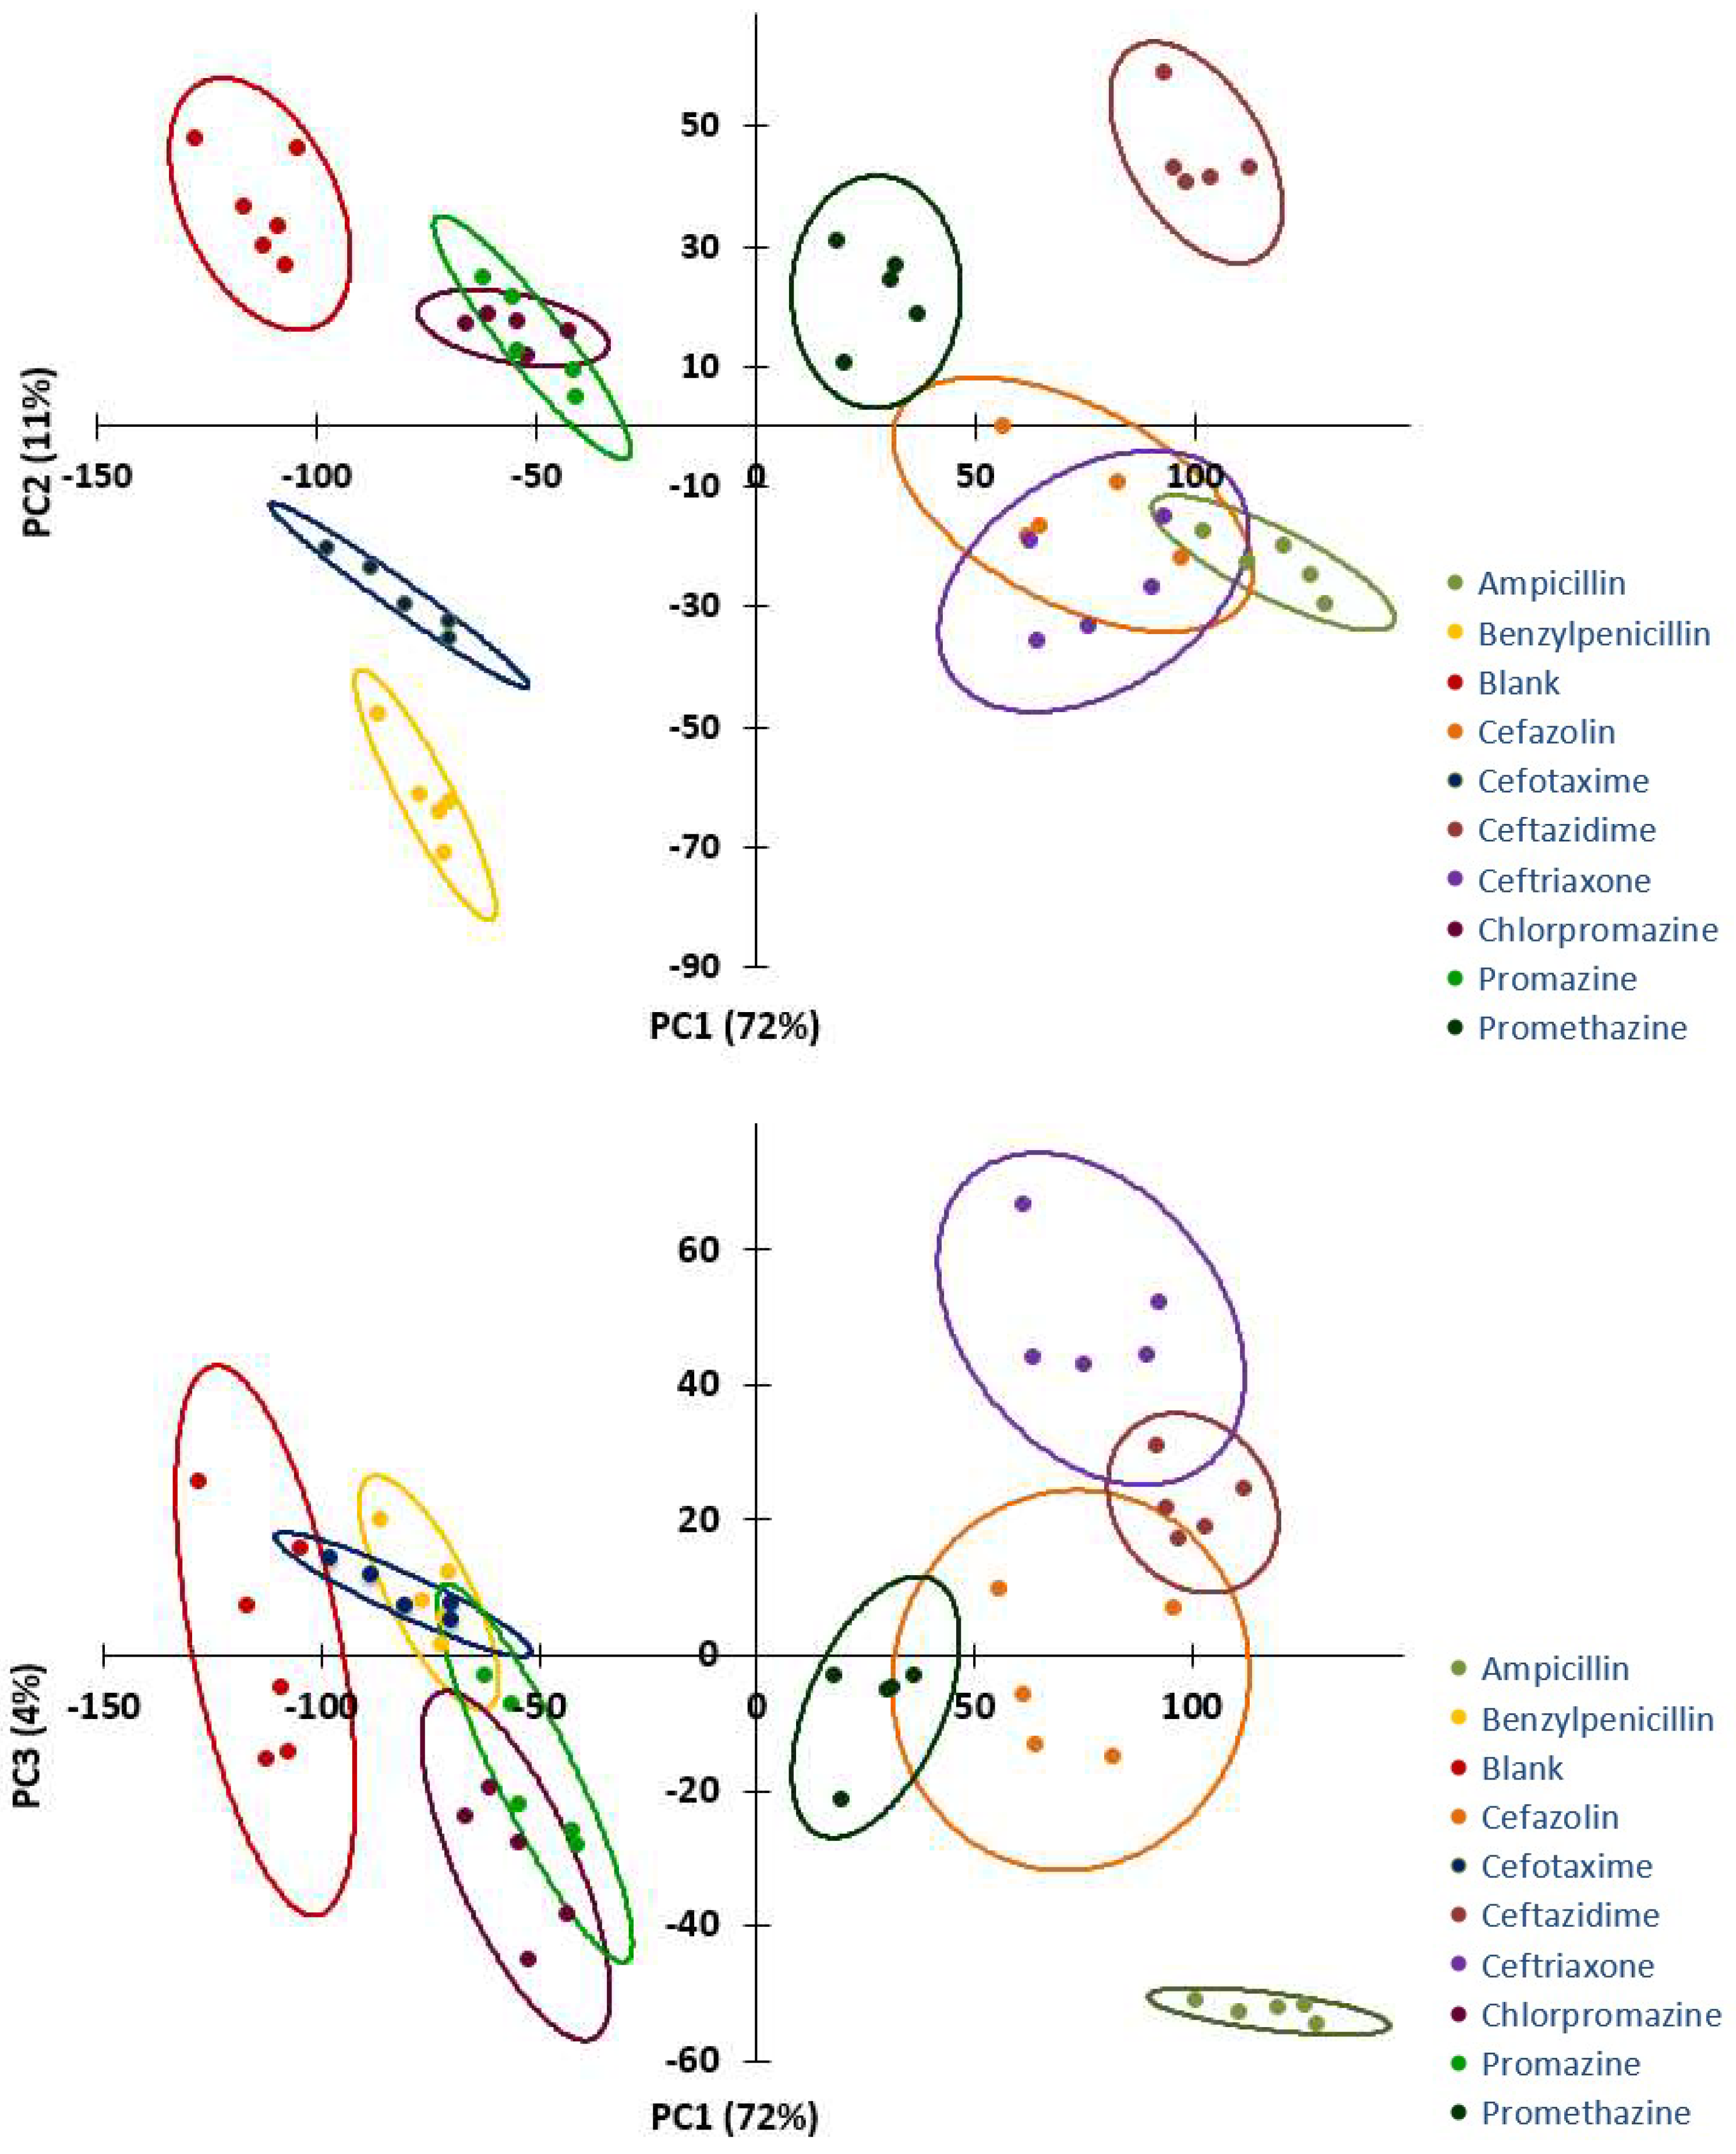
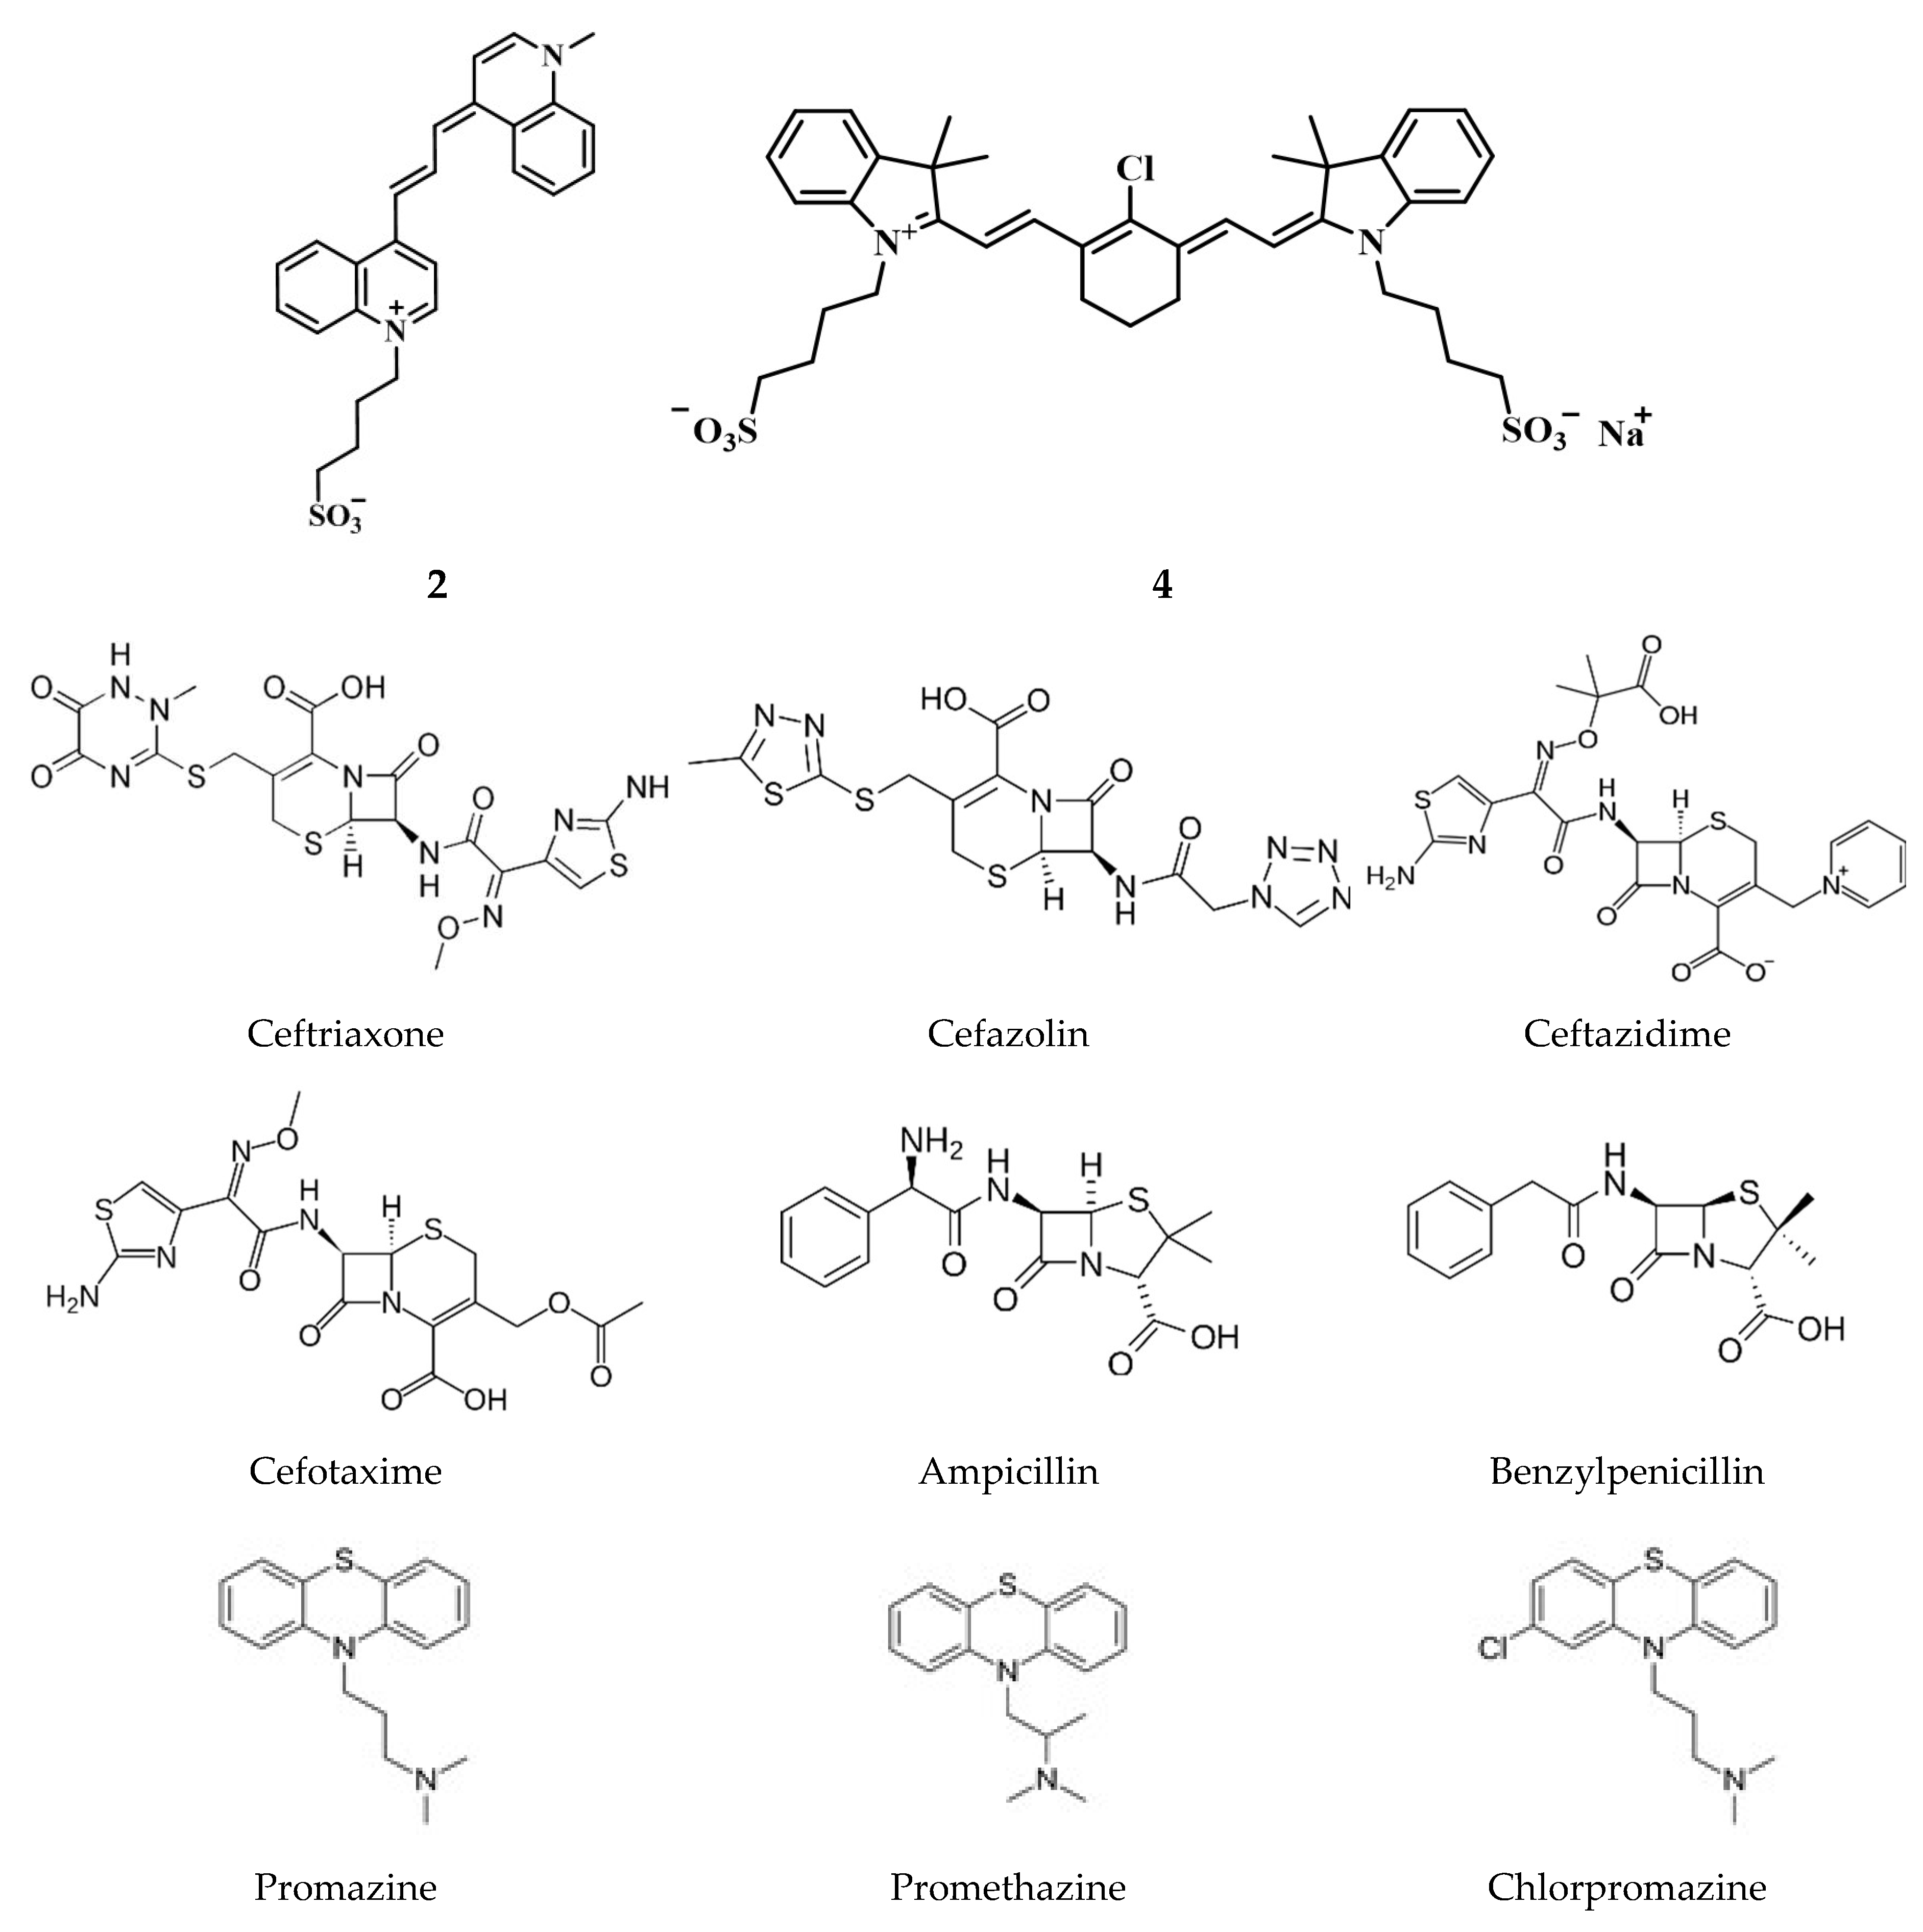
3.2. Discrimination of Nine Model Analytes in Water

Our purpose was to demonstrate the potential of the designed sensing platform by an example of discrimination of nine individual pharmaceutical compounds. The model analytes yielded different kinetic curves (Figure 2 and Figure 3), which allowed a possibility of their recognition by using colorimetry and fluorimetry. As a single reaction was found insufficient for the recognition/discrimination of all analytes, we combined the data for all five indicator reactions (four redox ones and an aggregation-based reaction) and subjected it to principal component analysis. All nine analytes were completely discriminated in the space of three principal components. In Figure 5 the results are shown in two sets of coordinates from which it can be noticed that compounds not discriminated in PC1–PC2 coordinates are all separated in PC1–PC3 coordinates, which implies a 100% accuracy of discrimination.
The amount of data used for discrimination was quite large, and it was advisable to reduce it by omitting some data columns. Before addressing this issue, it was necessary to select a criterion for evaluation of discrimination efficiency. Accuracy estimated as the ratio of unclassified samples to the total number of samples was not very informative, as it was equal to 100% in many cases (Table 2). A simple appropriate criterion can be the number of intersections of confidence ellipses in the scores plot CrN [61]. If two confidence ellipses crossed, this event was counted as an intersection. For example, the graph in PC2–PC1 coordinates (Figure 5) has two crossings (two pairs of ellipses are overlapped), while PC3–PC1 plot shows one crossing (one pair of ellipses is overlapped). If three neighboring ellipses intersected, it was considered as three intersections. Discrimination quality was considered higher for the scores plots with a lesser number of intersections. The discrimination efficiencies were characterized by ‘rating’ values that were obtained by the summation of CrN values for PC1–PC2 and PC1–PC3 plots (lower rating values implied better discrimination). All the results are summarized in Table 2.
Removing even a single column from the basic dataset impacts the discrimination efficiency (Table 2, line 2: removal of dye 1 oxidation data decreases rating from 3 to 6). Arbitrary removal of 2–6 columns related to one or two dyes (lines 3, 4, 6), or complete removal of a dye (line 5), reduce the discrimination quality considerably. Using only the visible data for two dyes provides poor discrimination (line 12, rating 11).
An attempt to reduce the number of columns by half (8 of 16) was undertaken by performing a visual inspection of the visible and NIR images and selecting the systems with greater visual differences between analytes. This selection of data columns shown in line 7 of Table 2 gave a fair rating of 4 (which is more favorable than for the lines 2–6 with larger numbers of columns, and which is close to the rating value of 3 of the basic dataset). To justify the intuitive data selection, we calculated the standard deviations of intensities for each of the columns of the standard dataset and selected eight columns with the highest values of standard deviations (Figure 6). A higher variability within the intensities along a data column (i.e., for one indicator reaction) only indicated that some analytes can be discriminated and did not bring about any information about the others. However, the standard deviations approach worked: the new selection of 8 data columns (line 8 in Table 2) ensured the same discrimination quality (rating 4) as the intuitively selected set of eight columns (line 7). The similar procedure but with relative standard deviations of intensities gave a slightly worse discrimination (line 9, rating 5). Notably, an attempt to arbitrarily replace only one of the columns in this selection (line 10) aggravates the discrimination (rating 7).
Further reduction of the dataset to six columns backed by the standard deviation approach gave a fair rating of six (line 11). With this six-column dataset, all model analytes were discriminated in the space of PC1–PC3 components, except one pair of analytes (chlorpromazine–promethazine).
Attempts to involve the data for additional reaction times not used in the basic data set were unsuccessful. For example, adding 17 columns to the basic data set pertaining to the same reactions at different times resulted in a poorer result compared to the basic set (line 13, rating 7).
Factor diagrams representing the correlations between variables and factors for the complete data set were also constructed (Figure S6) along with the loading plots. However, no relation was observed between the position of the indicator reaction in the factor diagram and its role in discrimination (Table 2).
Overall, the basic dataset provides optimum discrimination, though a proper data selection of indicator reactions allows reducing the set of columns at least twofold with a minimum loss in discrimination efficiency.

3.3. Discrimination of Nine Model Analytes in Turkey Meat Extract

Detecting pharmaceuticals in complex real-world samples such as turkey meat extract is a challenging task. The components of turkey extract were supposed to affect the detection. Our goal was to demonstrate the discriminating ability of the method in the presence of a complicated matrix.
Individual analytes were introduced into the indicator reactions similarly to the operations with aqueous solutions but with turkey meat extract added. The extract retarded the oxidation of the carbocyanines 3–10-fold, which could be a consequence of ethanol and biomolecules presence in the extract. However, for comparison, the reaction conditions were kept the same as in aqueous solution. The response times selected for data treatment were notably longer than in the work with the aqueous solution (Table 1).
Predictably, the discrimination quality was lower than in water: with the basic dataset (5 indicator reactions, 16 data columns) the rating value was equal to 13 with 4 and 10 intersections of ellipses in PC1–PC2 and PC1–PC3 graphs, respectively (Figure 7). Notwithstanding a great number of intersections in the planar graphs, only one pair of model analytes was not discriminated in the space of three principal components (promazine and chlorpromazine), and the accuracy was found to be 92%. Overall, the discrimination of the model analytes was still feasible, notwithstanding the matrix effect.

4. Conclusions

In this study, two principles were applied for the first time to develop an optical sensor array: a specific type of aggregation-based fluorescence amplification and catalytic oxidation of carbocyanine dyes. In combination with chemometrics it was possible to discriminate nine medicinal compounds with 100% accuracy in water and 92% in the presence of turkey meat extract, including closely related species belonging to one and the same class (cephalosporins, phenothiazines, or penicillins). These results confirm that the developed platform can be used as a powerful tool for the recognition of analytes of various nature. The designed sensing platform uses a simple protocol, does not involve biomolecules or complicated instrumentation. Photographic registration of the responses is more rapid than the spectral measurements using a fluorimeter and a spectrophotometer. The sensing systems are not specific to the particular compounds involved, which allows further broadening of the range of analytes by adjusting the nature of the dye, oxidizer, and metal ion catalyst.

Supplementary Materials

The following materials are available online at https://0-www-mdpi-com.brum.beds.ac.uk/article/10.3390/chemosensors10020088/s1: Protocols for the syntheses of dyes 2–4 and spectral data; Figure S1. Scheme of the NIR visualizer; Figure S2. Effect of pH on the NIR fluorescence and visible images in the presence of carbocyanine dyes 2 and 3 and three model analytes; Figure S3. Kinetic curves for the redox system dye 4 − H2O2 − Cu2+ with three selected analytes for pH 3.6–10.4; Figure S4. Effect of the concentration of hydrogen peroxide and CuSO4 on the NIR fluorescence intensity of the reaction products; Figure S5. Images used for the data treatment obtained with nine analytes after oxidation of dye 4; Figure S6. Loadings plot for the first three principal components for the basic data set and circular factor diagrams.

Author Contributions

Conceptualization, M.K.B.; Methodology, T.A.P. and M.K.B.; Investigation, A.V.S., I.A.S. and I.A.D.; Writing—original draft preparation, A.V.S.; Writing—review and editing, M.K.B.; Supervision, M.K.B.; Funding acquisition, M.K.B. All authors have read and agreed to the published version of the manuscript.

Funding

This research was supported by the Russian Science Foundation (grant no. 20-13-00330).

Acknowledgments

The authors thank E.V. Skorobogatov for his help with calculations.

Conflicts of Interest

The authors declare no conflict of interest. The funder had no role in the design of the study; in the collection, analyses, or interpretation of data; in the writing of the manuscript, or in the decision to publish the results.

References

  1. Fan, J.; Ding, L.; Fang, Y. Surfactant Aggregates Encapsulating and Modulating: An Effective Way to Generate Selective and Discriminative Fluorescent Sensors. Langmuir 2019, 35, 326–341. [Google Scholar] [CrossRef] [PubMed]
  2. Guo, C.; Sedgwick, A.C.; Hirao, T.; Sessler, J.L. Supramolecular Fluorescent Sensors: An Historical Overview and Update. Coord. Chem. Rev. 2021, 427, 213560. [Google Scholar] [CrossRef] [PubMed]
  3. Fukuhara, G. Analytical supramolecular chemistry: Colorimetric and fluorimetric chemosensors. J. Photochem. Photobiol. C 2020, 42, 100340. [Google Scholar] [CrossRef]
  4. Mancin, F.; Rampazzo, E.; Tecilla, P.; Tonellato, U. Self-assembled fluorescent chemosensors. Chem. Eur. J. 2006, 12, 1844–1854. [Google Scholar] [CrossRef] [PubMed]
  5. Rehm, T.H.; Schmuck, C. Ion-pair induced self-assembly in aqueous solvents. Chem. Soc. Rev. 2010, 39, 3597–3611. [Google Scholar] [CrossRef]
  6. Sabela, M.; Balme, S.; Bechelany, M.; Janot, J.-M.; Bisetty, K. A Review of Gold and Silver Nanoparticle-Based Colorimetric Sensing Assays. Adv. Eng. Mater. 2017, 12, 1700270. [Google Scholar] [CrossRef]
  7. Guo, Y.; Zhao, W. In Situ formed nanomaterials for colorimetric and fluorescent sensing. Coord. Chem. Rev. 2019, 387, 249–261. [Google Scholar] [CrossRef]
  8. Mauriz, E. Clinical Applications of Visual Plasmonic Colorimetric Sensing. Sensors 2020, 20, 6214. [Google Scholar] [CrossRef]
  9. Singh, R.; Thakur, P.; Thakur, A.; Kumar, H.; Chawla, P.; Rohit, J.V.; Kaushik, R.; Kumar, N. Colorimetric sensing approaches of surface-modified gold and silver nanoparticles for detection of residual pesticides: A review. Int. J. Env. Anal. Chem. 2021, 101, 1715382. [Google Scholar] [CrossRef]
  10. Olenin, A.Y. Chemically Modified Silver and Gold Nanoparticles in Spectrometric Analysis. J. Anal. Chem. 2019, 74, 355–375. [Google Scholar] [CrossRef]
  11. Demchenko, A.P. Introduction to Fluorescence Sensing; Springer: Cham, Switzerland, 2015. [Google Scholar]
  12. Pallavicini, P.; Diaz-Fernandez, Y.A.; Pasotti, L. Micelles as nanosized containers for the self-assembly of multicomponent fluorescent sensors. Coord. Chem. Rev. 2009, 253, 2226–2240. [Google Scholar] [CrossRef]
  13. Riis-Johannessen, T.; Severin, K. A Micelle-Based Chemosensing Ensemble for the Fluorimetric Detection of Chloride in Water. Chem. Eur. J. 2010, 16, 8291–8295. [Google Scholar] [CrossRef] [PubMed]
  14. Ghosh, A.K.; Samanta, A.; Bandyopadhyay, P. Cu2+-Induced Micellar Charge Selective Fluorescence Response of Acridine Orange: Effect of Micellar Charge, pH, and Mechanism. J. Phys. Chem. B 2011, 115, 11823–11830. [Google Scholar] [CrossRef] [PubMed]
  15. Köstereli, Z.; Scopelliti, R.; Severin, K. Pattern-based sensing of aminoglycosides with fluorescent amphiphiles. Chem. Sci. 2014, 5, 2456–2460. [Google Scholar] [CrossRef]
  16. Li, Y.; Zhou, H.; Chen, J.; Shahzad, S.A.; Yu, C. Controlled self-assembly of small molecule probes and the related applications in bioanalysis. Biosens. Bioelectron. 2016, 76, 38–53. [Google Scholar] [CrossRef] [PubMed]
  17. He, G.; Peng, H.; Liu, T.; Yang, M.; Zhang, Y.; Fang, Y. A novel picric acid film sensor via combination of the surface enrichment effect of chitosan films and the aggregation-induced emission effect of siloles. J. Mater. Chem. 2009, 19, 7347–7353. [Google Scholar] [CrossRef]
  18. Cao, J.; Ding, L.; Zhang, Y.; Wang, S.; Fang, Y. A ternary sensor system based on pyrene derivative-SDS assemblies-Cu2+ displaying dual responsive signals for fast detection of arginine and lysine in aqueous solution. J. Photochem. Photobiol. A 2016, 314, 66–74. [Google Scholar] [CrossRef]
  19. Zakharenkova, S.A.; Katkova, E.A.; Doroshenko, I.A.; Kriveleva, A.S.; Lebedeva, A.N.; Vidinchuk, T.A.; Shik, A.V.; Abramchuk, S.S.; Podrugina, T.A.; Beklemishev, M.K. Aggregation-based fluorescence amplification strategy: "turn-on" sensing of aminoglycosides using near-IR carbocyanine dyes and pre-micellar surfactants. Spectr. Acta A 2021, 247, 119109. [Google Scholar] [CrossRef]
  20. Gopika, G.S.; Prasad, P.H.; Lekshmi, A.G.; Lekshmypriya, S.; Sreesaila, S.; Arunima, C.; Kumar, M.S.; Anil, A.; Pillai, Z.S. Chemistry of cyanine dyes—A review. Mater. Today Proc. 2021, 46, 3102–3108. [Google Scholar] [CrossRef]
  21. Sun, W.; Guo, S.; Hu, C.; Fan, J.; Peng, X. Recent development of chemosensors based on cyanine platforms. Chem. Rev. 2016, 116, 7768–7817. [Google Scholar] [CrossRef]
  22. Chen, C.; Tian, R.; Zeng, Y.; Chu, C.; Liu, G. Activatable fluorescence probes for “turn-on” and ratiometric biosensing and bioimaging: From NIR-I to NIR-II. Bioconjugat. Chem. 2020, 31, 276–292. [Google Scholar] [CrossRef] [PubMed] [Green Version]
  23. Mottola, H.A.; Perez-Bendito, D. Kinetic determinations and some kinetic aspects of analytical chemistry. Anal. Chem. 1994, 66, 131–162. [Google Scholar] [CrossRef] [PubMed]
  24. Crouch, S.R.; Scheeline, A.; Kirkor, E.S. Kinetic determinations and some kinetic aspects of analytical chemistry. Anal. Chem. 2000, 72, 53–70. [Google Scholar] [CrossRef] [PubMed]
  25. Pérez Bendito, D.; Silva, M. Kinetic Methods in Analytical Chemistry; Ellis Horwood Ltd.: Chichester, UK, 1988; ISBN 9780470211816. [Google Scholar]
  26. Ye, M.L.; Zhu, Y.; Lu, Y.; Gan, L.; Zhang, Y.; Zhao, Y.G. Magnetic nanomaterials with unique nanozymes-like characteristics for colorimetric sensors: A review. Talanta 2021, 230, 122299. [Google Scholar] [CrossRef]
  27. Li, J.; Yu, C.; Wu, Y.-N.; Zhu, Y.; Xu, J.; Wang, Y.; Wang, H.; Guo, M.; Li, F. Novel sensing platform based on gold nanoparticle-aptamer and Fe-metal-organic framework for multiple antibiotic detection and signal amplification. Environ. Int. 2019, 125, 135–141. [Google Scholar] [CrossRef] [PubMed]
  28. Li, Z.; Suslick, K.S. The optoelectronic nose. Acc. Chem. Res. 2020, 54, 950–960. [Google Scholar] [CrossRef]
  29. Dolmanova, I.F.; Peshkova, V.M. Determination of copper traces using the catalytic oxidation of hydroquinone with hydrogen peroxide in the presence of pyridine. Zh. Anal. Khim. 1964, 19, 297–302. [Google Scholar]
  30. Beklemishev, M.K.; Petrova, Y.Y.; Dolmanova, I.F. Sorption-Catalytic Determination of Imazapyr on a Copper-Containing Sorbent. Microchim. Acta 2001, 136, 35–41. [Google Scholar] [CrossRef]
  31. Stepanova, I.A.; Lebedeva, A.N.; Shik, A.V.; Skorobogatov, E.V.; Beklemishev, M.K. Recognition and Determination of Sulfonamides by Near-IR Fluorimetry Using Their Effect on the Rate of the Catalytic Oxidation of a Carbocyanine Dye by Hydrogen Peroxide. J. Analyt. Chem. 2021, 76, 1397–1405. [Google Scholar] [CrossRef]
  32. Abedalwafa, M.A.; Li, Y.; Ni, C.; Wang, L. Colorimetric sensor arrays for the detection and identification of antibiotics. Anal. Meth. 2019, 11, 2836–2854. [Google Scholar] [CrossRef]
  33. Melikishvili, S.; Piovarci, I.; Hianik, T. Advances in colorimetric assay based on AuNPs modified by proteins and nucleic acid aptamers. Chemosensors 2021, 9, 281. [Google Scholar] [CrossRef]
  34. Monogarova, O.V.; Chaplenko, A.A.; Oskolok, K.V. Multisensory digital colorimetry to identify and determination of active substances in drugs. Sens. Actuat. B 2019, 299, 126909. [Google Scholar] [CrossRef]
  35. Shayesteh, O.H.; Ghavami, R. Two colorimetric ampicillin sensing schemes based on the interaction of aptamers with gold nanoparticles. Microchim. Acta 2019, 186, 485. [Google Scholar] [CrossRef] [PubMed]
  36. Lin, J.; Shi, A.; Zheng, Z.; Huang, L.; Wang, Y.; Lin, H.; Lin, X. Simultaneous Quantification of Ampicillin and Kanamycin in Water Samples Based on Lateral Flow Aptasensor Strip with an Internal Line. Molecules 2021, 26, 3806. [Google Scholar] [CrossRef]
  37. Aghamirzaei, M.; Khiabani, M.S.; Hamishehkar, H.; Mokarram, R.R.; Amjadi, M. Plasmonic Sensor for Detection of β-Lactam Antibiotics based on the Conjugated Antibody with Gold Nanoparticles. J. Appl. Spectrosc. 2021, 88, 233–241. [Google Scholar] [CrossRef]
  38. Fu, Y.; Zhao, S.; Wu, S.; Huang, L.; Xu, T.; Xing, X.; Lan, M.; Song, X. A carbon dots-based fluorescent probe for turn-on sensing of ampicillin. Dyes Pigm. 2020, 172, 107846. [Google Scholar] [CrossRef]
  39. Esmaelpourfarkhani, M.; Abnous, K.; Taghdisi, S.M.; Chamsaz, M. A novel turn-off fluorescent aptasensor for ampicillin detection based on perylenetetracarboxylic acid diimide and gold nanoparticles. Biosens. Bioelectron. 2020, 164, 112329. [Google Scholar] [CrossRef]
  40. Lin, H.; Fang, F.; Zang, J.; Su, J.; Tian, Q.; Kumar Kankala, R.; Lin, X. A Fluorescent Sensor-Assisted Paper-Based Competitive Lateral Flow Immunoassay for the Rapid and Sensitive Detection of Ampicillin in Hospital Wastewater. Micromachines 2020, 11, 431. [Google Scholar] [CrossRef] [Green Version]
  41. Pennacchio, A.; Varriale, A.; Esposito, M.G.; Scala, A.; Marzullo, V.M.; Staiano, M.; D’Auria, S. A Rapid and Sensitive Assay for the Detection of Benzylpenicillin (PenG) in Milk. PLoS ONE 2015, 10, e0132396. [Google Scholar] [CrossRef]
  42. Salem, H.; Samir, E. Determination of cefotaxime, cefoperazone, ceftazidime and cefadroxil using surface plasmon resonance band of silver nanoparticles. Braz. J. Pharm. Sci. 2018, 54. [Google Scholar] [CrossRef]
  43. Ali, R.; Ali, H.R.H.; Batakoushy, H.A.; Derayea, S.M.; Elsutohy, M.M. A reductant colorimetric method for the rapid detection of certain cephalosporins via the production of gold and silver nanoparticles. Microchem. J. 2019, 146, 864–871. [Google Scholar] [CrossRef]
  44. Pourreza, N.; Ghomi, M. A network composed of gold nanoparticles and a poly(vinyl alcohol) hydrogel for colorimetric determination of ceftriaxone. Microchim. Acta 2020, 187, 133. [Google Scholar] [CrossRef] [PubMed]
  45. Liu, W.; Qu, X.; Zhu, C.; Gao, Y.; Mao, C.; Song, J.; Niu, H. A two-dimensional zinc(II)-based metal-organic framework for fluorometric determination of ascorbic acid, chloramphenicol and ceftriaxone. Microchim. Acta 2020, 187, 136. [Google Scholar] [CrossRef] [PubMed]
  46. Douglass, P.M.; Salins, L.L.E.; Dikici, E.; Daunert, S. Class-Selective Drug Detection:  Fluorescently-Labeled Calmodulin as the Biorecognition Element for Phenothiazines and Tricyclic Antidepressants. Bioconjugate Chem. 2002, 13, 1186–1192. [Google Scholar] [CrossRef] [PubMed]
  47. Gurka, D.F.; Kolinski, R.E.; Myrick, J.W.; Wells, C.E. Scope of differential UV and differential fluorescence assays for phenothiazines: Comparison with official methods. J. Pharm. Sci. 1980, 69, 1069–1074. [Google Scholar] [CrossRef]
  48. Xia, W.Q.; Zhang, H.C.; Wang, G.N.; Liu, J.; Wang, J.P. A molecularly imprinted polymer based chemiluminescence array sensor for one-step determination of phenothiazines and benzodiazepines in pig urine. Luminescence 2019, 34, 98–105. [Google Scholar] [CrossRef]
  49. Jarangdet, T.; Pratumyot, K.; Srikittiwanna, K.; Dungchai, W.; Mingvanish, W.; Techakriengkrai, I.; Sukwattanasinitt, M.; Niamnont, N. A fluorometric paper-based sensor array for the discrimination of volatile organic compounds (VOCs) with novel salicylidene derivatives. Dyes Pigm. 2018, 159, 378–383. [Google Scholar] [CrossRef]
  50. Divyanin, N.N.; Rukosueva, E.A.; Garmash, A.V.; Beklemishev, M.K. Recognition of Model Analyte Mixtures in the Presence of Blood Plasma Using a Mixture of Fluorophores (“Fluorescent Tongue”). J. Analyt. Chem. 2018, 73, 1195–1201. [Google Scholar] [CrossRef]
  51. Gao, Y.; Gao, F.; Zhang, G.; Chen, L.; Wu, Q.; Liu, X. Sensor array based on single carbon quantum dot for fluorometric differentiation of all natural amino acids. Microchim. Acta 2019, 186, 858. [Google Scholar] [CrossRef]
  52. Han, J.; Wang, B.; Bender, M.; Kushida, S.; Seehafer, K.; Bunz, U.H.F. Poly (aryleneethynylene) tongue that identifies nonsteroidal anti-inflammatory drugs in water: A test case for combating counterfeit drugs. ACS Appl. Mater. Interfaces 2017, 9, 790–797. [Google Scholar] [CrossRef]
  53. Wang, B.; Han, J.; Ma, C.; Bender, M.; Seehafer, K.; Herrmann, A.; Bunz, U.H.F. A Simple Optoelectronic Tongue Discriminates Amino Acids. Chem. Eur. J. 2017, 23, 12471–12474. [Google Scholar] [CrossRef]
  54. Wang, B.; Han, J.; Bender, M.; Seehafer, K.; Bunz, U.H.F. Array-Based Sensing of Explosives by Water-Soluble Poly(p-phenyleneethynylene)s. Macromolecules 2017, 50, 4126–4131. [Google Scholar] [CrossRef]
  55. Bojanowski, N.M.; Bender, M.; Seehafer, K.; Bunz, U.H.F. Discrimination of Saccharides by a Simple Array. Chem. Eur. J. 2017, 23, 12253–12258. [Google Scholar] [CrossRef] [PubMed] [Green Version]
  56. Han, J.; Wang, B.; Bender, M.; Pfisterer, J.; Huang, W.; Seehafer, K.; Yazdani, M.; Rotello, V.M.; Rotello, C.M.; Bunz, U.H.F. Fingerprinting antibiotics with PAE-based fluorescent sensor arrays. Polymer Chem. 2017, 8, 2723–2732. [Google Scholar] [CrossRef] [PubMed] [Green Version]
  57. Demarco, P.V.; Nagarajan, R. Physico-chemical properties of cephalosporins and penicillins. In Cephalosporins and Penicillins. Chemistry and Biology; Flynn, E.H., Ed.; Academic Press: Cambridge, MA, USA, 1972; p. 315. ISBN 9781483270173. [Google Scholar]
  58. Perez-Inestrosa, E.; Suau, R.; Montañez, M.I.; Rodriguez, R.; Mayorga, C.; Torres, M.J.; Blanca, M. Cephalosporin chemical reactivity and its immunological implications. Curr. Opin. Allergy Clin. Immunol. 2005, 5, 323–330. [Google Scholar] [CrossRef] [PubMed]
  59. Kojlo, A.; Karpinska, J.; Kuzmicka, L.; Misiuk, W.; Puzanowska-Tarasiewicz, H.; Tarasiewicz, M. Analytical study of the reaction of phenothiazines with some oxidants, metal ions, and organic substances (review article). J. Trace Microprobe Tech. 2001, 19, 45–70. [Google Scholar] [CrossRef]
  60. Narayanan, N.; Patonay, G. A New Method for the Synthesis of Heptamethine Cyanine Dyes: Synthesis of New Near-Infrared Fluorescent Labels. J. Org. Chem. 1995, 60, 2391–2395. [Google Scholar] [CrossRef]
  61. Rukosueva, E.A.; Belikova, V.A.; Krylov, I.N.; Orekhov, V.S.; Skorobogatov, E.V.; Garmash, A.V.; Beklemishev, M.K. Evaluation of Discrimination Performance in Case for Multiple Non-Discriminated Samples: Classification of Honeys by Fluorescent Fingerprinting. Sensors 2020, 20, 5351. [Google Scholar] [CrossRef]
Scheme 1. Sensing principles. The effect of the analyte can have different sign (increase or decrease of the signal).
Chemosensors 10 00088 sch001
Scheme 2. Chemical structure of dyes 14 used in this study, and the chemical structure of nine pharmaceutical compounds used as analytes.
Chemosensors 10 00088 sch002aChemosensors 10 00088 sch002b
Scheme 3. Synthetic routes for dyes 2 and 3.
Chemosensors 10 00088 sch003
Figure 1. Effects of aggregation: absorbance spectrum change (a) and near-IR fluorescence enhancement (b) of dye 1 in the presence of cefazolin and CTAB; (c): images of the wells with varying concentration of CTAB for three analytes (0.5 mM analyte, 0.1 mM CTAB, 2.5 mg/L dye 1, pH 7.4).
Chemosensors 10 00088 g001
Figure 2. Effects of analytes in the oxidation of dyes with H2O2/Cu2+ system: absorbance spectra of dye 1 and its oxidation products in the presence of benzylpenicillin (a,b); dye 2 oxidation in the presence of chlorpromazine as observed in NIR (c,d) and visible spectra (e,f).
Chemosensors 10 00088 g002
Figure 3. Kinetic curves of NIR fluorescence intensity of the dye 3 (obtained from NIR images) as a function of time for three model analytes (chlorpromazine, cefazolin, benzylpenicillin) and a blank experiment. Visual images of the four wells containing the analytes at times 0, 1, and 5 min are also shown. Conditions: phosphate buffer (pH 7.4), 0.5 mM analyte, 0.1 mM CTAB, 0.01 g/L dye 3, 0.1 M H2O2, 0.1 mM Cu2+.
Chemosensors 10 00088 g003
Figure 4. Near-IR fluorescence (left) and visible (right) images of a portion of a 96-well plate with the reacting system dye 2 − H2O2 − Cu(2+) at 2 min (NIR) and 5 min (vis) after the reaction start. Without analyte (1st column) and with analytes: 2—promethazine, 3—promazine, 4—chlorpromazine, 5—ceftriaxone, 6—cefazolin, 7—ceftazidime, 8—cefotaxime, 9—benzylpenicillin, 10—ampicillin. All experiments in the column are parallel runs. Conditions: 30 μL each of the following: 0.067 M phosphate buffer (pH 7.4), 1 mM CTAB, 5 mM model analyte, 0.1 g/L dye 3, 1 M H2O2, and 0.1 mM CuSO4; 120 μL of water.
Chemosensors 10 00088 g004
Figure 5. Score plots obtained with the basic dataset in the coordinates of first and second (top) and first and third (bottom) principal components.
Chemosensors 10 00088 g005
Figure 6. (a): Intensities of parallel runs with nine analytes for the selected indicator reactions of dyes 14 (shown in the legend). Only four analytes are made visible in the x-axis title to save space; (b): standard deviations of intensities for each column of the basic data set. The columns with higher ST DEV values selected for PCA treatment are framed.
Chemosensors 10 00088 g006
Figure 7. Score plots in PC1–PC2 and PC1–PC3 coordinates obtained with the basic dataset for the indicator reactions conducted in the presence of turkey meat extract.
Chemosensors 10 00088 g007
Table 1. Indicator reactions used in the discrimination studies and the details of photographic registration of the signal.
Dye11234
Indicator reaction typeAggregationOxidationOxidationOxidationOxidation
Type of photography *NIRNIRNIR and visNIR and visNIR and vis
RGB splitting of imagesNoNoYesYesNo
Total number of data columns **11662
Time of signal measurement after reaction start, min– ***62 (NIR),
5 (vis)
2 (NIR),
5 (vis)
4 (NIR),
4 (vis)
The same in the presence of turkey extract, min– ***5036 (NIR),
19 (vis)
11 (NIR),
10 (vis)
58 (NIR),
33 (vis)
* NIR: fluorescence photographs of the plates in the near-IR region were obtained in the visualizer, vis: photographs were taken under visible light by a smartphone camera. ** A column of data contains four or five parallel runs with each of the nine analytes and a blank, 40–50 values in all. *** The signal does not depend on time and was measured immediately after mixing the reactants.
Table 2. Discrimination efficiency of nine analytes represented as the number of intersections of confidence ellipses CrN and total rating for various data sets treated by PCA.
No.Description of the Data SetTotal Number of Data ColumnsData Columns Used for PCA TreatmentCrossing Number of Ellipses CrN for the PlotRatingAccuracy, & %
Dye 1Dye 2, NIR *Dye 2, vis *Dye 3, NIRDye 3, visDye 4
redoxaggr.RGBvisRvisGvisBRGBvisRvisGvisBNIRvisPC1-PC2PC1-PC3
1Basic set16++++++++++++++++213100
2Oxidation of dye 1 removed15+++++++++++++++24695
3Dyes 1 and 4 oxidation removed13+++++++++++++246100
4Dye 3 (NIR), dye 4 (vis) removed12++++++++++++235100
5Dye 3 completely removed10++++++++++44897.5
6Dyes 2 and 3 (part of channels) removed10++++++++++325100
78 col. selected based on visual inspection8++++++++13495
88 columns selected by ST DEV ** (Figure 6)8++++++++134100
98 columns selected by RSD **8++++++++32597.5
10Same as line 7, one column changed8++++++++25797.5
116 columns selected by ST DEV **6++++++33695
12Only dyes 2 and 3, visible photographs6++++++471185
13Basic set + additional points in kinetic curves33++++++++++++++++347100
Notes. A plus (+) denotes the column used for treatment, a minus (−) means the column was not used. * Denotes oxidation of dye 2 with H2O2, NIR: photographs of the plate for near-IR emission, vis: photographs in visible light; RGB splitting; columns contain R, G, or B channel data, 9 analytes + blank × 4 parallel runs = 40 values in column. ** For each column of the basic data set, the standard deviation (lines 8, 11) or relative standard deviation (line 9) was calculated. The 8 (or 6) columns with maximum standard deviations between the values were selected for PCA treatment. & For 97.5% accuracy, one data point was non-classified (belonged to more than one confidence ellipse) in the space of PC1–PC2 and PC1–PC3. For 95%, 2 points were non-classified, and for 85%, 6 points.
Publisher’s Note: MDPI stays neutral with regard to jurisdictional claims in published maps and institutional affiliations.

