1. Introduction
Grape (
Vitis vinifera L.) vines are bush-type plants of the Vitaceae family which represent a major world fruit crop, totaling > 80 million metric tons in annual production worldwide, and are sold as raw fruits, fruit juice, and processed wines [
1]. Thousands of grape cultivars are available throughout the world. The fruits can be found in a variety of colors ranging from red, yellow, and green to almost black. Grape vines grow best in regions where maximum daily temperatures do not exceed 40 °C and minimum daily temperatures do not fall below 15 °C. In Europe, the main producers of grapes are Italy, France, and Spain, with EU-member countries accounting for 65% of global production over the past 7 years [
1]. The economic and social significance of the grape and wine industries have encouraged the development of innovative technologies for real-time monitoring of vineyards to improve fruit and vine quality. The quality and prices of wines produced from grapes largely depend on grape cultivar, soil and climate types, and effective cultivation methods [
2]. Consequently, there is increasing demand to develop precise methods for identification and authentication of grape cultivars, particularly vine cuttings for sale to vineyards, detection of prohibited species or cultivars in certain areas, or for estimation of cultivar market prices in different production regions [
2].
Conventional cultivar identification by analysis of leaf samples often involves destructive sampling, followed by physical, physiological, or biochemical measurements, and genomic sequencing [
3]. One common technique used for differentiating grape cultivars relies on detecting morphological differences between cultivars. This method requires a great degree of expertise, as do chemical and molecular methods based on isoenzyme or DNA analysis. Chemical methods are also time-consuming and ineffective for rapid identification of grape cultivars [
1]. The development of environmentally friendly (solvent-free) automated methods for rapid identification of grape cultivars is crucial in grape industries including vineyards, nurseries, and suppliers of grape products.
Recognition of grape cultivars before fruit growth would be an effective improvement. One potential means of identifying grape cultivars noninvasively is to use electronic devices. An electronic nose (e-nose) is a digital electronic device currently capable of identifying, characterizing, and grading post-harvest fruits and vegetables by their volatile aromas. This can be performed quickly and continuously by analysis of complex mixtures of volatiles, or volatile organic compounds (VOCs) in fruit emissions without the need to identify individual compounds present in the fruit aroma [
4,
5]. Early electronic nose devices were designed to mimic a mammalian olfactory system using metal oxide gas sensors. The sensor arrays had relatively poor specificity but resulted in an experimental instrument that could discriminate between some odors or aromas from organic sources with good reproducibility [
6]. The electronic nose contains a multisensor array that measures all VOCs in the aroma mixture simultaneously (as a collective sample) and generates electronic output signals proportional to the types of volatile gases present. In this way, the device output is an aroma signature that can be employed to identify and classify specific fruit cultivars [
7]. Electronic noses are highly suitable for detecting and analyzing a wide range of VOCs from different chemical classes and are used extensively to identify and classify foods and many types of agricultural products [
8,
9,
10]. E-nose devices have also been used in many other industries for a wide range of applications, including food quality and safety [
11,
12], disease detection and diagnosis [
13], biomedical applications [
14,
15], human health [
13], and environmental protection [
16].
Several techniques are applied to classify e-nose output data derived from aroma emission analyses. Principal component analysis (PCA) is the most common statistical technique utilized for analyzing electronic-nose data. PCA can reduce high-dimensional data to greatly simplify the analysis. Each principal component is orthogonal to other components and contains portions of the variance in the dataset. While PCA is useful for reducing data size, it does not cover the requirements for classifying data. Therefore, methods such as support vector machines (SVMs) and artificial neural networks (ANNs), operating similarly to biological neurons in the mammalian brain, are employed to facilitate aroma classifications [
17]. An SVM finds the best classification model for data separation [
18,
19]. Artificial neural networks similarly look for differences between aroma signatures of different sample types (aroma classes) to classify e-nose aroma data [
20,
21].
Machine learning (ML) has recently been used in some industries, including food and agricultural production [
22,
23]. It can effectively help with the rapid prediction and evaluation of food product quality. However, a common problem associated with the use of ML is overfitting of models because data generalization is not easily achieved. This usually occurs in noisy datasets with many selected neurons, which offer high accuracy but poor performance. Among the supervised ML algorithms, ANNs are the strongest type due to their nonlinearity and proper capacity to find patterns among inputs and targets.
Increasing interest in uses of portable e-nose devices for agricultural product identification, classification, and authentication has supported incentives to further develop these instruments for important practical applications. Our aim was to develop an e-nose system with associated statistical methods capable of discriminating between different grape cultivars as a means for certifying and authenticating individual cultivars as rootstocks for commercial sale. This application is primarily focused on markets within the grape nursery industry. The specific purposes of this study were to (1) evaluate the capability of an experimental MOS e-nose to identify differences between five grape cultivars based on whole-leaf VOC emissions, and (2) to further evaluate the accuracy of grape cultivar classifications and identifications using five chemometric methods including PCA, LDA, QDA, SVM, and ANN.
2. Materials and Methods
2.1. Sample Preparation
The leaves of five grape cultivars were provided from grape vineyards in the summer near Bonab City in West Azerbaijan Province of northwestern Iran. These five cultivars included: ‘Join’, ‘Rasmi’, ‘Askari’ (Vitis), ‘Tokilgan’, and ‘Keshmeshi’ (Sultana). After preparing fresh leaves (by removing any free moisture) of different grape cultivars, approximately 2.0 g of each whole-leaf sample was randomly picked from each grape cultivar within a vineyard (containing more than 50 grape vines), placed in separate 240 cc capped rectangular sampling containers for 120 min at 30 °C to build sufficient, previously determined headspace volatiles with unknown VOCs derived from grape leaves. Twenty 2.0 g leaf samples (40.0 g total) were analyzed for each of the five grape cultivars (treatments) within a short time after field collection. Room humidity was maintained at a constant level for all experiments and sensor baseline was adjusted periodically as needed to correct for sensor drift. Volatile emissions within sample containers were then analyzed with the e-nose sensor array via data collection using machine olfaction, but individual VOCs were not identified by chemical-analysis methods such as gas chromatograph-mass spectrometry (GS-MS).
2.2. Data Collection with Machine Olfaction
An experimental olfactory machine (MAU-9 electronic-nose system) equipped with nine metal oxide sensors (MOS) was used for all experiments. The names of the sensors (in order, with primary VOCs detected) are as follows: TGS2620 (alcohols, organic solvents), TGS813 (aliphatic alkanes), TGS822 (organic solvents), MQ3 (alcohols), MQ4 (urban gases and methane), MQ9 (carbon monoxide and combustible gases), MQ135 (ammonia, benzene, sulfides), MQ8 (hydrogen), and MQ136 (sulfur dioxide). This device was developed and assembled by the Department of Biosystems Engineering of Mohaghegh Ardabili University, Ardabil, Iran, as described in detail previously [
20,
24]. Outputs from the sensor array were assembled to create an aroma smellprint profile of grape leaf volatiles from samples of individual grape cultivars. The performance of the MAU-9 e-nose was evaluated previously for discrimination of volatiles from other plant sample types [
20]. More information about the device can be found in Rasekh et al. [
24]. The detection parameters set by the initial experiments were as follows. Sensor array flush and purge time between samples was 100 s to prevent volatile carryover. At this initial stage, air flow was initiated by a diaphragm pump which passed through a filter equipped with activated carbon to remove VOCs from the purged air. Then clean, purged air was injected into the sensor chamber to remove any volatiles attached to the sensor surfaces. The data sampling total measurement time was 100 s with a total cycle run time of 300 s. During instrument sampling, the pump moved sample air (containing grape leaf volatiles) from the 240 cm
3 sample chamber into the 1414 cm
3 sensor chamber. The flow rate of the sample gas to the sensor array chamber was set at 200 mL/min. Data responses from the sensor array were instantly collected at a rate of once/s during the analysis phase. At the end of sample data collection from the sensor array, clean air was pumped back into the sample gas path for 100 s to clean and purge the gas sensors before subsequent sample analysis. Fifteen replicate leaf samples of each grape cultivar were analyzed for the experiments. The output voltage of the sensors changed due to exposure to the gases emitted from the sample (grape leaf aroma volatiles) and sensor responses were collected and recorded on data collection cards. The sensor signals from all sensors were recorded and stored at 1-s intervals. To maintain e-nose stability, e-nose detection was maintained for all samples at 25 ± 1 °C.
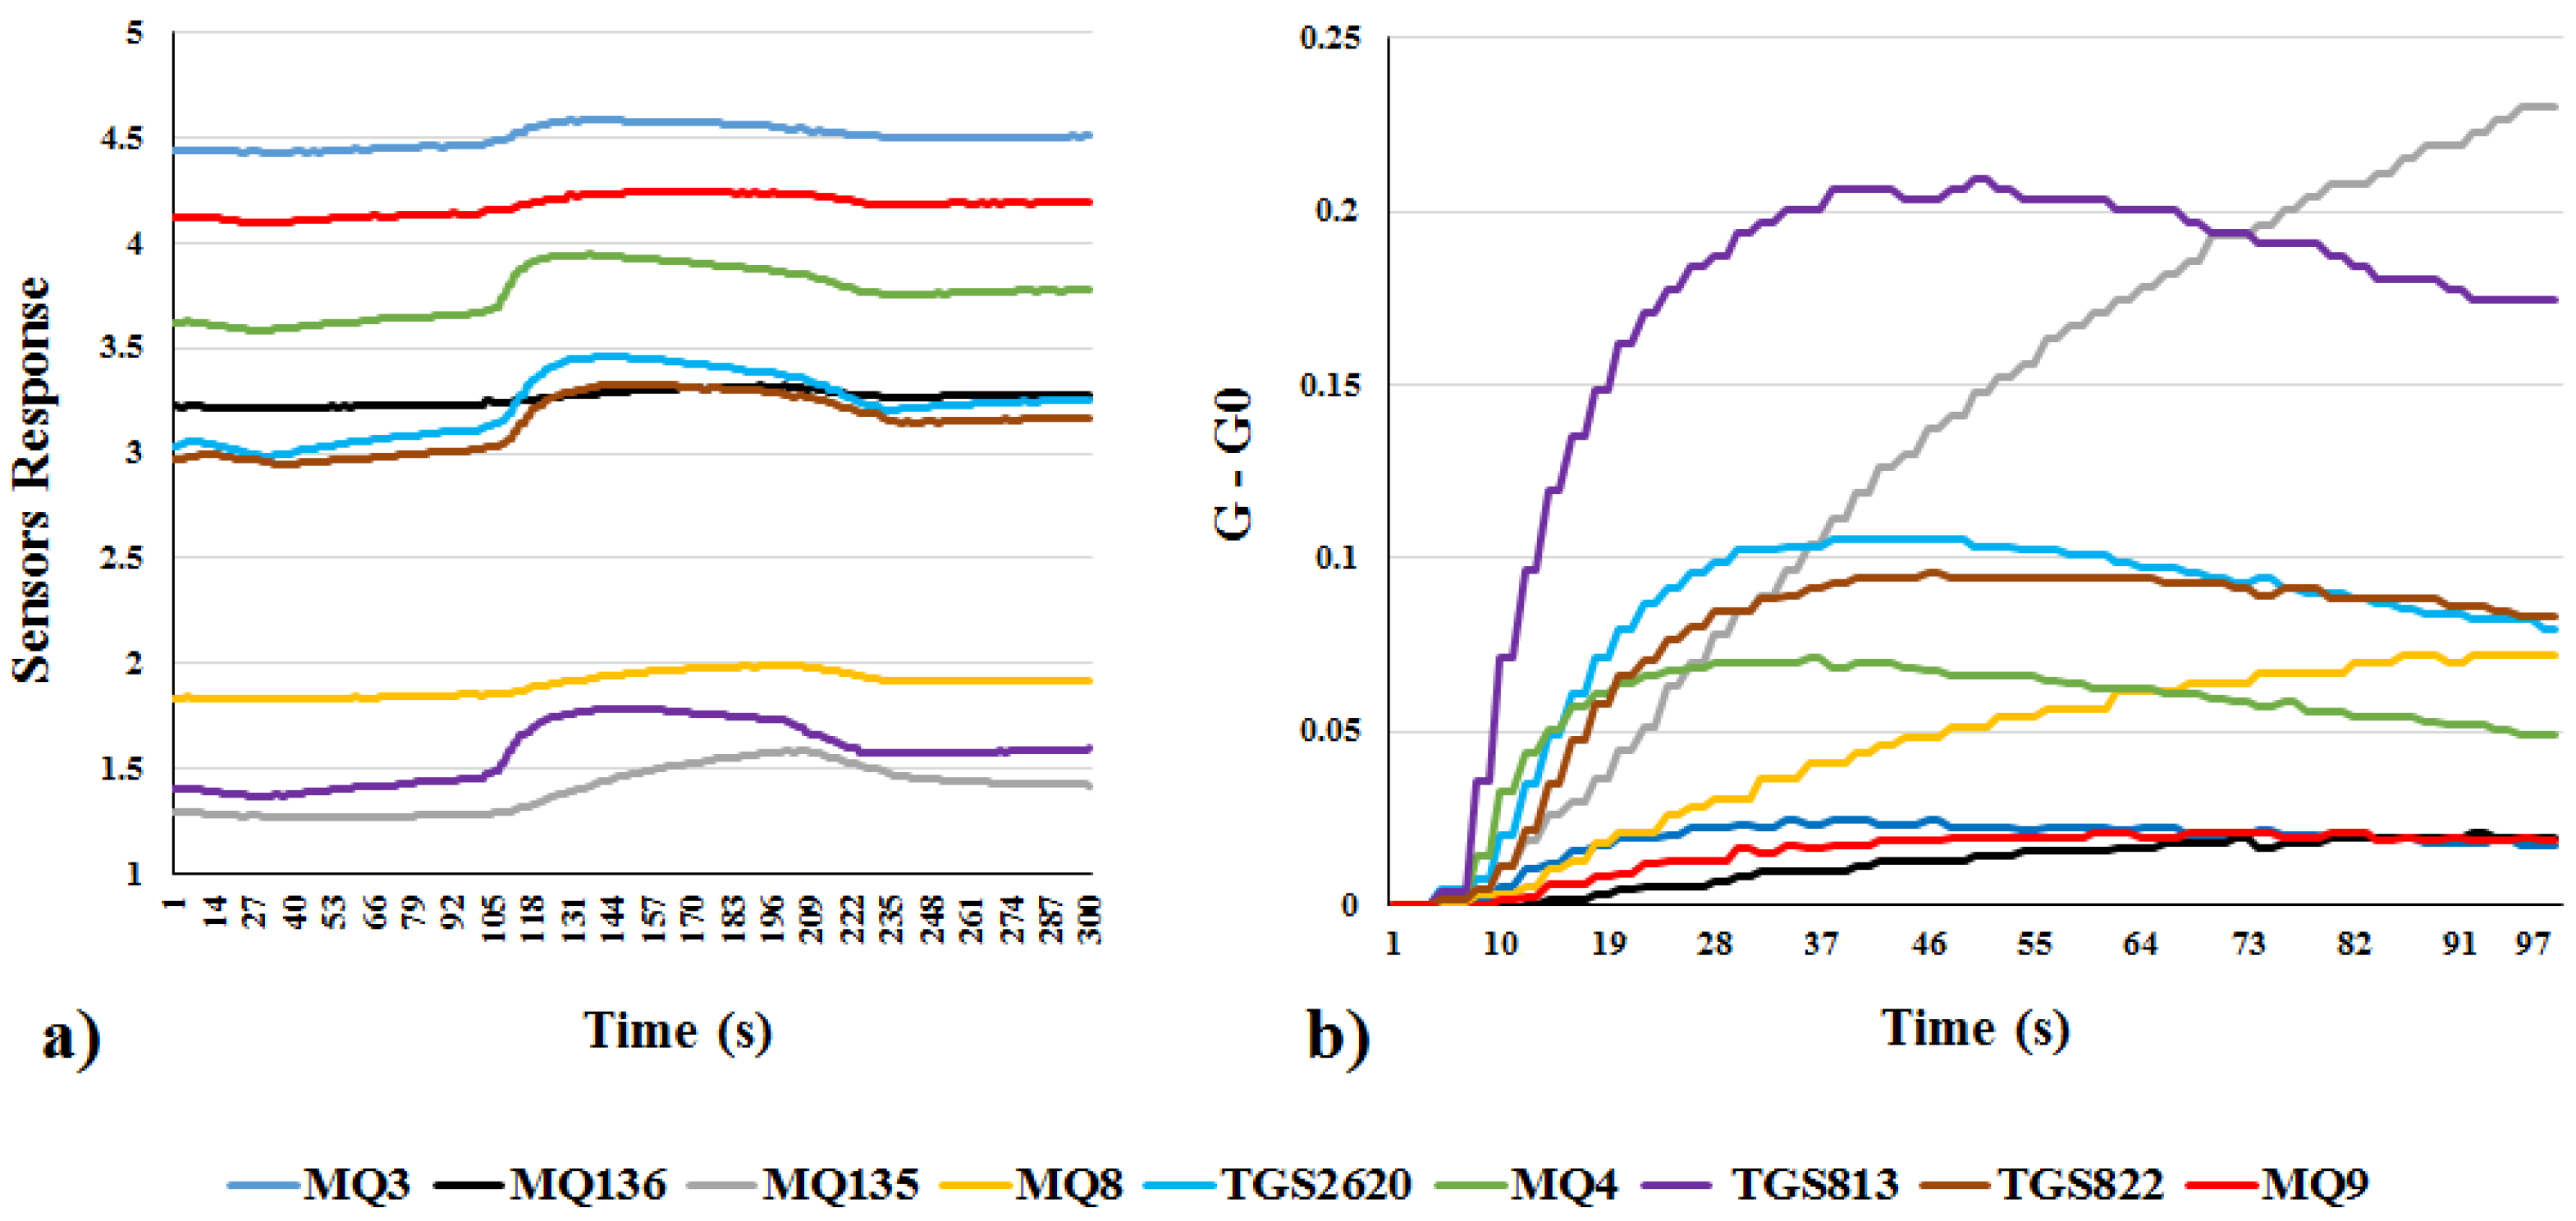
Sensor response signals for the e-nose were expressed as a conductivity ratio, symbolized as (G-G0) on the y-axis of the sensor array output. G refers to the conductivity of the sensor upon exposure to the target gas sensor whereas G0 signifies the conductivity of the gas sensor when exposed to the cleaning air. In this study, the mean value of the relatively stable phase of the response curve was extracted from each e-nose sensor within the sensor array.
2.3. Analysis by Chemometric Methods
The dataset from each sample analysis included preprocessed signals collected from 9 MOS gas sensors of the electronic nose. Principal component analysis (PCA) was used as an unsupervised pattern recognition method to reduce the dimensions of the experimental data. PCA allows an initial assessment of e-nose capability to be used as an unsupervised classification model for grape leaf samples. E-nose performance was further evaluated for grape cultivar detection and classification using the four supervised statistical methods of LDA, QDA, SVM, and ANN.
LDA is a supervised learning method used for finding a linear combination of specified properties for the proper separation of two or more object classes [
24]. This is an effective method for qualitative analysis and is widely employed for distinguishing samples from different geographical areas [
25].
SVM is a supervised learning and classification algorithm based on statistical theory [
26]. An SVM can nonlinearly plot input data, not linearly separable in low-dimensional space, into high-dimensional space using a kernel function. A hyperplane is built in high-dimensional space to maximize the margin between two classes and classify data in high-dimensional space. The most common kernel function is the radial basis function (RBF), which has high classification performance [
27]. As SVM minimizes structural risk, it is considered a proper classifier for nonlinear data and smaller sample sizes.
The normalized response of each MOS e-nose output data was employed to classify grape cultivars using machine learning models based on ANN to establish a pattern recognition model which classified grape cultivars based on VOC emissions from leaves.
The ANN method utilizes a set of connected nodes called artificial neurons. ANN architectures possess several hyper-parameters including hidden layers, connection and activation functions. In this present study, 9 neurons were considered for the input layer based on nine sensors. Because this method was intended to classify five grape cultivars, 5 neurons were considered for the output layer. The majority, or 60% of the total data were randomly selected for training while the remaining 40% were used for testing and validation.
2.4. Model Evaluation Criteria
The confusion matrix is a table that evaluates the performance of a classification model based on a set of experimental data with known true values. The following definitions are provided for this study: true positive (TP), true negative (TN), false positive (FP), and false negative (FN).
The performance of each classification model in this study was described by analyzing accuracy, precision, sensitivity, specificity, area under the curve (AUC), and F values for binary classification with ’positive’ and ’negative’ labels. Accuracy measures how a model correctly identifies and meets a given condition. Accuracy is the ratio of correct predictions (both
TP and
TN) to the total number of investigated cases and can be calculated by Equation (1):
Sensitivity (also known as recall) is the true positive rate that evaluates the test performance in detecting grape cultivars. It is a positive probability that a real positive is tested and is calculated as presented in Equation (2).
Specificity, also called real negative rate (RNR), estimates how the test can correctly identify wrong numbers. It is calculated as the number of correct negative predictions divided by the total number of negatives according to Equation (3).
Other parameters of precision, AUC, and F were calculated from Equations (4)–(6):
Receiver Operating Characteristic (ROC) and Area under the ROC Curve (AUC)
The ROC curve is a graph that shows the performance of a classification model at all classification thresholds. This curve plots two parameters: true positive rate (TPR) and false positive rate (FPR), where Specificity FPR = −1. The AUC measures the entire two-dimensional region below the total ROC curve from (0, 0) to (1, 1). A model with 100% correct predictions has an AUC of 1.0 while the AUC of a model with 100% incorrect predictions is 0.0. For AUC ≤ 0.5, the classifier fails to distinguish between positive or negative classes. Thus, the AUC ranges of 0.9–1.0, 0.8–0.9, 0.7–0.8, and 0.6–0.7 imply excellent, good, weak, and bad classification accuracies, respectively [
28].
2.5. Software
Matlab® (vers. 2014a) software (Mathworks, Inc., Natick, MA, USA) was used to perform neural network analysis. To analyze the PCA, LDA, QDA, and SVM, Unscrambler software version 10.4 (Camus, Oslo, Norway) was used.
3. Results
3.1. E-Nose Response
Sensor output signals from the nine-sensor MAU-9 MOS e-nose sensor array constituted a full multisensory-array output response, referred to as a smellprint or aroma signature pattern. The unique aroma signatures (smellprint patterns), resulting from MAU-9 sensor array output responses to individual aroma VOC emissions of grape leaf samples, are presented in
Figure 1a,b. Sensor output responses are indicated in both raw data output format as well as in normalized sensor output format for comparative purposes using the conductivity ratio (G-G0) to indicate a normalized value on the
y-axis.
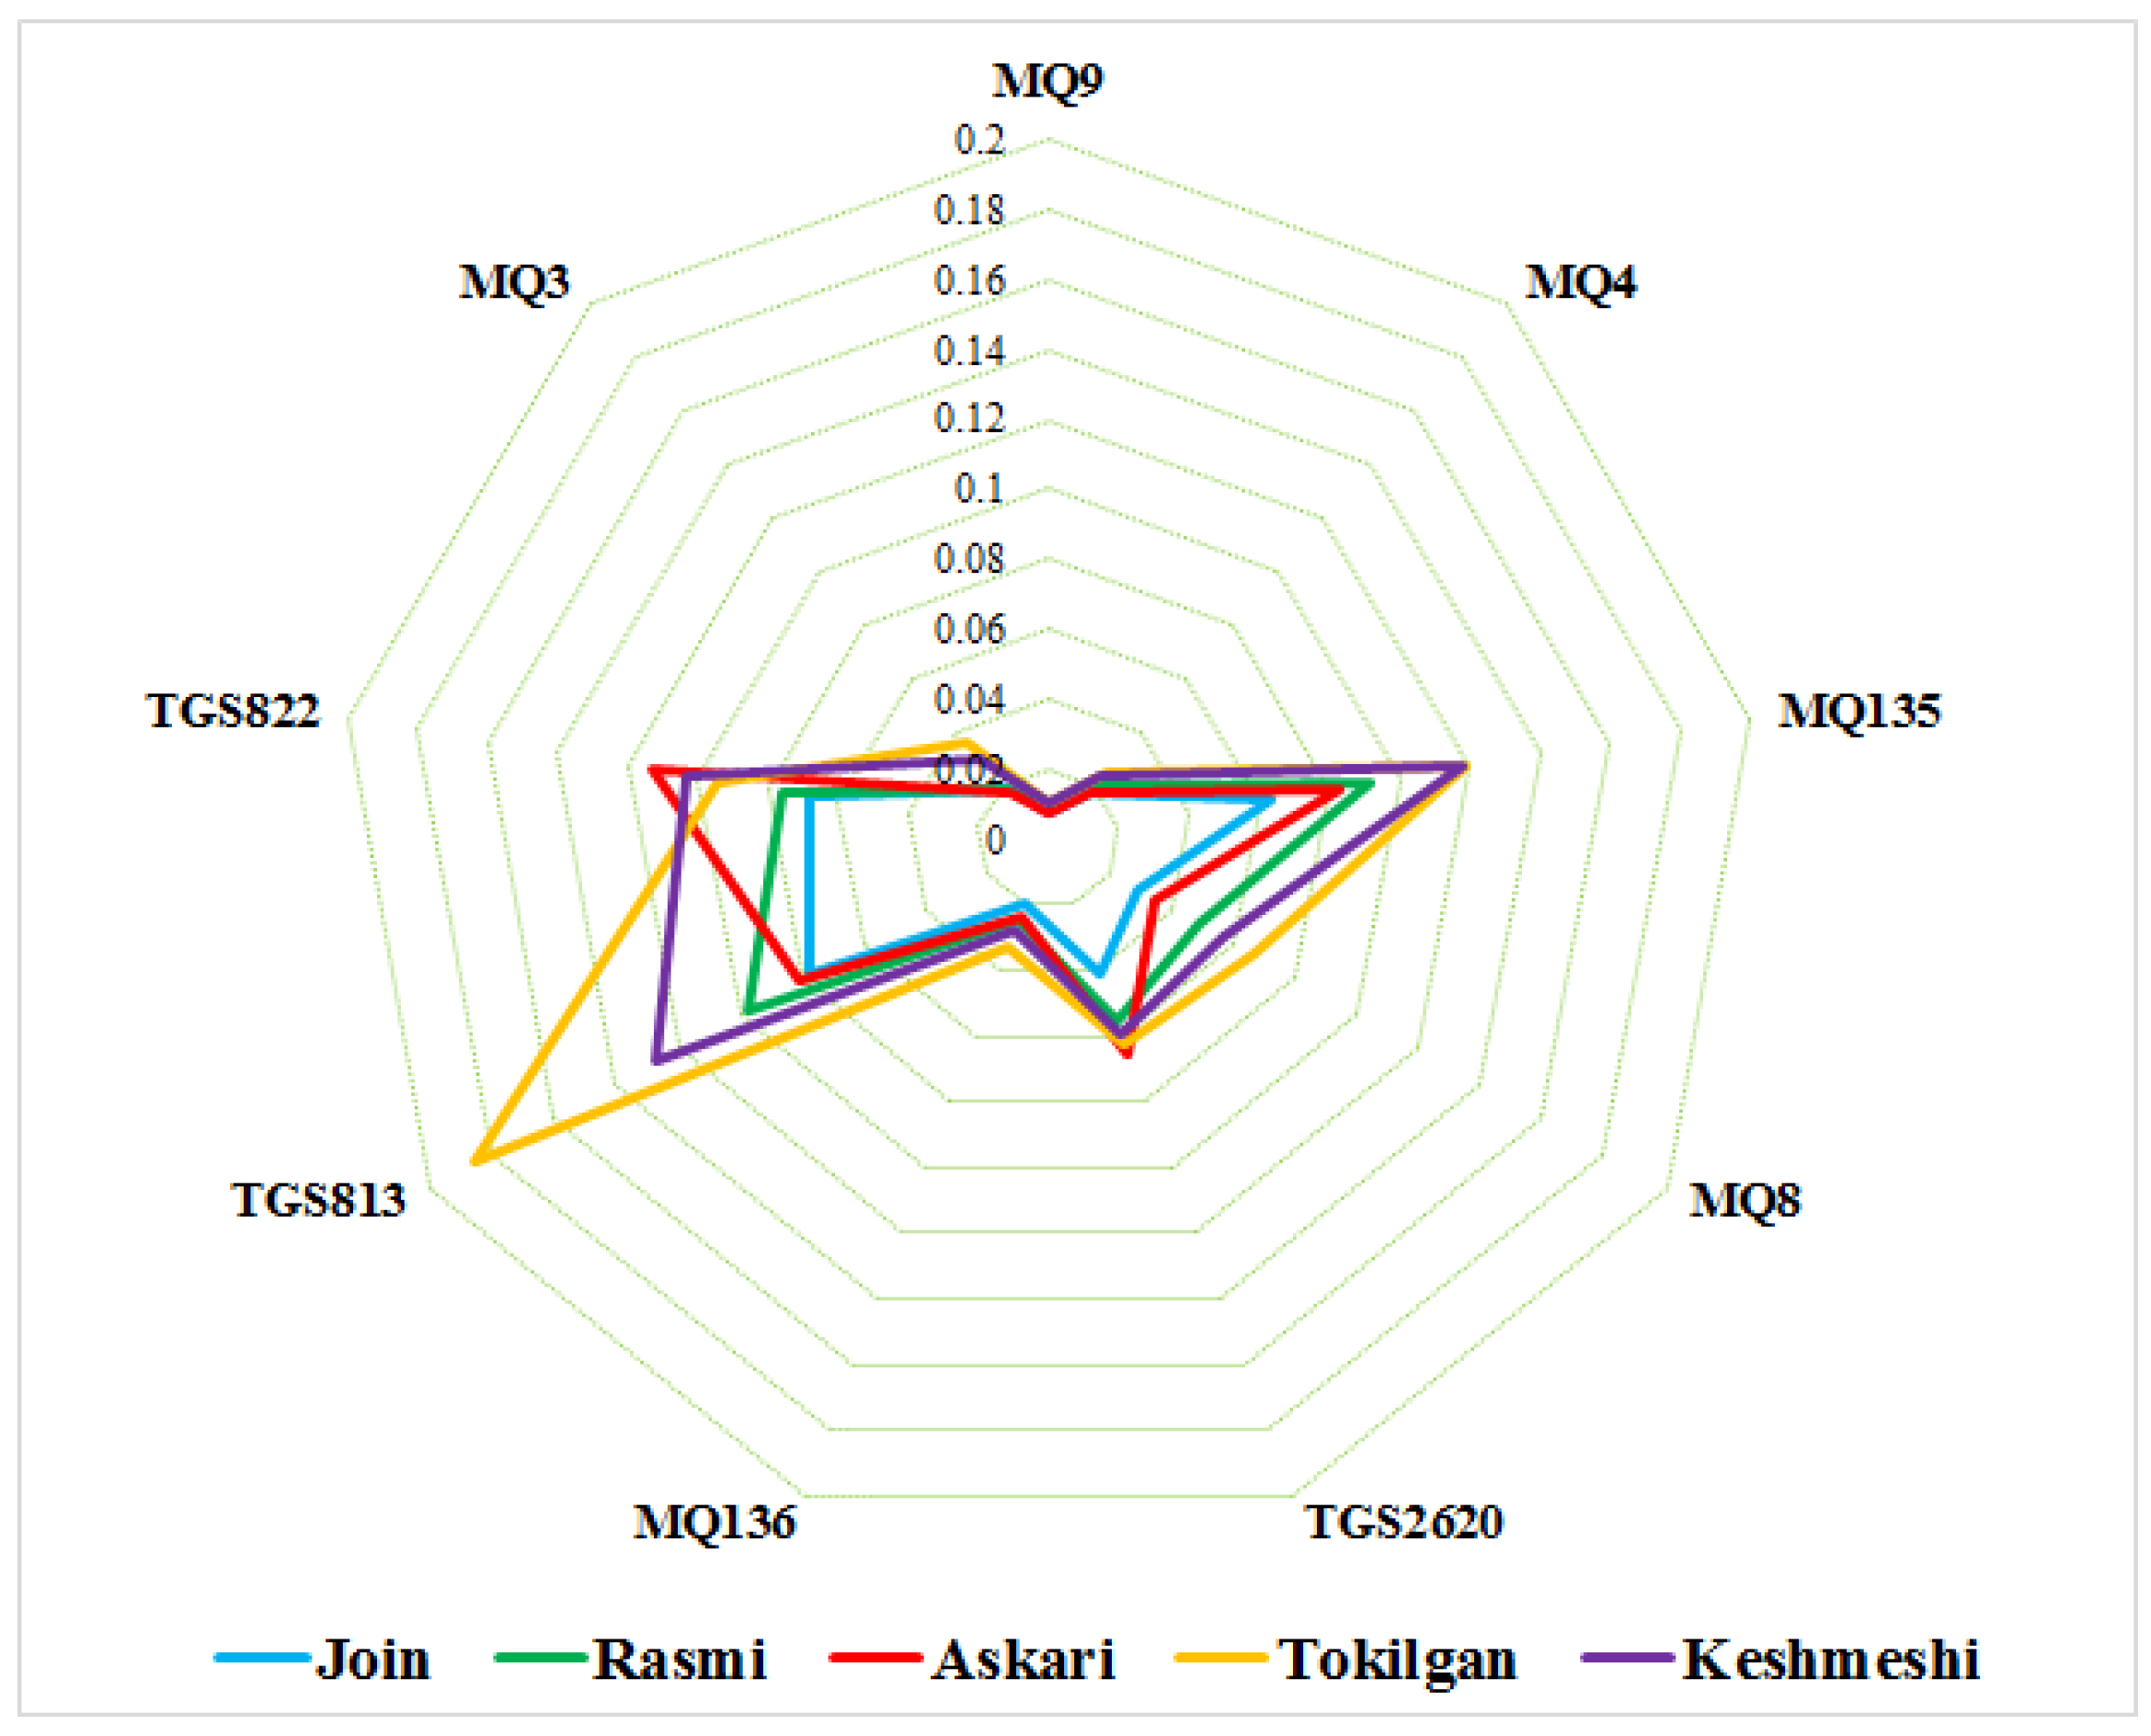
Radar plots of sensor array output data were produced with a single radius to reveal differences in sensor response patterns (i.e., aroma smellprints) resulting from analysis of leaf volatiles from five grape cultivars. The average responses of individual sensors to headspace volatiles present in aromas of 5 grape cultivars are plotted on a radar diagram (
Figure 2). The outputs of nine sensors in the sensor array (sensor numbers 1–9) are arranged in sequential order, clockwise from the top sensor MQ9 (sensor 1) to MQ3 (sensor 9). All output results for the five grape cultivars were plotted simultaneously for visual comparisons on the radar plots.
Different sensors in the nine-sensor array exhibited differential responses to mixtures of VOCs present in volatile emissions from analyzed leaf samples of each grape cultivar. The highest and lowest sensor responses were recorded for Tokilgan and Join grape cultivars, respectively. TGS813 and MQ135 sensors showed the strongest sensor intensity responses among the nine sensors, indicating a large significant contribution to sample classification.
A clear pattern of diversity (in smellprint signatures) was observed between the five grape cultivars, confirming the ability of the e-nose to readily distinguish between different cultivars using radar plots of e-nose sensor outputs. The response of sensor eight (TGS822) for grape cultivar Askari was noticeably stronger than the response of this sensor to the other four cultivars.
A summary of relative sensor intensity responses among all sensors provided an indication of which sensors were most responsive to overall VOC components present in leaf volatile emissions. Sensors with the lowest sensor intensity responses included sensor one (MQ9), two (MQ4), six (MQ136), and nine (MQ3). Sensors that produced moderate-intensity responses included sensors four (MQ8), five (TGS2620), and eight (TGS822). There were only two sensors that produced high-intensity responses, including sensor three (MQ135) and sensor seven (TGS813).
3.2. PCA
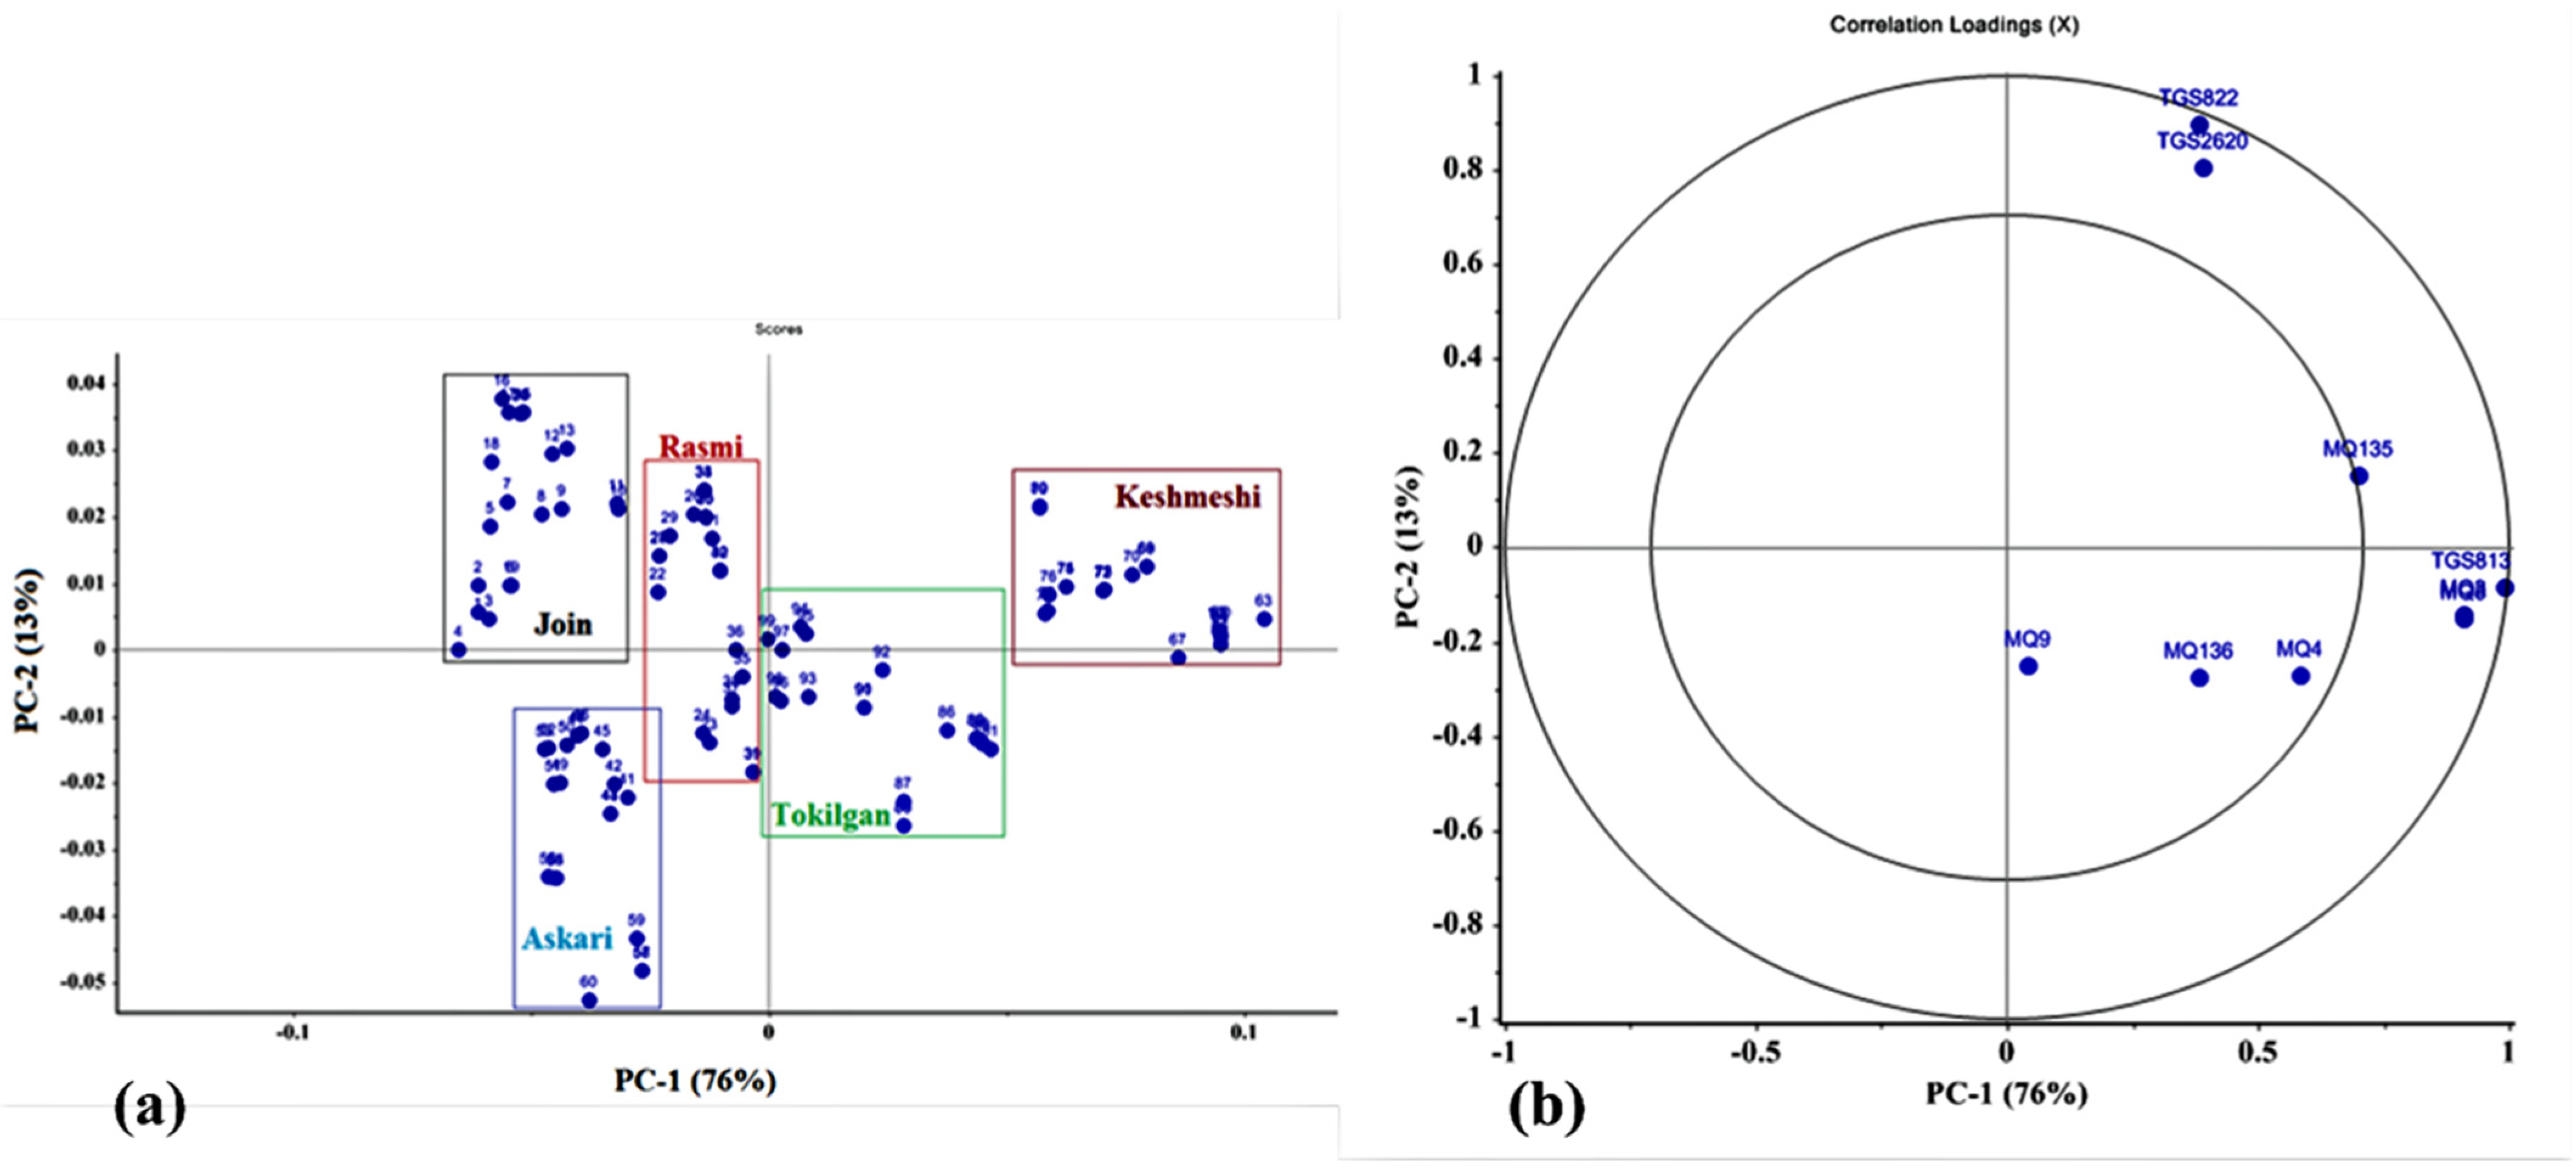
Electronic nose data of different grape cultivars were first analyzed by PCA to obtain better insight into the grouping of samples (sample types). The principal components are linear combinations of the main variables where the principal component represents the largest variance, the second principal component represents the second largest variance, and so on. PCA results indicated that 76% and 13% of the total variance of the data was explained by PC1 and PC2, respectively. The first two main components constituted 89% of the total variance of the normalized data (
Figure 3a). The model based on the first two principal components showed clear, well separated discriminations between grape samples of the three cultivars Join, Askari, and Keshmeshi. However, there were no distinct data clusters, resulting in relatively low separation and discrimination between cultivars Rasmi and Tokilgan.
The relationships between the variables can be explored by plotting the correlation loading diagram using Unscramble-x software. The loading diagram (
Figure 3b) presents the relative role of each sensor for the main components. This diagram consists of two concentric circles; the inner circle shows 50%, while the outer circle demonstrates 100% of the total variance of the data.
The higher the loading coefficient of a sensor (i.e., the closer to the larger circle), the more prominent role the sensor contributes to identification and classification. Therefore, sensors located on the larger circle play a greater role in data classification. According to the figure, MQ9, MQ136, MQ4, and MQ135 sensors had the least response to and role in data classification, while the other five sensors had an important role in identifying grape cultivars from their leaf aromatic compounds. The variance of sensor signals for grape leaves was relatively low, suggesting that sensor variance did not significantly influence the reliability of individual sensor responses in their contributions to discriminations.
3.3. LDA and QDA
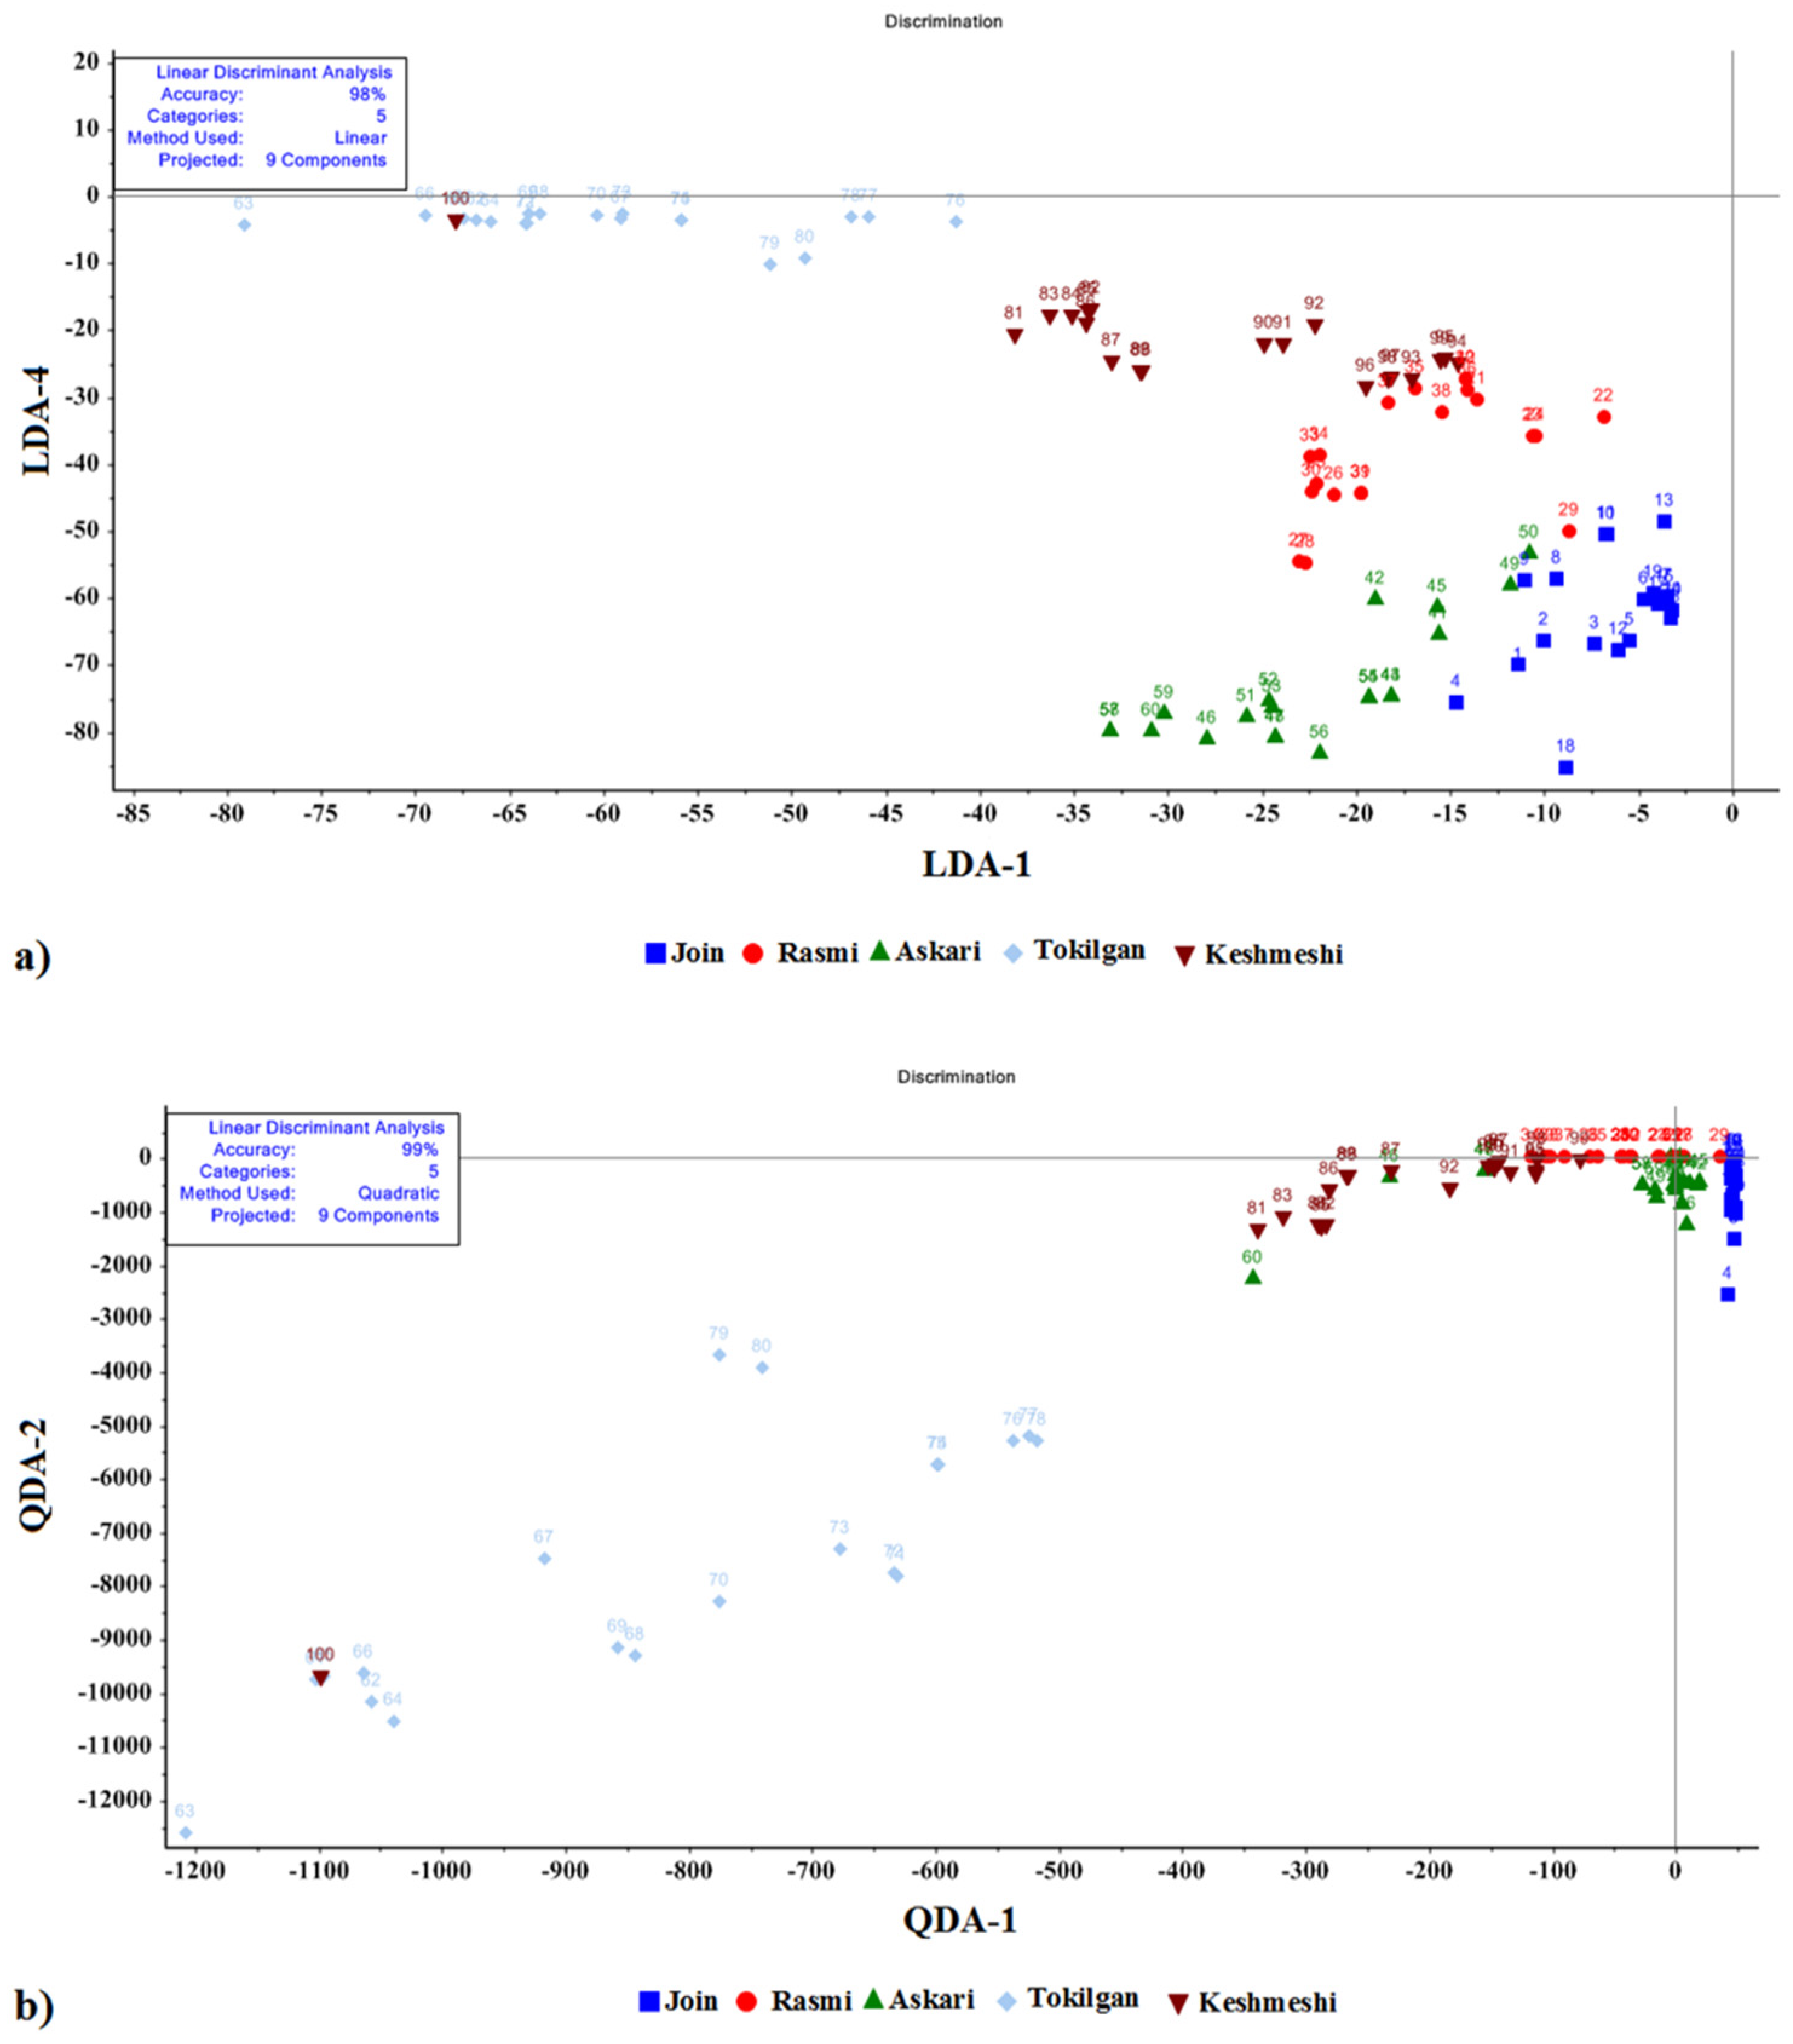
LDA and QDA analyses were utilized to classify grape cultivars based on leaf VOCs. The results for these data analyses are presented in
Figure 4a,b. After normalization, the data of nine sensors were entered into the Unscramble-x software. The weight of the data was one. According to the LDA results shown in
Figure 4a, the first two differentiating variables explained 98% of the total variance of the data, reflecting the relatively good accuracy in the classification of five grape cultivars using the LDA method. Two out of 100 total data were not properly classified by the LDA approach.
Figure 4b also presents the results of QDA analysis, demonstrating 99% accuracy, which is a very high precision level for classifying five grape cultivars. With this technique, only one sample was not correctly identified.
According to Equations (2)–(6), the classification performance parameters of LDA and QDA methods are summarized in
Table 1. Based on
Table 1, the classification precision of data using LDA and QDA methods was 98% and 99%, respectively. The classification performance of the LDA and QDA statistical methods were similar and performed at a high level for all five grape cultivars based on MAU-9 e-nose leaf data emissions.
Table 2 presents the confusion matrices obtained by LDA and QDA methods for the classification of grape cultivars. According to
Table 2, the classification accuracy of the QDA method was higher than that of the LDA method, as the incidence of misclassification was very small.
3.4. SVM
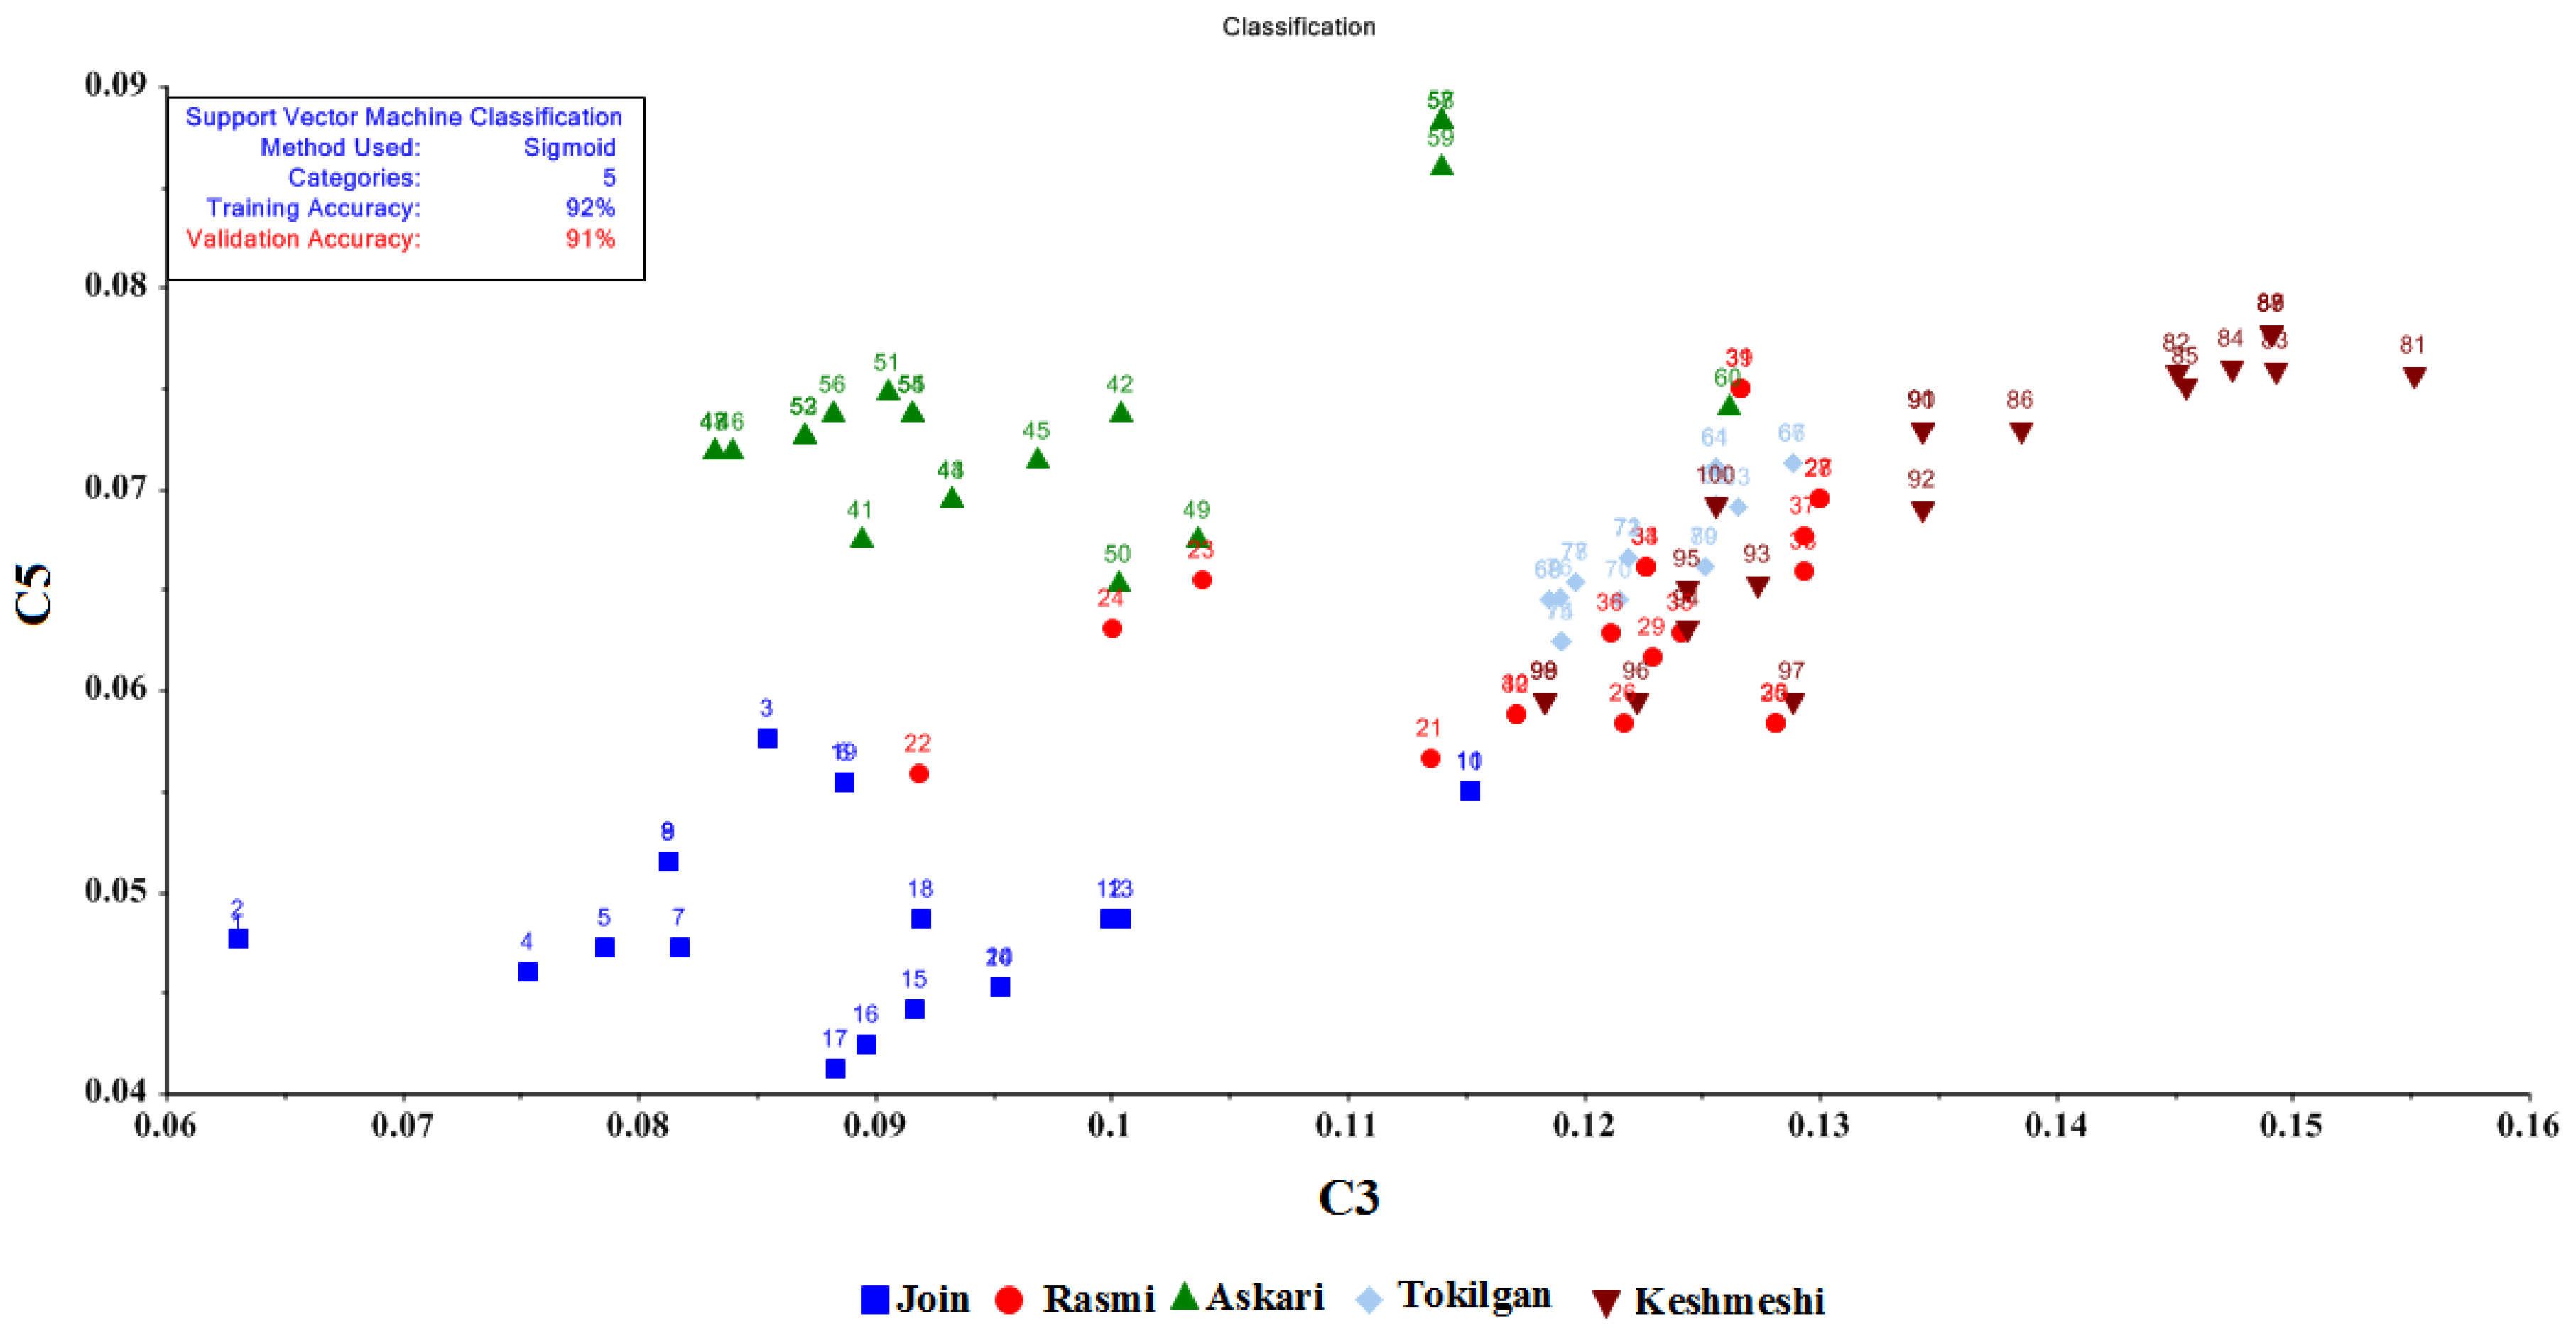
Two methods, C-SVM and Nu-SVM, were applied in this study to classify five grape cultivars using SVM. Four kernel functions of radial basis, sigmoid, polynomial, and linear, were used as the kernel functions of SVM, which have a penalty coefficient of C and Nu and a kernel factor of γ. A cross-validation method was employed for validation with a weight of one assigned to nine input sensors. The results of the SVM method are summarized in
Table 2. The highest accuracy was obtained by the Nu-SVM method and the sigmoid kernel function with 92% and 91% accuracy for training and validation, respectively.
Two methods, C-SVM and Nu-SVM, were applied in this study to classify five grape cultivars using SVM. Four kernel functions were used, including radial basis, sigmoid, polynomial, and linear functions. Results of the SVM method are presented in
Figure 5.
Table 3 summarizes the classification accuracy and the confusion matrix for the Nu-SVM method using the sigmoid kernel function which achieved higher accuracy.
The classification precision determined by the Nu-SVM method with sigmoid kernel function was 0.924. Eight out of 100 input data were misclassified. The SVM model exhibited lower classification accuracy for the five grape cultivars compared to LDA and QDA.
3.5. ANN
The use of the recognition method with the help of ANN led to the minimum cross-entropy (0.039) during the training course. An entropy error of less than 1% was applied to stop training the output data from the E-nose.
Table 4 shows the confusion matrix for classifying five grape cultivars. Accordingly, only 1 sample was not properly classified, leading to the classification accuracy of 99%.
The functional parameters of ANN for the classification of five grape cultivars are presented in
Table 5. Classification of three cultivars (Join, Rasmi, and Askari) were better than results for classification of cultivars Tokilgan and Keshmeshi based on all six performance measures.
Therefore, the network with a 9-3-5 topology structure offered the highest classification accuracy for the five grape cultivars. The statistical results of ANN classification models using e-nose output are also listed in
Table 5. The total accuracy was equal to 99% with an error and cross-entropy of 1 and 0.030, respectively. This model was not under- or over-fitted as the CE values obtained for training were lower than the values of the testing phase, suggesting its high performance.
3.6. Performance of Statistical Models
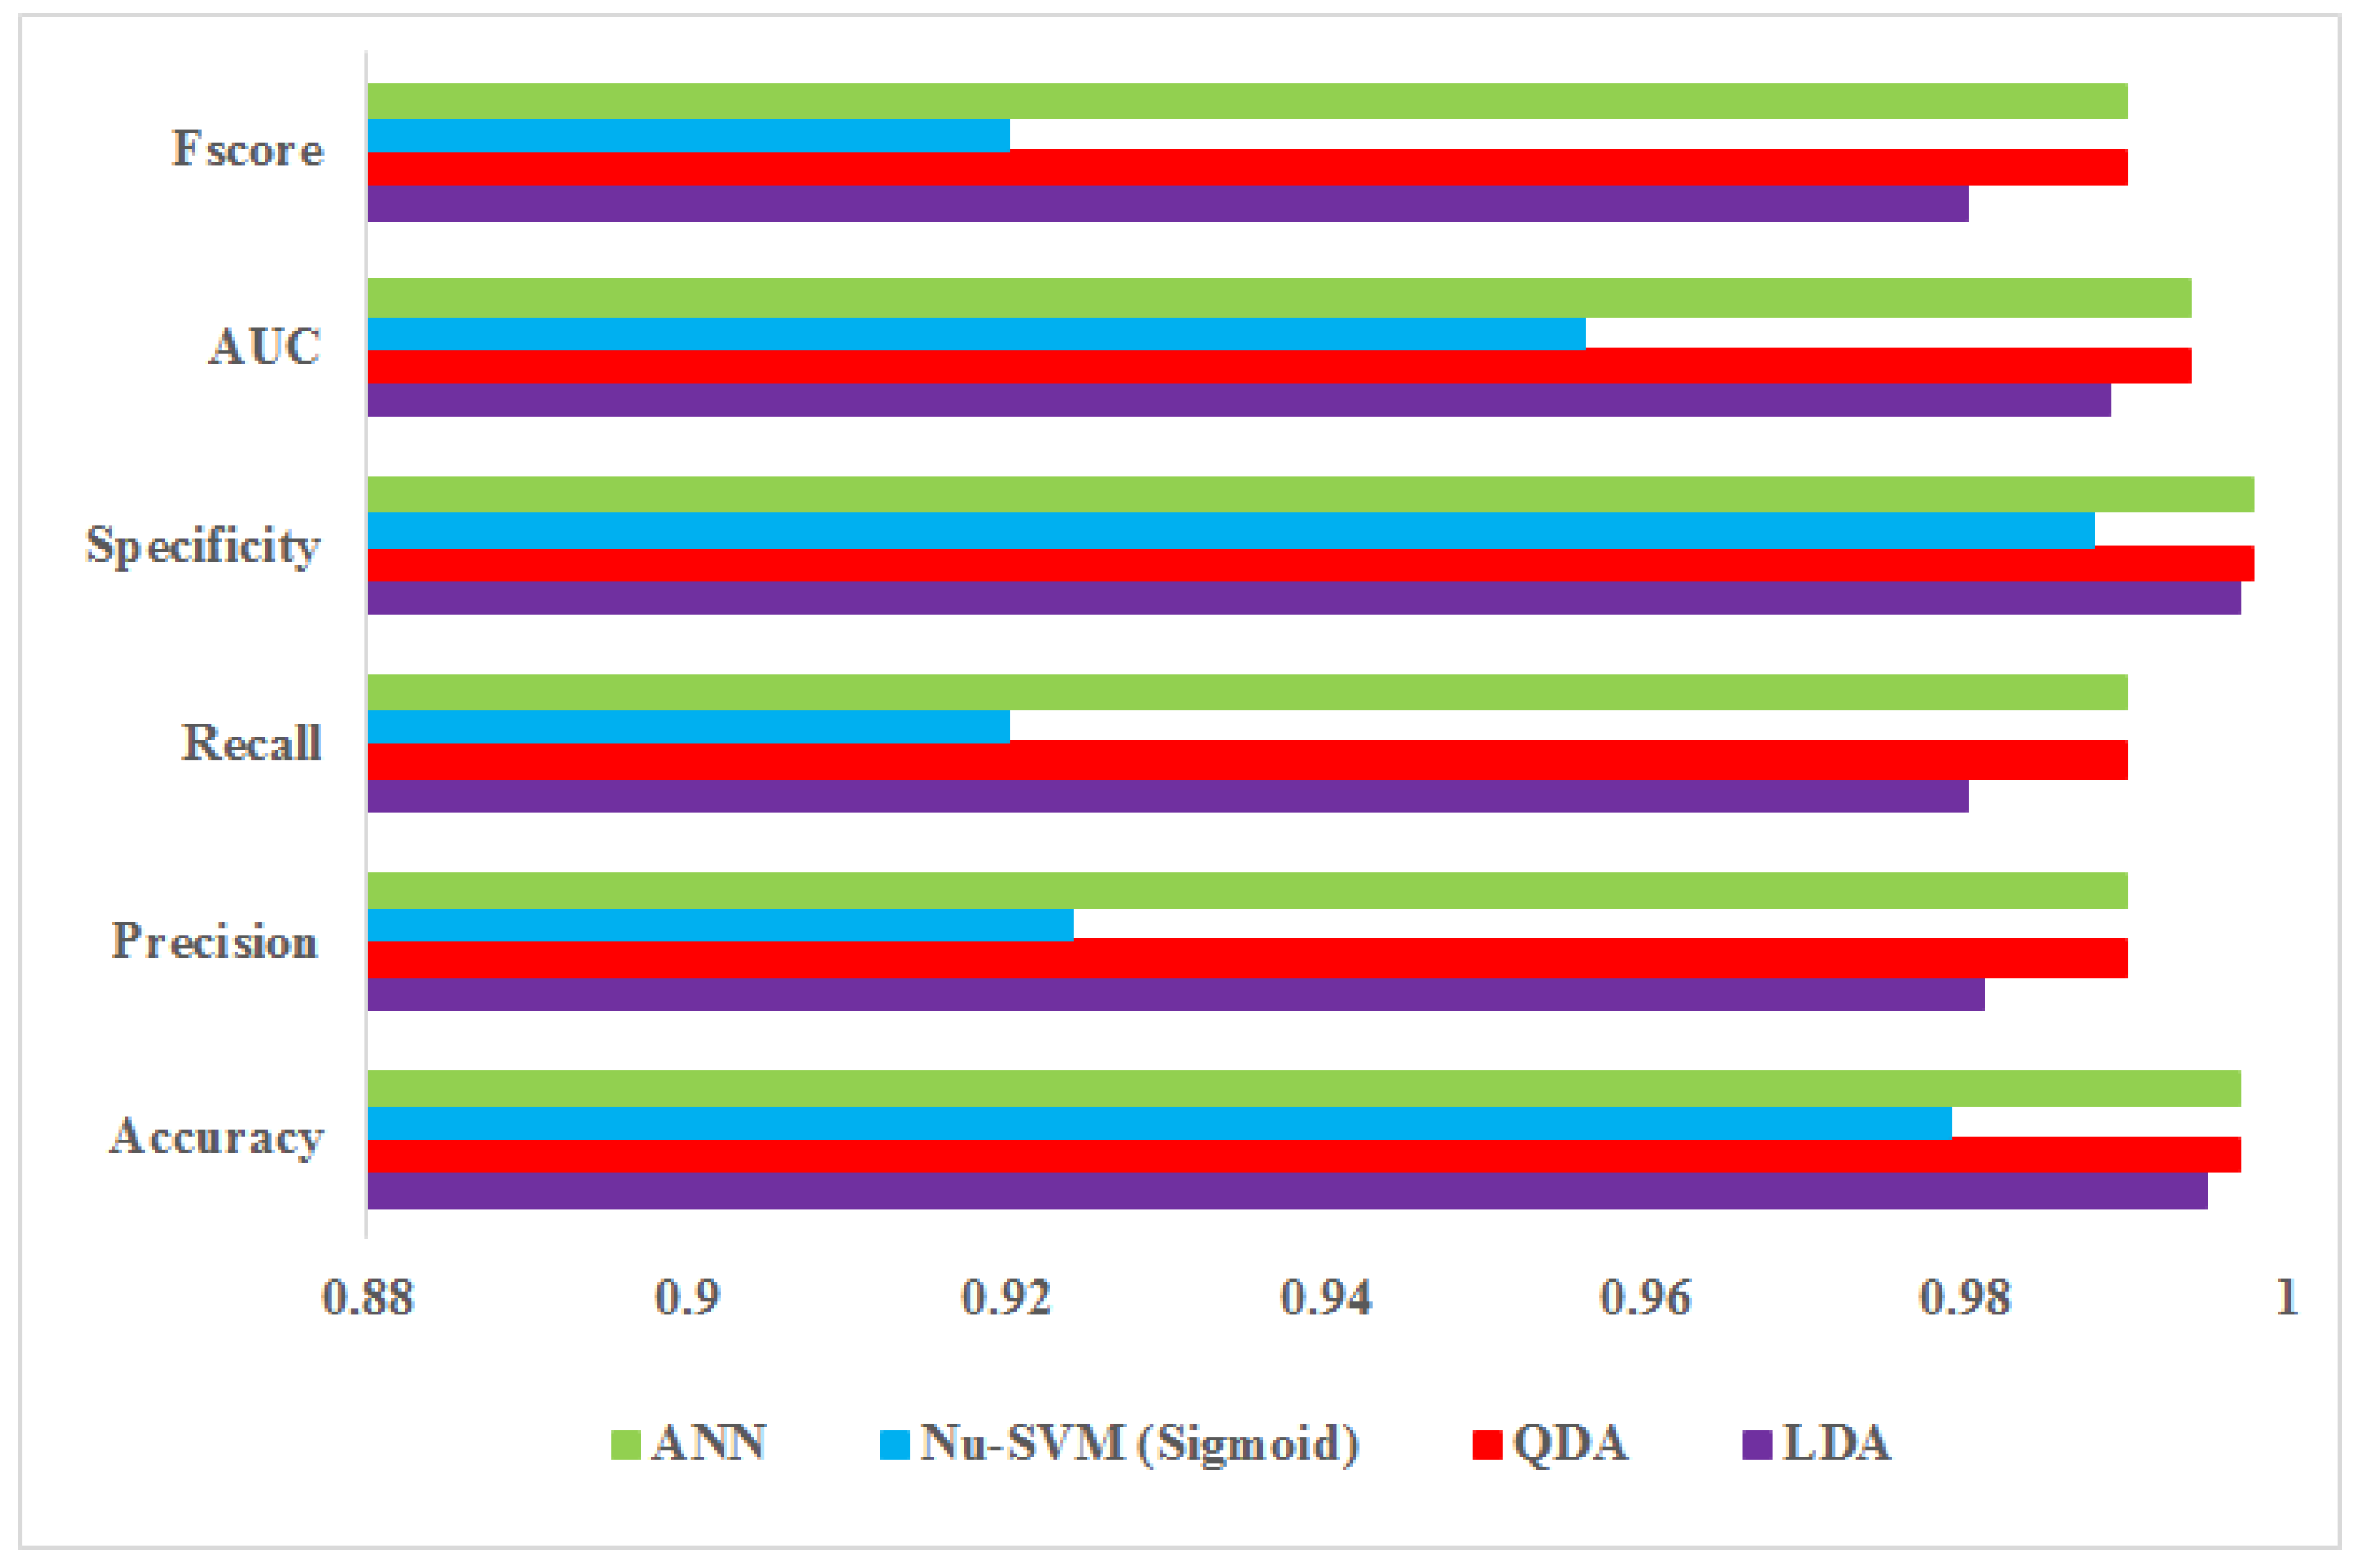
Test results comparing the performance accuracy of ANN, Nu-SVM, QDA, and LDA statistical methods for classifying the five grape cultivars are presented in
Table 6. Statistical results were calculated using Equations (1)–(6) and their mean values were reported. Among the tested models, ANN and QDA models showed the best performance in the classification of grape cultivars. The highest value of classification recall for the five grape cultivars for both QDA and ANN methods was 99%. Classification precision determined by the Nu-SVM method with sigmoid kernel function was 0.924. Only eight out of 100 input data were misclassified. The SVM model exhibited lower classification accuracy for the five grape cultivars compared to LDA and QDA. ANNs, for the classification of three cultivars (Join, Rasmi, and Askari), were better than results for classification of cultivars Tokilgan and Keshmeshi based on all six performance measures.
Although precision and recall are valid criteria, one of them can be optimized at the expense of the other. Therefore, the F-score criterion was adopted. The supervised methods of ANN and QDA, along with electronic nose, may be used for satisfactory classification of grape cultivars. No model achieved 100% accuracy. The highest accuracy was obtained by ANN and QDA models while the lowest accuracy was obtained by the SVM model, which could not correctly classify grape cultivars.
Figure 6 shows test results comparing the performance accuracy of ANN, Nu-SVM, QDA, and LDA methods for classifying the five grape cultivars. Statistical results were calculated using Equations (1)–(6) and their mean values were reported.
ANN and QDA models showed the best performance in the classification of grape cultivars among the tested models. The highest value of classification recall for the five grape cultivars for both QDA and ANN methods was 99%. Although precision and recall are valid criteria, one of them can be optimized at the expense of the other. Therefore, the F-score criterion was adopted. The supervised methods of ANN and QDA, along with electronic nose, may be used for satisfactory classification of grape cultivars. No model achieved 100% accuracy. The highest accuracy was obtained by ANN and QDA models while the lowest accuracy was obtained by the SVM model, which could not correctly classify grape cultivars.
4. Discussion
The MAU-9 MOS experimental e-nose tested in this study allowed for effective discrimination between certain grape cultivars based on analysis of leaf volatiles using specific statistical methods for e-nose data analysis, as indicated in subsequent discussions. This new tool provides a means for certifying and authenticating individual grape cultivars as rootstocks for commercial sale within the grape nursery industry. This capability is quite significant given that wine and commercial grapes, sold as fruits and for juice production, are high cash-crop industries worldwide with significant value placed on specific cultivars responsible for producing high-quality products. Thus, the importance of certifying specific grape cultivars is essential to maintain the integrity of product quality for rootstocks sold by the grape nursery industry. To our knowledge, this is the first report of an e-nose device being used for the particular purpose of discriminating between grape cultivar rootstocks via VOC analysis of grape leaf volatiles. Some limitations of this method may include various modifying parameters that could affect aromas emitted by grape vines such as vine age, geographical variations in environments, changing climatic conditions, edaphic factors such as fertilizers applied to vineyard soils, and the presence of pests, diseases, and agricultural pesticide residues on vegetative surfaces of grape plants.
The intensity of the sensor response of the nine sensors in the MAU-9 sensor array to all leaf volatiles, derived from the five grape cultivars tested, was strongest in cultivar Tokilgan, with relative sensor intensity responses to leaf volatiles reduced for the other four cultivars, in order of decreasing magnitude, for Keshmeshi, Rasmi, Askari, and Join. This relative strength in MAU-9 sensor responses, as indicated by the radar plot, was very useful in contributing to effective discrimination between the five cultivars based on leaf volatiles. The strongest sensor responses to leaf volatiles of all five grape cultivars occurred for sensor TGS813, with slightly lower responses from sensor MQ135, and with even lesser relative responses from sensors TGS2620 and TGS822. One exception was the abnormally strong response of sensor TGS822 to leaf volatiles from cultivar Askari. These differences in sensor response intensities and patterns suggest that varying amounts and types of VOCs are present in volatile emissions from different grape cultivars, which could provide additional information for effective cultivar discriminations through more detailed chemical analysis of grape leaf volatiles.
Known sensitivities of component MAU-9 sensors in the sensor array to certain chemical classes of VOCs provided some indications of likely types of major VOCs most prevalent in volatile emissions from grape cultivars. The strongest responses of sensors TGS813 and MQ135 to grape volatiles suggest major VOC components, including aliphatic alkanes, aromatic compounds (benzene derivatives), and sulfides. Lower responses to sensors TGS2620 and TGS822 provide evidence that lesser component VOCs in grape volatiles may contain alcohols and polar hydrocarbons, likely containing oxygen and nitrogen functional groups, such as aldehydes, ketones, esters, and amino or nitrile functional groups. Grape cultivar Askari appeared to contain particularly strong VOC components of polar hydrocarbons.
Five chemometric methods (PCA, ANN, LDA, QDA, and SVM) were tested in the present study to classify five grape cultivars based on electronic-nose analyses of VOC emissions from whole leaves. The unsupervised method using PCA indicated a classification accuracy of 89%, based on the total variance explained by the first two principal components. Supervised classification algorithms, including ANN, LDA, QDA, and SVM, were described by analyzing accuracy, precision, sensitivity, specificity, AUC, and F-value for binary classification with labels of ’positive’ and ’negative’. The best results were provided by the ANN and QDA classifiers which classified different grape cultivars with 99% accuracy. Thus, the ANN and QDA statistical classification methods are preferentially recommended here for more effective discriminations between grape cultivar rootstocks, via leaf volatile analysis using the MAU-9 e-nose, by vineyards and the commercial nursery industry. However, the SVM method did not yield high classification accuracy, perhaps due to incompatibilities of this method with e-nose sensor data due to the specific chemical nature of VOCs present in grape leaf volatiles. Using the confusion matrix, the Tokilgan cultivar was correctly detected by all models, while the Keshmeshi cultivar was detected at a lower accuracy. To the best of our knowledge, the present study is the first to comprehensively test five different chemometric algorithms for effectiveness in identifying and classifying grape cultivars based on leaf volatile emissions.
Khorramifar et al. [
21] examined the identification of potato cultivars using machine olfaction. They reported that high detection accuracy was achievable using an electronic nose with the PCA method. They also stated that 100% accuracy can be achieved in the identification of potato cultivars using electronic nose and LDA and ANN methods.
Machine olfaction was used to classify 17 rice samples into four categories [
29]. The report showed that SVM was the best classification method, with an accuracy of 100%. The k-nearest neighbor (KNN) method was second best for classifying rice samples. In another study [
30], the KNN method was employed to detect three rice cultivars with an accuracy of 100%. It was stated that the accuracy of the KNN method was better than PCA and LDA methods.
Lim et al. [
31] achieved good results using the PCA method with an e-nose to grade the quality of Chinese commercial moccasin yarn. They were able to classify yarn quality via the PCA method with 94.3% accuracy. Their results are in line with the results of the current research.
Jana et al. [
32] used machine olfaction with ANN, PCA, and LDA to detect aromatic and non-aromatic rice. The accuracy of the results obtained by these methods was 93%, 96.5%, and 80%, respectively. The results of our research showed much higher accuracy, perhaps due to the presence of different VOCs emitted from grape leaves. Other types of input variables in the group of non-destructive methods are based on sensors capable of mimicking organoleptic perceptions, such as for e-noses and e-tongues [
33].
Electronic-nose devices previously have been utilized to specifically analyze leaf volatile emissions to distinguish between different varieties and cultivars of herbaceous (leaf-based) agricultural field crop products, including herbs and teas, but not for grape leaf volatiles. Bernáth et al. [
34] applied an NST-3320 (AppliedSensor Sweden AB, Linköping, Sweden) e-nose for identification of oregano herb cultivars to accelerate the cultivar selection process for carvacrol essential oil content. Yu et al. [
35] employed an e-nose for the rapid identification of green tea quality grades, using two neural networks, backpropagation neural network (BPNN) and probabilistic neural network (PNN), with classification success rates of 100% and 98.7%, respectively. An electronic nose with 12-MOS sensors also effectively classified the aroma qualities of three Indonesian black teas using PCA discrimination with PC-1 and PC-2 principal components accounting for 80.3% and 15.3% of the total variance, respectively [
36].
Several types of e-nose and e-tongue devices have been developed to distinguish between cultivars of agricultural field crops. A conducting polymer (CP)-based electronic tongue, combined with PCA and partial least squares (PLS) data analyses, was used to discriminate between five different soybean cultivars with genetically distinct characteristics [
37]. CP e-nose devices generally are more sensitive to sample moisture content and more susceptible to sensor poisoning than MOS sensors. Trirongjitmoah et al. [
38] developed an e-nose method with supporting technologies, including amplified fragment length polymorphism (AFLP) markers and gas chromatography-mass spectrometry (GC–MS), to characterize, detect chemical differences, and group four Thai garlic cultivars. Zhou et al. [
39] investigated the capabilities of an e-nose for distinguishing between wheat seed (grain) varieties. They applied PCA and LDA statistical methods. PC1 and PC2 explained 99.7% of the total variance, while LD1 and LD2 accounted for 97.2% of the variance. The classification accuracy using the BPNN model for training and testing data sets was 100% and >90%, respectively.
Applications of e-nose devices for quality grading of fruits, fruit types, and cultivar identification have also been developed for the fruit industry [
6]. Sun et al. [
40] used an e-nose with GC-MS analysis to discern differences between diploid loquat fruits based on volatile emissions and chemical components. Volatile profiles were effective in differentiating between most triploid loquat cultivars, but PCA did not clearly separate white-fleshed and red-fleshed loquat varieties. Four cultivars of mandarin orange with very similar morphologies were distinguished by combining metabolomics, DNA barcoding, and an electronic nose [
41]. Electronic-nose methods coupled with chemometrics effectively distinguished mandarin orange cultivars. Metabolomic analysis with liquid chromatography-quadrupole time of flight-mass spectrometry (LC-QTOF-MS) was used to identify nine species-specific chemical marker metabolites that could be applied for discrimination between certain cultivars. In addition, 19 single nucleotide polymorphism (SNP) sites within the nuclear internal transcribed spacer 2 (ITS2) region, and three stable SNP sites in the ITS2 region, were found to be useful for distinguishing four mandarin orange cultivars.
Other studies have demonstrated capabilities of e-nose devices to detect differences in fruit cultivars and aromatic tree wood types using e-nose devices alone. Pruteanu et al. [
42] developed an 18-sensor MOS electronic-nose method to classify seven Romanian apple cultivars by volatile emissions. Their results indicated that the e-nose could successfully discriminate between all varieties of apples tested with almost 100% accuracy and a variance of greater than 90%. Aditama et al. [
43] used a 3-MOS e-nose equipped with neural networks to classify
Gyrinops versteegii (=
Aquilaria versteegii) agarwood volatiles. Their test results showed that an e-nose could detect differences in quality of agarwood based on emissions of essential oil VOCs. This aromatic resinous wood oil, extracted only from the heartwood of old-growth trees, is extremely rare and valuable as a ceremonial incense (called aloeswood) in many Asian cultures [
44].
The e-nose sensor array generates digital output responses to VOCs from food and other agricultural products, which could be classified after processing using supervised algorithms. The use of supervised algorithms to classify food and agricultural products has increased in recent years and is expected to further expand in the future. A systematic comparison of the main supervised algorithms useful for performing accurate classifications based on dataset variables provides new information to help determine the best methods for identifying and classifying agricultural products using e-nose technologies.


 ,
, 


