Communication

Quantification of a COVID-19 Antibody Assay Using a Lateral Flow Test and a Cell Phone

by
Pearl Thompson
1,
Ana Lívia de Carvalho Bovolato
1,2,
Gisela Ibáñez-Redín
1,3 and
Alexandre G. Brolo
1,4,*
1
Department of Chemistry, University of Victoria, Victoria, BC V8P 5C2, Canada
2
Institute of Biosciences, São Paulo State University—UNESP, Botucatu 18618-689, Brazil
3
Sao Carlos Institute of Physics, University of São Paulo—USP, São Carlos 13563-120, Brazil
4
Centre for Advanced Materials and Related Technologies (CAMTEC), University of Victoria, Victoria, BC V8P 5C2, Canada
*
Author to whom correspondence should be addressed.
Submission received: 13 May 2022 / Revised: 14 June 2022 / Accepted: 17 June 2022 / Published: 21 June 2022
(This article belongs to the Special Issue Feature Papers on Optical Chemical Sensors and Biosensors)

Abstract

:
Although several biomedical assays have been developed to screen for antibodies against SARS-CoV-2, very few can be completed without drawing blood. We developed a rapid lateral flow screening tool that used saliva samples and yielded rapid results that could be quantified using a cell phone. This assay provided the sensitive detection of IgG antibodies against SARS-CoV-2 within 10 min. We started by synthesising, modifying, and characterising gold nanoparticles. Using these particles as a coloured label, we developed a lateral flow strip made of nitrocellulose, glass fibre, and cellulose material. We quantified our visual results using pictures acquired with a cell phone and calculated a limit of detection of 4 ng/mL of antibodies against the SARS-CoV-2 spike protein.

1. Introduction

The COVID-19 pandemic was caused by severe acute respiratory syndrome coronavirus 2 (SARS-CoV-2) [1]. This virus has impacted the health, employment, and lifestyle of people across the globe [2]. This worldwide crisis has led to an increased need for research pertaining to prevention, treatment, and testing, including antigen and antibody assays. For diagnostic antigen detection, a real-time reverse transcriptase chain reaction has been commonly used throughout the pandemic [3]. Additional techniques have been developed for antigen detection, including nucleic acid amplification tests [3], fluorescence assays [4], surface-enhanced Raman scattering techniques [5], and electrochemical assays [6]. In contrast to these diagnostic methods, our work focused on antibody testing, which can be used to identify individuals who have been infected with COVID-19 in the past [7] or who have developed antibodies through vaccinations [8]. This information can be used to inform healthcare professionals and public health experts about the spread of the disease and protect against the virus [9].
Studies by Hall et al. [10] and Lumley et al. [11] have shown that the development of COVID-19 antibodies yields an increased immunity to the virus. The presence of antibodies leads to a less severe illness. When a person is reinfected with COVID-19 after a previous infection or experiences a breakthrough infection after a vaccination, the individual is less likely to face severe symptoms, hospitalisations, or death if they have pre-existing antibodies for the SARS-CoV-2 virus [12].
There are multiple varieties of COVID-19 antibodies, which have separate and distinct viral protein targets. For instance, there are IgM and IgG antibodies that target both viral spike (S) proteins and nucleocapsid (N) proteins [9]. The antibodies against the N viral protein only develop from an infection and not a vaccination [9]. COVID-19 mRNA vaccinations work in part by encoding the S “spike” protein, to which the body develops antibodies; the same antibodies also develop from an infection [9]. Therefore, by screening for antibodies against the S protein, it is possible to identify individuals who have antibodies through vaccination and/or from an infection. The assay reported here detected anti-SARS-CoV-2 spike protein S1 antibodies and anti-SARS-CoV-2 spike protein S2 antibodies.
SARS-CoV-2 antibody assays often require blood samples [13,14,15,16,17,18,19,20,21,22,23,24,25,26,27]. Our test used saliva, which is less invasive and can be easily collected by the patient at point-of-care or at-home settings. Saliva-based COVID-19 antibody assays have been developed that use ELISA [28], electrochemical processes [29], Simoa [30] or Luminex instrumentation [31,32], and optical interferometry [33]. Our lateral flow assay (LFA) is advantageous because it is cost-effective, simple, and can be administered without elaborate instrumentation. Table 1 compares the proposed assay with the pre-existing LFAs for antibodies against SARS-CoV-2 [13,14,15,16,17,18,19,20,21,34,35]. Of these pre-existing assays, only two use saliva samples [34,35]. Our method offers unique advantages due to a combination of a quick processing time (10 min) and low detections limits. In addition to these advantages, our assay does not require a swab for the sample collection. Previous studies have shown that the concentration of SARS-CoV-2 antibodies in saliva are a thousand times lower than in blood [28]. With our highly sensitive lateral flow assay, we could detect antibodies even at those low levels without using invasive sampling methods.
The proposed LFA used colloidal gold nanoparticles (AuNPs), which offer advantages over other commonly used probes such as latex beads, fluorescent particles (e.g., europium beads and quantum dots), and colloidal carbon. Compared with AuNPs, latex beads (polystyrene particles) yield a higher detection limit for LFAs [36] and require a coloured dye [37] in contrast to the inherent colour of gold. Fluorescent probes have relatively high sensitivity but have a higher toxicity and require an additional reader or laser equipment for the visualisation [38,39]. Colloidal carbon is black in colour and yields a high sensitivity in LFAs; however, its propensity for non-specific binding and its amorphous shape present major challenges [38]. Oliveira-Rodríguez et al. compared the effectiveness of gold and carbon nanoparticles as labels for an LFA to detect extracellular vesicles. The researchers observed a lower limit of detection and stronger linearity between the analyte concentration and signal response when using AuNPs as opposed to carbon [40]. AuNPs are biocompatible and their surface chemistry allows for an easy conjugation with biological molecules (e.g., antibodies and peptides) [38]. In the assay proposed here, this binding reaction occurred between the AuNPs and the anti-IgG Fc-specific antibodies. Gold nanoparticles support the localised surface plasmon resonance (LSPR) effect, which creates a deep red colour [41]. This conjugation and colour make gold nanoparticles a clearly visible and effective label in LFAs.
The proposed assay detected anti-SARS-CoV-2 spike protein S1 antibodies and anti-SARS-CoV-2 spike protein S2 antibodies in saliva samples. The samples flowed over a lateral flow strip. The SARS-CoV-2 antibodies in the saliva sample bound to the gold-labelled anti-IgG Fc-specific antibodies. The entire complex flowed over the strip and bound to the immobilised SARS-CoV S1 and S2 antigens on the test line. This produced a red line to indicate a positive test result. In this paper, we describe the development and efficacy of this lateral flow saliva test for COVID-19 antibody screening.

2. Materials and Methods

2.1. Materials and Reagents

The anti-IgG Fc-specific antibodies were purchased from Sigma Aldrich™ (Burlington, MA, USA). All other antibodies and proteins were purchased from Sino Biological™ (Beijing, China). The glass fibre conjugate pad (Standard 14) was obtained from Cytoviva™ (Auburn University, AL, USA). The Hi-Flow Plus 120 nitrocellulose membrane cards, the cellulose fibre pad (C083), and the rest of the chemical reagents were purchased from Sigma Aldrich™ (Burlington, MA, USA).

2.2. Preparation of Colloidal Gold Nanoparticles

The gold nanoparticles were prepared following a procedure based on the method proposed by Turkevich [42] and optimised by Frens [43]. The preparation procedure was as follows: 100 mL of ultrapure water was heated to approximately 85 °C and the temperature was maintained throughout the reaction. Whilst under constant agitation, 1 mL of 1% gold chloride solution was added, followed by 1.75 mL of 1% sodium citrate. The solution was incubated for 15 min. The same volumes of the gold chloride and sodium citrate solutions were added again, followed by a second 15 min incubation period, and then allowed to cool. The prepared gold nanoparticle solution was dark red in colour and was stored at 4 °C.

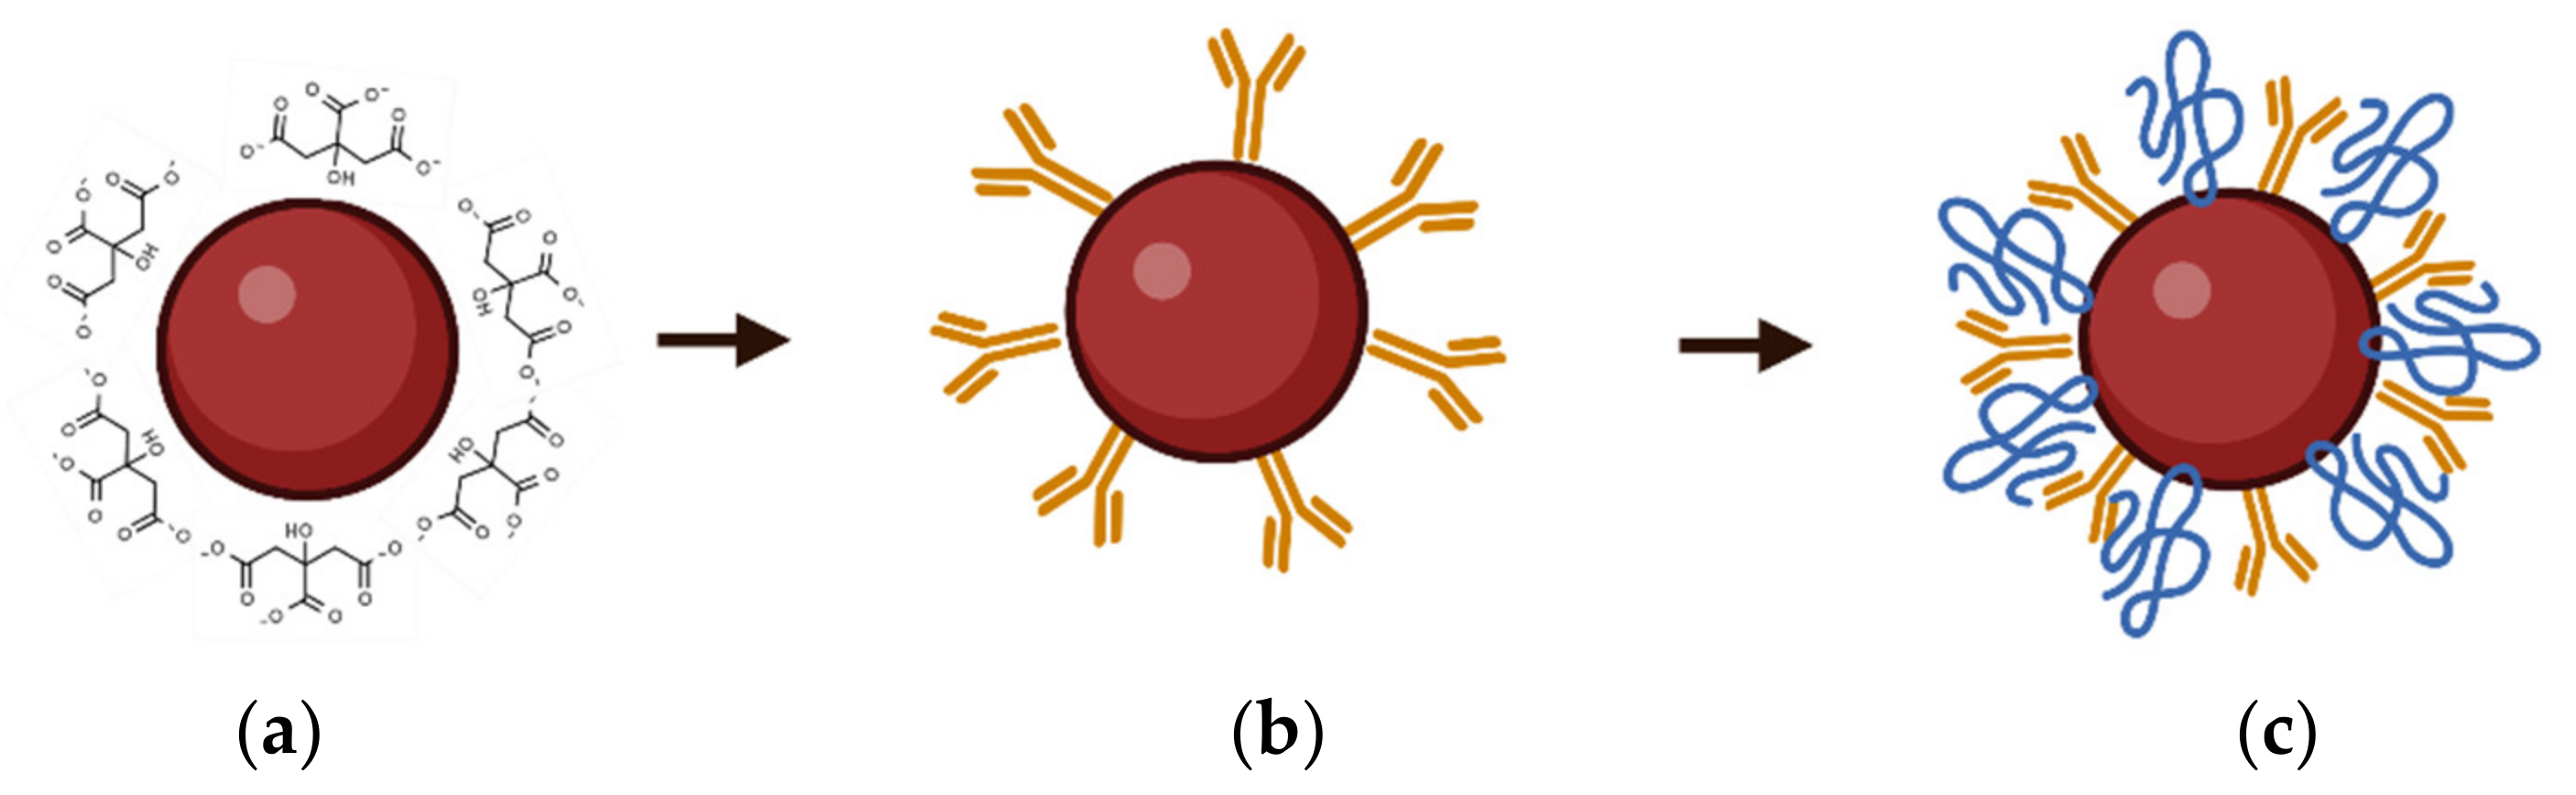
2.3. Nanoparticle Modification

The AuNPs were modified with anti-IgG Fc-specific antibodies. This modification occurred through passive absorption, a process whereby van der Waals and ionic forces allow the citrate molecules surrounding the gold to be displaced by the antibody, which then directly associates with the AuNPs [44]. Prior to the conjugation reaction, the antibodies were purified using a spin column from Abcam™ (Cambridge, UK).
The steps of the modification process are shown in Figure 1. First, the pH of the nanoparticles was increased to approximately 7.5 with potassium carbonate. A 20 µL aliquot of 0.5 mg/mL antibody solution was added to 0.5 mL of the gold nanoparticle solution whilst being vortexed. The reaction was incubated for 30 min. A total of 100 µL of 5% bovine serum albumin (BSA) suspended in diluted phosphate-buffered saline (PBS) was then added and the solution was vortexed for 1 h. The modified nanoparticle solution was centrifuged and the pellet was resuspended in 100 µL of the resuspension buffer. The resuspension buffer was phosphate-buffered saline (PBS)-diluted by a factor of 10 with 1% sucrose. This resuspension resulted in a conjugated nanoparticle solution that was ten times more concentrated than the original nanoparticle solution.

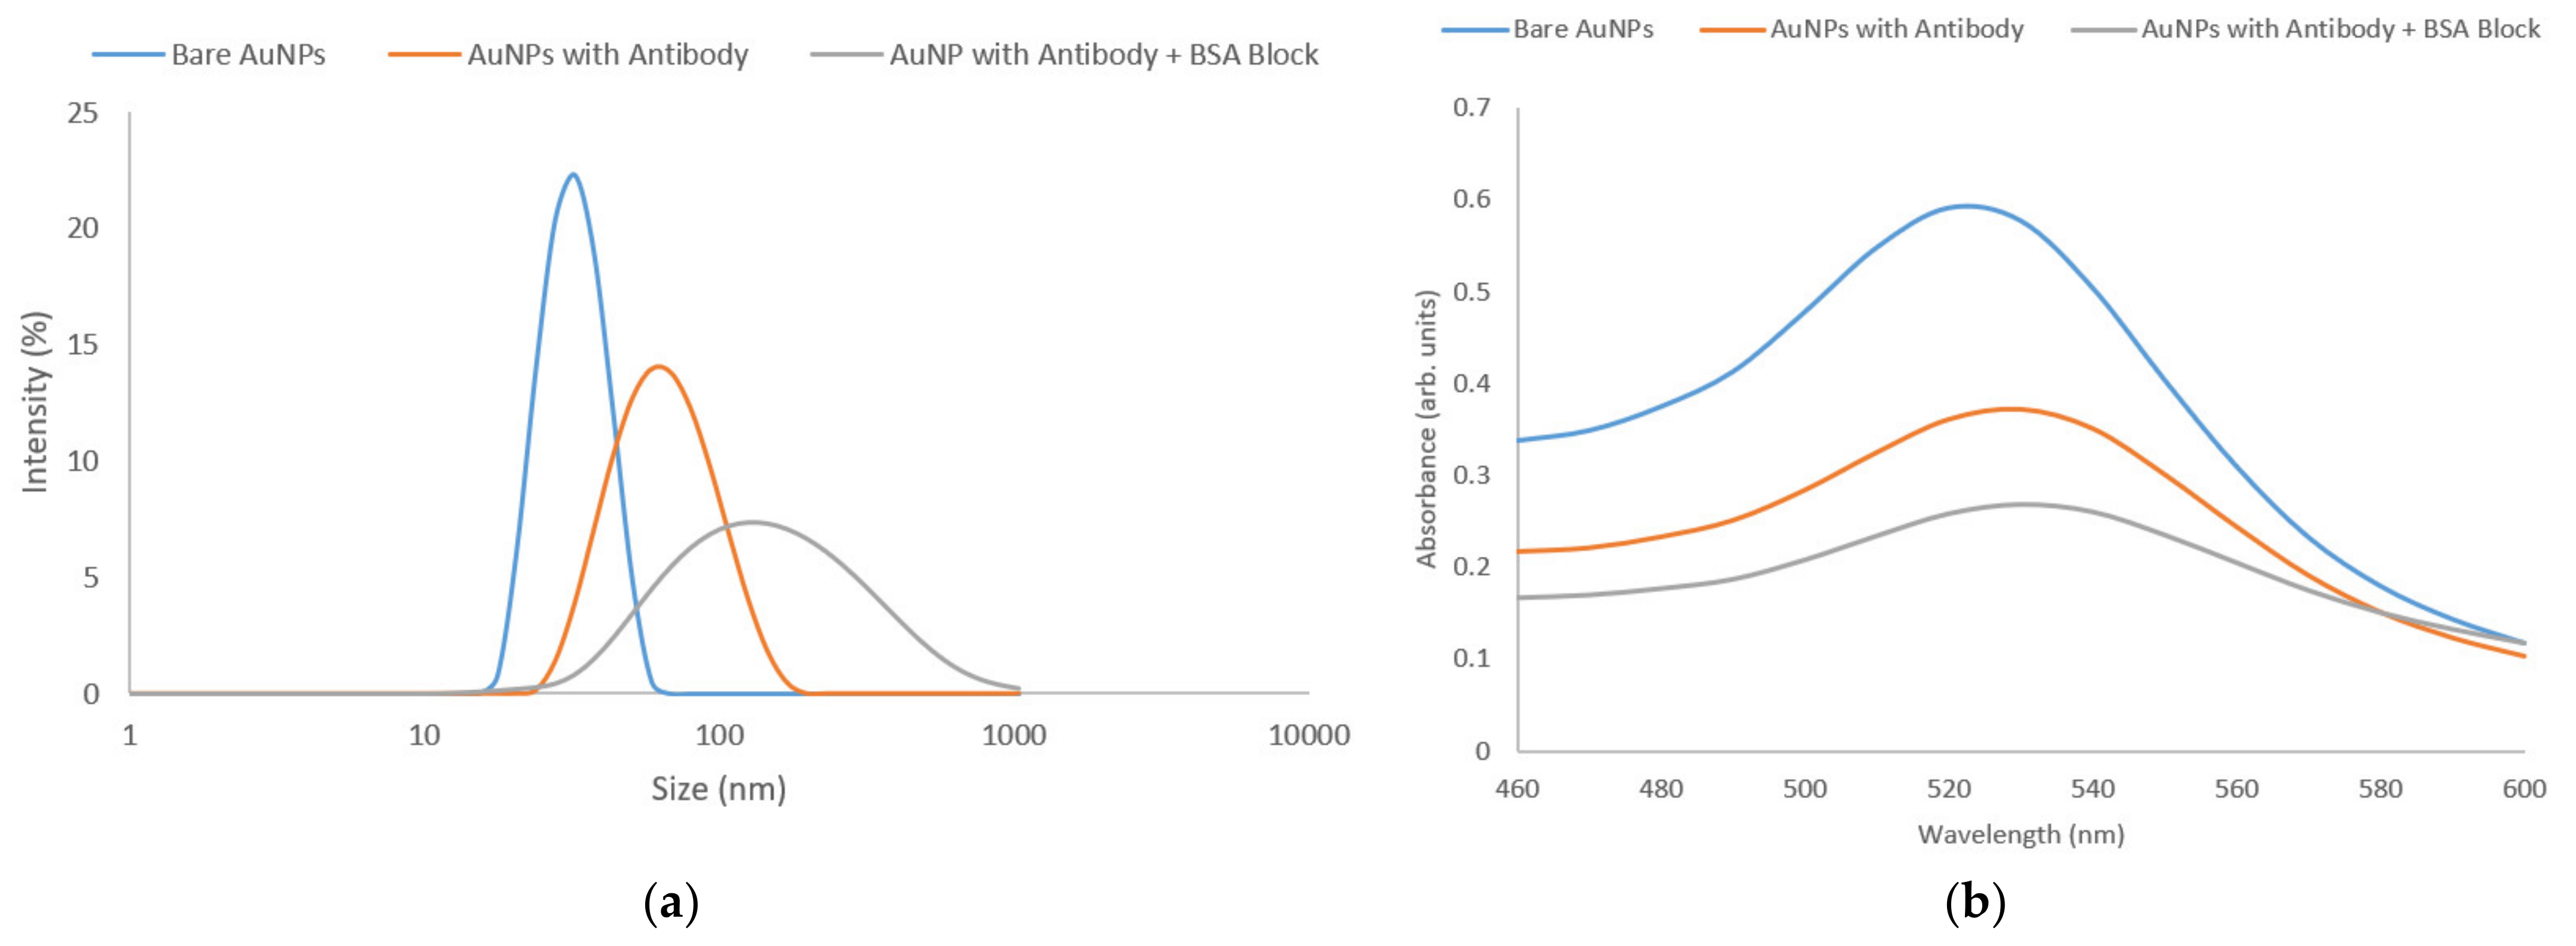
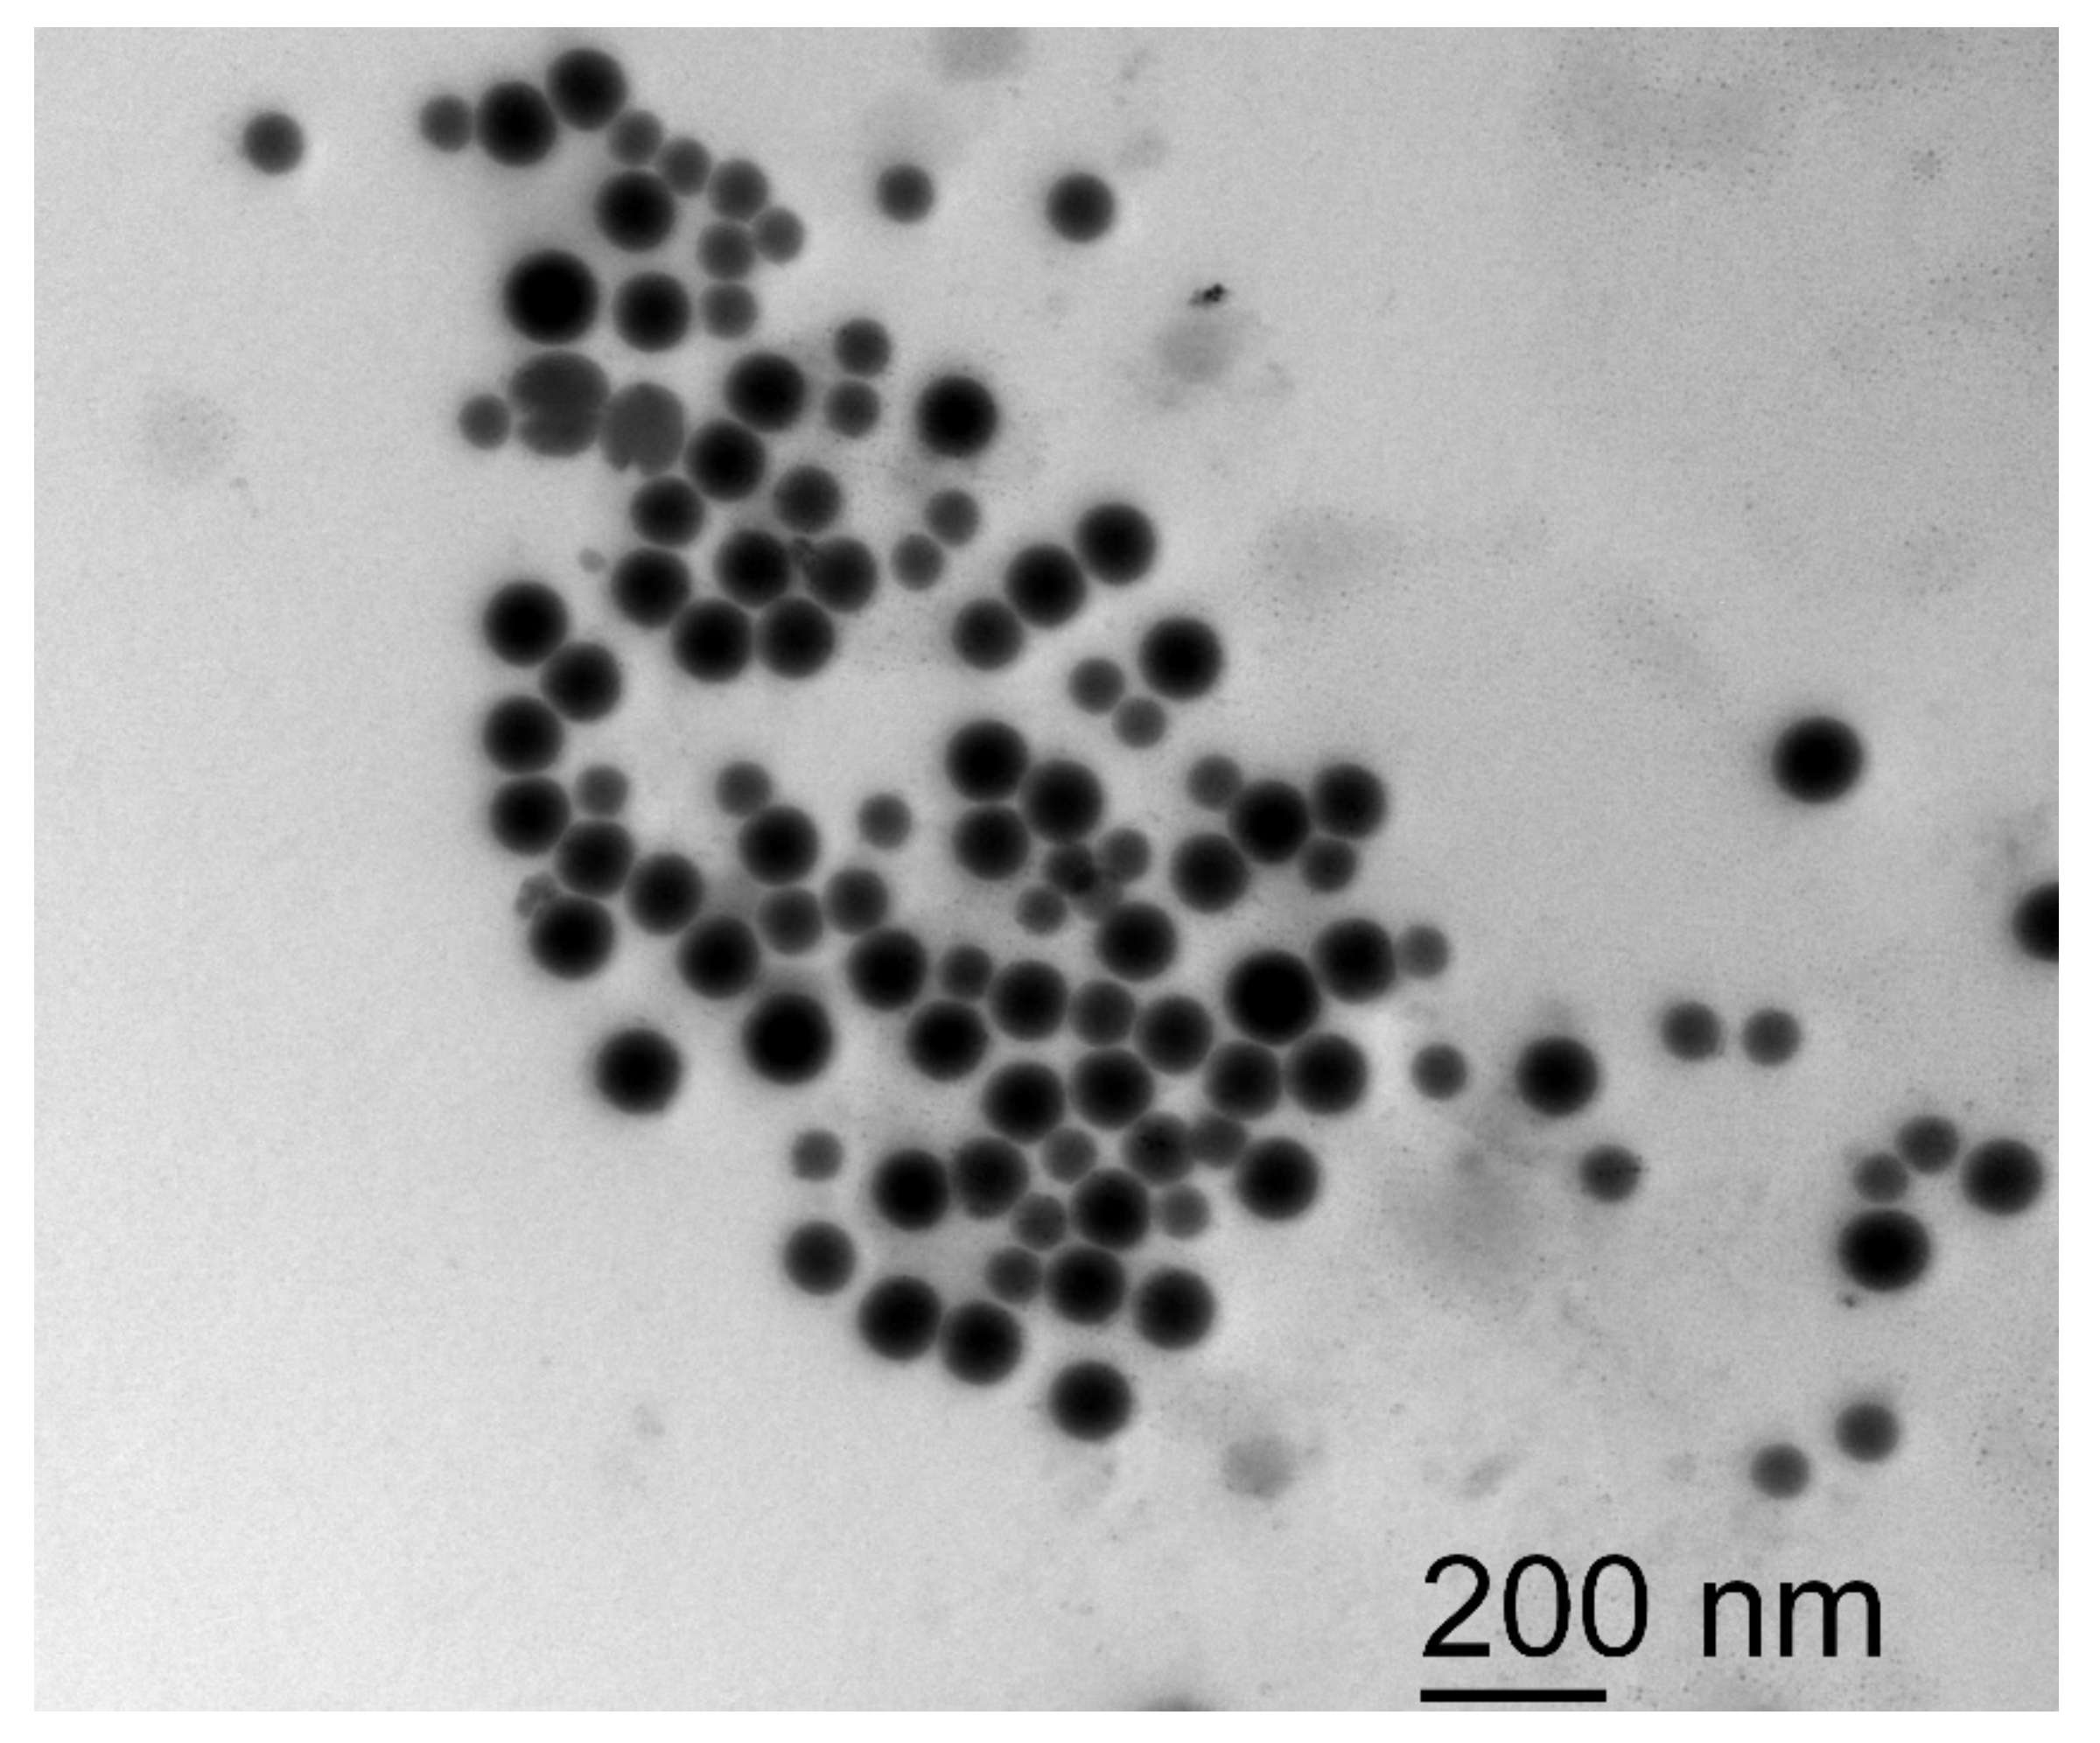
2.4. Nanoparticle Characterisation

The nanoparticles were characterised at three stages using dynamic light scattering (DLS) by a Malvern Zetasizer Pro (Figure 2a) and a Cytation 5 UV-Vis reader by Biotek™ (Winooski, VT, USA) (Figure 2b). DLS was used to measure the hydrodynamic radius of the particles and Cytation 5 provided the absorbance spectra. For both analyses, the spectra were obtained for the AuNPs before the modification, after passive absorption with the anti-IgG Fc-specific antibody, and at the end of the modification process when the antibody—AuNP complex had been blocked with 5% BSA. The bare AuNPs were also photographed using a scanning electron microscope (SEM) (Figure 3). The instruments used were a JEM-1400 by JEOL™ (Tokyo, Japan) and an Orius SC100 by Gatan™ (Pleasanton, CA, USA).

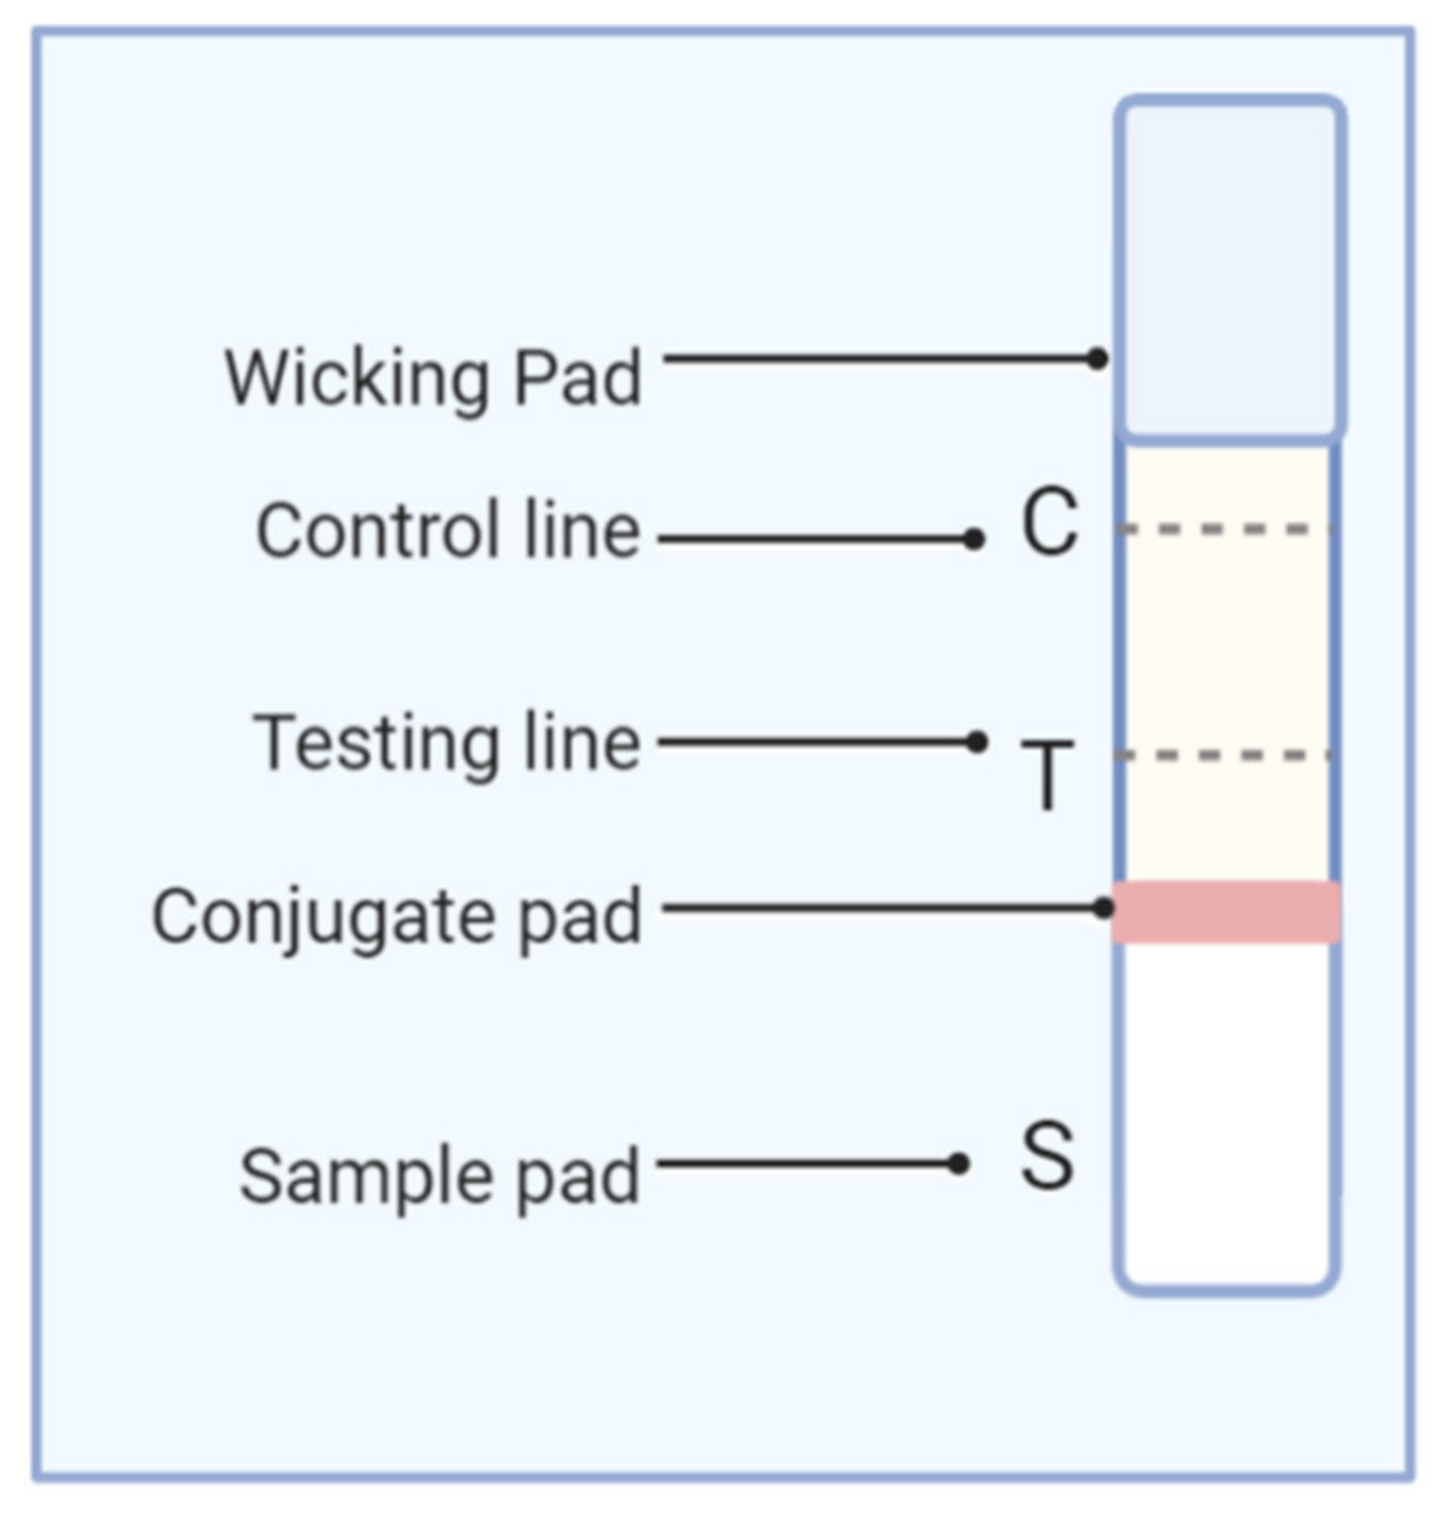
2.5. Preparation of the Test Strip

The layout of the test strip is displayed in Figure 4. The card material included a nitrocellulose membrane with adhesive at both ends. This material was cut into strips with a width of 0.5 cm and length of 6 cm. Glass fibre and cellulose were cut into pads that were 0.5 cm wide and 2 cm long and set aside. The glass fibre and cellulose pads acted as the sample and wicking pad, respectively.
The nitrocellulose strips were placed in a humidity chamber for 15 min. After the humidification, the antibodies were added to form the test and control lines. The test line was formed by pipetting 5 µL of a SARS-CoV-2 spike protein S1 and S2 antigen solution (0.5 mg/mL) in a line formation on the nitrocellulose strip. The control line was formed using the same method but with human IgG (0.5 mg/mL). The strips were dried at 37 °C for 1 h. The strips were blocked with diluted tris-buffered saline containing 2% BSA and 0.1% poly-vinyl alcohol for 2 h. The strips were then washed 3 times with diluted PBS with 0.05% Tween 20 and dried.
The modified nanoparticles (10 µL) were added to the 0.5 cm edge of the glass fibre pad and dried for 10 min before being pressed onto an adhesive end of the nitrocellulose strip. This formed the sample pad. The cellulose pad was added to the other adhesive end of the strip to act as the wicking pad.

2.6. Control Line Selection

As shown in Figure 4, the lateral flow strips had a positive control line in addition to the test line. After running the lateral flow strip, a red control line indicated that the lateral flow results were valid. For this line, we used human IgG. This antibody was chosen because it reliably bound to the anti-IgG Fc-specific antibody that was immobilised on the AuNPs. This binding occurred whether or not there were SARS-CoV-2 antibodies in the saliva sample. Therefore, it was an effective positive control to indicate that the lateral flow strip was functioning and that the nanoparticles had migrated across the strip.

2.7. Sample Preparation

Healthy human saliva was collected and stored at −20 °C. Before use, the saliva was centrifuged for 10 min at 7000× g. The supernatant was combined with a lateral flow running buffer using 10 µL of saliva for every 100 µL of buffer. The running buffer was composed of 1% BSA, 0.5% sucrose, 0.05% Tween 20, and PBS diluted by a factor of 10. To create the positive samples, we added a SARS-CoV-2 antibody solution to the saliva containing antibodies against SARS-CoV-2 spike protein S1 and SARS-CoV-2 spike protein S2. The total antibody concentrations ranged from 10 ng/mL to 100 µg/mL. All antibodies in the saliva were added by the researchers. Therefore, the exact concentrations were known and an additional concentration analysis and validation were not necessary. The presence of the antibodies was proven using the LFA.

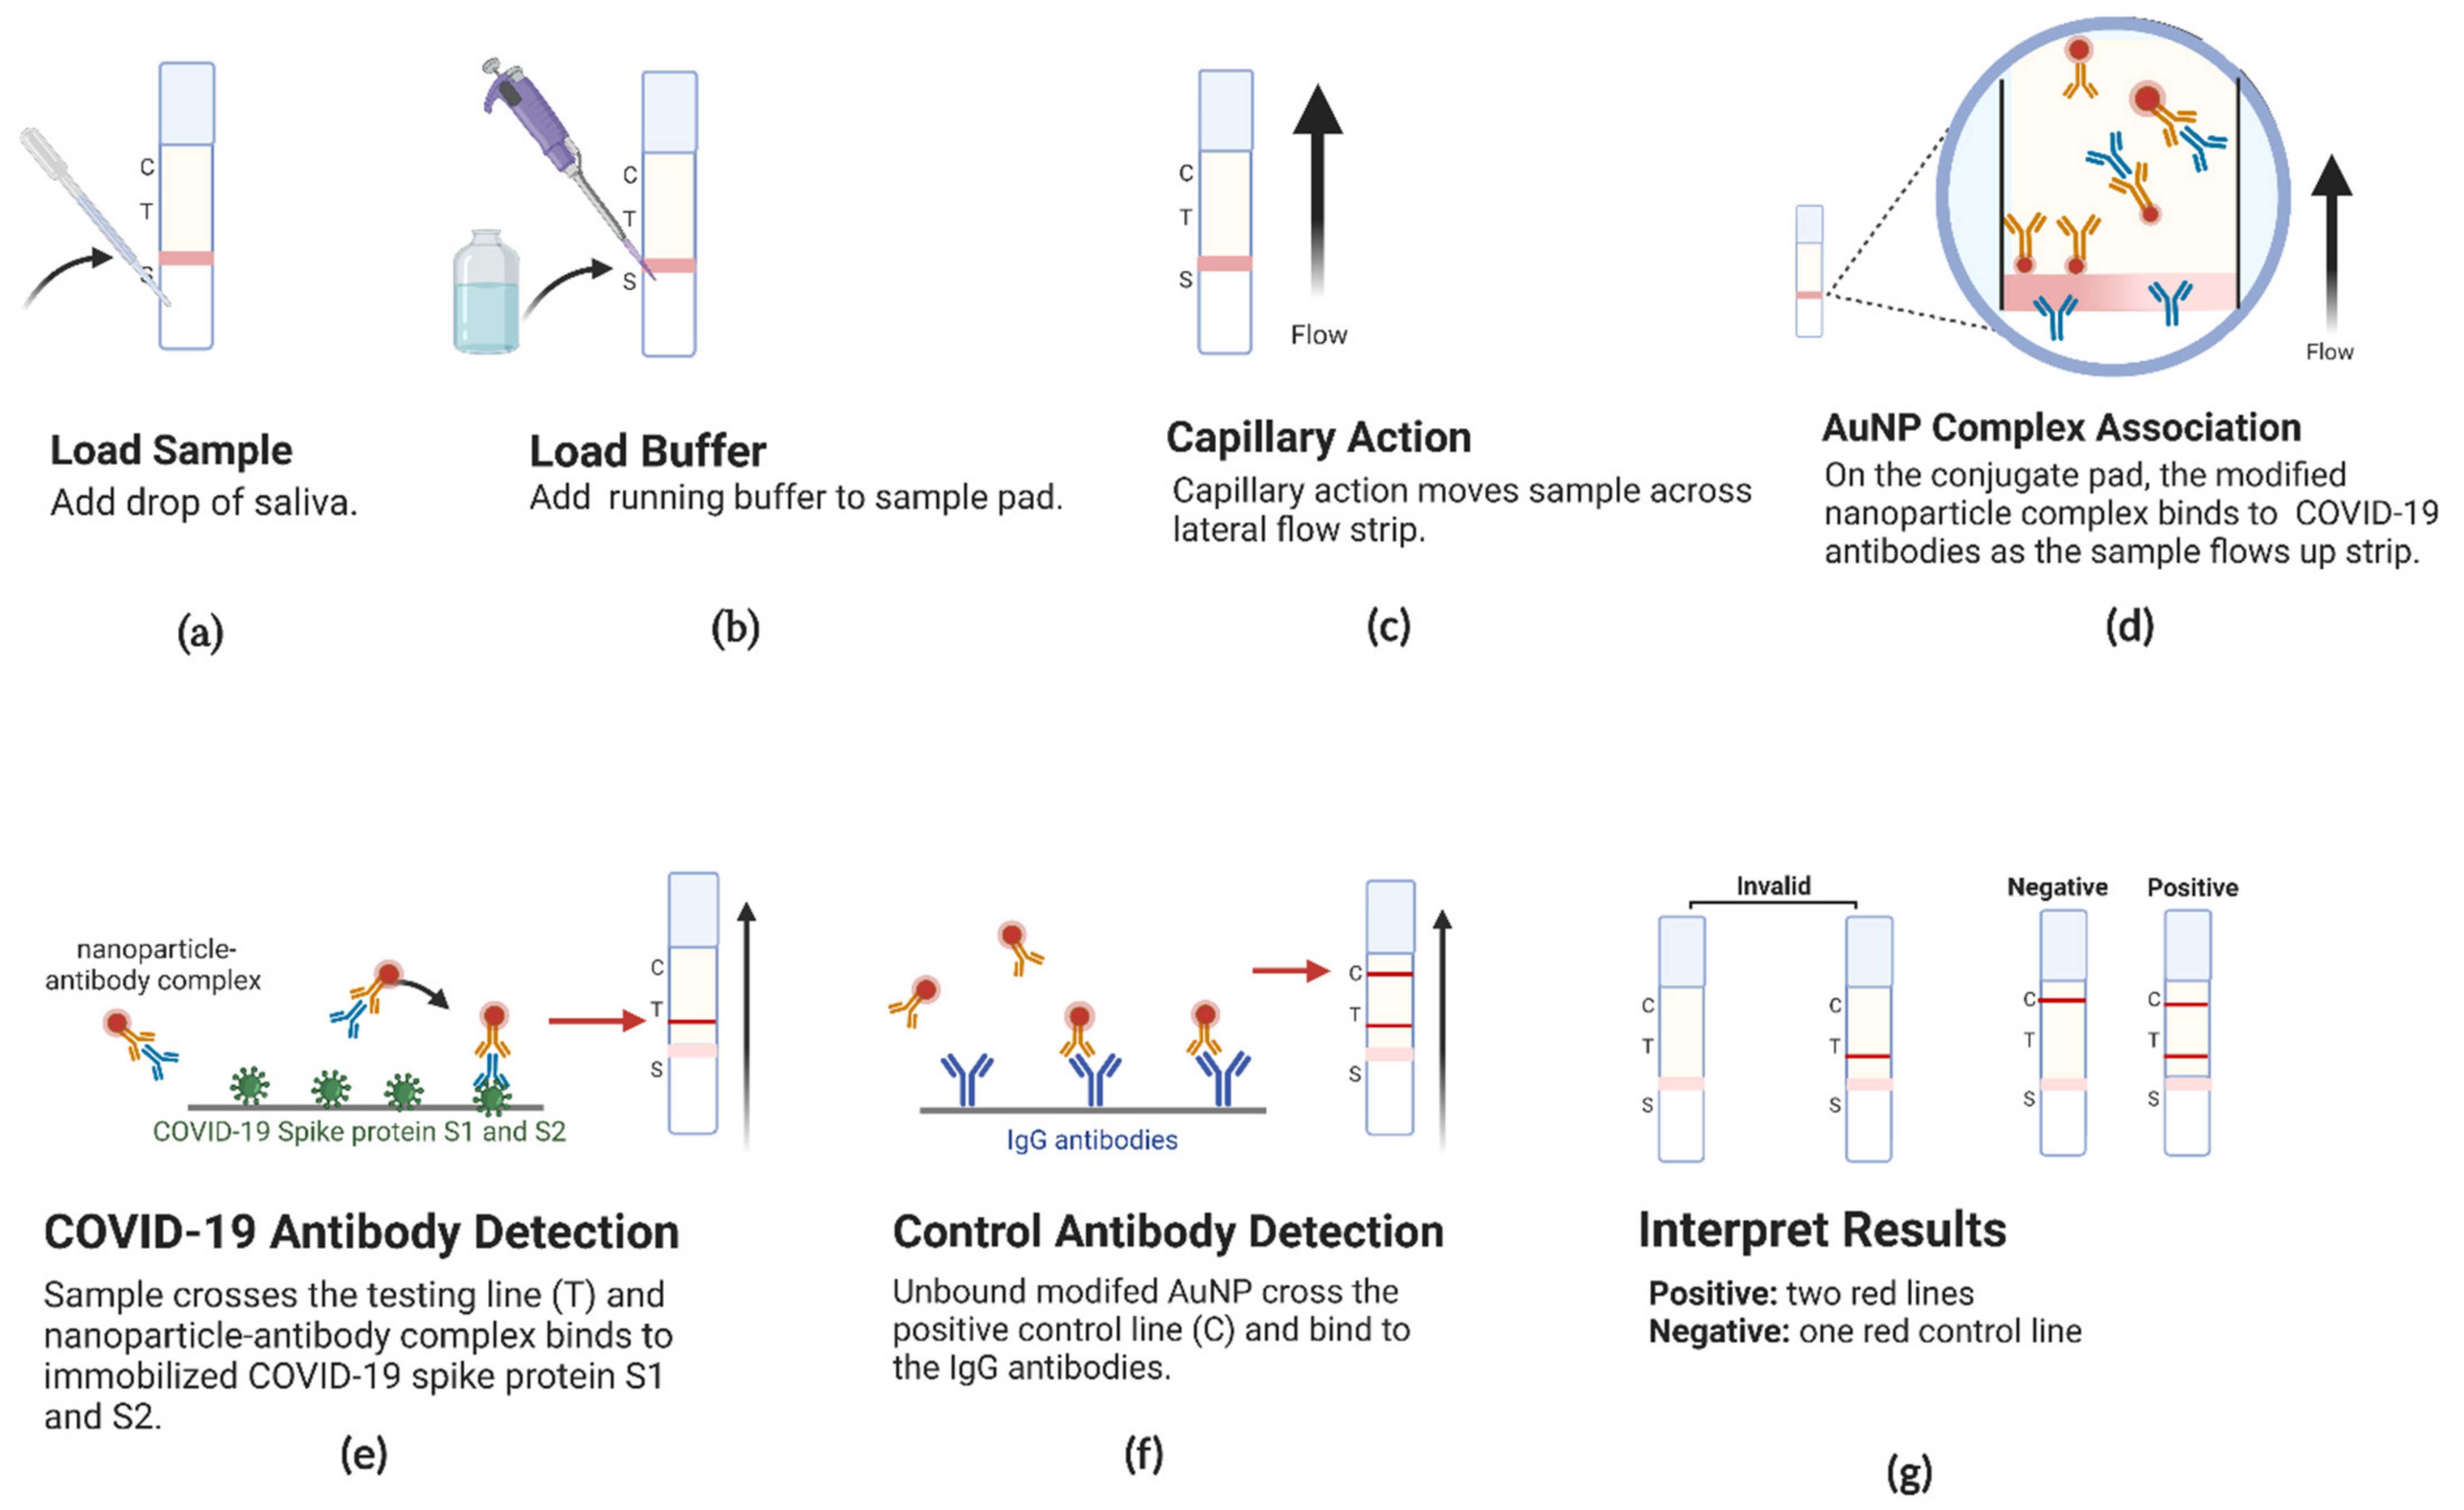
2.8. Lateral Flow Process

The lateral flow process is presented in Figure 5. The running buffer contained 1% BSA, 0.5% sucrose, 0.05% Tween 20, and diluted PBS.

3. Results

3.1. Characterisation Results

The DLS and UV-Vis results are shown in Figure 2. The bare AuNPs, antibody—AuNP complex, and the blocked complexes had a peak size of 32.3 nm, 59.07 nm, and 125.6 nm, respectively, as determined by DLS. This increase in size indicated that the passive absorption and blocking procedures successfully coated the surface of the gold nanoparticles. The UV-Vis spectra presented peak absorbances at 520 nm, 530 nm, and 535 nm, for AuNPs (Figure 1a), the antibody—AuNP complex (Figure 1b), and the blocked complex (Figure 1c), respectively. This increase in the peak absorbance wavelength indicated that the diameter of the NPs increased and the modification had taken place. The modification process led to a slight aggregation. This contributed to the red shift and increased the variance, as indicated by the broadness of the UV-Vis curve. The spectra for the bare AuNPs, AuNPs with antibodies, and the AuNPs with antibodies and BSA corresponded with steps a, b, and c in Figure 1, respectively. A SEM image of the AuNPs is provided in Figure 3. The average size of the AuNPs was determined by SEM (~35 nm).

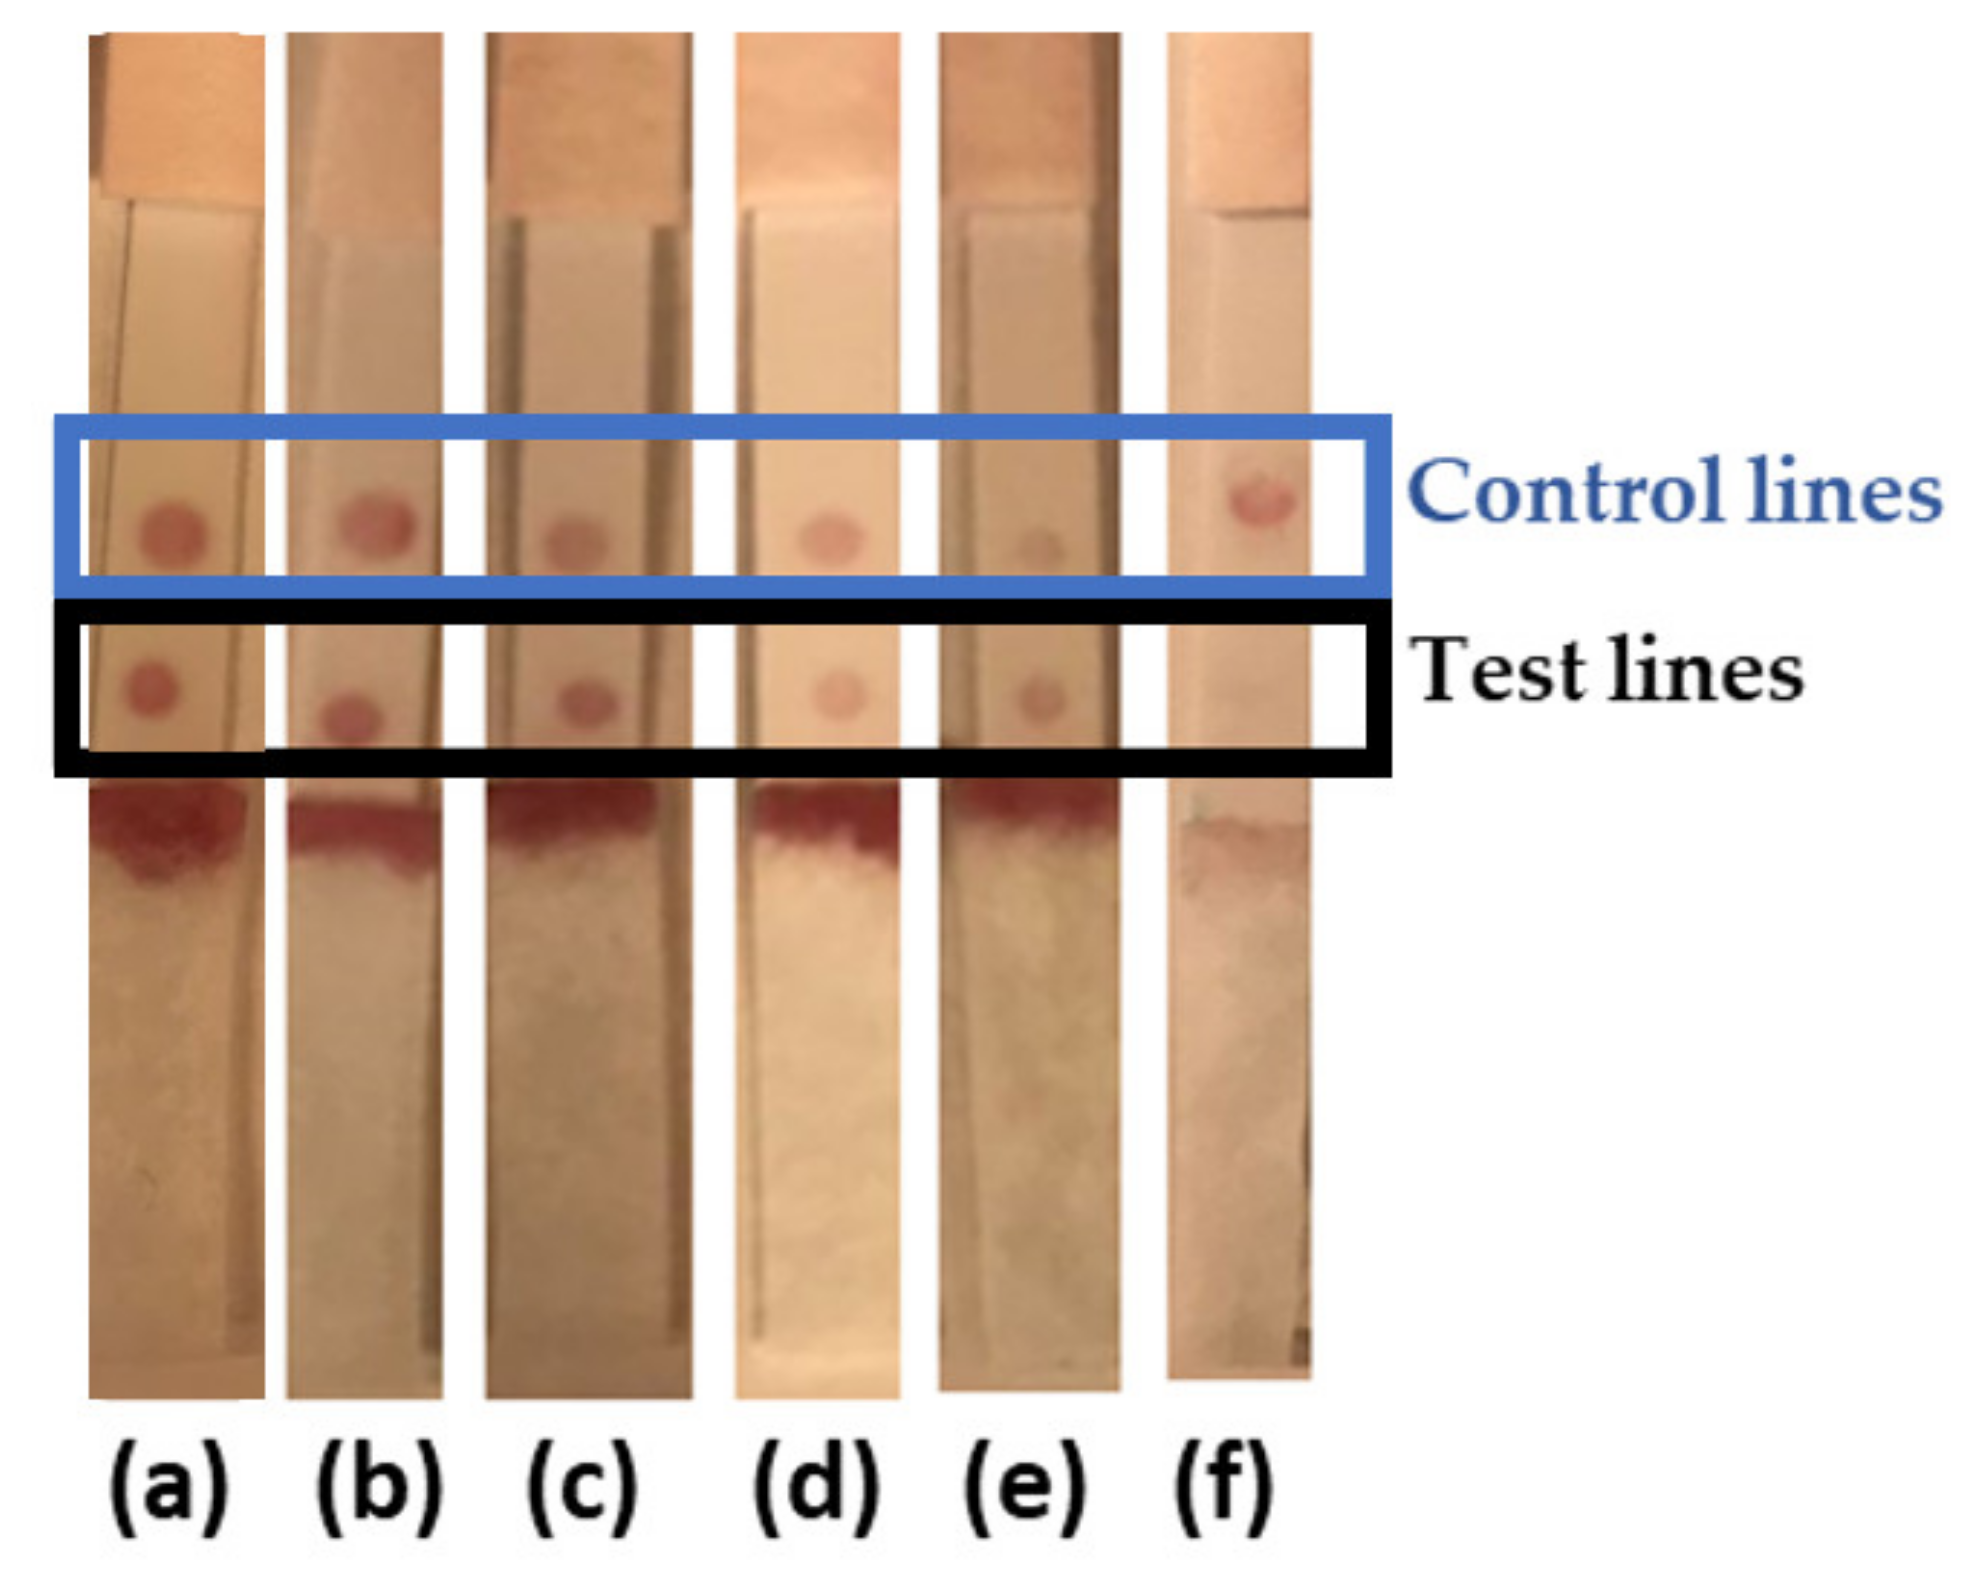
3.2. Qualitative Results

The assay result was visually observed ten minutes after the addition of the sample and running buffer. The presence of two red lines indicated a positive result, meaning that SARS-CoV-2 antibodies were detected in the saliva sample. The observed colour of the test line was more intense for the positive samples with higher antibody concentrations. Lines were observed with the following antibody concentrations in the diluted saliva samples: 100 µg/mL, 10.0 µg/mL, 1.0 µg/mL, 100 ng/mL, and 10.0 ng/mL. All those samples showed positive results. However, the 100 ng/mL and 10.0 ng/mL samples showed the faintest lines. Photos of the strips are provided in Figure 6. The control and test lines shown in Figure 6 were made with small circles of antibodies on the strip instead of straight lines across the strip (as shown in Figure 4 and Figure 5). This was done to save the biological reagents during the development process.

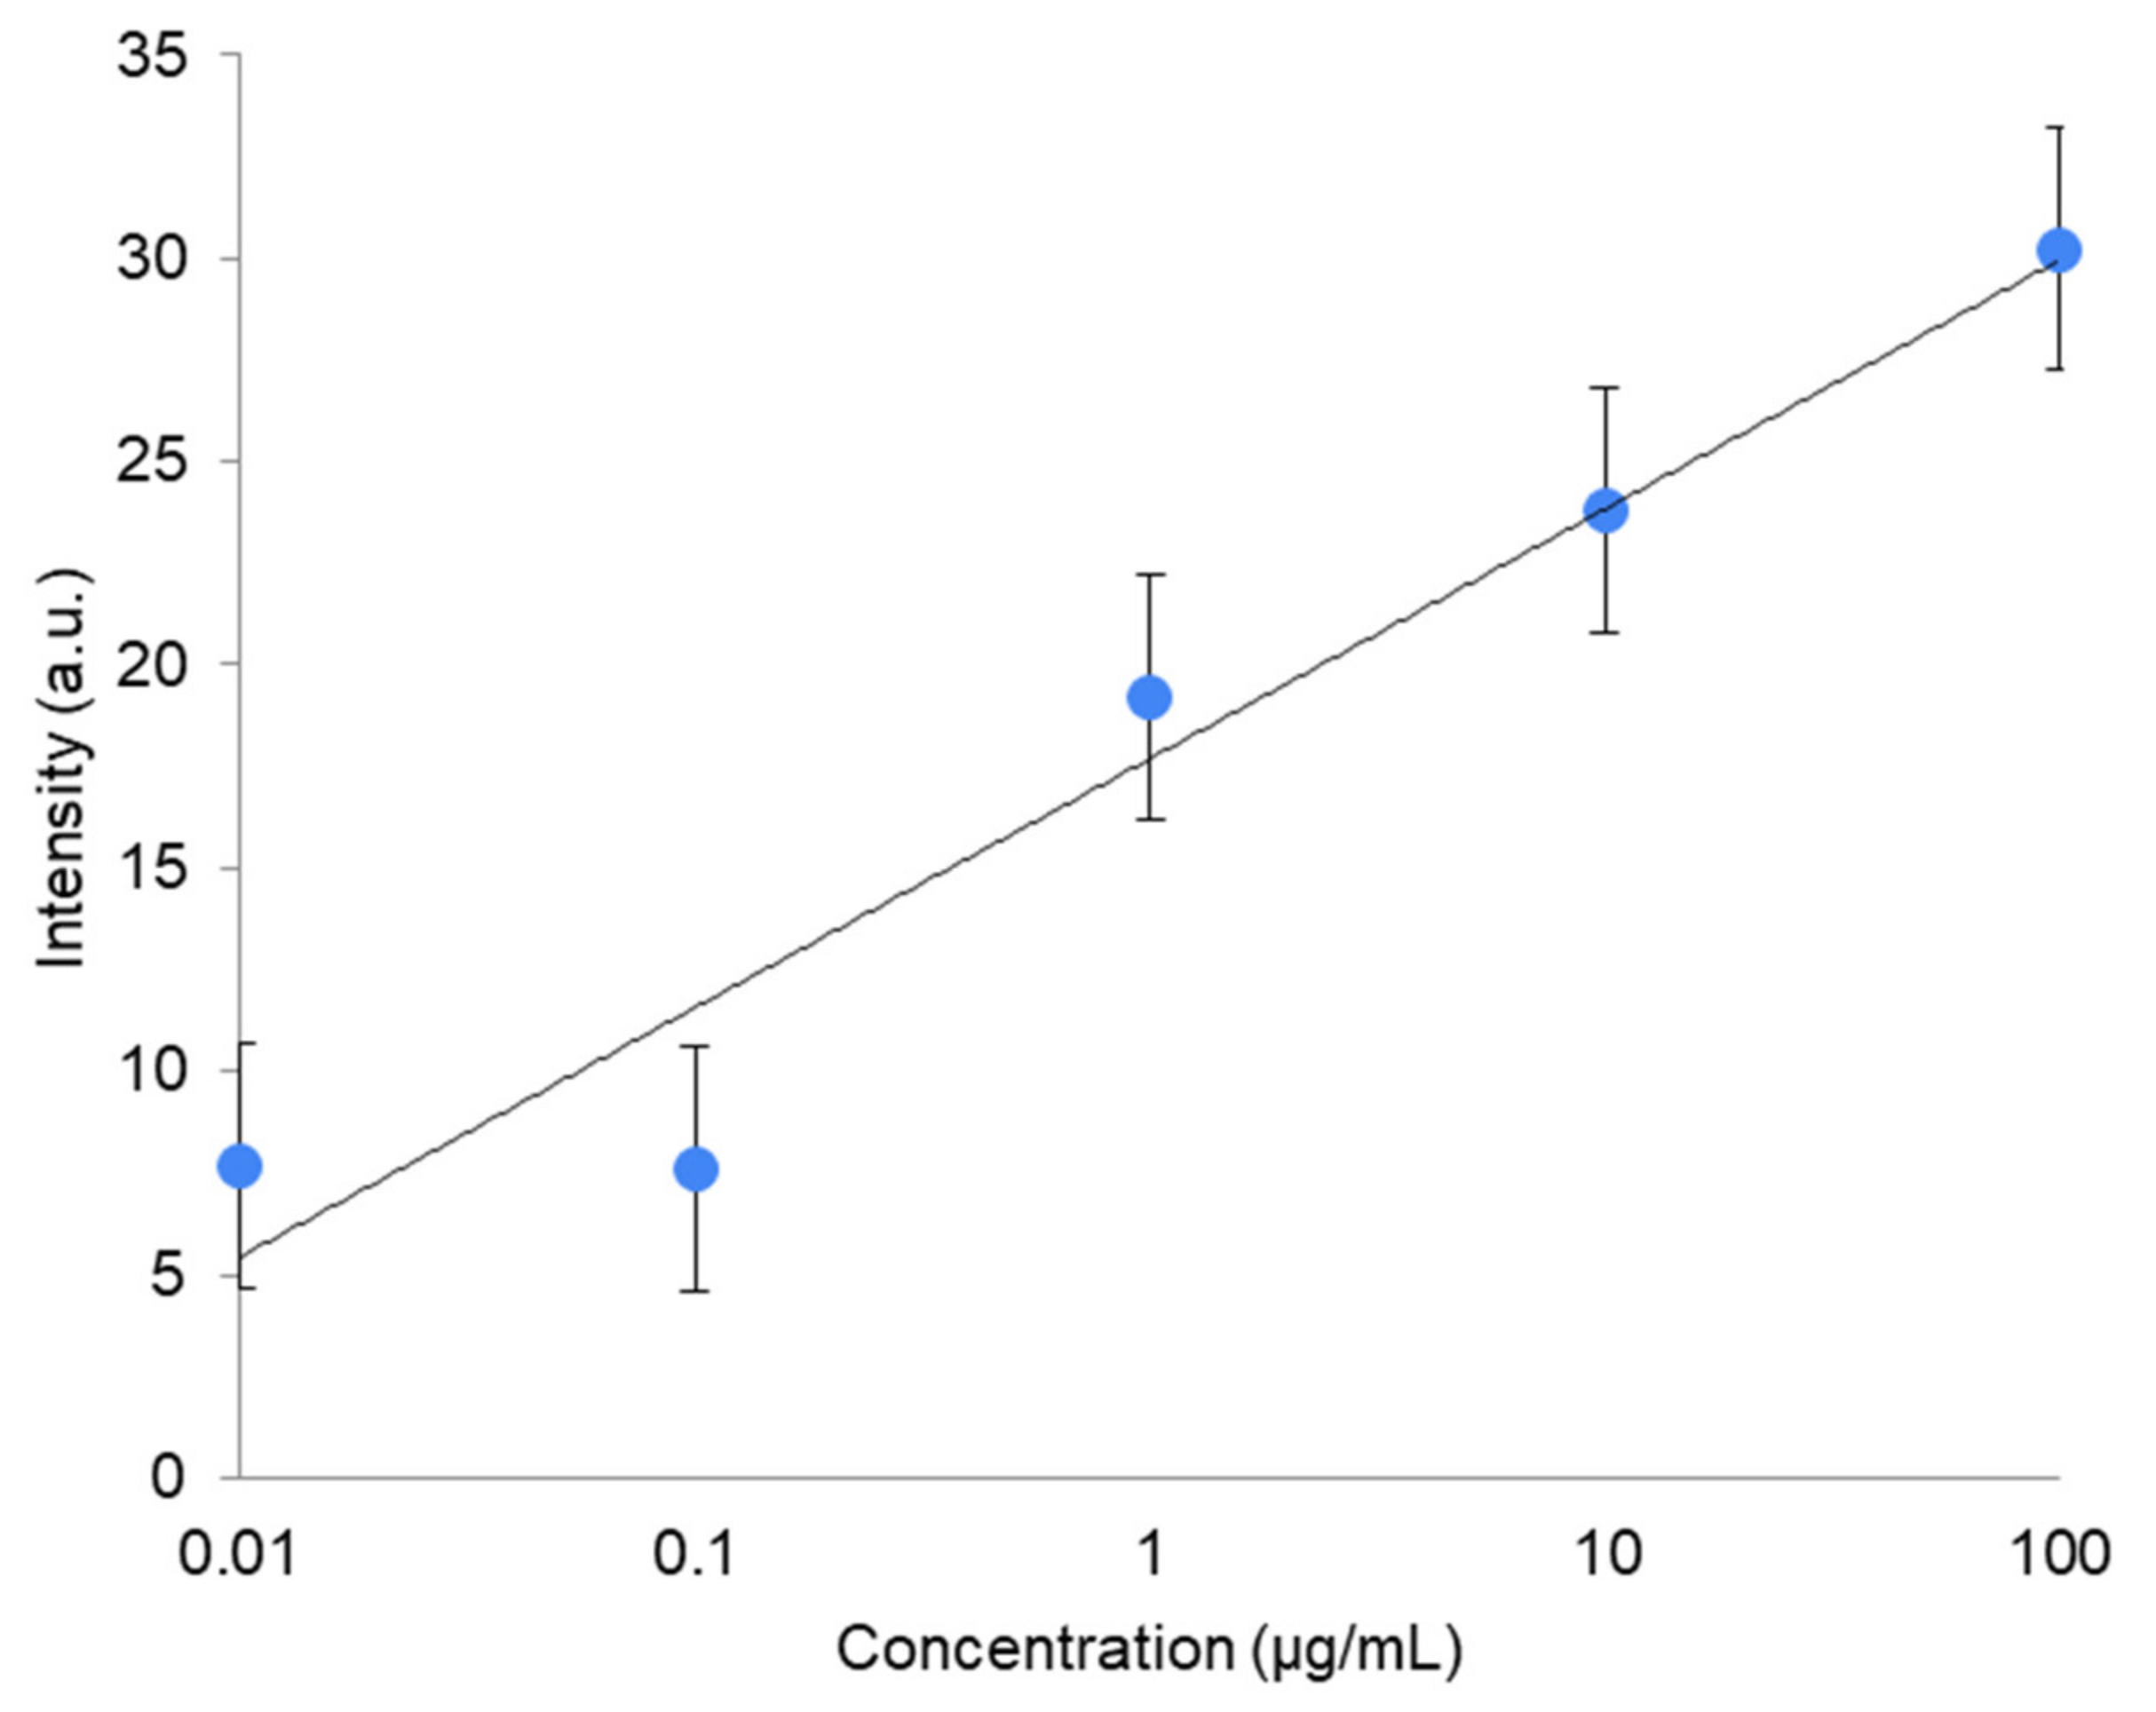
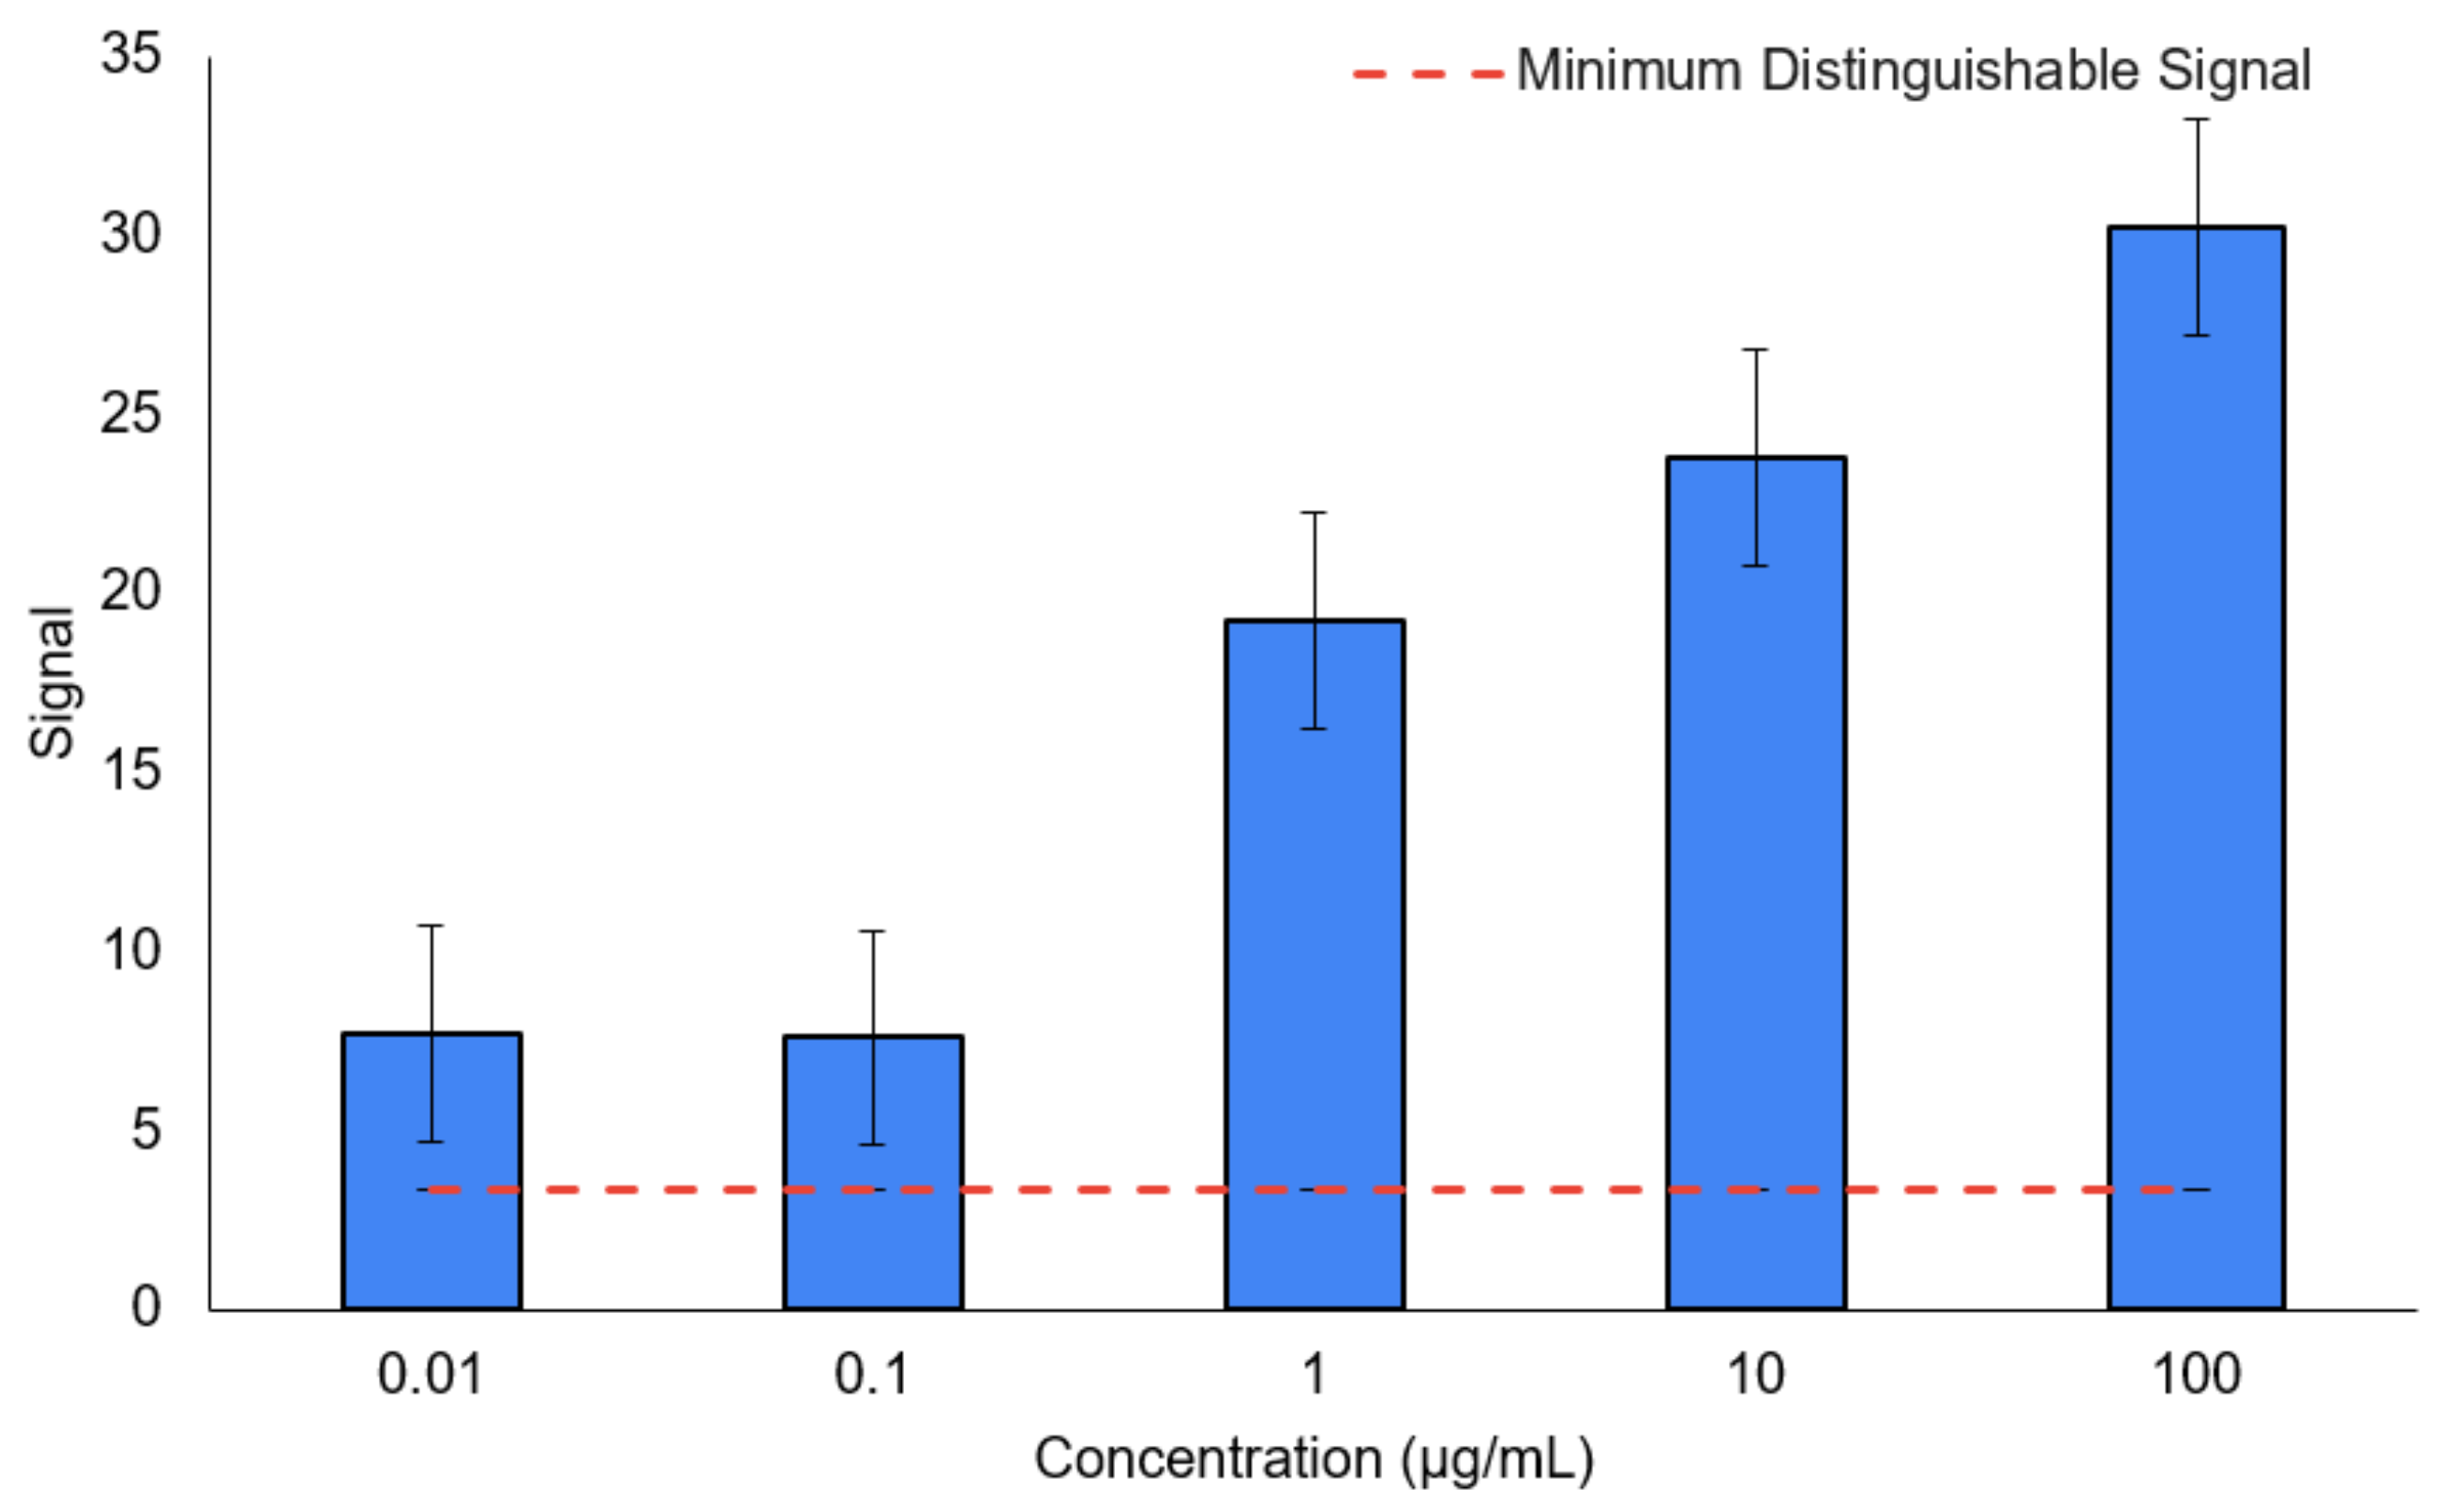
3.3. Quantitative Results

A cell phone was used to take pictures of the lateral flow strips after running the samples with varying antibody concentrations ranging from 0.0 µg/mL to 100 µg/mL. The colour intensity of the test line in these images was analysed with ImageJ™. Six strips were analysed for each concentration and the colour intensity values were compared with the corresponding value from the negative results. Using a one-tailed t-test, we concluded that the difference in colour intensity between the positive strips and negative strips was statistically significant at a 95% confidence level for the strips with 100 µg/mL, 10.0 µg/mL, 1.0 µg/mL, 100 ng/mL, and 10 ng/mL of SARS-CoV-2 antibodies in the saliva sample. A calibration curve was created to show the correlation between the difference in colour intensity and the concentration (Figure 7).
The minimum distinguishable signal was calculated by considering the mean blank signal and three times the standard deviation of the blank signals [45]. This value was the minimum difference in colour intensity that the lateral flow strip had to show to be considered as a positive result. This minimum signal was calculated to be 3.33 arbitrary units. To calculate our limit of detection, we used our calibration curve to convert this value into the corresponding concentration value of 4 ng/mL. The same method was used to calculate the limit of quantification, except that the standard deviation was multiplied by ten as opposed to three. The limit of quantification was calculated to be 1.32 µg/mL. Figure 8 shows our results in comparison with the minimum distinguishable signal.
A total of 15 positive saliva samples were tested. For every positive antibody concentration, 3 strips were made and run. All 15 strips yielded a positive result, thereby indicating a 0% false negative rate. We also ran 15 strips without antibodies to test for false positives. Of these 15 strips, one strip showed invalid results because the AuNPs did not run over the strip. The other 14 strips showed a negative result. Therefore, we obtained a 0% false positive rate.

4. Discussion

The proposed assay is a rapid saliva-based antibody screening tool for SARS-CoV-2. We started by synthesising, modifying, and characterising gold nanoparticles. We then used their optical properties to create an antibody screening tool that could be read with the naked eye in just 10 min and quantified using a cell phone.
Our quantification method required a consistent lighting scheme to avoid changes in image colour due to external lighting. For a further development, a cell phone adapter could be created that controls the lighting shown in the photo [35]. Additionally, the quantification process could be enhanced by developing a mobile application for an on-the-go image analysis.
By using saliva samples, we eliminated the need for blood samples or swabs. One limitation of saliva samples is their low concentration of antibodies. Typical levels of IgG antibodies in human saliva are approximately 15 µg/mL compared with 15 mg/mL in serum or blood [28]. After exposure to COVID-19, the concentration of SARS-CoV-2 IgG antibodies in saliva reaches 25.5 ± 47.7 μg/mL [46]. Our calculated detection limit (4 ng/mL) was three orders of magnitude below this level and lower than the limit of detection for pre-existing saliva-based antibody LFAs for SARS-CoV-2 [34]. Table 1 shows a comparison between the proposed assay and other LFAs previously reported in the literature for the detection of SARS-CoV-2 IgG antibodies in different samples [13,14,15,16,17,18,19,20,21,34,35]. Our method exhibited a lower limit of detection than other quantitative LFAs based on an image analysis and magnetic measurements [16,17,34]. Other tests based on surface-enhanced Raman spectroscopy, fluorescence spectroscopy, and reflectance measurements showed lower limits of detection [13,14,15,19]. However, they required more complex conjugates and instruments that, despite being portable, are expensive and more complicated to use and require trained personnel to perform the analysis. The methodology described here is advantageous because low limits of detection were achieved using saliva samples and simple Au nanoparticle-based conjugates and image analyses.
As the pandemic approaches its final stages and public health authorities continue to monitor COVID-19 immunity levels across populations, efficient and accessible ways to identify individuals with and without SARS-CoV-2 antibodies are required. Previous studies have shown the correlation between saliva and the serum levels of IgG antibodies for COVID-19. Based on this, salivary studies may be a non-invasive alternative to serology testing and can yield helpful information regarding immunity. By using our method, COVID-19 antibodies can rapidly be detected even at low levels and quantified using a regular cell phone.

Author Contributions

P.T. performed the experiments, analysed the results, and wrote the paper. A.L.d.C.B. assisted with the planning as well as the experiment completion and strip photography. G.I.-R. performed the preliminary experiments. A.G.B. oversaw the project. All authors have read and agreed to the published version of the manuscript.

Funding

This research was funded by Natural Sciences and Engineering Research Council (NSERC), CFI, BCKDF, and the University of Victoria, Department of Chemistry. Researchers received the NSERC Discovery Grant (#2020-04236) and NSERC Alliance COVID-19 grant (#550059-29).

Institutional Review Board Statement

Not applicable.

Informed Consent Statement

Not applicable.

Data Availability Statement

Data are available upon request to the corresponding author.

Acknowledgments

This work was supported by NSERC, CFI, BCKDF, and the University of Victoria. Gisela Ibáñez-Redín gratefully acknowledges the Emerging Leaders in the Americas Program and the DFATD. Animated diagrams were created with BioRender.com (accessed on 19 June 2022). The results were quantified using ImageJ.

Conflicts of Interest

The authors declare no conflict of interest.

References

  1. Lai, C.-C.; Shih, T.-P.; Ko, W.-C.; Tang, H.-J.; Hsueh, P.-R. Severe acute respiratory syndrome coronavirus 2 (SARS-CoV-2) and coronavirus disease-2019 (COVID-19): The epidemic and the challenges. Int. J. Antimicrob. Agents 2020, 55, 105924. [Google Scholar] [CrossRef] [PubMed]
  2. Lee, S.; Schmidt-Klau, D.; Verick, S. The labour market impacts of the COVID-19: A global perspective. Indian J. Labour Econ. 2020, 63, 11–15. [Google Scholar] [CrossRef] [PubMed]
  3. Peaper, D.R.; Kerantzas, C.A.; Durant, T.J. Advances in molecular infectious diseases testing in the time of COVID-19. Clin. Biochem. 2022; in press. [Google Scholar]
  4. Zhang, Q.; Yin, B.; Hao, J.; Ma, L.; Huang, Y.; Shao, X.; Li, C.; Chu, Z.; Yi, C.; Wong, S.H.D. An AIEgen/graphene oxide nanocomposite (AIEgen@ GO)-based two-stage “turn-on” nucleic acid biosensor for rapid detection of SARS-CoV-2 viral sequence. Aggregate 2022, e195. [Google Scholar] [CrossRef] [PubMed]
  5. Yin, B.; Ho, W.K.H.; Zhang, Q.; Li, C.; Huang, Y.; Yan, J.; Yang, H.; Hao, J.; Wong, S.H.D.; Yang, M. Magnetic-Responsive Surface-Enhanced Raman Scattering Platform with Tunable Hot Spot for Ultrasensitive Virus Nucleic Acid Detection. ACS Appl. Mater. Interfaces 2022, 14, 4714–4724. [Google Scholar] [CrossRef]
  6. Lam, C.Y.K.; Zhang, Q.; Yin, B.; Huang, Y.; Wang, H.; Yang, M.; Wong, S.H.D. Recent advances in two-dimensional transition metal dichalcogenide nanocomposites biosensors for virus detection before and during COVID-19 outbreak. J. Compos. Sci. 2021, 5, 190. [Google Scholar] [CrossRef]
  7. Anichini, G.; Terrosi, C.; Gandolfo, C.; Gori Savellini, G.; Fabrizi, S.; Miceli, G.B.; Cusi, M.G. SARS-CoV-2 antibody response in persons with past natural infection. N. Engl. J. Med. 2021, 385, 90–92. [Google Scholar] [CrossRef]
  8. Wei, J.; Stoesser, N.; Matthews, P.C.; Ayoubkhani, D.; Studley, R.; Bell, I.; Bell, J.I.; Newton, J.N.; Farrar, J.; Diamond, I. Antibody responses to SARS-CoV-2 vaccines in 45,965 adults from the general population of the United Kingdom. Nat. Microbiol. 2021, 6, 1140–1149. [Google Scholar] [CrossRef]
  9. Centers for Disease Control and Prevention. Interim Guidelines for COVID-19 Antibody Testing. Available online: https://www.cdc.gov/coronavirus/2019-ncov/lab/resources/antibody-tests-guidelines.html#print (accessed on 20 December 2021).
  10. Hall, V.J.; Foulkes, S.; Charlett, A.; Atti, A.; Monk, E.J.M.; Simmons, R.; Wellington, E.; Cole, M.J.; Saei, A.; Oguti, B.; et al. SARS-CoV-2 infection rates of antibody-positive compared with antibody-negative health-care workers in England: A large, multicentre, prospective cohort study (SIREN). Lancet 2021, 397, 1459–1469. [Google Scholar] [CrossRef]
  11. Lumley, S.F.; O’Donnell, D.; Stoesser, N.E.; Matthews, P.C.; Howarth, A.; Hatch, S.B.; Marsden, B.D.; Cox, S.; James, T.; Warren, F.; et al. Antibody Status and Incidence of SARS-CoV-2 Infection in Health Care Workers. N. Engl. J. Med. 2021, 384, 533–540. [Google Scholar] [CrossRef]
  12. Centers for Disease Control and Prevention. Antibodies and COVID-19. Available online: https://www.cdc.gov/coronavirus/2019-ncov/your-health/about-covid-19/antibodies.html#print (accessed on 5 February 2022).
  13. Liu, H.; Dai, E.; Xiao, R.; Zhou, Z.; Zhang, M.; Bai, Z.; Shao, Y.; Qi, K.; Tu, J.; Wang, C. Development of a SERS-based lateral flow immunoassay for rapid and ultra-sensitive detection of anti-SARS-CoV-2 IgM/IgG in clinical samples. Sens. Actuators B Chem. 2021, 329, 129196. [Google Scholar] [CrossRef]
  14. Chen, S.; Meng, L.; Wang, L.; Huang, X.; Ali, S.; Chen, X.; Yu, M.; Yi, M.; Li, L.; Chen, X. SERS-based lateral flow immunoassay for sensitive and simultaneous detection of anti-SARS-CoV-2 IgM and IgG antibodies by using gap-enhanced Raman nanotags. Sens. Actuators B Chem. 2021, 348, 130706. [Google Scholar] [CrossRef] [PubMed]
  15. Hung, K.-F.; Hung, C.-H.; Hong, C.; Chen, S.-C.; Sun, Y.-C.; Wen, J.-W.; Kuo, C.-H.; Ko, C.-H.; Cheng, C.-M. Quantitative Spectrochip-Coupled Lateral Flow Immunoassay Demonstrates Clinical Potential for Overcoming Coronavirus Disease 2019 Pandemic Screening Challenges. Micromachines 2021, 12, 321. [Google Scholar] [CrossRef]
  16. Wang, Z.; Zheng, Z.; Hu, H.; Zhou, Q.; Liu, W.; Li, X.; Liu, Z.; Wang, Y.; Ma, Y. A point-of-care selenium nanoparticle-based test for the combined detection of anti-SARS-CoV-2 IgM and IgG in human serum and blood. Lab A Chip 2020, 20, 4255–4261. [Google Scholar] [CrossRef] [PubMed]
  17. Bayin, Q.; Huang, L.; Ren, C.; Fu, Y.; Ma, X.; Guo, J. Anti-SARS-CoV-2 IgG and IgM detection with a GMR based LFIA system. Talanta 2021, 227, 122207. [Google Scholar] [CrossRef] [PubMed]
  18. Wang, C.; Yang, X.; Gu, B.; Liu, H.; Zhou, Z.; Shi, L.; Cheng, X.; Wang, S. Sensitive and simultaneous detection of SARS-CoV-2-specific IgM/IgG using lateral flow immunoassay based on dual-mode quantum dot nanobeads. Anal. Chem. 2020, 92, 15542–15549. [Google Scholar] [CrossRef]
  19. Wang, C.; Shi, D.; Wan, N.; Yang, X.; Liu, H.; Gao, H.; Zhang, M.; Bai, Z.; Li, D.; Dai, E. Development of spike protein-based fluorescence lateral flow assay for the simultaneous detection of SARS-CoV-2 specific IgM and IgG. Analyst 2021, 146, 3908–3917. [Google Scholar] [CrossRef] [PubMed]
  20. Wen, T.; Huang, C.; Shi, F.-J.; Zeng, X.-Y.; Lu, T.; Ding, S.-N.; Jiao, Y.-J. Development of a lateral flow immunoassay strip for rapid detection of IgG antibody against SARS-CoV-2 virus. Analyst 2020, 145, 5345–5352. [Google Scholar] [CrossRef] [PubMed]
  21. Chen, Z.; Zhang, Z.; Zhai, X.; Li, Y.; Lin, L.; Zhao, H.; Bian, L.; Li, P.; Yu, L.; Wu, Y. Rapid and sensitive detection of anti-SARS-CoV-2 IgG, using lanthanide-doped nanoparticles-based lateral flow immunoassay. Anal. Chem. 2020, 92, 7226–7231. [Google Scholar] [CrossRef]
  22. Kopel, J.; Goyal, H.; Perisetti, A. Antibody tests for COVID-19. Bayl. Univ. Med. Cent. Proc. 2021, 34, 63–72. [Google Scholar] [CrossRef]
  23. Townsend, A.; Rijal, P.; Xiao, J.; Tan, T.K.; Huang, K.-Y.A.; Schimanski, L.; Huo, J.; Gupta, N.; Rahikainen, R.; Matthews, P.C. A haemagglutination test for rapid detection of antibodies to SARS-CoV-2. Nat. Commun. 2021, 12, 1951. [Google Scholar] [CrossRef]
  24. West, R.M.; Kobokovich, A.; Connell, N.; Gronvall, G.K. Antibody (serology) tests for COVID-19: A case study. Msphere 2021, 6, e00201–e00221. [Google Scholar] [CrossRef]
  25. Conklin, S.E.; Martin, K.; Manabe, Y.C.; Schmidt, H.A.; Miller, J.; Keruly, M.; Klock, E.; Kirby, C.S.; Baker, O.R.; Fernandez, R.E. Evaluation of serological SARS-CoV-2 lateral flow assays for rapid point-of-care testing. J. Clin. Microbiol. 2021, 59, e02020-20. [Google Scholar] [CrossRef]
  26. Rashed, M.Z.; Kopechek, J.A.; Priddy, M.C.; Hamorsky, K.T.; Palmer, K.E.; Mittal, N.; Valdez, J.; Flynn, J.; Williams, S.J. Rapid detection of SARS-CoV-2 antibodies using electrochemical impedance-based detector. Biosens. Bioelectron. 2021, 171, 112709. [Google Scholar] [CrossRef]
  27. Lew, T.T.S.; Aung, K.M.M.; Ow, S.Y.; Amrun, S.N.; Sutarlie, L.; Ng, L.F.; Su, X. Epitope-functionalized gold nanoparticles for rapid and selective detection of SARS-CoV-2 IgG antibodies. ACS Nano 2021, 15, 12286–12297. [Google Scholar] [CrossRef]
  28. Ketas, T.J.; Chaturbhuj, D.; Portillo, V.M.C.; Francomano, E.; Golden, E.; Chandrasekhar, S.; Debnath, G.; Diaz-Tapia, R.; Yasmeen, A.; Kramer, K.D. Antibody responses to SARS-CoV-2 mRNA vaccines are detectable in saliva. Pathog. Immun. 2021, 6, 116. [Google Scholar] [CrossRef]
  29. Chiang, S.H.; Tu, M.; Cheng, J.; Wei, F.; Li, F.; Chia, D.; Garner, O.; Chandrasekaran, S.; Bender, R.; Strom, C.M. Development and validation of a quantitative, non-invasive, highly sensitive and specific, electrochemical assay for anti-SARS-CoV-2 IgG antibodies in saliva. PLoS ONE 2021, 16, e0251342. [Google Scholar] [CrossRef]
  30. Ter-Ovanesyan, D.; Gilboa, T.; Lazarovits, R.; Rosenthal, A.; Yu, X.; Li, J.Z.; Church, G.M.; Walt, D.R. Ultrasensitive measurement of both SARS-CoV-2 RNA and antibodies from saliva. Anal. Chem. 2021, 93, 5365–5370. [Google Scholar] [CrossRef]
  31. Heaney, C.D.; Pisanic, N.; Randad, P.R.; Kruczynski, K.; Howard, T.; Zhu, X.; Littlefield, K.; Patel, E.U.; Shrestha, R.; Laeyendecker, O. Comparative performance of multiplex salivary and commercially available serologic assays to detect SARS-CoV-2 IgG and neutralization titers. J. Clin. Virol. 2021, 145, 104997. [Google Scholar] [CrossRef]
  32. Keuning, M.W.; Grobben, M.; de Groen, A.-E.C.; Berman-de Jong, E.P.; Bijlsma, M.W.; Cohen, S.; Felderhof, M.; de Groof, F.; Molanus, D.; Oeij, N. Saliva SARS-CoV-2 antibody prevalence in children. Microbiol. Spectr. 2021, 9, e00731-21. [Google Scholar] [CrossRef]
  33. Murillo, A.; Tomé-Amat, J.; Ramírez, Y.; Garrido-Arandia, M.; Valle, L.; Hernández-Ramírez, G.; Tramarin, L.; Herreros, P.; Santamaría, B.; Díaz-Perales, A. Developing an Optical Interferometric Detection Method based biosensor for detecting specific SARS-CoV-2 immunoglobulins in Serum and Saliva, and their corresponding ELISA correlation. Sens. Actuators B Chem. 2021, 345, 130394. [Google Scholar] [CrossRef]
  34. Shan, D.; Hsiung, J.; Bliden, K.P.; Zhao, S.; Liao, T.; Wang, G.; Tan, S.; Liu, T.; Sreedhar, D.; Kost, J. A New Saliva-Based Lateral-Flow SARS-CoV-2 IgG Antibody Test for mRNA Vaccination. medRxiv 2021. [Google Scholar] [CrossRef]
  35. Roda, A.; Cavalera, S.; Di Nardo, F.; Calabria, D.; Rosati, S.; Simoni, P.; Colitti, B.; Baggiani, C.; Roda, M.; Anfossi, L. Dual lateral flow optical/chemiluminescence immunosensors for the rapid detection of salivary and serum IgA in patients with COVID-19 disease. Biosens. Bioelectron. 2021, 172, 112765. [Google Scholar] [CrossRef] [PubMed]
  36. Linares, E.M.; Kubota, L.T.; Michaelis, J.; Thalhammer, S. Enhancement of the detection limit for lateral flow immunoassays: Evaluation and comparison of bioconjugates. J. Immunol. Methods 2012, 375, 264–270. [Google Scholar] [CrossRef]
  37. Quesada-González, D.; Merkoçi, A. Nanoparticle-based lateral flow biosensors. Biosens. Bioelectron. 2015, 73, 47–63. [Google Scholar] [CrossRef] [Green Version]
  38. Sajid, M.; Kawde, A.-N.; Daud, M. Designs, formats and applications of lateral flow assay: A literature review. J. Saudi Chem. Soc. 2015, 19, 689–705. [Google Scholar] [CrossRef] [Green Version]
  39. Parolo, C.; Sena-Torralba, A.; Bergua, J.F.; Calucho, E.; Fuentes-Chust, C.; Hu, L.; Rivas, L.; Álvarez-Diduk, R.; Nguyen, E.P.; Cinti, S. Tutorial: Design and fabrication of nanoparticle-based lateral-flow immunoassays. Nat. Protoc. 2020, 15, 3788–3816. [Google Scholar] [CrossRef]
  40. Oliveira-Rodríguez, M.; Serrano-Pertierra, E.; García, A.C.; López-Martín, S.; Yañez-Mo, M.; Cernuda-Morollón, E.; Blanco-López, M. Point-of-care detection of extracellular vesicles: Sensitivity optimization and multiple-target detection. Biosens. Bioelectron. 2017, 87, 38–45. [Google Scholar] [CrossRef]
  41. Brolo, A.G. Plasmonics for future biosensors. Nat. Photonics 2012, 6, 709–713. [Google Scholar] [CrossRef]
  42. Turkevich, J.; Stevenson, P.; Hiller, J. Synthesis of gold nanoparticles Turkevich method. Discuss. Faraday Soc 1951, 11, 55–75. [Google Scholar] [CrossRef]
  43. Frens, G. Controlled nucleation for the regulation of the particle size in monodisperse gold suspensions. Nat. Phys. Sci. 1973, 241, 20–22. [Google Scholar] [CrossRef]
  44. Thobhani, S.; Attree, S.; Boyd, R.; Kumarswami, N.; Noble, J.; Szymanski, M.; Porter, R.A. Bioconjugation and characterisation of gold colloid-labelled proteins. J. Immunol. Methods 2010, 356, 60–69. [Google Scholar] [CrossRef] [PubMed]
  45. Skoog, D.A.; Holler, F.J.; Nieman, T.A. Principles of Instrumental Analysis, 5th ed.; Saunders: Orlando, FL, USA, 1998. [Google Scholar]
  46. Isho, B.; Abe, K.T.; Zuo, M.; Jamal, A.J.; Rathod, B.; Wang, J.H.; Li, Z.J.; Chao, G.; Rojas, O.L.; Bang, Y.M.; et al. Persistence of serum and saliva antibody responses to SARS-CoV-2 spike antigens in COVID-19 patients. Sci. Immunol. 2020, 5, 20. [Google Scholar] [CrossRef] [PubMed]
Figure 1. Gold nanoparticle modification process. (a) An AuNP is suspended in a citrate solution; (b) antibodies associated with the AuNP; (c) modified AuNP after blocking the surface with bovine serum albumin (BSA).
Chemosensors 10 00234 g001
Figure 2. Characterisation spectra for AuNPs at three stages of the modification process: (a) DLS spectra for the bare AuNPs, AuNPs with antibodies, and the AuNPs with antibodies and BSA. (b) UV-Vis spectra for the same AuNP solutions.
Chemosensors 10 00234 g002
Figure 3. SEM image of AuNPs before modification.
Chemosensors 10 00234 g003
Figure 4. Lateral flow strip diagram. The control line was formed using human IgG and the test line was formed using SARS-CoV-2 S1 and S2 spike proteins. The conjugate pad contained AuNPs modified with anti-IgG Fc-specific antibodies.
Chemosensors 10 00234 g004
Figure 5. Schematic of the lateral flow process and result interpretation: (a) 10 µL of the sample solution was pipetted onto a glass fibre pad; (b) 100 µL of running buffer was added to the same pad; (c) the sample and buffer migrated upward over the entire strip; (d) in positive samples, the SARS-CoV-2 antibodies in the saliva associated with the modified AuNPs on the conjugate pad and continued to flow over the strip; (e) in positive samples, the antibody—AuNP complex associated with the immobilised proteins on the test line to form a red line; (f) in all samples, the extra-modified AuNPs associated with the IgG antibodies on the control line to form a red line; (g) the results were read based on the presence or absence of the test line. The red control line indicated that the assay results were valid.
Chemosensors 10 00234 g005
Figure 6. Lateral flow strips showing results for a range of antibody concentrations: (a) 100 µg/mL; (b) 10.0 µg/mL; (c) 1.0 µg/mL; (d) 100 ng/mL; (e) 10.0 ng/mL; (f) 0.00 ng/mL (negative result).
Chemosensors 10 00234 g006
Figure 7. Calibration curve showing the relationship between the colour intensity of the test line and the antibody concentration in the saliva. The equation of the fitted line was y = 17.7 + 2.66 lnx and R2 = 0.941.
Chemosensors 10 00234 g007
Figure 8. Colour intensity results in comparison with minimum distinguishable signal.
Chemosensors 10 00234 g008
Table 1. Analytical parameters of the proposed test compared with results from the literature for other LFAs.
TestTargetConjugateLimit of DetectionReadout InstrumentRunning TimeSampleReferences
Quantitative SERS-based LFAIgM, IgGSiO2@Ag SERS tag1 × 10−3 ng/mLPortable Raman spectrometer25 minSerum[13]
Quantitative SERS-based LFAIgM, IgGAu GERTs0.1 ng/mLRaman spectrometer15 minSerum[14]
Quantitative Spectrochip-Coupled LFAIgGAu Nps conjugated SARS-CoV-2 nucleoprotein0.186 ng/mLCommercial LFA spectrum analyzer10–15 minWhole blood, serum and plasma[15]
Qualitative SeNps-based LFAIgM, IgGSeNPs conjugated nucleoprotein5 ng/mLCamera and image processing software10 minSerum, blood[16]
Quantitative GMR-based LFAIgM, IgGSMNPs conjugated SARS-CoV-2 NP5 ng/mLGMR sensor10 minSerum[17]
Quantitative colorimetric-fluorescent dual-mode LFAIgM, IgGSiO2@Au@QD conjugated S protein1:106 dilutionPortable fluorescent instrument15 minSerum[18]
Quantitative protein-based fluorescence LFAIgM, IgGSiO2@DQD conjugated S protein1:107 dilutionPortable fluorescent strip reader15 minSerum[19]
Qualitative LFAIgGAuNPs conjugated anti-human IgG antibodies--15–20 minSerum[20]
Qualitative LNPs -Based LFAIgGLNPs functionalized with anti-human IgG antibodies-Portable fluorescence reader10 minSerum[21]
Quantitative magnetic AuNps-based LFAIgGMagnetic AuNPs conjugated S1 or NCP0.3 µg/mLCamera and image processing software25 minSaliva[34]
Dual lateral flow optical/chemiluminescence immunosensorIgAGNP-labelled anti-IgA-Complementary Metal Oxide Semiconductor camera and portable charge-coupled device15 minSaliva[35]
Quantitative LFAIgGAuNPs conjugated anti-human IgG antibodies4 ng/mLCamera and image processing software10 minSalivaProposed assay
GERTs: gap-enhanced Raman tags; SeNps: selenium nanoparticles; QD: quantum dot; NCP: nucleocapsid protein; GMR: giant magnetoresistance; LNPs: lanthanide-doped nanoparticles.
Publisher’s Note: MDPI stays neutral with regard to jurisdictional claims in published maps and institutional affiliations.

