
Recent Progress in Fluorescent Probes for Diabetes Visualization and Drug Therapy


1
College of Chemistry and Chemical Engineering, Luoyang Normal University, Luoyang 471934, China
2
College of Resources, Environment and Chemistry, Chuxiong Normal University, Chuxiong 675000, China
3
College of Food and Bioengineering, Henan University of Science and Technology, Luoyang 471000, China
*
Authors to whom correspondence should be addressed.
Chemosensors 2022, 10(7), 280; https://0-doi-org.brum.beds.ac.uk/10.3390/chemosensors10070280
Submission received: 17 June 2022
/
Revised: 7 July 2022
/
Accepted: 12 July 2022
/
Published: 14 July 2022
(This article belongs to the Special Issue Fluorescent Sensors for Disease Diagnosis and Therapy)
Abstract
:Diabetes has become one of the most prevalent endocrine and metabolic diseases that threaten human health, and it is accompanied by serious complications. Therefore, it is vital and pressing to develop novel strategies or tools for prewarning and therapy of diabetes and its complications. Fluorescent probes have been widely applied in the detection of diabetes due to the fact of their attractive advantages. In this report, we comprehensively summarize the recent progress and development of fluorescent probes in detecting the changes in the various biomolecules in diabetes and its complications. We also discuss the design of fluorescent probes for monitoring diabetes in detail. We expect this review will provide new ideas for the development of fluorescent probes suitable for the prewarning and therapy of diabetes in future clinical transformation and application.
1. Introduction
Diabetes, as a metabolic disease with hyperglycemia, is caused by defective insulin secretion or impaired biological action, or both [1,2]. Significantly, some diseases caused by diabetes, including neurodegenerative diseases, liver diseases, and kidney diseases, are essential and prevalent problems in patients with diabetes [3,4,5]. Therefore, it is one of the frontiers and difficulties to illuminate the precise pathogenesis of diabetes in biological and medical research. As we know, there are two types of diabetes. One is type I diabetes, which is mainly found in kids and teenagers. It is mainly caused by abnormal immune systems and hereditary factors [6]. The other is type II diabetes, which mostly occurs in middle-aged and older people who are fatigued and obese [7,8]. Inhibition of the levels or concentrations of blood glucose is fundamental to diabetes management. As far as diabetes treatment is concerned, it is relatively effective to treat type I diabetes by injecting insulin, reducing the amount of sugar in the daily diet, or increasing exercise [9]. Noninsulin drugs, including sulfonylureas and biguanide hypoglycemic drugs, may be used to treat type II diabetes [10,11]. At present, the diagnosis of diabetes is mainly based on the blood glucose levels of patients and analysis of typical symptoms of diabetes, including polyphagia, obesity, and fatigue [12,13]. However, these phenomena are all diagnosed after diabetes occurs; therefore, the opportunity for early treatment may be missed. Thus, it is vital and pressing to diagnose diabetes with precise and early warning and to cure diabetes and its complications.
Diabetes has become one of the most prevalent endocrine and metabolic diseases that threaten human health, and it is accompanied by serious complications [3,4,5]. So far, several essential biomarkers that may be linked to the occurrence of diabetes have been raised, such as intracellular calcium waves [14], beta cell proteins [15], glycated hemoglobin (HbA1c) [16], fructosamine [17], glycated albumin [18], overproduction of reactive oxygen species (ROS) [19,20,21], aberrant polarity or abnormal viscosity levels in subcellular organelles [22,23], reactive sulfur species (RSS) [24,25], abnormally high methylglyoxal (MGO) levels [26,27], and abnormal changes in enzymes and pH values [28,29,30,31].
Compared with classical imaging techniques, such as magnetic resonance imaging (MRI), computed tomography (CT), and positron emission tomography, fluorescence imaging has been widely used in various fields owing to its attractive advantages, including outstanding sensitivity, excellent selectivity, simple operation, membrane permeability, real-time visualization, and inexpensiveness [32,33,34]. In addition, it has become a potent instrument for in situ and real-time imaging of biomolecules in organisms [35,36].
In this review, we provide an overview of the recent progress in the design of fluorescent probes, fluorescence imaging mechanisms, and their application for detecting various biomarkers of diabetes including polarity, viscosity, ROS, RSS, MGO in active carbonyl compounds, enzymes, and pH values (Figure 1). In addition, we also pay attention to a variety of vital biomarkers and their biological applications and significance in the occurrence and development of diabetes. Finally, we discuss the limitations of fluorescent probes currently used for diabetes diagnosis and imaging and put forward ideas on how to overcome these shortcomings. Therefore, this review will provide new ideas for the development of fluorescent probes suitable for the prewarning and cure of diabetes in future clinical transformation and application.
2. Design of Fluorescent Probes for Diabetes
Organic fluorescent probes designed for prewarning and cure of diabetes should meet the following demands: (1) It has a certain water solubility, and the amount of organic solvent added should be as low as possible, because the high proportions of organic solvents usually destroy the normal functions of biomolecules. (2) The recognition system cannot react with the detected bioactive species. For example, dimethyl sulfoxide (DMSO) is not suitable for examining hypochlorous acid (HClO), because it is easily oxidized by HClO [37]. Similarly, HEPES (4-(2-hydroxyethyl)piperazine-1-ethanesulfonic acid) buffer solution is also easily oxidized by HClO; thus, HEPES buffer solution cannot be used as a system for detecting HClO [38]. (3) Fluorophores have high fluorescence quantum yield and excellent biocompatibility. (4) There are obvious fluorescence changes before and after recognition. (5) The probe has a certain membrane penetration and low photobleaching and photodamage, which can avoid the interference of autofluorescence of organisms such as near-infrared (NIR) luminescence and two-photon imaging [39,40,41,42,43].
According to the differences in fluorescence changes before and after probes recognize bioactive species, they can be divided into three categories: (1) fluorescence-reduced probes; (2) fluorescence-enhanced probes (without or with reference fluorophore); (3) ratiometric fluorescent probes. In general, fluorescence-enhanced probes are more efficient than fluorescence-reduced probes, and the signal-on of fluorescence-enhanced probes makes it easy to measure low concentrations in the presence of background interference, which can decrease fake positive signals and improve sensitivity. Ratiometric fluorescent probes can eliminate the interferences caused by various factors, such as unbalanced loading or distribution of fluorescent probes in cells, by testing the ratio of emission intensities at two different wavelengths [44,45].
3. Different Probes for Various Potential Biomarkers of Diabetic
3.1. Probes Targeting Viscosity
Cell viscosity plays a crucial role in signal transmission, biomolecular interactions, electron transport, and diffusion of reactive metabolites [46]. As is well known, abnormal behavior of viscosity in organisms is strongly associated with diabetes [47,48]. In addition, the normal activities in different subcellular organelles, such as lysosomes, mitochondria, and lipid droplets (LDs), are affected by viscosity [49,50,51,52,53].
In recent years, a series of fluorescence probes have been reported for successfully monitoring viscosity changes in organisms [53]. The sensitivity of the probe used to detect viscosity levels is due to the limited rotation freely around a single bond, which reduces the radiation energy and enhances the fluorescence intensity. The detailed mechanism is that in a low-viscosity environment, the rotation of the probe is not suppressed, while the rotation of the probe is hampered in conditions of high viscosity, reducing the possibility of a radiation path, increasing the fluorescence.
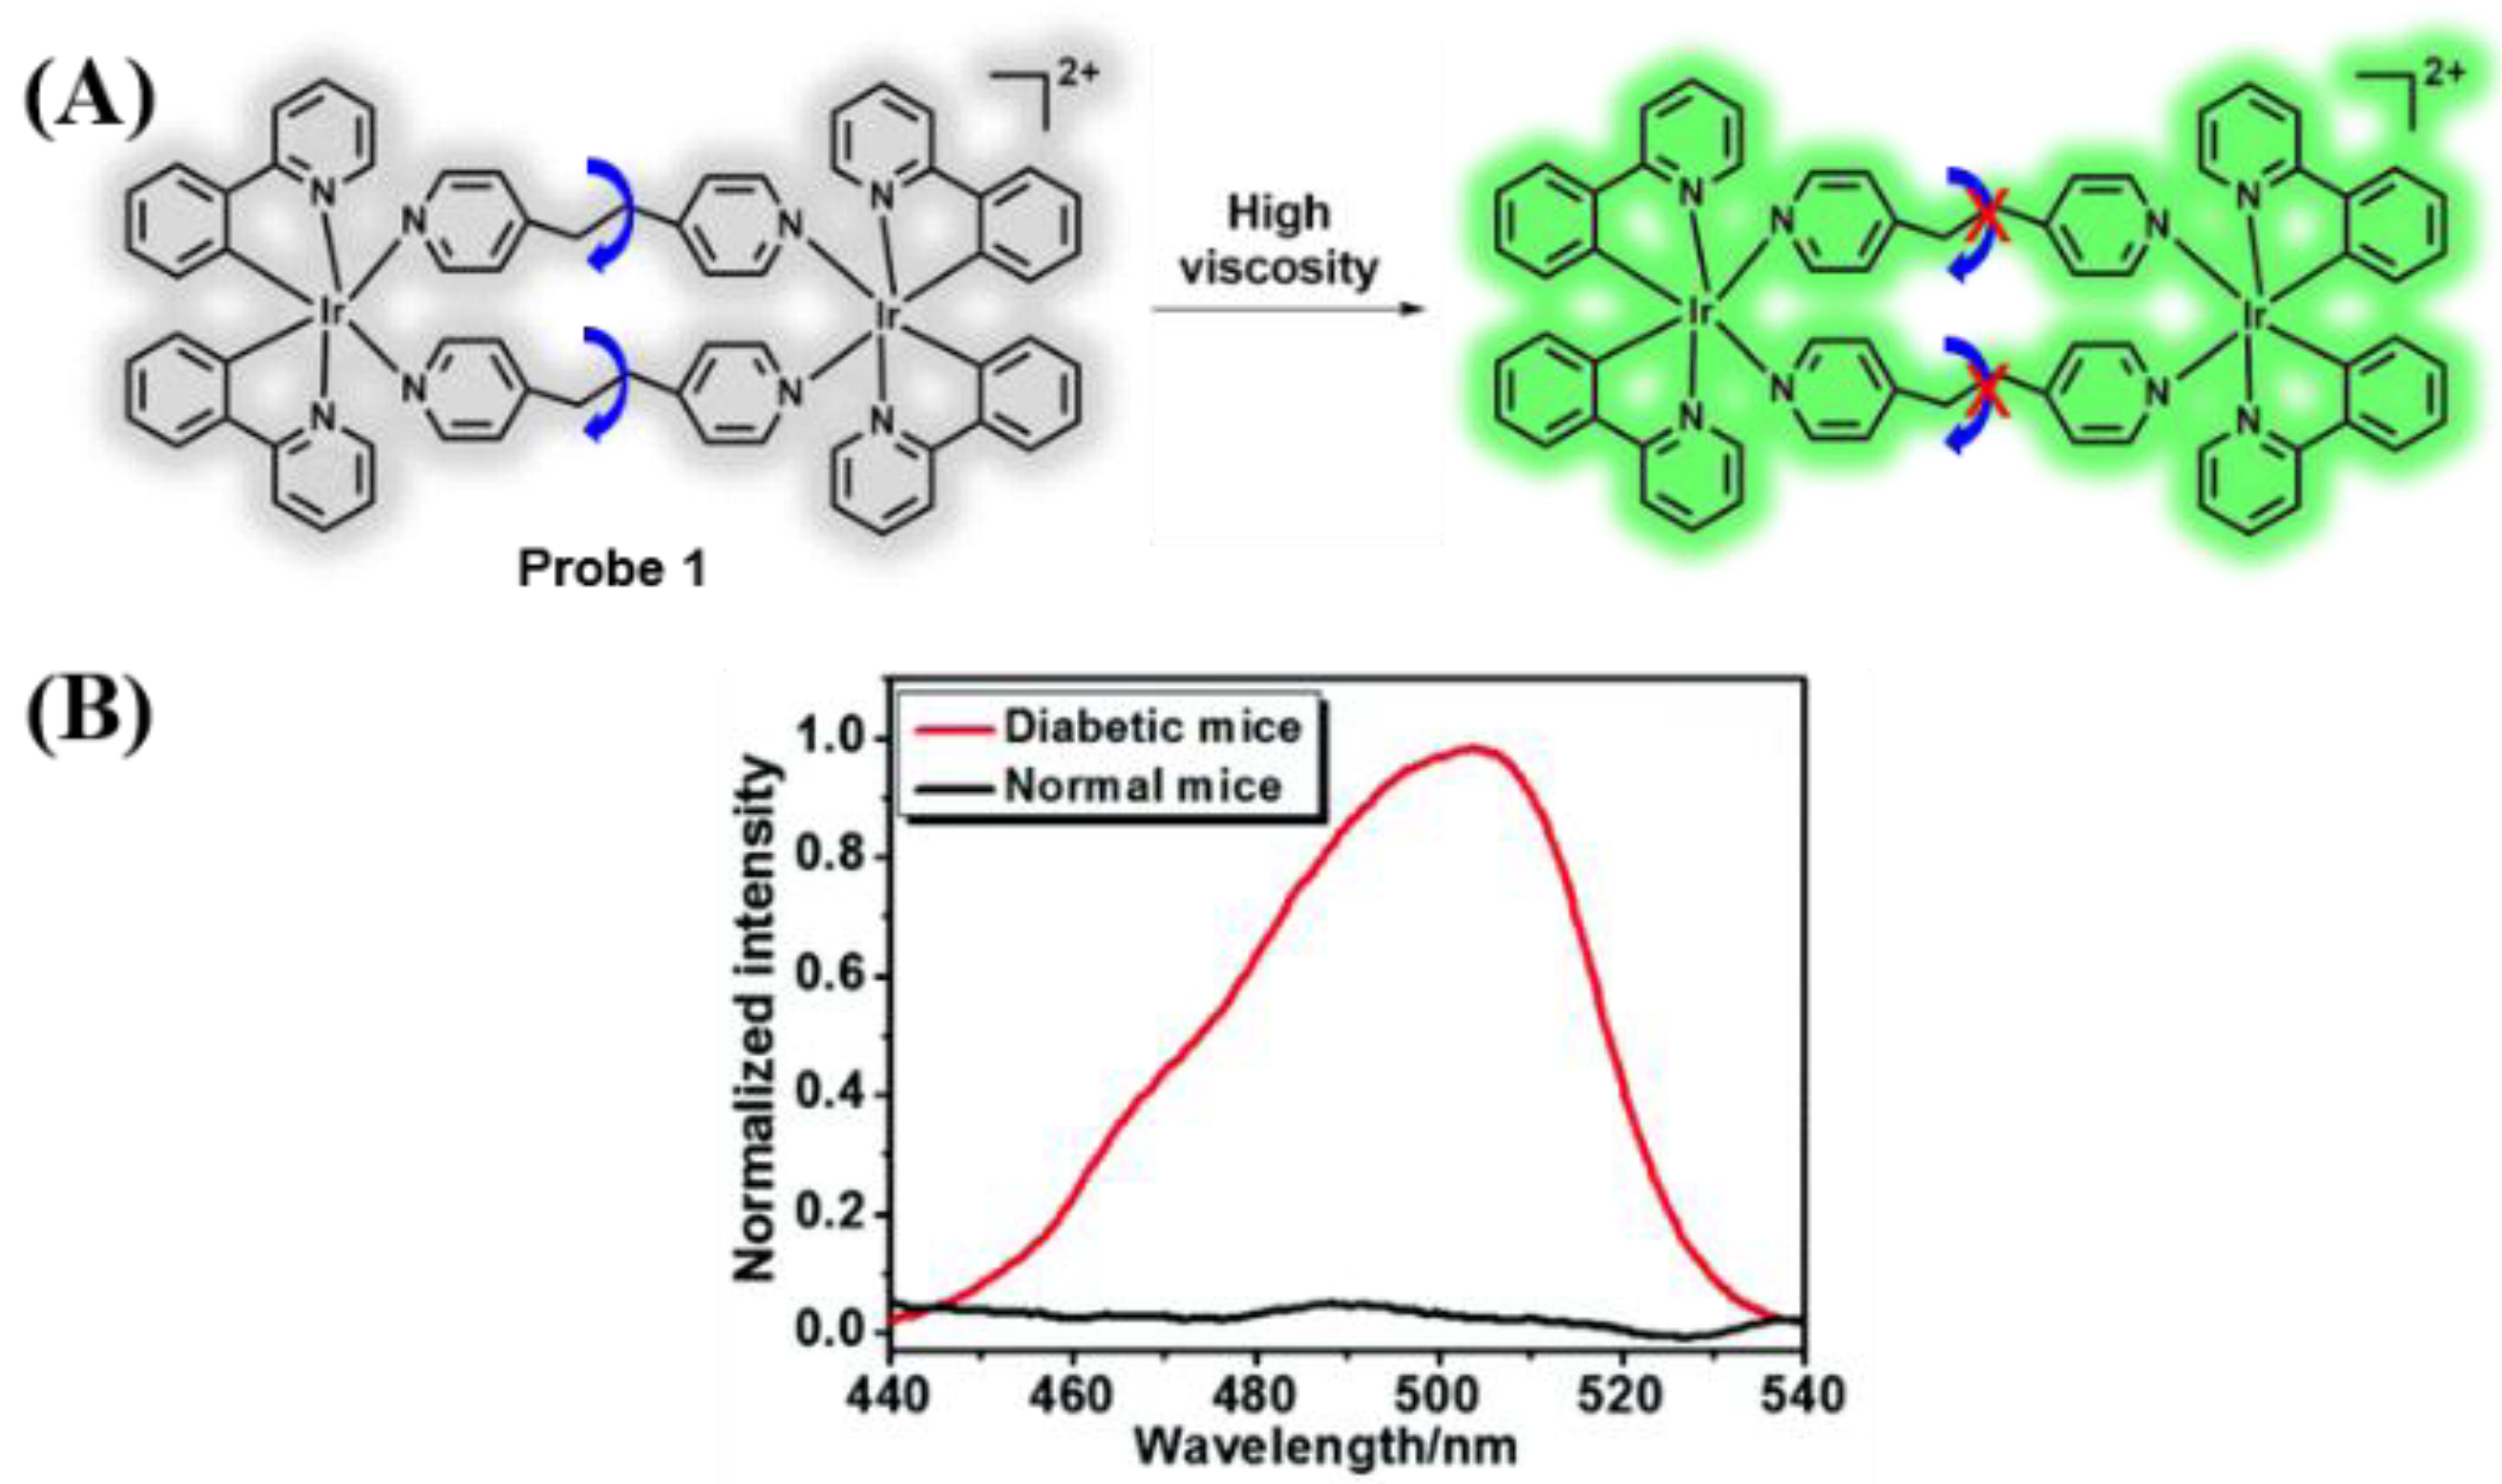
In 2019, Zhang and coworkers reported a metal complex-based probe (probe 1) for detecting blood viscosity in mice, which is made up of 1,2-di(pyridine-4-yl)ethane ligands and metal iridium(III) [54]. The phosphorescence intensity of probe 1 at 479 nm increased significantly by arising the viscosity (Figure 2A). Probe 1 had the ability to test the local microviscosity in lysosomal with excellent precision and reliability. In addition, a more significant fluorescence signal was found in the fresh blood of diabetic mice than that of normal mice (Figure 2B).
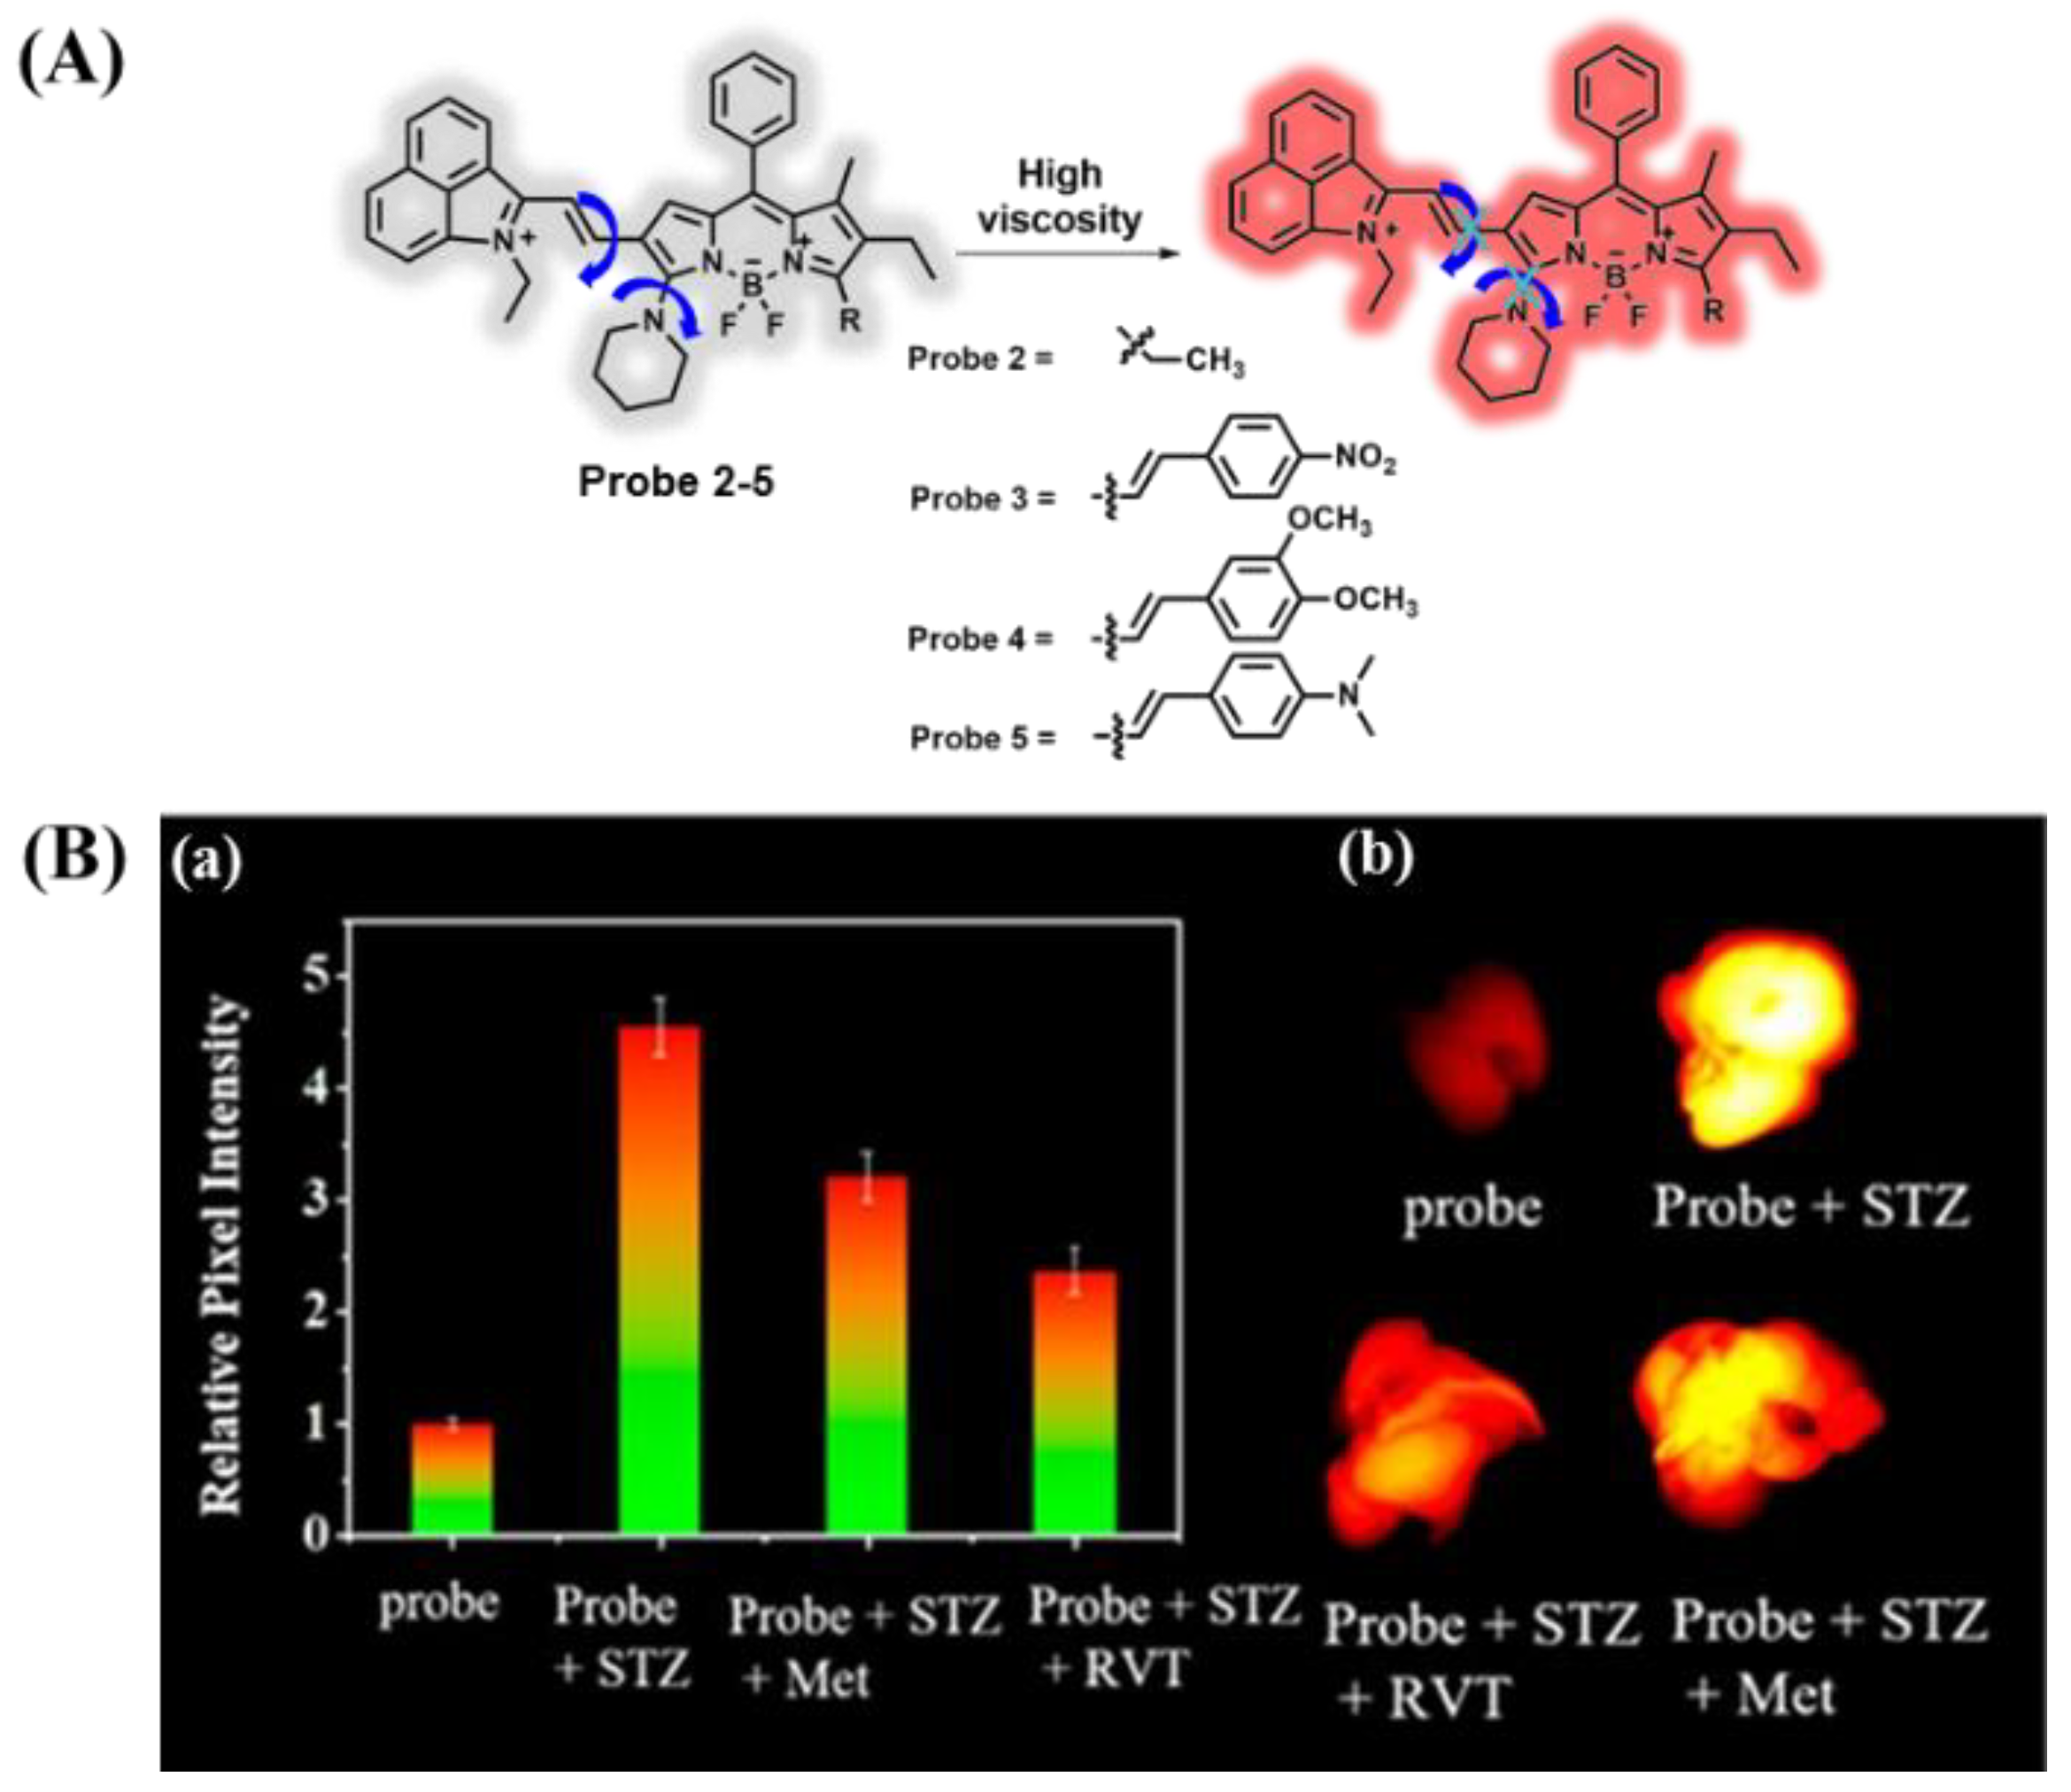
The NIR-II region (1000–1700 nm) has drawn increasing attention owing to its non-invasiveness and superior temporal resolution and spatial resolution [55,56,57,58]. In 2020, Liu et al. reported four viscosity-activated NIR-II emissive probes 2–4 [59], which consisted of boron dipyrromethenes (BODIPY) dye as a reporting unit and 1-ethyl-2-methyl-benz [c,d] iodolium salt as a molecular rotor and electron-withdrawing group (Figure 3A). Probe 3, compared to the other three molecules, exhibited the best advantages in viscosity sensitivity, environmental insensitivity, and quantum yield. In addition, probe 3 displayed the ability to monitor the viscosity behaviors in organisms and image the viscosity variation in liver injury caused by streptozotocin (STZ, an antitumor antibiotic)-induced diabetes. When treated with resveratrol (RVT, a drug for liver injury treatment) to prevent liver damage or lower blood sugar levels, the viscosity of diabetic mice decreased (Figure 3B).
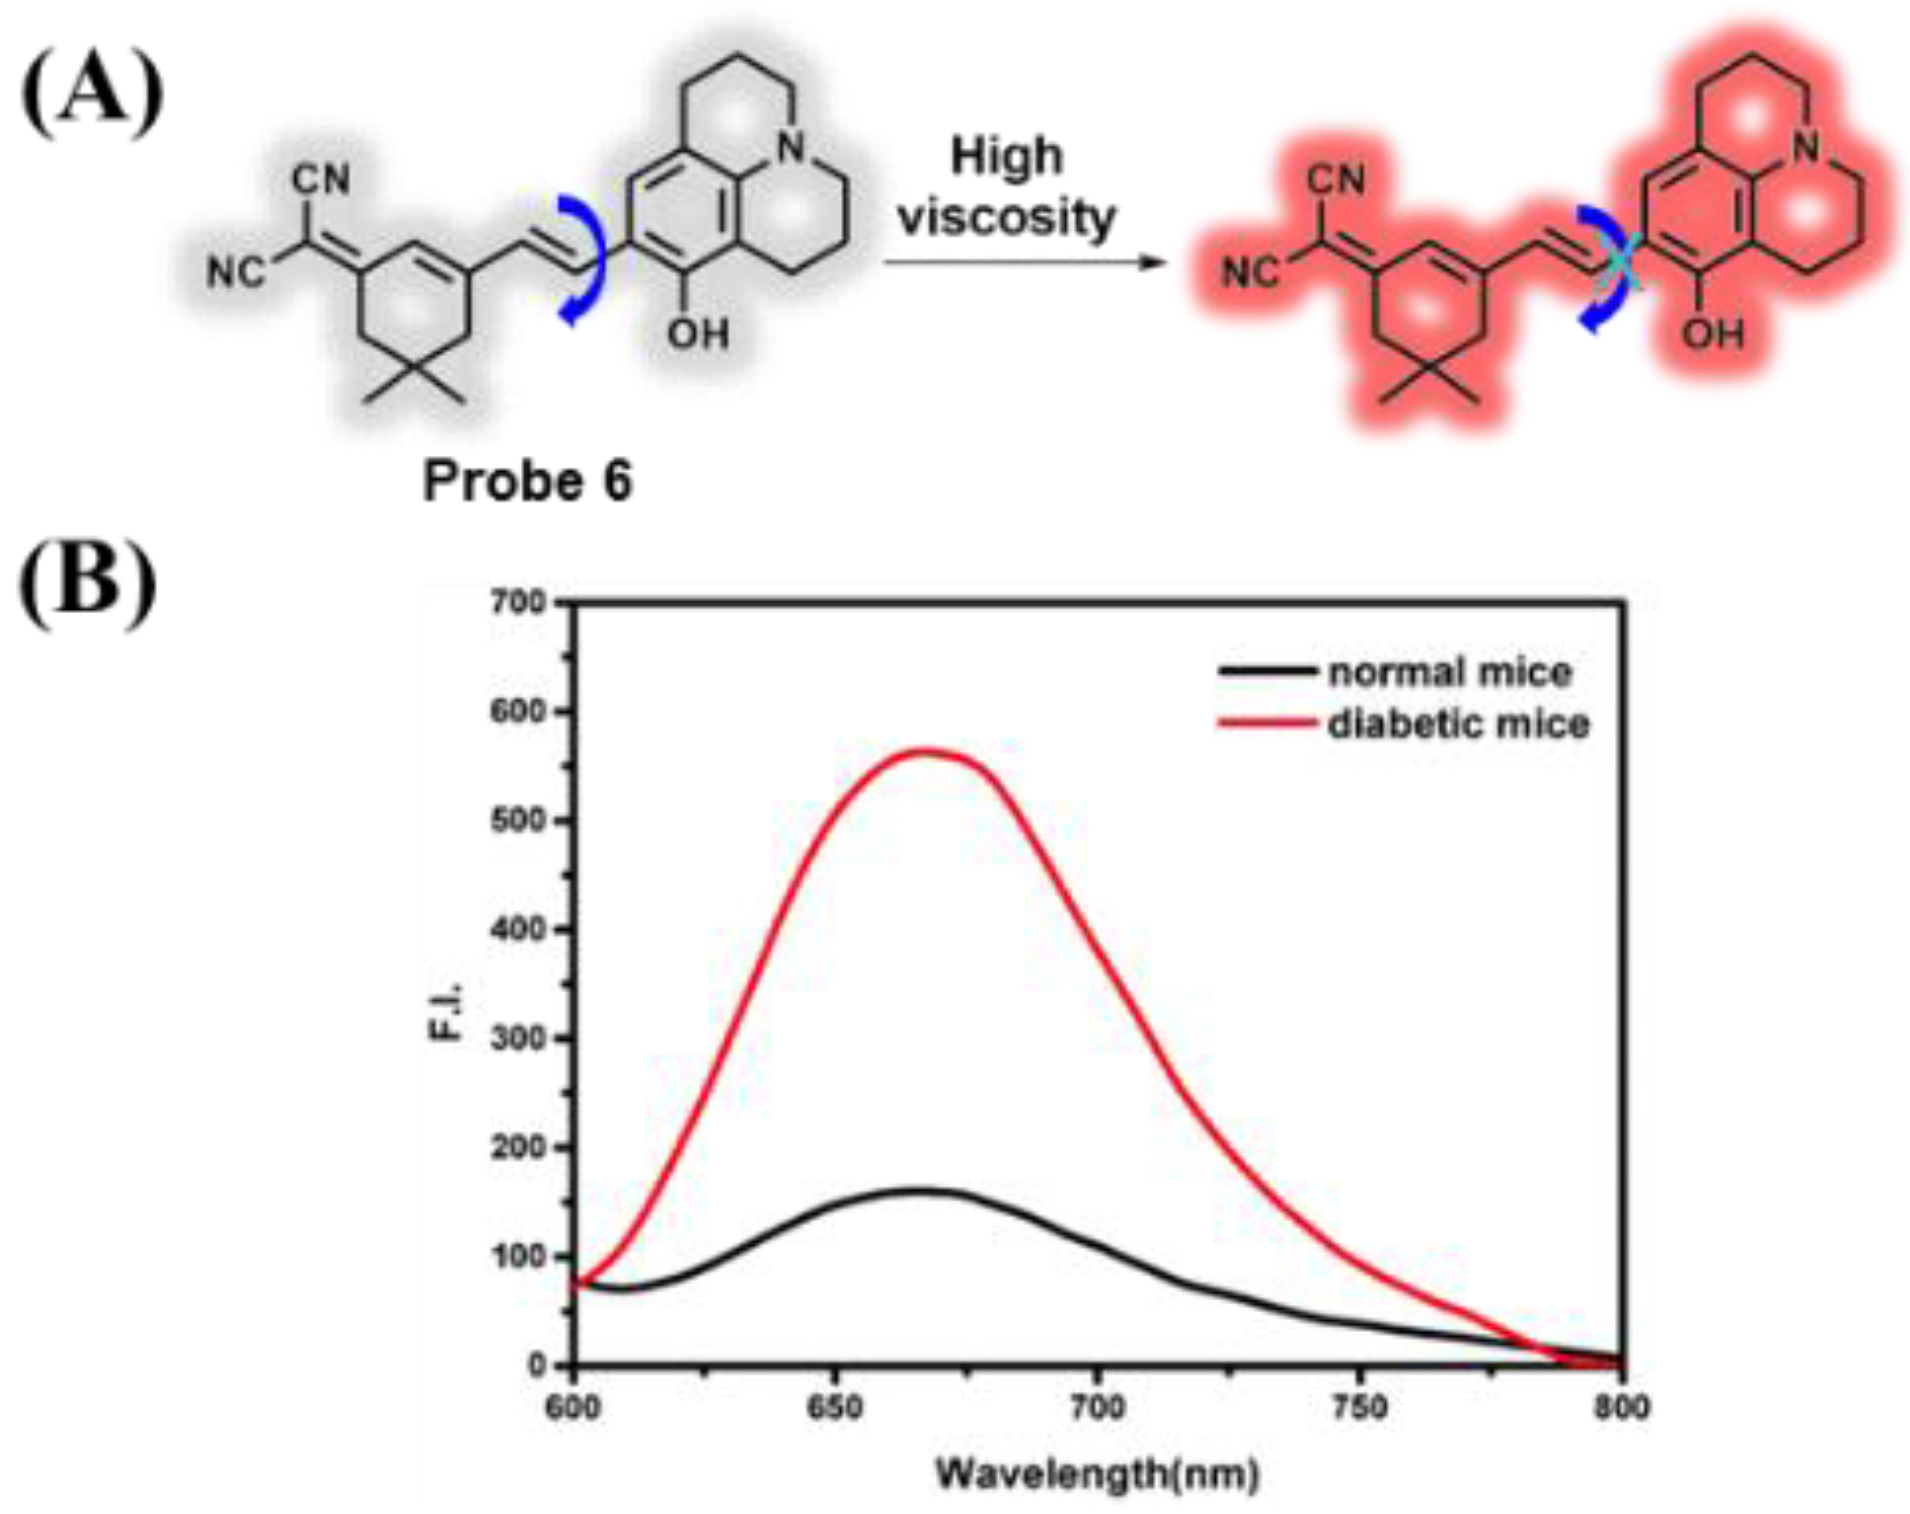
In 2019, a red-emitting probe 6 for detecting viscosity, which consists of dicyanoisophorone as acceptor and modified julolidine as donor, was obtained by Zhu and coworkers (Figure 4A) [60]. With the environmental viscosity aggrandized, a prominent fluorescence enhancement (400-fold) of probe 6 at approximately 675 nm was observed. Probe 6 possessed the advantages of high sensitivity, good water solubility, and low cytotoxicity; thus, it is befitting for monitoring the behavior of viscosity in vitro and in vivo. Probe 6 is regarded as the first probe to estimate the viscosity behavior between blood samples of diabetic and hypertensive patients (Figure 4B).
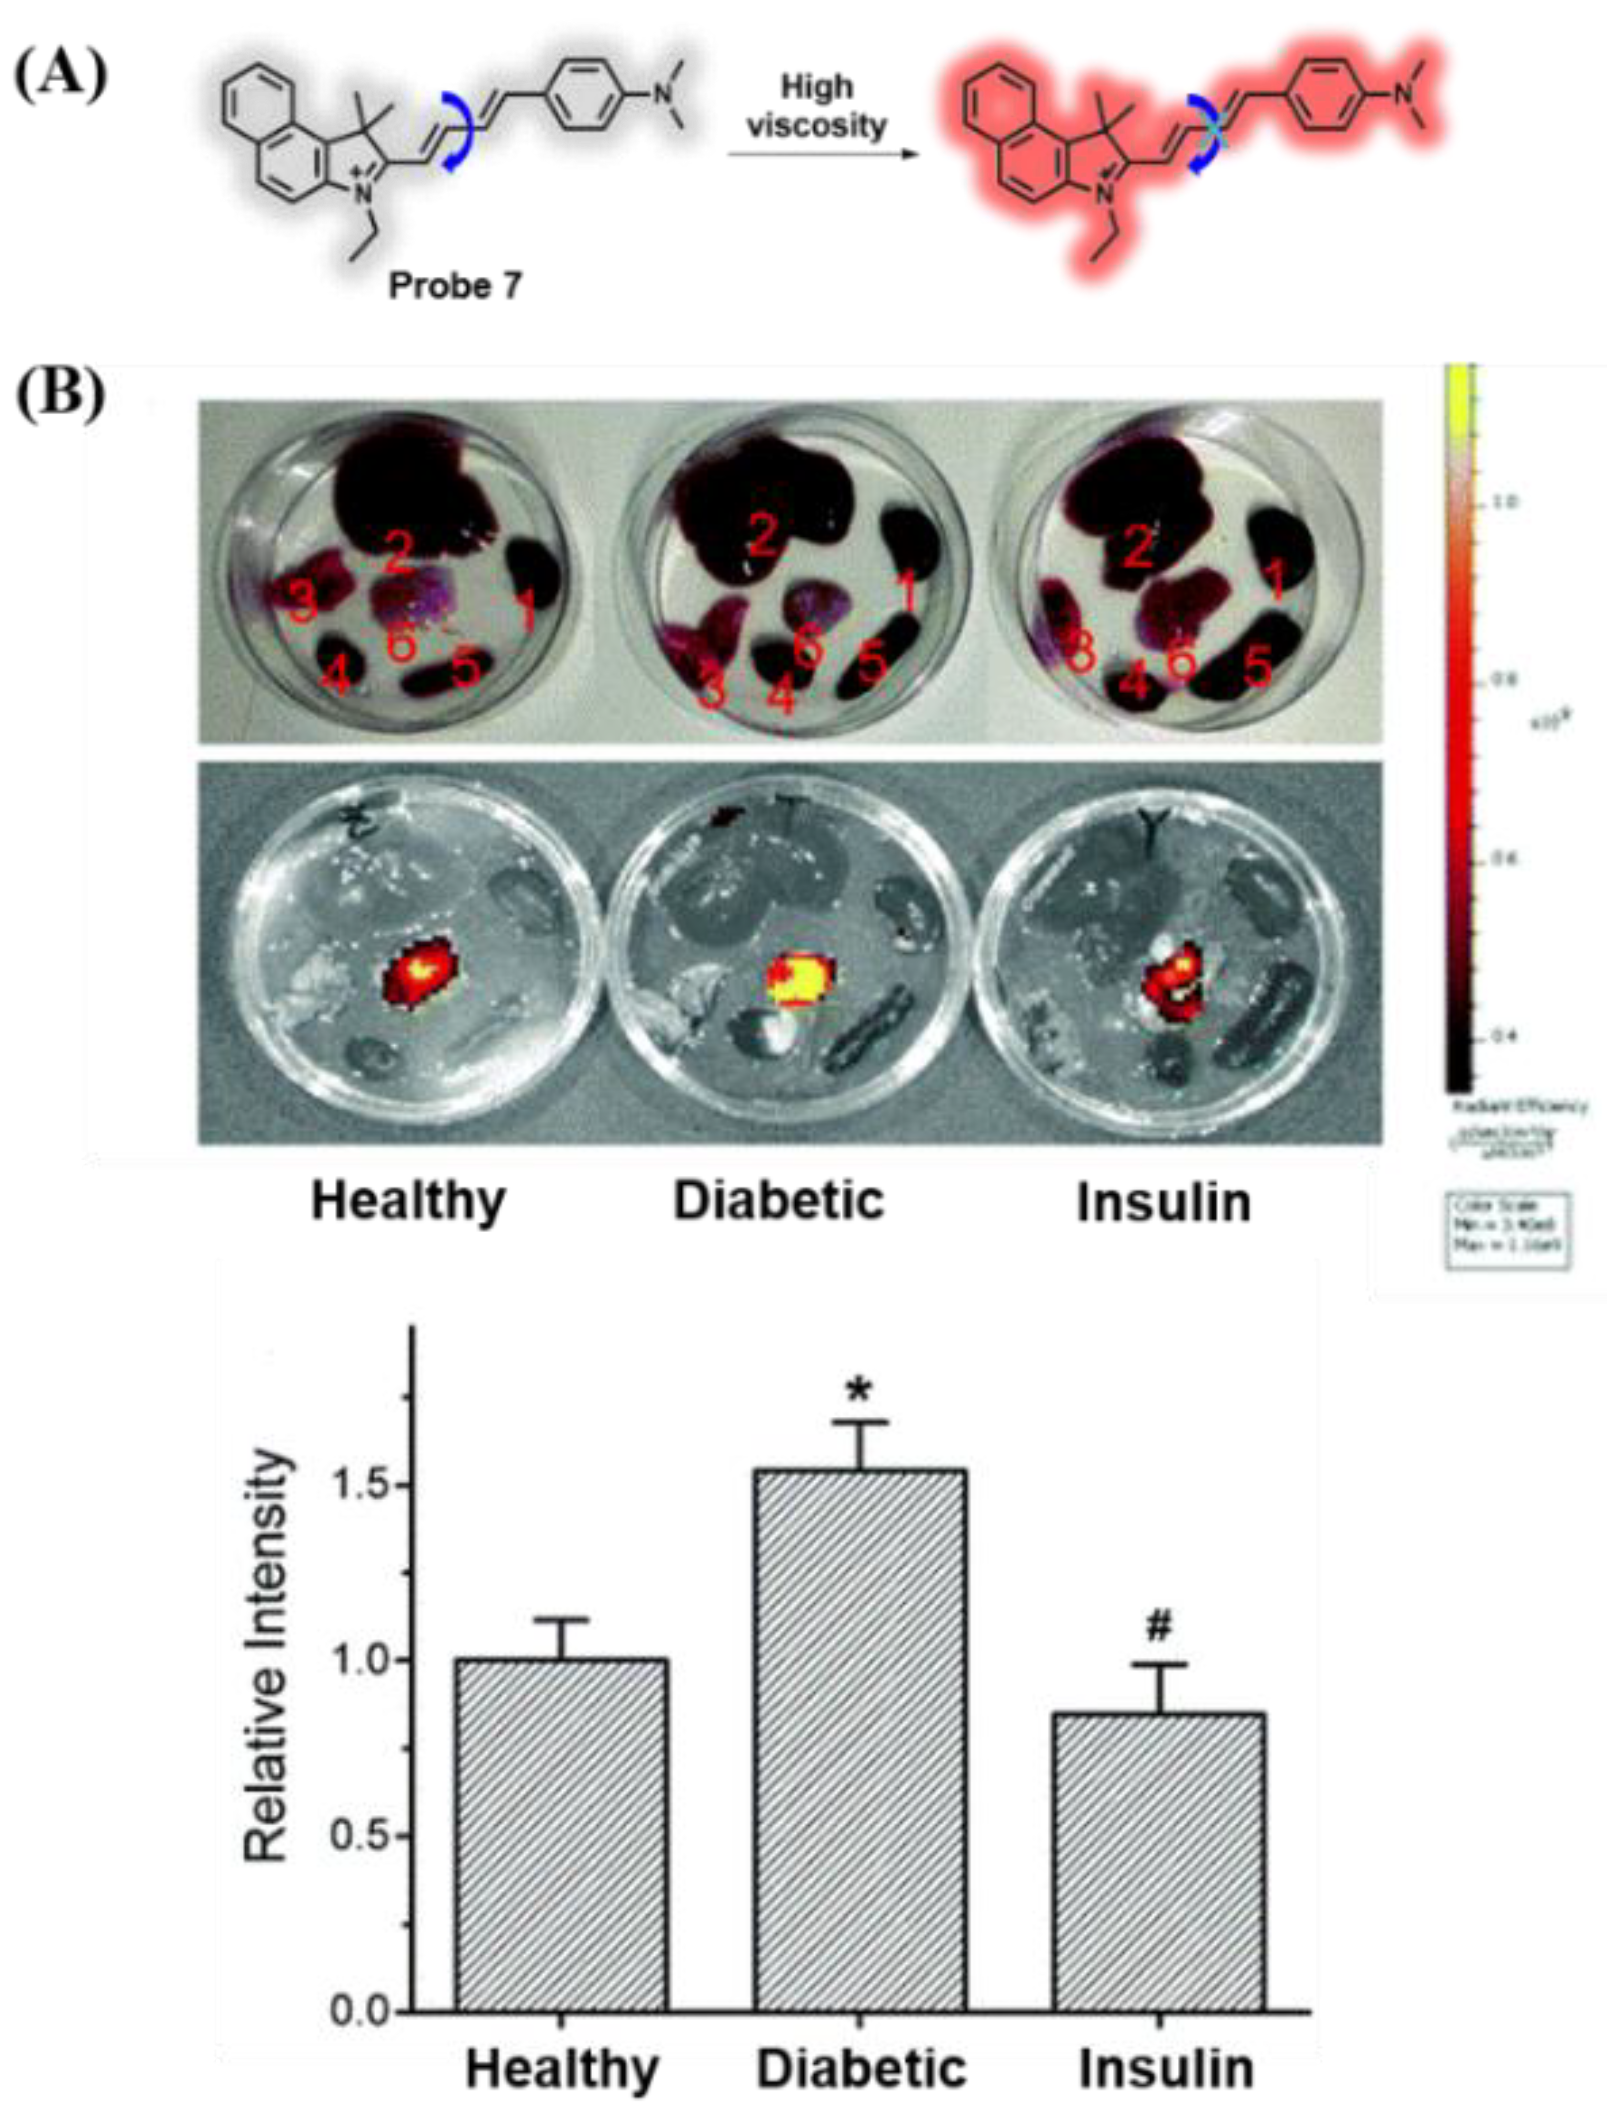
Zhou’s group created a mitochondria-targeted NIR viscosity fluorescent probe (7) [61], consisting of 2,3,3-trimethyl-3H-indolenine and 4-(dimethylamino) cinnamaldehyde (Figure 5A). Probe 7 had a double twistable ethylene structure with twisted intramolecular charge transfer (TICT) capacity. In probe 7, the cationic indoline moiety, as an acceptor, improved the aqueous solubility, the aniline group was essential for electron emission, and the conjugated diethylene bond structure would rotate sensitively with the difference in environmental viscosity. Probe 7 had some merits of NIR emission at 700 nm and good selectivity, sensitivity, and biocompatibility. Figure 5B shows that the viscosity of the insulin group was lower than that of the diabetic group, which indicates that the probe is suitable for monitoring viscosity behavior and imaging pancreatic tissue in diabetic mice.
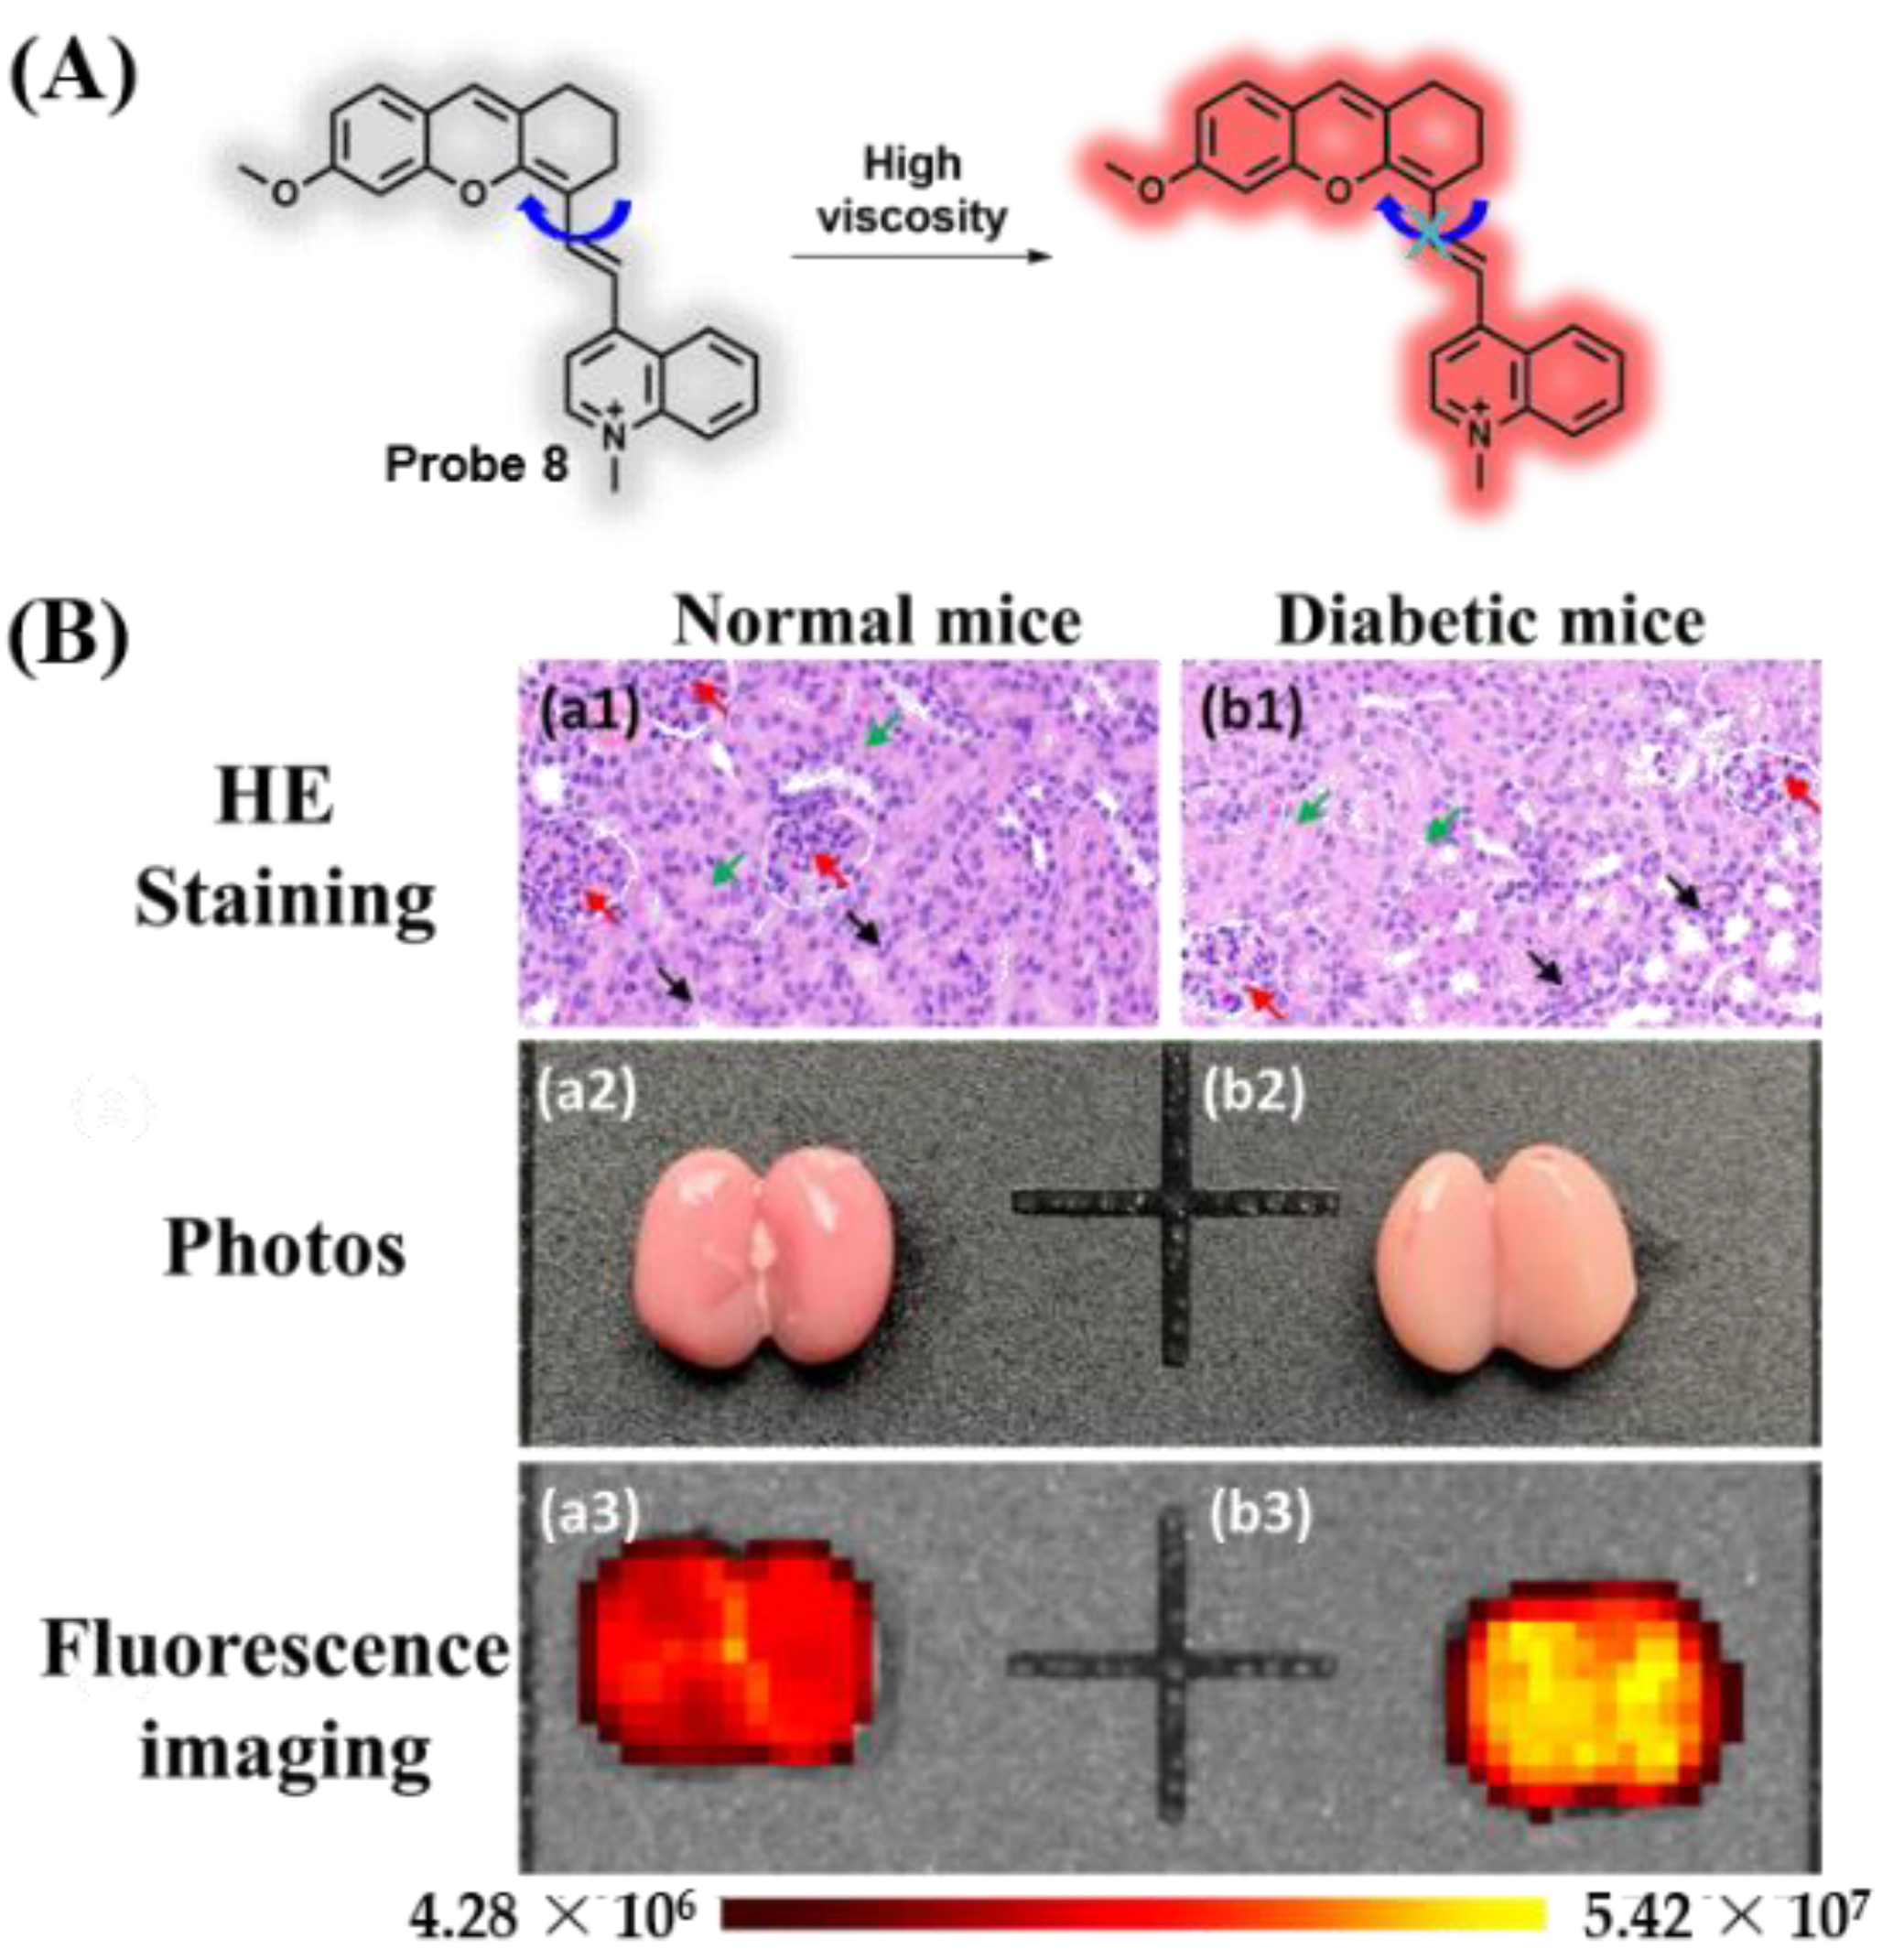
Lin’s group fabricated a NIR viscosity fluorescent probe 8 [62]. Probe 8 possessed a D-π-A configuration, which consisted of phenolic dihydroxanthene, with methoxy as the donor and quinolone as the acceptor through a flexible conjugated linker (Figure 6A). The quaternary ammonium salt group was able to ensure the solubility of probe 8 in water and target mitochondria. A large Stokes shift was observed in probe 8, which effectively avoided the interference from overlapping excitation and emission. As the environmental viscosity rises, the fluorescence signal of the probe at 730 nm displayed 13-fold enhancement. In addition, probe 8 had the ability to visualize the viscosity behavior in mitochondria of living cells and zebrafish. Importantly, visualizing the differences in cell viscosity in the kidneys of diabetic and normal mice was achieved by probe 8 for the first time (Figure 6B).
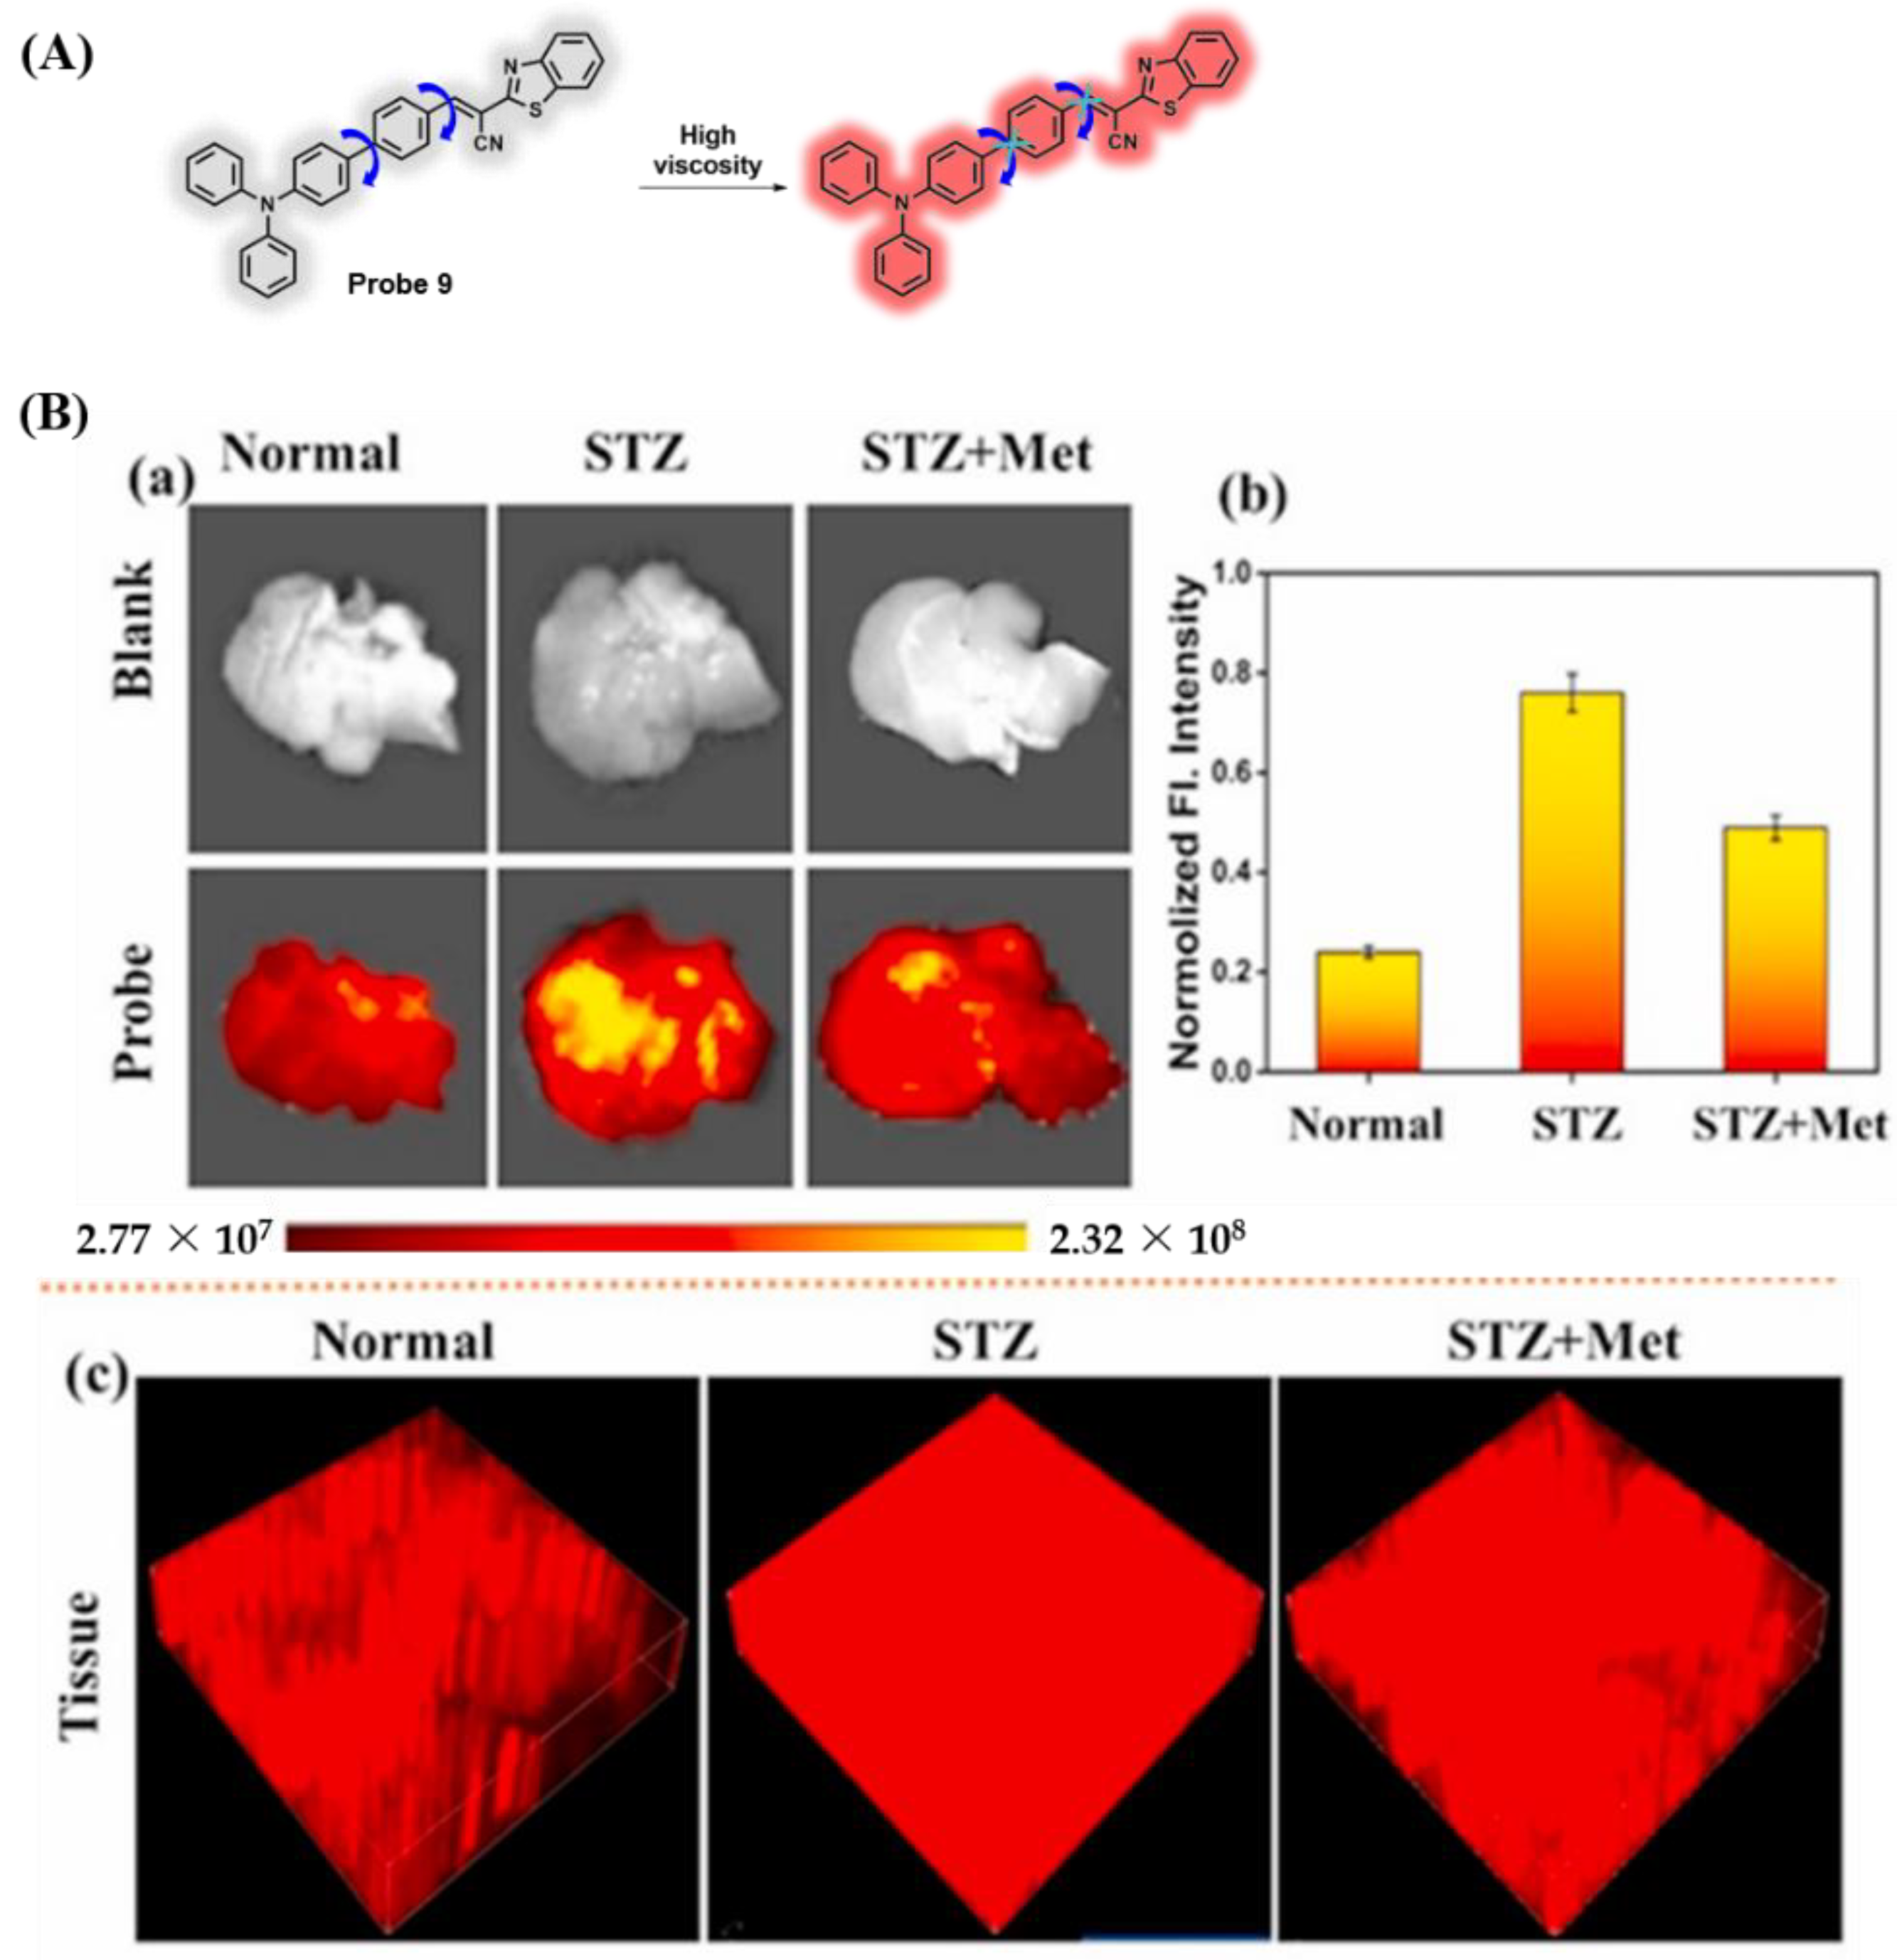
A NIR fluorescent probe (9) for examining the viscosity behavior of LDs was obtained by Lin and colleagues [63]. Probe 9 was composed of triphenylamine as a fluorescence group and benzothiazole as viscosity-sensitive group through a benzene linker (Figure 7A). Probe 9 showed a larger stokes shift of approximately 195 nm, good photostability, and high sensitivity of viscosity. With the viscosity boost, the fluorescence signal at 650 nm displayed remarkable enhancement (95-fold). The blood viscosity in normal mice was lower than that of STZ-induced diabetic mice, and the cell localization experiment displayed that probe 9 accumulated obviously in LDs. In addition, probe 9 had the ability to track metformin (Met, an antidiabetic drug)-treated diabetes by monitoring viscosity behavior (Figure 7B).
3.2. Probes Targeting Polarity
Changes and developments in polarity may be caused by many cellular processes linked to spatial arrangement and protein composition such as cell differentiation, activation of the immune response, and localized membrane growth [64,65,66]. Abnormal polarity behavior may result in impaired function of subcellular organelles as well as the onset and development of various physiological or pathological activities [67]. For example, excessive accumulation of partially unfolded or glycosylated proteins in the ER stress environment can induce a polarity change [68]. The degree of liver injury caused by diabetes can be evaluated by differences or changes in ER polarity [69]. During autophagy, the fusion between the lysosomal membrane and the autophagosome membrane leads to an increase in polarity [70]. Therefore, tracking intracellular polarity behavior in different organelles is of great significance for illuminating cell state variation.
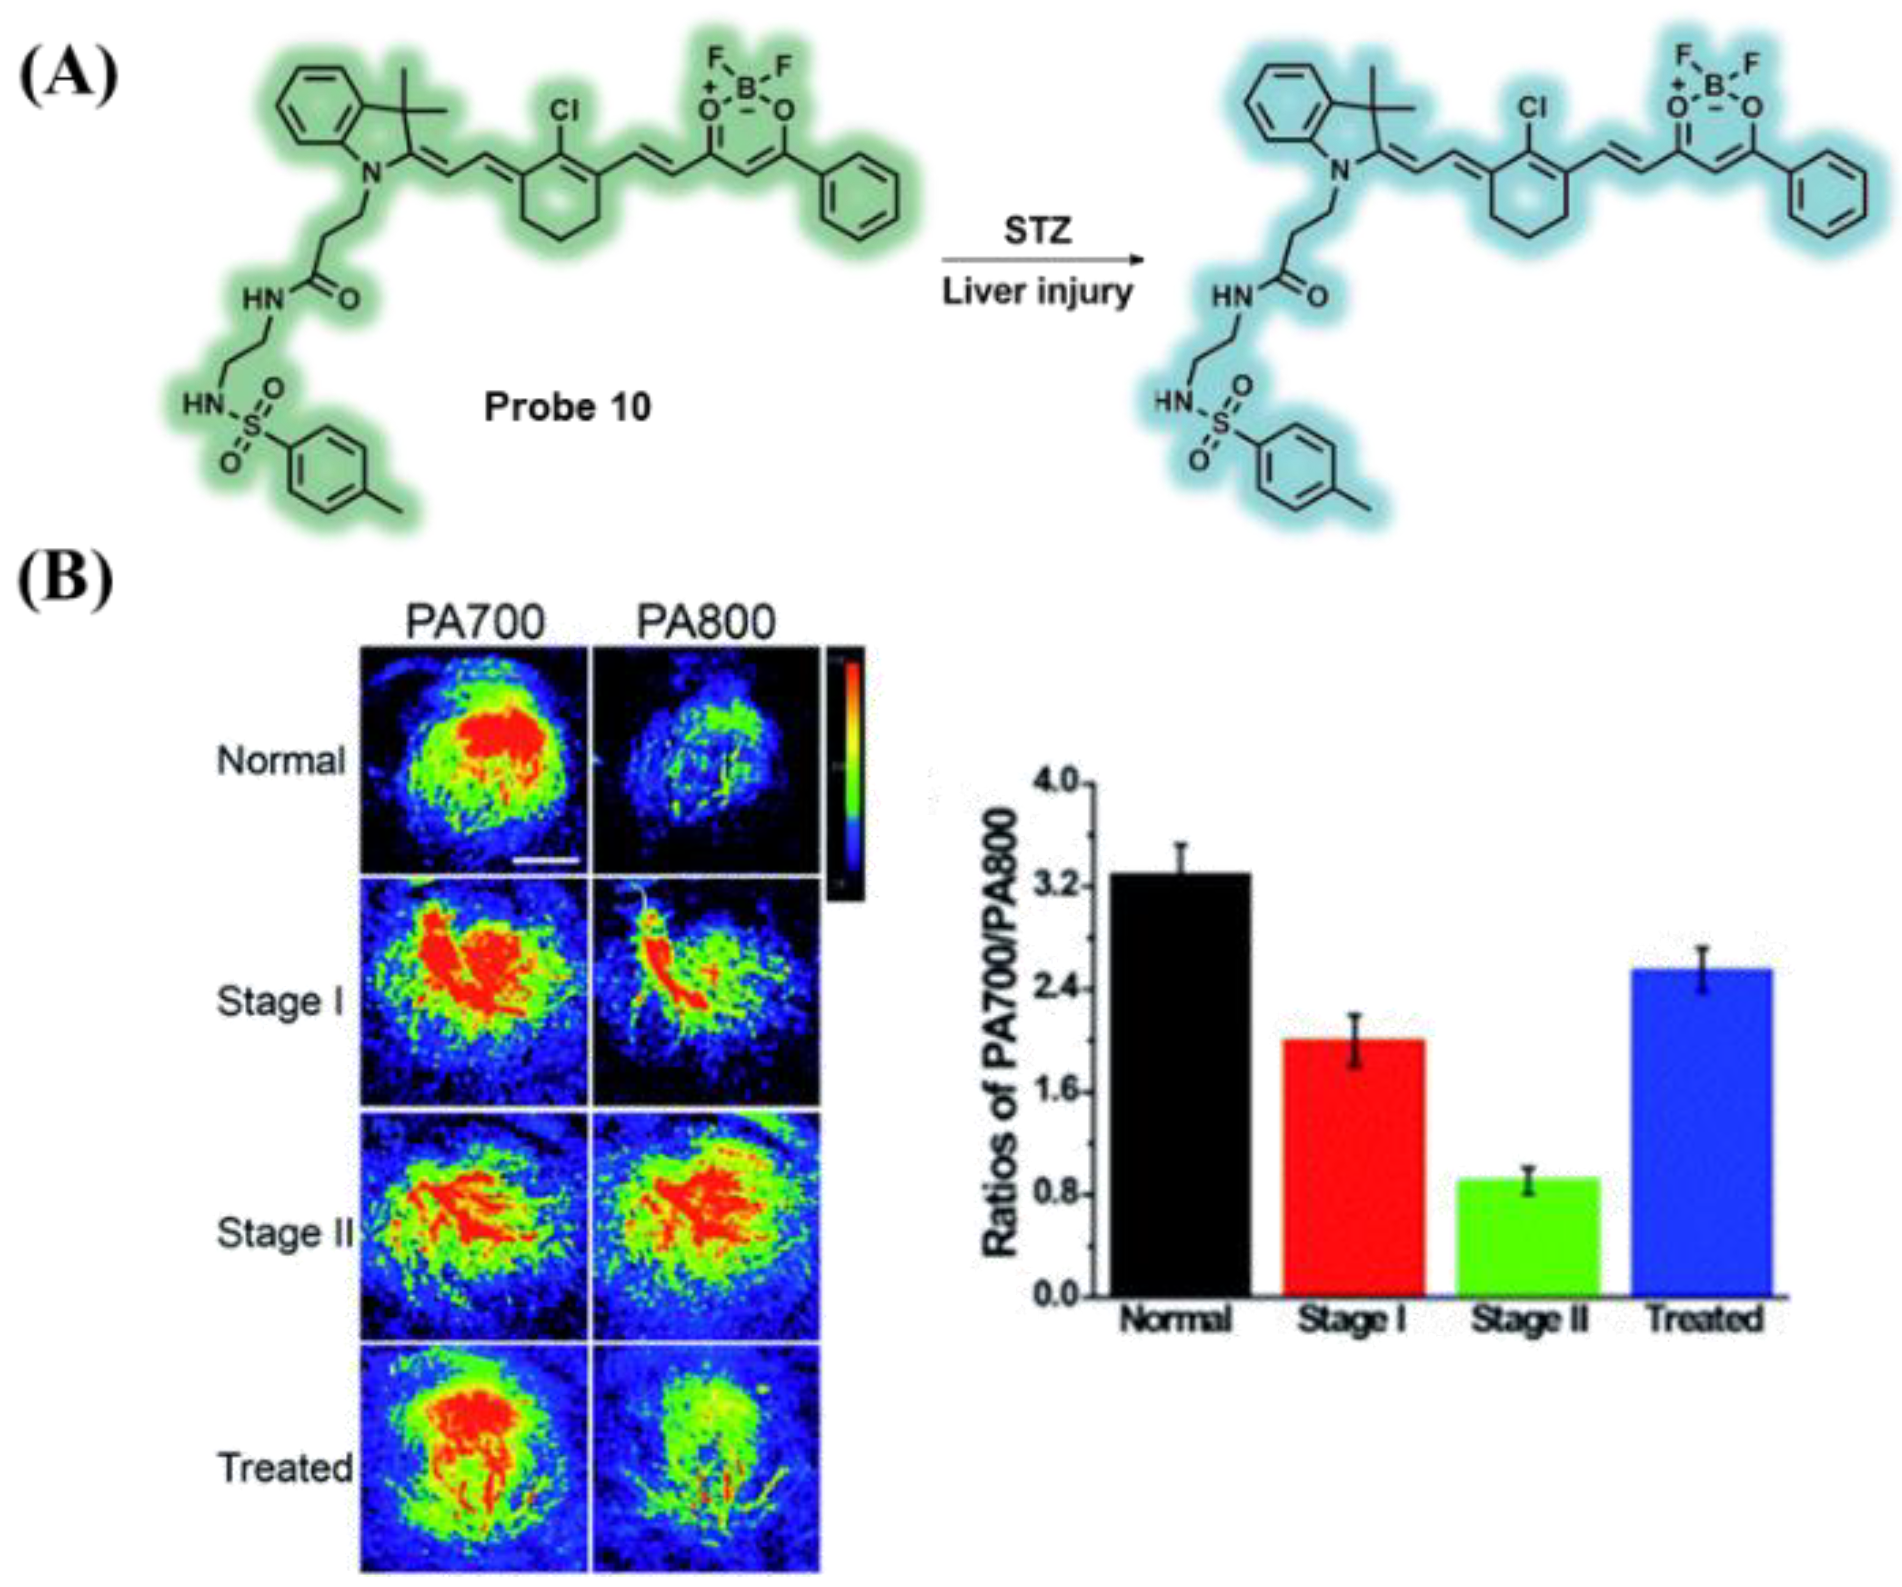
The fluorescent probe 10 with NIR emission, ratiometric photoacoustic (PA) imaging dual-mode, and ER-targeting was constructed by Tang and coworkers [71], which was used to image the behavior of polarity in the liver of normal and diabetic mice. Probe 10 was composed of merocyanine, with a tertiary amine as the donor and difluoroboronate as the acceptor (Figure 8A). The conjugated system was able to offer NIR absorption and a strong PA signal. The fluorescence signal of probe 10 at approximately 800 nm exhibited dramatic enhancement by reducing the polarity in the environment. Probe 10 was able to examine the polarity changes with sensitivity and selectivity and had excellent biocompatibility and ER-targeting ability. Higher polarity behavior in the liver of diabetic mice than in normal mice was observed by ratiometric PA imaging, and when metformin was used, the polarity behavior in the liver tissue of diabetic mice showed an obvious decline (Figure 8B).
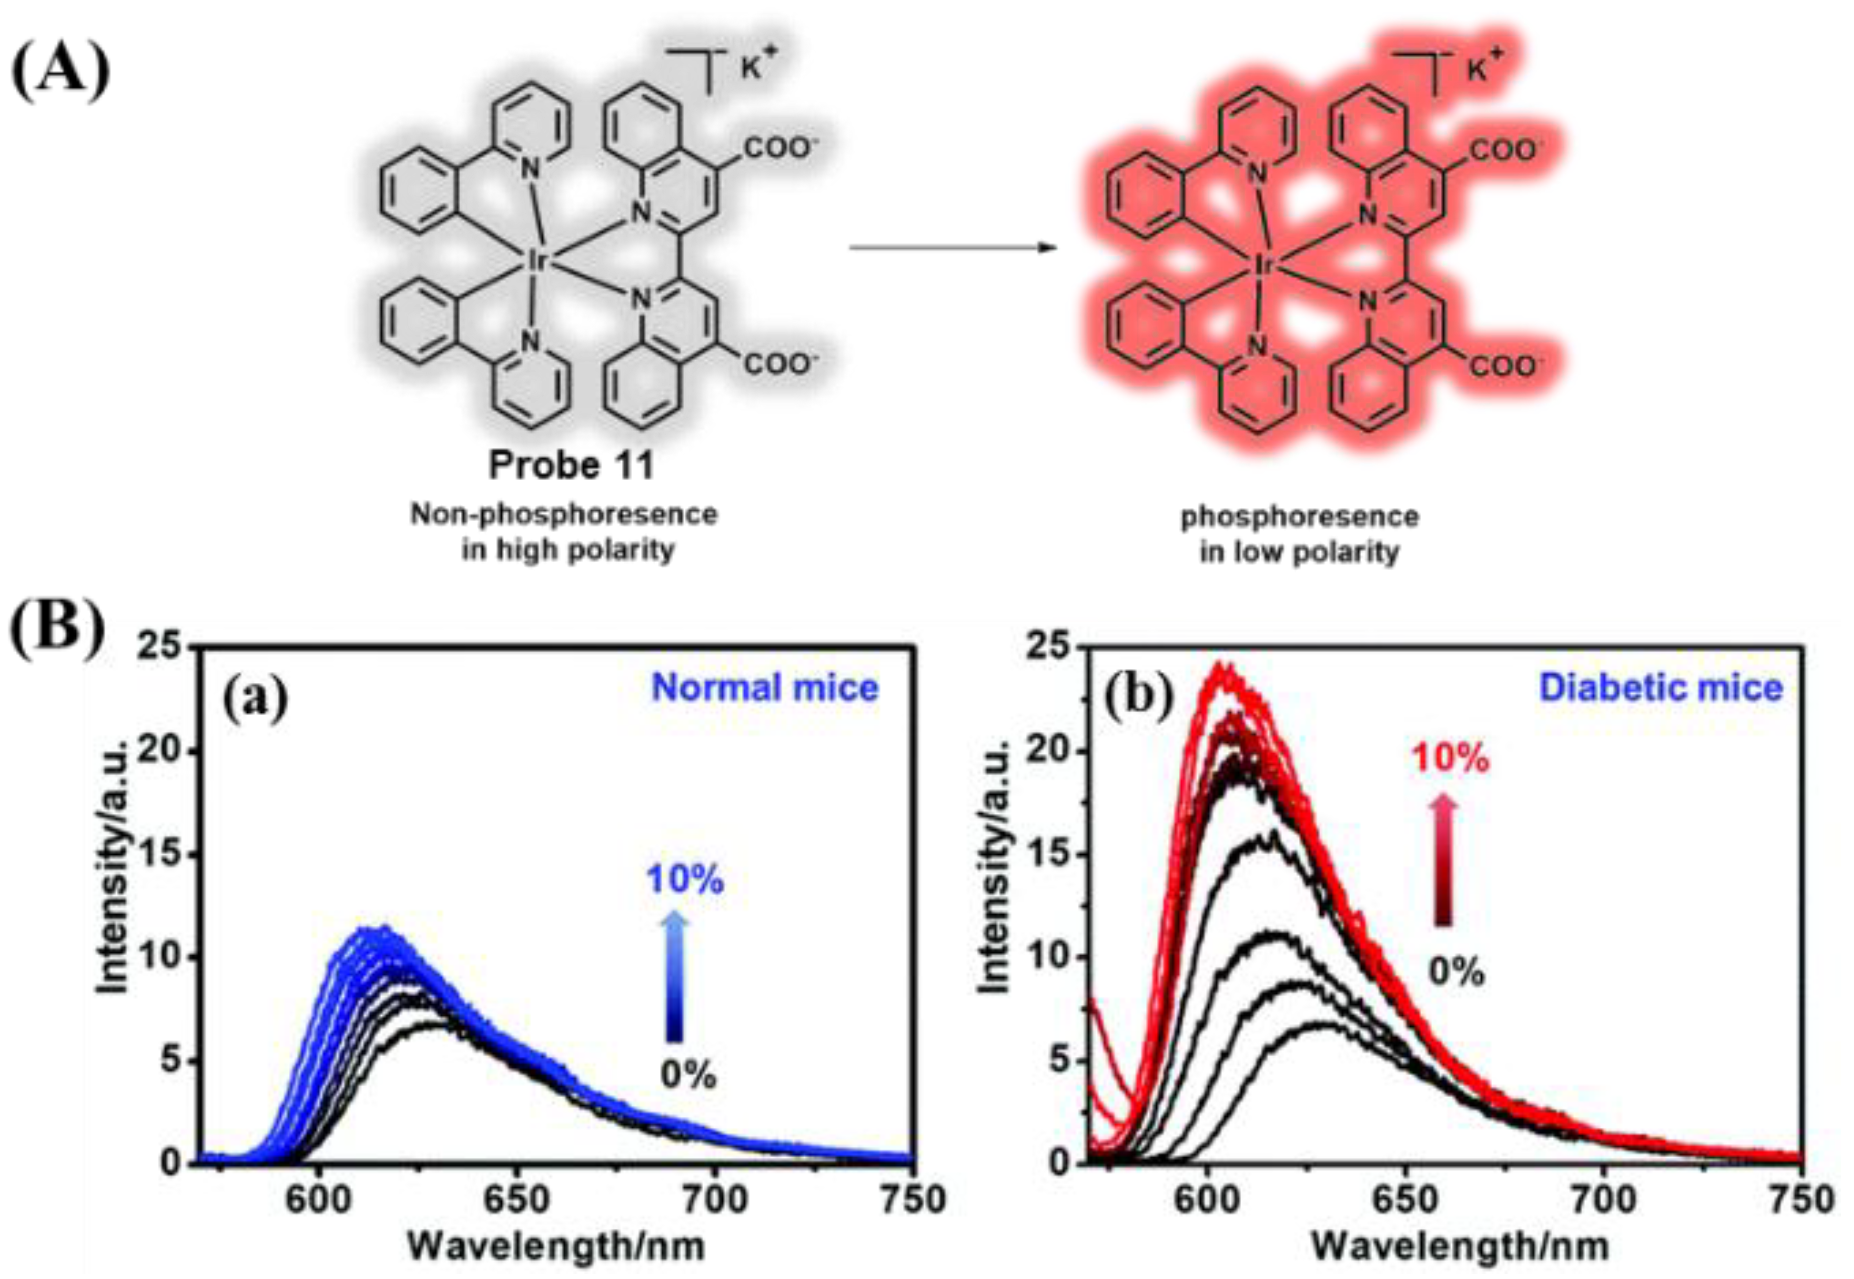
Probe 11 is an electro-negative, water-soluble Ir (III) complex for detecting polarity behavior that was reported by Zhang and coworkers [72]. With the increase or decrease in polarity in the environment, probe 11 exhibited excellent sensitivity (Figure 9A). When the solvent polarity was reduced, the phosphorescence peak of probe 11 changed from 632 to 585 nm. Probe 11 with ER-targeting was able to trace the polarity behavior in situ during ER stress in vitro. In addition, the polarity difference between the fresh blood of diabetic and normal mice was examined by probe 11 (Figure 9B).
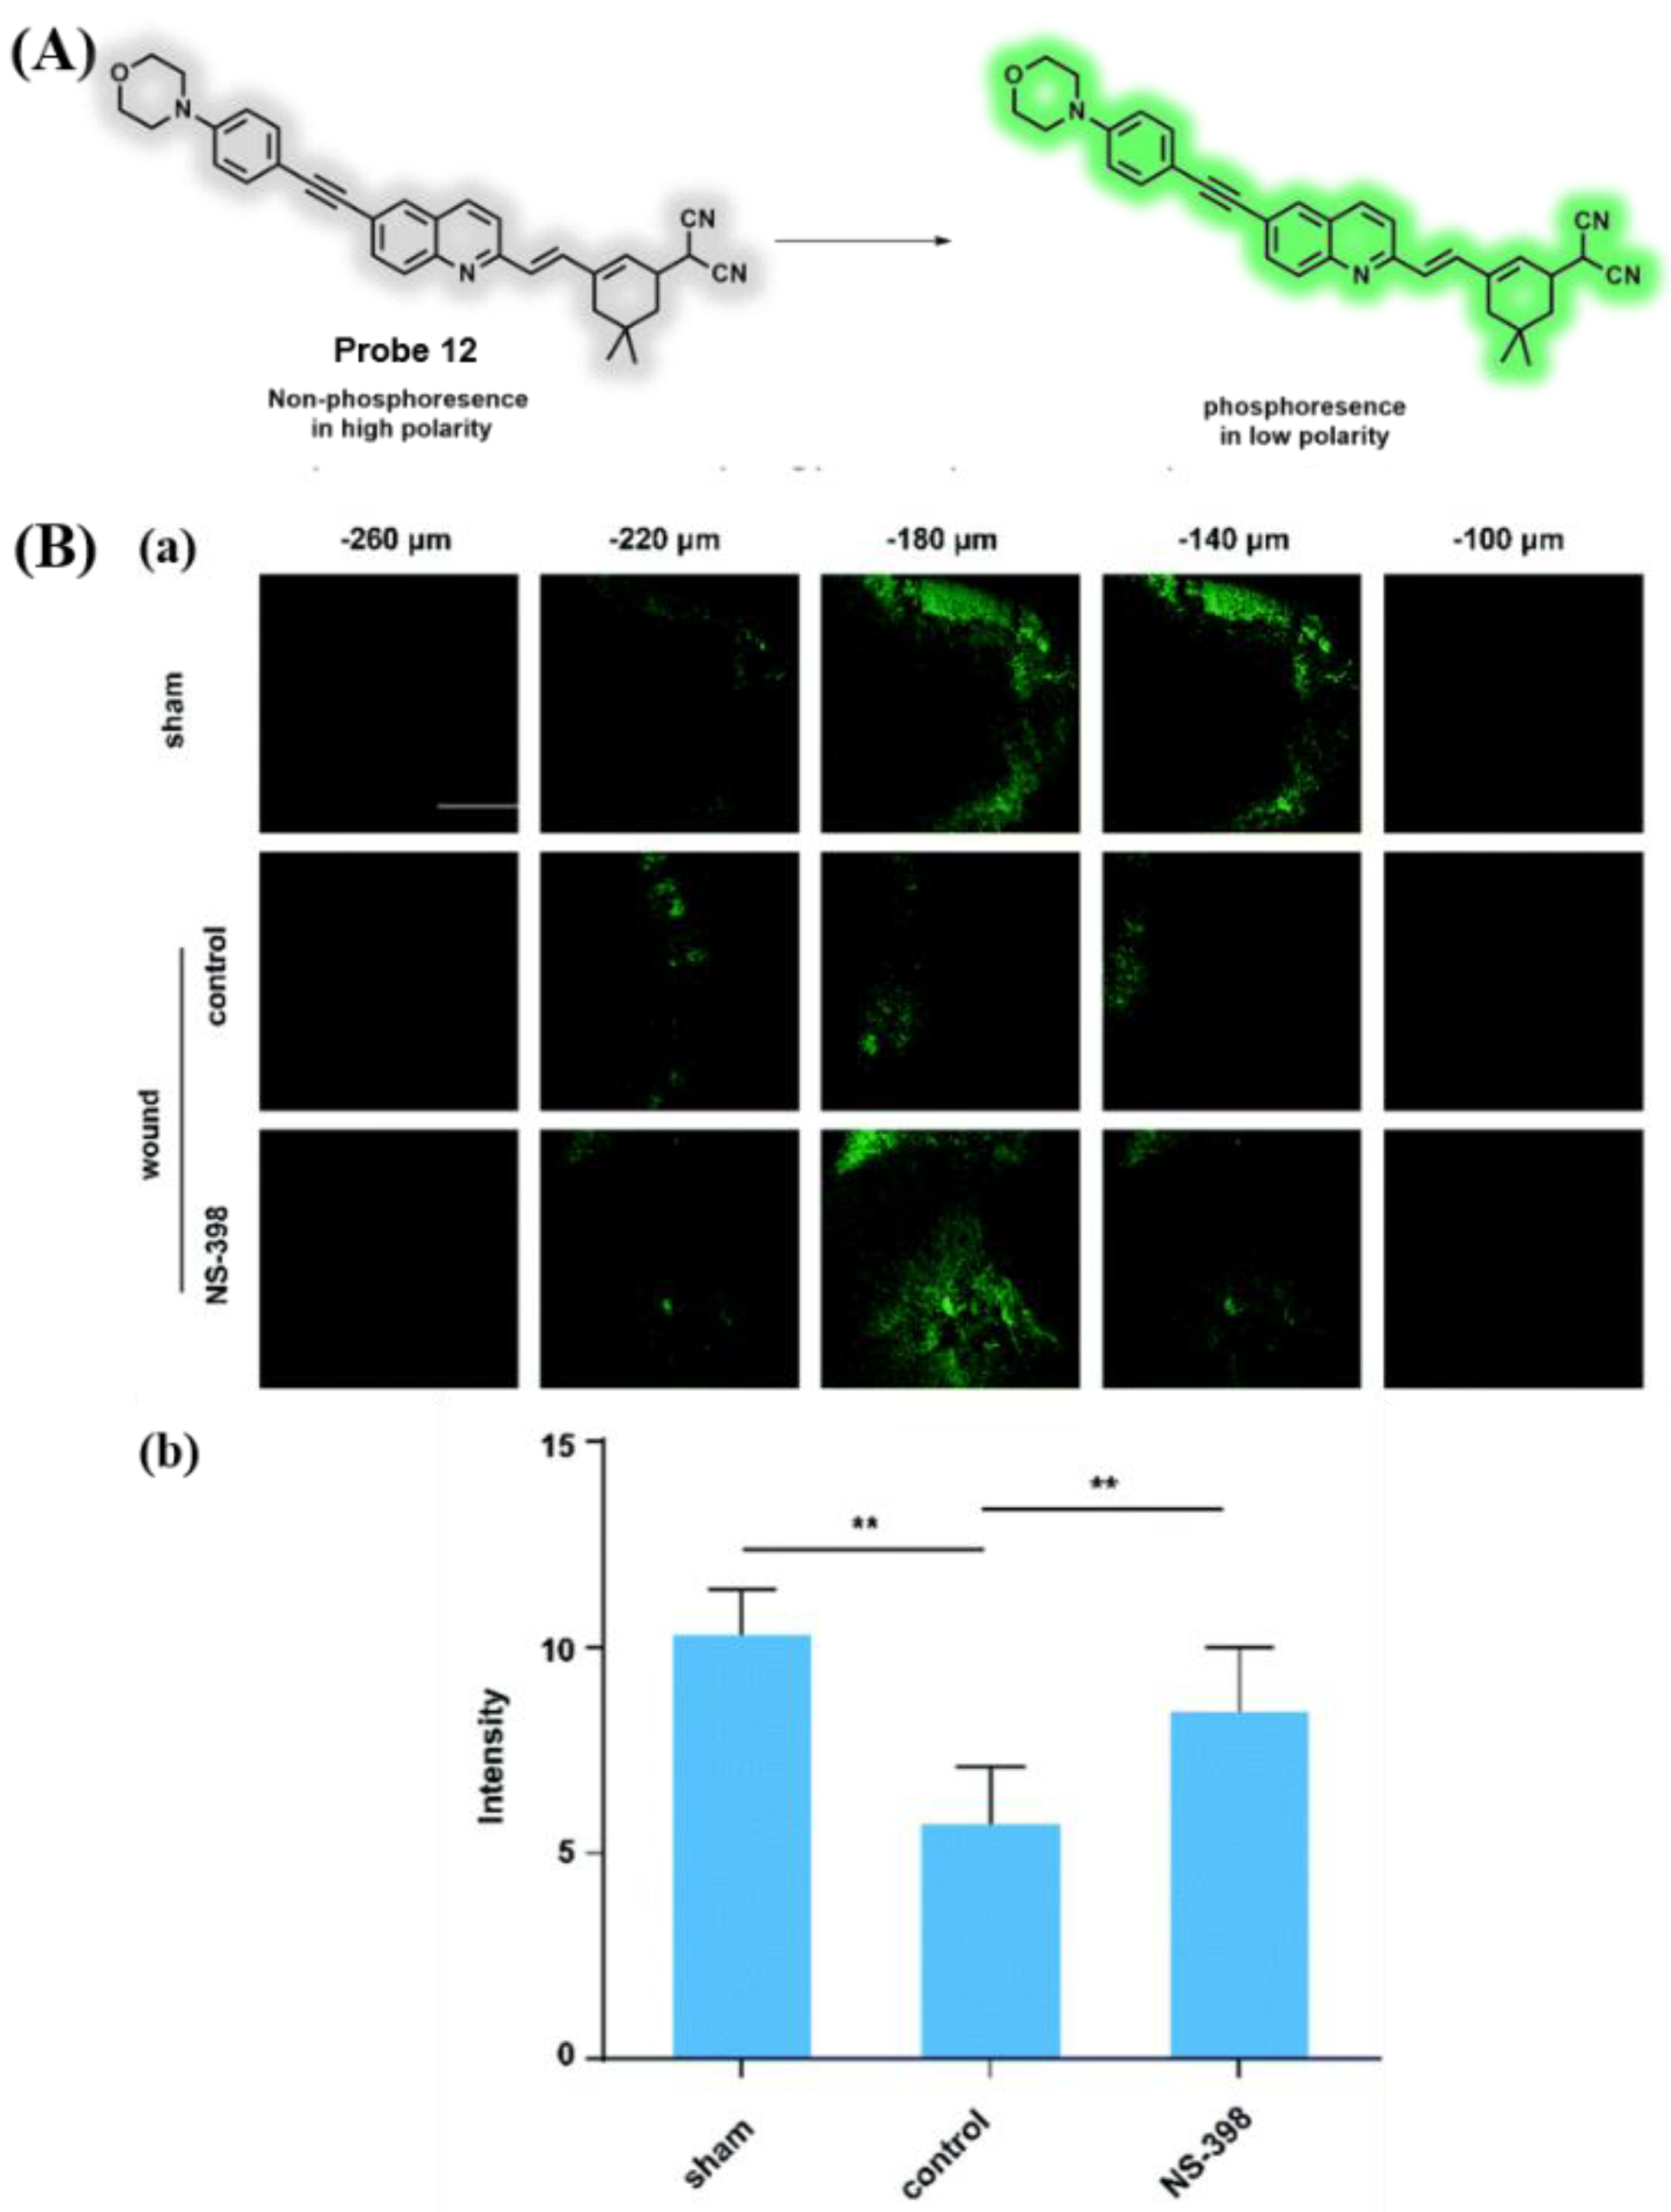
Qiang and colleagues fabricated a two-photon probe (12) with the features of lysosome targeting and polarity-sensitive properties (Figure 10A) [73]. The probe featured several advantages of a large two-photon action cross-section, good water solubility, and excellent biocompatibility. When autophagy occurred, the fluorescence intensity in the green channel showed a dramatic decline. Probe 12 successfully visualized the polarity behavior of lysosomes in BV-2 cells. Furthermore, probe 12 was used to visualize the development of inflammation caused by skin ulcers in diabetic mice (Figure 10B).
3.3. Probes Targeting ROS
Diabetes is a disease characterized by hyperglycemia, which threatens human health [70]. The excessive production of ROS is due to the oxidative phosphorylation of glucose, which results in the activation of non-enzyme glycosylation and the reduction of the antioxidant capacity of superoxide dismutase [74,75,76,77,78]. In addition, the burst of ROS may be linked to the onset and evolution of diabetes and related complications, including liver diseases, neurodegenerative diseases, and kidney diseases [79,80]. Therefore, revealing the detailed mechanism of the occurrence and evolution of diabetes has attracted great attention in the field of biology and medical research.
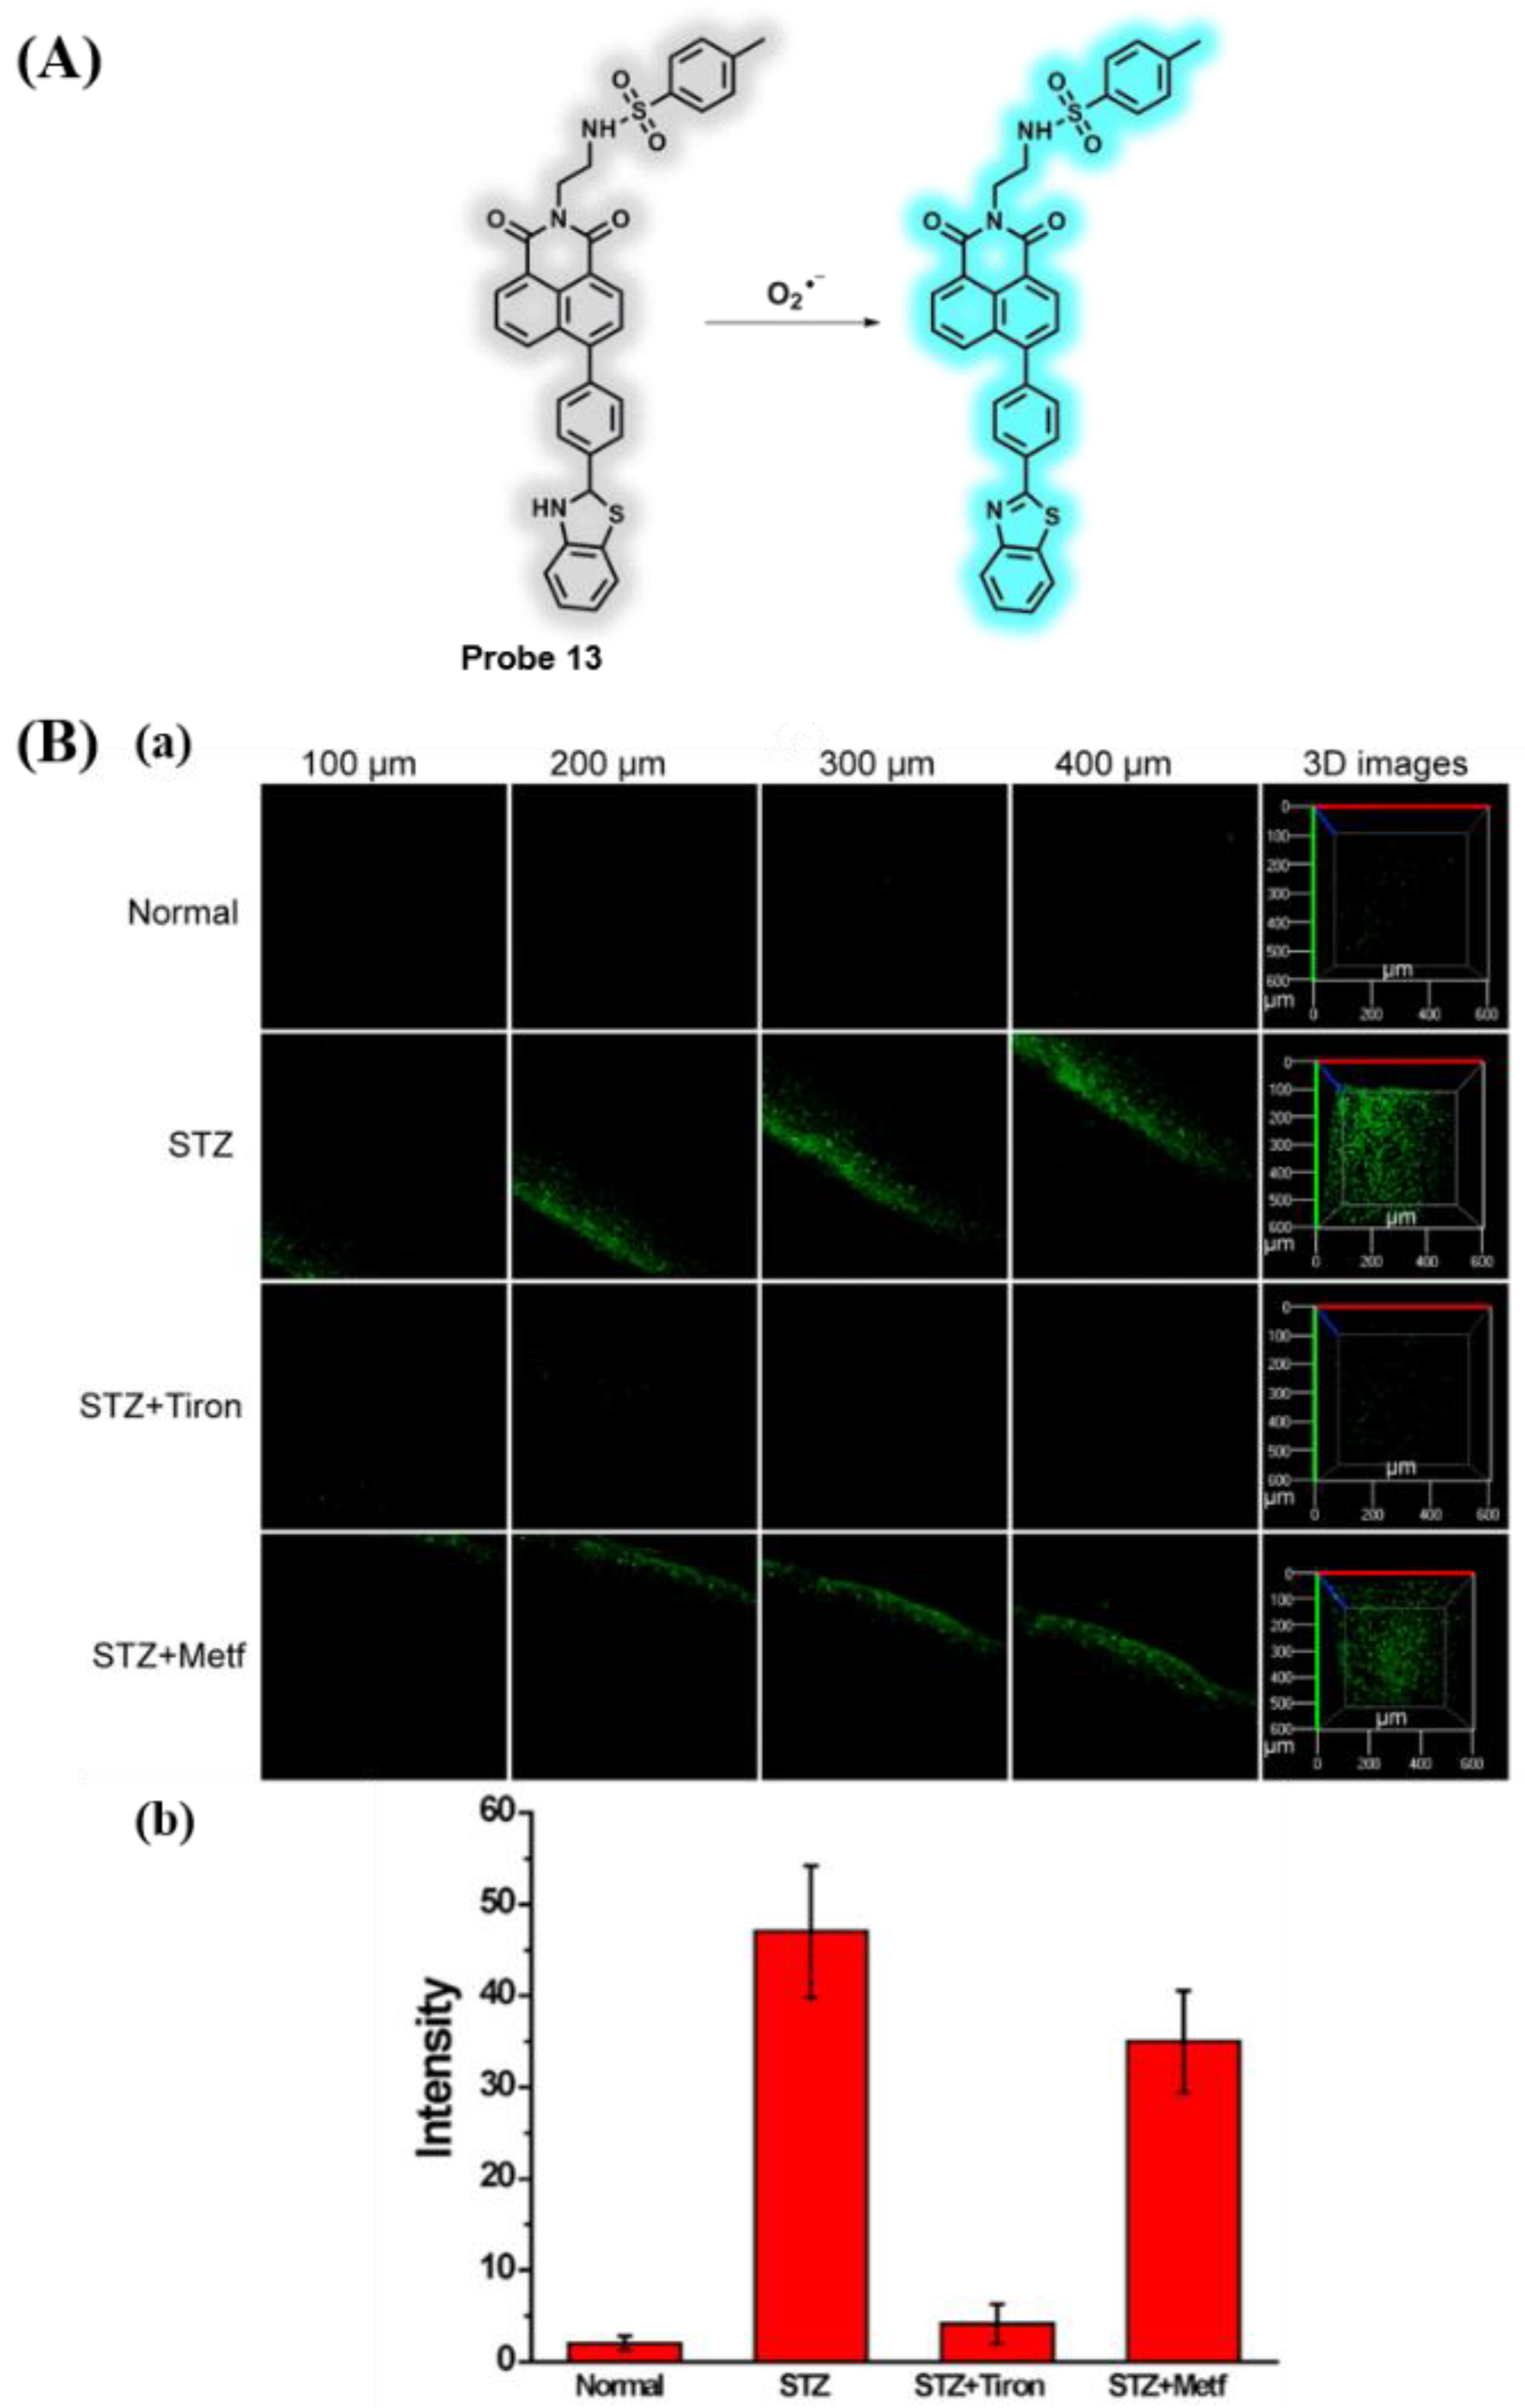
Superoxide anion (O2•−), as a kind of cell signaling mediator of ROS, is related to the physiological and pathological process of diabetes [81,82,83]. In 2017, Tang and coworkers reported the ER-targeted two-photon fluorescent probe 13 [84], which was composed of 1,8-naphthalimide, benzothiazoline, and methyl sulphonamide (Figure 11A). When O2•− was introduced, probe 13 exhibited a remarkable fluorescence enhancement (11-fold) around 450 nm, and the limit of detection was 60 nM. In addition, probe 13 featured the advantages of excellent sensitivity, selectivity, and stability and low toxicity. Fluorescence imaging experiments suggested that O2•− levels in ER were increased under different conditions. The fluorescence imaging of two-photon showed that endogenous O2•− in the liver and abdomen of normal mice was less than that of diabetic mice. Moreover, the diabetic mice were treated with an antidiabetic drug of metformin, and the levels of O2•− were reduced (Figure 11B).
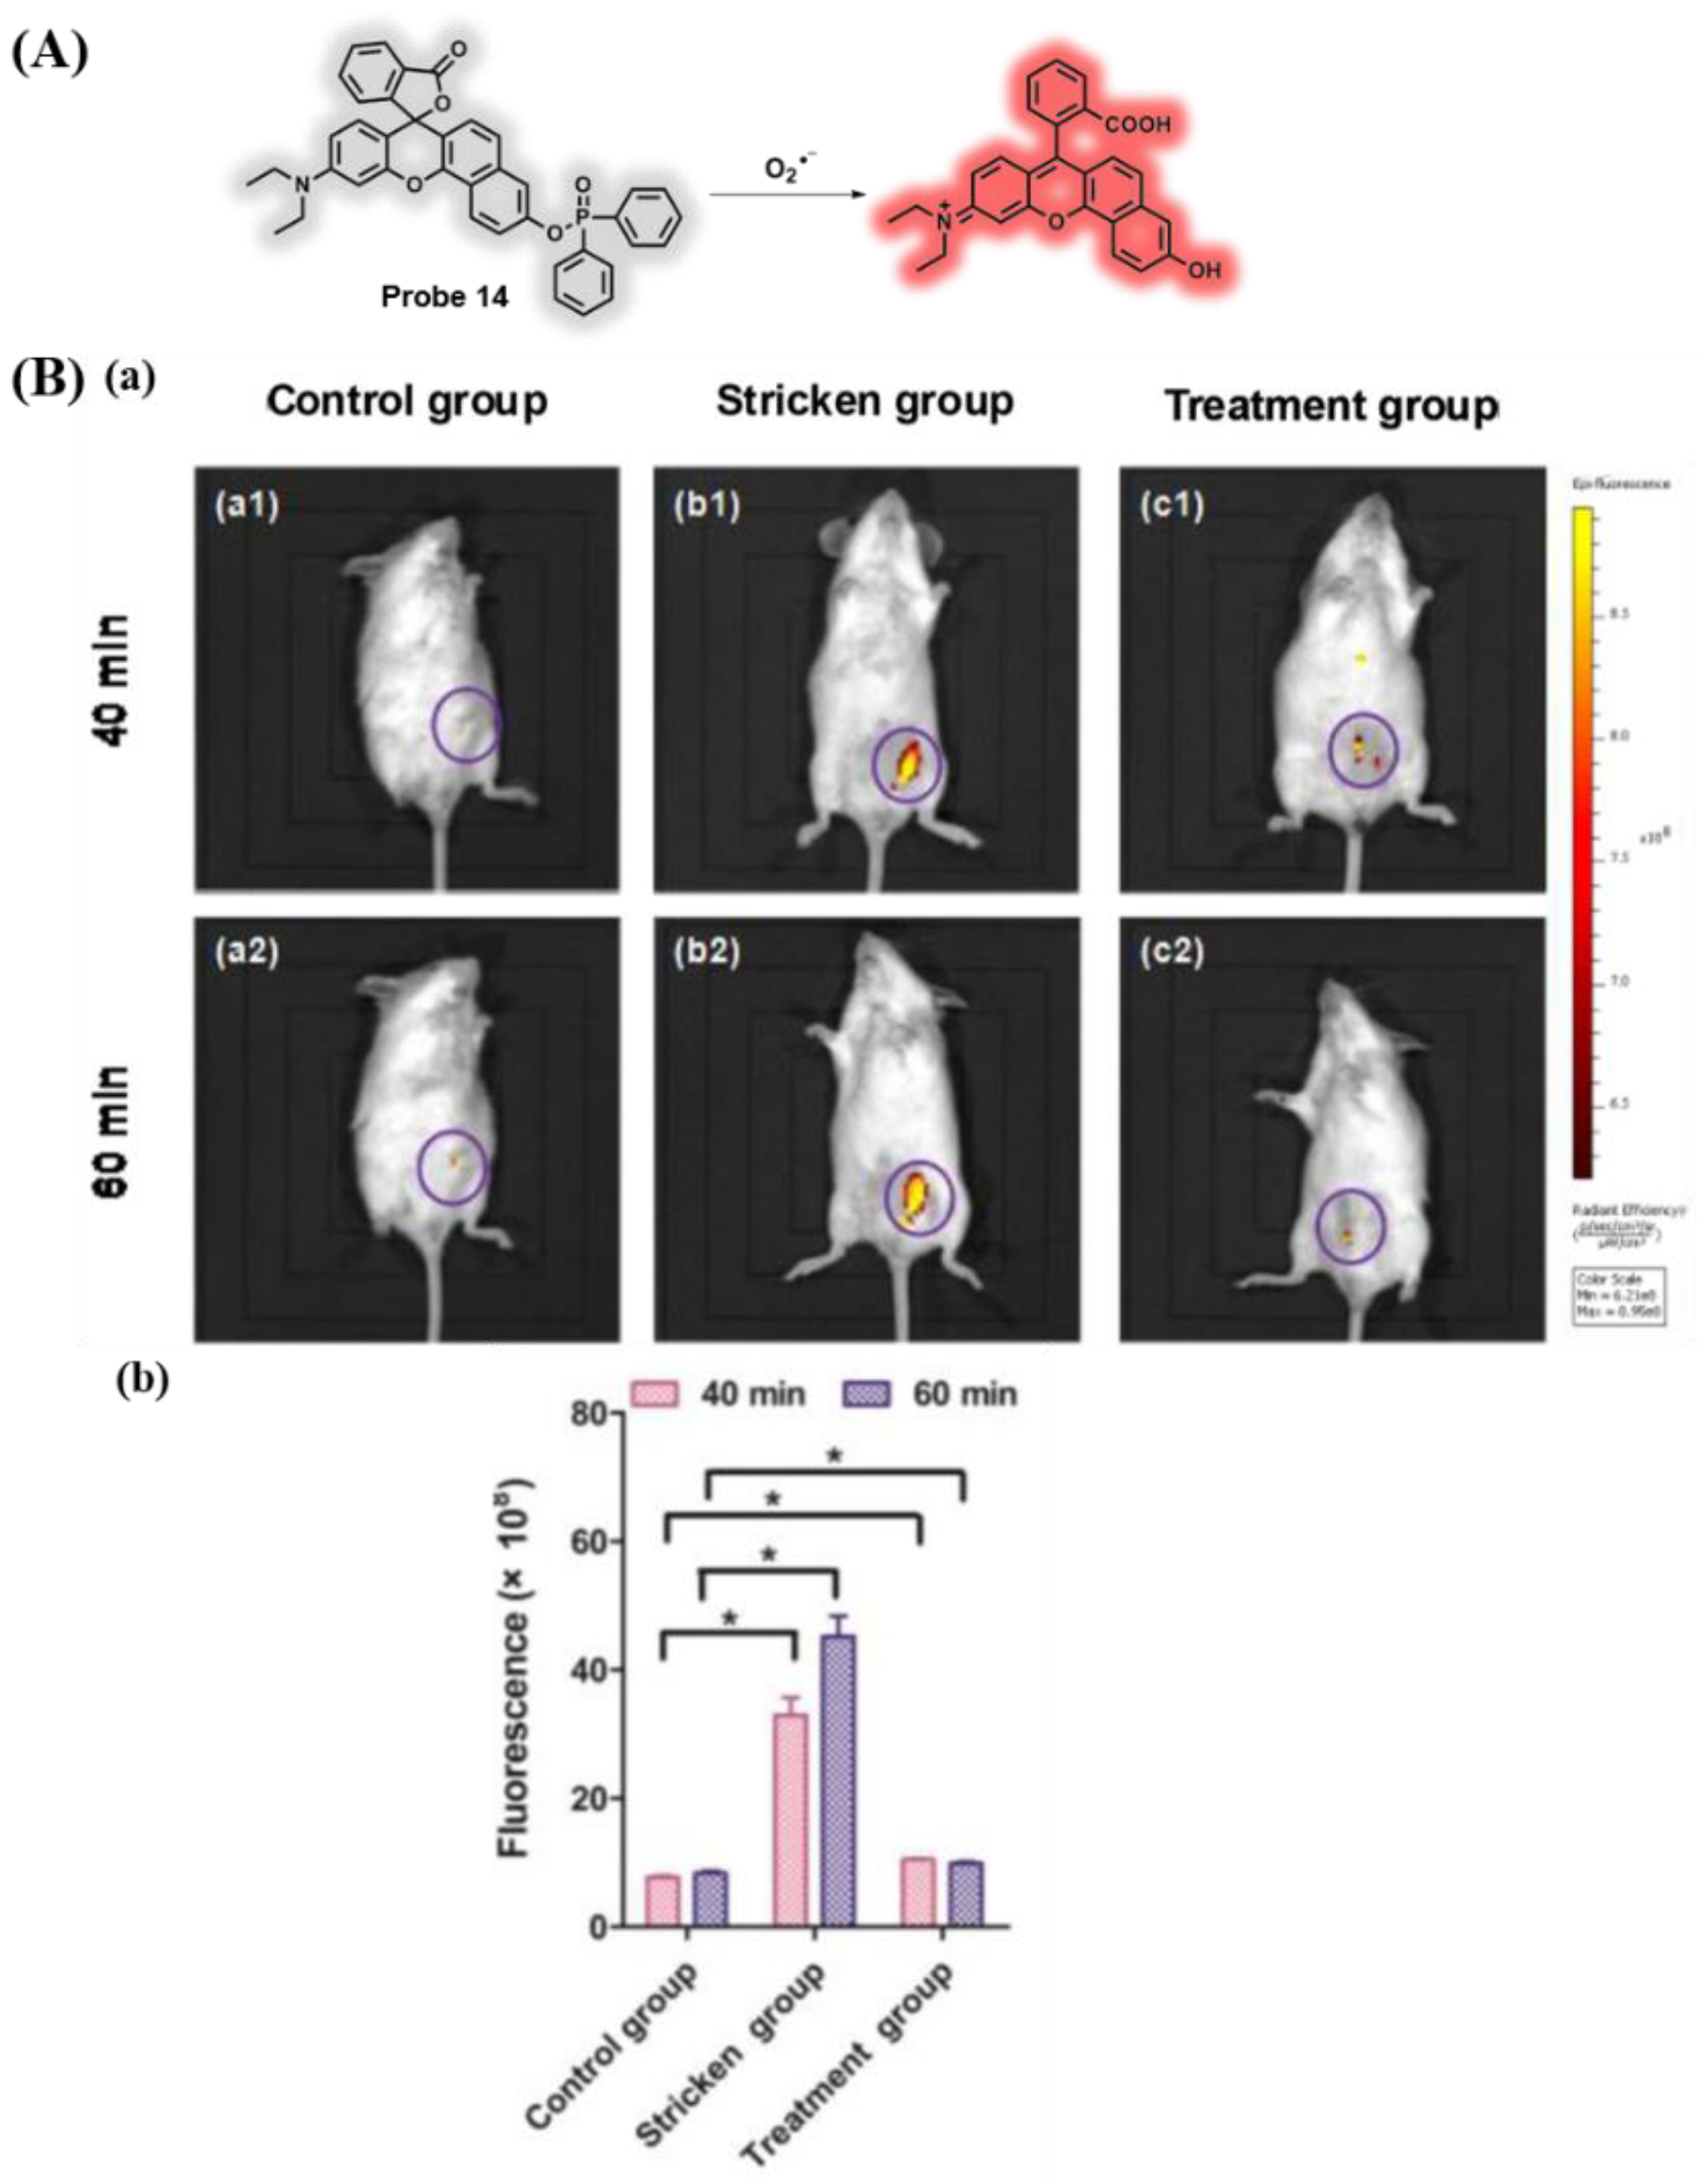
In 2021, Lin and coworkers developed a two-photon fluorescent probe that could detect aberrant levels of O2•− in diabetes [85]. The probe adopted Rho as the red luminescent group and used diphenylphosphine as the quenching group and O2•− response site (Figure 12A). After reacting with O2•−, probe 14 emitted red fluorescence at 638 nm with the detection limit of 2.09 μΜ and reached a response plateau after 150 s. Probe 14 had high sensitivity, excellent selectivity, and low toxicity. In addition, the concentrations of intracellular O2•− under different stimuli were observed by two-photon fluorescence imaging experiments. Probe 14 achieved the changes of O2•− in diabetic mice and mice after treatment (Figure 12B).
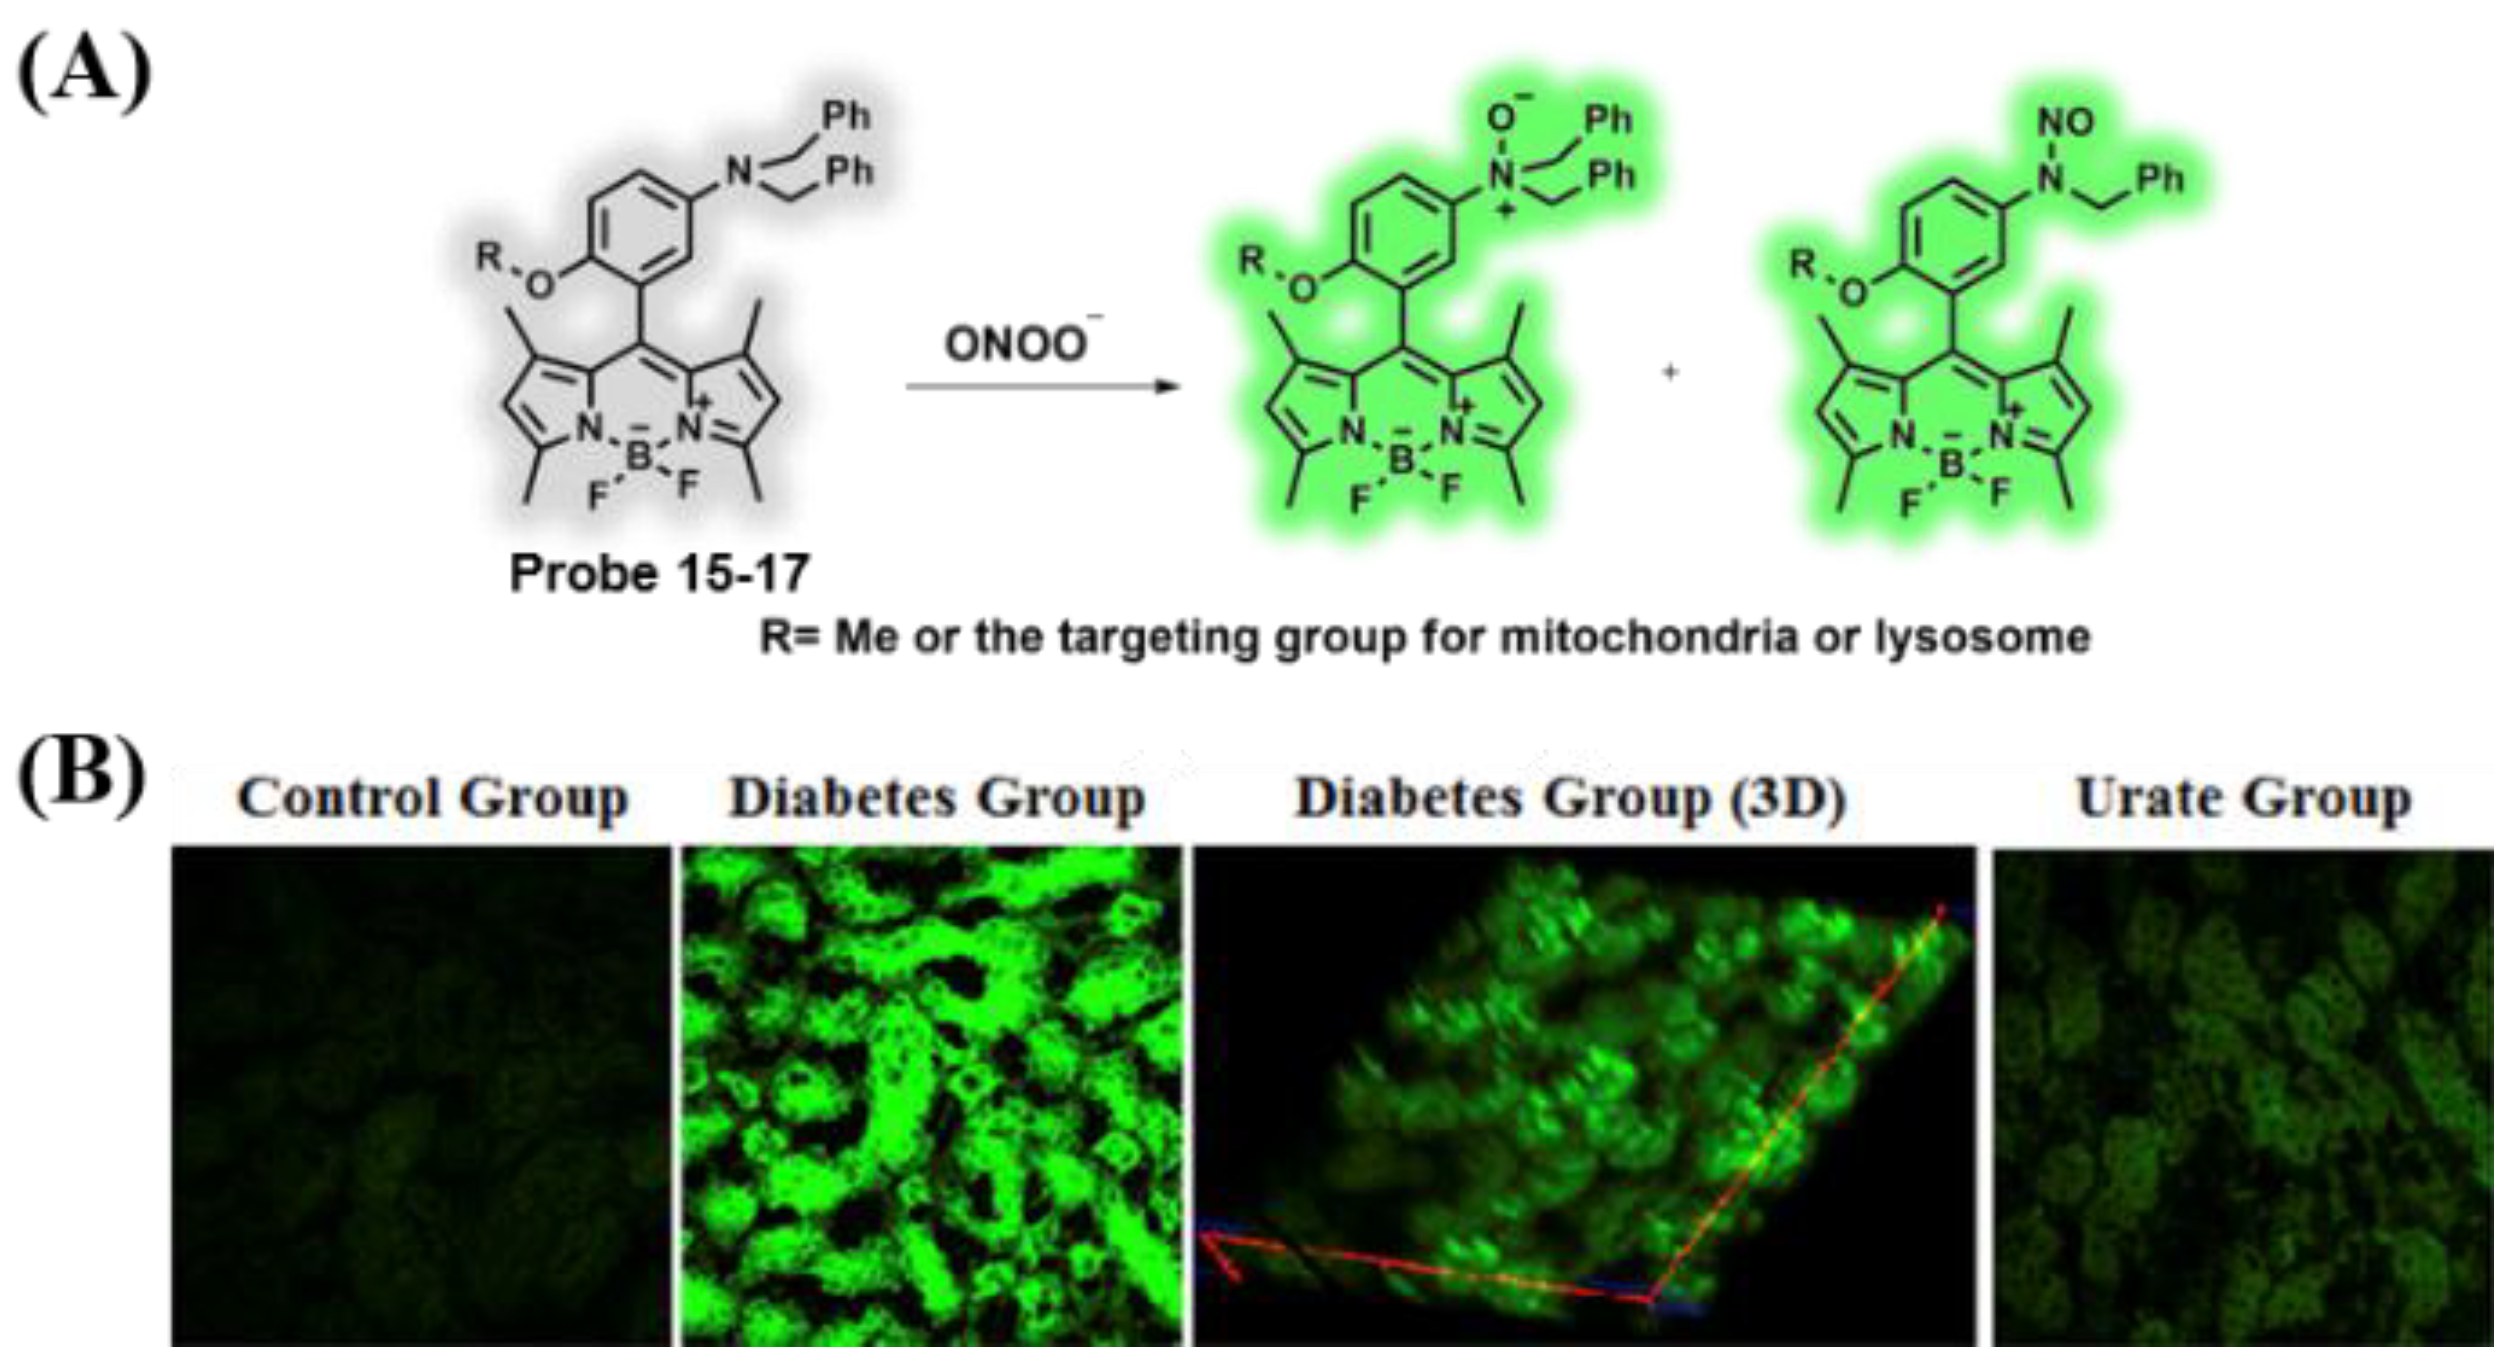
Peroxynitrite (ONOO−), as a crucial oxidant in organisms, participates in the reaction of many biomolecules, such as proteins, lipids, and nucleic acids, thus leading to some diseases including diabetes, cancer, and autoimmune [86,87,88,89,90]. In 2016, an ONOO− fluorescent probe 15 was successfully designed and synthesized by Guo and coworkers [91], and it featured the advantages of fast response, a low detection limit (<2 nM), and excellent selectivity. When treated with ONOO−, the photoinduced electron transfer (PET) quenching process was inhibited, and probe 15 displayed remarkable green fluorescence enhancement (560-fold) around 517 nm (Figure 13A). The colocalization results demonstrated that probes 16 and 17 were able to image ONOO− in the corresponding subcellular organelles, respectively. The visualization of endogenous ONOO− in RAW264.7 cells, EA.hy926 cells after oxygen-glucose deprivation (OGD), and kidneys of diabetic rats was realized by probe 15 (Figure 13B).
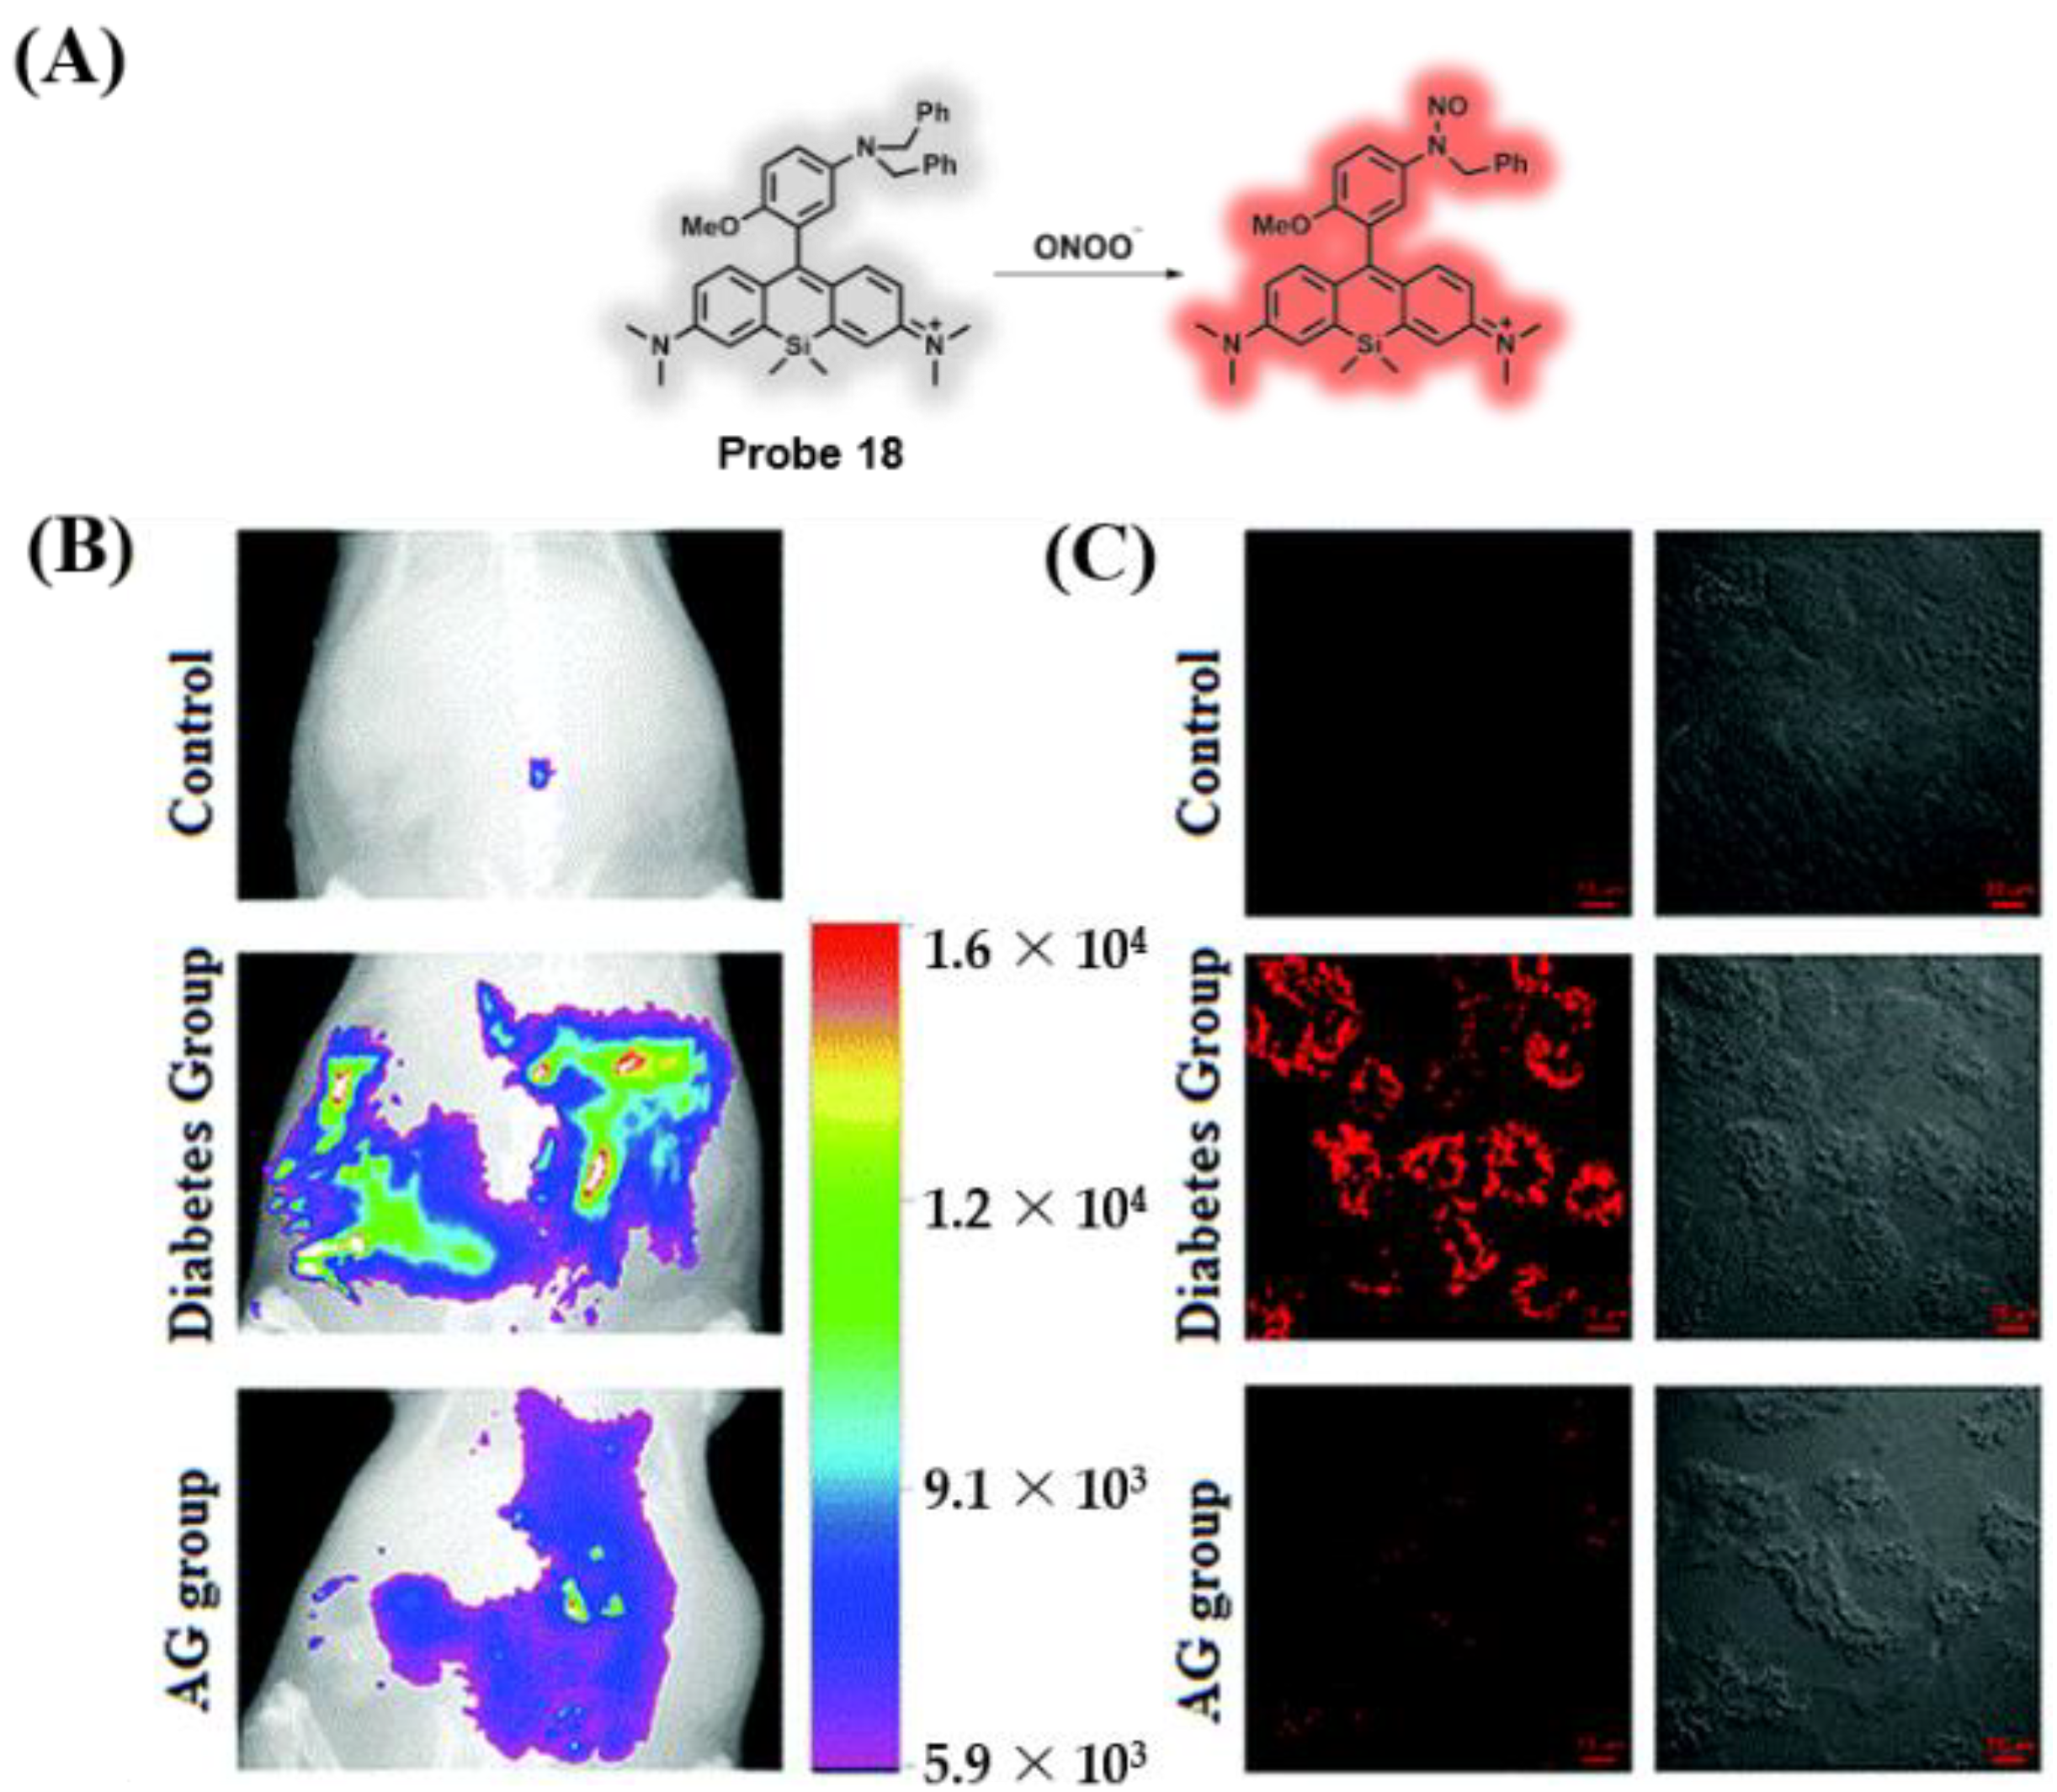
Probe 15 exhibited a fast response and good selectivity for ONOO− [91]. However, it could be found that probe 15 possessed excitation and emission wavelengths of 400–650 nm (visible region), which may be a defect for in vivo imaging applications. To overcome the above limitation, Guo’s group successfully obtained the NIR fluorescent probe 18 for examining and visualizing endogenous ONOO− [92]. Probe 18 was composed of a functional group with aromatic tertiary amine and a Si-rhodamine fluorophore (Figure 14A). When ONOO− was introduced to probe 18, a fast and specific reaction occurred along with an arresting fluorescence off–on response around 680 nm. Probe 18 also displayed outstanding sensitivity, with a detection limit of 3.0 nM and had the potential for visualizing and examining exogenous and endogenous ONOO− in cells. Probe 18 had the ability to analyze the pathogenesis in activated pancreatic β-cells and diabetic rats. In addition, visualization of ONOO− in diabetic rats during the development of diabetic nephropathy was also carried out (Figure 14B).
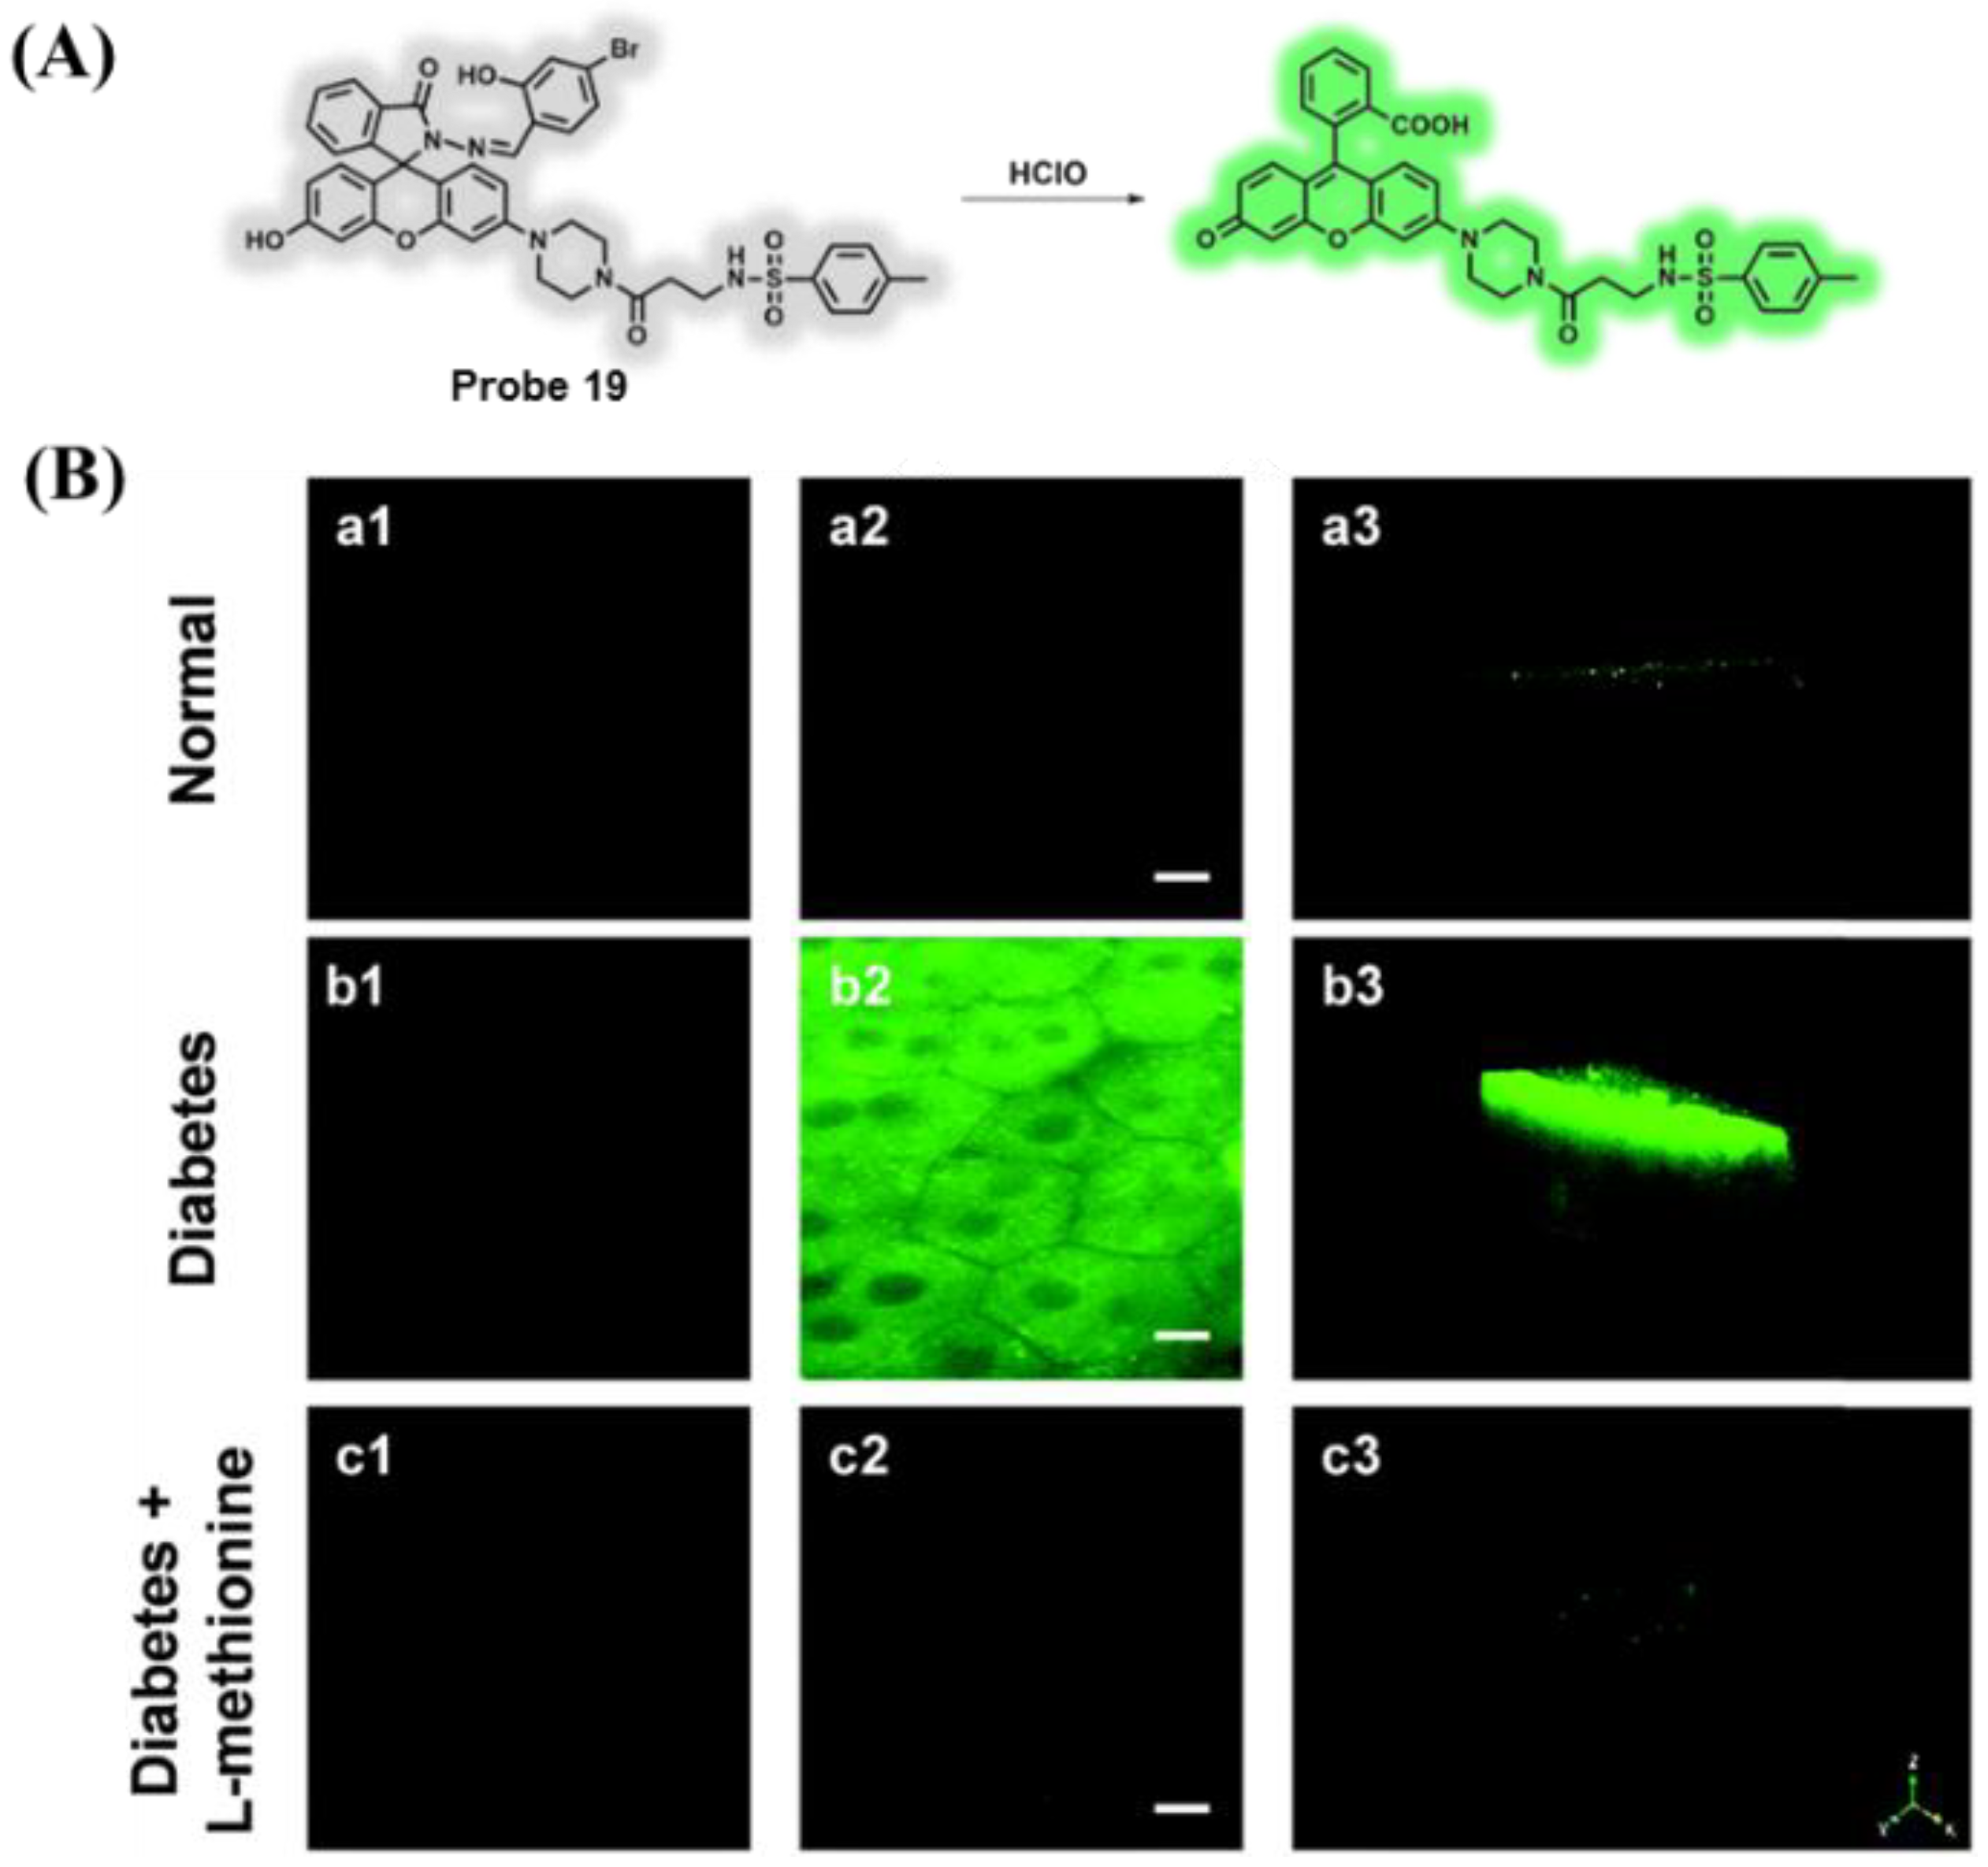
Diabetes is closely related to excessive HClO induced by ER stress [93,94]; thus, it is vital to test HClO behavior in the ER to study the relationships between HClO and diabetes. In 2021, Lin et al. constructed a two-photon fluorescent probe (19) for examining HClO behavior in diabetes [95]. Probe 19 consisted of rhodol fluorophore, p-methylbenzene sulfonamide serving as an ER-specific part, and 4-Bromo-2-hydroxybenzaldehyde for improving its lipid solubility (Figure 15A). When probe 19 was treated with various concentrations of HClO, the fluorescence signal (556 nm) enhanced depending on the concentration. In addition, probe 19 exhibited high selectivity and sensitivity with a detection limit of 0.785 μM for detecting HClO. Moreover, probe 19 was applied in the monitoring of HClO levels in vivo (Figure 15B).
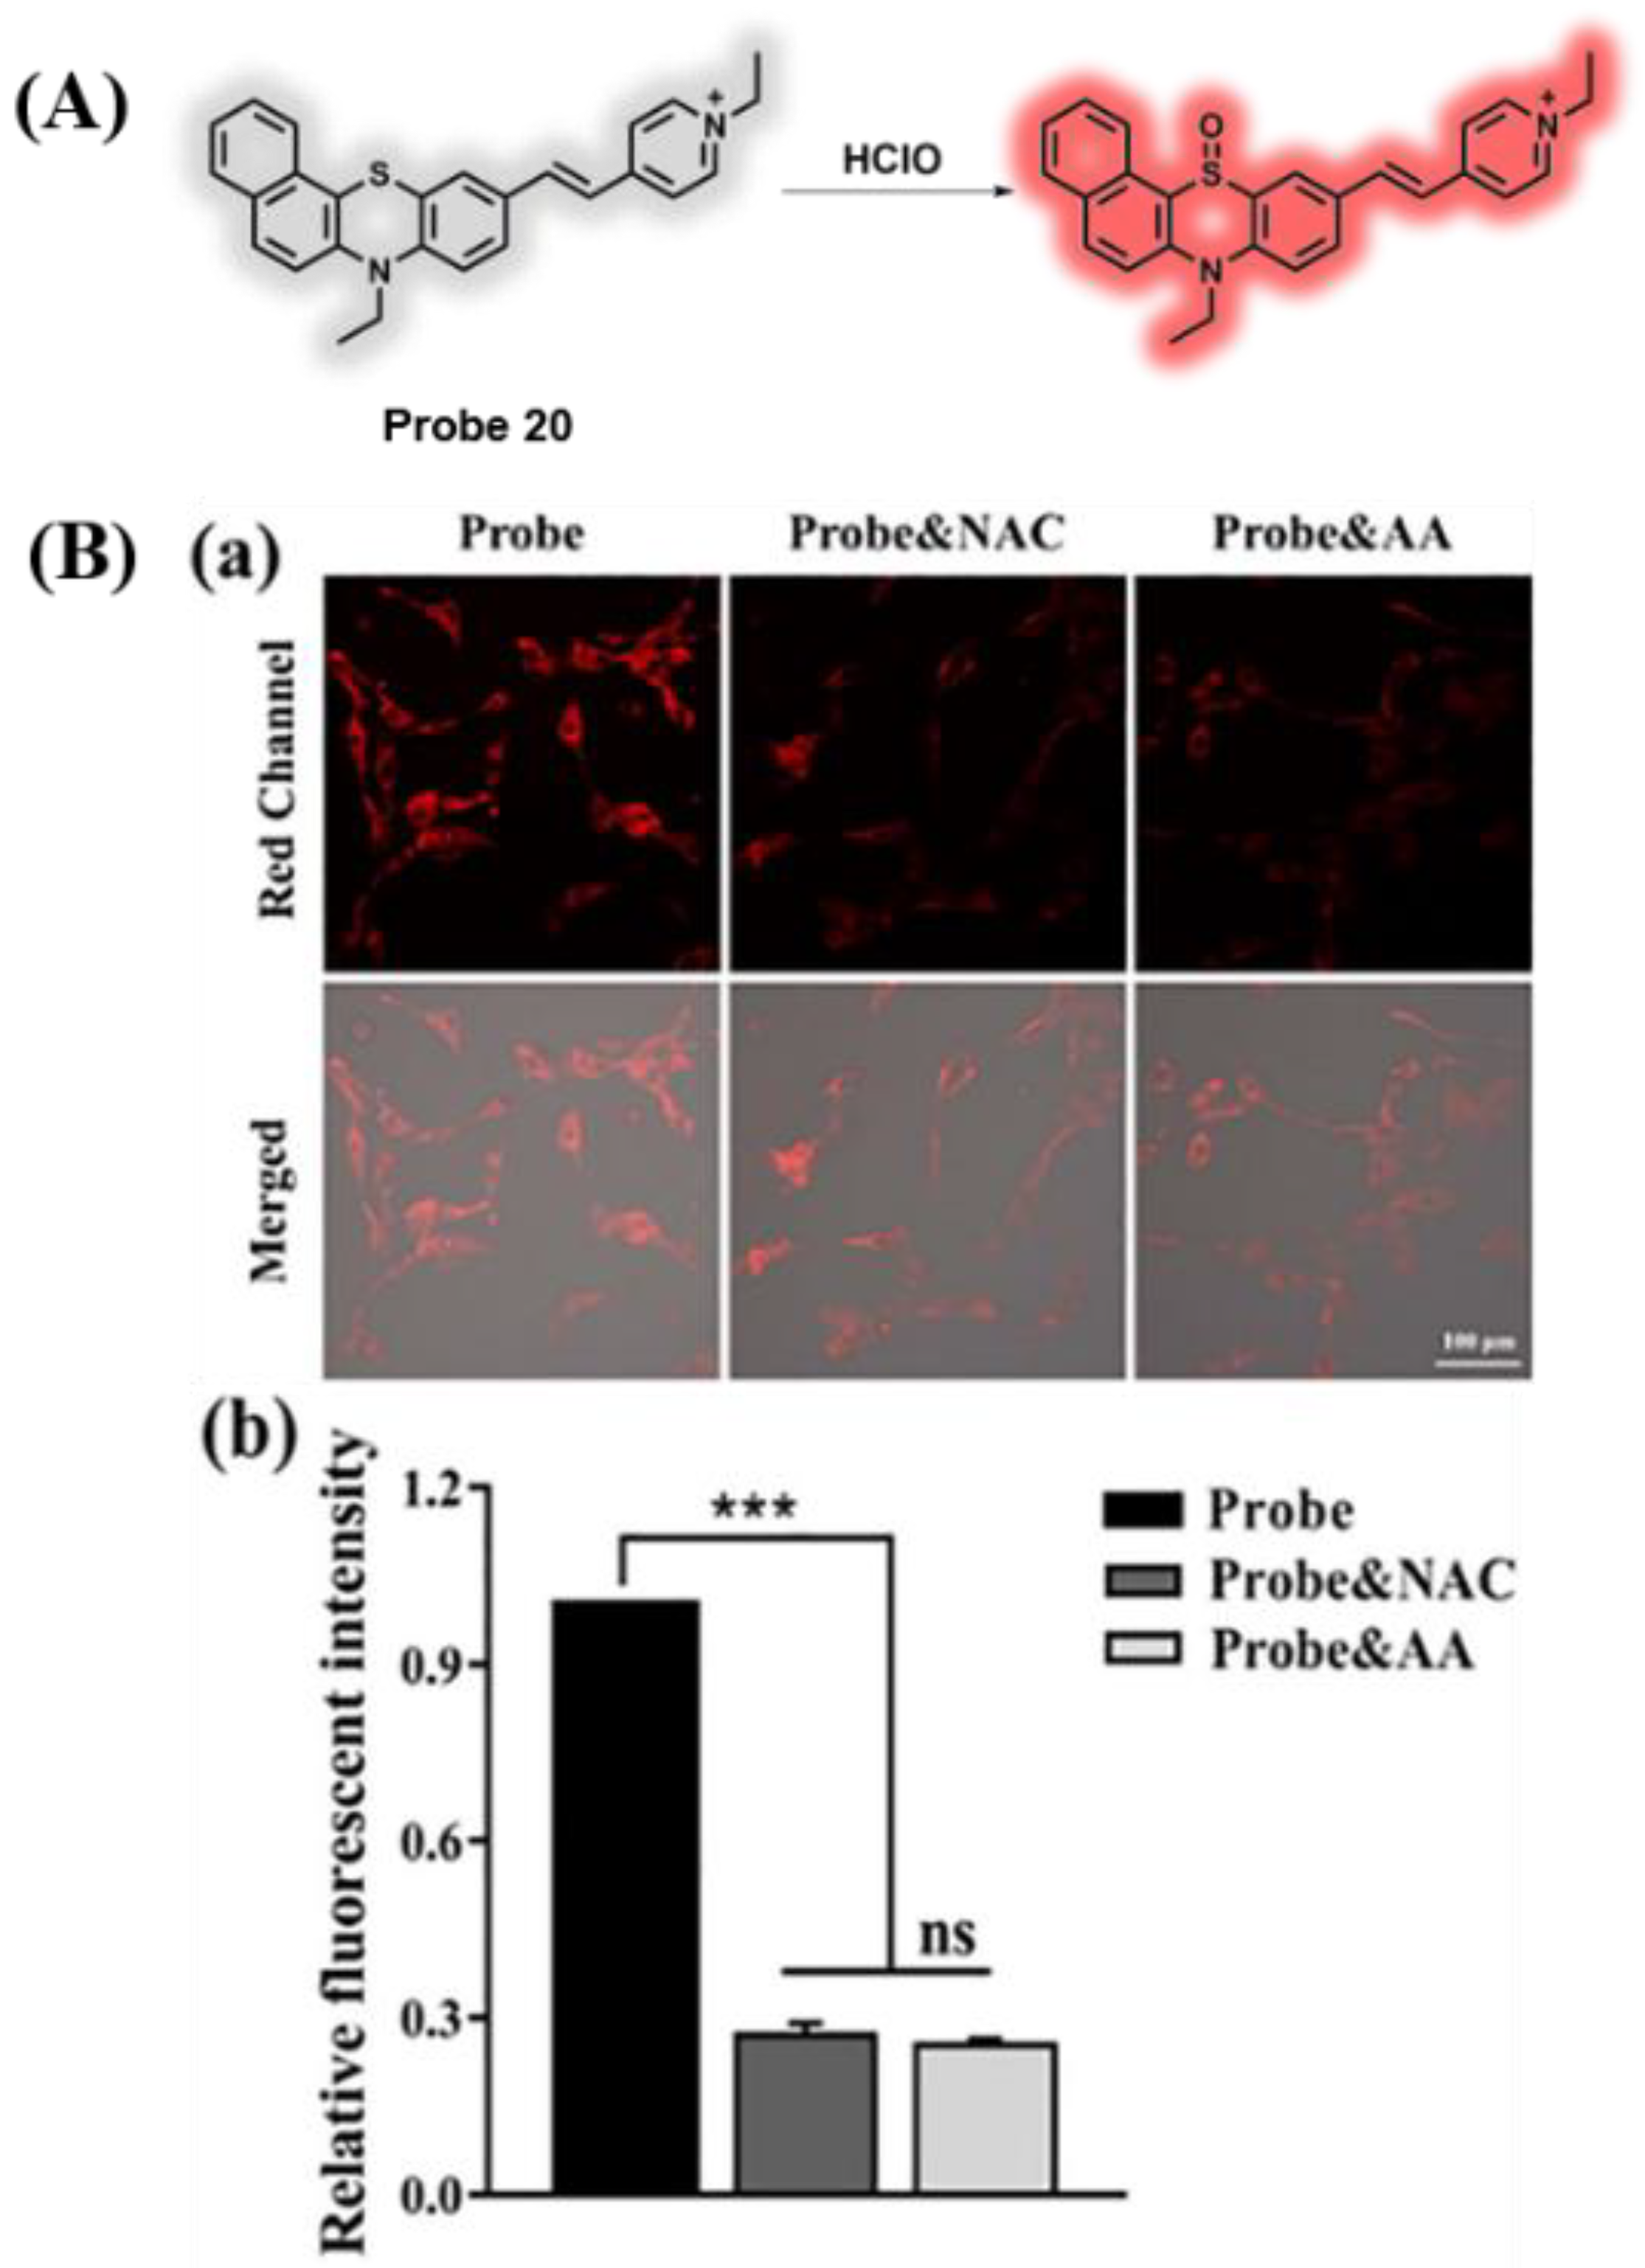
In 2022, Hou et al. developed a red-emitting fluorescent probe (20) to observe HClO production associated with diabetic cataracts [96]. The benzophenothiazine moiety of the probe not only functions as a fluorophore but also acts as a specific recognition group for HClO, and pyridinium salt was introduced to increase the water solubility of the probe (Figure 16A). Probe 20 showed a significant emission enhancement of HClO at 562 nm, with high selectivity, excellent sensitivity, a low detection limit (LOD = 12.6 nM), and fast response (within seconds). Probe 20 has been successfully used to detect exogenous and endogenous HClO in living cells. In addition, probe 20 was successfully used to monitor HClO levels in diabetic HLE cells, as well as downregulation of HClO during antioxidant (NAC or AA) treatment (Figure 16B).
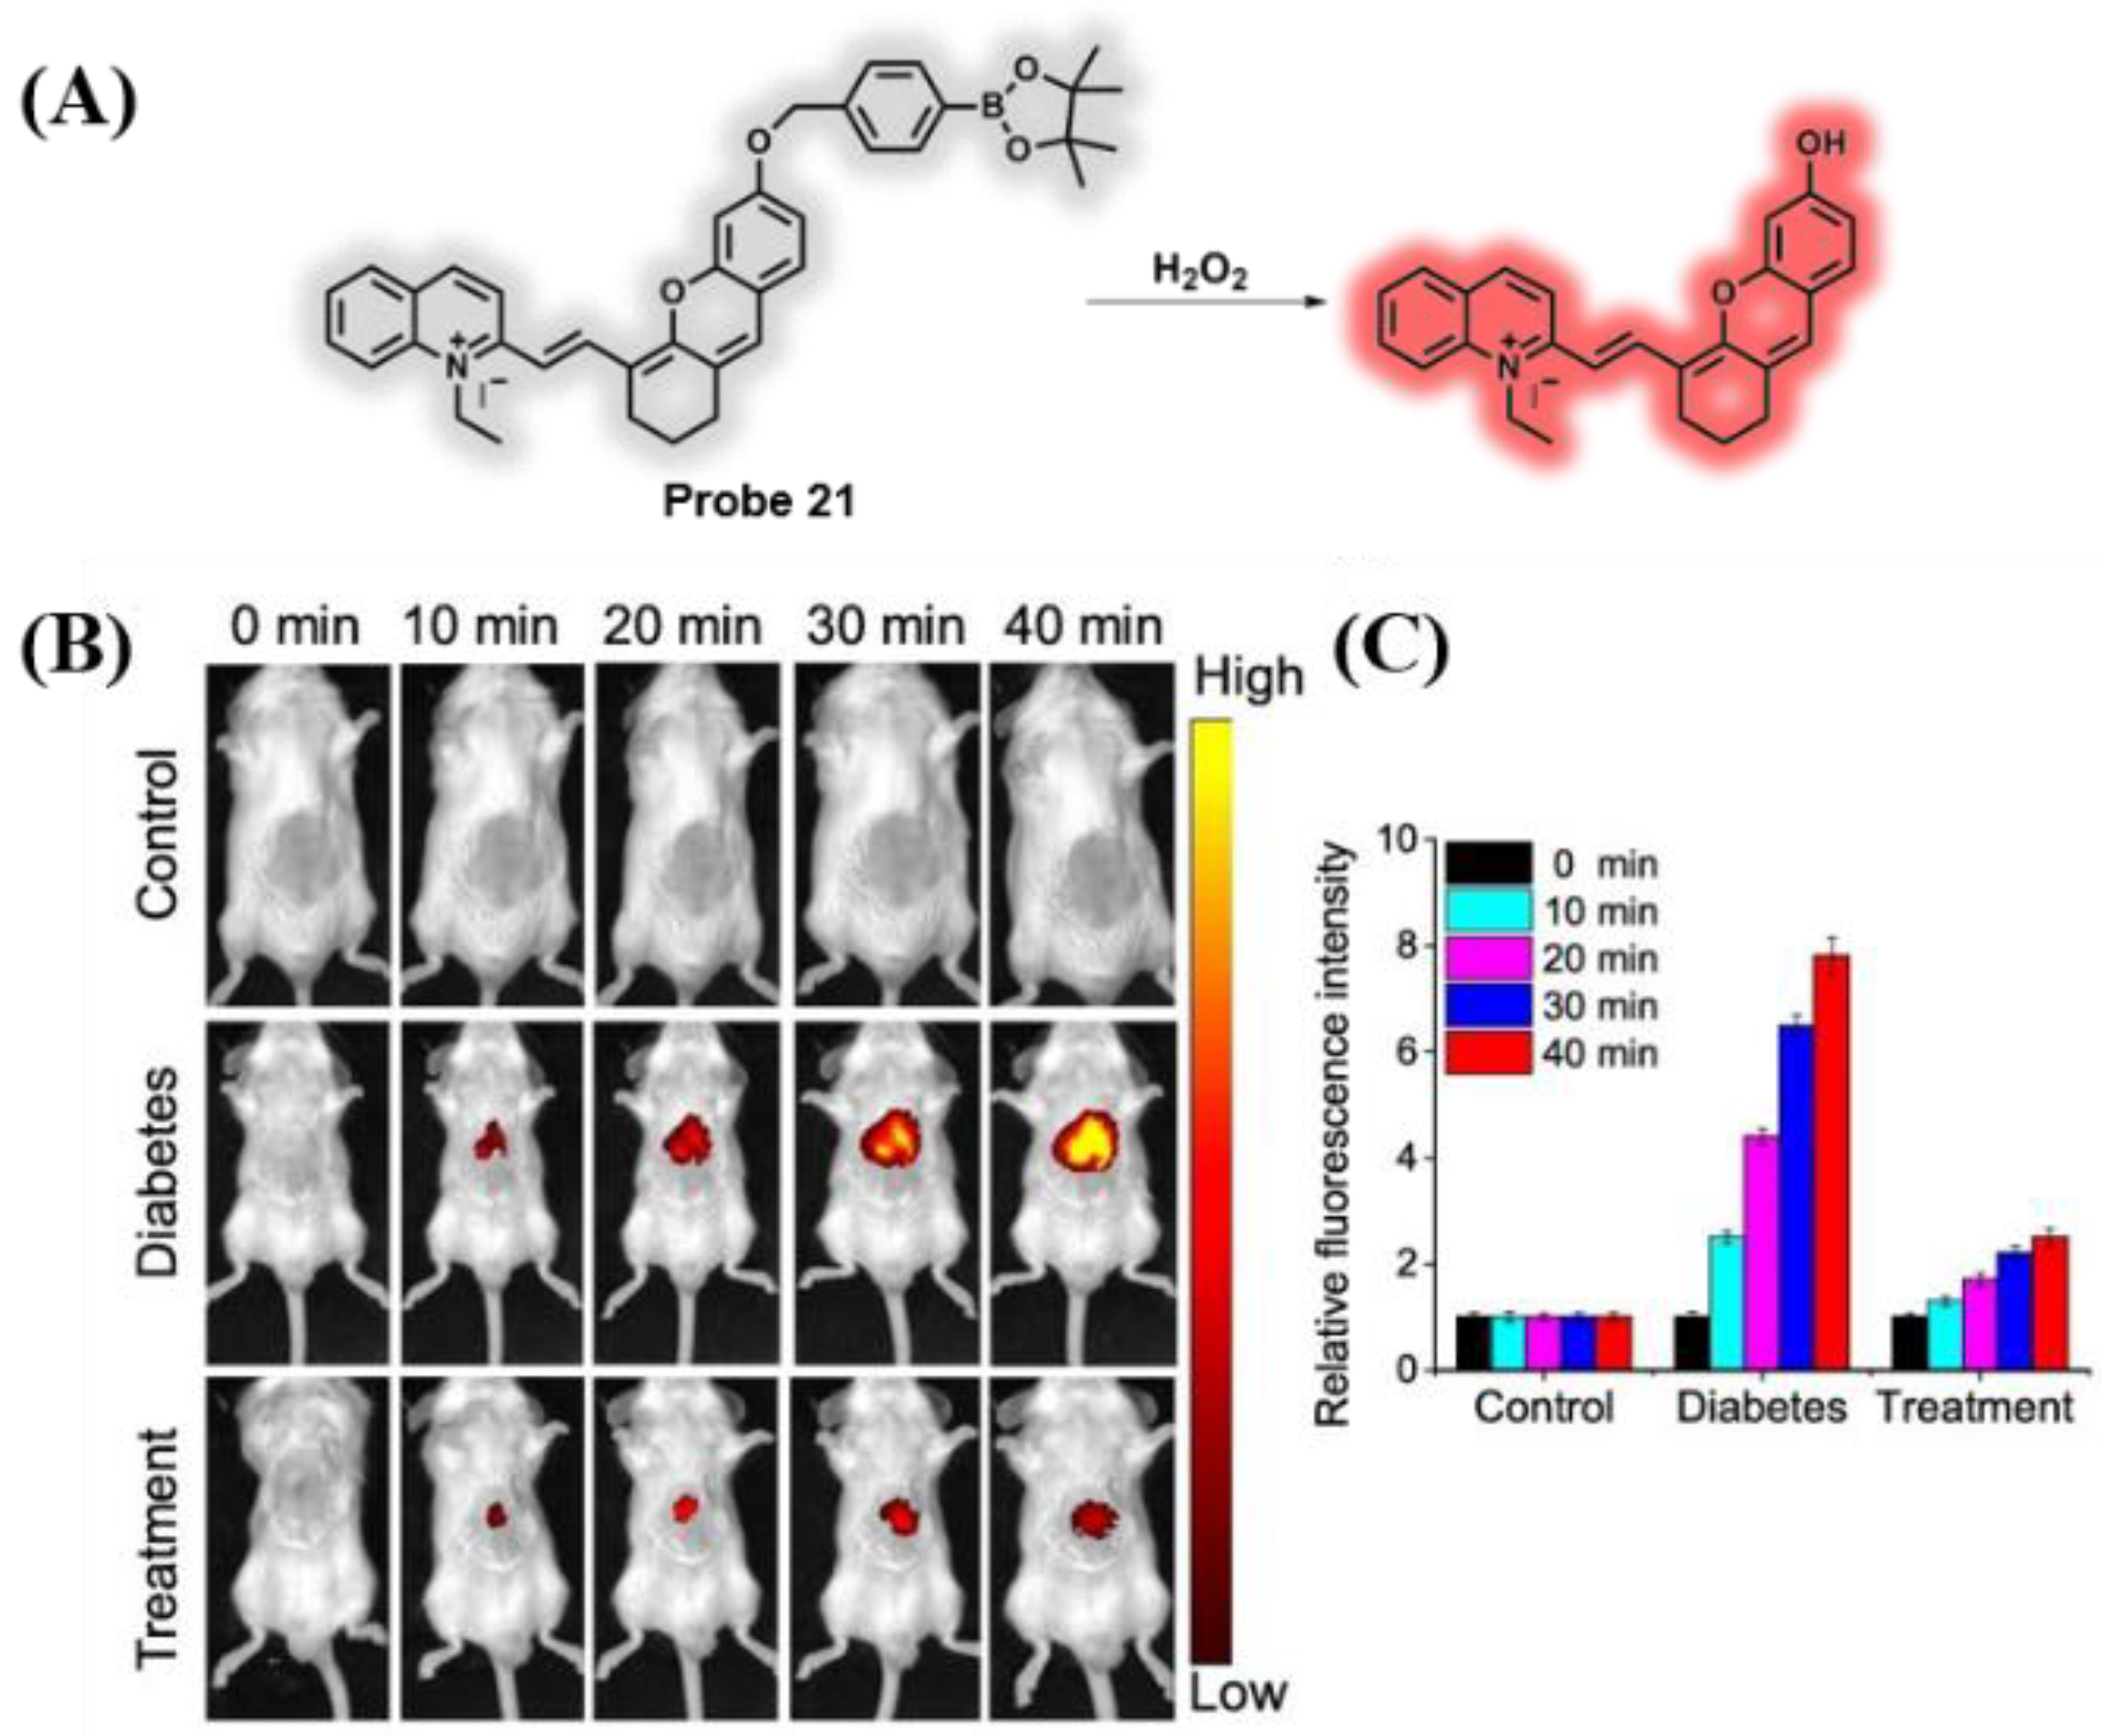
Adopting quinolinium-xanthene dye as a fluorophore and borate ester as the response group of H2O2, the NIR fluorescent probe 21 for examining H2O2 was successfully achieved by Li’s group (Figure 17A) [97]. After H2O2 was introduced into probe 21, a new remarkable NIR fluorescence peak around 772 nm was found, with a detection limit of 0.17 μM. Probe 21 featured outstanding sensitivity and selectivity for testing H2O2. Moreover, visualizing exogenous and endogenous H2O2 in different cells and zebrafish was realized by probe 21. Figure 17B shows that the fluorescence intensity of the control mice was weaker than that of the diabetic mice, and the signal in the diabetic mice was reduced obviously with treatment with metformin.
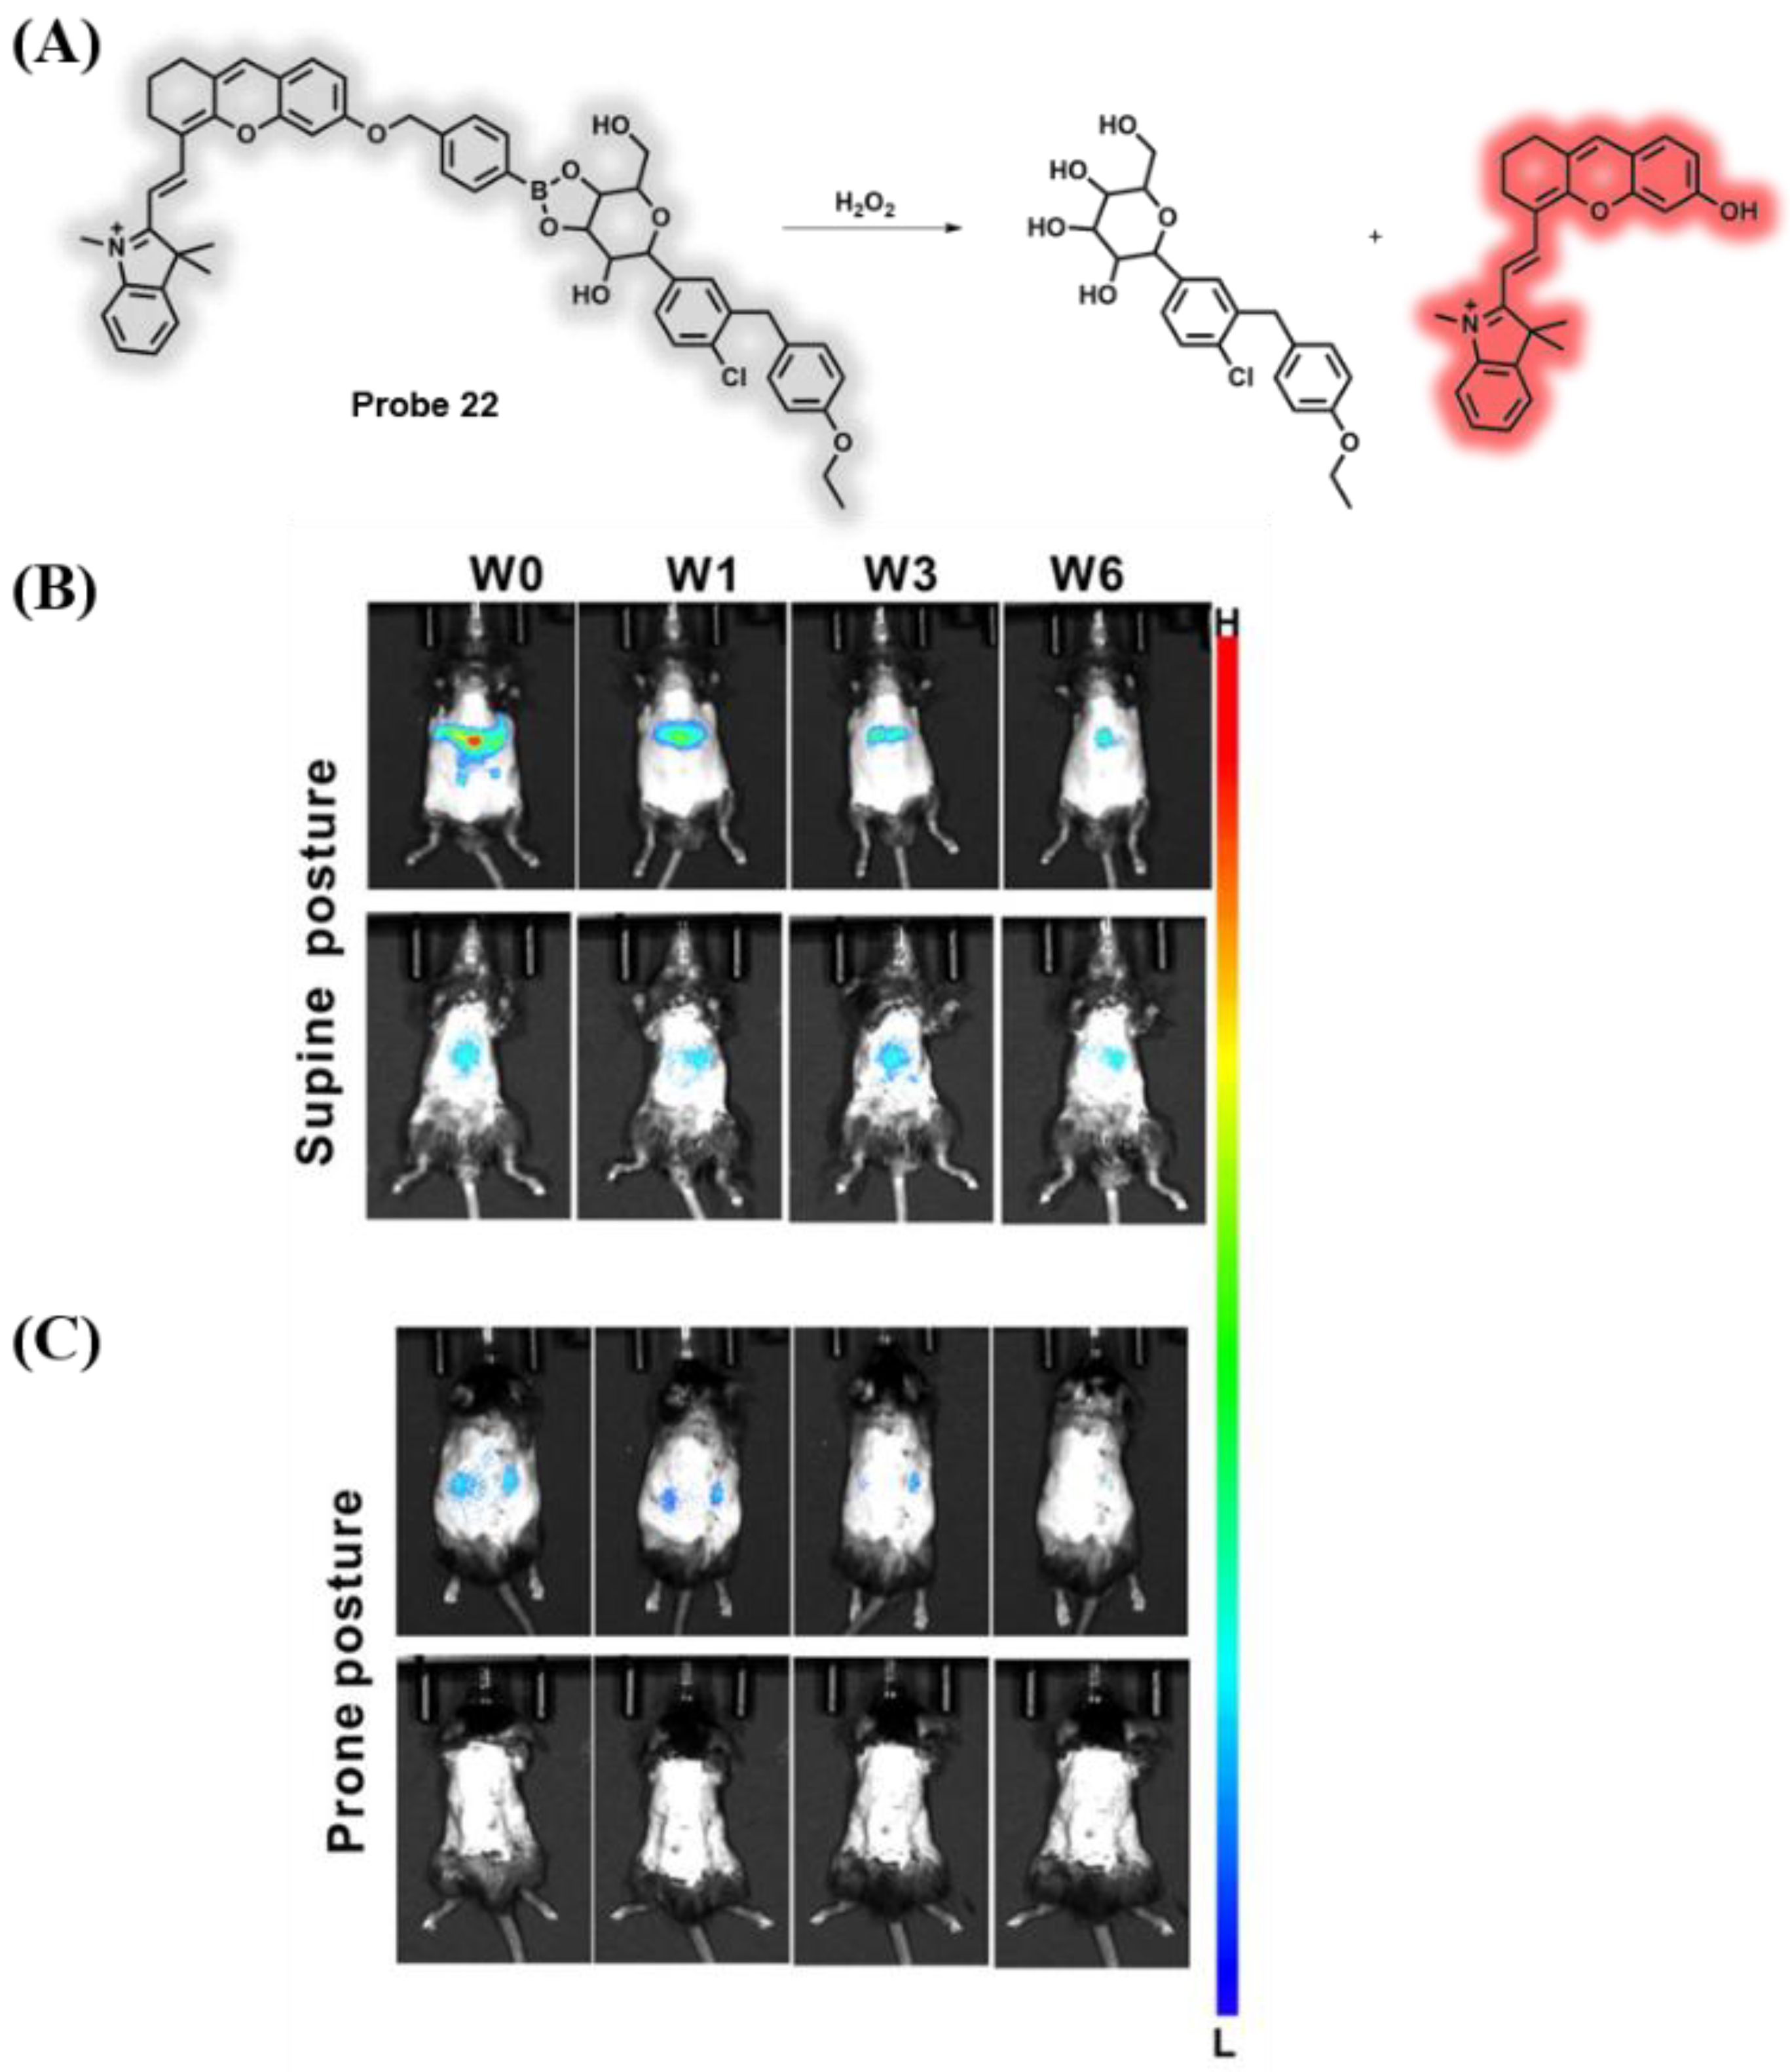
In 2021, a fluorophore–dapagliflozin dyad (22), as a theranostic system, was designed and synthesized by Wu’s group [98]. Probe 22 consisted of NIR fluorescent dye (DX) and the SGLT2 inhibitor, dapagliflozin (DA), and they were connected by a borate ester bond which acted as a linker between the fluorescence quencher and the responsive ROS (Figure 18A). Overexpressed H2O2 triggered the theranostic system of the probe such that DX and DA were released. Meanwhile, the absorption band from 590 to 685 nm displayed obvious changes, and the fluorescence intensity around 705 nm also exhibited significant enhancement. Probe 22 had excellent sensitivity, good selectivity, low toxicity, and good biosafety. Furthermore, the probe not only offered visualization of liver/kidney injury induced by diabetes but also improved the therapeutic effect of type II diabetes (Figure 18B).
3.4. Probes Targeting H2S and Cys
H2S, a vital endogenous signaling molecule with reductive properties, is thought to be associated with diabetes [24,99,100]. H2S not only adjusts the insulin sensitivity in insulin-targeted organs but also preserves intracellular redox homeostasis [101]. Cys serves as a vital scavenger of ROS under mitochondrial oxidative stress, which is very vital in the biosystem [102]. Therefore, it is of great significance to research the relations and connections between mitochondrial oxidative stress and diabetes by monitoring the levels or behaviors of Cys in mitochondria.
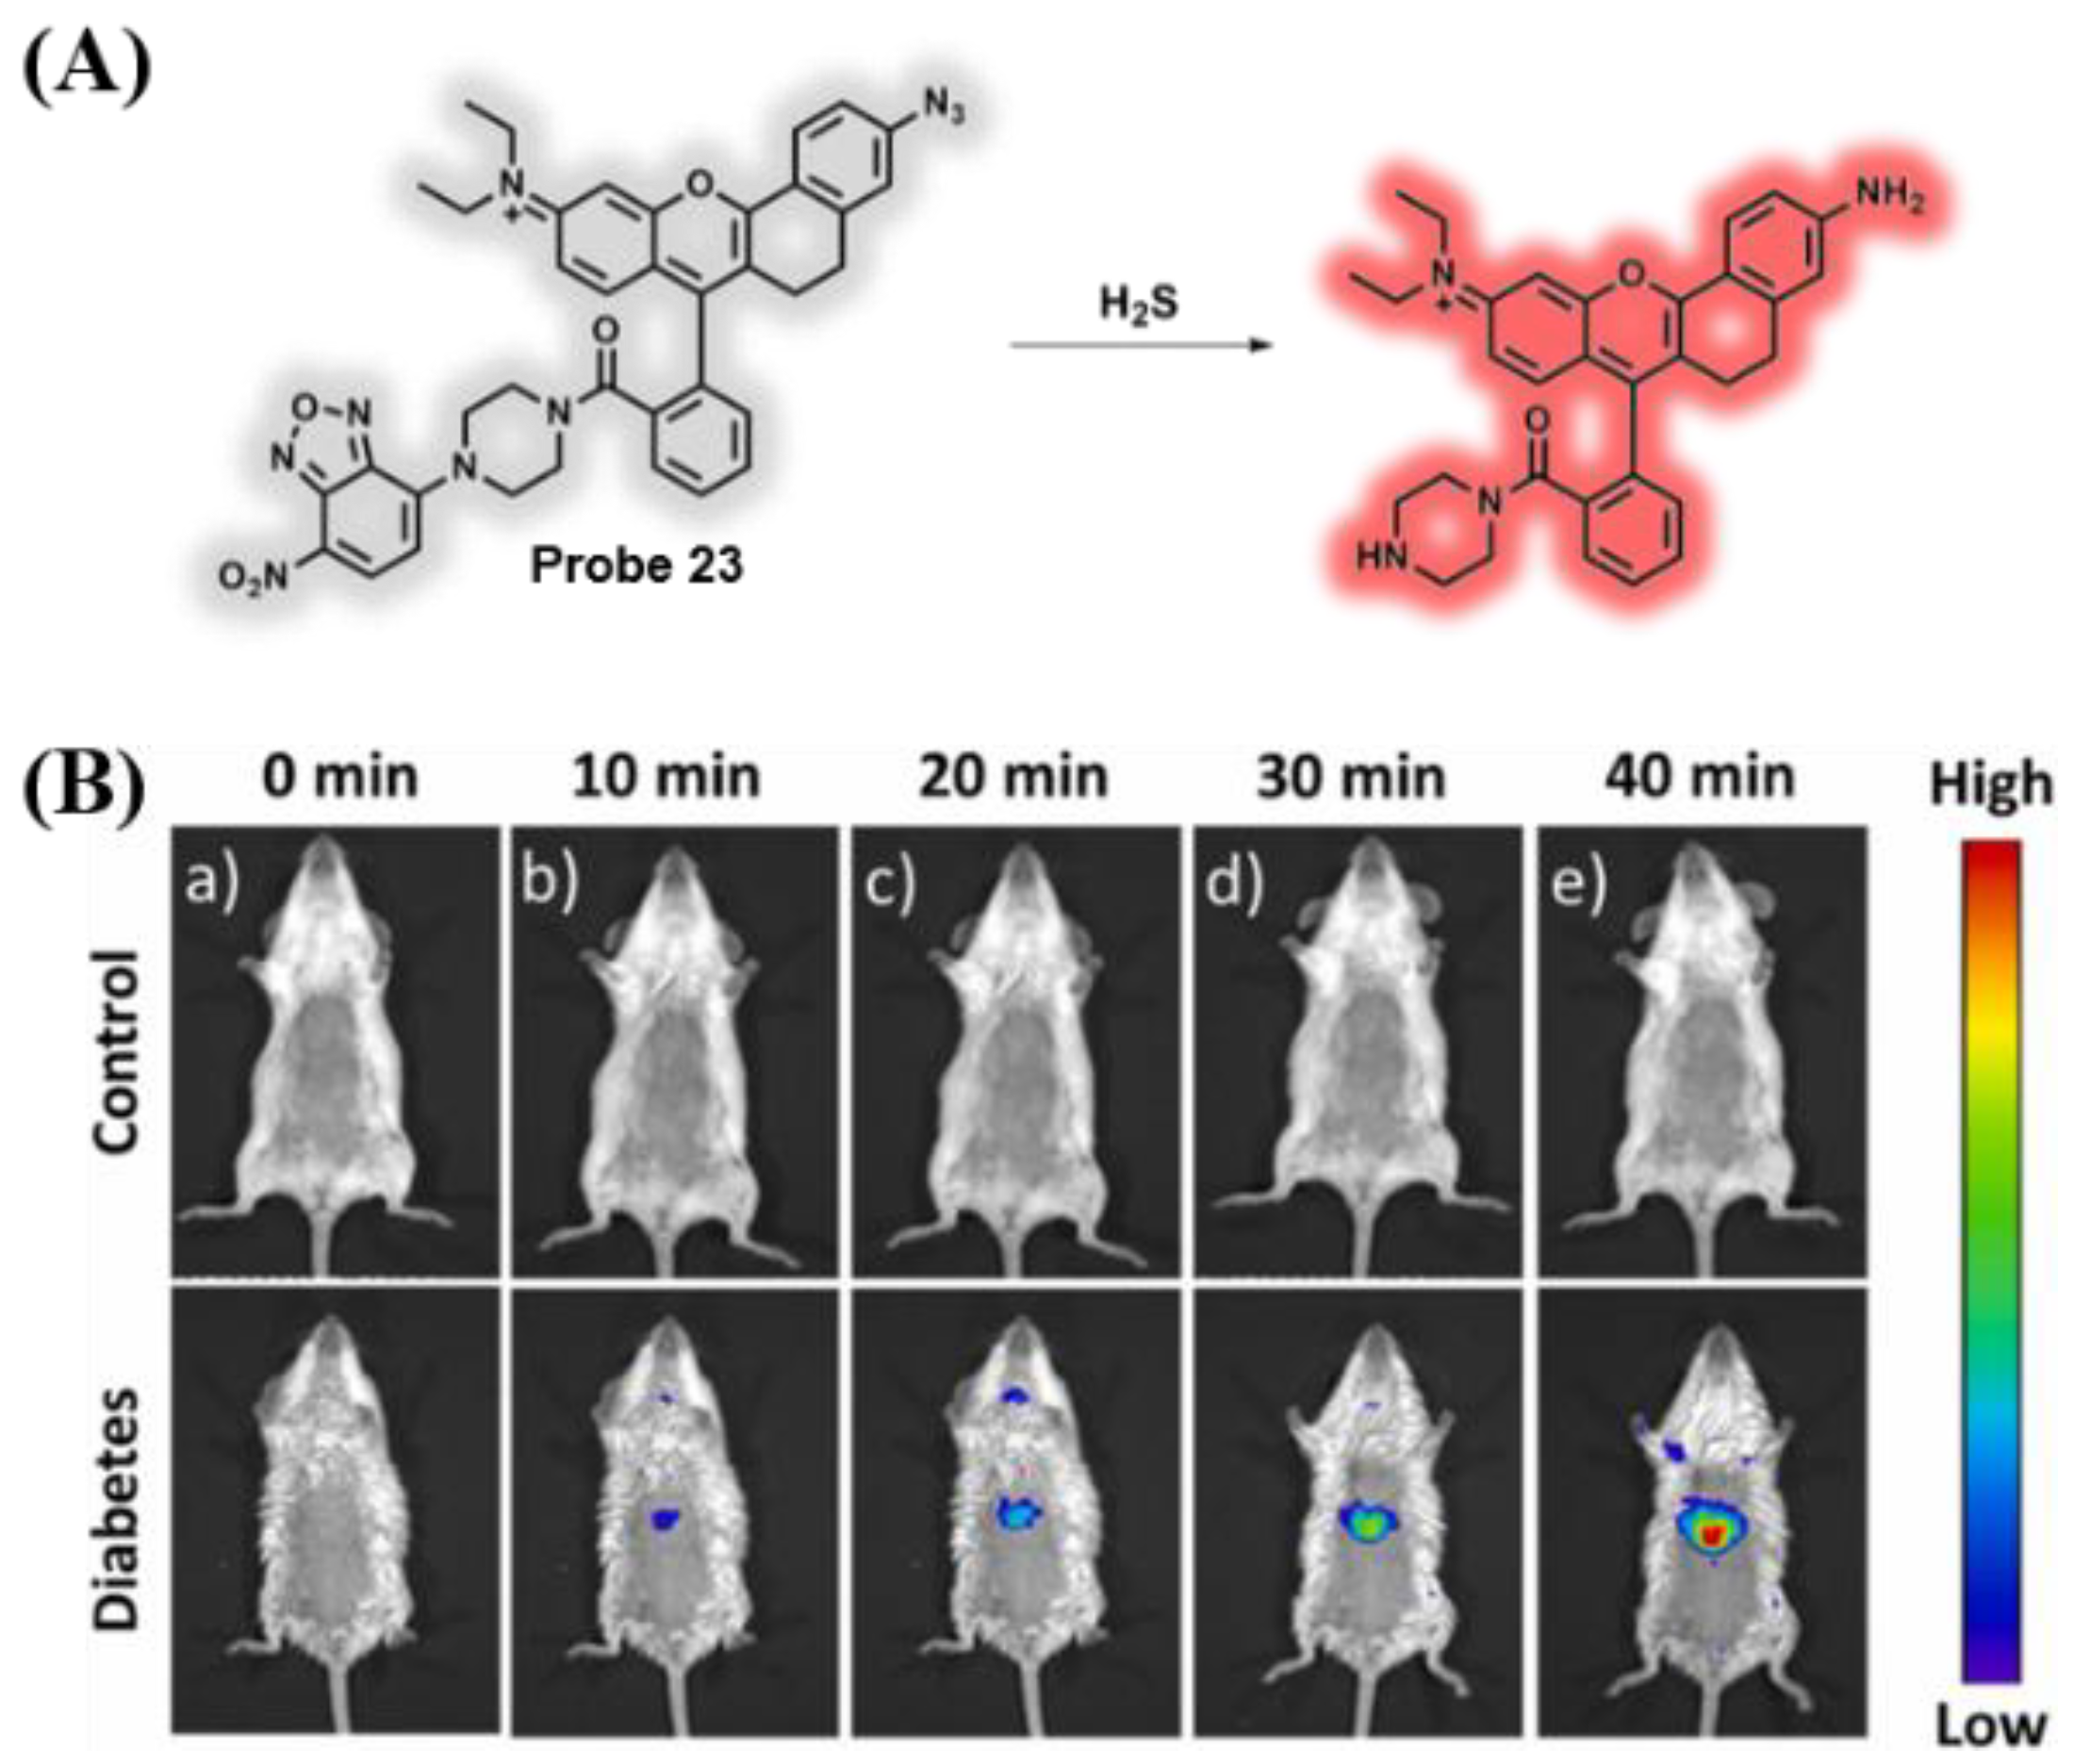
In 2022, Wei et al. obtained the dual-locked fluorescent probe 23 with NIR emission for testing the H2S behavior in organisms [103]. In probe 23, rhodamine B was used as a fluorophore with NIR emission, and aromatic azide and NBD-piperazine acted as the reactive site of H2S (Figure 19A). The fluorescence signal at 663 nm was locked and quenched by the processes of intramolecular charge transfer (ICT) and PET, and the detection limit was calculated as 33 nM. Probe 23 showed excellent selectivity and good sensitivity for visualizing the changes of H2S. Importantly, probe 23 had the ability to image the behavior of endogenous H2S in diabetic mice (Figure 19B).
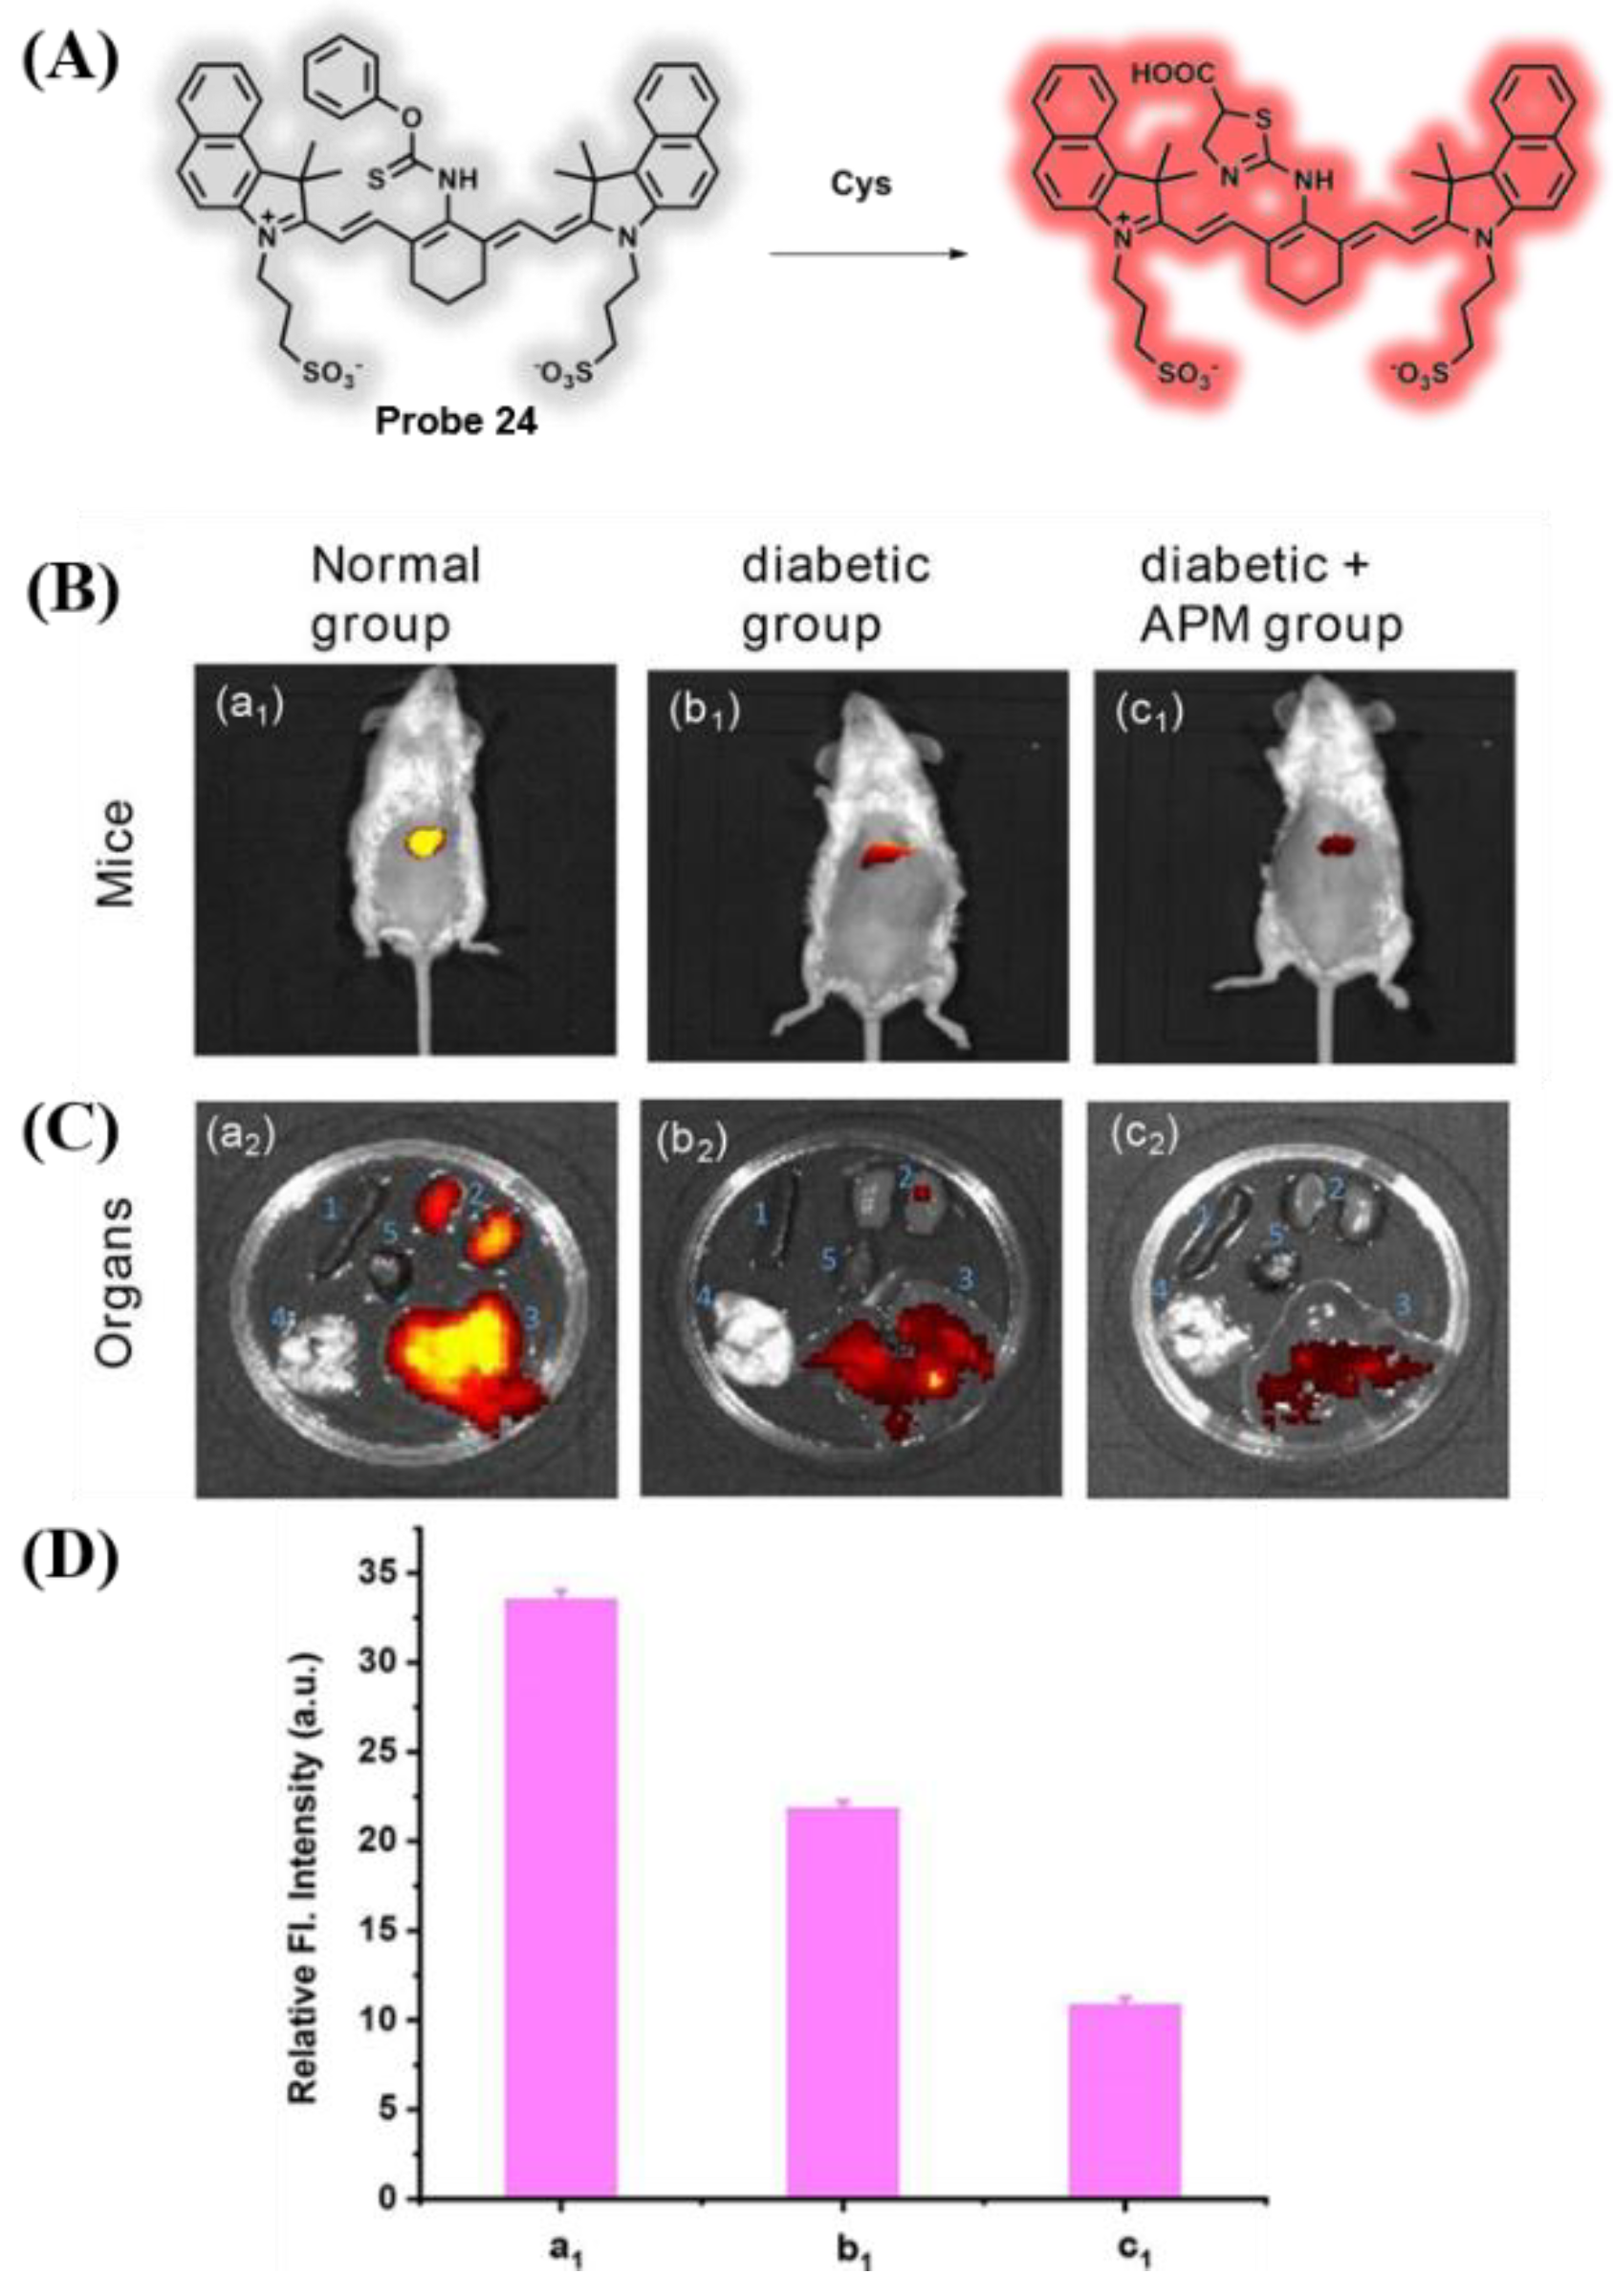
In 2022, Wei and coworkers reported a mitochondrial-targeted Cys NIR fluorescent probe 24 [104]. The cyanine in the probe acted as a NIR fluorescent dye and its positive charge could be used as a mitochondrial targeting group, and thiobenzoate was used as a Cys-specific recognition group (Figure 20A). The fluorescence signal at 628 nm gradually increased depending on Cys concentration, and the detection limit was 36.8 nM. The levels of Cys in mitochondrial were remarkably reduced in diabetic cells and mice. Figure 20B showed that airborne particulate matter (APM) promoted the development of diabetes, and the main damaged organs of diabetic mice were liver and kidney.
3.5. Probes Targeting Methylglyoxal (MGO)
Methylglyoxal (MGO), as a small molecule by-product, is produced by a variety of metabolic pathways, such as glycolysis, polyol pathway, and threonine [105,106,107]. In addition, MGO also acts as an effective saccharifying agent, which has the ability to help the formation of terminal glycation products and has a remarkable reactivity of 20,000 folds [108]. Currently, studies have shown that MGO concentrations often rise in conditions of hyperglycemia, including diabetes [109]. In particular, for type II diabetes, MGO plays a potentially critical role in visualizing disease development and therapeutic effects [110,111].
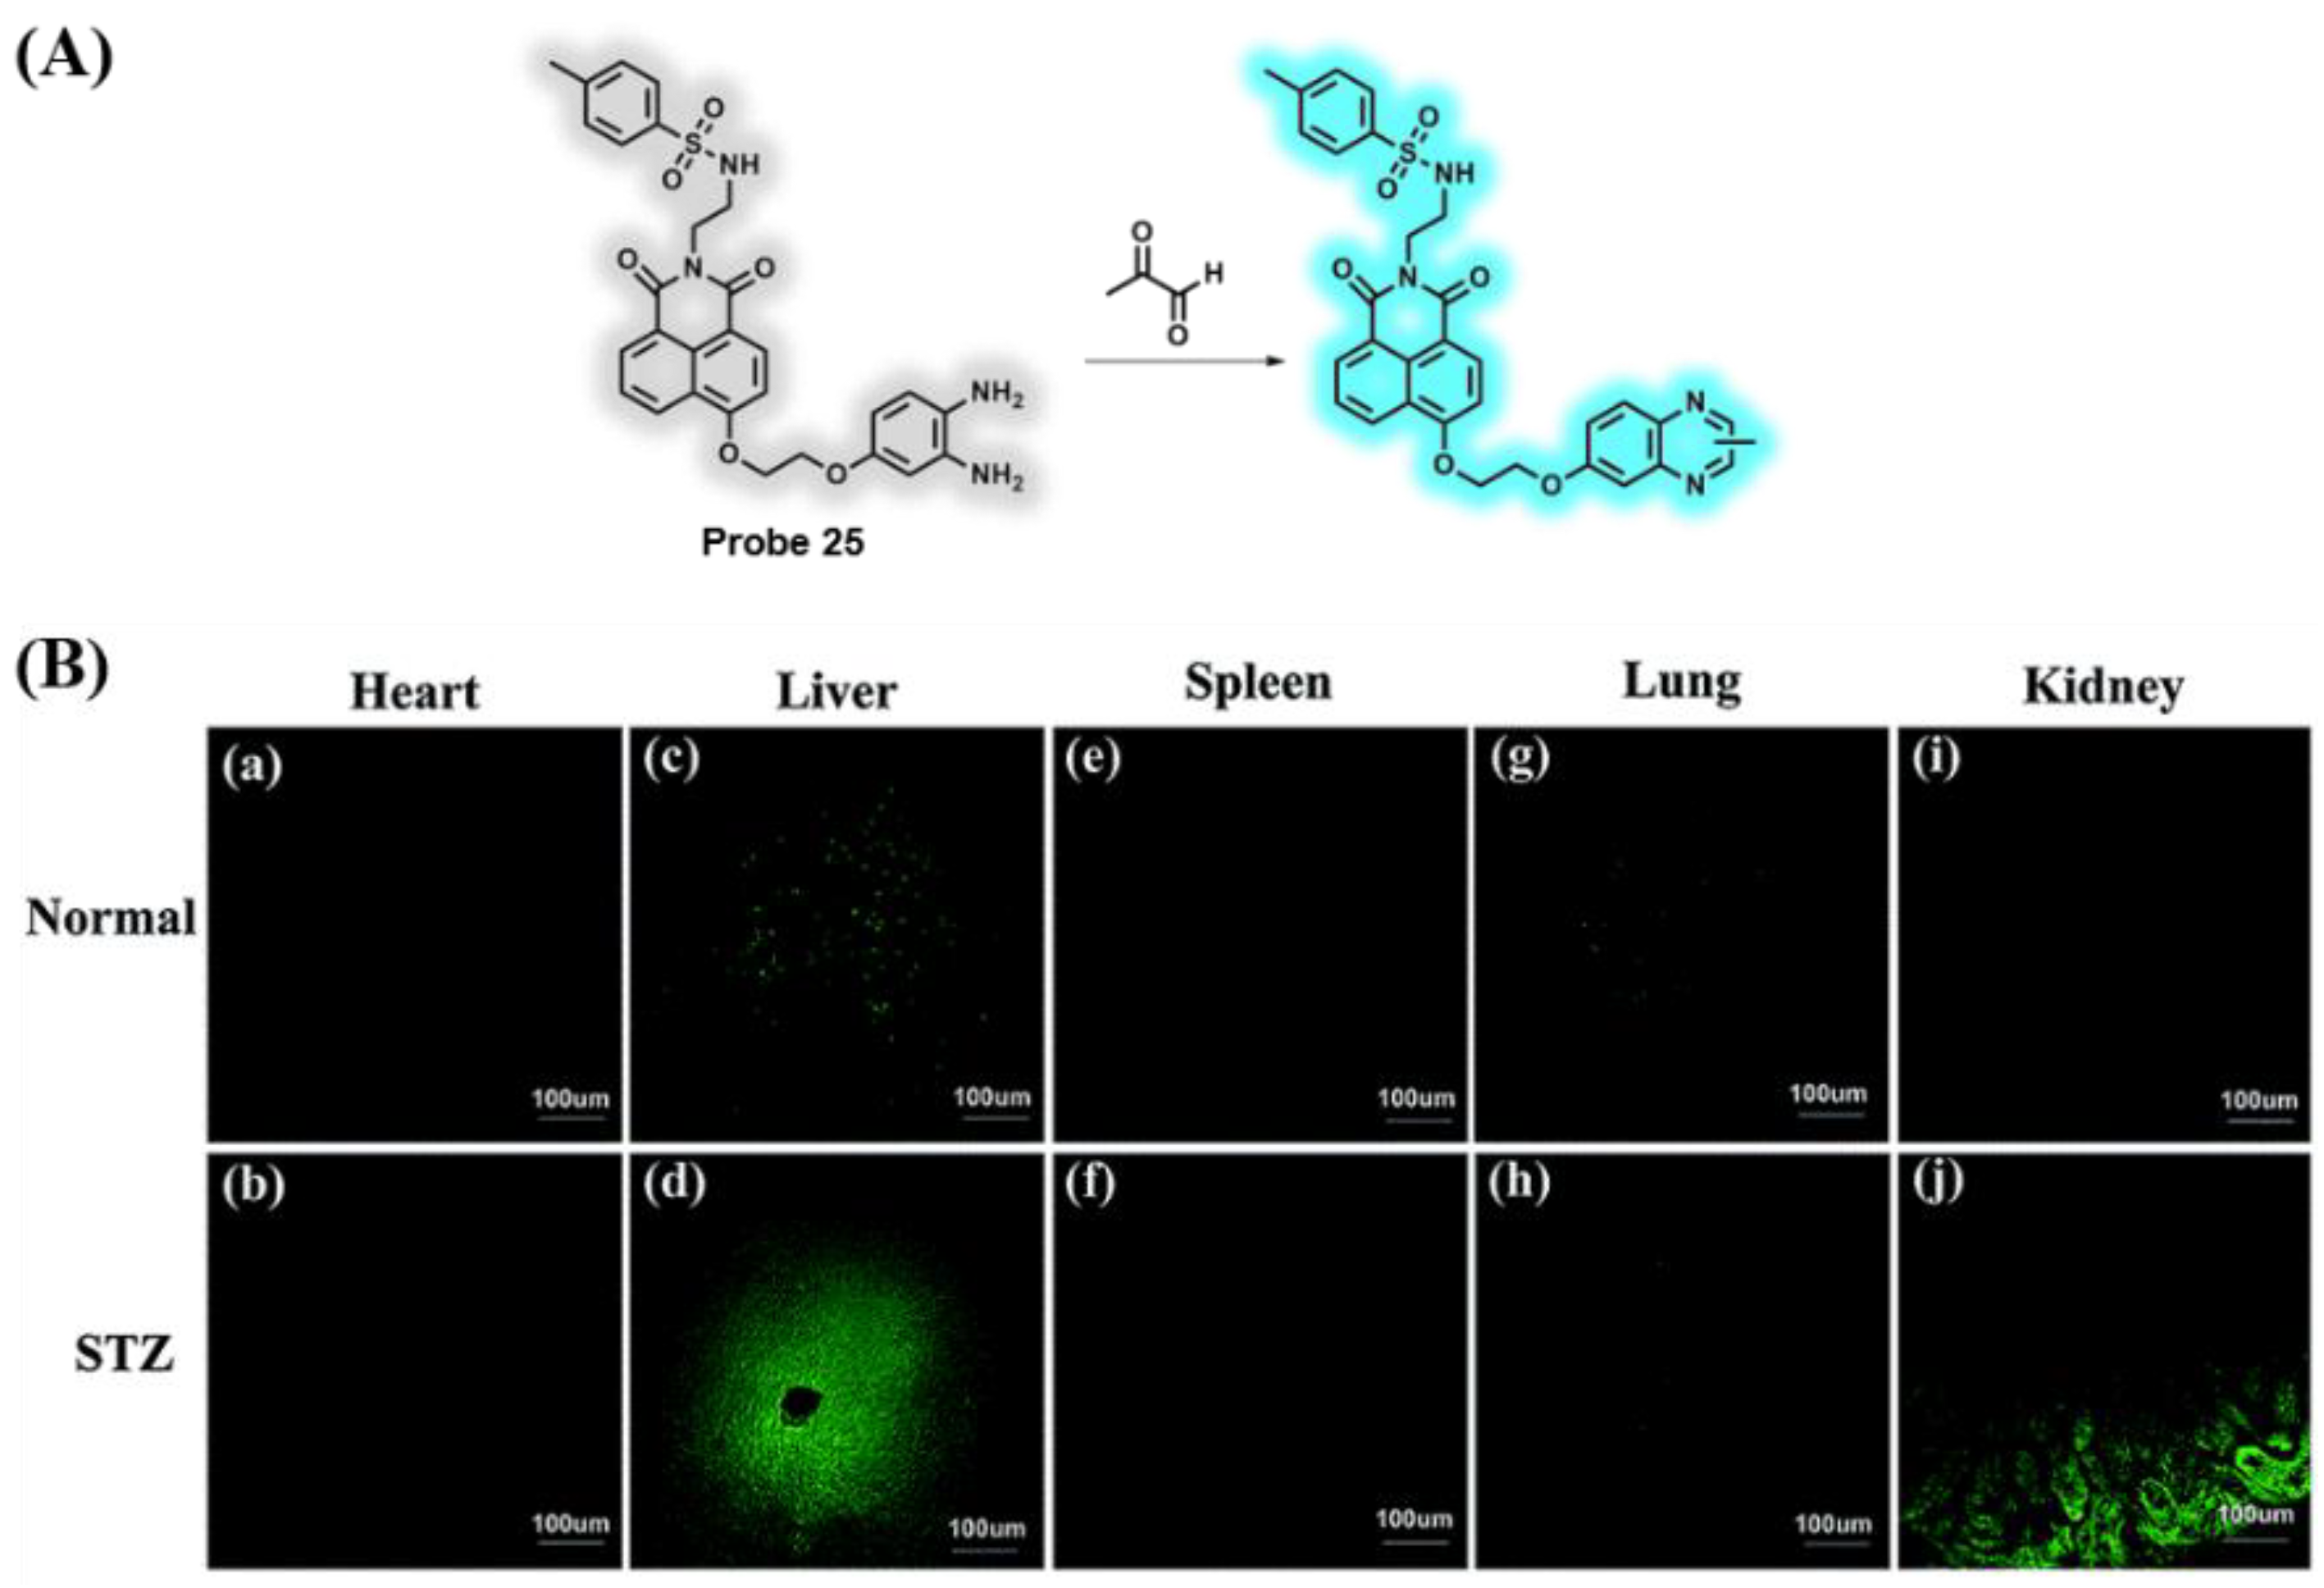
In 2018, an ER-targeted two-photon fluorescent probe 25 for detecting MGO levels was achieved by Fan and coworkers [112]. After o-phenylenediamine moiety of the probe reacted with MGO, the PET process was repressed, and an obvious fluorescence signal appeared at 460 nm (Figure 21A). The probe could be used for examining MGO with excellent selectivity, excellent sensitivity, low toxicity, and a lower detection limit (56 nM). Monitoring MGO in living cells and diabetic mice was realized by probe 25. When metformin was introduced to diabetic mice, the level of MGO in the liver and kidney displayed an obvious reduction (Figure 21B).
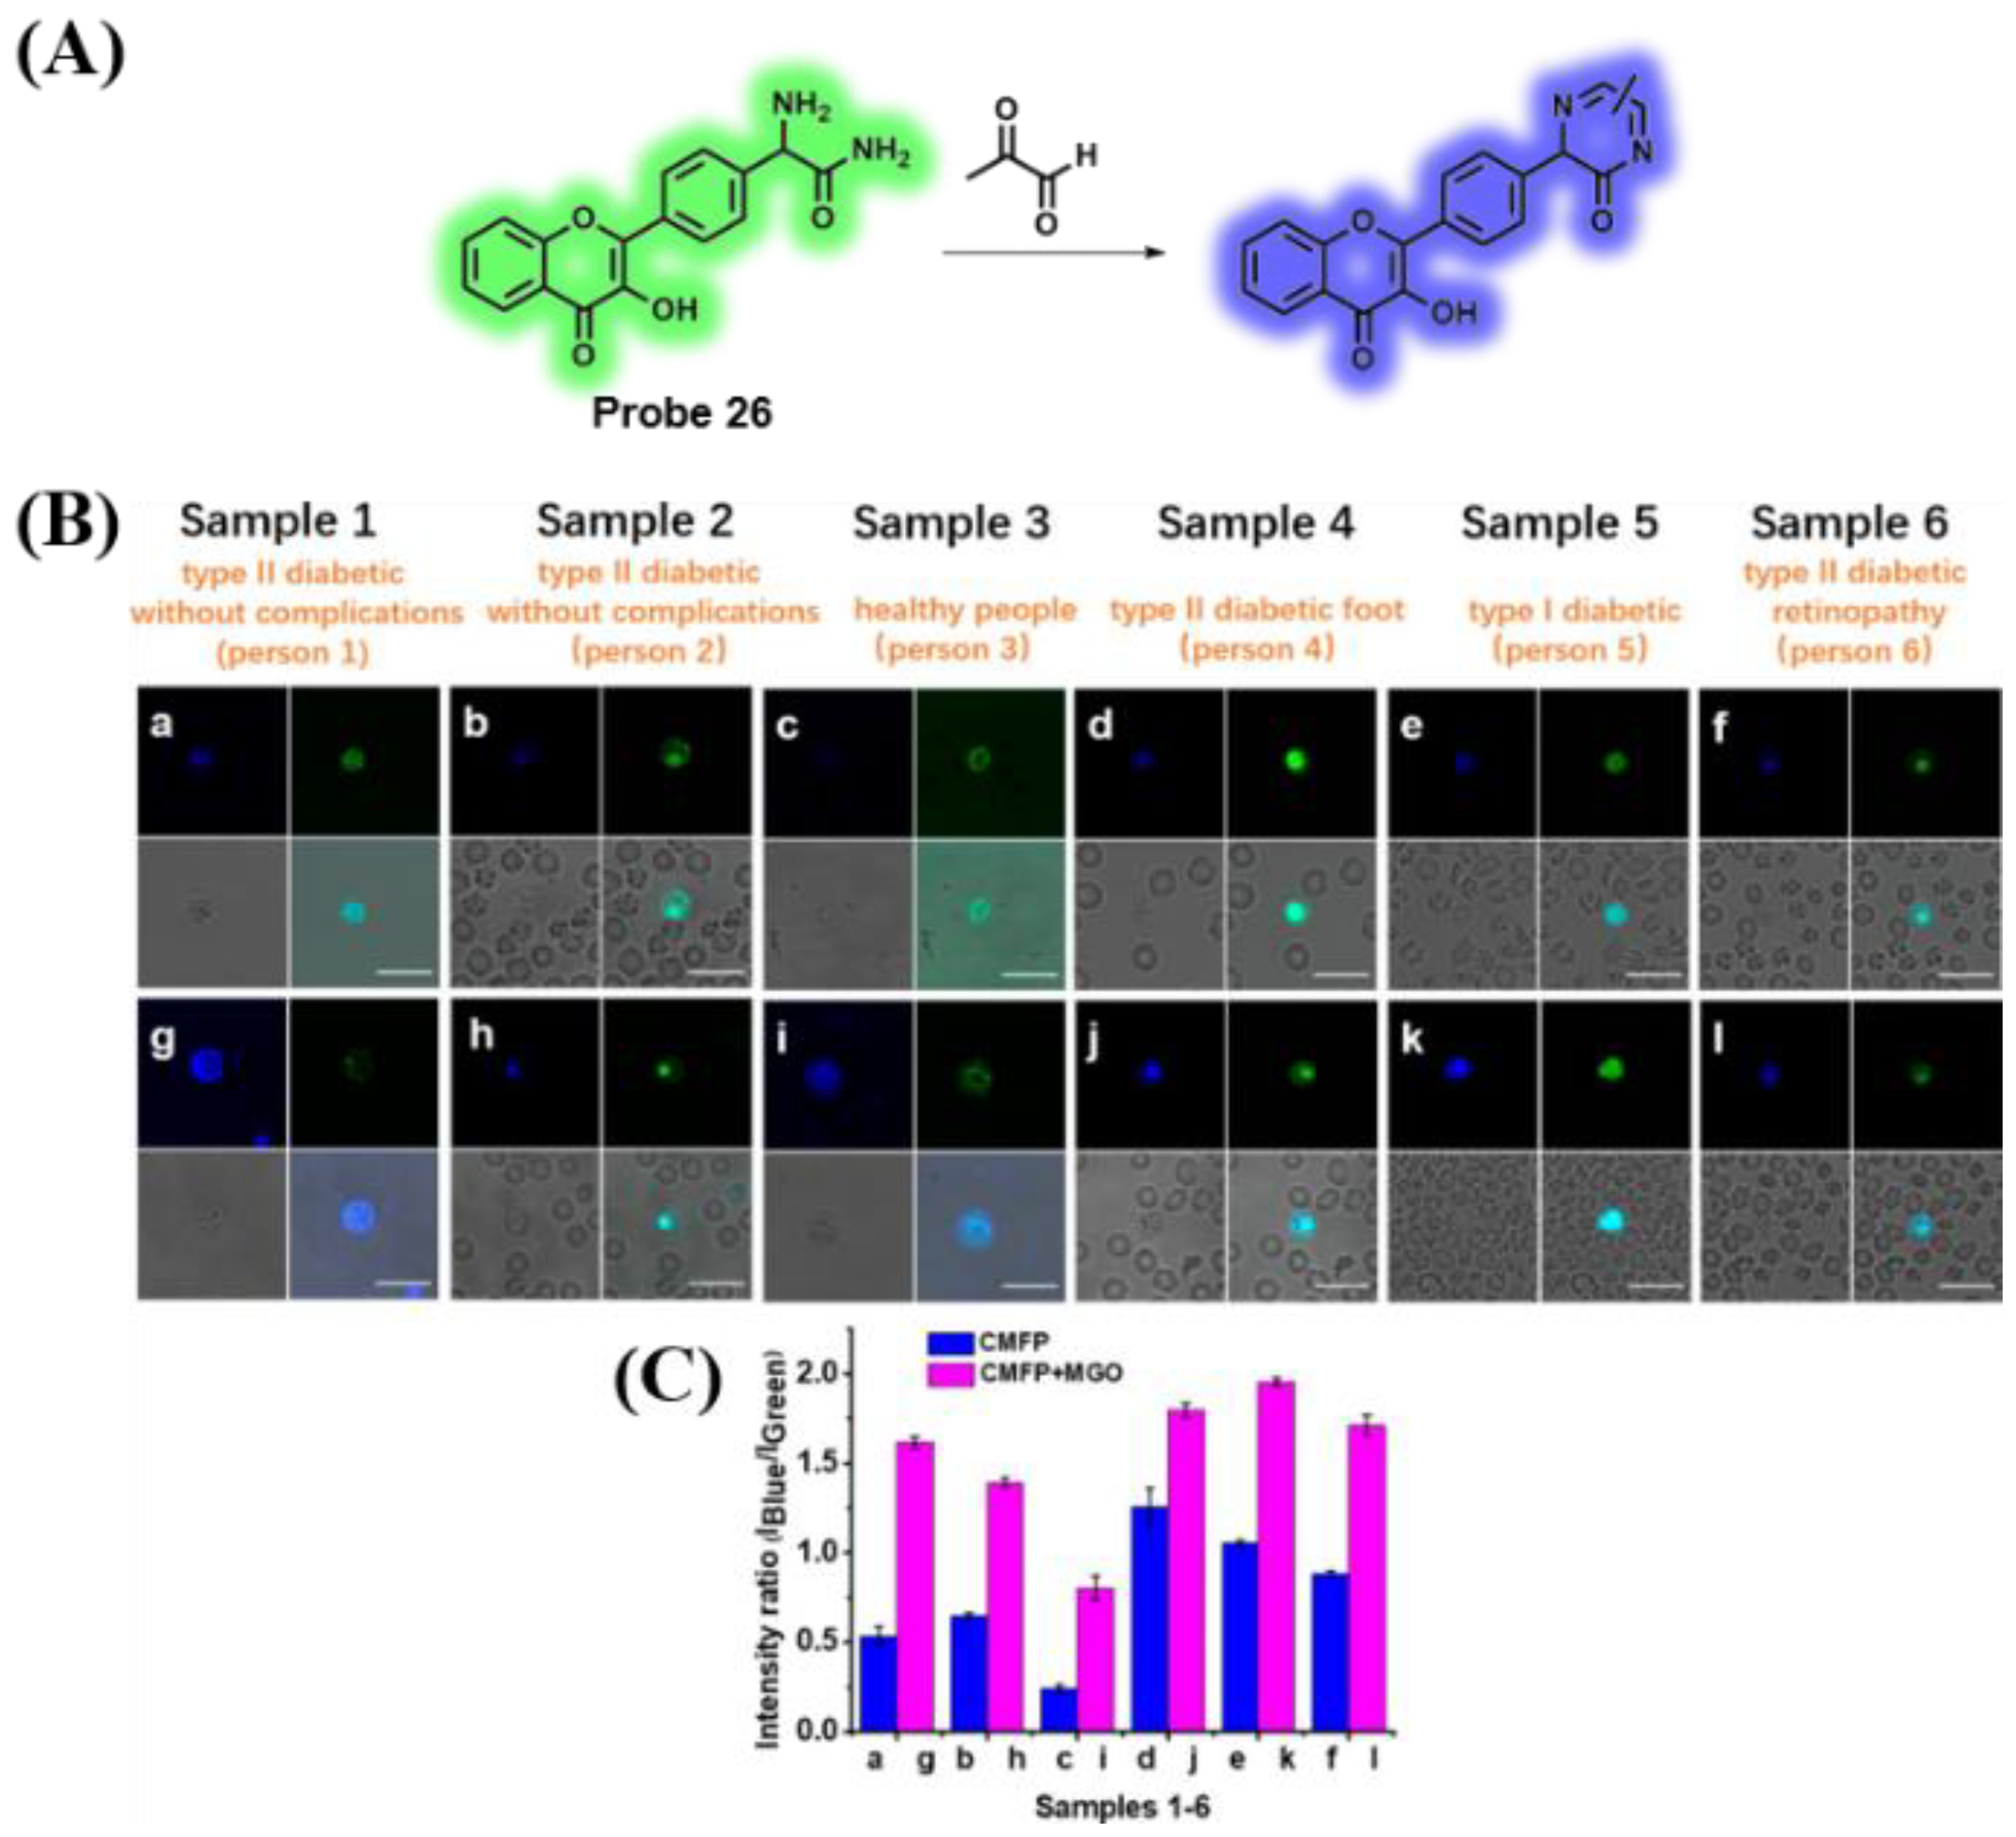
In 2019, Liu et al. created the ratiometric fluorescent probe 26 for detecting exogenous and endogenous MGO in living cells [113]. The probe used 2-aminoacetamide as the reaction site and exhibited outstanding fluorescence intensity around 525 nm during the process of detecting MGO, which was free from the interference of NO and FA (Figure 22A). Probe 26 featured some merits, with excellent sensitivity and selectivity and a low detection limit (0.24 μM). In addition, probe 26 was applied to track the behavior of intracellular MGO and to assess the changes of MGO in clinical blood samples from patients with diabetes and normal people (Figure 22B).
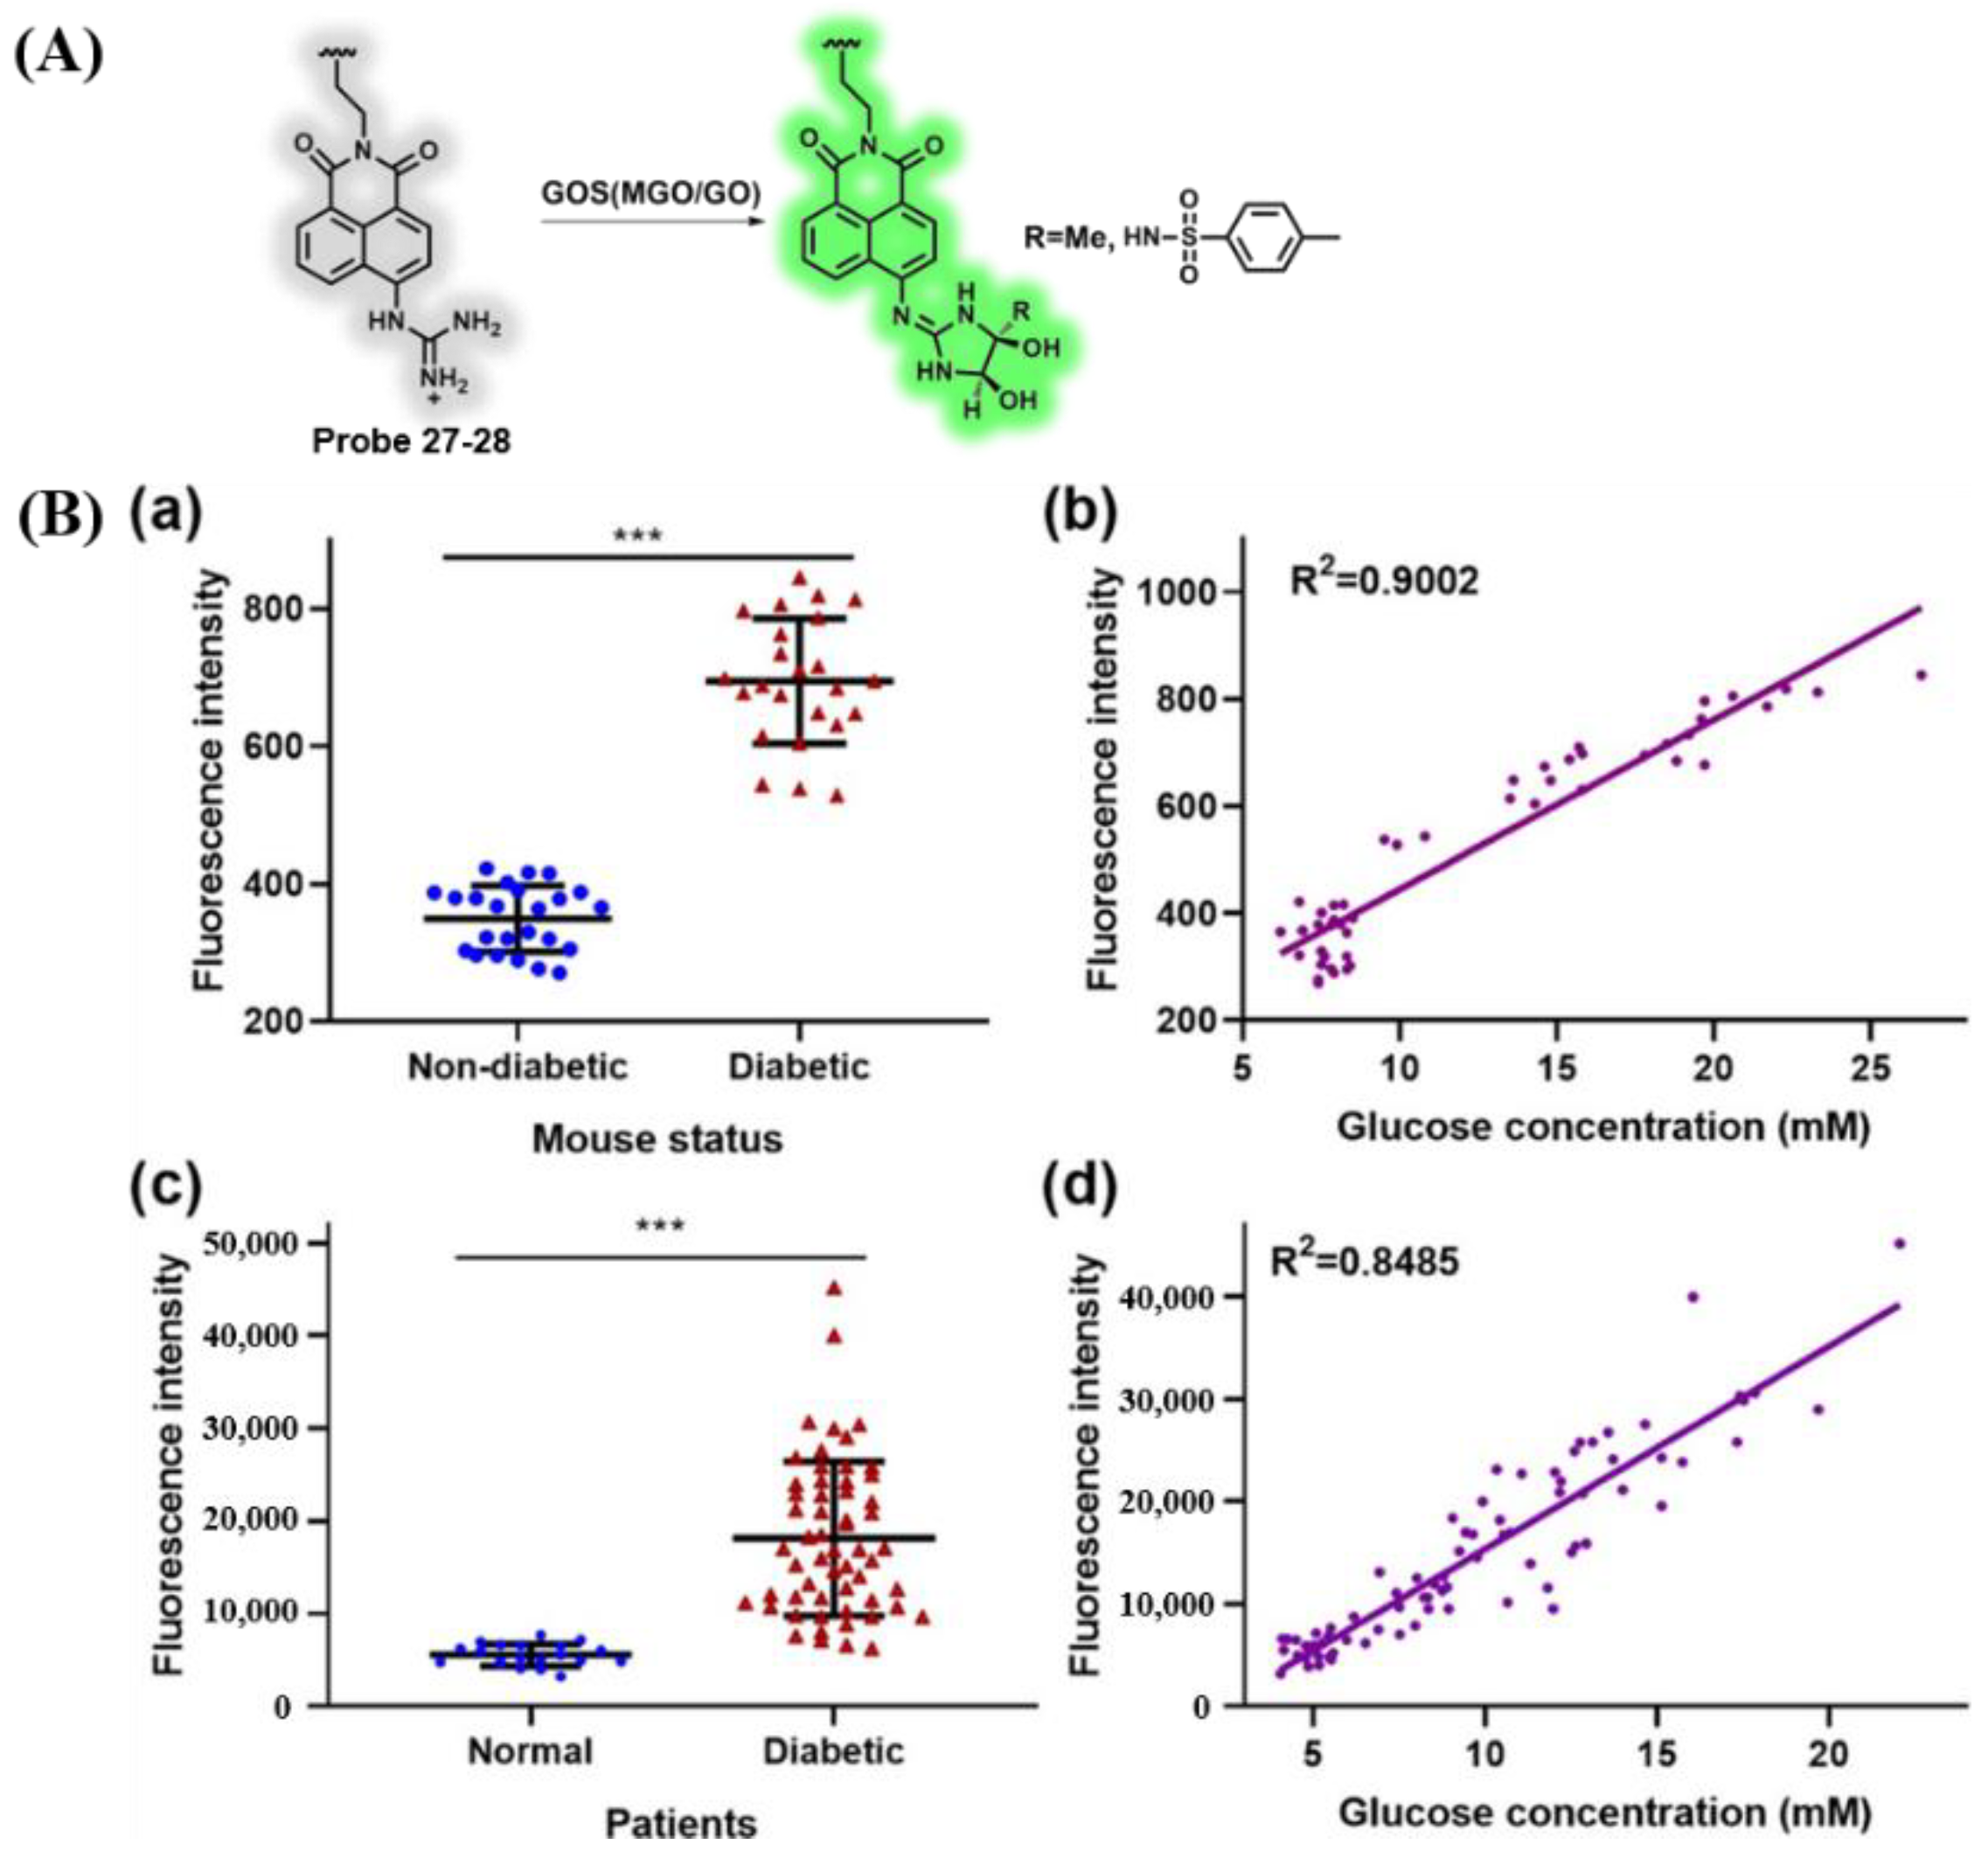
Two fluorescent probes (27 and 28) based on 4-(2-guanidino)-1,8-naphthalimide were reported by Lou and coworkers in 2020 [114]. When the probes reacted with MGO/GO (GOS), deprotonation-cyclization of the guanidium ion process occurred, and an exocyclic five-membered dihydroxyimi-dazolidines was produced (Figure 23A). Upon GOS being introduced into probe 27, a new fluorescence signal peak appeared around 564 nm. When GOS coexisted with aminoguanidine or N-acetylcysteine (quenchers of GOS), probe 27 displayed reversible fluorescence turn-on responses. Probe 27 displayed excellent features of quick, reversible, and good selectivity for testing GOS. The spectral response behavior of ER-targeting probe 28 for detecting GOS was similar to probe 27, and it had the ability to investigate the GOS changes of ER under various stress environments (Figure 23B).
3.6. Probes Targeting Enzymes
Enzymes, as one potential biomarker, have aroused wide concern in recent years owing to their intriguing and vital roles in various processes including physiology, pathology, and pharmacology [32,115,116]. Studies have shown that caspases (Cas), dipeptidyl peptidase-IV (DPP-IV), nitroreductase, and leucine aminopeptidase (LAP) are potential indicators of specific diseases [117,118]. For example, DPP-IV can be used as a target for the diagnosis and cure of diabetes, and it plays a vital role in adjusting blood glucose levels in the biosystem [28]. Hence, precisely detecting the activity of various enzymes in complex biosystems, particularly the activity of diabetes-related enzymes in plasma, will be helpful for early diagnosis of disease, drug discovery, and clinical application.
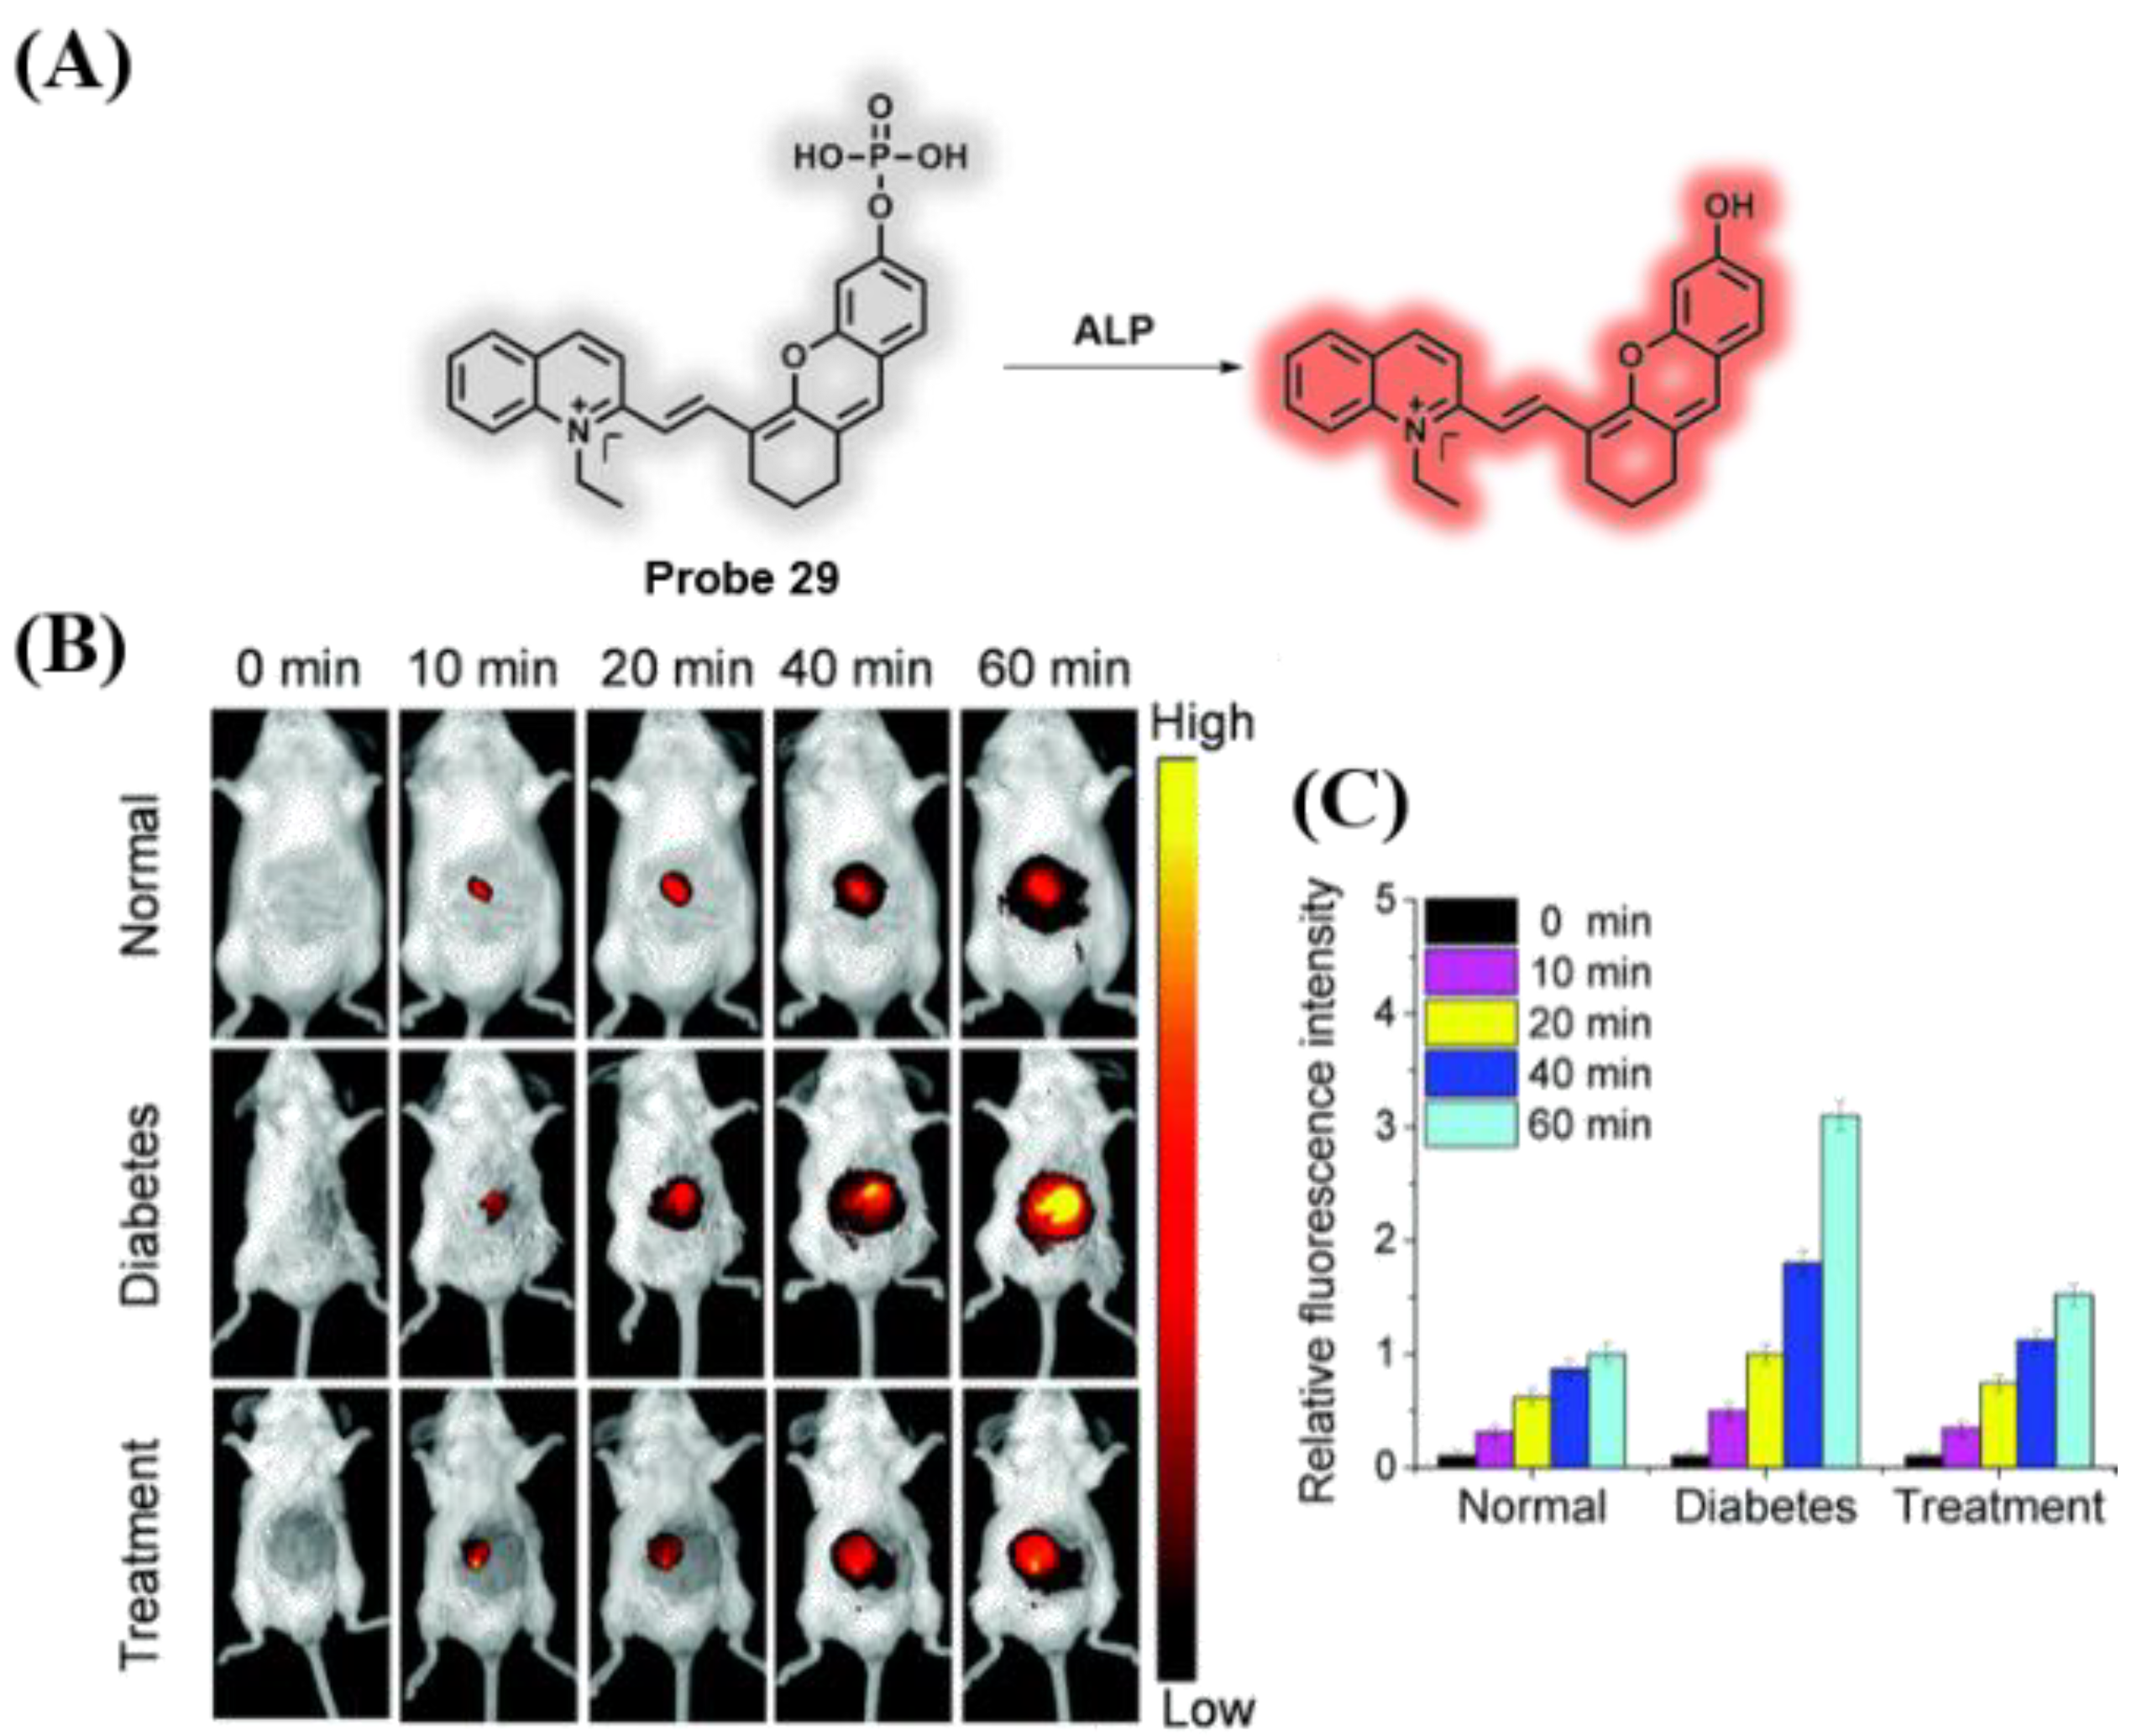
In 2020, Li et al. fabricated a fluorescent probe (29) with NIR emission and excellent water solubility for testing the activity of alkaline phosphatase (ALP) [119]. The fluorescence of the free probe 29 was interdicted by the phosphate group due to the suppressed ICT effect (Figure 24A). When ALP was added to probe 29, a remarkable fluorescent emission signal appeared at 770 nm. Probe 29 exhibited excellent sensitivity and selectivity for detecting ALP, and the detection limit was calculated as 0.017 U mL−1. Moreover, probe 29 successfully testified that the concentration of ALP in diabetic mice was higher than that in normal mice. When diabetic mice were treated with a hypoglycemic drug (metformin), a marked decrease in ALP occurred (Figure 24B).
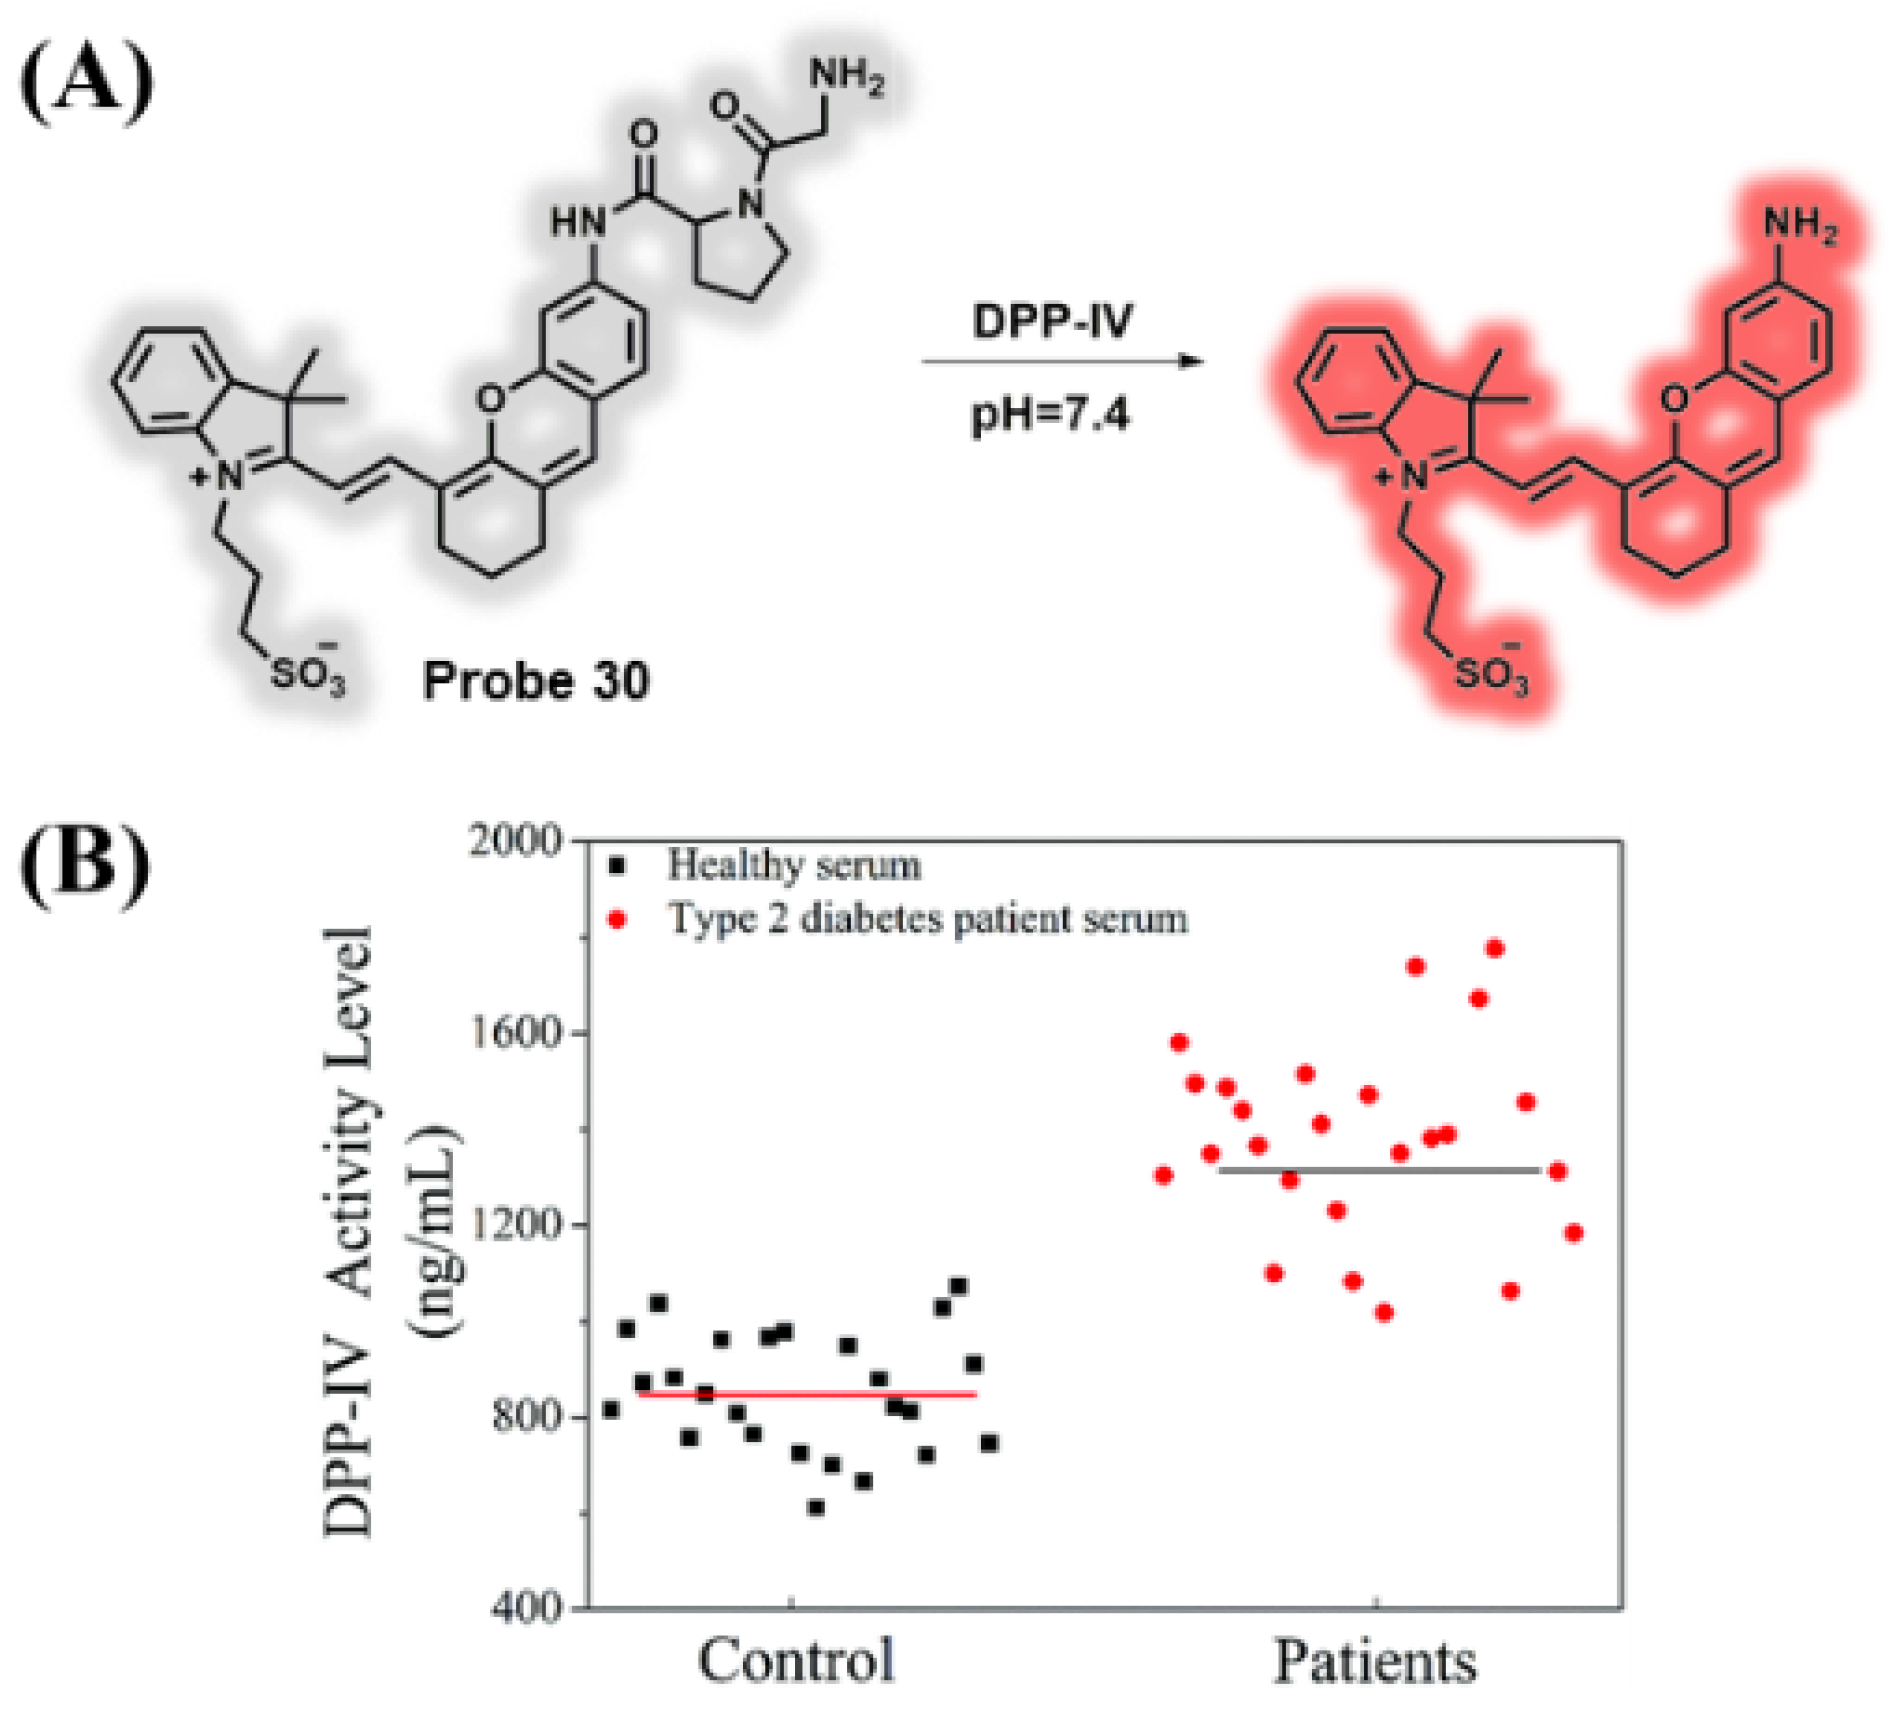
A fluorescent probe (30) with features of good water solubility and NIR emission, was developed in 2020 by Gao and coworkers [120]. Probe 30 was composed of a cyanine skeleton containing a sulfonic acid group (as a fluorophore) and glycylproline dipeptidyl aminopeptidase (GPDA, as a specific recognition site) (Figure 25A). When DPP-IV was introduced to the probe solution, probe 30 exhibited a remarkable NIR fluorescence emission. Probe 30 exhibited the excellent features of selectivity, high sensitivity, and a low detection limit of 0.19 ng mL−1. In addition, probe 30 had the ability to monitor DPP-IV changes in serum samples from normal and diabetic people and visualize DPP-IV in vivo (Figure 25B).
In 2021, Liu et al. constructed a fluorescent probe (31) with ratiometric emission and long-wavelength emission for examining DPP-IV (Figure 26A) [121]. A large Stokes shift of 135 nm was found in probe 31. Upon DPP-IV being reacted with probe 31, the fluorescence emission behavior in the mixture solution was changed from yellow (564.8 nm) to red (616.8 nm) with the detection limit of 5.8 ng/mL. Comparing the fluorescence signals of diabetic mice with those of normal mice and tumor-bearing mice, the diabetic mice displayed outstanding fluorescence signals. Organ experiments suggested that DPP-IV was relatively gathered in diabetic mice livers. Moreover, probe 31 possessed the ability to monitor the behavior of DPP-IV and diagnose diabetic mice (Figure 26B).
3.7. Probes Targeting pH Values
The skin surface of healthy people was found to be subacid (4.2–5.9); however, obvious alkaline (7.14–8.9) was found at the chronic wound stage when delayed healing occurred in certain pathological environments [122,123,124]. Chronic wounds, including diabetic foot ulcers, venous leg ulcers, and bedsores, decrease patients’ quality of life and increase their financial burden [125,126,127]. A serious type of body condition in patients with type I diabetes is diabetic ketoacidosis (DKA) [128]. It is a phenomenon of hyperglycemia and metabolic acidosis caused by the deposition of ketone bodies in the blood and urine, and the accumulation of these ketones and the resulting ketoacidosis can reduce the pH of blood and urine [129]. There are currently known methods for detecting pH values, including glass electrodes, luminescent probes, and electrochemical methods of detection of chronic wounds, which have the disadvantages of only single-spot value detecting or tracking in real time [127]. Thus, developing novel and convenient methods with high spatiotemporal resolutions to monitor pH behavior is crucial.
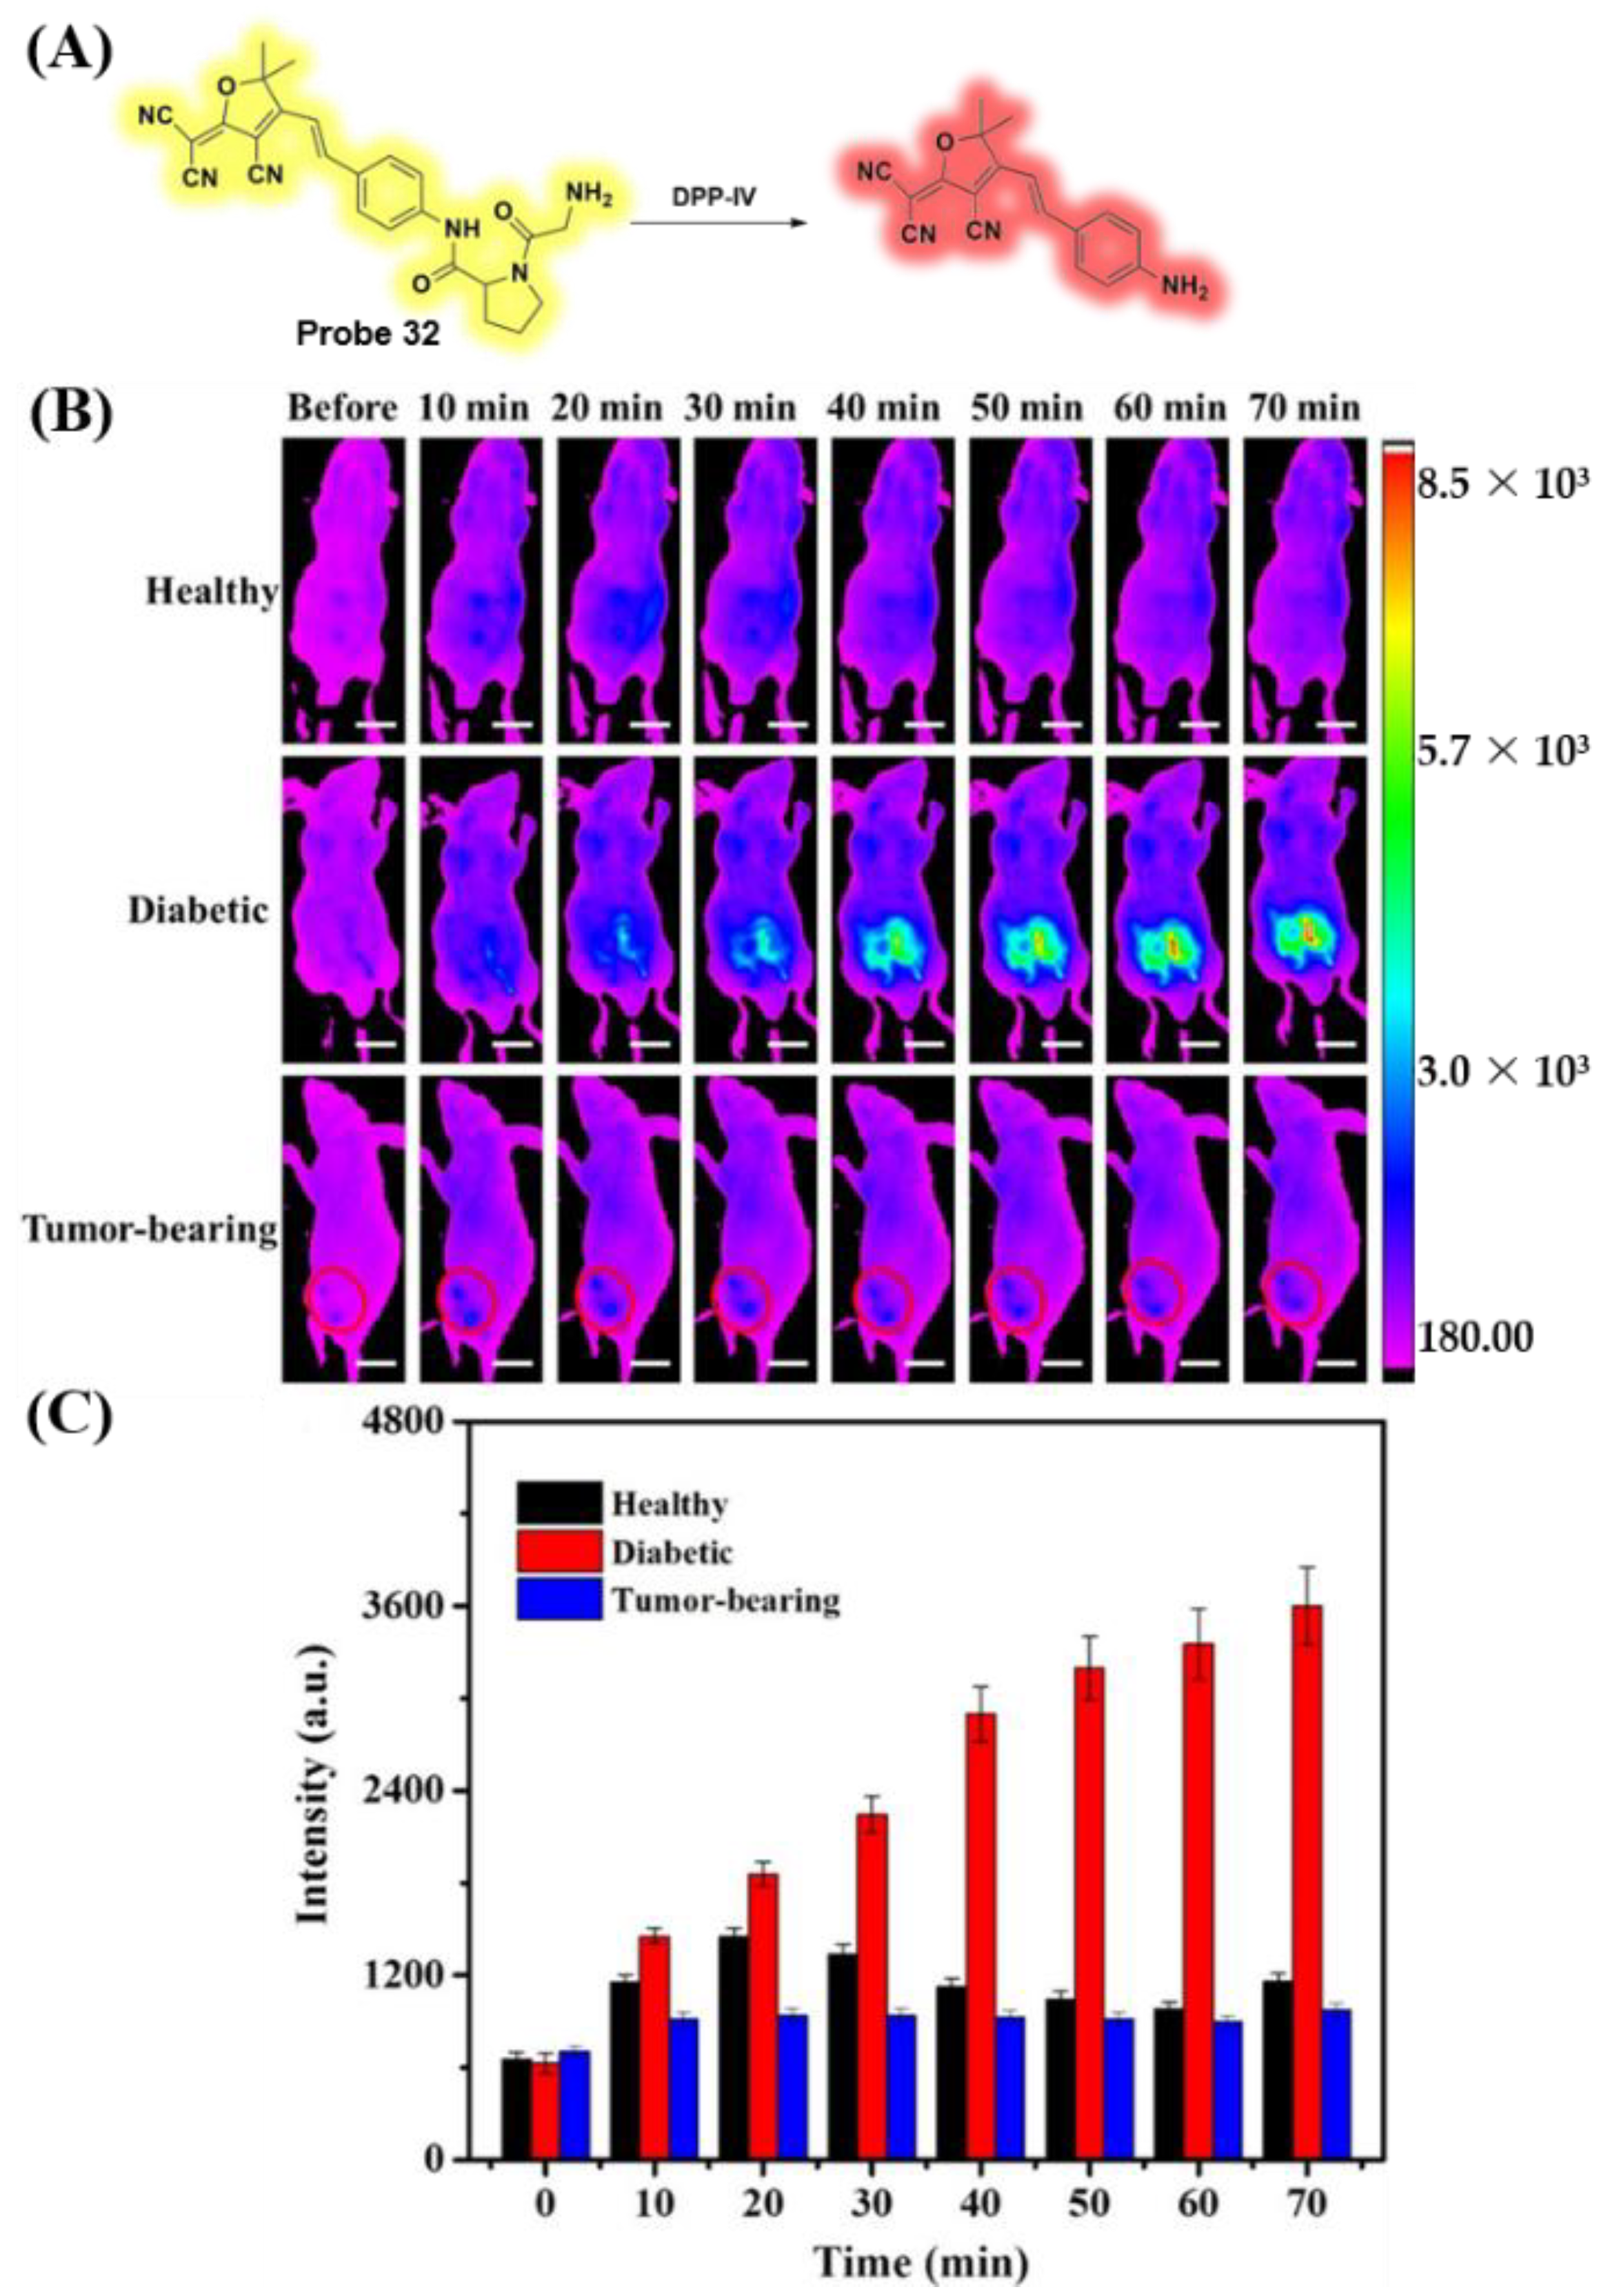
In 2019, Wu and coworkers reported a NIR fluorescent probe (32) for sensitivity examining pH (Figure 27A) [130]. The pH experiments revealed that the fluorescence emission of probe 32 decreased drastically in the region of pH from 7.0 to 10.5. Probe 32 exhibited good selectivity and excellent photostability in acidic and alkaline environments. Moreover, the pH behavior in the course of chronic wound development in diabetic mice was visualized by probe 32 for the first time (Figure 27B).
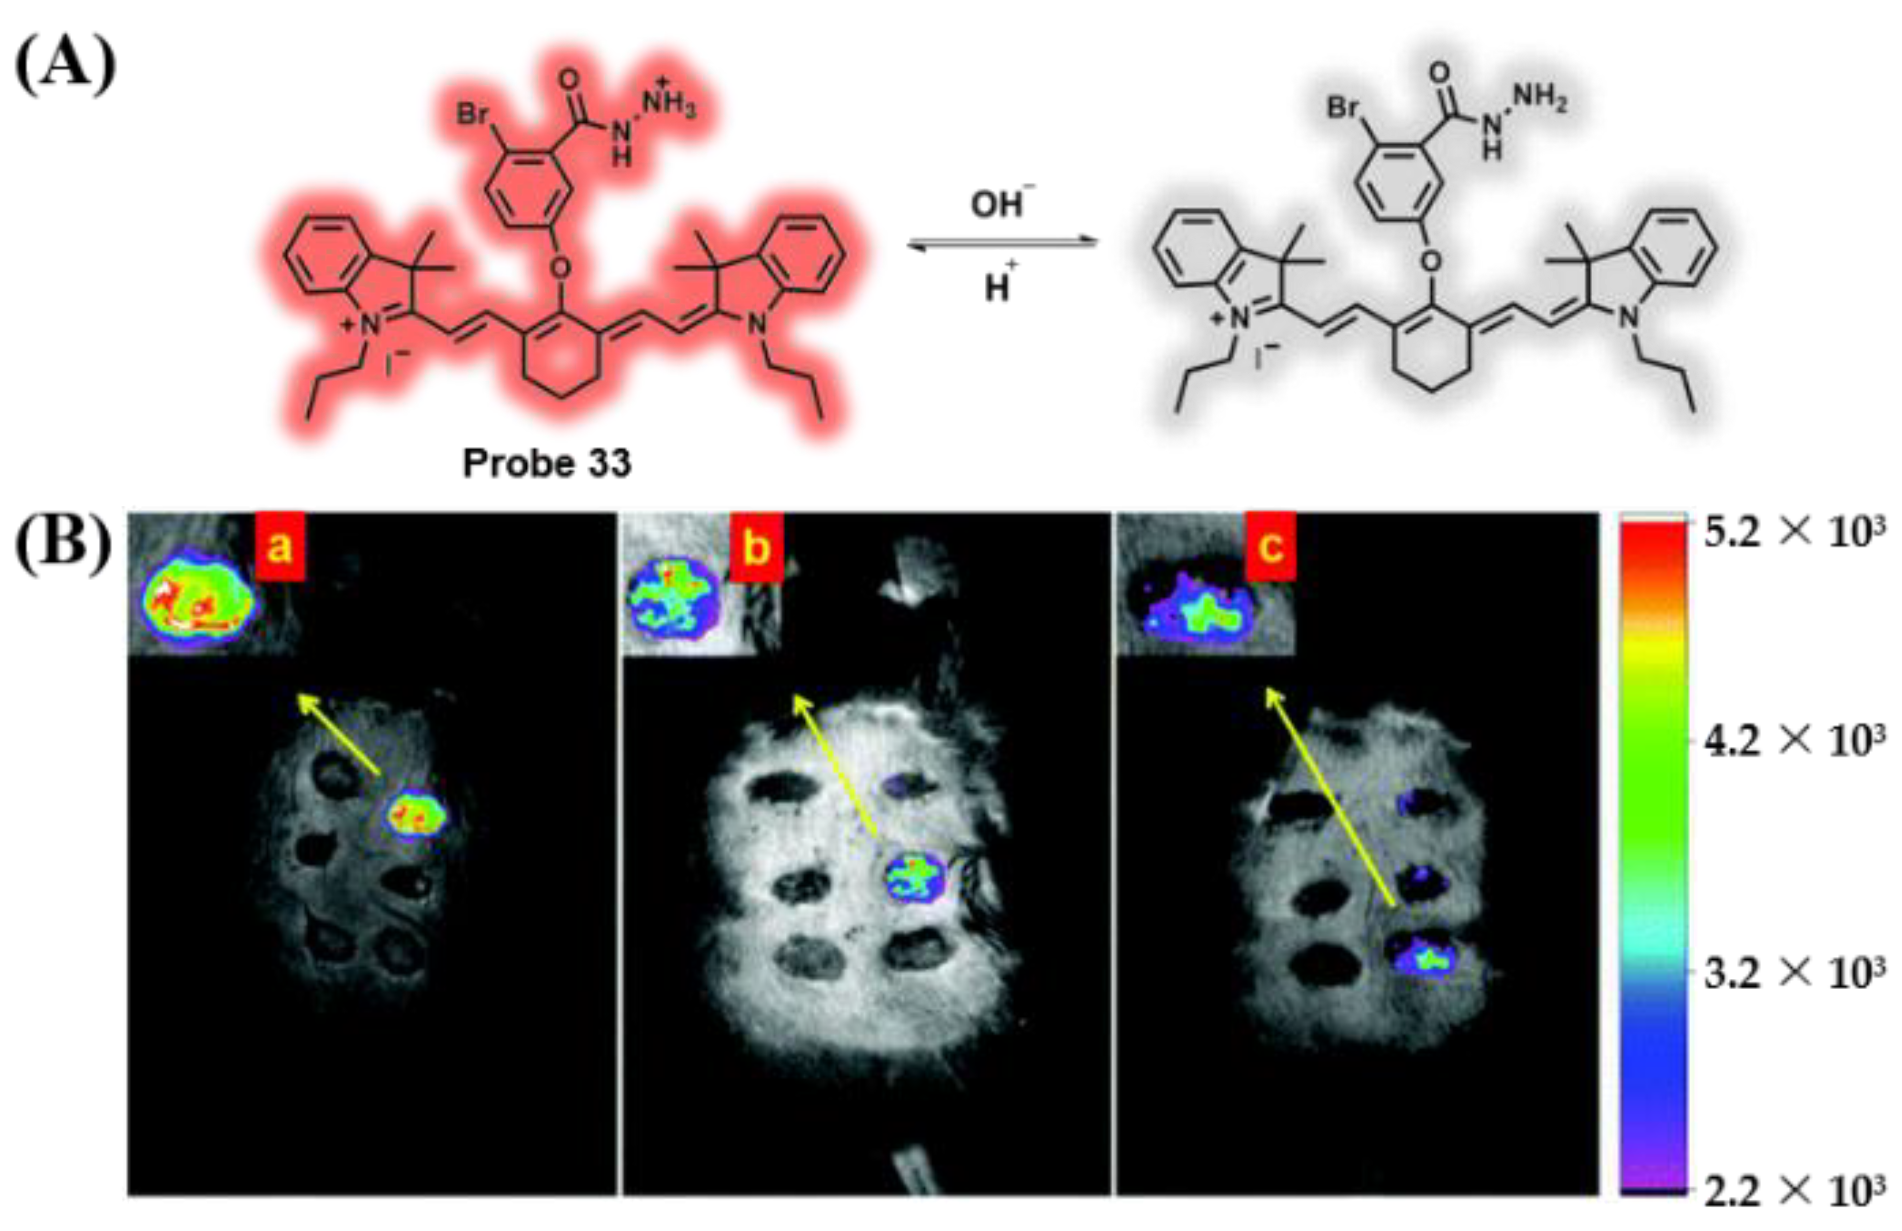
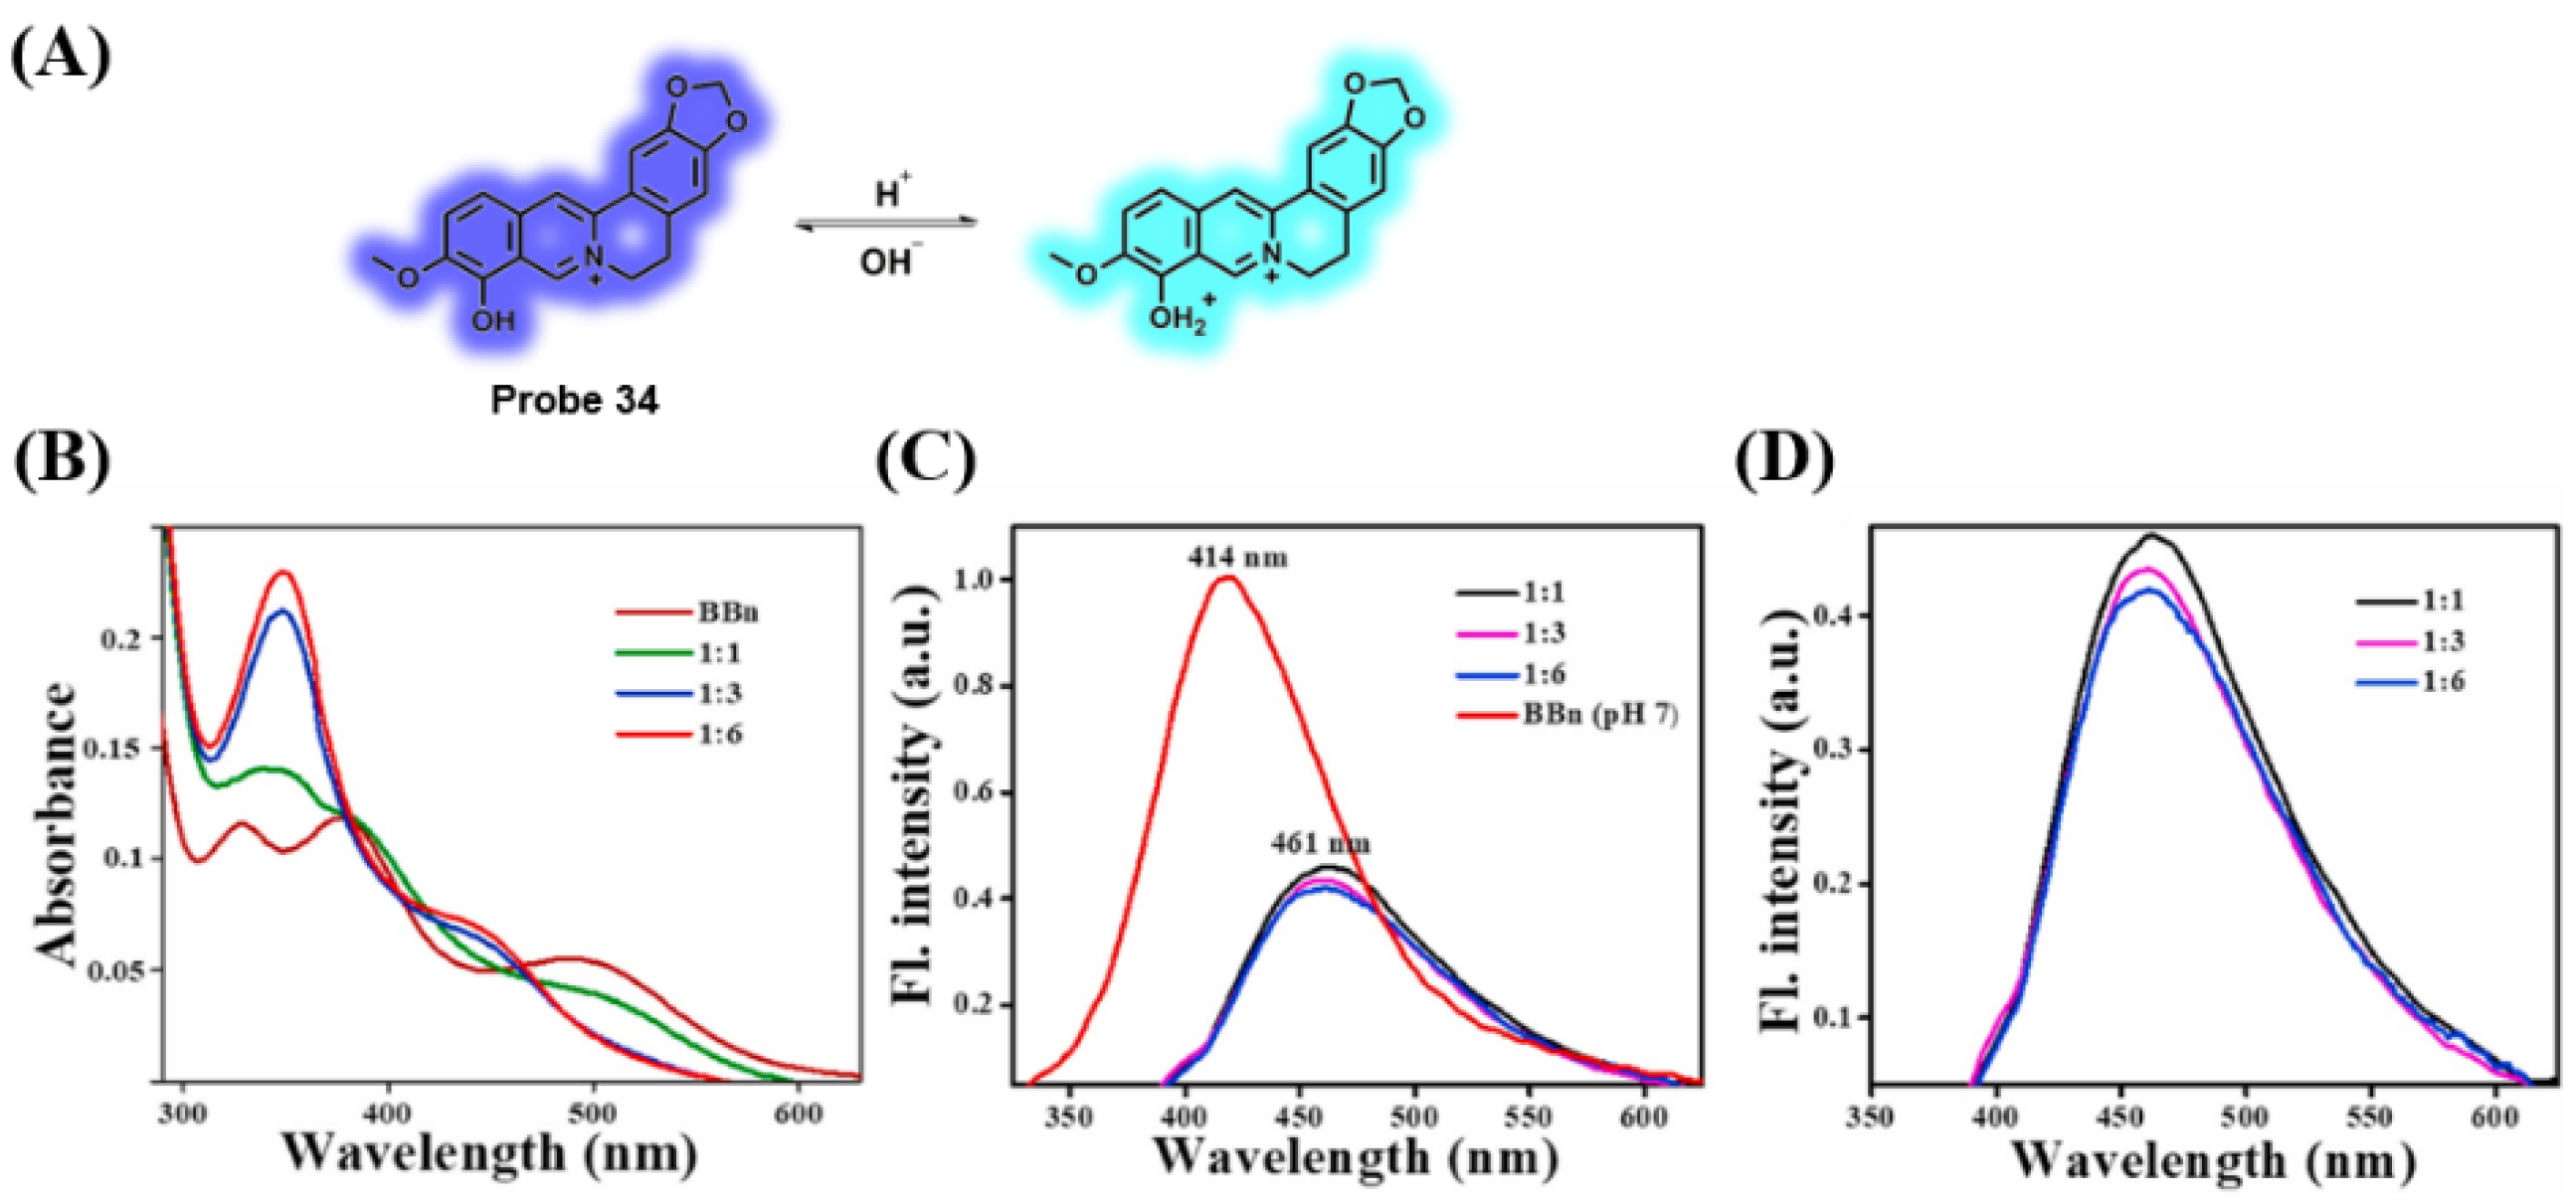
In 2021, Radhakrishnan’s group fabricated a ratiometric fluorescent probe for monitoring pH changes in patients with type I diabetes (Figure 28A) [131]. With the augment of basicity, the fluorescence emission wavelength of probe 33 gradually red-shifted from 414 to 447 nm. In addition, probe 33 had the excellent advantages of good water solubility, photostability, reversibility, and selectivity. The probe could directly detect the DKA status of patients with type I diabetes (Figure 28B).
3.8. Probes Targeting O2•− and Polarity
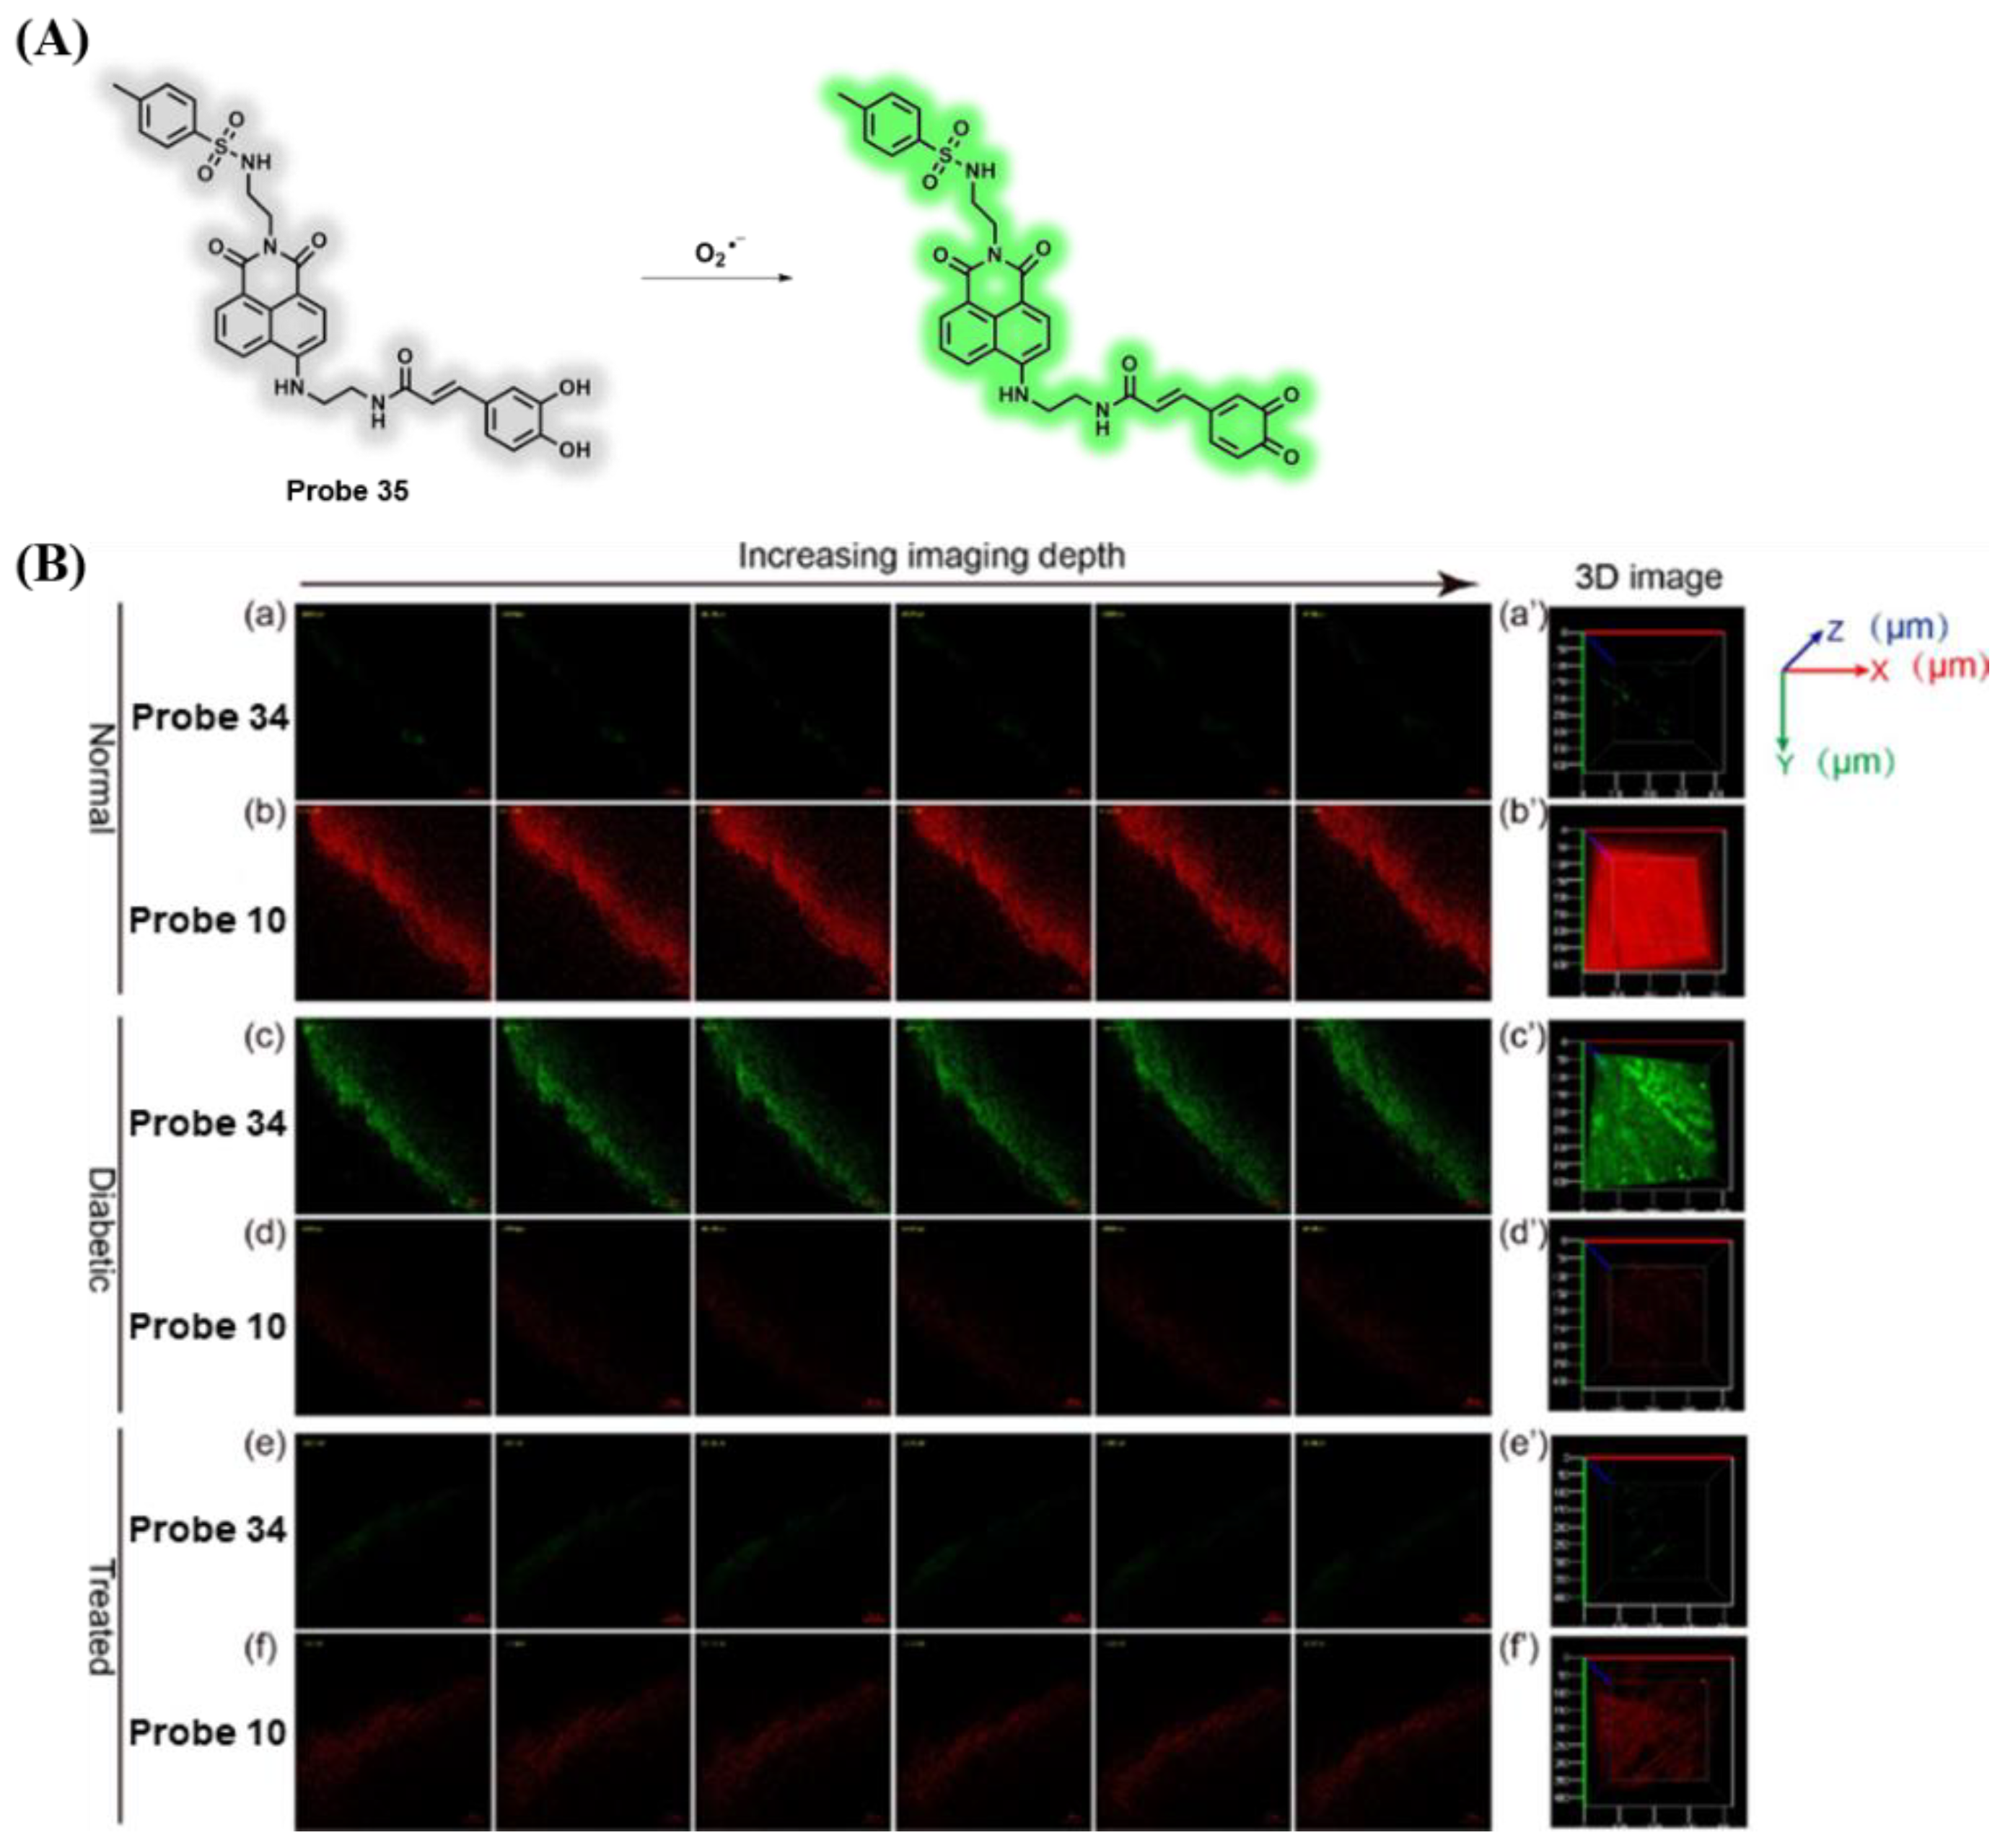
Diabetic cardiomyopathy (DCM) is a diabetic complication that threatens human health, and the occurrence of DCM is closely related to abnormal fluctuations of ROS [75,132,133,134,135]. DCM also may be able to change the polarity in myocardial cells [136]. In 2018, the ER-targeting fluorescent probe 34, including 1,8-naphthalimide as a potent fluorophore, caffeic acid group as O2•− the recognition unit, and methylsulphonamide as an ER-targeting moiety, was successfully obtained by Tang et al. (Figure 29A) [137]. Upon the introduction of O2•−, the fluorescence signal at 545 nm displayed obvious enhancement owing to caffeic acid being instantaneously oxidized to benzoquinone and releasing strong a fluorescence of 1,8-naphthalimide. Probes 34 and 10 exhibited different fluorescence spectra (405/545 nm for probe 34 and 633/800 nm for probe 10), and endogenous O2•− level and polarity differences in normal and diabetic myocardium were determined using this dual-color imaging method (Figure 29B).
4. Conclusions
Diabetes is associated with complications in various organs, especially the liver, kidneys, heart, and blood vessels. Effective and accurate diagnosis or tracking of early diabetes and its complications is of importance for early diagnosis and treatment of diabetes. To date, great progresses have been achieved in the development of organic fluorescent probes for detecting and treating diabetes. In this review, we mainly summarized the organic fluorescent probes used in the study of diabetes and its complications, and analyzed their design concept, potential detection mechanism, advantages, and disadvantages. Currently, most fluorescent probes are designed and synthesized based on abnormally expressed biomarkers during the development of diabetes or its complications such as polarity, viscosity, ROS, RSS, pH values, MGO, and enzymes. Among them, some probes can achieve subcellular localization, which provides evidence for studying the relationship between diabetes and subcellular organelles such as lysosomes, mitochondria, and endoplasmic reticulum. In addition, several probes with two-photon or NIR/NIR-II regions, especially for photoacoustic imaging applications, have been developed. They are helpful for further imaging in tissue or in vivo, which will promote the application of probes in clinical diagnostics.
Although considerable progresses have been made, there are still some challenges to overcome. Firstly, for the diagnosis and treatment of diabetes, most fluorescent probes are basically monochromatic at present, which are easily interfered with by external factors. In addition, most organic small molecules always face some disadvantages, such as short fluorescence lifetime, small Stokes shift, and susceptibility to spontaneous fluorescence background in cell imaging applications. In order to solve these problems, it is vital to fabricate novel probes with some excellent advantages of two-photon fluorophores, NIR luminescence, and even NIR-II luminescence for early diagnosis and cure of diabetes and complications efficiently and accurately. Secondly, some probes possess poor water solubility and generally require organic solvents such as DMSO and acetonitrile as auxiliary solvents. Therefore, designing and constructing novel fluorescent probes with excellent water solubility and biocompatibility are necessary and important for further biological applications. Finally, dual-recognition fluorescent probes that can detect two or more biomarkers of diabetes and complications remain rare. In biological systems, changes in one active substance may lead to changes in another related active substance. Thus, developing bifunctional or multifunctional fluorescent probes is beneficial for the simultaneous recognition of two or more indicators in the diagnosis and cure of diabetes and complications.
In summary, fluorescent probes possess excellent advantages in the diagnosis and cure of diabetes and complications, and we strongly believe that fluorescent probes for monitoring diabetes and complications will become increasingly important tools in future work.
Author Contributions
Conceptualization, T.-T.J., Y.L. and H.N.; writing—original draft preparation, T.-T.J.; writing—review and editing, T.-T.J.; supervision, H.N. and Y.L.; funding acquisition, T.-T.J. All authors have read and agreed to the published version of the manuscript.
Funding
This research was funded by the Natural Science Foundation of Henan (grant number: 222300420244).
Institutional Review Board Statement
Not applicable.
Informed Consent Statement
Not applicable.
Data Availability Statement
Not applicable.
Conflicts of Interest
The authors declare no conflict of interest.
References
- Vigliotta, G.; Miele, C.; Santopietro, S.; Portella, G.; Perfetti, A.; Maitan, M.A.; Cassese, A.; Oriente, F.; Trencia, A.; Fiory, F.; et al. Overexpression of the ped/pea-15 gene causes diabetes by impairing glucose-stimulated insulin secretion in addition to insulin action. Mol. Cell. Biol. 2004, 24, 5005–5015. [Google Scholar] [CrossRef] [PubMed] [Green Version]
- Chaudhury, A.; Duvoor, C.; Reddy Dendi, V.S.; Kraleti, S.; Chada, A.; Ravilla, R.; Marco, A.; Shekhawat, N.S.; Montales, M.T.; Kuriakose, K.; et al. Clinical review of antidiabetic drugs: Implications for Type 2 diabetes mellitus management. Front. Endocrinol. 2017, 8, 6. [Google Scholar] [CrossRef] [PubMed] [Green Version]
- Pugazhenthi, S.; Qin, L.; Reddy, P.H. Common neurodegenerative pathways in obesity, diabetes, and Alzheimer’s disease. BBA Mol. Basis Dis. 2017, 1863, 1037–1045. [Google Scholar] [CrossRef] [PubMed]
- El-Serag, H.B.; Tran, T.; Everhart, J.E. Diabetes increases the risk of chronic liver disease and hepatocellular carcinoma. Gastroenterology 2004, 126, 460–468. [Google Scholar] [CrossRef]
- Earle, K.; Walker, J.; Hill, C.; Viberti, G. Familial clustering of cardiovascular disease in patients with insulin-dependent diabetes and nephropathy. N. Engl. J. Med. 1992, 326, 673–677. [Google Scholar] [CrossRef]
- Patterson, C.C.; Karuranga, S.; Salpea, P.; Saeedi, P.; Dahlquist, G.; Soltesz, G.; Ogle, G.D. Worldwide estimates of incidence, prevalence and mortality of type 1 diabetes in children and adolescents: Results from the International Diabetes Federation Diabetes Atlas, 9th edition. Diabetes Res. Clin. Pract. 2019, 157, 107842. [Google Scholar] [CrossRef] [Green Version]
- Brufani, C.; Crino, A.; Fintini, D.; Patera, P.I.; Cappa, M.; Manco, M. Systematic review of metformin use in obese nondiabetic children and adolescents. Horm. Res. Paediatr. 2013, 80, 78–85. [Google Scholar] [CrossRef]
- Ericson, U.; Hindy, G.; Drake, I.; Schulz, C.A.; Brunkwall, L.; Hellstrand, S.; Almgren, P.; Orho-Melander, M. Dietary and genetic risk scores and incidence of type 2 diabetes. Genes Nutr. 2018, 13, 13. [Google Scholar] [CrossRef] [Green Version]
- Atkinson, M.A.; Eisenbarth, G.S.; Michels, A.W. Type 1 diabetes. Lancet 2014, 383, 69–82. [Google Scholar] [CrossRef] [Green Version]
- Jiang, L.; Wang, S.; Zhao, J.; Huang, W.; Li, J.; Xiao, Y.; Zhang, H.; Fu, Q.; Chen, Y.; Yang, T.; et al. Qingre Yiqi method along with oral hypoglycemic drugs in treating adults with type 2 diabetes mellitus: A systematic review and meta-analysis. Evid. Based Complement. Altern. Med. 2021, 2021, 4395228. [Google Scholar] [CrossRef]
- Signorovitch, J.E.; Macaulay, D.; Diener, M.; Yan, Y.; Wu, E.Q.; Gruenberger, J.B.; Frier, B.M. Hypoglycaemia and accident risk in people with type 2 diabetes mellitus treated with non-insulin antidiabetes drugs. Diabetes Obes. Metab. 2013, 15, 335–341. [Google Scholar] [CrossRef] [PubMed] [Green Version]
- Odani, H.; Shinzato, T.; Matsumoto, Y.; Usami, J.; Maeda, K. Increase in three α,β-dicarbonyl compound levels in human uremic plasma: Specific in vivo determination of intermediates in advanced Maillard reaction. Biochem. Biophys. Res. Commun. 1999, 256, 89–93. [Google Scholar] [CrossRef] [PubMed]
- Matafome, P.; Sena, C.; Seica, R. Methylglyoxal, obesity, and diabetes. Endocrine 2013, 43, 472–484. [Google Scholar] [CrossRef] [PubMed]
- Tammineni, E.R.; Kraeva, N.; Figueroa, L.; Manno, C.; Ibarra, C.A.; Klip, A.; Riazi, S.; Rios, E. Intracellular calcium leak lowers glucose storage in human muscle, promoting hyperglycemia and diabetes. eLife 2020, 9, e53999. [Google Scholar] [CrossRef]
- Benninger, R.K.; Zhang, M.; Head, W.S.; Satin, L.S.; Piston, D.W. Gap junction coupling and calcium waves in the pancreatic islet. Biophys. J. 2008, 95, 5048–5061. [Google Scholar] [CrossRef] [Green Version]
- Syreeni, A.; Sandholm, N.; Cao, J.; Toppila, I.; Maahs, D.M.; Rewers, M.J.; Snell-Bergeon, J.K.; Costacou, T.; Orchard, T.J.; Caramori, M.L.; et al. Genetic determinants of glycated hemoglobin in type 1 diabetes. Diabetes 2019, 68, 858–867. [Google Scholar] [CrossRef] [Green Version]
- Yudkin, J.S.; de Swiet, M. Fructosamine assay for gestational diabetes. Lancet 1983, 2, 1304. [Google Scholar] [CrossRef]
- Wang, N.; Xu, Z.; Han, P.; Li, T. Glycated albumin and ratio of glycated albumin to glycated hemoglobin are good indicators of diabetic nephropathy in type 2 diabetes mellitus. Diabetes Metab. Res. Rev. 2017, 33, e2843. [Google Scholar] [CrossRef]
- Chen, J.; Stimpson, S.E.; Fernandez-Bueno, G.A.; Mathews, C.E. Mitochondrial reactive oxygen species and type 1 diabetes. Antioxid. Redox Signal. 2018, 29, 1361–1372. [Google Scholar] [CrossRef]
- Panigrahy, S.K.; Bhatt, R.; Kumar, A. Reactive oxygen species: Sources, consequences and targeted therapy in type 2 diabetes. J. Drug Target. 2017, 25, 93–101. [Google Scholar] [CrossRef]
- Lim, H.M.; Park, S.H. Regulation of reactive oxygen species by phytochemicals for the management of cancer and diabetes. Crit. Rev. Food Sci. Nutr. 2022, 1–26. [Google Scholar] [CrossRef] [PubMed]
- Rodriguez-Boulan, E.; Macara, I.G. Organization and execution of the epithelial polarity programme. Nat. Rev. Mol. Cell Biol. 2014, 15, 225–242. [Google Scholar] [CrossRef] [PubMed]
- Yang, Z.; He, Y.; Lee, J.H.; Park, N.; Suh, M.; Chae, W.S.; Cao, J.; Peng, X.; Jung, H.; Kang, C.; et al. A self-calibrating bipartite viscosity sensor for mitochondria. J. Am. Chem. Soc. 2013, 135, 9181–9185. [Google Scholar] [CrossRef]
- Zhang, H.; Huang, Y.; Chen, S.; Tang, C.; Wang, G.; Du, J.; Jin, H. Hydrogen sulfide regulates insulin secretion and insulin resistance in diabetes mellitus, a new promising target for diabetes mellitus treatment? A review. J. Adv. Res. 2021, 27, 19–30. [Google Scholar] [CrossRef] [PubMed]
- Rehman, T.; Shabbir, M.A.; Inam-Ur-Raheem, M.; Manzoor, M.F.; Ahmad, N.; Liu, Z.W.; Ahmad, M.H.; Siddeeg, A.; Abid, M.; Aadil, R.M. Cysteine and homocysteine as biomarker of various diseases. Food Sci. Nutr. 2020, 8, 4696–4707. [Google Scholar] [CrossRef]
- Moraru, A.; Wiederstein, J.; Pfaff, D.; Fleming, T.; Miller, A.K.; Nawroth, P.; Teleman, A.A. Elevated levels of the reactive metabolite methylglyoxal recapitulate progression of type 2 diabetes. Cell Metab. 2018, 27, 926–934.e8. [Google Scholar] [CrossRef] [Green Version]
- Jyoti; Mir, A.R.; Habib, S.; Siddiqui, S.S.; Ali, A.; Moinuddin. Neo-epitopes on methylglyoxal modified human serum albumin lead to aggressive autoimmune response in diabetes. Int. J. Biol. Macromol. 2016, 86, 799–809. [Google Scholar]
- Kirkpatrick, P. How DPP-IV takes a bite. Nat. Rev. Drug. Discov. 2003, 2, 92. [Google Scholar] [CrossRef]
- Hernandez, C.; Bogdanov, P.; Sola-Adell, C.; Sampedro, J.; Valeri, M.; Genis, X.; Simo-Servat, O.; Garcia-Ramirez, M.; Simo, R. Topical administration of DPP-IV inhibitors prevents retinal neurodegeneration in experimental diabetes. Diabetologia 2017, 60, 2285–2298. [Google Scholar] [CrossRef] [Green Version]
- Hashimoto, Y.; Hamaguchi, M.; Nakanishi, N.; Ohbora, A.; Kojima, T.; Fukui, M. Urinary pH is a predictor of diabetes in men; a population based large scale cohort study. Diabetes Res. Clin. Pract. 2017, 130, 9–14. [Google Scholar] [CrossRef]
- Higashiura, Y.; Tanaka, M.; Furuhashi, M.; Koyama, M.; Ohnishi, H.; Numata, K.; Hisasue, T.; Hanawa, N.; Moniwa, N.; Miura, T. Low urine pH predicts new onset of diabetes mellitus during a 10-year period in men: BOREAS-DM1 study. J. Diabetes Investig. 2020, 11, 1490–1497. [Google Scholar] [CrossRef] [PubMed]
- Hou, J.-T.; Kwon, N.; Wang, S.; Wang, B.; He, X.; Yoon, J.; Shen, J. Sulfur-based fluorescent probes for HOCl: Mechanisms, design, and applications. Coord. Chem. Rev. 2022, 450, 214232. [Google Scholar] [CrossRef]
- Gao, L.; Wang, W.; Wang, X.; Yang, F.; Xie, L.; Shen, J.; Brimble, M.A.; Xiao, Q.; Yao, S.Q. Fluorescent probes for bioimaging of potential biomarkers in Parkinson’s disease. Chem. Soc. Rev. 2021, 50, 1219–1250. [Google Scholar] [CrossRef]
- Hou, J.-T.; Yu, K.-K.; Sunwoo, K.; Kim, W.Y.; Koo, S.; Wang, J.; Ren, W.X.; Wang, S.; Yu, X.-Q.; Kim, J.S. Fluorescent imaging of reactive oxygen and nitrogen species associated with pathophysiological processes. Chem 2020, 6, 832–866. [Google Scholar] [CrossRef]
- Han, H.H.; Tian, H.; Zang, Y.; Sedgwick, A.C.; Li, J.; Sessler, J.L.; He, X.P.; James, T.D. Small-molecule fluorescence-based probes for interrogating major organ diseases. Chem. Soc. Rev. 2021, 50, 9391–9429. [Google Scholar] [CrossRef]
- Tian, M.; Ma, Y.; Lin, W. Fluorescent probes for the visualization of cell viability. Acc. Chem. Res. 2019, 52, 2147–2157. [Google Scholar] [CrossRef]
- Amels, P.; Elias, H.; Wannowius, K.-J. Kinetics and mechanism of the oxidation of dimethyl sulfide by hydroperoxides in aqueous medium study on the potential contribution of liquid-phase oxidation of dimethyl sulfide in the atmosphere. J. Chem. Soc. Faraday Trans. 1997, 93, 2537–2544. [Google Scholar] [CrossRef]
- Xing, P.; Gao, K.; Wang, B.; Gao, J.; Yan, H.; Wen, J.; Li, W.; Xu, Y.; Li, H.; Chen, J.; et al. HEPES is not suitable for fluorescence detection of HClO: A novel probe for HClO in absolute PBS. Chem. Commun. 2016, 52, 5064–5066. [Google Scholar] [CrossRef]
- Gadella, T.W.J. New near-infrared fluorescent probes and tools. Nat. Methods 2022, 19, 654–655. [Google Scholar] [CrossRef]
- Hou, J.-T.; Wang, B.; Zou, Y.; Fan, P.; Chang, X.; Cao, X.; Wang, S.; Yu, F. Molecular fluorescent probes for imaging and evaluation of hypochlorite fluctuations during diagnosis and therapy of osteoarthritis in cells and in a mouse model. ACS Sens. 2020, 5, 1949–1958. [Google Scholar] [CrossRef]
- Juvekar, V.; Park, S.J.; Yoon, J.; Kim, H.M. Recent progress in the two-photon fluorescent probes for metal ions. Coord. Chem. Rev. 2021, 427, 213574. [Google Scholar] [CrossRef]
- Wang, Y.; Niu, H.; Wang, K.; Wang, G.; Liu, J.; James, T.D.; Zhang, H. mtDNA-Specific ultrasensitive near-infrared fluorescent probe enables the differentiation of healthy and apoptotic cells. Anal. Chem. 2022, 94, 7510–7519. [Google Scholar] [CrossRef] [PubMed]
- Usama, S.M.; Inagaki, F.; Kobayashi, H.; Schnermann, M.J. Norcyanine-carbamates are versatile near-infrared fluorogenic probes. J. Am. Chem. Soc. 2021, 143, 5674–5679. [Google Scholar] [CrossRef]
- Hou, J.-T.; Kim, H.S.; Duan, C.; Ji, M.S.; Wang, S.; Zeng, L.; Ren, W.X.; Kim, J.S. A ratiometric fluorescent probe for detecting hypochlorite in the endoplasmic reticulum. Chem. Commun. 2019, 55, 2533–2536. [Google Scholar] [CrossRef] [PubMed]
- Liu, Y.; Wei, Z.; Zhou, J.; Ma, Z. Simultaneous multi-signal quantification for highly precise serodiagnosis utilizing a rationally constructed platform. Nat. Commun. 2019, 10, 5361. [Google Scholar] [CrossRef] [Green Version]
- Ren, M.; Zhou, K.; Wang, L.; Liu, K.; Lin, W. Construction of a ratiometric two-photon fluorescent probe to monitor the changes of mitochondrial viscosity. Sens. Actuators B Chem. 2018, 262, 452–459. [Google Scholar] [CrossRef]
- Krahmer, N.; Farese, R.V., Jr.; Walther, T.C. Balancing the fat: Lipid droplets and human disease. EMBO Mol. Med. 2013, 5, 973–983. [Google Scholar] [CrossRef]
- Olofsson, S.O.; Andersson, L.; Haversen, L.; Olsson, C.; Myhre, S.; Rutberg, M.; Mobini, R.; Li, L.; Lu, E.; Boren, J.; et al. The formation of lipid droplets: Possible role in the development of insulin resistance/type 2 diabetes. Prostaglandins Leukot. Essent. Fat. Acids 2011, 85, 215–218. [Google Scholar] [CrossRef]
- Ni, J.-Y.; Zhang, X.-Q.; Wang, M.-Y.; Yu, Q.; Sun, R.; Xu, Y.-J.; Song, Y.-L.; Ge, J.-F. Dicyanoisophorone derivatives with self-targeting abilities towards multiple organelles for fluorescent markers and viscosity detection. Sens. Actuators B Chem. 2022, 367, 132065. [Google Scholar] [CrossRef]
- Yin, J.; Kong, X.; Lin, W. Noninvasive cancer diagnosis in vivo based on a viscosity-activated near-infrared fluorescent probe. Anal. Chem. 2021, 93, 2072–2081. [Google Scholar] [CrossRef]
- Wang, X.; Fan, L.; Wang, S.; Zhang, Y.; Li, F.; Zan, Q.; Lu, W.; Shuang, S.; Dong, C. Real-time monitoring mitochondrial viscosity during mitophagy using a mitochondria-immobilized near-infrared aggregation-induced emission probe. Anal. Chem. 2021, 93, 3241–3249. [Google Scholar] [CrossRef] [PubMed]
- Dong, B.; Song, W.; Lu, Y.; Sun, Y.; Lin, W. Revealing the viscosity changes in lipid droplets during ferroptosis by the real-time and in situ near-infrared imaging. ACS Sens. 2021, 6, 22–26. [Google Scholar] [CrossRef] [PubMed]
- Yang, X.; Zhang, D.; Ye, Y.; Zhao, Y. Recent advances in multifunctional fluorescent probes for viscosity and analytes. Coord. Chem. Rev. 2022, 453, 214336. [Google Scholar] [CrossRef]
- Zhang, P.; Chen, H.; Huang, H.; Qiu, K.; Zhang, C.; Chao, H.; Zhang, Q. A viscosity-sensitive iridium(iii) probe for lysosomal microviscosity quantification and blood viscosity detection in diabetic mice. Dalton Trans. 2019, 48, 3990–3997. [Google Scholar] [CrossRef]
- Kenry; Duan, Y.; Liu, B. Recent advances of optical imaging in the second near-infrared window. Adv. Mater. 2018, 30, 1802394. [Google Scholar]
- Jing, L.; Sun, M.; Xu, P.; Yao, K.; Yang, J.; Wang, X.; Liu, H.; Sun, M.; Sun, Y.; Ni, R.; et al. Noninvasive in vivo imaging and monitoring of 3D-printed polycaprolactone scaffolds labeled with an NIR region II fluorescent dye. ACS Appl. Bio Mater. 2021, 4, 3189–3202. [Google Scholar] [CrossRef]
- Zhu, S.; Herraiz, S.; Yue, J.; Zhang, M.; Wan, H.; Yang, Q.; Ma, Z.; Wang, Y.; He, J.; Antaris, A.L.; et al. 3D NIR-II molecular imaging distinguishes targeted organs with high-performance NIR-II bioconjugates. Adv. Mater. 2018, 30, e1705799. [Google Scholar] [CrossRef]
- Wang, F.; Wan, H.; Ma, Z.; Zhong, Y.; Sun, Q.; Tian, Y.; Qu, L.; Du, H.; Zhang, M.; Li, L.; et al. Light-sheet microscopy in the near-infrared II window. Nat. Methods 2019, 16, 545–552. [Google Scholar] [CrossRef]
- Dou, K.; Huang, W.; Xiang, Y.; Li, S.; Liu, Z. Design of activatable NIR-II molecular probe for in vivo elucidation of disease-related viscosity variations. Anal. Chem. 2020, 92, 4177–4181. [Google Scholar] [CrossRef] [Green Version]
- Fu, M.; Shen, W.; Chen, Y.; Yi, W.; Cai, C.; Zhu, L.; Zhu, Q. A highly sensitive red-emitting probe for the detection of viscosity changes in living cells, zebrafish, and human blood samples. J. Mater. Chem. B 2020, 8, 1310–1315. [Google Scholar] [CrossRef]
- Chen, B.; Mao, S.; Sun, Y.; Sun, L.; Ding, N.; Li, C.; Zhou, J. A mitochondria-targeted near-infrared fluorescent probe for imaging viscosity in living cells and a diabetic mice model. Chem. Commun. 2021, 57, 4376–4379. [Google Scholar] [CrossRef] [PubMed]
- Dai, L.; Ren, M.; Lin, W. Development of a novel NIR viscosity fluorescent probe for visualizing the kidneys in diabetic mice. Spectrochim. Acta A Mol. Biomol. Spectrosc. 2021, 254, 119627. [Google Scholar] [CrossRef] [PubMed]
- Lu, B.; Yin, J.; Liu, C.; Lin, W. NIR fluorescence imaging of lipid drops viscosity in liver organs of diabetic mice. Dyes Pigments 2021, 187, 109120. [Google Scholar] [CrossRef]
- Del Valle Batalla, F.; Lennon-Dumenil, A.M.; Yuseff, M.I. Tuning B cell responses to antigens by cell polarity and membrane trafficking. Mol. Immunol. 2018, 101, 140–145. [Google Scholar] [CrossRef]
- Mizukawa, B.; O’Brien, E.; Moreira, D.C.; Wunderlich, M.; Hochstetler, C.L.; Duan, X.; Liu, W.; Orr, E.; Grimes, H.L.; Mulloy, J.C.; et al. The cell polarity determinant CDC42 controls division symmetry to block leukemia cell differentiation. Blood 2017, 130, 1336–1346. [Google Scholar] [CrossRef] [Green Version]
- Scheler, B.; Schnepf, V.; Galgenmuller, C.; Ranf, S.; Huckelhoven, R. Barley disease susceptibility factor RACB acts in epidermal cell polarity and positioning of the nucleus. J. Exp. Bot. 2016, 67, 3263–3275. [Google Scholar] [CrossRef]
- Hu, J.; Yang, R.; Qin, H.; Sun, Y.; Qu, L.; Li, Z. Spying on the polarity dynamics during wound healing of zebrafish by using rationally designed carbon dots. Adv. Healthc. Mater. 2021, 10, e2002268. [Google Scholar] [CrossRef]
- Shuang, E.; Mao, Q.X.; Wang, J.H.; Chen, X.W. Carbon dots with tunable dual emissions: From the mechanism to the specific imaging of endoplasmic reticulum polarity. Nanoscale 2020, 12, 6852–6860. [Google Scholar] [CrossRef]
- Yin, J.; Quan, W.; Kong, X.; Liu, C.; Lu, B.; Lin, W. Utilizing a solvatochromic optical agent to monitor the polarity changes in dynamic liver injury progression. ACS Appl. Bio Mater. 2021, 4, 3630–3638. [Google Scholar] [CrossRef]
- Jiang, J.; Tian, X.; Xu, C.; Wang, S.; Feng, Y.; Chen, M.; Yu, H.; Zhu, M.; Meng, X. A two-photon fluorescent probe for real-time monitoring of autophagy by ultrasensitive detection of the change in lysosomal polarity. Chem. Commun. 2017, 53, 3645–3648. [Google Scholar] [CrossRef]
- Xiao, H.; Wu, C.; Li, P.; Gao, W.; Zhang, W.; Zhang, W.; Tong, L.; Tang, B. Ratiometric photoacoustic imaging of endoplasmic reticulum polarity in injured liver tissues of diabetic mice. Chem. Sci. 2017, 8, 7025–7030. [Google Scholar] [CrossRef] [PubMed] [Green Version]
- Tang, Q.; Zhang, X.; Cao, H.; Chen, G.; Huang, H.; Zhang, P.; Zhang, Q. A phosphorescent iridium probe for sensing polarity in the endoplasmic reticulum and in vivo. Dalton Trans. 2019, 48, 7728–7734. [Google Scholar] [CrossRef] [PubMed]
- Wang, L.; Qiang, T.; Ren, L.; Cheng, F.; Hu, W.; Qu, R. Observation of macrophage autophagy in the healing of diabetic ulcers via a lysosome-targeting polarity-specific two-photon probe. RSC Adv. 2022, 12, 3654–3661. [Google Scholar] [CrossRef] [PubMed]
- Kerru, N.; Singh-Pillay, A.; Awolade, P.; Singh, P. Current anti-diabetic agents and their molecular targets: A review. Eur. J. Med. Chem. 2018, 152, 436–488. [Google Scholar] [CrossRef]
- Byrne, N.J.; Rajasekaran, N.S.; Abel, E.D.; Bugger, H. Therapeutic potential of targeting oxidative stress in diabetic cardiomyopathy. Free Radic. Biol. Med. 2021, 169, 317–342. [Google Scholar] [CrossRef]
- Rizwan, H.; Pal, S.; Sabnam, S.; Pal, A. High glucose augments ROS generation regulates mitochondrial dysfunction and apoptosis via stress signalling cascades in keratinocytes. Life Sci. 2020, 241, 117148. [Google Scholar] [CrossRef]
- Papachristoforou, E.; Lambadiari, V.; Maratou, E.; Makrilakis, K. Association of glycemic indices (hyperglycemia, glucose variability, and hypoglycemia) with oxidative stress and diabetic complications. J. Diabetes Res. 2020, 2020, 7489795. [Google Scholar]
- Matsuzaki, S.; Eyster, C.; Newhardt, M.F.; Giorgione, J.R.; Kinter, C.; Young, Z.T.; Kinter, M.; Humphries, K.M. Insulin signaling alters antioxidant capacity in the diabetic heart. Redox Biol. 2021, 47, 102140. [Google Scholar] [CrossRef]
- Bhatti, J.S.; Sehrawat, A.; Mishra, J.; Sidhu, I.S.; Navik, U.; Khullar, N.; Kumar, S.; Bhatti, G.K.; Reddy, P.H. Oxidative stress in the pathophysiology of type 2 diabetes and related complications: Current therapeutics strategies and future perspectives. Free Radic. Biol. Med. 2022, 184, 114–134. [Google Scholar] [CrossRef]
- Zhang, P.; Li, T.; Wu, X.; Nice, E.C.; Huang, C.; Zhang, Y. Oxidative stress and diabetes: Antioxidative strategies. Front. Med. 2020, 14, 583–600. [Google Scholar]
- Makino, A.; Scott, B.T.; Dillmann, W.H. Mitochondrial fragmentation and superoxide anion production in coronary endothelial cells from a mouse model of type 1 diabetes. Diabetologia 2010, 53, 1783–1794. [Google Scholar] [CrossRef] [PubMed] [Green Version]
- Ivanov, V.V.; Shakhristova, E.V.; Stepovaya, E.A.; Nosareva, O.L.; Fedorova, T.S.; Ryazantseva, N.V.; Novitsky, V.V. Effect of insulin, the glutathione system, and superoxide anion radical in modulation of lipolysis in adipocytes of rats with experimental diabetes. Biochem. Mosc. 2015, 80, 87–96. [Google Scholar] [CrossRef] [PubMed]
- Jie, Z.; Liu, J.; Shu, M.; Ying, Y.; Yang, H. Detection strategies for superoxide anion: A review. Talanta 2022, 236, 122892. [Google Scholar] [CrossRef] [PubMed]
- Xiao, H.; Liu, X.; Wu, C.; Wu, Y.; Li, P.; Guo, X.; Tang, B. A new endoplasmic reticulum-targeted two-photon fluorescent probe for imaging of superoxide anion in diabetic mice. Biosens. Bioelectron. 2017, 91, 449–455. [Google Scholar] [CrossRef]
- Song, W.; Dong, B.; Lu, Y.; Li, Z.; Zhang, W.; Lin, W. Two-photon fluorescent sensors for visual detection of abnormal superoxide anion in diabetes mice. Sens. Actuators B Chem. 2021, 332, 129537. [Google Scholar] [CrossRef]
- Pacher, P.; Szabo, C. Role of peroxynitrite in the pathogenesis of cardiovascular complications of diabetes. Curr. Opin. Pharmacol. 2006, 6, 136–141. [Google Scholar] [CrossRef]
- Suarez-Pinzon, W.L.; Szabo, C.; Rabinovitch, A. Development of autoimmune diabetes in NOD mice is associated with the formation of peroxynitrite in pancreatic islet beta-cells. Diabetes 1997, 46, 907–911. [Google Scholar] [CrossRef] [Green Version]
- Wu, Y.; Zhang, X.; Lu, X.; Chen, Y.; Ju, J.; Wu, H.; Zhu, B.; Huang, S. An SMVT-targeting and peroxynitrite-activating fluorescent probe for head and neck cancer imaging and peroxynitrite detection. Sens. Actuators B Chem. 2021, 348, 130677. [Google Scholar] [CrossRef]
- Shi, M.; Zhang, J.; Wang, Y.; Peng, C.; Hu, H.; Qiao, M.; Zhao, X.; Chen, D. Tumor-specific nitric oxide generator to amplify peroxynitrite based on highly penetrable nanoparticles for metastasis inhibition and enhanced cancer therapy. Biomaterials 2022, 283, 121448. [Google Scholar] [CrossRef]
- Li, W.; Feng, J.; Gao, C.; Wu, M.; Du, Q.; Tsoi, B.; Wang, Q.; Yang, D.; Shen, J. Nitration of Drp1 provokes mitophagy activation mediating neuronal injury in experimental autoimmune encephalomyelitis. Free Radic. Biol. Med. 2019, 143, 70–83. [Google Scholar] [CrossRef]
- Miao, J.; Huo, Y.; Liu, Q.; Li, Z.; Shi, H.; Shi, Y.; Guo, W. A new class of fast-response and highly selective fluorescent probes for visualizing peroxynitrite in live cells, subcellular organelles, and kidney tissue of diabetic rats. Biomaterials 2016, 107, 33–43. [Google Scholar] [CrossRef] [PubMed]
- Miao, J.; Huo, Y.; Shi, H.; Fang, J.; Wang, J.; Guo, W. A Si-rhodamine-based near-infrared fluorescent probe for visualizing endogenous peroxynitrite in living cells, tissues, and animals. J. Mater. Chem. B 2018, 6, 4466–4473. [Google Scholar] [CrossRef] [PubMed]
- Prasad, M.K.; Mohandas, S.; Ramkumar, K.M. Role of ER stress inhibitors in the management of diabetes. Eur. J. Pharmacol. 2022, 922, 174893. [Google Scholar] [CrossRef] [PubMed]
- Yong, J.; Johnson, J.D.; Arvan, P.; Han, J.; Kaufman, R.J. Therapeutic opportunities for pancreatic beta-cell ER stress in diabetes mellitus. Nat. Rev. Endocrinol. 2021, 17, 455–467. [Google Scholar] [CrossRef]
- Zhang, W.; Song, W.; Lin, W. A novel ER-targeted two-photon fluorescent probe for monitoring abnormal concentrations of HClO in diabetic mice. J. Mater. Chem. B 2021, 9, 7381–7385. [Google Scholar] [CrossRef]
- Zhang, R.; Lian, L.; Wang, B.; Zhu, L.; Ren, Y.; Shen, J.; Yu, X.Q.; Hou, J.-T. Observation of HOCl generation associated with diabetic cataract using a highly sensitive fluorescent probe. Spectrochim. Acta A Mol. Biomol. Spectrosc. 2022, 278, 121385. [Google Scholar] [CrossRef]
- Wang, W.X.; Jiang, W.L.; Mao, G.J.; Tan, M.; Fei, J.; Li, Y.; Li, C.Y. Monitoring the fluctuation of hydrogen peroxide in diabetes and its complications with a novel near-infrared fluorescent probe. Anal. Chem. 2021, 93, 3301–3307. [Google Scholar] [CrossRef]
- Yu, W.; Huang, J.; Lin, M.; Wei, G.; Yang, F.; Tang, Z.; Zeng, F.; Wu, S. Fluorophore-dapagliflozin dyad for detecting diabetic liver/kidney damages via fluorescent imaging and treating diabetes via inhibiting SGLT2. Anal. Chem. 2021, 93, 4647–4656. [Google Scholar] [CrossRef]
- Szabo, C. Roles of hydrogen sulfide in the pathogenesis of diabetes mellitus and its complications. Antioxid. Redox Signal. 2012, 17, 68–80. [Google Scholar] [CrossRef]
- Pichette, J.; Gagnon, J. Implications of hydrogen sulfide in glucose regulation: How H2S can alter glucose homeostasis through metabolic hormones. Oxid. Med. Cell. Longev. 2016, 2016, 3285074. [Google Scholar] [CrossRef] [Green Version]
- Kumar, R.; Banerjee, R. Regulation of the redox metabolome and thiol proteome by hydrogen sulfide. Crit. Rev. Biochem. Mol. Biol. 2021, 56, 221–235. [Google Scholar] [CrossRef] [PubMed]
- Wang, J.; Hu, L.; Shen, J.; Jiang, J.; Yu, K.; Sun, R. Research progress in the visual sensors/sensing ensembles for L-Cysteine. Chin. J. Org. Chem. 2018, 38, 760–774. [Google Scholar] [CrossRef]
- Li, Z.; Gao, J.; Guo, Z.; Zhao, H.; Liu, L.; Wang, M.; Zhang, P.; Chen, G.; Li, X.; Wei, C. Monitoring the fluctuation of H2S in insulin-resistant HepG2 cells and diabetic mice with a dual-locked NIR fluorescent probe. Sens. Actuators B Chem. 2022, 353, 131141. [Google Scholar] [CrossRef]
- Yue, L.; Huang, H.; Song, W.; Lin, W. Research on mitochondrial oxidative stress accompanying the diabetic process under airborne particulate matter pollution by NIR fluorescence imaging of cysteine. Chem. Eng. J. 2022, 441, 135981. [Google Scholar] [CrossRef]
- Luengo, A.; Abbott, K.L.; Davidson, S.M.; Hosios, A.M.; Faubert, B.; Chan, S.H.; Freinkman, E.; Zacharias, L.G.; Mathews, T.P.; Clish, C.B.; et al. Reactive metabolite production is a targetable liability of glycolytic metabolism in lung cancer. Nat. Commun. 2019, 10, 5604. [Google Scholar] [CrossRef] [PubMed] [Green Version]
- Ramasamy, R.; Yan, S.F.; Schmidt, A.M. Methylglyoxal comes of AGE. Cell 2006, 124, 258–260. [Google Scholar] [CrossRef] [Green Version]
- Liu, J.; Wang, R.; Desai, K.; Wu, L. Upregulation of aldolase B and overproduction of methylglyoxal in vascular tissues from rats with metabolic syndrome. Cardiovasc. Res. 2011, 92, 494–503. [Google Scholar] [CrossRef]
- Thornalley, P.J. Dicarbonyl intermediates in the maillard reaction. Ann. N. Y. Acad. Sci. 2005, 1043, 111–117. [Google Scholar] [CrossRef]
- Queisser, M.A.; Yao, D.; Geisler, S.; Hammes, H.P.; Lochnit, G.; Schleicher, E.D.; Brownlee, M.; Preissner, K.T. Hyperglycemia impairs proteasome function by methylglyoxal. Diabetes 2010, 59, 670–678. [Google Scholar] [CrossRef] [Green Version]
- Darvishi, B.; Dinarvand, R.; Mohammadpour, H.; Kamarul, T.; Sharifi, A.M. Dual l-carnosine/Aloe vera nanophytosomes with synergistically enhanced protective effects against methylglyoxal-induced angiogenesis impairment. Mol. Pharm. 2021, 18, 3302–3325. [Google Scholar] [CrossRef]
- Kold-Christensen, R.; Johannsen, M. Methylglyoxal metabolism and aging-related disease: Moving from correlation toward causation. Trends Endocrinol. Metab. 2020, 31, 81–92. [Google Scholar] [CrossRef] [PubMed]
- Yang, M.; Fan, J.; Zhang, J.; Du, J.; Peng, X. Visualization of methylglyoxal in living cells and diabetic mice model with a 1,8-naphthalimide-based two-photon fluorescent probe. Chem. Sci. 2018, 9, 6758–6764. [Google Scholar] [CrossRef] [PubMed] [Green Version]
- Wang, H.; Xu, Y.; Rao, L.; Yang, C.; Yuan, H.; Gao, T.; Chen, X.; Sun, H.; Xian, M.; Liu, C.; et al. Ratiometric fluorescent probe for monitoring endogenous methylglyoxal in living cells and diabetic blood samples. Anal. Chem. 2019, 91, 5646–5653. [Google Scholar] [CrossRef] [PubMed]
- Xu, H.; Liu, Q.; Song, X.; Wang, C.; Wang, X.; Ma, S.; Wang, X.; Feng, Y.; Meng, X.; Liu, X.; et al. Fluorophore-promoted facile deprotonation and exocyclic five-membered ring cyclization for selective and dynamic tracking of labile glyoxals. Anal. Chem. 2020, 92, 13829–13838. [Google Scholar] [CrossRef] [PubMed]
- Bray, J.K.; Dawlaty, M.M.; Verma, A.; Maitra, A. Roles and regulations of TET enzymes in solid tumors. Trends Cancer 2021, 7, 635–646. [Google Scholar] [CrossRef] [PubMed]
- Wu, X.; Wang, R.; Kwon, N.; Ma, H.; Yoon, J. Activatable fluorescent probes for in situ imaging of enzymes. Chem. Soc. Rev. 2022, 51, 450–463. [Google Scholar] [CrossRef]
- Wu, X.; Shi, W.; Li, X.; Ma, H. Recognition moieties of small molecular fluorescent probes for bioimaging of enzymes. Acc. Chem. Res. 2019, 52, 1892–1904. [Google Scholar] [CrossRef]
- Singh, H.; Tiwari, K.; Tiwari, R.; Pramanik, S.K.; Das, A. Small molecule as fluorescent probes for monitoring intracellular enzymatic transformations. Chem. Rev. 2019, 119, 11718–11760. [Google Scholar] [CrossRef]
- Wang, W.X.; Jiang, W.L.; Guo, H.; Li, Y.; Li, C.Y. Real-time imaging of alkaline phosphatase activity of diabetes in mice via a near-infrared fluorescent probe. Chem. Commun. 2021, 57, 480–483. [Google Scholar] [CrossRef]
- Guo, X.; Mu, S.; Li, J.; Zhang, Y.; Liu, X.; Zhang, H.; Gao, H. Fabrication of a water-soluble near-infrared fluorescent probe for selective detection and imaging of dipeptidyl peptidase IV in biological systems. J. Mater. Chem. B 2020, 8, 767–775. [Google Scholar] [CrossRef]
- Wang, J.; Zhang, L.; Qu, Y.; Yang, Y.; Cao, T.; Cao, Y.; Iqbal, A.; Qin, W.; Liu, Y. Long-wavelength ratiometric fluorescent probe for the early diagnosis of diabetes. Anal. Chem. 2021, 93, 11461–11469. [Google Scholar] [CrossRef] [PubMed]
- Korting, H.C.; Braun-Falco, O. The effect of detergents on skin pH and its consequences. Clin. Dermatol. 1996, 14, 23–27. [Google Scholar] [CrossRef]
- Ehlers, C.; Ivens, U.; Møller, M.; Senderovitz, T.; Serup, J. Technology, females have lower skin surface pH than men: A study on the influence of gender, forearm site variation, right/left difference and time of the day on the skin surface pH. Skin Res. Technol. 2001, 7, 90–94. [Google Scholar] [CrossRef] [PubMed]
- Gethin, G. The significance of surface pH in chronic wounds. Wounds UK 2007, 3, 52. [Google Scholar]
- Zubair, M.; Ahmad, J. Role of growth factors and cytokines in diabetic foot ulcer healing: A detailed review. Rev. Endocr. Metab. Disord. 2019, 20, 207–217. [Google Scholar] [CrossRef]
- Kasiewicz, L.N.; Whitehead, K.A. Recent advances in biomaterials for the treatment of diabetic foot ulcers. Biomater. Sci. 2017, 5, 1962–1975. [Google Scholar] [CrossRef]
- James, G.A.; Swogger, E.; Wolcott, R.; Pulcini, E.; Secor, P.; Sestrich, J.; Costerton, J.W.; Stewart, P.S. Biofilms in chronic wounds. Wound Repair Regen. 2008, 16, 37–44. [Google Scholar] [CrossRef]
- Dhatariya, K.K.; Glaser, N.S.; Codner, E.; Umpierrez, G.E. Diabetic ketoacidosis. Nat. Rev. Dis. Primers 2020, 6, 41. [Google Scholar] [CrossRef]
- Nanda, S.; Longo, S.; Bhatt, S.P.; Pamula, J.; Sharma, S.G.; Dale, T.H. Stress cardiomyopathy—A unique presentation of diabetic ketoacidosis. Ann. Clin. Biochem. 2009, 46, 257–260. [Google Scholar] [CrossRef] [Green Version]
- Mai, H.; Wang, Y.; Li, S.; Jia, R.; Li, S.; Peng, Q.; Xie, Y.; Hu, X.; Wu, S. A pH-sensitive near-infrared fluorescent probe with alkaline pKa for chronic wound monitoring in diabetic mice. Chem. Commun. 2019, 55, 7374–7377. [Google Scholar] [CrossRef]
- Meenu, M.T.; Cherian, A.R.; Sherin, D.R.; Nair, A.R.; Manojkumar, T.K.; Radhakrishnan, K.V.; Varghese, A. A protoberberine alkaloid based ratiometric pH-responsive probe for the detection of diabetic ketoacidosis. Dyes Pigments 2021, 194, 109636. [Google Scholar] [CrossRef]
- Wang, Y.; Chen, J.; Li, S.; Zhang, X.; Guo, Z.; Hu, J.; Shao, X.; Song, N.; Zhao, Y.; Li, H.; et al. Exogenous spermine attenuates rat diabetic cardiomyopathy via suppressing ROS-p53 mediated downregulation of calcium-sensitive receptor. Redox Biol. 2020, 32, 101514. [Google Scholar] [CrossRef] [PubMed]
- Wang, M.; Li, Y.; Li, S.; Lv, J. Endothelial Dysfunction and Diabetic Cardiomyopathy. Front. Endocrinol. 2022, 13, 851941. [Google Scholar] [CrossRef] [PubMed]
- Kaludercic, N.; Di Lisa, F. Mitochondrial ROS Formation in the Pathogenesis of Diabetic Cardiomyopathy. Front. Cardiovasc. Med. 2020, 7, 12. [Google Scholar] [CrossRef] [Green Version]
- Liu, Z.W.; Zhu, H.T.; Chen, K.L.; Dong, X.; Wei, J.; Qiu, C.; Xue, J.H. Protein kinase RNA-like endoplasmic reticulum kinase (PERK) signaling pathway plays a major role in reactive oxygen species (ROS)-mediated endoplasmic reticulum stress-induced apoptosis in diabetic cardiomyopathy. Cardiovasc. Diabetol. 2013, 12, 158. [Google Scholar] [CrossRef] [Green Version]
- Jin, L.; Deng, Z.; Zhang, J.; Yang, C.; Liu, J.; Han, W.; Ye, P.; Si, Y.; Chen, G. Mesenchymal stem cells promote type 2 macrophage polarization to ameliorate the myocardial injury caused by diabetic cardiomyopathy. J. Transl. Med. 2019, 17, 251. [Google Scholar] [CrossRef] [Green Version]
- Xiao, H.; Wu, C.; Li, P.; Tang, B. Simultaneous fluorescence visualization of endoplasmic reticulum superoxide anion and polarity in myocardial cells and tissue. Anal. Chem. 2018, 90, 6081–6088. [Google Scholar] [CrossRef]
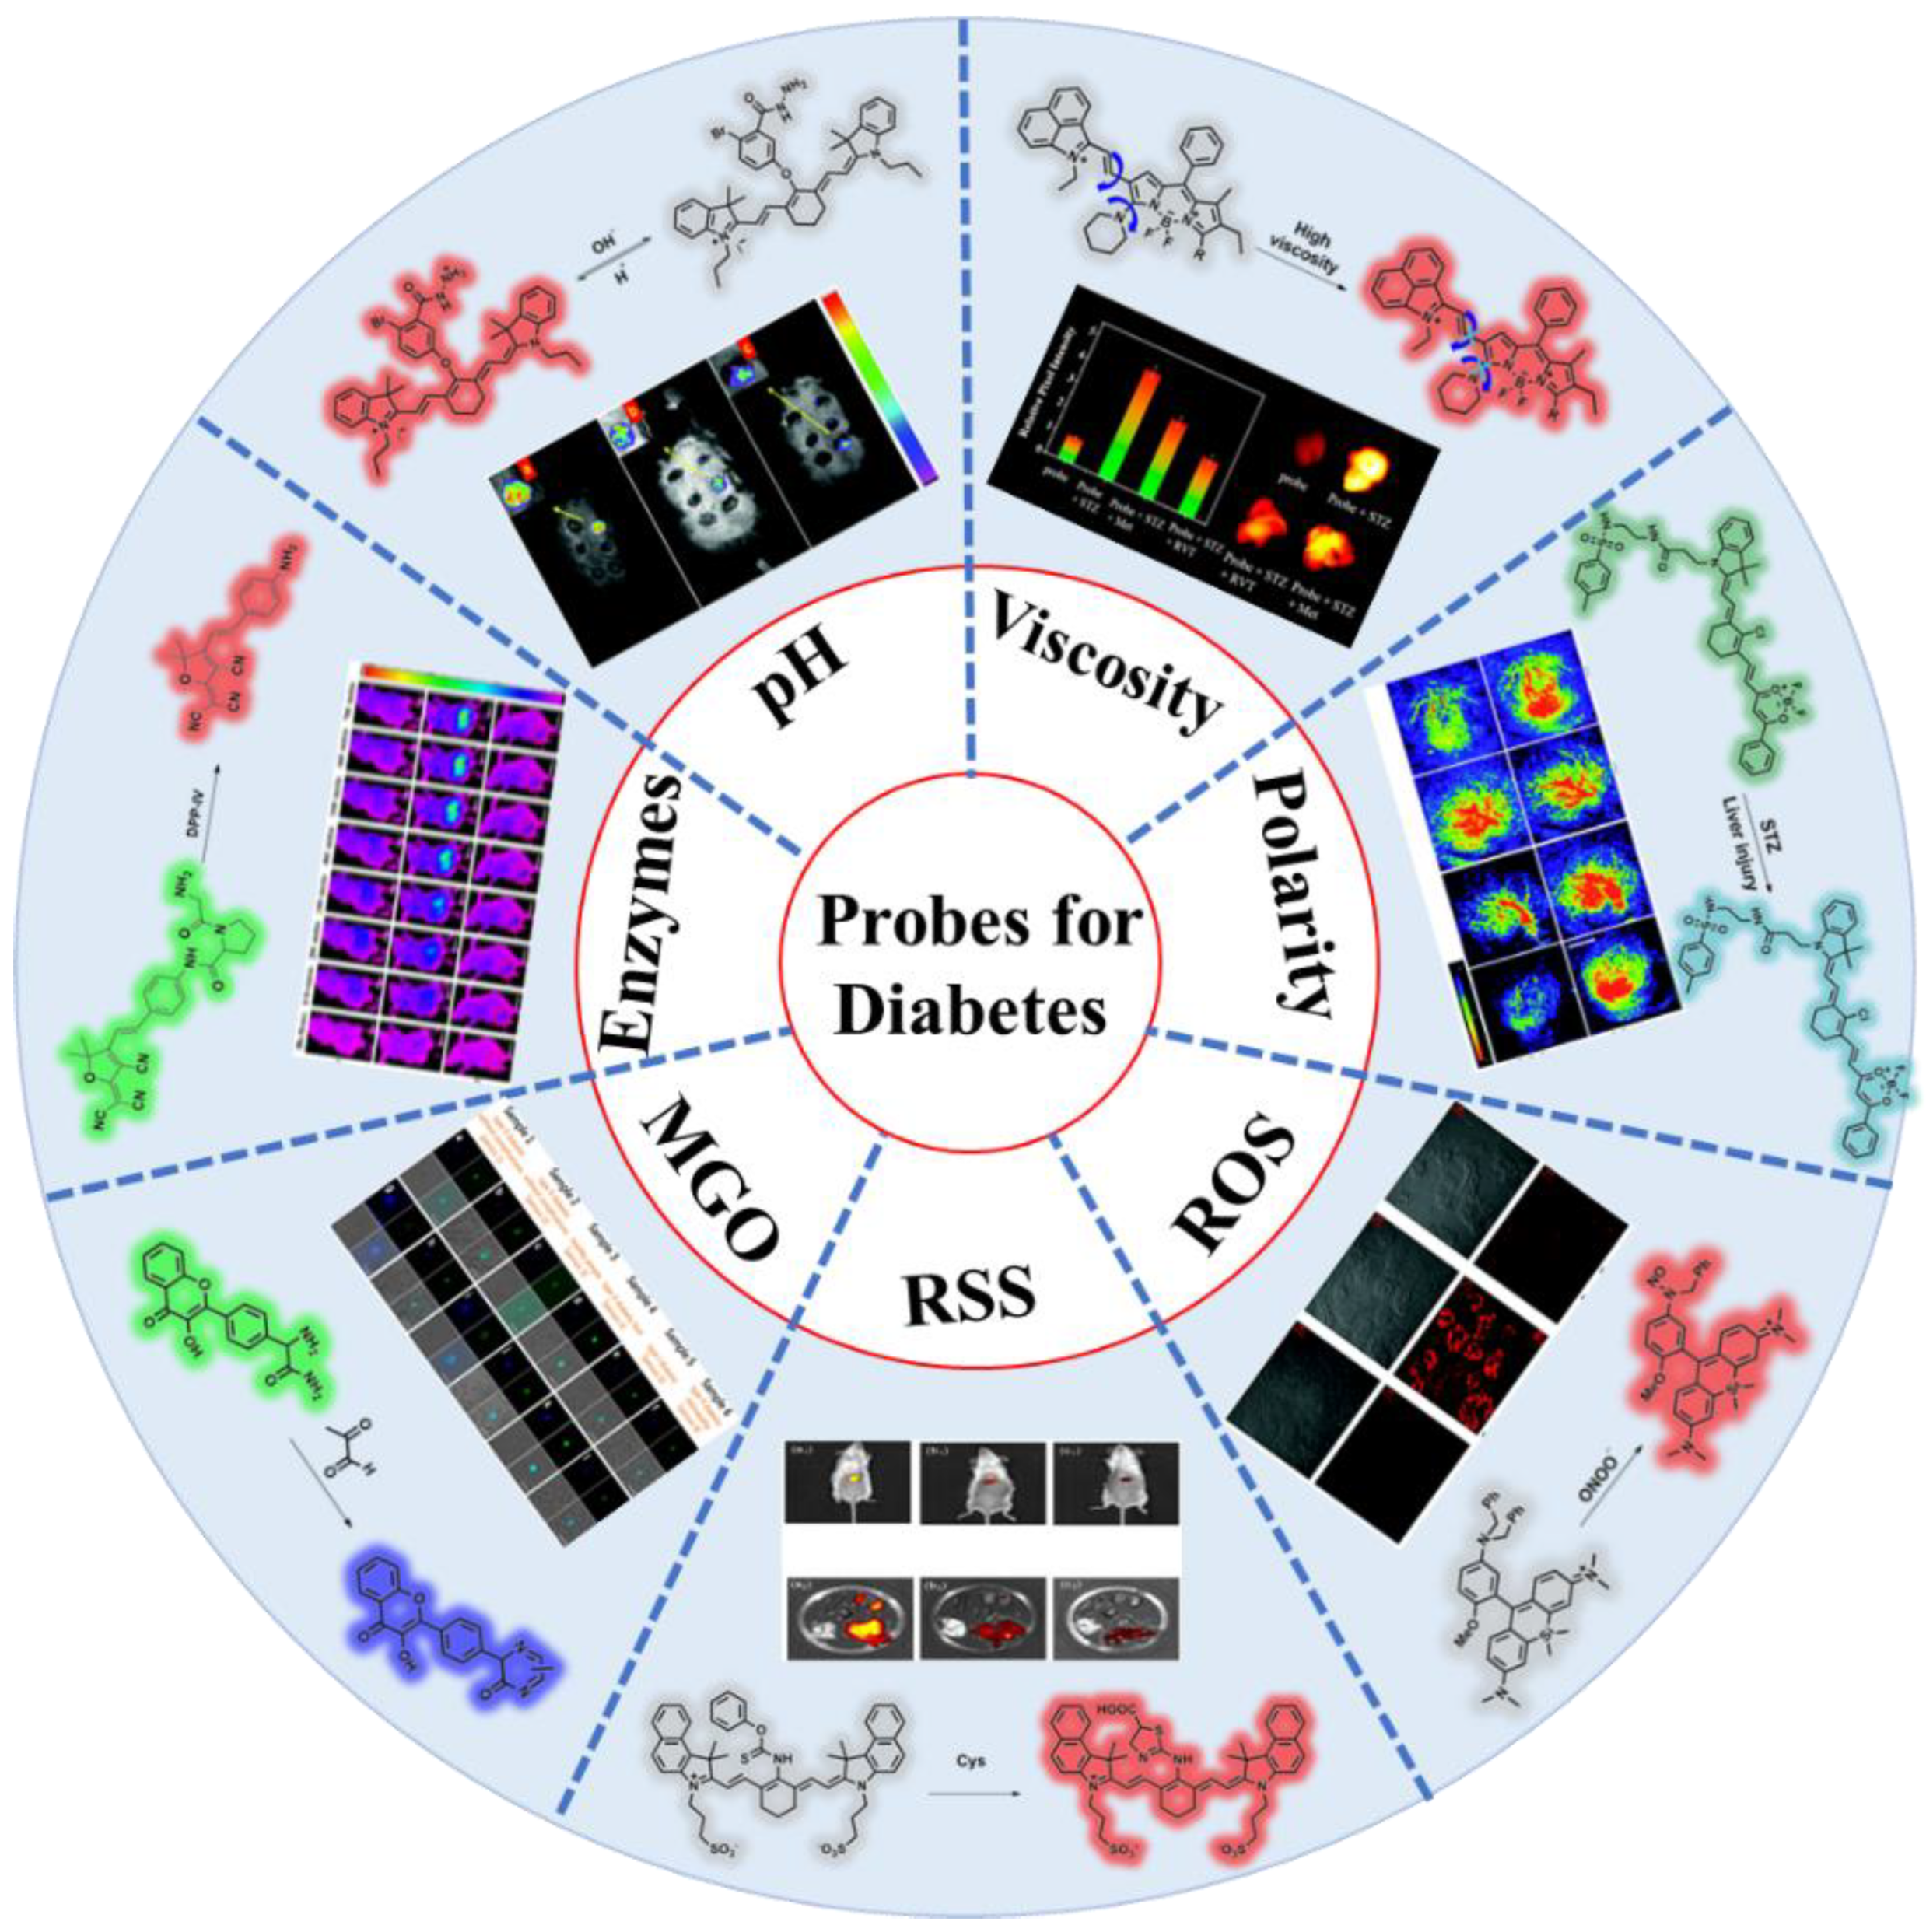
Figure 1.
Fluorescent probes for diabetes visualization and treatment.

Figure 2.
(A) Imaging mechanism of probe 1; (B) the phosphorescence spectra of probe 1 in the fresh blood of normal and diabetic mice, respectively, λex = 405 nm. Adapted from Reference [54]. Copyright 2019, the Royal Society of Chemistry.
Figure 2.
(A) Imaging mechanism of probe 1; (B) the phosphorescence spectra of probe 1 in the fresh blood of normal and diabetic mice, respectively, λex = 405 nm. Adapted from Reference [54]. Copyright 2019, the Royal Society of Chemistry.

Figure 3.
(A) Imaging mechanism of probes 2–5; (Ba) relative fluorescence intensity in mice livers treated with various drugs and probe 3; (Bb) ex vivo imaging of liver viscosity after drug treatment. Adapted from Reference [59]. Copyright 2020, American Chemical Society.
Figure 3.
(A) Imaging mechanism of probes 2–5; (Ba) relative fluorescence intensity in mice livers treated with various drugs and probe 3; (Bb) ex vivo imaging of liver viscosity after drug treatment. Adapted from Reference [59]. Copyright 2020, American Chemical Society.

Figure 4.
(A) Imaging mechanism of probe 6; (B) the fluorescence spectra of probe 6 in the fresh blood of normal and diabetic mice, respectively, λex = 510 nm. Adapted from Reference [60]. Copyright 2020, the Royal Society of Chemistry.
Figure 4.
(A) Imaging mechanism of probe 6; (B) the fluorescence spectra of probe 6 in the fresh blood of normal and diabetic mice, respectively, λex = 510 nm. Adapted from Reference [60]. Copyright 2020, the Royal Society of Chemistry.

Figure 5.
(A) Imaging mechanism of probe 7; (B) distribution of organ fluorescence in three groups, λex/em = 570/700 nm, * p < 0.05, # p < 0.05. Adapted from Reference [61]. Copyright 2021, the Royal Society of Chemistry.
Figure 5.
(A) Imaging mechanism of probe 7; (B) distribution of organ fluorescence in three groups, λex/em = 570/700 nm, * p < 0.05, # p < 0.05. Adapted from Reference [61]. Copyright 2021, the Royal Society of Chemistry.

Figure 6.
(A) Imaging mechanism of probe 8; (B) HE staining, photos, and fluorescence imaging of the kidney in a normal mouse and a diabetic mouse treated with probe 8, respectively; HE staining of (Ba1) normal mouse kidney and (Bb1) diabetic mouse kidney; photos of (Ba2) normal mouse kidney and (Bb2) diabetic mouse kidney; fluorescence imaging of (Ba3) normal mouse kidney and (Bb3) diabetic mouse kidney, λex/em = 560/740 nm. Adapted from Reference [62]. Copyright 2021, Elsevier B.V.

Figure 7.
(A) Imaging mechanism of probe 9; (Ba) fluorescence imaging of LDs viscosity with probe 9 (15 μM) in normal, STZ-induced, and Met-treated livers/liver slices; (Bb) fluorescence intensity of (Ba); (Bc) fluorescence images of the normal, STZ-induced and Met-treated liver slices pretreated with probe 9, λex/em = 520/650 nm. Adapted from Reference [63]. Copyright 2021, Elsevier B.V.

Figure 8.
(A) Imaging mechanism of probe 10; (B) photoacoustic images at PA700 and PA800 of probe 10 (100 μM) in the liver tissue of mice. Scale bar: 5.0 mm. Adapted from Reference [71]. Copyright 2017, the Royal Society of Chemistry.
Figure 8.
(A) Imaging mechanism of probe 10; (B) photoacoustic images at PA700 and PA800 of probe 10 (100 μM) in the liver tissue of mice. Scale bar: 5.0 mm. Adapted from Reference [71]. Copyright 2017, the Royal Society of Chemistry.

Figure 9.
(A) Imaging mechanism of probe 11; (Ba) phosphorescence spectra of probe 11 in 0–10% blood solution of normal mice; (Bb) phosphorescence spectra of probe 11 in 0−10% blood solution of diabetic mice. Conditions: λex = 405 nm, λem = 570−750 nm. Adapted from Reference [72]. Copyright 2017, the Royal Society of Chemistry.

Figure 10.
(A) Imaging mechanism of probe 12; (Ba) in situ TP fluorescence imaging of 12-loaded (200 μL, 100 μM) wound healing tissue in diabetic mice under different treatments; (Bb) averaged fluorescence changes of (Ba). Difference was analyzed by one-way ANOVA, ** p < 0.01. Scale bars: 200 μm. Adapted from Reference [73]. Copyright 2022, the Royal Society of Chemistry.

Figure 11.
(A) Imaging mechanism of probe 13; (Ba) the two-photon fluorescence images at different depths, and the 3D stack images of liver tissue were stained with probe 13 (100 μM, 50 μL) under different treatments; (Bb) the fluorescence intensity statistics were output by selecting five representative regions of (Ba). Conditions: λex = 750 nm, λem = 420−480 nm. Adapted from Reference [84]. Copyright 2017, Elsevier B.V.

Figure 12.
(A) Imaging mechanism of probe 14; (Ba) imaging experiments after injecting 40 μL probe 14 (1 mM in DMSO) into the abdominal cavity of mice at 40 and 60 min, respectively, λex/em = 580/620 nm; (Bb) changes in the fluorescence intensity in the purple circle from (B). Statistical analyses were performed with a Student’s t-test. * p < 0.01, (n = 3). Adapted from Reference [85]. Copyright 2021, Elsevier B.V.

Figure 13.
(A) Imaging mechanism of probe 15–17; (B) the representative fluorescence images of kidney slices of rats in different groups (i.e., control group, diabetes group, and urate group), respectively. The red line in (B) represents the coordinate axis of 3D imaging. Conditions: λex = 488 nm, λem = 500−600 nm. Adapted from Reference [91]. Copyright 2016, Elsevier B.V.

Figure 14.
(A) Imaging mechanism of probe 18; (B) images of ONOO− in the peritoneal cavity of rats and (C) Confocal images of rat kidney in different groups after probe 18 (2 μM, 0.2 mL per 100 g) injection, respectively, λex = 633 nm. Adapted from Reference [92]. Copyright 2018, the Royal Society of Chemistry.

Figure 15.
(A) Imaging mechanism of probe 19; (B) the comparison of liver tissue imaging in different groups (i.e., normal mice group, diabetic mice group, and diabetic mice with L-methionine group). (Ba1,Bb1,Bc1) control group; (Ba2,Bb2,Bc2) imaging of liver tissue after incubation with probe 19; (Ba3,Bb3,Bc3) 3D imaging of liver tissue after incubation with probe 19. Scale bar: 25 μm. Adapted from Reference [95]. Copyright 2021, the Royal Society of Chemistry.

Figure 16.
(A) Imaging mechanism of probe 20; (Ba) visualization of HClO fluctuations in diabetic HLE cells after drug (100 μM NAC or AA) treatment; (Bb) quantitative statistical analysis. Conditions: λex = 405 nm, λem = 520−620 nm. Scale bar: 100 μm. ns, no significance; *** p < 0.001 by one-way ANOVA. Adapted from Reference [96]. Copyright 2022, Elsevier B.V.

Figure 17.
(A) Imaging mechanism of probe 21; (B) fluorescence imaging of mice in different groups (i.e., control group, diabetes group, and treatment group) over time after probe 21 (200 μM) injection; (C) relative fluorescence intensity in panel (B). Conditions: λex = 640 nm, λem = 680–780 nm. Adapted from Reference [97]. Copyright 2021, American Chemical Society.

Figure 18.
(A) Imaging mechanism of probe 22; fluorescent images in (B) supine posture and (C) prone of the control group and the model group at weeks 0, 1, 3, and 6 (therapy course) 15 min after i.v. injection of probe 22. Adapted from Reference [98]. Copyright 2021, American Chemical Society.
Figure 18.
(A) Imaging mechanism of probe 22; fluorescent images in (B) supine posture and (C) prone of the control group and the model group at weeks 0, 1, 3, and 6 (therapy course) 15 min after i.v. injection of probe 22. Adapted from Reference [98]. Copyright 2021, American Chemical Society.

Figure 19.
(A) Imaging mechanism of probe 23; (B) fluorescence imaging of control and diabetic mice. (Ba) 0 min; (Bb) 10 min; (Bc) 20 min; (Bd) 30 min; (Be) 40 min. Adapted from Reference [103]. Copyright 2022 Elsevier B.V.
Figure 19.
(A) Imaging mechanism of probe 23; (B) fluorescence imaging of control and diabetic mice. (Ba) 0 min; (Bb) 10 min; (Bc) 20 min; (Bd) 30 min; (Be) 40 min. Adapted from Reference [103]. Copyright 2022 Elsevier B.V.

Figure 20.
(A) Imaging mechanism of probe 24; (B) fluorescence images of mice in (Ba1) normal group, (Bb1) experimental group, and (Bc1) diabetic + APM group after treated with probe 24; (C) fluorescence images of major organs (Ca2) normal group, (Cb2) experimental group, and (Cc2) diabetic + APM group after treated with probe 24. λex/em = 628/668 nm. (D) Relative fluorescence intensity in (B). Adapted from Reference [104]. Copyright 2022 Elsevier B.V.

Figure 21.
(A) Imaging mechanism of probe 25; (B) the two-photon fluorescence imaging of MGO in normal and STZ-induced diabetic mouse tissues. (Ba,Bb) heart, (Bc,Bd) liver, (Be,Bf) spleen, (Bg,Bh) lung, (Bi,Bj) kidney. Conditions: λex = 780 nm, λem = 420–480 nm. Scale bar: 100 μm. Adapted from Reference [112]. Copyright 2018, the Royal Society of Chemistry.

Figure 22.
(A) Imaging mechanism of probe 26; (B) probe 26 application in leukocytes; (Ba,Bg) sample 1 (person 1), type II diabetic without complications; (Bb,Bh) sample 2 (person 2), type II diabetic without complications; (Bc,Bi) sample 3 (person 3), healthy people; (Bd,Bj) sample 4 (person 4), type II diabetic foot; (Be,Bk) sample 5 (person 5), type I diabetics; (Bf,Bl) sample 6 (person 6), type II diabetic retinopathy; (C) integrated emission intensity ratios (Iblue/Igreen) of images. Conditions: λex = 405 nm; for blue channel, λem = 420–480 nm; for green channel, λem = 500–650 nm. Scale bar: 20 μm. Adapted from Reference [113]. Copyright 2019, American Chemical Society.

Figure 23.
(A) Imaging mechanism of probe 27–28; (B) detection of labile GOS in the serum of diabetic mouse models using probe 28; (Ba) fluorescence intensity of probe 28 in 100 μL of serum collected from nondiabetic and diabetic male ion cyclotron resonance (ICR) mice; (Bb) correlation between the fluorescence intensities and blood glucose concentrations in the serum from both nondiabetic and diabetic male ICR mice; (Bc) fluorescence intensity of probe 28 in 100 μL of serum collected from patients with diagnosis of diabetes or not; (Bd) correlation between the fluorescence intensities and blood glucose concentrations in the serum collected from normal or diabetic individuals. Conditions: for (Ba), λex = 425 nm, λem = 564 nm; for (Bc), λex = 440 nm, λem = 540 ± 25 nm. *** p < 0.0001. Adapted from Reference [114]. Copyright 2020, American Chemical Society.

Figure 24.
(A) Imaging mechanism of probe 29; (B) fluorescence images of mice from the normal group, diabetes group, and treatment group after injection of probe 29 over time; (C) relative fluorescence intensity in (B). Conditions: λex = 640 nm, λem = 680–780 nm. Adapted from Reference [119]. Copyright 2020, the Royal Society of Chemistry.

Figure 25.
(A) Imaging mechanism of probe 30; (B) the DPP-IV activity levels in serum samples from the control group (healthy volunteers) and patient group. Adapted from Reference [120]. Copyright 2020, the Royal Society of Chemistry.
Figure 25.
(A) Imaging mechanism of probe 30; (B) the DPP-IV activity levels in serum samples from the control group (healthy volunteers) and patient group. Adapted from Reference [120]. Copyright 2020, the Royal Society of Chemistry.

Figure 26.
(A) Imaging mechanism of probe 31; (B) time-dependent fluorescence imaging of probe 31 (10 mM, 100 μL) in healthy, diabetic, and tumor-bearing mice planted with HepG2 cells; (C) fluorescence intensity at different times in (B). Conditions: λex = 470 nm, λem = 590–700 nm. Adapted from Reference [121]. Copyright 2021, American Chemical Society.

Figure 27.
(A) Imaging mechanism of probe 32; (B) the fluorescence intensity within the wound beds at different times (i.e., day 1, day 4, and day 7) points was recorded using pseudo−color images. (Ba,Bb), and (Bc) are the partially enlarged views of the pseudocolor images, respectively. Adapted from Reference [130]. Copyright 2019, the Royal Society of Chemistry.

Figure 28.
(A) Imaging mechanism of probe 33; (B) absorption spectra of probe 34 (20 μM) in PBS were measured for three different ratios of acetoacetate and 3-hydroxy butyric acid (i.e., 1:1, 1:3, and 1:6); (C) the fluorescence response of probe 33 in PBS was measured for three different ratios of acetoacetate and 3-hydroxy butyric acid (i.e., 1:1, 1:3, and 1:6); (D) expanded graph of (C). λex = 350 nm. Adapted from Reference [131]. Copyright 2021, Elsevier B.V.

Figure 29.
(A) Imaging mechanism of probe 34; (B) confocal fluorescence imaging of endogenous O2•– and polarity in myocardial tissues; (Ba,Bb) the selected fluorescence images of normal myocardial tissue; (Bc,Bd) the selected fluorescence images of diabetic myocardial tissue; (Be,Bf) the selected fluorescence images of Metf-treated diabetic myocardial tissue. (Ba′–Bf′) The 3D stack images of corresponding myocardial tissue. Conditions: for probe 34, λex = 800 nm, λem = 500−600 nm; for probe 10, λex = 633 nm, λem = 700−750 nm. Scale bar: 50 μm. Adapted from Reference [137]. Copyright 2018, American Chemical Society.

Publisher’s Note: MDPI stays neutral with regard to jurisdictional claims in published maps and institutional affiliations. |
© 2022 by the authors. Licensee MDPI, Basel, Switzerland. This article is an open access article distributed under the terms and conditions of the Creative Commons Attribution (CC BY) license (https://creativecommons.org/licenses/by/4.0/).
Share and Cite
MDPI and ACS Style
Jia, T.-T.; Li, Y.; Niu, H. Recent Progress in Fluorescent Probes for Diabetes Visualization and Drug Therapy. Chemosensors 2022, 10, 280. https://0-doi-org.brum.beds.ac.uk/10.3390/chemosensors10070280
AMA Style
Jia T-T, Li Y, Niu H. Recent Progress in Fluorescent Probes for Diabetes Visualization and Drug Therapy. Chemosensors. 2022; 10(7):280. https://0-doi-org.brum.beds.ac.uk/10.3390/chemosensors10070280
Chicago/Turabian StyleJia, Tong-Tong, Yashan Li, and Huawei Niu. 2022. "Recent Progress in Fluorescent Probes for Diabetes Visualization and Drug Therapy" Chemosensors 10, no. 7: 280. https://0-doi-org.brum.beds.ac.uk/10.3390/chemosensors10070280
Note that from the first issue of 2016, this journal uses article numbers instead of page numbers. See further details here.