
Fe3O4-Nanoparticle-Modified Sensor for the Detection of Dopamine, Uric Acid and Ascorbic Acid

Departamento de Química Física Aplicada, Facultad de Ciencias, Universidad Autónoma de Madrid, 28049 Madrid, Spain
*
Author to whom correspondence should be addressed.
Chemosensors 2023, 11(2), 79; https://0-doi-org.brum.beds.ac.uk/10.3390/chemosensors11020079
Submission received: 19 December 2022
/
Revised: 15 January 2023
/
Accepted: 18 January 2023
/
Published: 20 January 2023
(This article belongs to the Special Issue Advances in Magnetic Sensors with Nanocomponents)
Abstract
:A simple electrochemical sensor based on electrochemically synthesized Fe3O4 nanoparticles was constructed by an ink with the nanoparticles, isopropanol, NAFION and carbon Vulcan to detect dopamine, uric acid and ascorbic acid. The electrocatalytic activity of the nanoparticles for the oxidation of the analyte molecules was examined by means of cyclic voltammetry and square wave voltammetry. The parameters controlling the performance of the sensor were optimized, such as the amount of Fe3O4 nanoparticles (1, 2, 3, 5, 8, 10 mg), amount of binder (5, 10, 15 µL) and carbon Vulcan in the ink (4, 6, 8 mg). The temperature was maintained at 25 °C and the pH was 7.5 with buffer phosphate. The optimal sensor conditions were 8 mg magnetite, 4 mg carbon Vulcan and 5 µL of NAFION@ 117. The calibration curves for the three analytes were determined separately, obtaining linear ranges of 10–100, 20–160 and 1050–2300 µM and limits of detection of 4.5, 14 and 95 µM for dopamine, uric acid and ascorbic acid, respectively. This electrochemical sensor has also shown significant sensitivity and selectivity without interference from the three analyte molecules presented simultaneously in solution. This sensor was applied for the detection of these molecules in real samples.
1. Introduction
Dopamine (DA), ascorbic acid (AA) and uric acid (UA) coexist in biological fluids such as blood and urine [1]. Abnormal concentrations of DA may result in brain disorders such as schizophrenia and Parkinson’s disease. In addition, ascorbic acid (AA) plays an important role in the metabolic processes of the human body. A lack or excess of it may engender infertility and scurvy. Uric acid (UA) is a compound excreted by the kidneys in urine. Its excess or deficiency leads to Lesch-Nyhan syndrome and hyperuricemia. Maintaining normal levels of these biomolecules is a necessity for metabolic systems and overall human health. Several methods have been developed for the detection of these molecules, including liquid chromatography [2], chemiluminescence [3] and gas chromatography-mass spectrometry [4]. However, these analytical techniques have some limitations, including being time-consuming, having low sensitivity and generally requiring expensive equipment. Electrochemical sensors open a new alternative method with simple operation, fast response, low cost and excellent sensitivity and selectivity of detection. Nevertheless, the determination of these species is difficult due to the high electrochemical activity and the proximity of their redox potentials. In addition, DA and AA exist in metabolism as cations and anions, respectively, which strongly enhances their interaction [5]. In addition, the oxidation of DA can result in catalyzing the oxidation of AA [6]. It has been reported that detection using bare electrodes shows overlapping voltammetric results [7]. One solution is the use of modified electrodes, which allows the separation of the signals corresponding to each analyte. In the literature, a number of different metal alloys have been used, for example, noble metal alloys such as Pd/Pt and Pt/Au [8,9]; although their performance has been very good, their high price point and low natural abundance limit their application. Carbon-based materials such as multiwalled carbon nanotubes (MWCNTs) [10], graphene oxide (GO) [11], doped graphene [12] and carbon nanotubes functionalized with noble/nonnoble metals, metal oxides and conducting polymers [13,14,15] have also attracted much attention from researchers due to their excellent physical and chemical properties. Magnetic nanoparticles, particularly iron oxide nanoparticles, are promising materials for sensor applications due to their inherent biocompatibility, magnetic properties and large surface area, and due to the fact that they are environmentally friendly, easy to prepare and can be obtained with narrow size distribution. The electrochemical method used in this work allows one to obtain Fe3O4 nanoparticles with these properties and does not require post-synthesis purification other than centrifugation and washing with water. Some biomolecules have been detected using iron nanoparticles [16], magnetite nanoparticles [17] and hybrid ferrite oxide nanoparticles [18], and the results have shown good detection. It has also been reported that these kinds of particles could be functionalized with a wide range of functional groups [19,20,21,22] and have favorably interacted with different biomolecules of some active groups such as –OH, –COOH and –NH2 [23]. The increased catalytic activity of magnetite-containing sensors may be due to the use of nanomaterials, which involve a high contact surface with the analyte, but it is mainly due to the presence in the structure of Fe2+ and Fe3+ ions, which favors the exchange of electrons and thus increases the response in the oxidation process of the analyte.
Most of these sensors are constructed using graphene either as single layers of carbon atoms or linked in a hexagonal lattice. Graphene has been considered an essential material in the manufacturing of electrochemical sensors due to its electronic properties. Although its properties in multi-material composites, such as magnetic nanoparticles, have been widely studied, the fabrication and reproducibility of graphene is not easy, so it adds an additional parameter to the sensor development that is not simple to control. Many authors justify the use of mixtures of magnetic nanoparticles with graphene due to the fact that pure magnetite nanoparticles are chemically unstable and easily oxidize. Thus, an incorporation of magnetite onto the graphene sheets will give rise to new and enhanced functionalities that show favorable magnetic properties, increased electrocatalytic activity and electron transfer ability, as well as prevent heavy aggregation. In this work, a sensor was developed based on electrochemically synthesized magnetite nanoparticles, which were mixed with carbon black Vulcan to increase their conductivity, and NAFION@ 117 was used as a binder. A quantity of 20 µL of the formed ink was deposited on a vitreous carbon electrode. To optimize the electrode, we varied the quantities of the components in the ink, i.e., nanoparticles, the binder and the amount of carbon black Vulcan. The concentrations at which the best voltammetric response was obtained for the three analytes studied were chosen. The results show that the sensitivity of the obtained sensor is better in many cases than the previous ones. More importantly, the electrode is modified only by one step, which can make the preparation time of the electrode very short and reduce the error of the multiple modifications. Compared to other methods, the proposed method of electrode modification produces sensors with good stability and reproducibility and, most important of all, it is a cheaper and easier method to perform the sensor.
2. Materials and Methods
2.1. Reagents
All chemicals used in this study were of analytical grade and used without further purification. The reagents isopropyl alcohol, sodium chloride (0.04 M), dibasic sodium phosphate dihydrate (0.1 M), potassium phosphate monobasic (0.1 M), NAFION@ 117 solution, dopamine (0.5 mM), uric acid (0.5 mM) and ascorbic acid (2 mM) were purchased from Sigma-Aldrich (St. Louis, MO, USA). Other reagents used were sodium hydroxide (Panreac, Barcelona, Spain, 98%) and carbon black Vulcan. The solutions were prepared using deionized water.
2.2. Electrochemical Synthesis of Magnetite Nanoparticles (MNs)
Iron oxide nanoparticles (magnetite, Fe3O4) were synthetized at 25 °C using a flow cell with parallel arrangement according to the procedure developed by Lozano et al. [19]. Eight low-carbon steel sheets (100 mm × 45 mm) of 1 mm thickness and 99.8% pure iron were used as electrodes. The polished plates were immersed in 0.04 mol L−1 NaCl. A peristaltic pump operating at a flow rate of 30 mL min−1 was used, and the total cell volume was 460 mL. A current of 700 mA was supplied by a PeakTech model 6080 A power source. The nanoparticles were collected via the magnetic precipitation method using a neodymium magnet placed at the bottom of the cell. The supernatant was discarded. The nanoparticles were washed several times with distilled water, collected with a magnet and then centrifuged at 9000 rpm for 15 min at room temperature. Drying was carried out in a vacuum system for a period of 24 h. The nanoparticles were stored in a nitrogen atmosphere.
2.3. Electrochemical Measurements
Measurements involving cyclic and square wave voltammetry techniques were recorded on an Autolab PGSTAT302N potentiostat/galvanostat (Metrohm AG, Herisau, Switzerland), controlled by Nova 11.1 software. Parameters such as potentials, frequency and sweep rates were varied to obtain the different voltammograms. A conventional three-electrode system was adopted using glassy carbon and a 10 mL glass cell.
A glassy carbon electrode (GCE) (Φ = 2.7 mm) was used as the substrate for the deposition of the different inks of the working electrode (WE), an Ag/AgCl/KCl(sat.) electrode was used as the reference electrode and a platinum helical electrode was used as the auxiliary electrode.
2.4. Preparation and Modification of the Electrocatalytic Surface
Nanoparticle inks of different compositions were added directly by means of drop coating to the vitreous carbon surface. The electrode was polished with 0.3 and 0.05 μm alumina powder for 10 min and carefully washed ultrasonically in absolute ethanol and water for 10 min each. The electrode was then rinsed with deionized water and dried. To prepare the ink, we used 1 mL of isopropyl alcohol:water (4:1) and 1 mg of magnetite nanoparticles, 4 mg of carbon and 15 µL of NAFION@ 117. Subsequently, we fixed the same amount of magnetite and NAFION@ 117 and varied the amount of carbon Vulcan, increasing to 6 and 8 mg. In other experiments, we kept the concentration of magnetite at 1 mg and carbon Vulcan at 4 mg and varied the amount of NAFION@ 117 (5, 10, 15 µL). Finally, we fixed the amount of NAFION at 5 µL and carbon Vulcan at 4 mg and varied the amount of magnetite (1, 2, 3, 5, 8, 10 mg). The mixture was solubilized for 10 min in an ultrasonic bath. Subsequently, the working electrode was prepared with 20 μL of the homogenized suspension dropped on the polished GCE and then dried overnight. The ratios of the sensor components that provided the best sensitivity were used for the detection of the three analytes.
2.5. Analytical Response
A phosphate-buffered solution (PBS) (0.10 mol L−1, pH 7.5) was used as a support electrolyte to evaluate the performance of different electrocatalytic surfaces. Additionally, pHs between 6 and 9 were studied. Sensor performance was tested by applying cyclic and square wave voltammetry in the presence and absence of DA, AA and UA at different concentrations in PBS. The procedure was performed in triplicate under continuous stirring. The measurements were carried out with each analyte individually or by adding the three analytes simultaneously.
The sensor performance in samples containing the analytes was evaluated by the following parameters: specificity/selectivity, linearity, sensitivity and detection limit (LOD). For this evaluation, the following equations were used: LOD = 3 SD/slope, linearity = 10 SD/slope and sensitivity = slope/S, where SD (n = 3) and S are the electrode surface.
Real samples of urine, orange juice and dopamine were used to determine the reliability of the constructed sensor.
3. Results and Discussion
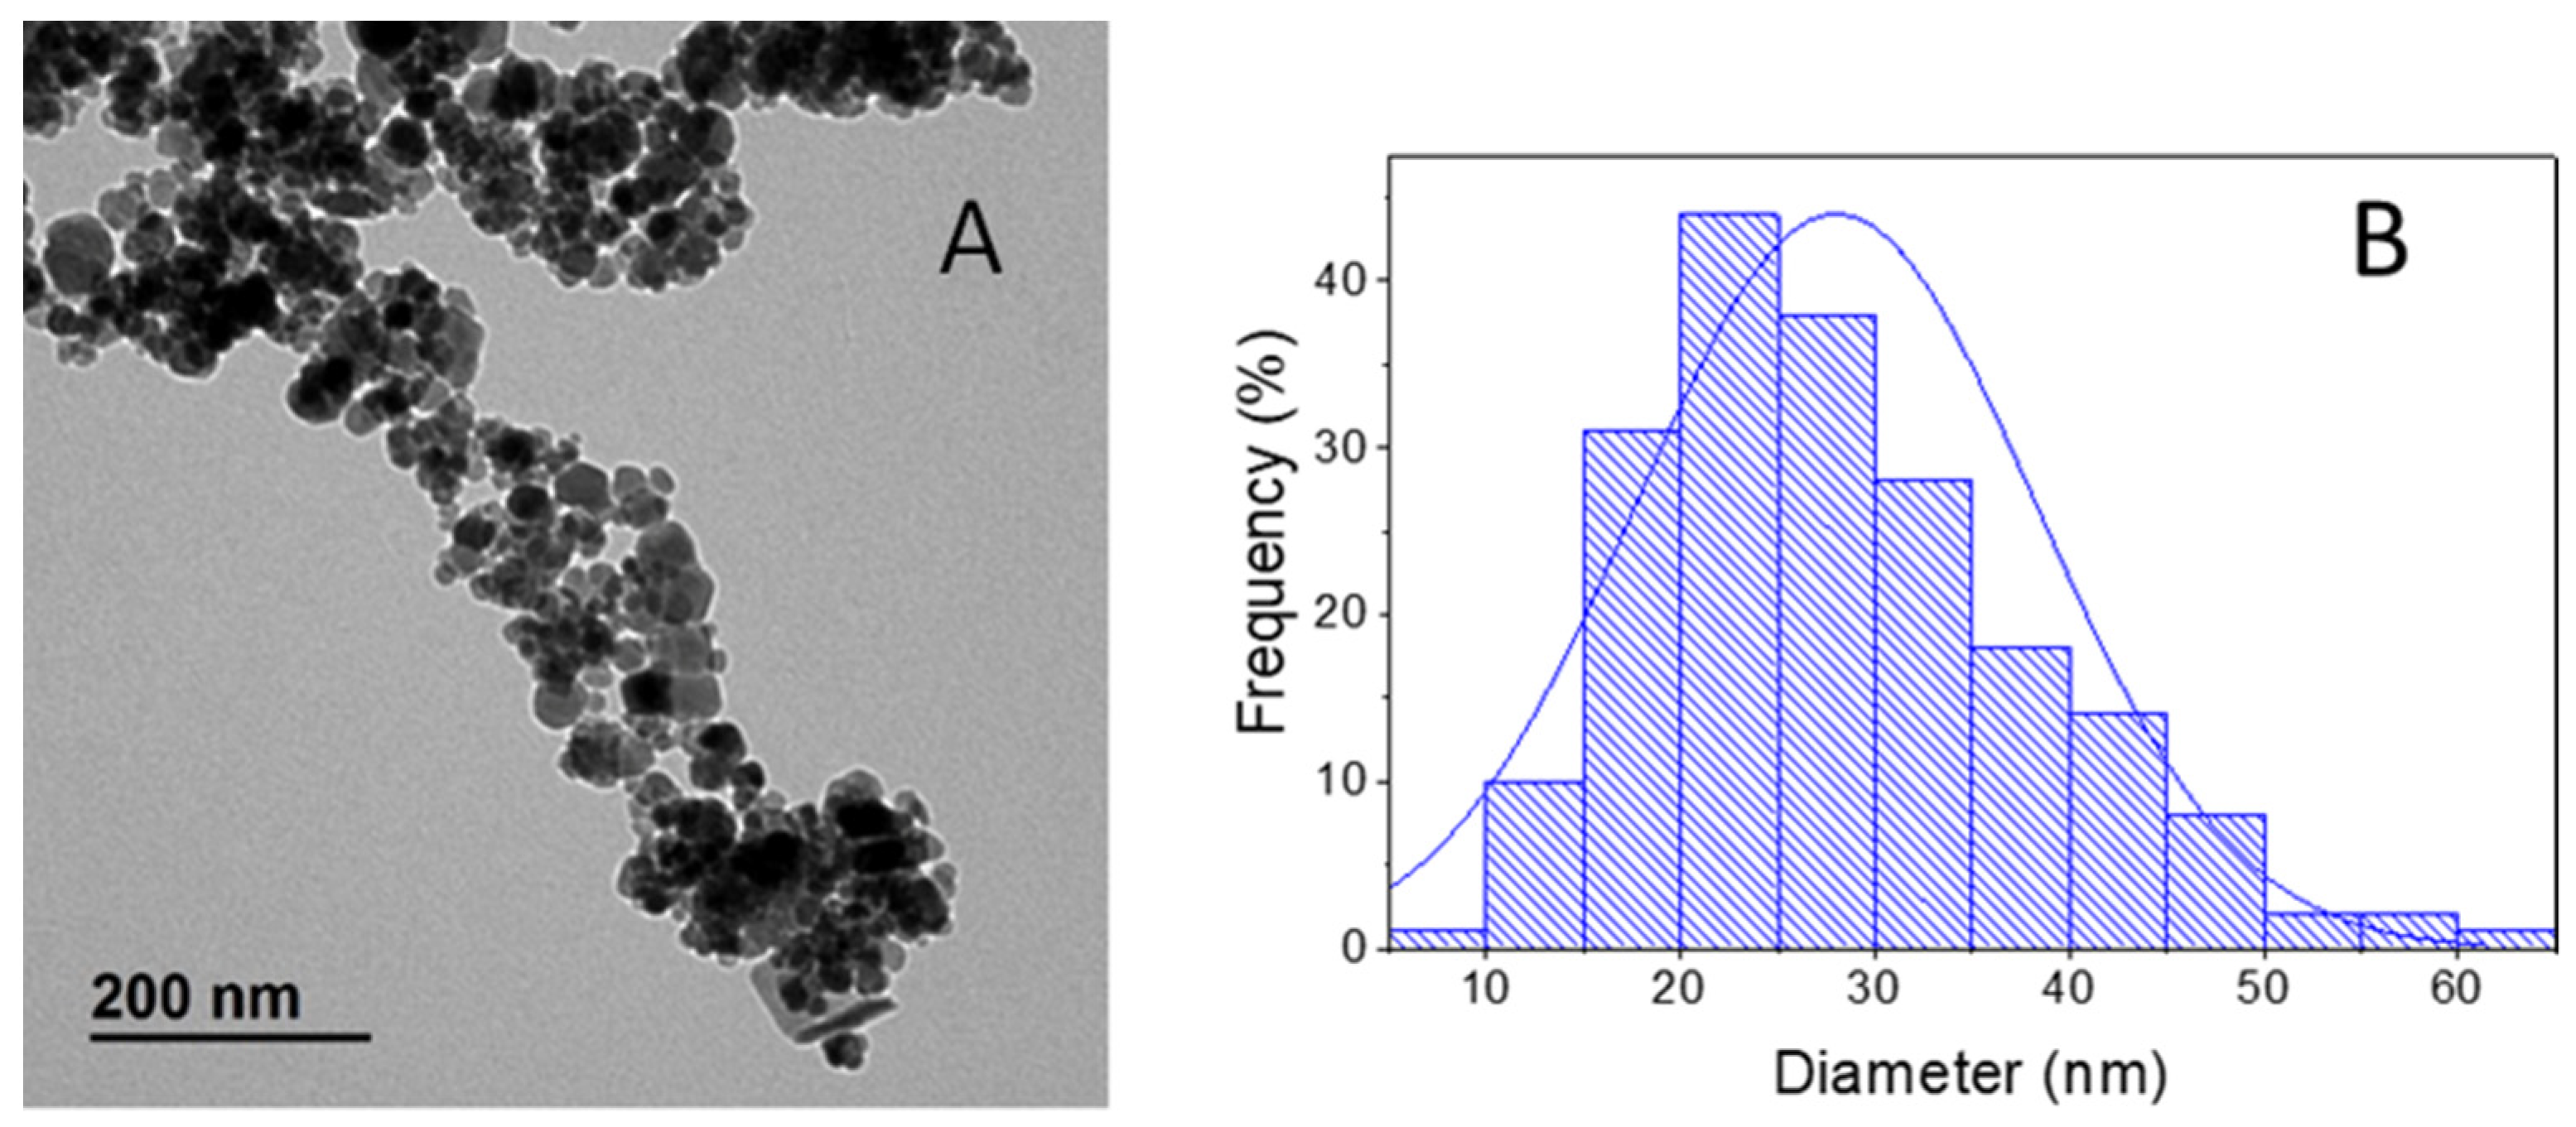
The electrochemically synthesized magnetite was characterized using different techniques. Figure 1A shows a transmission electron microscopy (TEM) micrograph where the nanoparticle size and spherical shape can be observed. By analyzing 200 nanoparticles using the program ImageJ, the histogram in Figure 1B shows that the size average was 29 ± 12 nm.
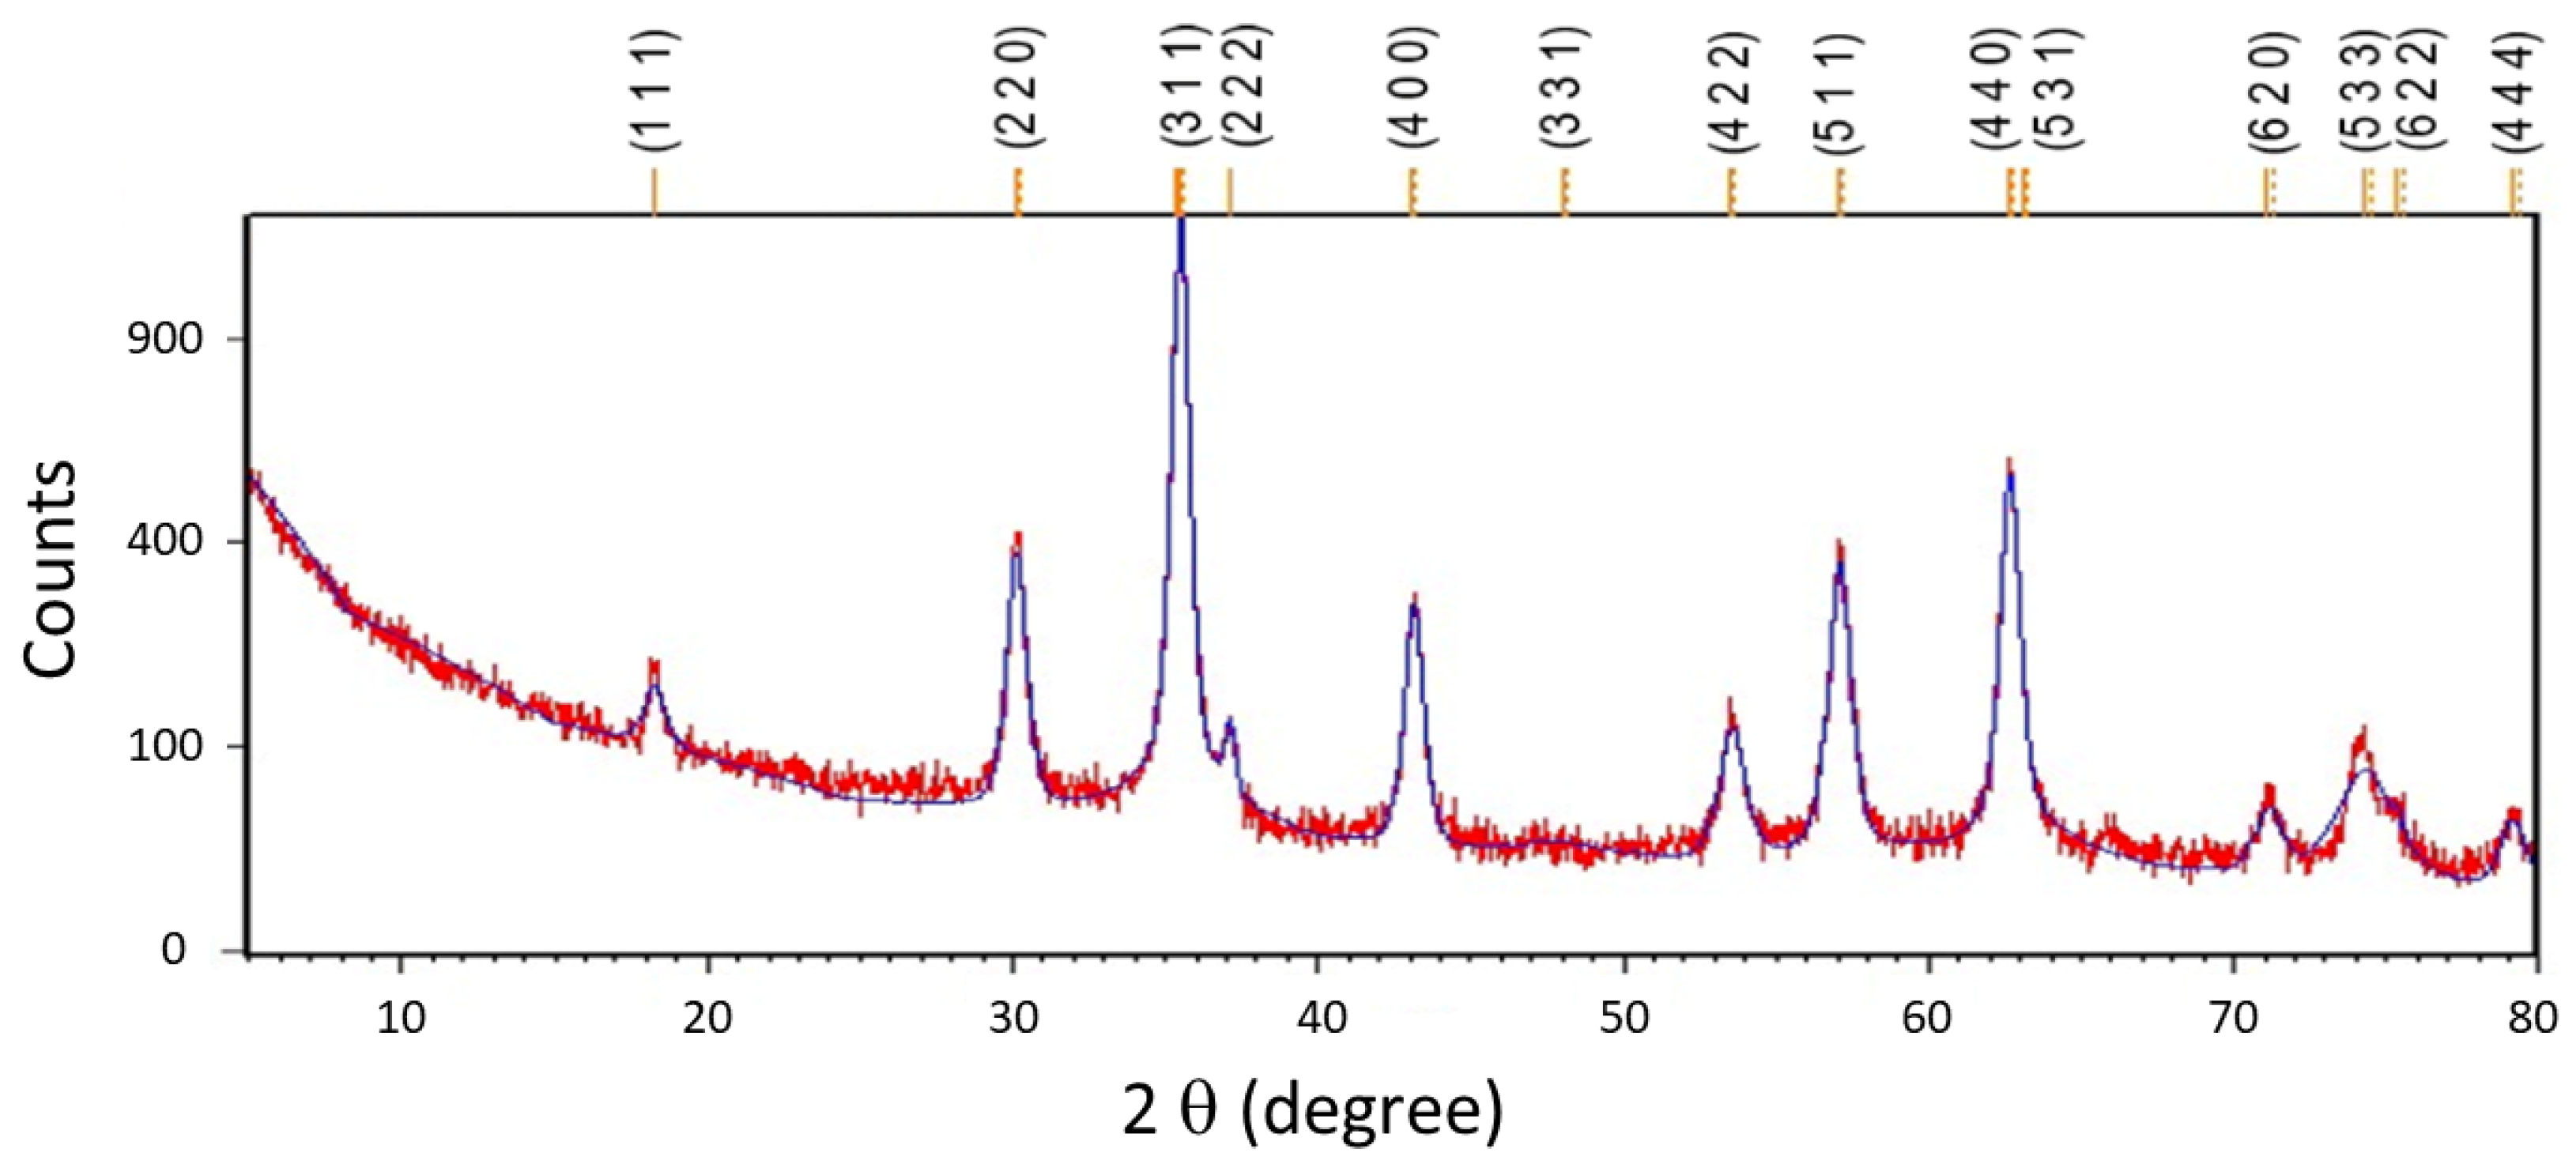
Figure 2 shows the X-ray diffractogram; all diffraction peaks match the standard JCPDS no. 01–089-5892 which corresponds to magnetite. No additional peaks are observed in the diffractogram.
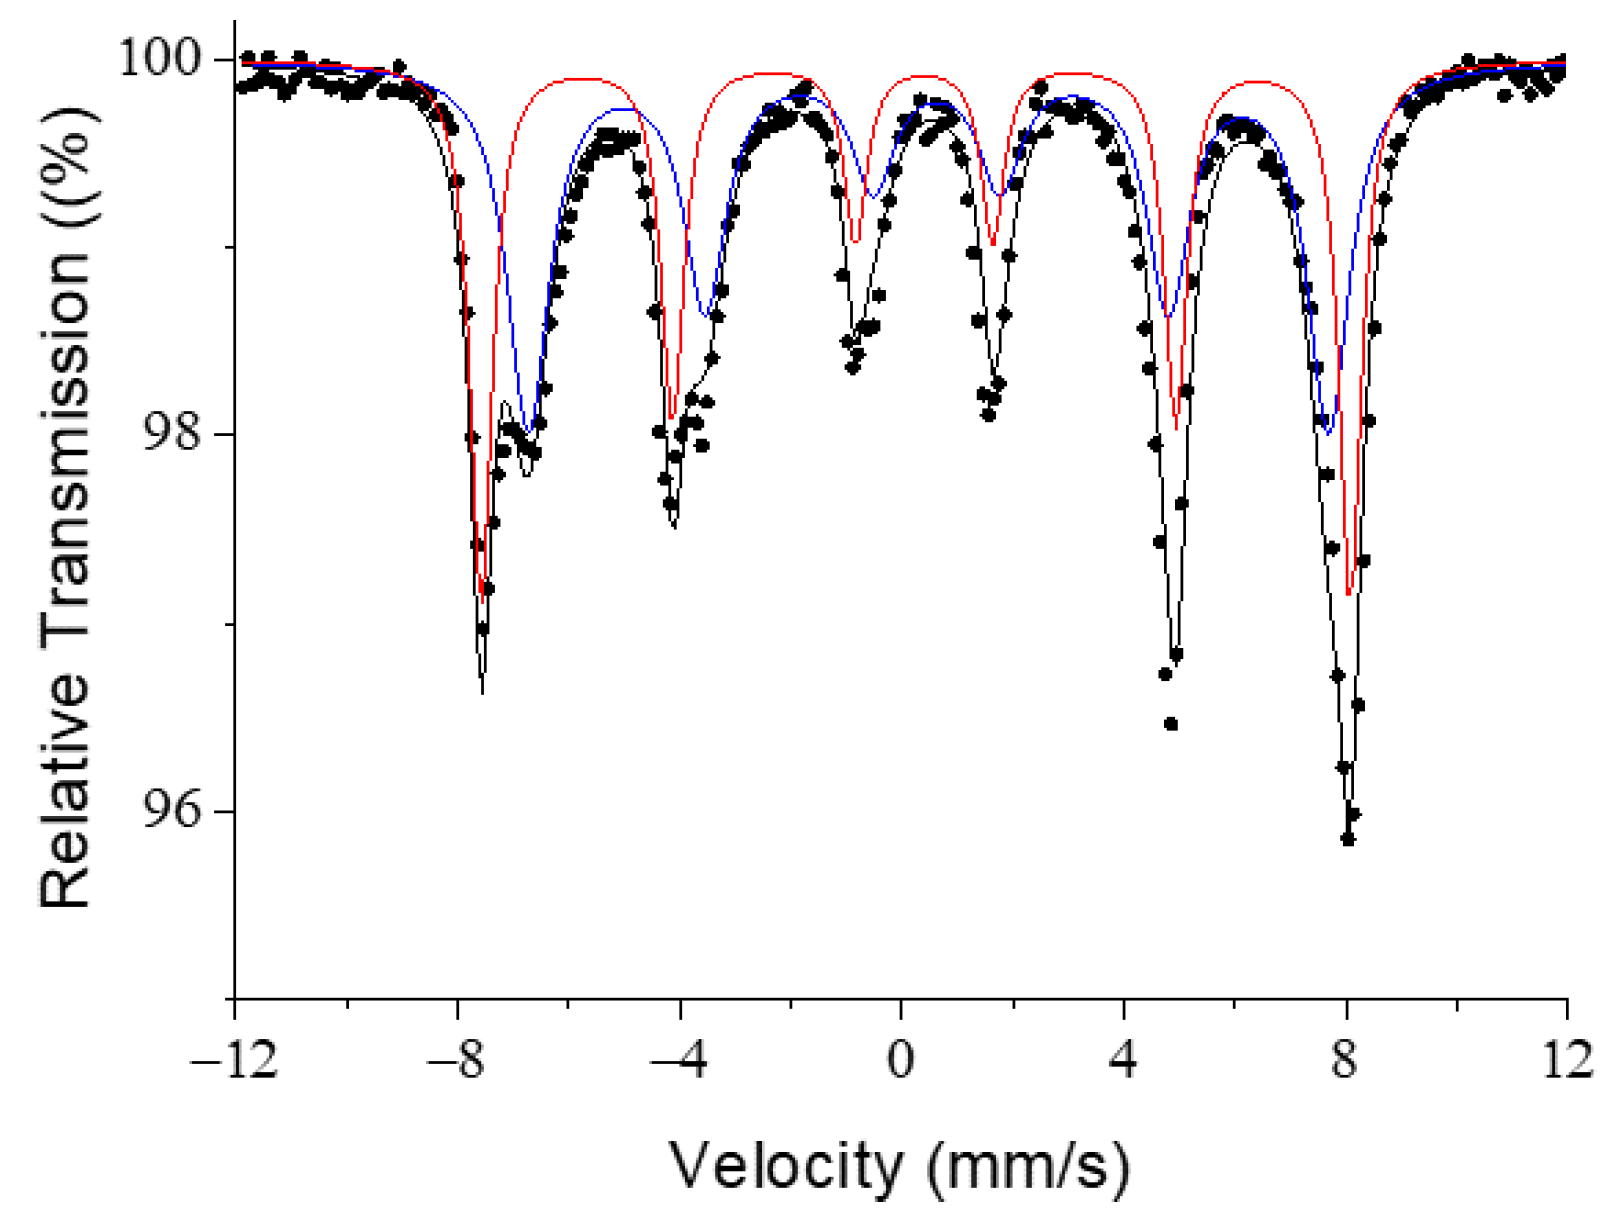
Figure 3 shows the room temperature Mössbauer spectrum for the electrosynthesized Fe3O4 sample. This spectrum is interpreted as the contribution of two sextets with a hyperfine magnetic field of H = 48.5 T (isomer shift, IS = 0.33 mm−1) and H = 44.6 T (IS = 0.52 mm−1), corresponding to Fe3+ located in the tetrahedral position (A) and Fe3+/Fe2+ located in the octahedral position (B) of the spinel structure of (AB2O4), respectively [20,21]. The hyperfine magnetic fields are slightly lower than those corresponding to the same material in a macroscopic size [22]. This spectrum corroborates the nanometric character of the particles and the absence of impurities in the sample.
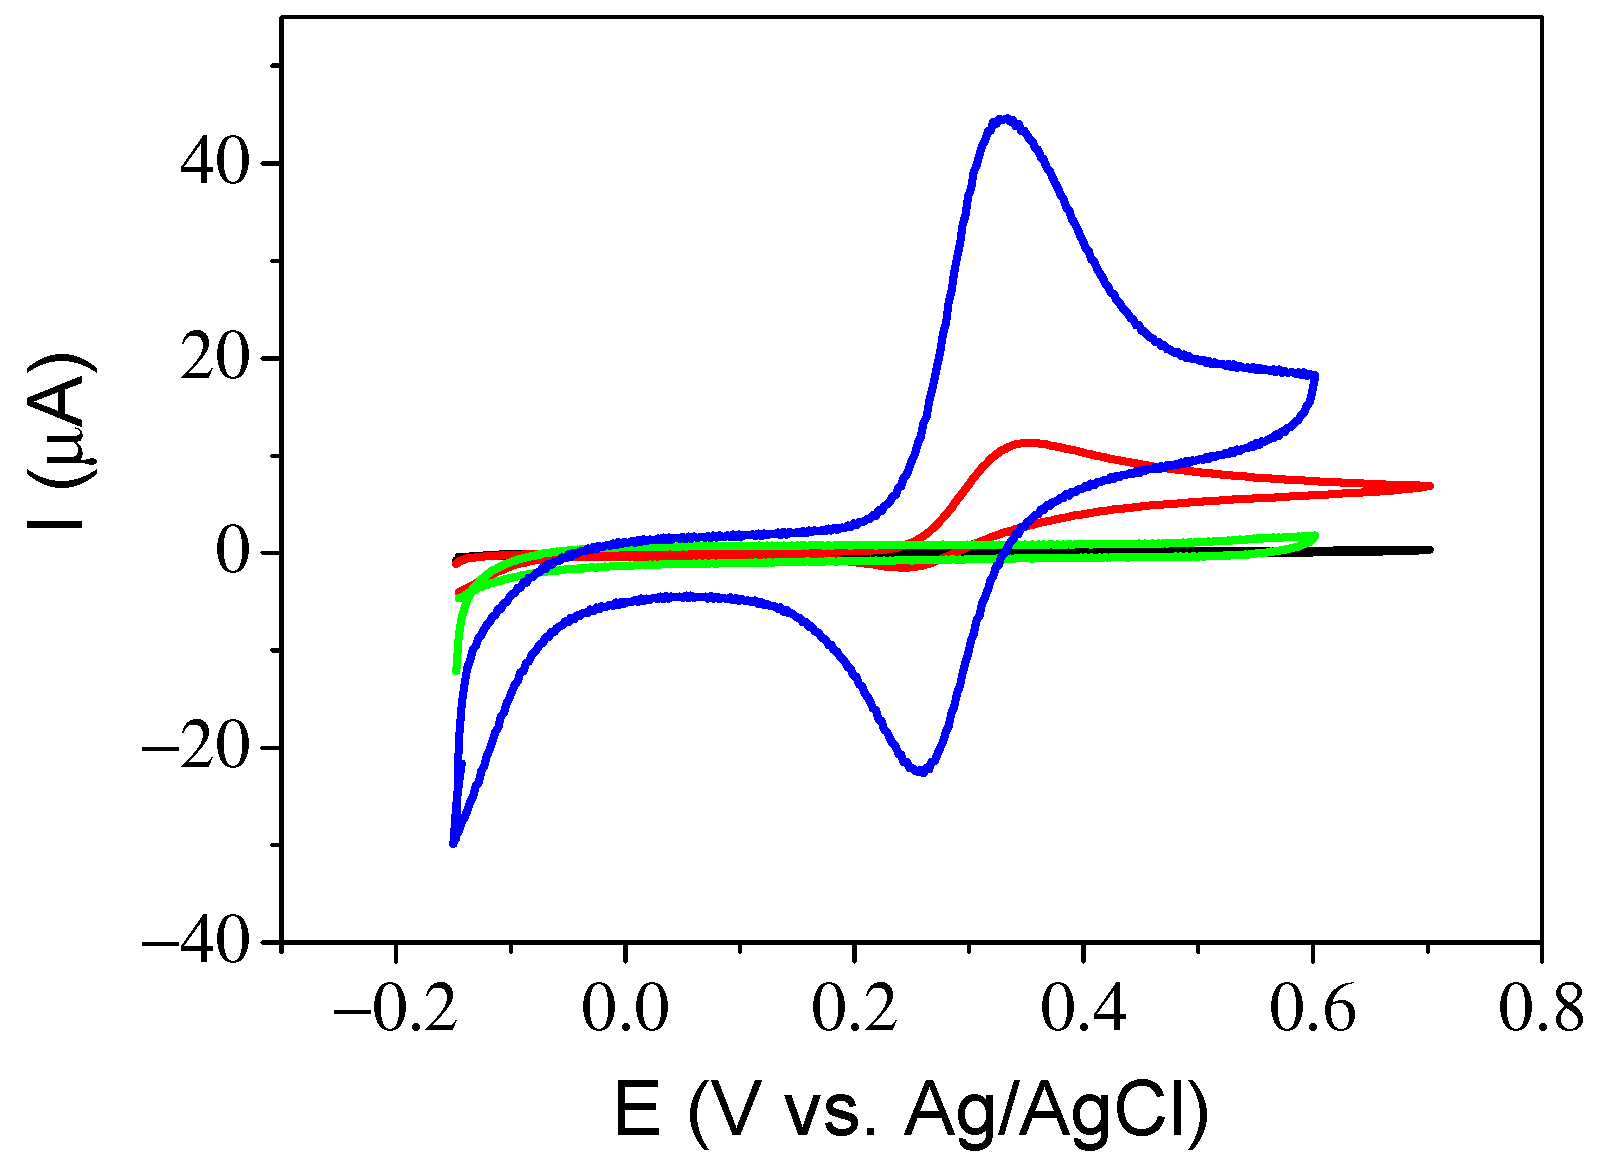
For the production of a sensor, it is necessary to analyze the best conditions with respect to the materials of which the sensor is composed. We first selected DA as the analyte and recorded the voltammetric curves in the presence and absence of DA while varying the different components of the catalytic ink. Figure 4 shows the voltammetric curves under different conditions. Both GC electrodes with and without magnetic nanoparticles (MNs) in 0.1 M PBS showed a negligible electrochemical signal. When 0.5 mM DA was added to PBS, peaks corresponding to the oxidation and reduction of DA appeared at 0.35 V (oxidation of DA) and 0.25 V (reduction of DA) vs. Ag/AgCl/KCl(sat.). The current of the electrode containing the MNs is almost 5 times higher than that without magnetite nanoparticles.
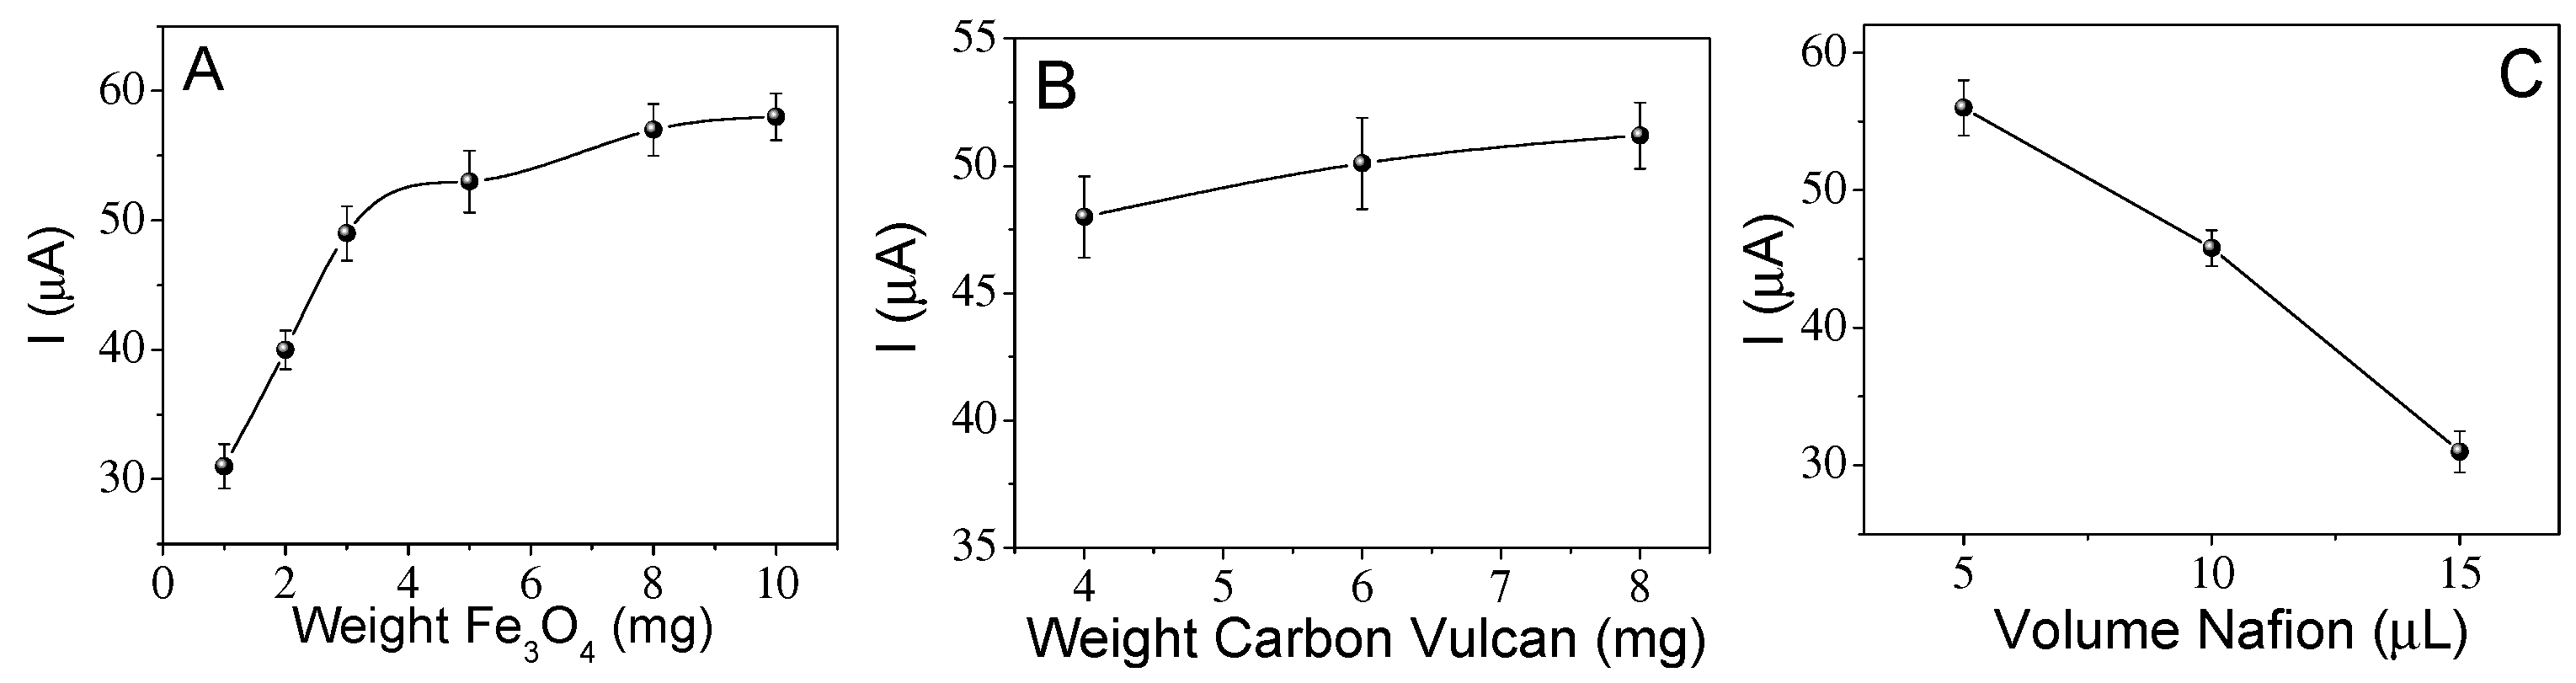
Figure 5A–C shows the current obtained for a solution of 0.1 M PBS and 0.5 mM DA, varying the amount of MNs, carbon and NAFION@ 117 in the ink. Initially, the experiment started with 1 mg of magnetite nanoparticles, 4 mg of carbon and 15 µL of NAFION@ 117. Subsequently, the amount of each of these was varied, fixing the amount to the best response found, as was explained in the experimental section. An increase in the amount of nanoparticles while keeping the other components constant produces an increase in the detection signal up to a value of approximately 8 mg of MNs, whereas an increase up to 10 mg does not produce a significant improvement in the signal, and so this amount of MNs was chosen (Figure 5A). In the case of the amount of Vulcan, as shown in Figure 5B, no great variation in detection is observed with its increase, so the least amount of carbon black Vulcan was used in order to reduce the cost of the sensor. Finally, Figure 5C shows the variation in the signal with the increase in the amount of NAFION@ 117, which is a nonconductive compound. An increase in NAFION@ 117 in the ink produces a clear decrease in the signal. The working conditions chosen for the preparation of the inks were 8 mg of magnetite nanoparticles, 4 mg of carbon black Vulcan and 5 µL of NAFION@ 117.
The influence of scan rates on the electrocatalytic response of the GCE/magnetite towards the analyte oxidation was studied.
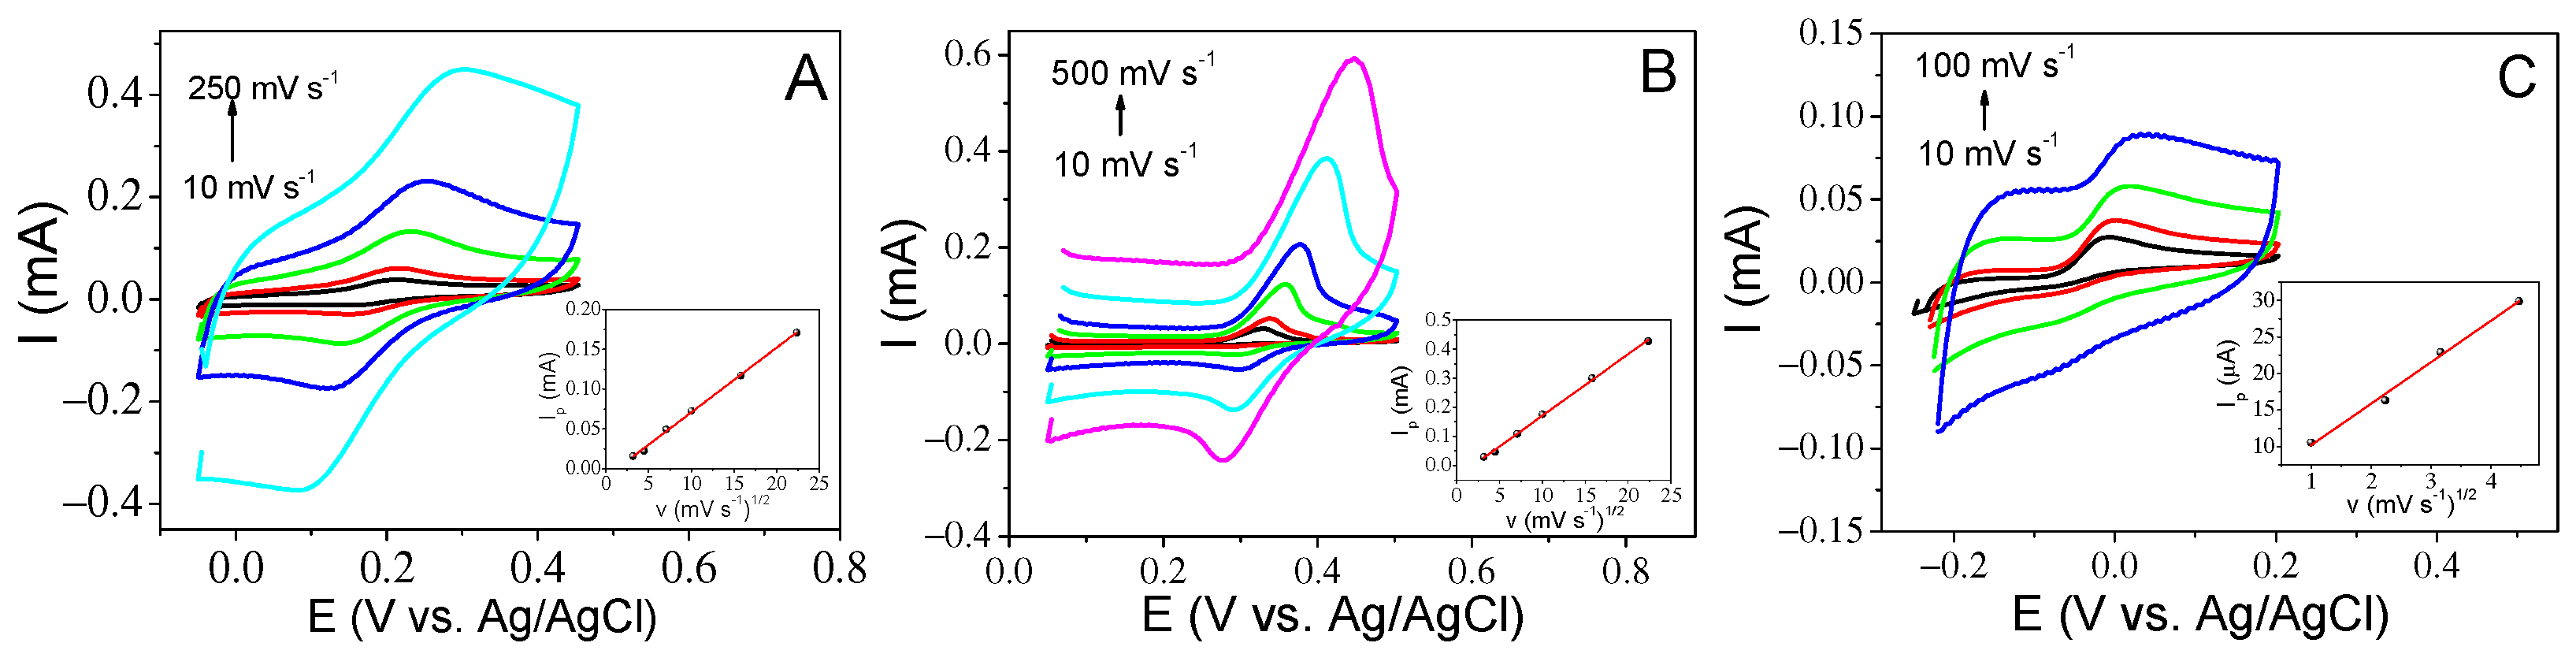
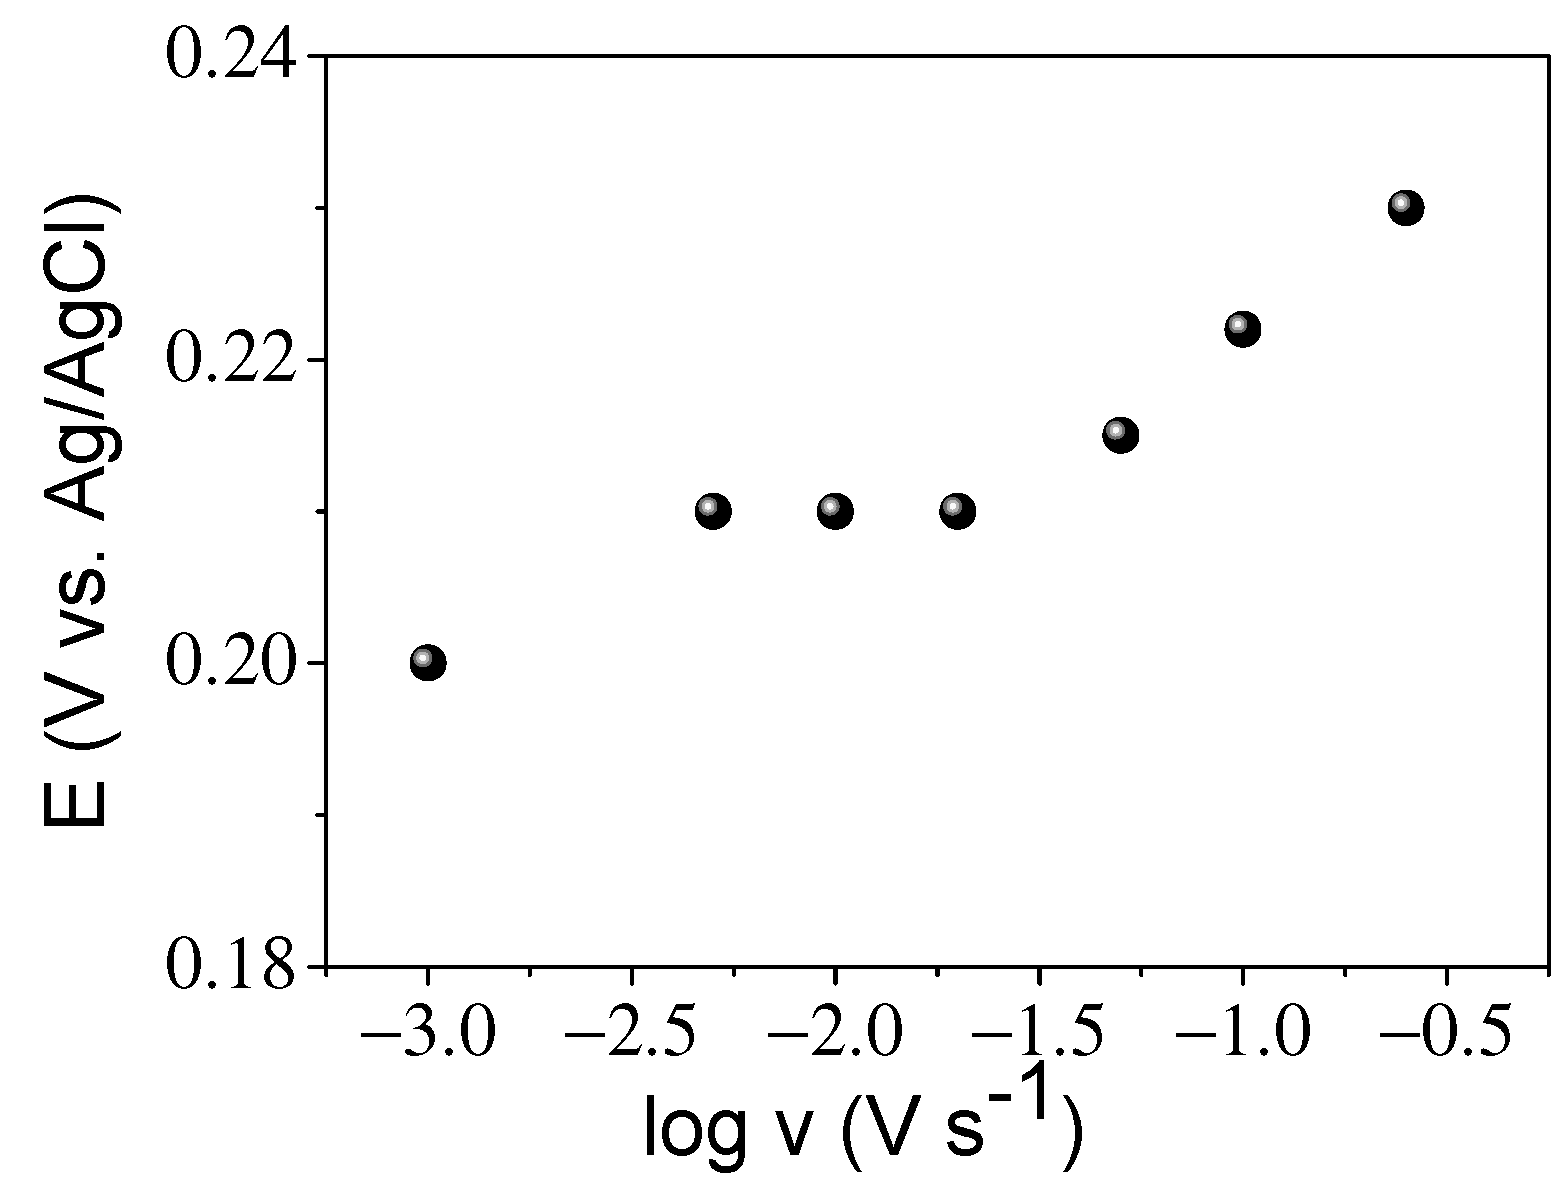
Figure 6A–C displays the voltammetric curves and the inset plots of the current versus v1/2. DA and UA were found to be diffusion-controlled processes and exhibited good linearity in both cases up to a 200 mV s−1 sweep rate. For AA, this linearity is reduced up to a scan rate of 100 mV s−1. The electron transfer coefficient for the anodic processes, αa, can be obtained by the plot of the redox peak potential versus the logarithm of the sweep rate. This calculation has been performed for the dopamine analyte. Figure 7 shows the almost linear behavior of the anodic peak potential (Epa) until 200 mV s−1 in the case of DA. If we use Laviron’s theory, the slope of this plot is equal to 2.3 RT/(αa)nF, where n is the number of electrons transferred, in our case two, T is the temperature and R and F are the conventional values of these constants. The calculated value of αa is approximately 0.4. This value should be 0.5 for a fully reversible process; this difference in value may be due to the process being quasi-reversible. This is also confirmed by the fact that an increase in the sweep rate produces an increase in the peak current as well as an increase in the potential separation of the anodic and cathodic peaks, (Figure 6). If the value of αa is substituted in Laviron’s equation (Equation (1)), the value of the electron transfer rate coefficient is 2.2 s−1. This value is higher than some reported values [23,24], with a more complicated structure and higher cost. In the case of UA and AA analytes, the process is much more irreversible, and it is not possible to calculate the kinetic parameters through the equations mentioned above.
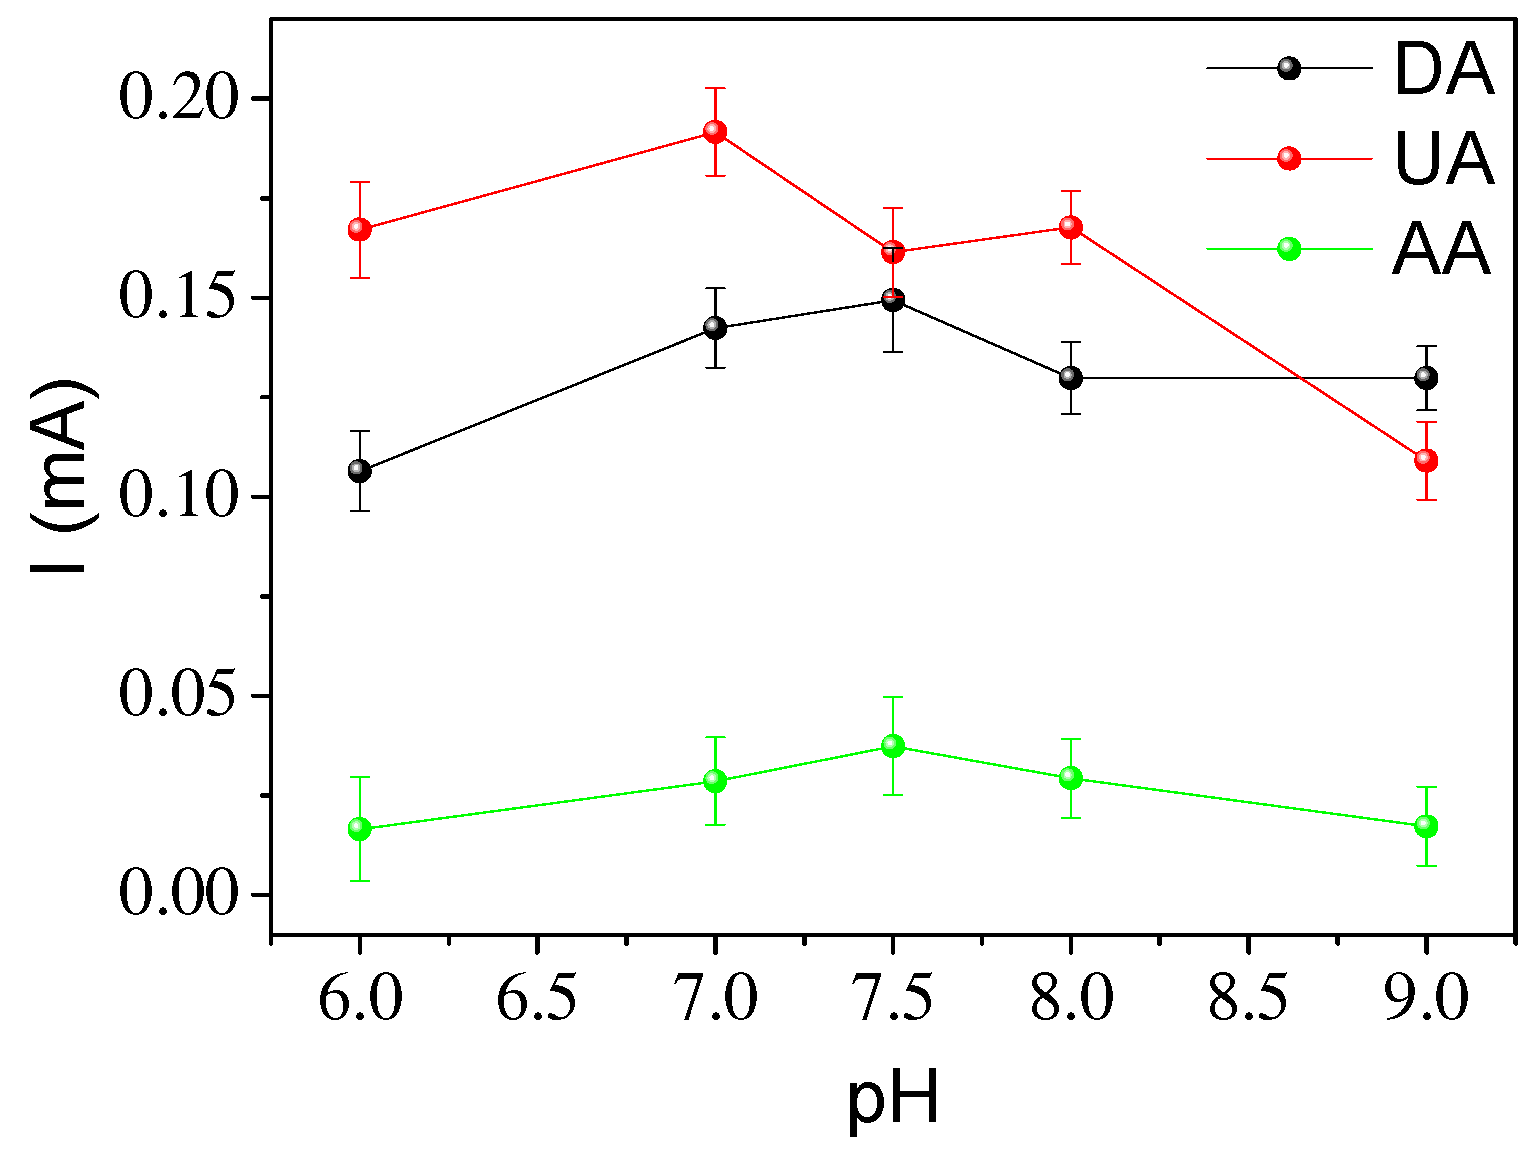
Another important parameter to take into account is the pH of the solution. To study this effect, the pH of the solution was adjusted from 6 to 9; lower pHs favor partial dissolution of magnetite in the medium [25]. Figure 8 shows that there is not a great variation in the detection signal with pH, but it can be observed that the current gradually decreases with increasing or decreasing pH; similar results have been obtained using Fe3O4 and nitrogen self-doped sunflower plate-derived carbon as an electrochemical sensor [26]. The best pH seems to be approximately 7.5 for uric and ascorbic acid and 7 for DA. Both pH values are optimal for measuring these analytes under physiological conditions. In addition, the oxidation peak potential in all cases decreases to more negative values with an increasing pH. The dependencies of Epa versus pH were found to be linear in the range of pH 6 to 8.0. The slope of the straight line is approximately 57 mV for the three analytes, which indicates the requirement of two electrons or two protons in the oxidation process following Nernstian behavior [27,28].
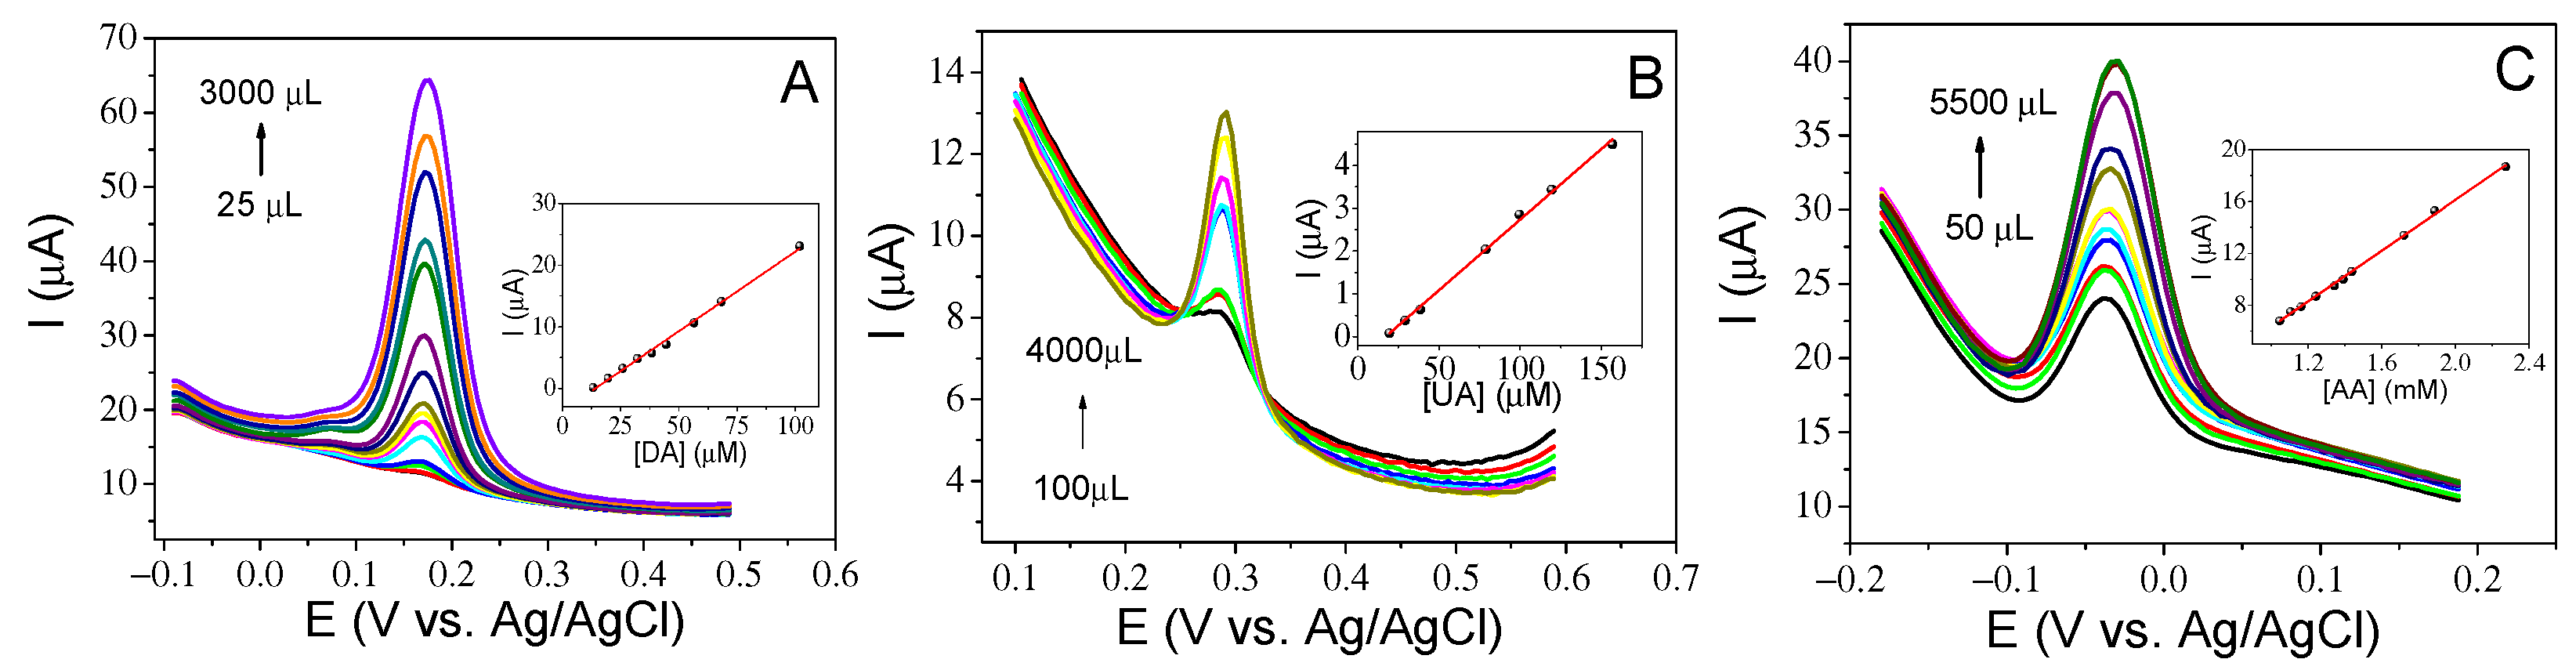
Figure 9A–C shows the SVW response of the sensor for different analyte concentrations and the inset plots of peak current versus analyte concentration. From these straight lines, the LOD, sensitivity and linear range of this sensor for the three analytes are calculated and represented in Table 1.
The values obtained with this sensor compared with those obtained with other sensors (Table 2) show that the sensor studied has good performance for the determination of uric acid and ascorbic acid, with lower detection limits for dopamine, although even in the latter case it is possible to determine dopamine in real samples within the required sensitivity range.
To evaluate the reproducibility of the GCE/magnetite sensor, a continuous measurement for a solution of 0.5 mM DA was carried out with the electrode, and a 30% loss of effectiveness was observed after 15 uses. On the other hand, a sensor was also used to measure the same concentration of DA at three different times and stored in two environments, either in air or in buffer. The results showed that the sensor left in buffer maintained its sensitivity and effectiveness after 24 h post-manufacture, while the sensor left in air suffered a 35% drop in effectiveness. This may be due to partial oxidation of the magnetite nanoparticles exposed to air for 24 h. Additionally, the loss in stability of fabricated sensors is attributed to the structure and robustness of them. Although it is a simple and inexpensive sensor, the non-coating of the nanoparticles can lead to its agglomeration and lower adhesion to the substrate after a high number of cycles of use [37,38].
To analyze the reliability of the sensor, it was applied to determine UA in urine, AA in orange juice and DA in an unknown test sample. Urine from three different individuals was used. Then, 150 μL of urine was diluted in 0.1 M PB electrolyte at pH 7.5, and the corresponding voltammogram was recorded via SWV. The results showed normal levels of UA between 1.4 and 4.4 mM in urine for a healthy human. An AA study was also performed on a sample of natural orange juice. Similarly, three dilutions were prepared by diluting 3.9 mL of the orange juice in 0.1 M PBS at pH 7.5 to a final volume of 5.0 mL. The results in the three cases were identical, indicating a concentration of ascorbic acid of 1.6 mM or 37 mg/100 mL, which agreed with that reported by the manufacturer. DA determination was performed in an unknown test sample by means of the sensor. The concentration of DA was 54 µM and the concentration of the test sample was 50 µM. A summary of these results is shown in Table 3.
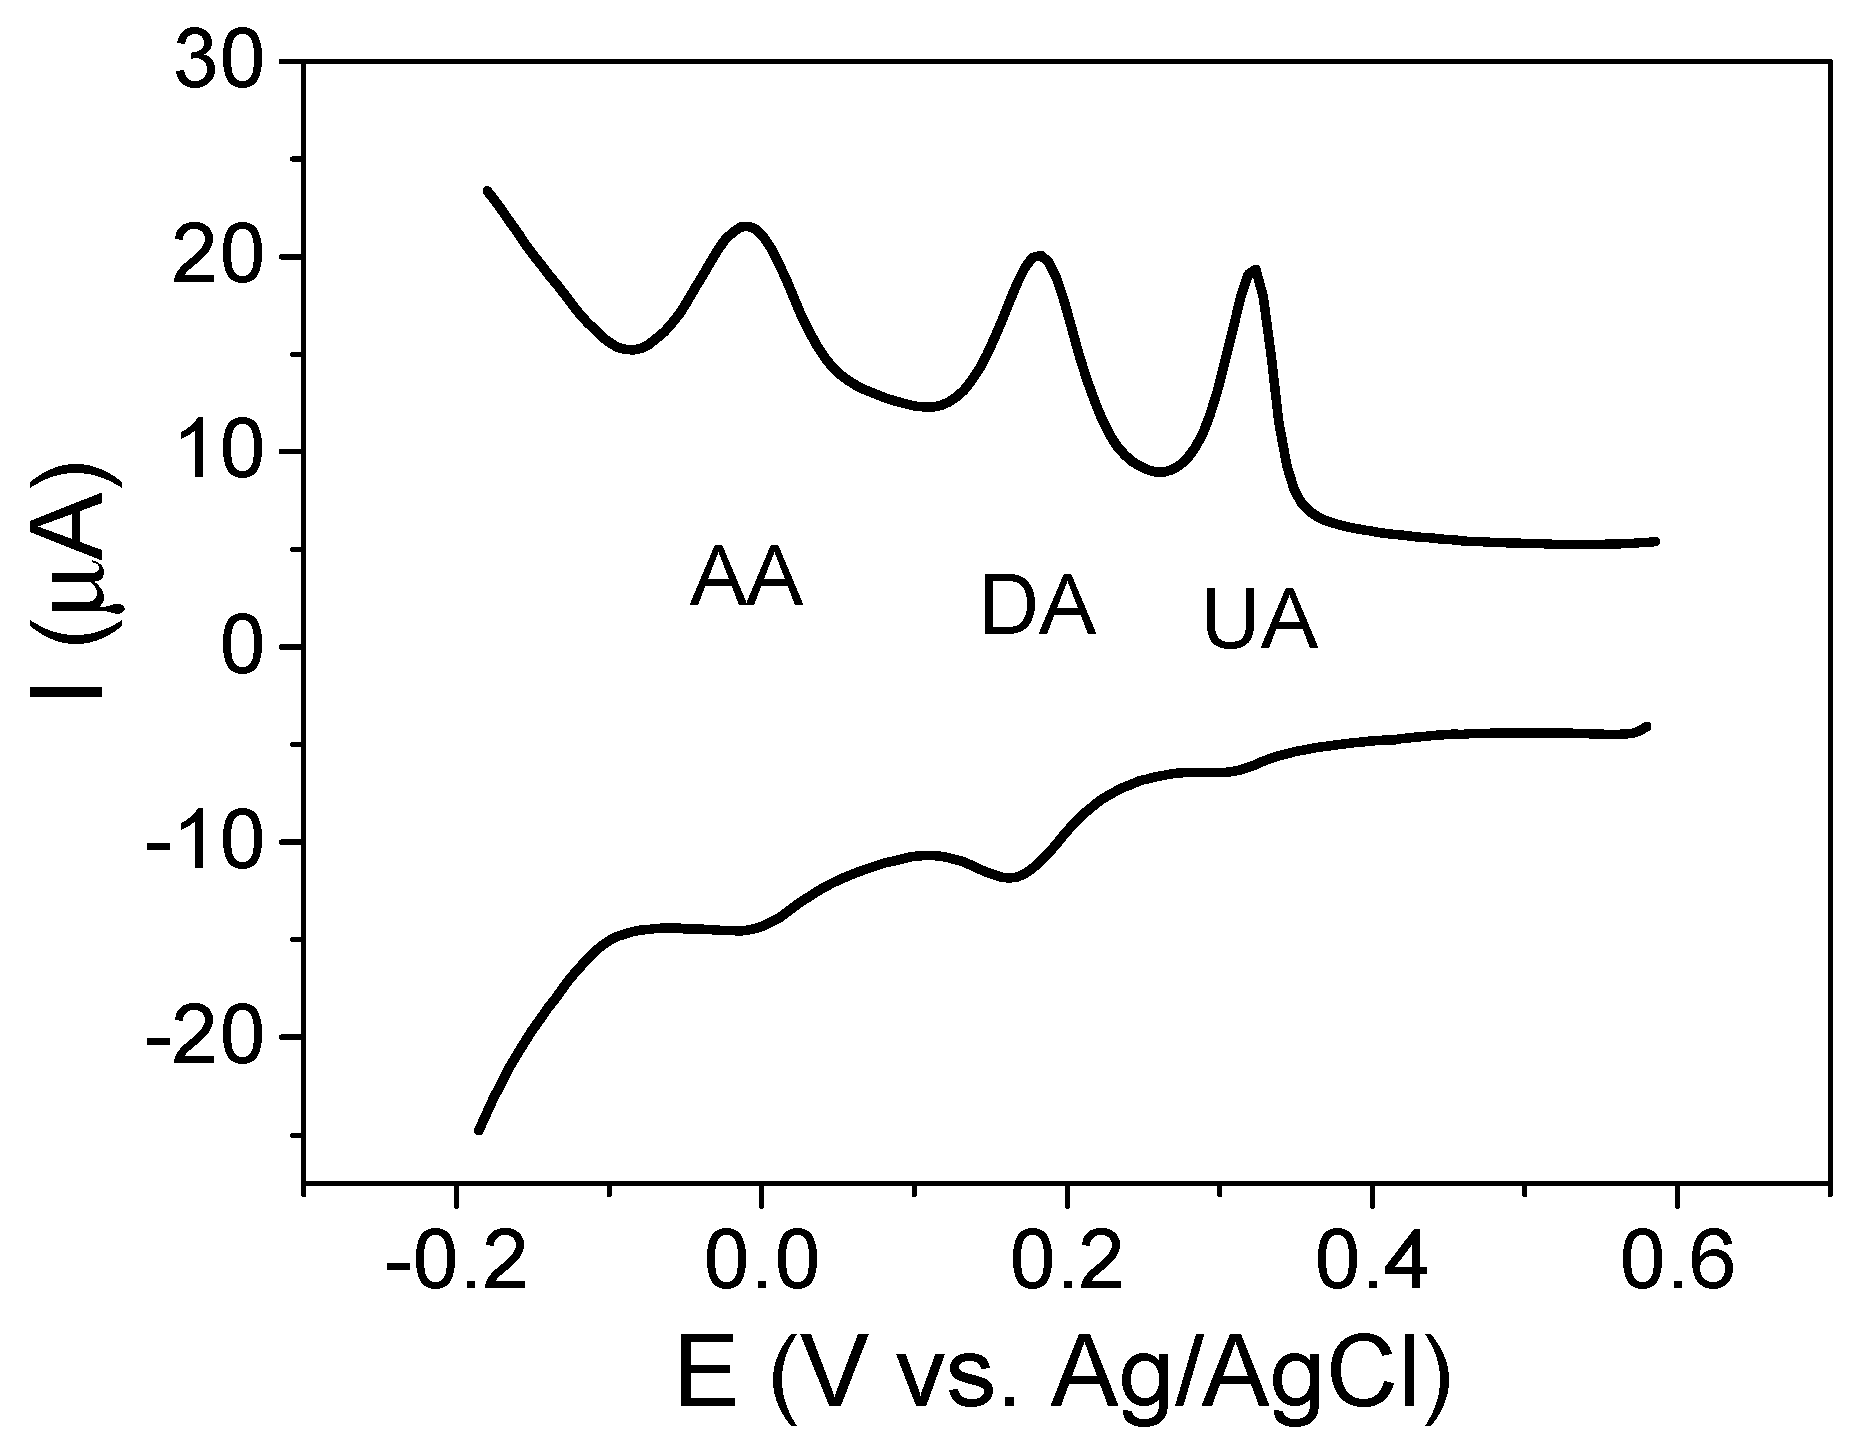
Finally, we evaluated the ability of the sensor to detect the three analytes simultaneously in the solution. Figure 10 shows the square wave voltammetry performed in a solution containing 50 µM DA, 75 µM UA and 2.25 mM AA. As seen, it is possible to quantitatively determine the three analytes, the potentials being sufficiently separated so that there is no interference between them, with potential values of 0.0, 0.195 and 0.32 V vs. Ag/AgCl/KCl(sat.) for AA, DA and UA, respectively.
4. Conclusions
The electrochemical sensor developed in this work with a very simple methodology showed good detection of dopamine, uric acid and ascorbic acid. The sensor composed of 8 mg of magnetite nanoparticles, 4 mg of carbon black Vulcan and 5 µL of NAFION@ 117 in a 1:4 solution of water:isopropanol provided the best results. The analytical properties of the electrochemical sensor were determined for each analyte by means of cyclic voltammetry and square wave voltammetry. The linear ranges of DA, UA and AA detection were 10–100, 20–160 and 1050–2300 µM, and the detection limits were 4.5, 14 and 95 µM, respectively. These values are comparable with other more complicated electrochemical sensors or biosensors. The sensor has shown good stability and reproducibility. In terms of stability, it is possible to use the same sensor at least 15 times with a 30% loss in sensitivity in the last use. Reproducibility is excellent for sensors kept in the buffer for more than one day, shown by repeating the measurement three times a day. However, if the sensor is kept in air, it suffers a loss of sensitivity of at least 35% of the initial sensitivity value. It is possible to use the sensor in the simultaneous determination of all three analytes in simulated solutions as well as in real samples.
Author Contributions
Conceptualization, P.H. and E.G.; methodology, P.H. and E.G.; software, E.M.; validation, P.H. and E.G.; formal analysis, E.G. and P.H.; investigation, E.G.; data curation, N. Menendez, P.H. and E.M.; writing—original draft preparation, P.H. and N.M.; writing—review and editing, P.H., N.M. and E.M.; supervision, P.H.; funding acquisition, P.H. All authors have read and agreed to the published version of the manuscript.
Funding
This research was funded by Ministerio de Ciencia e Innovación, grant number PID2021-123431OB-I00.
Institutional Review Board Statement
Not applicable.
Informed Consent Statement
Not applicable.
Data Availability Statement
Not applicable.
Conflicts of Interest
The authors declare no conflict of interest.
References
- Kong, D.; Zhuang, Q.; Han, Y.; Xu, L.; Wang, Z.; Jiang, L.; Su, J.; Lu, C.-H.; Chi, Y. Simultaneous Voltammetry Detection of Dopamine and Uric Acid in Human Serum and Urine with a Poly(Procaterol Hydrochloride) Modified Glassy Carbon Electrode. Talanta 2018, 185, 203–212. [Google Scholar] [CrossRef]
- Carrera, V.; Sabater, E.; Vilanova, E.; Sogorb, M. A Simple and Rapid HPLC-MS Method for the Simultaneous Determination of Epinephrine, Norepinephrine, Dopamine and 5-Hydroxytryptamine: Application to the Secretion of Bovine Chromaffin Cell Cultures. J. Chromatogr. B Analyt. Technol. Biomed. Life Sci. 2007, 847, 88–94. [Google Scholar] [CrossRef] [PubMed]
- Xu, X.; Zhang, H.; Shi, H.; Ma, C.; Cong, B.; Kang, W. Determination of Three Major Catecholamines in Human Urine by Capillary Zone Electrophoresis with Chemiluminescence Detection. Anal. Biochem. 2012, 427, 10–17. [Google Scholar] [CrossRef]
- Naccarato, A.; Gionfriddo, E.; Sindona, G.; Tagarelli, A. Development of a Simple and Rapid Solid Phase Microextraction-Gas Chromatography–Triple Quadrupole Mass Spectrometry Method for the Analysis of Dopamine, Serotonin and Norepinephrine in Human Urine. Anal. Chim. Acta 2014, 810, 17–24. [Google Scholar] [CrossRef] [PubMed]
- Zhou, X.; Zheng, N.; Hou, S.; Li, X.; Yuan, Z. Selective Determination of Dopamine in the Presence of Ascorbic Acid at a Multi-Wall Carbon Nanotube-Poly(3,5-Dihydroxy Benzoic Acid) Film Modified Electrode. J. Electroanal. Chem. 2010, 642, 30–34. [Google Scholar] [CrossRef]
- Dayton, M.A.; Ewing, A.G.; Wightman, R.M. Response of Microvoltammetric Electrodes to Homogeneous Catalytic and Slow Heterogeneous Charge-Transfer Reactions. Anal. Chem. 1980, 52, 2392–2396. [Google Scholar] [CrossRef]
- Ensafi, A.A.; Taei, M.; Khayamian, T. A Differential Pulse Voltammetric Method for Simultaneous Determination of Ascorbic Acid, Dopamine, and Uric Acid Using Poly (3-(5-Chloro-2-Hydroxyphenylazo)-4,5-Dihydroxynaphthalene-2,7-Disulfonic Acid) Film Modified Glassy Carbon Electrode. J. Electroanal. Chem. 2009, 633, 212–220. [Google Scholar] [CrossRef]
- Yusoff, N.; Pandikumar, A.; Ramaraj, R.; Lim, H.N.; Huang, N.M. Gold Nanoparticle Based Optical and Electrochemical Sensing of Dopamine. Microchim. Acta 2015, 182, 2091–2114. [Google Scholar] [CrossRef]
- Nguyen, N.T.; Özkan, S.; Tomanec, O.; Zhou, X.; Zboril, R.; Schmuki, P. Nanoporous AuPt and AuPtAg Alloy Co-Catalysts Formed by Dewetting-Dealloying on Ordered TiO2 Nanotube Surface Lead to Significantly Enhanced Photocatalytic H2 Generation. J. Mater. Chem. A 2018, 6, 13599. [Google Scholar] [CrossRef]
- Oliveira, T.M.B.F.; Morais, S. New Generation of Electrochemical Sensors Based on Multi-Walled Carbon Nanotubes. Appl. Sci. 2018, 8, 1925. [Google Scholar] [CrossRef]
- Gao, L.; Lian, C.; Zhou, Y.; Yan, L.; Li, Q.; Zhang, C.; Chen, L.; Chen, K. Graphene Oxide–DNA Based Sensors. Biosens. Bioelectron. 2014, 60, 22–29. [Google Scholar] [CrossRef] [PubMed]
- Foroughi, F.; Rahsepar, M.; Kim, H. A Highly Sensitive and Selective Biosensor Based on Nitrogen-Doped Graphene for Non-Enzymatic Detection of Uric Acid and Dopamine at Biological PH Value. J. Electroanal. Chem. 2018, 827, 34–41. [Google Scholar] [CrossRef]
- Keerthi, M.; Boopathy, G.; Chen, S.-M.; Chen, T.-W.; Lou, B.-S. A Core-Shell Molybdenum Nanoparticles Entrapped f-MWCNTs Hybrid Nanostructured Material Based Non-Enzymatic Biosensor for Electrochemical Detection of Dopamine Neurotransmitter in Biological Samples. Sci. Rep. 2019, 9, 13075. [Google Scholar] [CrossRef] [PubMed] [Green Version]
- Zhihua, L.; Xue, Z.; Xiaowei, H.; Xiaobo, Z.; Jiyong, S.; Yiwei, X.; Xuetao, H.; Yue, S.; Xiaodong, Z. Hypha-Templated Synthesis of Carbon/ZnO Microfiber for Dopamine Sensing in Pork. Food Chem. 2021, 335, 127646. [Google Scholar] [CrossRef]
- Liu, P.; Lu, K.; Li, J.; Wu, X.; Qian, L.; Wang, M.; Gao, S. Effect of Aging on Adsorption Behavior of Polystyrene Microplastics for Pharmaceuticals: Adsorption Mechanism and Role of Aging Intermediates. J. Hazard. Mater. 2019, 384, 121193. [Google Scholar] [CrossRef]
- Comba, F.N.; Rubianes, M.D.; Herrasti, P.; Rivas, G.A. Glucose Biosensing at Carbon Paste Electrodes Containing Iron Nanoparticles. Sens. Actuators B Chem. 2010, 149, 306–309. [Google Scholar] [CrossRef]
- Jaime, J.; Rangel, G.; Muñoz-Bonilla, A.; Mayoral, A.; Herrasti, P. Magnetite as a Platform Material in the Detection of Glucose, Ethanol and Cholesterol. Sens. Actuators B Chem. 2017, 238, 693–701. [Google Scholar] [CrossRef]
- Tripathy, A.; Nine, M.J.; Silva, F.S. Biosensing Platform on Ferrite Magnetic Nanoparticles: Synthesis, Functionalization, Mechanism and Applications. Adv. Colloid Interface Sci. 2021, 290, 102380. [Google Scholar] [CrossRef]
- Lozano, I.; López, C.; Menendez, N.; Casillas, N.; Herrasti, P. Design, Construction and Evaluation of a 3D Printed Electrochemical Flow Cell for the Synthesis of Magnetite Nanoparticles. J. Electrochem. Soc. 2018, 165, H688–H697. [Google Scholar] [CrossRef]
- Franger, S.; Berthet, P.; Dragos, O.; Baddour-Hadjean, R.; Bonville, P.; Berthon, J. Large Influence of the Synthesis Conditions on the Physico-Chemical Properties of Nanostructured Fe3O4. J. Nanopart. Res. 2007, 9, 389–402. [Google Scholar] [CrossRef]
- Cornell, R.M.; Schwermann, U. The Iron Oxides: Structure, Properties, Reactions, Occurences and Uses; Crystal Structure; Wiley-VCH Verlang GmbH & Co.KGaA: Weinheim, Germany, 2003; pp. 9–38. [Google Scholar]
- Greenwood, N.N.; Gibb, T.C. Mössbauer Spectroscopy; Chapman and Hall: London, UK, 1971. [Google Scholar]
- Sun, W.; Wang, Y.; Zhang, Y.; Ju, X.; Li, G.; Sun, Z. Poly(Methylene Blue) Functionalized Graphene Modified Carbon Ionic Liquid Electrode for the Electrochemical Detection of Dopamine. Anal. Chim. Acta 2012, 751, 59–65. [Google Scholar] [CrossRef] [PubMed]
- Peik-See, T.; Pandikumar, A.; Nay-Ming, H.; Hong-Ngee, L.; Sulaiman, Y. Simultaneous Electrochemical Detection of Dopamine and Ascorbic Acid Using an Iron Oxide/Reduced Graphene Oxide Modified Glassy Carbon Electrode. Sensors 2014, 14, 15227–15243. [Google Scholar] [CrossRef] [PubMed]
- Salmimies, R.; Mannila, M.; Kallas, J.; Häkkinen, A. Acidic Dissolution of Magnetite: Experimental Study on the Effects of Acid Concentration and Temperature. Clays Clay Miner. 2011, 59, 136–146. [Google Scholar] [CrossRef]
- Gao, P.; Huang, Y.; Zhang, Y.; Sun, Q.; Ruan, S.; Yin, W.; Pu, H.; Yin, M.; Fa, H. Simultaneous Electrochemical Detection of Ascorbic Acid, Dopamine and Uric Acid Using the Composite Materials of Fe3O4 and Nitrogen Self-Doped Sunflower Plate-Derived Carbon. Nano 2021, 16, 2150127. [Google Scholar] [CrossRef]
- Tkach, V.V.; Ivanushko, Y.G.; Lukanova, S.M.; Kushnir, M.V.; de Oliveira, S.C.; Ojani, R.; Luganska, O.V.; Yagodynets’, P.I. Evaluación teórica del desempeño del electrodo, modificado por el oxihidróxido de cobalto (III) en la detección del ácido úrico TT—Theoretical evaluation of the work of the electrode, modified by cobalt (III) oxyhydroxide, in the uric acid detection. Rev. Colomb. Cienc. Químico Farm. 2018, 47, 289–300. [Google Scholar] [CrossRef] [Green Version]
- Wang, L.; Pan, L.; Han, X.; Ha, M.N.; Li, K.; Yu, H.; Zhang, Q.; Li, Y.; Hou, C.; Wang, H. A Portable Ascorbic Acid in Sweat Analysis System Based on Highly Crystalline Conductive Nickel-Based Metal-Organic Framework (Ni-MOF). J. Colloid Interface Sci. 2022, 616, 326–337. [Google Scholar] [CrossRef]
- Zou, H.L.; Li, B.L.; Luo, H.Q.; Li, N.B. 0D-2D Heterostructures of Au Nanoparticles and Layered MoS2 for Simultaneous Detections of Dopamine, Ascorbic Acid, Uric Acid, and Nitrite. Sens. Actuators B Chem. 2017, 253, 352–360. [Google Scholar] [CrossRef]
- Joshi, A.; Schuhmann, W.; Nagaiah, T.C. Mesoporous Nitrogen Containing Carbon Materials for the Simultaneous Detection of Ascorbic Acid, Dopamine and Uric Acid. Sens. Actuators B Chem. 2016, 230, 544–555. [Google Scholar] [CrossRef]
- Zhang, L.; Feng, J.; Chou, K.C.; Su, L.; Hou, X. Simultaneously Electrochemical Detection of Uric Acid and Ascorbic Acid Using Glassy Carbon Electrode Modified with Chrysanthemum-like Titanium Nitride. J. Electroanal. Chem. 2017, 803, 11–18. [Google Scholar] [CrossRef]
- Song, H.; Xue, G.; Zhang, J.; Wang, G.; Ye, B.C.; Sun, S.; Tian, L.; Li, Y. Simultaneous Voltammetric Determination of Dopamine and Uric Acid Using Carbon-Encapsulated Hollow Fe3O4 Nanoparticles Anchored to an Electrode Modified with Nanosheets of Reduced Graphene Oxide. Microchim. Acta 2017, 184, 843–853. [Google Scholar] [CrossRef]
- Rosli, A.R.M.; Noorashikin, M.S.; Yusoff, F. Electrochemical Sensor Based on Reduced Graphene Oxide Incorporated with Magnetite and Silver Nanoparticles Composite Electrode for Determination of Dopamine. J. Electrochem. Soc. 2021, 168, 087512. [Google Scholar] [CrossRef]
- Liu, M.; Chen, Q.; Lai, C.; Zhang, Y.; Deng, J.; Li, H.; Yao, S. A Double Signal Amplification Platform for Ultrasensitive and Simultaneous Detection of Ascorbic Acid, Dopamine, Uric Acid and Acetaminophen Based on a Nanocomposite of Ferrocene Thiolate Stabilized Fe3O4@Au Nanoparticles with Graphene Sheet. Biosens. Bioelectron. 2013, 48, 75–81. [Google Scholar] [CrossRef]
- Ensafi, A.A.; Arashpour, B.; Rezaei, B.; Allafchian, A.R. Voltammetric Behavior of Dopamine at a Glassy Carbon Electrode Modified with NiFe2O44 Magnetic Nanoparticles Decorated with Multiwall Carbon Nanotubes. Mater. Sci. Eng. C 2014, 39, 78–85. [Google Scholar] [CrossRef] [PubMed]
- Veera Manohara Reddy, Y.; Sravani, B.; Agarwal, S.; Gupta, V.K.; Madhavi, G. Electrochemical Sensor for Detection of Uric Acid in the Presence of Ascorbic Acid and Dopamine Using the Poly(DPA)/SiO2@Fe3O4 Modified Carbon Paste Electrode. J. Electroanal. Chem. 2018, 820, 168–175. [Google Scholar] [CrossRef]
- Gabunada, J.C.; Vinothkannan, M.; Kim, D.H.; Kim, A.R.; Yoo, D.J. Magnetite Nanorods Stabilized by Polyaniline/Reduced Graphene Oxide as a Sensing Platform for Selective and Sensitive Non-Enzymatic Hydrogen Peroxide Detection. Electroanalysis 2019, 31, 1507–1516. [Google Scholar] [CrossRef]
- Comba, F.N.; Rubianes, M.D.; Cabrera, L.; Gutiérrez, S.; Herrasti, P.; Rivas, G.A. Highly Sensitive and Selective Glucose Biosensing at Carbon Paste Electrodes Modified with Electrogenerated Magnetite Nanoparticles and Glucose Oxidase. Electroanalysis 2010, 22, 1566–1572. [Google Scholar] [CrossRef]
Figure 1.
(A) TEM image of magnetite nanoparticles synthesized electrochemically and (B) histogram analysis of particle size distribution.
Figure 1.
(A) TEM image of magnetite nanoparticles synthesized electrochemically and (B) histogram analysis of particle size distribution.

Figure 2.
XRD diffractogram of electrosynthesized magnetite nanoparticles. The observed (red) and calculated (blue) patterns are shown.
Figure 2.
XRD diffractogram of electrosynthesized magnetite nanoparticles. The observed (red) and calculated (blue) patterns are shown.

Figure 3.
Mössbauer spectrum for magnetite nanoparticles at room temperature. Fe is in the tetrahedral (red line) position and octahedral (blue line) position.
Figure 3.
Mössbauer spectrum for magnetite nanoparticles at room temperature. Fe is in the tetrahedral (red line) position and octahedral (blue line) position.

Figure 4.
Cyclic voltammogram at GC electrode in 0.1 M PBS (black), GCE/magnetite in 0.1 M PBS (green), GCE in 0.1 M PBS containing 0.5 mM DA (red) and GCE/magnetite in 0.1 M PBS containing 0.5 mM DA (blue); scan rate 50 mV s−1.
Figure 4.
Cyclic voltammogram at GC electrode in 0.1 M PBS (black), GCE/magnetite in 0.1 M PBS (green), GCE in 0.1 M PBS containing 0.5 mM DA (red) and GCE/magnetite in 0.1 M PBS containing 0.5 mM DA (blue); scan rate 50 mV s−1.

Figure 5.
Effect of the amperometric response with (A) amount of the magnetite, (B) amount of carbon Vulcan and (C) volume of NAFION@ 117 in the ink.
Figure 5.
Effect of the amperometric response with (A) amount of the magnetite, (B) amount of carbon Vulcan and (C) volume of NAFION@ 117 in the ink.

Figure 6.
(A) CV curves of PBS 0.1 M with 0.50 mM DA, (B) CV curves of PBS 0.1 M with 0.50 mM UA and (C) CV curves of PBS 0.1 M with 2.00 mM AA at various rates from 10 to 500 mV s−1 (inset: plot of peak current vs. square root of scan rates).
Figure 6.
(A) CV curves of PBS 0.1 M with 0.50 mM DA, (B) CV curves of PBS 0.1 M with 0.50 mM UA and (C) CV curves of PBS 0.1 M with 2.00 mM AA at various rates from 10 to 500 mV s−1 (inset: plot of peak current vs. square root of scan rates).

Figure 7.
Epa versus the logarithm of scan rate.

Figure 8.
Effect of pH on the peak current at the same concentration of DA, UA and AA as in Figure 6. Scan rate: 50 mV s−1.
Figure 8.
Effect of pH on the peak current at the same concentration of DA, UA and AA as in Figure 6. Scan rate: 50 mV s−1.

Figure 9.
Square wave voltammetry curves of (A) DA from 25 to 3000 µL, corresponding to 10–100 µM, (B) UA from 100 to 4000 µL, corresponding to 20–160 µM and (C) AA from 50 to 5500 µL, corresponding to 1050–2300 µM in a 0.1 M PBS (inset: plot of the Ip vs. the concentration of analyte).
Figure 9.
Square wave voltammetry curves of (A) DA from 25 to 3000 µL, corresponding to 10–100 µM, (B) UA from 100 to 4000 µL, corresponding to 20–160 µM and (C) AA from 50 to 5500 µL, corresponding to 1050–2300 µM in a 0.1 M PBS (inset: plot of the Ip vs. the concentration of analyte).

Figure 10.
SWV of GCE/magnetite electrode in PBS 0.1 M containing AA 2.25 mM, DA 50 µM and UA 75 µM.
Figure 10.
SWV of GCE/magnetite electrode in PBS 0.1 M containing AA 2.25 mM, DA 50 µM and UA 75 µM.


Table 1.
Parameters characteristic of the GCE/magnetite sensor for the three analytes.
| Properties | DA | UA | AA |
|---|---|---|---|
| Epa (mV) | 175 | 290 | −30 |
| Lineal range (µM) | 10–100 | 20–160 | 1050–2300 |
| LOD (µM) | 4.5 | 14 | 95 |
| Sensitivity (µA µM−1) | 0.26 | 0.003 | 0.0098 |
Table 2.
Comparison of results using different electrodes.
| Modification of GCE | Analyte | Lineal Range (µM) | LOD (µM) |
|---|---|---|---|
| Au nanoparticles MoS2 nanosheets [29] | Dopamine | 5.0–200.0 | 1.0 |
| Uric acid | 20.0–400.0 | 5.0 | |
| Ascorbic acid | 20.0–300.0 | 3.0 | |
| Carbon materials doped with nitrogen (MNC) [30] | Dopamine | 0.001–300 | 0.001 |
| Uric acid | 0.01–100 | 0.01 | |
| Ascorbic acid | 1–700 | 0.01 | |
| Titanium nitride [31] | Uric acid | 10–300 | 0.28 |
| Ascorbic acid | 50–1500 | 1.52 | |
| Fe3O4 Graphene oxide [32] | Dopamine | 0.1–150 | 0.053 |
| Uric acid | 1.00–100 | 0.41 | |
| Fe3O4 Ag nanoparticles Graphene oxide reduced [33] | Dopamine | 0.015–100 | 3.98 × 10⁻³ |
| Fe3O4@Au Phenylethynylferrocene thiolate Graphene/chitosan [34] | Dopamine | 0.5–50 | 0.1 |
| Uric acid | 1–90 | 0.2 | |
| Ascorbic acid | 6–350 | 1 | |
| NiFe2O4 Carbon nanotubes [35] | Dopamine | 0.05–100 | 0.02 |
| Fe3O4 Graphene oxide reduced [24] | Dopamine | 0.5–100 | 0.12 |
| Ascorbic acid | (1–9) × 103 | 0.42 | |
| Nanocomposite SiO2@Fe3O4 Poli-DPA [36] | Uric acid | 1.2–1.8 | 0.4 |
| Fe3O4 Nitrogen carbon [26] | Dopamine | 5–450 | 0.48 |
| Uric acid | 15–1200 | 1.48 | |
| Ascorbic acid | 3–150 | 1.0 |
Table 3.
Determination of the three analytes by measuring each sample three times.
| Samples | 1 | 2 | 3 |
|---|---|---|---|
| Urine/mM | 1.4 | 4.0 | 4.4 |
| Orange juice/mM | 1.6 | 1.6 | 1.6 |
| Dopamine/µM | 55 | 53 | 54 |
Disclaimer/Publisher’s Note: The statements, opinions and data contained in all publications are solely those of the individual author(s) and contributor(s) and not of MDPI and/or the editor(s). MDPI and/or the editor(s) disclaim responsibility for any injury to people or property resulting from any ideas, methods, instructions or products referred to in the content. |
© 2023 by the authors. Licensee MDPI, Basel, Switzerland. This article is an open access article distributed under the terms and conditions of the Creative Commons Attribution (CC BY) license (https://creativecommons.org/licenses/by/4.0/).
Share and Cite
MDPI and ACS Style
Gaya, E.; Menendez, N.; Mazario, E.; Herrasti, P. Fe3O4-Nanoparticle-Modified Sensor for the Detection of Dopamine, Uric Acid and Ascorbic Acid. Chemosensors 2023, 11, 79. https://0-doi-org.brum.beds.ac.uk/10.3390/chemosensors11020079
AMA Style
Gaya E, Menendez N, Mazario E, Herrasti P. Fe3O4-Nanoparticle-Modified Sensor for the Detection of Dopamine, Uric Acid and Ascorbic Acid. Chemosensors. 2023; 11(2):79. https://0-doi-org.brum.beds.ac.uk/10.3390/chemosensors11020079
Chicago/Turabian StyleGaya, Eduardo, Nieves Menendez, Eva Mazario, and Pilar Herrasti. 2023. "Fe3O4-Nanoparticle-Modified Sensor for the Detection of Dopamine, Uric Acid and Ascorbic Acid" Chemosensors 11, no. 2: 79. https://0-doi-org.brum.beds.ac.uk/10.3390/chemosensors11020079
Note that from the first issue of 2016, this journal uses article numbers instead of page numbers. See further details here.