Article

Gas and Liquid Chromatography Mass Spectrometry as a Tool for Elucidating Volatile Organic Compounds (VOCs) and Metabolites in Maternal Milk: A Perspective on Infants’ Health Risk Assessment

by
Evangelia N. Tzanetou
1,*,
Electra Manea-Karga
2,
Eirini Baira
2,
Theodora Boutsikou
3,
Zoi Iliodromiti
3,
Nicoletta Iacovidou
3,
Kyriaki Machera
2 and
Konstantinos M. Kasiotis
2,*
1
Laboratory of Chemical Control of Pesticides, Benaki Phytopathological Institute, 8 Stefanou Delta Str., 14561 Athens, Greece
2
Laboratory of Pesticides’ Toxicology, Benaki Phytopathological Institute, 8 Stefanou Delta Str., 14561 Athens, Greece
3
Neonatal Department, Aretaieio Hospital, Medical School, National and Kapodistrian University of Athens, 11528 Athens, Greece
*
Authors to whom correspondence should be addressed.
Submission received: 21 December 2023 / Revised: 16 February 2024 / Accepted: 19 February 2024 / Published: 21 February 2024

Abstract

:
Maternal milk is pivotal for infants’ nutrition. It also portrays the chemical burden to which the mother has been exposed. One of the chemical families that is prevalent and related to potential toxic effects are volatile organic compounds (VOCs). In the present study, motivated by the scarcity of works dealing with concomitant VOC and metabolite determination in maternal milk, two new gas/liquid chromatography tandem mass spectrometry (GC-MS/MS, LC-MS/MS) methods for the simultaneous measurement of 25 VOCs and 9 of their metabolites, respectively, in maternal milk were developed and applied to 20 maternal milk samples collected from mothers in Greece. In parallel, a headspace solid-phase microextraction (HS-SPME)–GC-MS method was employed for the untargeted screening of chemicals. Low detection rates for benzene, toluene, styrene and p,m-xylenes, and three of their metabolites, namely N-acetyl-S-(benzyl)-L-cysteine (BMA, metabolite of toluene), 3-methylhippuric (3-MHA, metabolite of xylenes) and mandelic acid (MA as DL and R isomers, metabolites of styrene and ethylbenzene), were evidenced in concentrations varying from <lower limit of quantification (LLOQ) to 0.79 ng mL−1. HS-SPME–GC-MS disclosed the presence of common maternal milk constituents such as fatty acids. Nevertheless, bisphenol-A, bisphenol derivatives and phthalates were also detected. The infants’ health risk assessment demonstrated a low risk and negligible carcinogenic risk, yet the detection of these compounds should not be underestimated.

1. Introduction

Human (maternal) milk is an important source of nutrients and antibodies for newborns and infants; the World Health Organization (WHO) and public health officials have recognized and promoted it as the most beneficial source of nourishment during infancy and recommend exclusive breastfeeding during the first six months [1]. The systematic monitoring of national breastfeeding rates and the duration of breastfeeding is not carried out annually in Greece [2]; recent data from a Greek research center, the “Institute of Child Health”, showed that slight improvements have been recorded in breastfeeding rates during the last few years in Greece [3]. Despite its proven benefits that compensate for any potential risks, maternal milk is susceptible to the accumulation of chemicals that enter the maternal body.
Among them, VOCs are low-molecular-weight compounds with a relatively low boiling point, broadly found in the environment, but they are also abundant in household settings. These lipophilic substances originate from a variety of natural and anthropogenic sources, including craft materials, personal care products, industrial emissions, car exhaust, printing shops, furnishing materials, pesticides, tobacco smoke, etc. [4]. As a result of their widespread use and physicochemical properties, they are transferred to the soil, air, water, plants, animals and humans [4,5]. Due to their wide occurrence (ambient and indoor air), VOCs pose threats to human health and are of controversial toxicity, with great interest regarding their exposure among humans and animals. It is well established that exposure to VOCs in sufficient quantities can cause eye, nose and throat irritations, headaches and dizziness and can produce adverse effects on the central nervous system (CNS) in both adults and children [6,7]. In more extreme cases, chronic exposure to some VOCs has been associated with an increased risk for cancer in animals and humans [8]. The toxicological profiles of several VOCs have been reviewed by the International Agency for Research on Cancer (IARC). Among them, particular attention is given to benzene, 1,3-butadiene and trichloroethylene due to their known classification as carcinogens, while acrylamide, acrylonitrile, N,N-dimethylformamide, ethylbenzene, isoprene and styrene are classified as probable/possible human carcinogens according to the IARC. Furthermore, acrolein, crotonaldehyde, toluene and xylene are classified as category 3 carcinogens (i.e., inadequate evidence) [4]. Indicatively, the limit value in the air for the protection of human health for benzene is set at 5 μg m−3 as a calendar year mean concentration, aimed to be achieved by the beginning of 2010 [9]. In the same context, the limit value for benzene in occupational settings in the European Union for an eight-hour duration (retrieved from the GESTIS database, maintained by the Institute for Occupational Safety and Health of the German Social Accident Insurance) is set at 0.66 mg m−3 [10].
Human biomonitoring studies, focused on chemical pollutants, have been conducted for many chemicals across the world for over 70 years. The matrices available for analyses include blood, urine, maternal milk, adipose tissue, hair and saliva [11,12,13]. Maternal milk as a biological monitoring matrix has great relevance for the potential risk to human health as it can be used more easily (collected via non-invasive techniques) among human tissues and fluids for biological monitoring in newborns, portraying also retrospective maternal exposure [14,15,16,17,18]. The comparatively high lipid content with respect to other biological fluids renders maternal milk a suitable matrix for lipophilic chemicals. However, as it is also composed mostly of water (≥85%), metabolized environmental pollutants are expected to be detected in this matrix. Therefore, the presence of lipids is a characteristic of milk that presents many challenges in measuring nonpersistent organic chemicals, such as VOCs [12,17].
Since 1951, when 1,1,1-trichloro-2,2-bis(chlorodiphenyl)ethane (DDT) was the first environmental pollutant identified in human milk [19], this matrix’s analysis has shown an interesting increase. At present, research on human milk analysis mainly focuses on persistent organic pollutants (POP) such as organochlorine pesticides (OCPs), polycyclic aromatic hydrocarbons (PAHs) and polychlorinated biphenyls (PCBs) [14,16,20,21], while there is a relative lack of monitoring of their metabolites [11]. In 2018, Lehmann and colleagues compiled data on environmental chemicals in human milk in the United States and highlighted that these data are, indeed, mostly available for persistent, lipophilic chemicals in human milk [22]. The analysis of VOCs’ metabolites in urine and other biological matrices offers advantages, including their relatively longer physiological half-life compared to parent compounds [4,23]. Human exposure to a group of VOCs (benzene, toluene, ethylbenzene and xylene (BTEX)) is associated with the disruption of endocrine signaling and adverse effects on the respiratory and central nervous systems (see [24] and references therein) and may result in the development of diseases, such as cancer [25].
Gas chromatography mass spectrometry (GC-MS), involving solvent extraction techniques, is a useful tool to identify and quantify VOCs in several matrices, including milk [5,26]. In the same direction, the GC-MS technique, in association with appropriate sample collection and pre-concentration approaches, such as solid-phase microextraction (SPME) and thermal desorption, has proven efficient [15]. Lastly, the scrutiny of some of the basic VOCs, such as aromatic compounds (e.g., benzene, xylene) and halogenated compounds (such as dichloromethane), is chemically rationalized since they exhibit substantial lipophilicity and, after their entrance in the bloodstream, can easily accumulate in fat tissues (breast has a plethora of lipid cells) and derived matrices (as maternal milk).
To understand the relation between external and internal exposure, a lactational transfer pharmacokinetic model developed by Fisher et al. (2010) predicted that exposure to 50 ppm styrene would result in 0.65 mg styrene being ingested by a nursing infant over a 24-h period [27]. The analysis of the main metabolites of styrene and ethylbenzene has been performed in detail and showed that both lead to the formation of mandelic acid (MA), which occurs in two enantiomeric forms, and phenylglyoxylic acid (PGA) [27]. To determine which enantiomer is preferably formed, the stereochemistry of MA, produced as a major urinary metabolite of ethylbenzene and styrene in rats and humans, has been investigated [28]. Although these solvents are both achiral, they are metabolized to chiral metabolites, and, more specifically, it was proven that the R-enantiomer of MA was excreted after ethylbenzene exposure, whereas the MA formed from styrene was essentially racemic. Furthermore, due to the much smaller amount of S-mandelic acid, this enantiomer is to be regarded as a minor metabolite in humans [28,29,30]. Methyl hippuric acids (2,3-4-MHA, depending on the methyl group’s position in the aromatic ring) constitute metabolites of xylenes. Consequently, their presence can be used as a biomarker to characterize exposure to xylenes.
To date, and despite the importance of maternal milk, only a few studies have pursued a targeted and non-targeted screening approach to analyze the VOCs and their metabolites in human milk [11]. It appears that the concurrent detection and quantification of parent compounds and metabolites in maternal milk has not yet been considered in scientific articles. The latter signifies the need for additional research to corroborate potentially harmful compounds such as VOCs and their metabolites and expand the scope of the methods and the portfolio of identified substances to other chemical categories.
Hence, the main aim of the presented work, which, to our knowledge, is the first in Greece, was to portray the residual prevalence of 25 commonly found VOCs in maternal milk samples, using a developed and validated GC-MS/MS method. As exposure to VOCs can be accurately determined and reinforced through metabolite quantitation, nine metabolites were additionally incorporated in a newly developed LC-ESI-MS/MS method applied in the same maternal milk samples. Furthermore, to provide a holistic picture of the maternal milk volatilome, HS-SPME was coupled with GC-MS for the untargeted analysis of GC-amenable substances in the 20 samples. Lastly, an infant health risk assessment was attempted to investigate the potential health impacts of the exposure of infants to such chemicals.

2. Materials and Methods

2.1. Reagents

Carbon disulfide (CS2) was purchased from Acros Organics (99%, Geel, Belgium). Reference standards of 25 VOCs were purchased from Sigma Aldrich (Steinheim, Germany) and were of ≥98% purity (the same applies to bisphenol-A). A mixture of them (isoprene, 2-methylpentane, hexane, tetrahydrofuran, methyl tert-butyl ether, 1,2-dichloroethene, 1,2-dichloroethane, 1,3-dichloropropene, 1,1,3 trichloroethane, benzene, heptane, octane, toluene, 2,2,4-trimethylpentane, tetrachloroethylene, dichloromethane, chlorobenzene, ethyl benzene, p-xylene, m-xylene, o-xylene, styrene, 1,2,4-trimethylbenzene, 1,2,3-trimethylbenzene, p-dichlorobenzene) was prepared to produce a stock solution of 5000 mg L−1 diluted to CS2 and was stored at −80 °C. Further dilutions were produced with CS2 and solutions were also stored at −80 °C. In addition, isotopically labeled internal standards (ILISs) for VOCs, namely 1,2-dichloroethane-D4, toluene-D8, chlorobenzene-D5 and o-xylene-D10, were purchased from Sigma Aldrich and they were used as surrogate standards added to the sample before extraction. Another individual stock solution of ILISs of 5000 mg L−1 was prepared by dilution with CS2 (stored at −80 °C) and further dilutions were produced with the same solvent (stored at −80 °C). MS nylon syringe filters (13 mm, 0.22 μm) from Membrane Solutions (Auburn, WA, USA) were used to filter the final extracts.
In addition, the nine reference standards of VOC metabolites, hippuric acid (HA), 2-methylhippuric (2-MHA, or ortho-methylhippuric acid), 3-methylhippuric (3-MHA, or meta-methylhippuric acid), 4-methylhippuric (4-MHA, or para-methylhippuric acid), R-mandelic acid (R-MA), DL-mandelic acid (DL-MA), N-acetyl-S-(benzyl)-L-cysteine or S-benzylmercapturic acid, (BMA), 2-methylphenol N-acetyl-S-phenyl-DL-cysteine or S-phenylmercapturic acid (PMA) and phenylglyoxylic acid (PGA), were purchased from Sigma Aldrich and were of ≥98% purity. HPLC-grade acetonitrile and ultrapure water were both purchased from Sigma Aldrich (Steinheim, Germany). Finally, ammonium acetate and methanol were purchased from Thermo Fisher Scientific (San Jose, CA, USA). Stock solutions of 1000 mg L−1 were prepared individually of each of the aforementioned metabolites in methanol:water (1:1), except for the PGA metabolite, which was diluted in water. To produce the mixed standard working solution, stock solutions were diluted in methanol:water (1:1, v/v) and further dilutions were produced with the same solvent (stored at −80 °C).
For untargeted analysis, commercial SPME was performed with a manual SPME holder and the following SPME fibers coated with polydimethylsiloxane (PDMS), 30 and 100 μm film thickness; carboxen/polydimethylsiloxane (CAR/PDMS), 75 μm film thickness; polyacrylate (PA), 85 μm film thickness; carbowax/divinylbenzene (CW/DVD), 65 μm film thickness; PDMS/divinylbenzene (PDMS/DVB); and polydimethylsiloxane/divinylbenzene/carbon (PDMS/DVB/CWR (all from Supelco (Bellefonte, PA, USA)).

2.2. Sample Collection

Ethical approval: This study was approved by the Institutional Review Board and Bioethics Committee of both the Benaki Phytopathological Institute and the Aretaieio University Hospital Ethics Committee, and informed consent was obtained from all participants prior to their recruitment for the study.
Twenty nursing mothers from different urban Greek districts were considered in this study. From each woman, breast milk was collected on the 3rd–4th day postpartum at the same time, between 12:00 and 13:00 h. Colostrum was expressed with a manual pump from one breast. One milliliter of milk was transferred into separate sterile cryovials and was stored at −80 °C. Additionally, in each case, an extended questionnaire was completed via a personal interview, which included sociodemographic data and maternal/neonatal anthropometric parameters (e.g., maternal nationality, age, parity, BMI, gestational age, mode of delivery, infantile gender, birth weight, customized centile). The samples were transferred to the analytical lab with cold packs to ensure that they remained chilled.
Upon arrival, the samples were placed in a sample storage refrigerator at −80 °C until analysis. Most samples were analyzed within 4 weeks of sample collection. Any repeat analysis for data confirmation was conducted within 12 weeks of sample collection to ensure the reliability of the repeat data.
For method validation, a surrogate matrix (infant formula milk, Almiron 1, Nutricia, suitable for infants 0–6 months, 70 mL) was obtained from a pharmacy store and used. Nevertheless, to approximate realistic conditions, pooled maternal milk samples (devoid of the VOCs and metabolites of study) were also fortified at the same concentration levels, to assess and verify the analytical method validation results obtained from the surrogate matrix.

2.3. Sample Preparation

2.3.1. GC-MS/MS Targeted Analysis for VOCs

Milk samples were removed from refrigerated storage (−80 °C) and allowed to equilibrate to room temperature. The samples were then vortex-mixed (Witeg Labortechnik, Wertheim, Germany) at the maximum agitation speed for 30 s and placed on a platform shaker (at 250 rpm) for 30 min. Subsequently, 100 μL of milk was transferred into a 1 mL vial, spiked with 500 μL internal standard mixture solution in CS2 and liquid–liquid extracted. The extracts were further filtered through 0.22-mm MS nylon syringe filters prior to the GC/MS-MS analysis.

2.3.2. LC-ESI-MS/MS Targeted Analysis of Metabolites

Milk samples were removed from refrigerated storage (−80 °C) and allowed to equilibrate to room temperature. The samples were then vortex-mixed (Witeg Labortechnik, Wertheim, Germany) at the maximum agitation speed for 30 s and placed on a platform shaker (at 250 rpm) for 30 min. Subsequently, 100 μL of milk was transferred into a 1 mL vial, spiked with 500 μL internal standard mixture solution and liquid–liquid extracted. The extracts were further filtered through 0.22-mm MS nylon syringe filters prior to the GC/MS-MS analysis.

2.3.3. GC-MS/MS Untargeted Analysis and SPME Selection

Experiments were conducted by transferring a sample aliquot of 1 mL to a 5 mL SPME vial, which was quickly sealed with an aluminum cap furnished with a PTFE-faced septum. The solution was vigorously stirred at 40 °C with a magnetic stir bar and the resulting VOCs were sampled from the headspace of the vial with SPME fibers for 30 min. The fiber was subsequently withdrawn and transferred to the GC injection port, serving as a thermal desorption interface. Exposure at 250 °C for 10 min resulted in the complete desorption of the analytes from the SPME fiber, as checked by the subsequent second desorption of the same fiber with no observable carry-over. Before each analysis, the fibers were conditioned for 30 min at 250 °C; then, prior to starting a set of experiments, a blank analysis was performed to verify that no interfering compounds were desorbed from the fiber. After each injection, the fibers were additionally conditioned and cleaned in the bake-out station for 5 min at 250 °C.
Three SPME parameters were optimized using spiked solutions of several VOCs. Experiments were conducted to choose the appropriate fiber, which was selected after various types of fibers were tested for their efficacy in absorbing and enriching the specific analyte. The other two parameters monitored were the extraction and temperature time, where the suitable time was determined after the exposure of the selected fiber for various time periods in the headspace of the vial. In this work, the extraction time profiles of the volatile compounds were studied at time intervals of 5, 15, 30 and 60 min.

2.4. Instrumental Analysis

2.4.1. GC-MS/MS Targeted Analysis

The chromatographic separation and determination of 25 VOCs was carried out on a Chromtech Evolution 3 MS/MS triple-quadrupole mass spectrometer built on an Agilent 5975 B inert XL EI/CI MSD system. Data acquisition was performed using the Evolution 3/Enhanced MassHunter Data Analysis software (version B.07.04.2260, Agilent Technologies, Santa Clara, CA, USA). GC separation was performed using an Agilent J&W DB-624 Ultra Inert GC capillary column with a length of 60 m, an internal diameter of 0.60 mm and a film thickness of 1.4 μm. The oven was programmed as follows: 35 °C (4 min); 10 °C min−1 to 235 °C (6 min); 20 °C min−1 to 240 °C (2 min). A PAL system was used to directly inject the samples via a programmed temperature: initial temperature 150 °C, 10 °C s−1 to final temperature 270 °C. The GC was equipped with a split/splitless injector operated in splitless mode (2.0 min splitless time). Helium 99.999% was used as a carrier gas at a constant flow of 2 mL min−1. The MS quad temperature was set to 150 °C. The electron impact ionization mode was selected (solvent delay of 4.0 min) with the MS source temperature set at 230 °C. For most compounds, an MS/MS procedure was performed in selected reaction monitoring (SRM, also known as multiple reaction monitoring (MRM)) mode. For those compounds where two MS/MS transitions were not obtained, pseudo-selected reaction monitoring (pseudo-SRM) was used, selecting the precursor ion in the first quadrupole, applying zero collision energy (or 1 eV) and isolating the same one as the product ion in the third quadrupole (Table 1). A dwell time per channel between 0.05 and 0.3 s was chosen, depending on the number of transitions recorded in each window and on the peak width of each compound, in order to obtain a minimum of 16 points per peak. The Agilent Mass Hunter Workstation software for quantitative analysis (Version B.07.01/Build 7.1.524.0) was used to process the data obtained. For limited analytes in which the generation of a second SRM transition was not feasible, selected ion monitoring (SIM) mode was used to strengthen the confirmation of analytes. Perfluorotri-n-butylamine (PFTBA) was used for mass calibration, and it was injected using a syringe in the reference reservoir of the MS system for this purpose.

2.4.2. LC-ESI-MS/MS Targeted Analysis

VOC metabolites were quantified using an LC/MSMS system (Shimadzu 8060NX, Kyoto, Japan). LC chromatographic separation was achieved using a Fortis Diphenyl column (150 mm × 2.1 mm × 3.0 µm particle size). LC and MS parameters were in line with previously validated methodologies [28] and further adapted to maternal milk. Furthermore, the MS parameters (functioning in the electrospray ionization (ESI) mode) were optimized for the quantification and qualification ions as well as the corresponding energies Q1 pre bias (V), collision energy (CE) and Q3 pre bias (V). Optimization occurred using the software of the instrument and was conducted for each compound using standard solutions of 100 ppb, separately. The procedure applied was flow injection analysis (FIA), without a chromatographic column, using the elution solvents in a ratio of 90/10 (15 mM ammonium acetate/acetonitrile), with a flow of 0.3 mL min−1. The analysis time of each injection was set at 1 min and the optimized conditions for each substance were saved to update the analytical method. Further information is included below under Table 2.

2.4.3. GC-MS Untargeted Analysis

The SPME parameters for the extraction of volatiles from maternal milk were the same as those described above (see Section 2.3), using a 65 μm PDMS/DVB SPME fiber. Chromatographic determination was carried out using a GC-MS/MS system (Shimadzu GC-MS-TQ80 40NX). GC separation was performed using a Mega-5HT (MEGA gas chromatography solutions) capillary column with a length of 30 m, an internal diameter of 0.25 mm and a film thickness of 0.25 μm. The oven was programmed as follows: 35 °C (5 min); 5 °C min−1 to 165 °C (1.5 min); 10 °C min−1 to 280 °C (10 min). The GC was equipped with a split/spitless injector operated in spitless mode. Helium 99.999% was used as a carrier gas at a constant flow of 2 mL min−1. The MS quad temperature was set to 150 °C. The ionization mode selected was electron ionization (EI) (solvent delay of 2.0 min) with the MS source temperature set at 270 °C. MS detection was carried out using full-scan mode with a mass range of 30–500 m/z. Blanks were run between samples to verify that there was no carry-over for SPME untargeted analysis. Data analysis after obtaining the raw data was conducted as indicated in the section below.

2.4.4. MS-DIAL Untargeted Workflow

The MS-Dial software (v4.90) was used for the untargeted analysis of the GC-MS spectra. The files were converted to .abf files using the Reifycs Abf (Analysis Base File) Converter and then uploaded to MS-Dial. The default settings and parameters for GC/MS-based metabolic profiling were used, with some modifications. These included, for peak detection, an average peak width of 20 scans and a minimum peak height of 1000 amplitudes, using, as a smoothing method, the linear weighted moving average; for deconvolution, an EI spectra cutoff of 10 amplitudes was implemented. For the retention index, a library was created and imported. We recorded the retention times and obtained the linear retention time indices (RIs) using an even-chain n-hydrocarbon mixture, C3–C33, 25 components (Los. #A0186669, Restek, Bellefonte, PA, USA), 100–200 mg/L, in hexane. For annotation, the retention time index tolerance was 20, the m/z tolerance was 0.5 Da, the EI similarity cutoff was 70% and the identification score cutoff was 70%. For alignment, a QC sample was used, applying retention index tolerance of 20 and a retention time factor 0.5. For spectra matching, the NIST2020 library was imported as an msp file.

2.5. Validation Study

GC-MS/MS and LC-ESI-MS/MS Targeted Analysis: For analytical method validation, the recommendations of the International Council of Harmonization (ICH) Harmonized Guideline for Bioanalytical Method Validation, and the respective document published by the U.S. Department of Health and Human Services, were adopted [32,33]. To address the validation criteria during the methods’ validation and the analysis of extracted samples, the following solutions were used: a blank maternal milk sample (procedural blank), a blank sample spiked with ILISs (procedural blank with ILISs) and the calibration standards of VOCs and their metabolites in seven (7) different concentration levels (procedural standards obtained by spiking blank maternal milk sample), including the lower limit of quantification (LLOQ) and the upper limit of quantification (ULOQ) corresponding to the last point of the calibration curve. The LLOQ regarded the lowest calibration level (which was not the same for all analytes) that demonstrated acceptable accuracy and precision. The limit of detection (LOD) was estimated using the statistical analysis of the background [34]. Specifically, three blank matrix samples were analyzed in duplicate over three runs, and the average and standard deviation were calculated. Consequently, concentrations below the LLOQ were fortified and analyzed similarly. Then, the lowest concentration that provided a signal steadily higher than the average signal of the blanks, plus 3.3 times the standard deviation (SD), was defined as the LOD.
The calibration curves were prepared in an indicative overall range of LLOQ–100 ng mL−1 (the LLOQ for all substances varied from 0.1 to 1 ng mL−1) by analyzing duplicate solutions of the seven different concentrations and considering the corresponding response factors (VOC peak area divided by the peak area of its isotope). Furthermore, the coefficient of determination (r2) for each analyte was determined and had to be ≥0.99. The recovery and precision for VOC analysis were determined for the maternal milk matrix. Recovery tests (accuracy %) were conducted at four concentration levels (LLOQ, 3 × LLOQ, 30 × LLOQ and upper ULOQ), using five replicates per level. Precision was determined as the repeatability of the method, expressed in terms of the relative standard deviation (RSD%), calculated from the same recovery experiments (n = 5) at the mentioned fortification levels. The precision did not exceed 20% at the LLOQ and 15% at the rest of the studied spiked levels. Accuracy (recovery) was assessed for the same concentration levels and had to be within ±20% of the nominal concentration at the LLOQ and within ±15% for rest of the levels. Concerning R and D,L-MA, since these compounds are isomers, and they co-elute and share the same SRM transitions, spiking was performed for each analyte separately. The approach (concerning spiking) was similar for p- and m-xylene. The selectivity of the method was assessed after injecting 6 different blank samples, monitoring the appropriate MS/MS transitions for each analyte. Satisfactory selectivity was reached if no interfering peaks, higher than 20% of the LLOQ signal, were present in the blank samples. For the internal standards used, the interfering peaks could not exceed 5% of the LLOQ signal. For confirmation purposes, the ratio between the intensity of the quantification (Q) and confirmation (qi) transitions was recorded for each compound. The theoretical value for each compound was obtained as an average of the standard solutions used for calibration (and updated in each analysis sequence). A maximum ratio tolerance of ±20% was allowed when the theoretical Q/qi ratio was 10, according to the European Union Decision 2002/657/EC [35]. An acceptable difference οf ±0.1 min in the retention time between the sample and standards was also required to confirm a positive identification in a sample. The stability of the VOCs and metabolites was studied both in the matrix and in solutions in solvent following the recommendations of the ICH guideline 2022 document. Specifically, two concentration levels were selected, 3 × LLOQ (as a low-level quality control (LLQC) sample) and ULOQ (as a high-level quality control (HLQC) sample). The freeze–thaw approach was used in several cycles, with QCs being kept frozen for 16 h between the cycles. Aliquots of LLQC and HLQC were subjected to chemical analysis at the onset of the study (zero time point) and after 3 months of storage at −80 °C. The mean concentration at each QC level had to be within ±15% of the nominal concentration. Carry-over was assessed by analyzing blank samples after the injection of the ULOQ in the analytical instrument. During samples’ analytical runs, all QC samples (suitably dispersed into the batch of injections, each in duplicate), procedural blanks and calibration standards were incorporated into the workflow and evaluated as dictated in the ICH M10 guideline [32]. Finally, the maternal milk samples were extracted and analyzed in triplicate, bracketed by QC samples.

2.6. Infants’ Health Risk Assessment

The non-carcinogenic risk to infants’ health posed by the VOCs and metabolites detected in the maternal milk samples was assessed using the hazard quotient (HQ, unitless) and hazard index (HI, unitless) approach [36]. The HQ was evaluated for each VOC, considering only the dietary exposure route via maternal milk consumption. Therefore, to proceed to the infants’ health risk assessment, the estimated daily intake (EDI, mg/kg bw day−1) via maternal milk consumption was calculated based on Equation (1) (non-carcinogenic risk) and Equation (2) as chronic EDI (CEDI, for carcinogenic risk).
E D I = C × C o n s m i l k / b w
where C: the concentration of the VOC in maternal milk (ng mL−1), Consmilk: the daily maternal milk consumption by infants (mL), estimated at 750 mL for an infant of 6 months [37]; and bw: the mean infant body weight (kg; for a 6-month-old infant, a median of 7.5 kg is considered [38]).
C E D I = C o n s m i l k × C × E F × E D B W × A T
where Consmilk: the daily maternal milk consumption by infants (mL), C: the concentration of the VOC in maternal milk (ng mL−1); EF: the exposure frequency, 365 days/year; ED: the exposure duration, 70 years for carcinogenic risk calculations; AT: the average exposure time, 365 days × ED; BW, the average body weight, 7.5 kg.
For several VOCs, the tolerable daily intake (TDI) is available in the bibliography and was used in the calculations. Then, the HQs were computed following Equation (3) as depicted below:
H Q = E D I T D I
where EDI is the estimated daily intake (μg kg−1 d−1), and TDI is the tolerable daily intake (or daily reference dose, μg kg−1d−1) retrieved from the open-access literature.
The ADI or TDI (if ADI is not available) of an active substance (associated with hazard identification and characterization) is based on the assessment of accessible toxicological data and is defined after the establishment of the no-observed-adverse-effect level (NOAEL) and use of the appropriate assessment factor. If the HQ is ≤1, it indicates that no adverse effect is likely to occur due to the exposure to the specific compound (health-protective). If HQ is >1, then a high level of concern is indicated for health effect occurrence. The higher the HQ, the higher the concern for chronic toxic effects, highlighting the need for immediate risk management actions.
For the estimation of the total risk from the simultaneous exposure to the mixture of VOCs that might be present in maternal milk, the hazard index approach (HI, unitless) was applied to approximate the overall risk following the simultaneous exposure to multiple VOCs. In the specific approach, the hypothesis of dose additivity was assumed and calculated as the sum of individual HQ values (Equation (3)):
H I = Σ H Q s = H Q 1 + H Q 2 + H Q 3 + + H Q n
Although the World Health Organization supports exclusive breastfeeding for 6 months, with adequate supplementation with solid foods from 6 months onwards for up to 2 years, children continue to be exposed to VOCs during their lifetime. Therefore, a carcinogenic risk (CR) assessment was contemplated for children [39]. For its estimation, 2 endpoints, the CEDI and the cancer potency factor (CPFo, (mg/kg/d)−1) were regarded. The CEDI (Equation (2)) was calculated considering an effective lifetime of 70 years. CPFo values were retrieved principally from the United States Environmental Protection Agency [40], the California Office of Environmental Health Hazards Assessment [41] and the Risk Assessment Information System [42]. The CR was computed following Equation (5):
C R = C E D I × C P F o
The CR was considered negligible when it was below 1 × 10⁻⁶ and likely harmful when above 1 × 10⁻⁴. Values in the range of 1 × 10⁻⁶ to 1 × 10⁻⁴ indicate an acceptable or tolerable risk [40].

3. Results

3.1. Optimization of Targeted and Untargeted Analytical Methods

Before the real samples’ analyses, several experiments were conducted to optimize, standardize and validate the sample preparation, including the extraction procedures and analysis methods. As most VOCs show molecular masses below m/z = 200, possible fragmentation in collision-induced dissociation (CID) was evaluated in detail. All VOCs’ related peaks were checked for the most abundant CID fragments (for indicative total ion (TIC) MRM chromatograms for VOCs and metabolites see Figure 1 and Figure 2, respectively).
The calibration curves presented good linearity, with regression coefficients (r2) > 0.99 (Table 3). The back-calculated concentrations of each calibration standard fell within ±20% at the LLOQ (see Table S2, Supplementary Materials for the respective metrics). Recoveries at the LLOQ (n = 5) ranged from 78 to 104% (Table 3) with an RSD ≤ 20%, which was acceptable, with the exception of 1,2-dichloroethene (78%, although the RSD was acceptable). The findings were similar for the recoveries at the rest of the spiked levels studied (see Table S1, Supplementary Materials), with the exception of 1,2-dichloroethene at 3 × LLOQ and 1,3-dichloropropene at 30 × LLOQ. In the same context, both (GC, LC) analytical methods demonstrated acceptable selectivity, with the interfering components’ response at the retention time of the analytes not more than 14% at the LLOQ. Regarding the four ILISs, the respective responses did not exceed 4%. The stability (short-term and long-term) of the analytes, both in the matrix and in the stock and working solutions, was deemed satisfactory since the mean concentration at the LLQC and HLQC was, in the majority of analytes, in the range of −10 to +14% of the nominal concentration. For o-xylene at the LLQC, the mean concentration exceeded ±15% (17%). Carry-over phenomena were not observed since the response in the retention time of VOCs was <8% of the response at the LLOQ and <3% for the ILISs. The overall results demonstrate the feasibility of the developed and validated analytical methods in measuring VOCs in maternal milk with adequate sensitivity, recovery and precision, being indispensable for biomonitoring studies.
With regard to the various combinations used in the HS-SPME–GC-MS method, the 65 μm PDMS/DVB fiber, functioning at 40 °C for 30 min, was considered the most effective (full data of the optimization experiments not shown). The extraction duration and agitation temperature of the samples were in line with the literature [8,15].

3.2. Compound Identification via Targeted and Untargeted Analysis to Support Characterization of VOCs in Human Milk

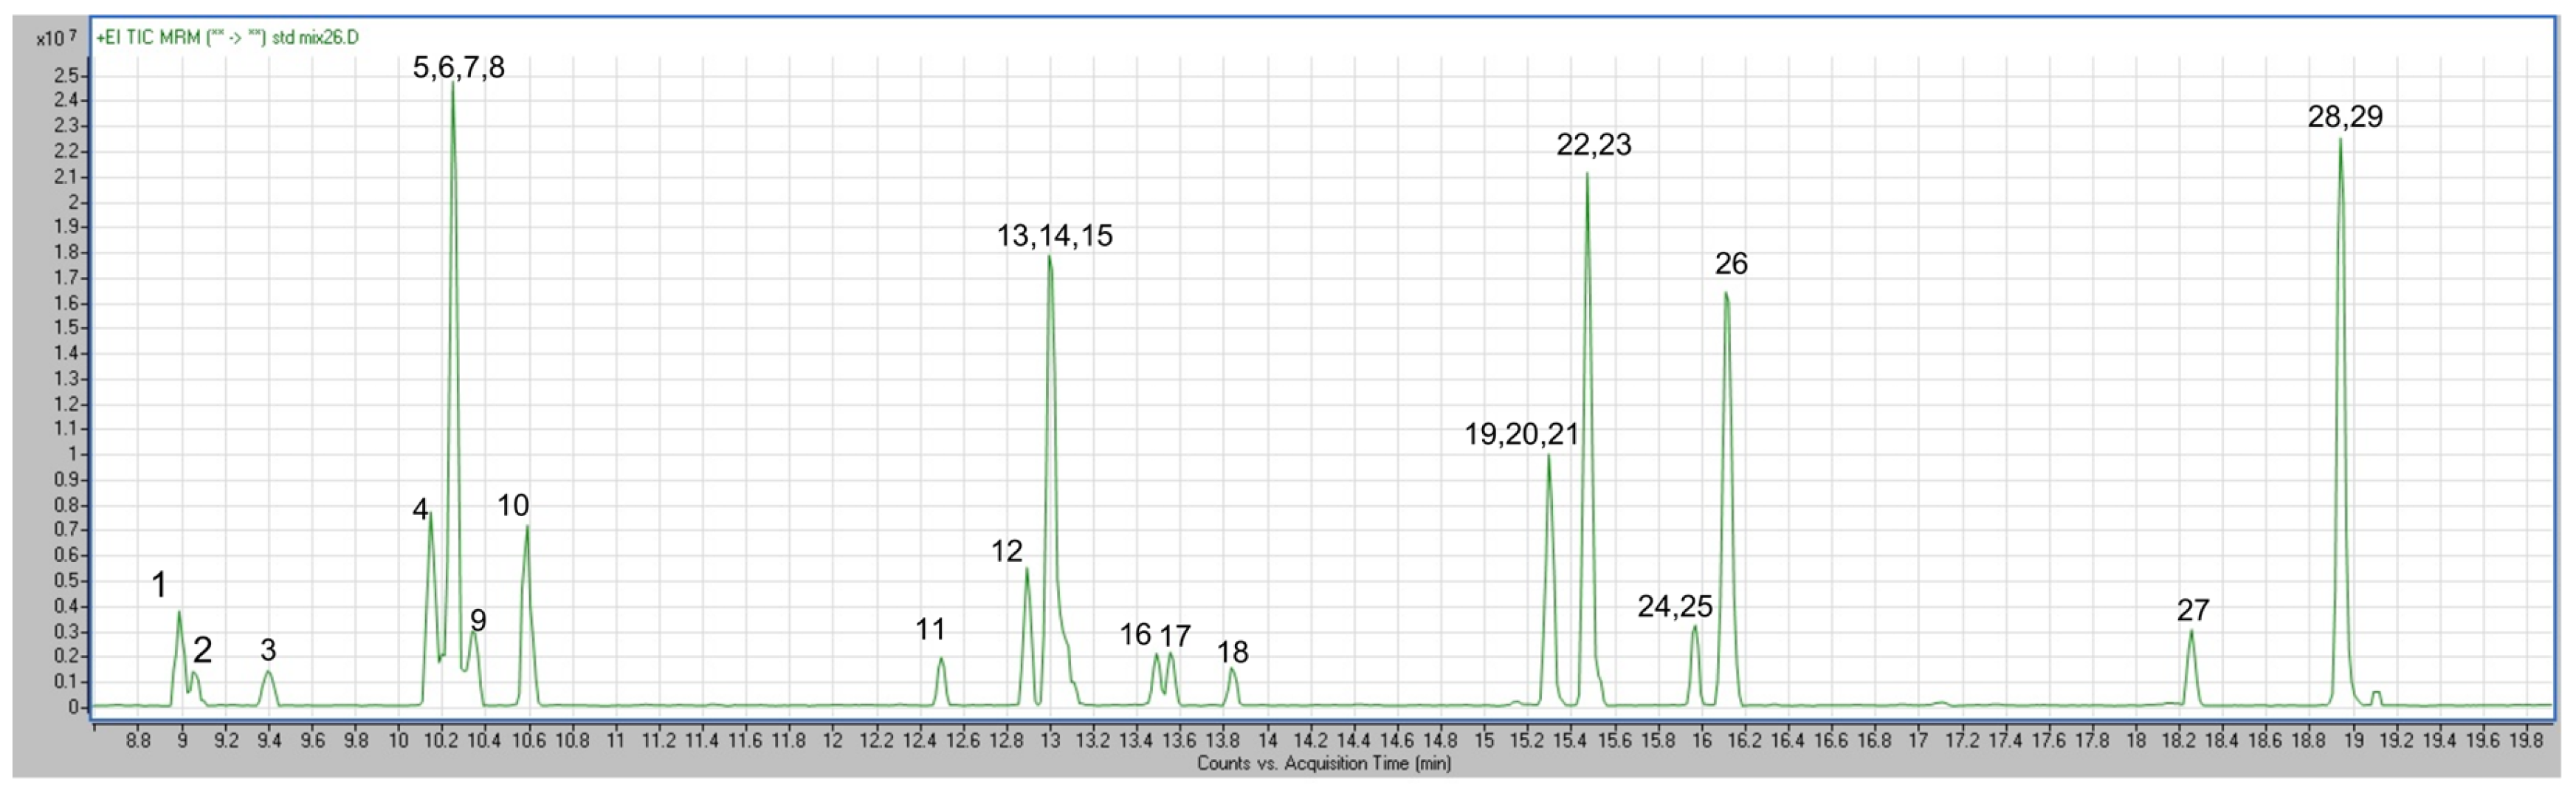
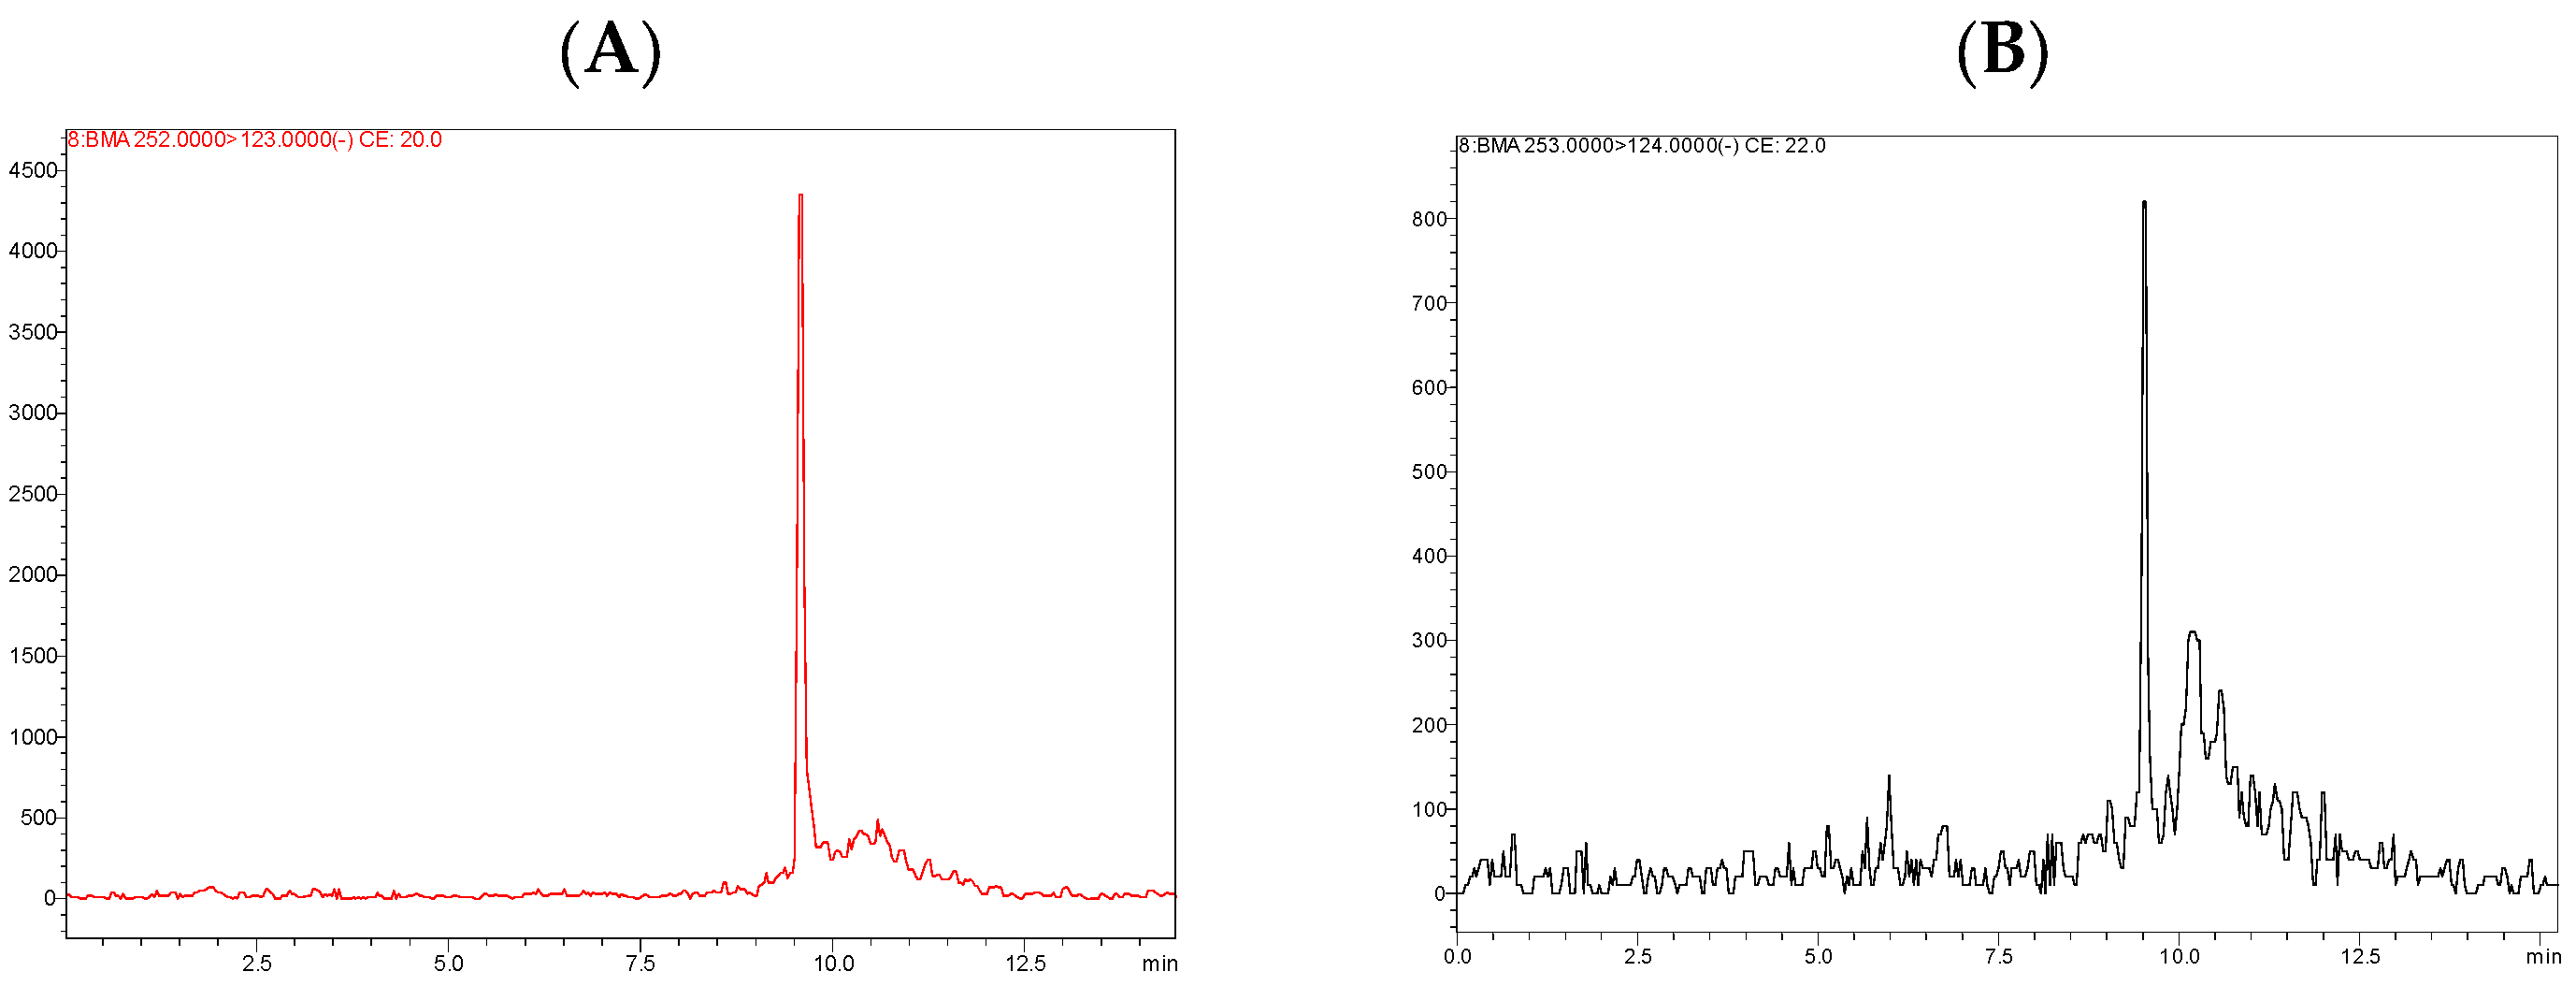
3.2.1. Targeted Chemical Analysis

From the panel of 34 analytes, eight (including metabolites) were detected in total (overall results shown in Table 4), in the 20 samples investigated in this work, with positive samples reaching 30%. The targeted chemical analysis unveiled isoprene detection in two samples in the range of <LLOQ–0.11 ng/mL. The isoprene levels reported in biological fluids are variable in studies. In 1992, blood concentrations were reported up to 4.8 ng/mL [43], while it is common to address its urinary metabolite, N-acetyl-S-(4-hydroxy-2-methyl-2-buten-1-yl)-L-cysteine (IPM3) [44]. The same number of detections was evidenced for benzene but at higher concentrations, 0.34–0.58 ng mL−1, compared to isoprene. Two detections were obtained for toluene, reaching a maximum of 0.63 ng mL−1, and one for p,m-xylene and styrene.
The detection of these compounds is not unexpected. Indicatively, isoprene has both synthetic and natural origins. It is a bioproduct of the thermal processing of oil and naphtha, and it is an emission product of several plants, such as oaks and poplars. Isoprene is also formed endogenously in humans [45]. Xylenes are also products of plant emissions, found in petroleum as well. Benzene and toluene are natural products of crude oil and gasoline and products of cigarette smoking. From the metabolite point of view, BMA and MA were detected in some of the samples (two detections of BMA (see Figure 3) and two detections for DL and R-MA, which could not be separated), with overall concentrations varying from <LLOQ to 0.79 ng mL−1. In one sample, the concomitant detection of BMA (for BMA, see MRM chromatograms above) and toluene (the parent compound) was corroborated. In the same context, 3-MHA was detected (<LLOQ) in the sample positive for xylene, substantiating the presence of the parent compound.

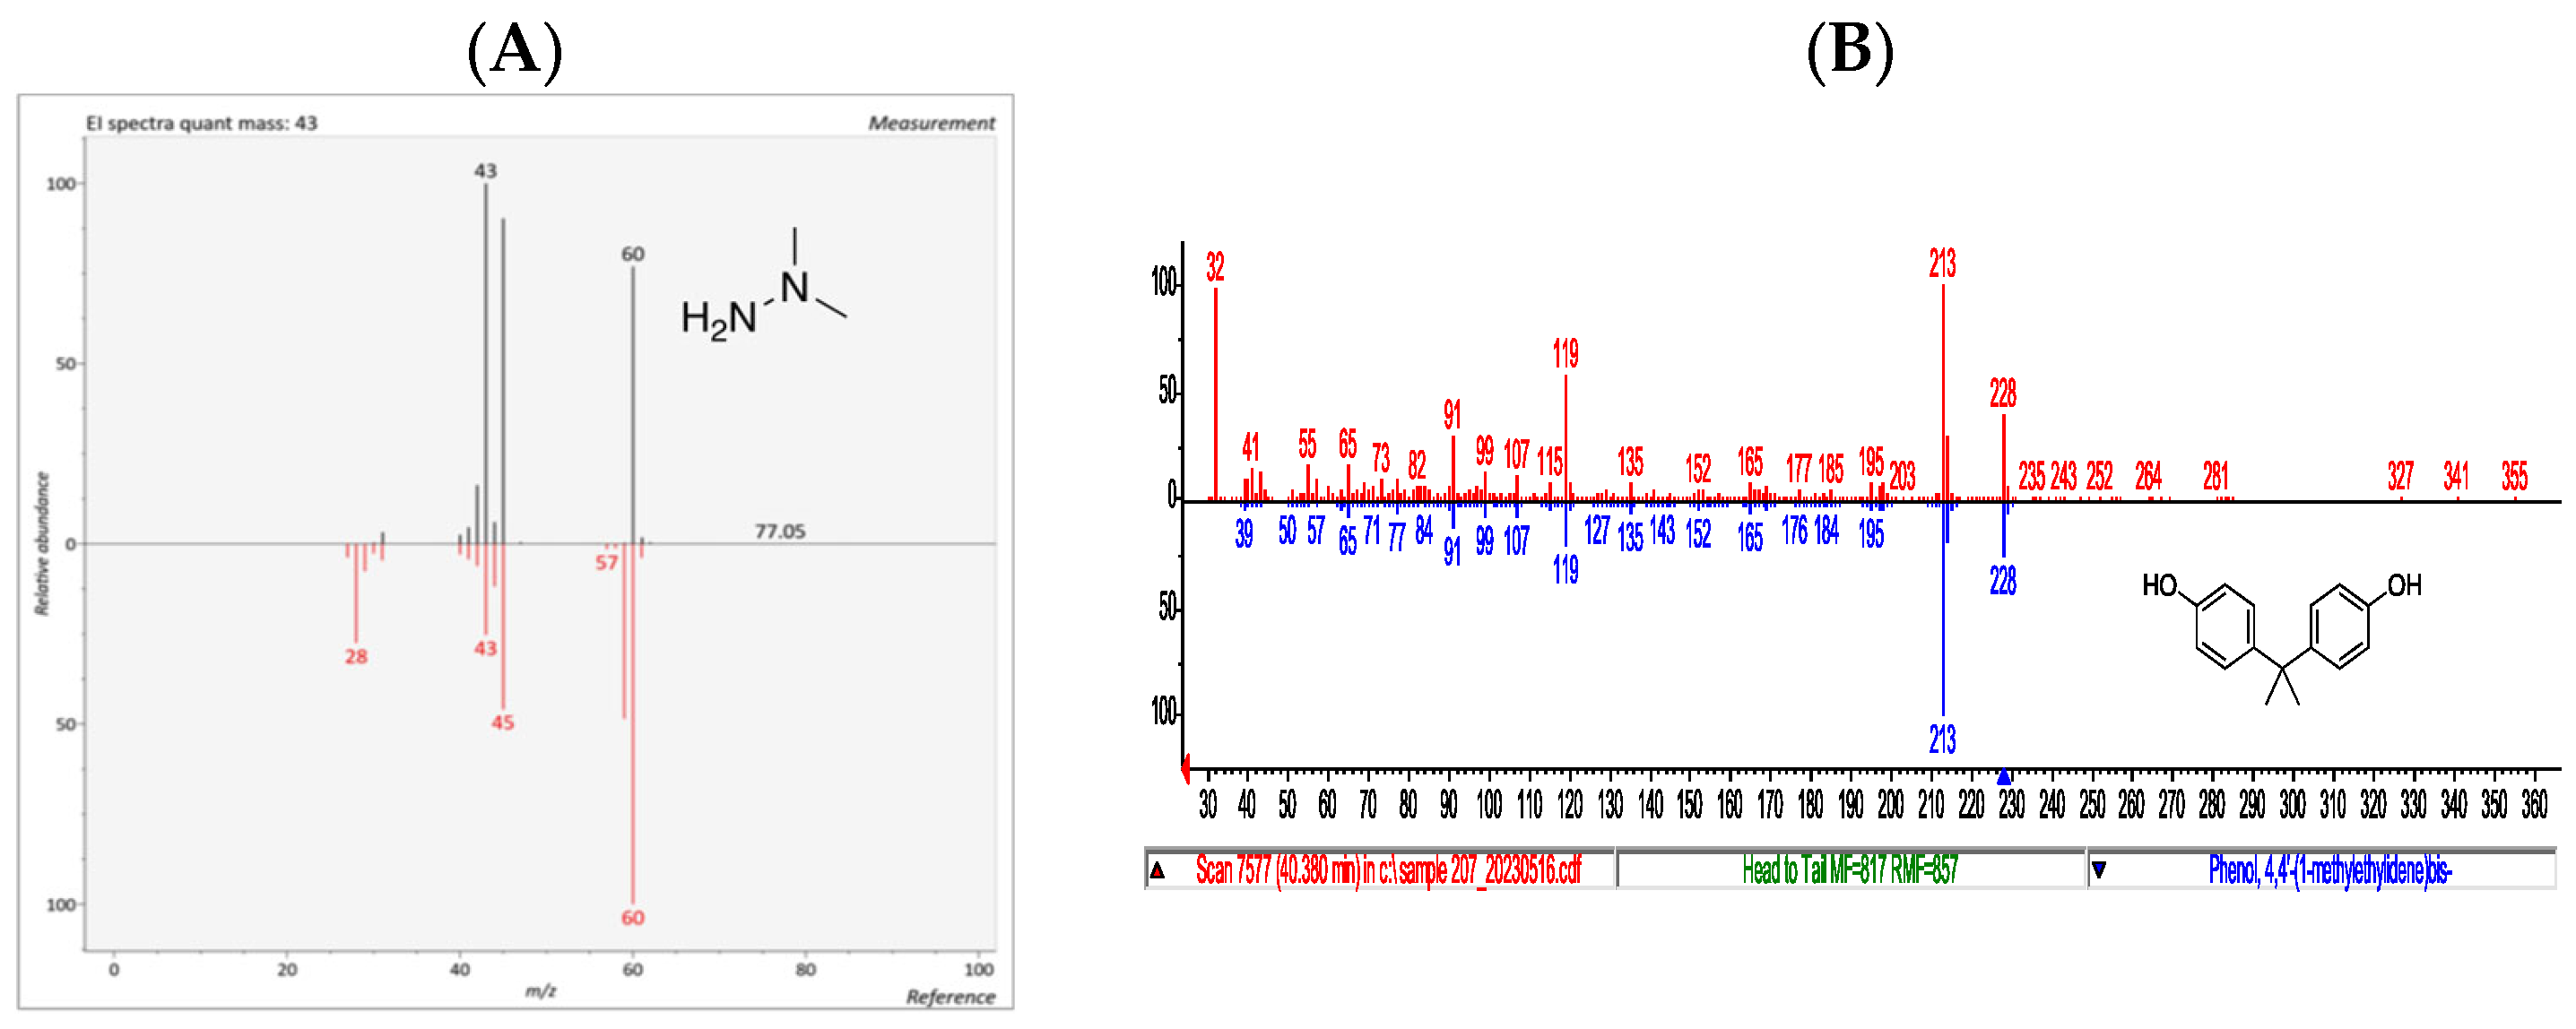
3.2.2. Untargeted Chemical Analysis

The importance of the obtained MS fragments (MS fragments for indicative compounds are presented in Table S3) and overall MS spectra in elucidating the presence of several chemicals was verified by the high similarity of the experimental MS data with the theoretical ones of the NIST library (for most of the chemicals, the similarity was >90%). The major findings of the untargeted GC-MS analysis in all samples regarded fatty acids, exemplified by cis-vaccenic acid, decanoic, dodecanoic, tetradecanoic, n-hexadecenoic and octadecanoic acid; alkanes, such as 2,6,10-trimethyl tetradecane (found in Nicotiana tabacum); alcohols; and aldehydes (e.g., 2,4-decadienal). Most compounds were previously reported as constituents of maternal milk, especially in metabolomics studies [46,47]. Docosahexaenoic acid was also detected in the majority of samples, which is in line with the recent bibliography [48]; it is a compound that is vital for the cognitive development of newborns. Citronellol (GC-MS full-scan spectra in Figure S1), a terpenoid that is a common constituent of essential oils and cosmetic products but also categorized as a flavoring substance [49], was also detected in several samples. 4-Mercaptophenol, a phenol derivative, exhibiting substantial bioactivity [50,51], was identified in several samples (GC-MS full-scan spectra in Figure S2), adding further evidence of the beneficial chemical arsenal of maternal milk. However, the same compound is also reported as an impurity in hair dye of 1,2,4-trihydroxybenzene [52], implying another potential etiology for its presence.
From a contaminant perspective, trans-1,4-dimethyl-cyclooctane, 1,1-dimethylhydrazine (Figure 4; used in the manufacture of plant growth regulators, as photographic chemicals and as stabilizers for fuel additives), 1,1-dicrotylhydrazine and propylbenzene (found in petroleum) were identified in maternal milk samples. In one sample, bisphenol-A (Figure 4) was identified and verified with the use of an authentic analytical standard solution. This finding is in line with the recent literature that reports the detection of several bisphenols in breast milk [53,54]. Interestingly, in two samples, bisphenol-B acetate was identified, which, to our knowledge, is its first report in this matrix. Similarly, in one sample 4,4′-(1,3-dimethylbutylidene)bisphenol was detected (see Figure S3). In four samples, acetophenone was identified, corroborating its widespread use and presence in a plethora of products spanning from cosmetics to fruit flavor ingredients. Lastly, phthalates (di-isobutyl phthalate in two samples) and their derivatives, such as phthalic acid, isobutyl neopentyl ester, phthalic acid and decyl neopentyl ester, were also detected.

3.3. Infants’ Health Risk Assessment

The health risk assessment was based on the TDI existing values from the accessible literature. More specifically, for toluene, xylenes and ethylbenzene, the TDIs were retrieved from Health Canada [55]. For styrene, the respective value was retrieved from the WHO International Peer-Reviewed Chemical Safety Information [56]. For benzene, the maximum allowable daily level by the oral route (MADLoral, considering reproductive toxicity) [57] was contemplated. For isoprene, Japanese data on repeated dose toxicity (key study on spinal cord degeneration in mouse) via the inhalation route outline the lowest observed adverse effect level (LOAEL) at 70 ppm (equivalent to 59 mg/kg/day) [58]. Therefore, to derive/extrapolate the no observed adverse effect level (NOAEL; to our knowledge, it is not available for isoprene), the LOAEL was used, applying an uncertainty factor of 2 (LOAEL/2, also envisaged by the use of the lowest observed effect concentration, the LOEC/2 value, in place of the no observed effect concentration, NOEC, in environmental risk assessment [59]), and then divided by an additional factor of 10 for intraspecies variability to provide the TDI. The European Chemicals Agency (ECHA) has also reported that the 1st-day administration of a dose (oral route, in Wistar rats) of 200 mg/kg bw/day, followed by a dose of 45 mg/kg bw/day on the following four days, did not cause death or any other adverse effects [60], yet the average value of these doses was not regarded in the calculations (preliminary calculations lead to a similar conclusion for EDI and HQ).
In the EDI calculation, the median weight for a 6-month-old infant reported in the bibliography was contemplated (median of 7.5 kg). The results for EDI and HQ calculations for the worst-case (highest obtained concentrations of VOCs and metabolites) findings are presented in Table 5. For HQ calculations, the following points were also considered. More specifically, since the isomers (DL and R) of MA could not be chromatographically separated and were derived from discrete VOCs, in the respective calculations (see Table 5 for positive samples), the exclusive detection of one metabolite (either DL-MA or R-MA) and its subsequent attribution to the related parent VOC were contemplated as two separate cases. In the same context, to expand the calculations, for detected analytes whose concentrations were below the LLOQ, an LLOQ/2 value was attributed and included in the EDI calculations. The latter is an approach implemented by the European Food Safety Authority (EFSA) for cut-off values on the LOQs delineated in datasets used to estimate dietary exposure to chemical contaminants [61].
For the cases of concomitant detections of more than one substance (VOCs and metabolites) in samples, the HI was calculated. In five out of six samples, the HI values were far below the threshold value of 1, while, for the most contaminated sample (sample 12), an HI value (Table 5) of 0.11 was derived <1.
Toluene, isoprene, styrene and xylenes were not regarded for the carcinogenic risk assessment calculations, since no CPFo values have been established. Consequently, respective calculations were performed for benzene and ethylbenzene, taking into account the maximum concentrations (see Table 6) as a worst-case scenario.
It is evident that the CR values for benzene and ethylbenzene are lower than 1 × 10⁻⁶, suggesting a negligible carcinogenic risk for infants.

4. Discussion

The presented study provides a practical way to determine VOCs’ and their metabolites’ concentrations in maternal milk samples and, in parallel, a workflow for the respective risk assessment of the vulnerable group of newborns and infants. From an analytical point of view, the developed methods met the threshold values (in the vast majority of cases) of the analytical method validation criteria set by the broadly acknowledged guidelines [32,33]. The latter, considering the relatively high number of VOCs and metabolites introduced in the methods’ scope (34 analytes in total), places this among the few works in this particular field [8]. In the same context, the established calibration range, along with the obtained LODs (for parent VOCs in the range of 0.04 to 0.4 ng mL−1) and LLOQs (for parent VOCs in the range of 0.1 to 1 ng mL−1), guarantee the detection and quantification of the investigated VOCs and metabolites at the low ppb scale, despite the use of liquid–liquid extraction (HS-SPME is the most common extraction technique in this domain) and the challenge faced in the MS/MS methodological approach for relatively low-molecular-weight analytes (indicative MS/MS chromatograms of benzene and styrene in Figure S3). To elaborate further, the LODs in this work are slightly above the ones reported in the literature [8,15], with the exception of MTBE (which is one order of magnitude higher and is a limitation of this study) [15], although the difficulty in the harmonization of analytical groups in calculations towards LODs and LLOQs can create discrepancies among them. The presented analytical figures of merit (for metabolites), exemplified by the obtained LODs (in the range of 0.08 to 0.2 ng mL−1), LLOQs (in the range of 0.2 to 0.5 ng mL−1) and calibration ranges, are comparable to the ones published by the US Centers for Disease Control and Prevention (CDC) National Center for Environmental Health (Tobacco and Volatiles branch) in an in-depth study of VOC metabolites in urine using tandem mass spectrometry [68]. Although the usual approach to analyzing VOCs is to detect and quantify them using the SIM mode [8], in this work, we managed to obtain two SRM transitions for most analytes and reach sufficient LLOQs, following all steps of bioanalytical method validation. In the same context, the SRM ratios obtained fοr positive samples were within the acceptable range of tolerance (in proximity to the respective ratios of standards and spiked samples). Therefore, the presented methods, building upon the advantages of tandem mass spectrometry [69], can be used for the accurate identification of VOCs and metabolites in this matrix that is important for infants’ nutrition, minimizing “false positive” results and enhancing the specificity/selectivity of the method.
Both the findings and concentrations are not surprising. Kim et al. used SPME/GC-MS to analyze four VOCs in 13 maternal milk samples, with the highest median value observed for chloroform (0.55 ng mL−1), followed by toluene (0.46 ng mL−1), benzene (0.12 ng mL−1) and MTBE (0.09 ng mL−1) [15]. Blount et al. [8] published a pivotal work using GC-MS coupled with the purge and trap-dynamic headspace method (P&T-HS). This group evaluated extensively methods of collecting, storing and analyzing human milk samples for the presence of thirty-six VOCs. In their study, ten VOCs were detected in most human milk samples, namely m/p-xylene (0.539 ng mL−1), toluene (0.464 ng mL−1), 1,4-dichlorobenzene (0.170 ng mL−1), tetrachloroethylene (0.165 ng mL−1), o-xylene (0.159 ng mL−1), ethylbenzene (0.0149 ng mL−1), styrene (0.129 ng mL−1), benzene (0.080 ng mL−1), chloroform (0.030 ng mL−1) and methyl-tert-butyl ether (0.016 ng mL−1). For toluene, the concentration obtained herein is of the same magnitude as in the literature, even if the BMA concentration is admeasured to it. An overview of the comparison of findings in association with the relevant literature is presented in Table 7.
In the same context, breast milk samples were collected from 170 mothers (breastfeeding premature infants) and analyzed by Muelbert and colleagues [71], with SPME–GC-MS revealing the presence of VOCs such as toluene, styrene, benzene and ethyl benzene, which were also detected in the present work (with the exception of ethylbenzene as a parent). Nevertheless, quantitative data were not provided (only relative quantitation) to compare them with the findings of this work. However, other VOCs detected were bromodichloromethane, trichloromethane, chloromethane, acetone and pentane, compounds not identified in the current study. Similarly, Contador and colleagues investigated the volatile profile of maternal milk in the context of variations in composition due to processing treatment without quantifying the detected compounds [72]. Toluene and p-xylene were detected, which is in accordance with the herein findings. In contrast, octane, identified by Contador and colleagues, was not detected in our work.
With regard to the sources of VOCs and how they interplay with specific findings, a plethora of sources and routes can be identified, with atmospheric air being their most prevalent reservoir due to the high volatility of VOCs. VOCs’ high vapor pressure is also the main reason for the elevated concentrations in indoor environments. For ethylbenzene, high concentrations are reported in beauty salons, while respective levels for toluene and xylenes are reported in home settings [4]. Since VOCs are derived from more than one source, it is risky to refer to the specific route unless easily interpretable information is present, which was not within the scope of the presented work. Nevertheless, it is noteworthy that the benzene and toluene detections in the current study (samples 4 and 12 in particular; see Table 4) corresponded to mothers who, based on the questionnaire, practiced smoking during pregnancy on a daily basis. Smoking is often demonstrated as one of the primary sources of VOCs for humans [73], as verified in large epidemiological studies [74]. The indoor environment seems to play a fundamental role for pregnant or lactating women since they tend to spend more time in their homes compared to their usual practice, which involves more outdoor activities. Occupational (e.g., industrial settings such as solvent and paint production or vehicle repair) biomonitoring studies represent a domain in which it is more straightforward to connect exposure with the source of VOCs [75,76,77], especially when the concentrations are higher than the background levels.
Concerning the potential risk due to the detection of VOCs, a comparative approach is presented in Table 8. Specifically, the US EPA has established health advisory (HA) values for the chronic ingestion of contaminated water by 10 kg children, presuming 1 L daily water ingestion [78,79]. Although maternal milk is not directly comparable with water, water constitutes its main component (up to 88%). The comparison of the maximum concentration values with the HA one-day and ten-day values (see Table 8) that are protective for adverse health effects regarding chronic exposure demonstrates that the measured levels are far below the HA values. The conclusion is similar (far lower concentrations) when the current findings are compared with the respective VOC findings in food commodities [80].
Despite the relatively low number of samples, the results of the presented study verify the presence of VOCs and metabolites in maternal milk at concentration levels within the range of other publications, as depicted in Table 7. Consequently, further evidence is added to support the potential transfer of these compounds during breastfeeding to newborns and infants. The health risk assessment did not unveil any threat to infants, but it should not be underestimated considering that VOCs are not the only chemical class to which infants are exposed via maternal milk or even via other sources, and real-life mixtures’ toxicity still represents a relevant area for research and potential risk management decisions.

5. Conclusions

In the present study, the pivotal role of mass spectrometry tools using both single- and triple-quadrupole technology in the investigation of the residual prevalence of VOCs and metabolites in maternal milk was demonstrated. Two analytical methods (GC, LC-MS/MS) were developed and validated to address the levels of 25 VOCs and 9 of their metabolites in 20 maternal milk samples collected from Greece. The application of the targeted methods disclosed low detection rates for benzene, toluene, styrene and p,m-xylenes and three of their metabolites, namely N-acetyl-S-(benzyl)-L-cysteine (BMA, metabolite of toluene), 3-methylhippuric (3-MHA, metabolite of xylenes) and mandelic acid (MA as DL and R isomers, metabolites of styrene and ethylbenzene), in concentrations varying from <LLOQ to 0.79 ng/mL. An untargeted chemical analysis employing HS-SPME–GC-MS unveiled principally fatty acids, but additional contaminants exemplified by bisphenol-A, bisphenol derivatives and phthalates were also identified. The infants’ health risk assessment (including carcinogenic risk) regarding the determined concentrations demonstrated a low to negligible risk, yet the detection of these compounds should not be underrated.
These results are expected to partially fill the literature gap on the levels of VOCs and their major metabolites in human milk and on the biomonitoring of mothers applying breastfeeding, in order to improve the understanding of the health risks of the exposure of children and their mothers to chemical pollutants such as VOCs. A larger study, in terms of the number of samples, is currently underway to enrich the findings, incorporating other chemical classes exemplified by pesticides and selected VOCs’ metabolites not included in the current study. Lastly, risk management actions should be reinforced to further reduce lifetime exposure, particularly during the prenatal period and pregnancy.

Supplementary Materials

The following supporting information can be downloaded at: https://0-www-mdpi-com.brum.beds.ac.uk/article/10.3390/chemosensors12030030/s1, Table S1: Accuracy (mean recovery, n = 5) and precision (n = 5) at 3 × LLOQ, 30 × LLOQ and ULOQ; Table S2: Accuracy (mean recovery, n = 5) and precision (n = 5) concerning the back-calculated concentrations of the calibration standards at LLOQ, 3 × LLOQ, 30 × LLOQ and ULOQ; Table S3: Exemplary MS fragments, retention time (RT) and retention index (RI) for selected detected identified compounds; Figure S1: GC-MS full-scan spectra of citronellol in positive maternal milk samples (the top spectra corresponds to the one obtained in the maternal milk sample, while the spectra below correspond to the respective of the NIST library); Figure S2: GC-MS full-scan spectra of 4-mercaptophenol in positive maternal milk samples (the top spectra corresponds to the one obtained in the maternal milk sample, while the spectra below corresponds to the respective of the NIST library); Figure S3: GC-MS full-scan spectra of 4,4′-(1,3-dimethylbutylidene)bisphenol in positive maternal milk samples (the top spectra corresponds to the one obtained in the maternal milk sample, while the spectra below corresponds to the respective of the NIST library); Figure S4: SRM transitions for benzene (a) and styrene (b) in standard mix in CS2 at 10 ng mL−1.

Author Contributions

Conceptualization, K.M.K., E.N.T. and K.M.; methodology, E.N.T. and K.M.K.; software, E.N.T., K.M.K., E.M.-K. and E.B.; validation, E.N.T. and K.M.K.; formal analysis, E.N.T. and K.M.K.; investigation, E.N.T., K.M.K., E.M.-K., E.B., K.M., T.B., Z.I. and N.I.; resources, K.M., T.B., Z.I. and N.I.; data curation, E.N.T., K.M.K., E.B., K.M., T.B., Z.I. and N.I.; writing—original draft preparation, E.N.T.; writing—review and editing, E.N.T., K.M.K., K.M., N.I. and T.B.; visualization, E.N.T., K.M.K., E.M.-K. and E.B.; supervision, K.M. and K.M.K.; project administration, K.M. and K.M.K.; funding acquisition, K.M. All authors have read and agreed to the published version of the manuscript.

Funding

This research received no external funding.

Institutional Review Board Statement

The study was conducted in accordance with the Declaration of Helsinki and approved by the Institutional Review Board and Ethics Committee of Aretaieion Hospital (protocol code: 528, date: 22 June 2023).

Informed Consent Statement

Informed consent was obtained from all subjects involved in the study.

Data Availability Statement

All analytical data of the study are presented in this work. Additional details of the study can be considered to be communicated after reasonable request.

Acknowledgments

The authors thank the contributing mothers for providing the donated maternal milk.

Conflicts of Interest

The authors declare no conflicts of interest.

References

  1. WHO-Breastfeeding. Available online: https://www.who.int/tools/elena/interventions/exclusive-breastfeeding (accessed on 2 September 2023).
  2. Theurich, M.A.; Davanzo, R.; Busck-Rasmussen, M.; Diaz-Gomez, N.M.; Brennan, C.; Kylberg, E.; Baerug, A.; McHugh, L.; Weikert, C.; Abraham, K.; et al. Breastfeeding Rates and Programs in Europe: A Survey of 11 National Breastfeeding Committees and Representatives. J. Pediatr. Gastroenterol. Nutr. 2019, 68, 400–407. [Google Scholar] [CrossRef] [PubMed]
  3. Tigka, M.; Metallinou, D.; Nanou, C.; Iliodromiti, Z.; Lykeridou, K. Frequency and Determinants of Breastfeeding in Greece: A Prospective Cohort Study during the COVID-19 Pandemic. Children 2022, 9, 43. [Google Scholar] [CrossRef] [PubMed]
  4. Li, A.J.; Pal, V.K.; Kannan, K. A review of environmental occurrence, toxicity, biotransformation and biomonitoring of volatile organic compounds. Environ. Chem. Ecotoxicol. 2021, 3, 91–116. [Google Scholar] [CrossRef]
  5. Ratel, J.; Engel, E. Determination of benzenic and halogenated volatile organic compounds in animal-derived food products by one-dimensional and comprehensive two-dimensional gas chromatography-mass spectrometry. J. Chromatogr. A 2009, 1216, 7889–7898. [Google Scholar] [CrossRef] [PubMed]
  6. Zhou, X.; Zhou, X.; Wang, C.; Zhou, H. Environmental and human health impacts of volatile organic compounds: A perspective review. Chemosphere 2023, 313, 137489. [Google Scholar] [CrossRef]
  7. Soni, V.; Singh, P.; Goel, V. Effects of VOCs on Human Health. In Air Pollution and Control; Energy, Environment, and Sustainability Book Series (ENENSU); Springer: Singapore, 2017; pp. 119–142. [Google Scholar]
  8. Blount, B.C.; McElprang, D.O.; Chambers, D.M.; Waterhouse, M.G.; Squibb, K.S.; LaKind, J.S. Methodology for collecting, storing, and analyzing human milk for volatile organic compounds. J. Environ. Monit. 2010, 12, 1265–1273. [Google Scholar] [CrossRef]
  9. DIRECTIVE-2008/50/EC. Directive 2008/50/EC of the European Parliament and of the Council of 21 May 2008 on Ambient Air Quality and Cleaner Air for Europe. Available online: https://eur-lex.europa.eu/legal-content/en/ALL/?uri=CELEX%3A32008L0050, (accessed on 5 June 2023).
  10. Limit—Value-Benzene. Available online: https://limitvalue.ifa.dguv.de (accessed on 5 June 2023).
  11. Chi, Z.H.; Goodyer, C.G.; Hales, B.F.; Bayen, S. Characterization of different contaminants and current knowledge for defining chemical mixtures in human milk: A review. Environ. Int. 2023, 171, 107717. [Google Scholar] [CrossRef]
  12. Barr, D.B.; Wang, R.Y.; Needham, L.L. Biologic monitoring of exposure to environmental chemicals throughout the life stages: Requirements and issues for consideration for the National Children’s Study. Environ. Health Perspect. 2005, 113, 1083–1091. [Google Scholar] [CrossRef]
  13. Drabinska, N.; Flynn, C.; Ratcliffe, N.; Belluomo, I.; Myridakis, A.; Gould, O.; Fois, M.; Smart, A.; Devine, T.; Costello, B.L. A literature survey of all volatiles from healthy human breath and bodily fluids: The human volatilome. J. Breath Res. 2021, 15, 034001. [Google Scholar] [CrossRef]
  14. Lin, Y.J.; Feng, C.; Le, S.Y.; Qiu, X.L.; Xu, Q.; Jin, S.P.; Fang, Y.M.; Jin, Y.E.; Wen, Y.M.; Wang, G.Q.; et al. Infant Exposure to PCBs and PBDEs Revealed by Hair and Human Milk Analysis: Evaluation of Hair as an Alternative Biomatrix. Environ. Sci. Technol. 2022, 56, 15912–15919. [Google Scholar] [CrossRef]
  15. Kim, S.R.; Halden, R.U.; Buckley, T.J. Volatile organic compounds in human milk: Methods and measurements. Environ. Sci. Technol. 2007, 41, 1662–1667. [Google Scholar] [CrossRef] [PubMed]
  16. Wilhelm, M.; Ewers, U.; Wittsiepe, J.; Furst, P.; Holzer, J.; Eberwein, G.; Angerer, J.; Marczynski, B.; Ranft, U. Human biomonitoring studies in North Rhine-Westphalia, Germany. Int. J. Hyg. Environ. Health 2007, 210, 307–318. [Google Scholar] [CrossRef]
  17. Rondanelli, M.; Perdoni, F.; Infantino, V.; Faliva, M.A.; Peroni, G.; Iannello, G.; Nichetti, M.; Alalwan, T.A.; Perna, S.; Cocuzza, C. Volatile Organic Compounds as Biomarkers of Gastrointestinal Diseases and Nutritional Status. J. Anal. Methods Chem. 2019, 2019, 7247802. [Google Scholar] [CrossRef]
  18. Costello, B.D.; Amann, A.; Al-Kateb, H.; Flynn, C.; Filipiak, W.; Khalid, T.; Osborne, D.; Ratcliffe, N.M. A review of the volatiles from the healthy human body. J. Breath Res. 2014, 8, 014001. [Google Scholar] [CrossRef]
  19. Smith, D. Worldwide trends in DDT levels in human breast milk. Int. J. Epidemiol. 1999, 28, 179–188. [Google Scholar] [CrossRef]
  20. Oliveira, M.; Duarte, S.; Delerue-Matos, C.; Pena, A.; Morais, S. Exposure of nursing mothers to polycyclic aromatic hydrocarbons: Levels of un-metabolized and metabolized compounds in breast milk, major sources of exposure and infants’ health risks. Environ. Pollut. 2020, 266, 115243. [Google Scholar] [CrossRef] [PubMed]
  21. Cok, I.; Mazmanci, B.; Mazmanci, M.A.; Turgut, C.; Henkelmann, B.; Schramm, K.W. Analysis of human milk to assess exposure to PAHs, PCBs and organochlorine pesticides in the vicinity Mediterranean city Mersin, Turkey. Environ. Int. 2012, 40, 63–69. [Google Scholar] [CrossRef]
  22. Lehmann, G.M.; LaKind, J.S.; Davis, M.H.; Hines, E.P.; Marchitti, S.A.; Alcala, C.; Lorber, M. Environmental Chemicals in Breast Milk and Formula: Exposure and Risk Assessment Implications. Environ. Health Perspect. 2018, 126, 96001. [Google Scholar] [CrossRef]
  23. Louis, L.M.; Kavi, L.K.; Boyle, M.; Pool, W.; Bhandari, D.; De Jesús, V.R.; Thomas, S.; Pollack, A.Z.; Sun, A.; McLean, S.; et al. Biomonitoring of volatile organic compounds (VOCs) among hairdressers in salons primarily serving women of color: A pilot study. Environ. Int. 2021, 154, 106655. [Google Scholar] [CrossRef] [PubMed]
  24. Bolden, A.L.; Kwiatkowski, C.F.; Colborn, T. New Look at BTEX: Are Ambient Levels a Problem? Environ. Sci. Technol. 2015, 49, 5261–5276. [Google Scholar] [CrossRef] [PubMed]
  25. Malik, P.; Hashim, T.; Varma, S.; Diaz, L.; Chowdhary, A.; Bapat, P.; Alkhatib, L.; Centeno, L.; Poursina, O.; Pan, H.; et al. BTEX (benzene, toluene, ethylbenzene, and xylene) and risk of cancer—A study from Centers for Disease Control and Prevention’s National Health and Nutrition Examination Survey. Am. J. Clin. Pathol. 2022, 158, S102–S103. [Google Scholar] [CrossRef]
  26. Gould, O.; Nguyen, N.; Honeychurch, K.C. New Applications of Gas Chromatography and Gas Chromatography-Mass Spectrometry for Novel Sample Matrices in the Forensic Sciences: A Literature Review. Chemosensors 2023, 11, 527. [Google Scholar] [CrossRef]
  27. Atsdr-Styrene. In Atsdr Toxicological Profile for Styrene; Agency for Toxic Substances and Disease Registry, U.S. Department of Human and Health Services: Atlanta, GA, USA, 2010. Available online: https://www.atsdr.cdc.gov/toxprofiles/tp53.pdf (accessed on 25 June 2023).
  28. Branch, V.; Pirkle, J.L. Laboratory Procedure Manual Analyte: Volatile Organic Compounds (VOCs) Metabolites Matrix: Urine Method: Ultra Performance Liquid Chromatography with Electro Spray Tandem Mass Spectrometry [UPLC ESI/MSMS]. Available online: https://wwwn.cdc.gov/nchs/data/nhanes/2015-2016/labmethods/UVOC_UVOCS_I_MET.pdf (accessed on 5 June 2023).
  29. INCHEM. Available online: https://inchem.org (accessed on 5 August 2023).
  30. Atsdr-Ethylbenzene. In Atsdr Toxicological Profile for Ethylbenzene; Agency for Toxic Substances and Disease Registry, U.S. Department of Health and Human Services: Atlanta, GA, USA, 2010. Available online: https://www.atsdr.cdc.gov/ToxProfiles/tp110.pdf (accessed on 25 June 2023).
  31. Atsdr-Xylene. In Atsdr Toxicological Profile for Xylene; Agency for Toxic Substances and Disease Registry, U.S. Department of Health and Human Services: Atlanta GA, USA, 2007. Available online: https://www.atsdr.cdc.gov/ToxProfiles/tp71.pdf (accessed on 25 June 2023).
  32. ICH-M10-Guideline-2022. ICH Harmonised Guideline: Bioanalytical Method Validation and Study Sample Analysis-M10 ICH Consensus Guideline. Available online: https://database.ich.org/sites/default/files/M10_Guideline_Step4_2022_0524.pdf (accessed on 3 April 2023).
  33. Bioanalytical Method Validation: Guidance for Industry. Available online: https://www.fda.gov/media/70858/download (accessed on 3 April 2023).
  34. SWGTOX. Scientific Working Group for Forensic Toxicology: Standard Practices for Method Validation in Forensic Toxicology. J. Anal. Toxicol. 2013, 37, 452–474. [Google Scholar] [CrossRef] [PubMed]
  35. 2002/657/EC. Commission Decision of 12 August 2002 Implementing Council Directive 96/23/EC Concerning the Performance of Analytical Methods and the Interpretation of Results. Available online: https://eur-lex.europa.eu/eli/dec/2002/657/oj, (accessed on 3 April 2023).
  36. US-EPA. Risk Based Concentration Table; United States Environmental Protection Agency: Philadelphia, PA, USA; Washington, DC, USA, 2000.
  37. Milk-Consumption. Available online: https://www2.hse.ie/babies-children/breastfeeding/expressing-pumping/how-much-breast-milk-express/ (accessed on 3 March 2023).
  38. Weight-WHO. Available online: https://www.who.int/tools/child-growth-standards/standards/weight-velocity (accessed on 6 April 2023).
  39. Rogan, W.J.; Ragan, N.B. Chemical contaminants, pharmacokinetics, and the lactating mother. Environ. Health Perspect. 1994, 102 (Suppl. S11), 89–95. [Google Scholar] [CrossRef]
  40. US-EPA. 2020. Available online: https://iris.epa.gov/AtoZ/?list_type=alpha (accessed on 21 May 2021).
  41. OEHHA. Office of Environmental Health Hazards Assessment. 2020. Available online: https://oehha.ca.gov (accessed on 21 May 2021).
  42. RAIS. The Risk Assessment Information System. 2020. Available online: https://rais.ornl.gov (accessed on 2 June 2021).
  43. Cailleux, A.; Cogny, M.; Allain, P. Blood isoprene concentrations in humans and in some animal species. Biochem. Med. Metab. Biol. 1992, 47, 157–160. [Google Scholar] [CrossRef]
  44. Biren, C.; Zhang, L.Y.; Bhandari, D.; Blount, B.C.; De Jesús, V.R. Isoprene Exposure in the United States Based on Urinary IPM3: NHANES 2015–2016. Environ. Sci. Technol. 2020, 54, 2370–2378. [Google Scholar] [CrossRef]
  45. Sukul, P.; Richter, A.; Junghanss, C.; Schubert, J.K.; Miekisch, W. Origin of breath isoprene in humans is revealed via multi-omic investigations. Commun. Biol. 2023, 6, 999. [Google Scholar] [CrossRef]
  46. Nolan, L.S.; Lewis, A.N.; Gong, Q.; Sollome, J.J.; DeWitt, O.N.; Williams, R.D.; Good, M. Untargeted Metabolomic Analysis of Human Milk from Mothers of Preterm Infants. Nutrients 2021, 13, 3604. [Google Scholar] [CrossRef]
  47. Marincola, F.C.; Noto, A.; Caboni, P.; Reali, A.; Barberini, L.; Lussu, M.; Murgia, F.; Santoru, M.L.; Atzori, L.; Fanos, V. A metabolomic study of preterm human and formula milk by high resolution NMR and GC/MS analysis: Preliminary results. J. Matern. Fetal Neonatal Med. 2012, 25, 62–67. [Google Scholar] [CrossRef]
  48. Kus-Yamashita, M.M.M.; Cano, C.B.; Monteiro, V.C.B.; Catarino, R.M. Human Milk: Fast Determination of Docosahexaenoic Acid (DHA). Analytica 2023, 4, 54–65. [Google Scholar] [CrossRef]
  49. EFSA-Citronellol. Safety and efficacy of non-conjugated and accumulated unsaturated straight-chain and branched-chain, aliphatic primary alcohols, aldehydes, acids, acetals and esters belonging to chemical group 4 when used as flavourings for all animal species EFSA Panel on Additives and Products or Substances used in Animal Feed (FEEDAP). EFSA J. 2016, 14, 4559. [Google Scholar]
  50. Kumar, A.; Mishra, A.K. Biological Importance of Phenol Derivatives as Potent Bioactive Compound: A Review. Lett. Org. Chem. 2018, 15, 251–264. [Google Scholar] [CrossRef]
  51. Maela, M.P.; van der Walt, H.; Serepa-Dlamini, M.H. The Antibacterial, Antitumor Activities, and Bioactive Constituents’ Identification of Alectra sessiliflora Bacterial Endophytes. Front. Microbiol. 2022, 13, 870821. [Google Scholar] [CrossRef] [PubMed]
  52. EC-SCCS-Opinion-1, 4-THB. European Commission: Scientific Committee on Consumer Safety (SCCS), Opinion on Hair Dye 1,2,4-trihydroxybenzene (1,2,4-THB): COLIPA n° A33. Available online: https://health.ec.europa.eu/system/files/2021-08/sccs_o_222_0.pdf (accessed on 25 January 2024).
  53. Niu, Y.M.; Wang, B.; Zhao, Y.F.; Zhang, J.; Shao, B. Highly Sensitive and High-Throughput Method for the Analysis of Bisphenol Analogues and Their Halogenated Derivatives in Breast Milk. J. Agric. Food Chem. 2017, 65, 10452–10463. [Google Scholar] [CrossRef] [PubMed]
  54. Rovira, J.; Martinez, M.A.; Mari, M.; Cunha, S.C.; Fernandes, J.O.; Marmelo, I.; Marques, A.; Haug, L.S.; Thomsen, C.; Nadal, M.; et al. Mixture of environmental pollutants in breast milk from a Spanish cohort of nursing mothers. Environ. Int. 2022, 166, 107375. [Google Scholar] [CrossRef] [PubMed]
  55. TDI-Toluene-Xylenes. 2023. Available online: https://www.canada.ca/en/health-canada/services/publications/healthy-living/guidelines-canadian-drinking-water-quality-toluene-ethylbenzene-xylenes/guidelines-canadian-drinking-water-quality-guideline-technical-document-toluene-ethylbenzene-xylenes-page-11.html (accessed on 22 August 2023).
  56. TDI-Styrene. Available online: https://inchem.org/documents/jecfa/jecmono/v19je15.htm (accessed on 25 June 2023).
  57. MADL-Benzene. Available online: https://oehha.ca.gov/media/downloads/crnr/benzene20madlfinal.pdf (accessed on 22 August 2023).
  58. LOAEL-Isoprene. Summary of Initial Risk Assessment Report: Isoprene-PRTR No of Japan: 28. Available online: https://www.nite.go.jp/en/chem/chrip/chrip_search/dt/pdf/CI_02_001/risk/pdf_gaiyou_en/028sum.pdf (accessed on 5 September 2023).
  59. ECHA-LOEC/2. Available online: https://echa.europa.eu/documents/10162/13632/information_requirements_r10_en.pdf/bb902be7-a503-4ab7-9036-d866b8ddce69 (accessed on 5 August 2023).
  60. ECHA-Isoprene. Available online: https://echa.europa.eu/documents/10162/431f6bc0-a4b3-a1a1-4e8f-6c8eb48ab64a (accessed on 5 September 2023).
  61. EFSA-LOQ/2. Use of cut-off values on the limits of quantification reported in datasets used to estimate dietary exposure to chemical contaminants. EFSA J. 2018, 15, 1452E. [Google Scholar]
  62. Seeber, A.; Demes, P.; Kiesswetter, E.; Schäper, M.; van Thriel, C.; Zupanic, M. Changes of neurobehavioral and sensory functions due to toluene exposure below 50 ppm? Environ. Toxicol. Pharmacol. 2005, 19, 635–643. [Google Scholar] [CrossRef]
  63. Seeber, A.; Schäper, M.; Zupanic, M.; Blaszkewicz, M.; Demes, P.; Kiesswetter, E.; van Thriel, C. Toluene exposure below 50 ppm and cognitive function: A follow-up study with four repeated measurements in rotogravure printing plants. Int. Arch. Occup. Environ. Health 2004, 77, 1–9. [Google Scholar] [CrossRef]
  64. Korsak, Z.; Wisniewska-Knypl, J.; Swiercz, R. Toxic effects of subchronic combined exposure to n-butyl alcohol and m-xylene in rats. Int. J. Occup. Med. Environ. Health 1994, 7, 155–166. [Google Scholar]
  65. EFSA-BMD-EFSA-Scientific-Committee. Guidance on the use of the benchmark dose approach in risk assessment. EFSA J. 2022, 20, e07584. [Google Scholar]
  66. US-EPA-Benzene. Available online: https://iris.epa.gov/ChemicalLanding/&substance_nmbr=276 (accessed on 25 January 2024).
  67. OEHHA-Ethylbenzene. Available online: https://oehha.ca.gov/chemicals/ethylbenzene (accessed on 26 January 2024).
  68. CDC-Environmental-Health. Available online: https://wwwn.cdc.gov/nchs/data/nhanes/2013-2014/labmethods/UVOC_H_MET.pdf (accessed on 25 January 2024).
  69. Thomas, S.N.; French, D.; Jannetto, P.J.; Rappold, B.A.; Clarke, W.A. Liquid chromatography-tandem mass spectrometry for clinical diagnostics. Nat. Rev. Methods Primers 2022, 2, 96. [Google Scholar] [CrossRef]
  70. Fabietti, F.; Ambruzzi, A.; Delise, M.; Sprechini, M.R. Monitoring of the benzene and toluene contents in human milk. Environ. Int. 2004, 30, 397–401. [Google Scholar] [CrossRef]
  71. Muelbert, M.; Galante, L.; Alexander, T.; Harding, J.E.; Pook, C.; Bloomfield, F.H. Odor-active volatile compounds in preterm breastmilk. Pediatr. Res. 2022, 91, 1493–1504. [Google Scholar] [CrossRef]
  72. Contador, R.; Delgado, F.J.; García-Parra, J.; Garrido, M.; Ramírez, R. Volatile profile of breast milk subjected to high-pressure processing or thermal treatment. Food Chem. 2015, 180, 17–24. [Google Scholar] [CrossRef]
  73. Pazo, D.Y.; Moliere, F.; Sampson, M.M.; Reese, C.M.; Agnew-Heard, K.A.; Walters, M.J.; Holman, M.R.; Blount, B.C.; Watson, C.H.; Chambers, D.M. Mainstream Smoke Levels of Volatile Organic Compounds in 50 US Domestic Cigarette Brands Smoked with the ISO and Canadian Intense Protocols. Nicotine Tob. Res. 2016, 18, 1886–1894. [Google Scholar] [CrossRef] [PubMed]
  74. Wu, G.J.; Gong, S.W.; He, Y.; Liu, D. Smoking is associated with elevated blood level of volatile organic compounds: A population-based analysis of NHANES 2017-2018. Arch. Public Health 2023, 81, 55. [Google Scholar] [CrossRef]
  75. Yaqub, G.; Hamid, A.; Khan, N.; Ishfaq, S.; Banzir, A.; Javed, T. Biomonitoring of Workers Exposed to Volatile Organic Compounds Associated with Different Occupations by Headspace GC-FID. J. Chem. 2020, 2020, 6956402. [Google Scholar] [CrossRef]
  76. Longo, V.; Forleo, A.; Giampetruzzi, L.; Siciliano, P.; Capone, S. Human Biomonitoring of Environmental and Occupational Exposures by GC-MS and Gas Sensor Systems: A Systematic Review. Int. J. Environ. Res. Public Health 2021, 18, 10236. [Google Scholar] [CrossRef]
  77. Wolff, M.S. Occupationally Derived Chemicals in Breast-Milk. Am. J. Ind. Med. 1983, 4, 259–281. [Google Scholar] [CrossRef] [PubMed]
  78. Fisher, J.; Mahle, D.; Bankston, L.; Greene, R.; Gearhart, J. Lactational transfer of volatile chemicals in breast milk. Am. Ind. Hyg. Assoc. J. 1997, 58, 425–431. [Google Scholar] [CrossRef]
  79. US-EPA-Water-HA. Available online: https://www.epa.gov/system/files/documents/2022-01/dwtable2018.pdf (accessed on 25 January 2024).
  80. Fleming-Jones, M.E.; Smith, R.E. Volatile organic compounds in foods: A five year study. J. Agric. Food Chem. 2003, 51, 8120–8127. [Google Scholar] [CrossRef] [PubMed]
Figure 1. GC-MS/MS TIC MRM chromatogram of spiked mixture of 25 VOCs + 4 ILISs at 10 ng/mL.
Chemosensors 12 00030 g001
Figure 2. LC-ESI-MS/MS TIC MRM chromatogram of standard mixture of 9 metabolites at 10 ng/mL.
Chemosensors 12 00030 g002
Figure 3. LC-ESI-MS/MS SRM chromatogram of BMA quantitation (A) and confirmation (B) transition in a positive maternal milk sample.
Chemosensors 12 00030 g003
Figure 4. GC-MS full-scan spectra of (A) 1,1-dimethylhydrazine and (B) bisphenol-A in positive maternal milk samples (the above spectra correspond to those obtained in the maternal milk samples, while the spectra below correspond to those from the NIST library).
Chemosensors 12 00030 g004
Table 1. GC-MS/MS method target VOC analytes, retention time (RT) and physicochemical properties. SRM transitions (quantifier and qualifier, including ratio) and MS parameters for VOCs.
NumberRT (min)CompoundMolecular FormulaCAS No.Octanol/Water Partition Coefficient (Log Pow)/Solubility in Water [29]Molecular Mass (Da)Boiling Point (°C)QuantifierCollision Energy CE (V)Qualifier 1
Qualifier 2
CE, VSRM Ratio %
19.031,2-DichloroetheneC2H2Cl2540-59-02.0/poor solubility in water96.955596 > 96161, 98 *na **na **
29.12Methyl tert-butyl-etherC5H12O1634-04-41.06/4.24 g/100 mL at 20 °C88.25573 > 73073 > 43516
39.51TetrahydrofuranC₄H₈O109-99-90.46 (estimated)/freely soluble72.16671 > 71172 > 42
72 > 72
10
1
8
410.11DichloromethaneCH2Cl275-09-21.25/1.3 g/100 mL at 20 °C: (moderate)84.94075 > 75186, 84.9, 84, 75 *na **na **
510.21IsopreneC5H878-79-52.3/642 mg/L at 25 °C: (very poor), insoluble in water68.13467 > 67167 > 411720
610.301,2-DichloroethaneC2H4Cl2203-458-11.48/0.87 g/100 mL98.9683.598 > 62197 > 921012
710.301,2-Dichloroethane-D4C2H3Cl2107-06-2 102.988366 > 651102 > 651740
810.31BenzeneC6H671-43-22.13/0.18 g/100 mL at 25 °C78.18078 > 78152 > 52
78 > 52
18
1
20
910.33HexaneC6H14110-54-33.9/0.0013 g/100 mL at 20 °C:86.26857 > 57057 > 41545
1010.612-Methyl-pentaneC6H14107-83-53.2 (estimated)/no solubility in water86.26071 > 71071 > 431270
1112.50HeptaneC7H16142-82-54.66/2.2 mg/L at 25 °C: (very poor)100.298.443 > 43171 > 43
71 > 71
4
1
42
1212.912,2,4-Trimethyl-pentaneC8H18540-84-1No water solubility114.39957 > 57185 > 43
43 > 43
24
1
15
1312.92Toluene-D8C7D82037-26-50.5 g/L in water at 20 °C100.19111100 > 1001100 > 98
98 > 98
5
1
35
1413.01TolueneC7H8108-88-32.69/no water solubility92.111191 > 91192 > 65
91 > 65
91 > 39
5
15
24
45
1513.10OctaneC8H18111-65-94.00/5.18/no water solubility114.2212643 > 43185 > 431115
1613.411,3-DichloropropeneC3H4Cl2542-75-61.82/0.2 g/100 mL at 20 °C11110875 > 75175 > 49
110 > 75
10
13
5
1713.501,1,2-TrichloroethaneC2H3Cl379-00-52.35/0.45 g/100 mL at 20 °C: (very poor)133.411496 > 961132 > 131
133 > 83
5
17
10
1813.81TetrachloroethyleneC2Cl4127-18-43.4/0.015 g/100 mL at 20 °C165.812196 > 961165 > 94
165 > 131
129 > 94
27
18
15
35
1915.22Chlorobenzene-D5C6D5Cl3114-55-40.49 g/L in water at 20 °C117.59132117 > 1171117 > 851545
2015.23ChlorobenzeneC6H5Cl108-90-72.18/2.84/g/100 mL at 20 °C: 0.05112.6132112 > 7713112 > 112135
2115.25Ethyl benzeneC8H10100-41-43.1/g/100 mL at 20 °C: 0.015106.2136106 > 9114106 > 106
91 > 65
91 > 91
1
20
1
80
2215.48p-XyleneC6H4(CH3)2106-42-33.15/no solubility in water106.2138106 > 9114106 > 106
91 > 65
91 > 91
1
20
1
70
2315.48m-XyleneC6H4(CH3)2108-38-33.20/no solubility in water106.17138106 > 9114106 > 106
91 > 65
91 > 91
1
20
1
70
2516.01o-XyleneC6H4(CH3)295-47-63.12/no solubility in water106.2144106 > 9114106 > 106
91 > 65
91 > 91
1
20
1
100
2416.11o-Xylene-D10C6D4(CD3)256004-61-6146 mg/L in water at 25 °C116.23142116 > 1161116 > 981716
2616.14StyreneC8H8100-42-53.0/g/100 mL at 20 °C: 0.03104.2145104 > 7820103 > 77
104 > 104
18
1
80
2718.271,2,4 Trimethyl benzeneC9H1295-63-63.8/very poor solubility in water120.2169105 > 1051120 > 120
120 > 105
1
10
32
2818.971,2,3 Trimethyl benzeneC9H12526-73-83.7/g/100 mL: 0.005120.2176105 > 1051120 > 120
120 > 105
1
10
70
2919.01p-DichlorobenzeneC6H4Cl2106-46-73.37/mg/L at 20 °C: 49 (practically insoluble)147.0174146 > 7527146 > 111
111 > 111
111 > 75
10
1
7
65
* obtained using the SIM mode, ** na: not applicable.
Table 2. LC-ESI-MS/MS SRM transitions and MS parameters for VOC metabolites.
tR (min)CompoundParent CompoundBiological Half-LifeMolecular FormulaCASMolecular Mass (Da)Quantifier/
Qualifier
CE, VDwell TimeQ1 Pre BiasQ3 Pre BiasSRM Ratio %
2.3DL-MAStyreneseveral hours in the blood and about 2–4 days in subcutaneous adipose tissue [27]C₈H₈O₃90-64-2152.15151 > 10711100191610
152 > 108181002521
2.3R-MAEthyl Benzene27.5 h [30]C₈H₈O₃611-71-2152.15151 > 10713100192610
152 > 108131002610
3.3PGAEthyl Benzene
Styrene
27.5 h [30]C₈H6O₃611-73-4150.13149 > 7711100111815
148.6 > 105.1181001121
3.7HATolueneNo refC9H9NO3495-69-2179.17177.9 > 133.814100132390
178 > 76.9221001515
4.62-MHAXylene1 h [31]C10H11NO342013-20-7193.20192.2 > 148.111100141725
191.9 > 91.2181001618
8.23-MHAXylene1 h [31]C10H11NO327115-49-7193.20192.2 > 148.216100151720
192.2 > 91.2101002021
8.24-MHAXylene1 hC10H11NO327115-50-0193.20192.2 > 148.310100202120
192.2 > 91161002319
9.2PMABenzeneNo refC11H13NO3S4775-80-8239.30237.8 > 10910012212232
239 > 110100121924
9.4BMAToluene3–738 min (depending on the tissue)C12H15NO3S19542-77-9253.32252 > 12320100171325
253 > 124221001715
Table 3. Calibration metrics, ILISs used per compound, LOD, LLOQ, accuracy (mean recovery, n = 5) and precision (n = 5) at the LLOQ.
CompoundILISCalibration Range (ng/mL)Regression EquationR2LOD
(ng/mL)
LLOQ (ng/mL)Mean Recovery (LLOQ) ± RSD %Precision, %CV
Isoprene1,2-Dichloroethane-D40.1–100y = 7.2441x − 8.03260.99750.040.181 ± 128
2-Methyl pentaneToluene-D81–100y = 0.017x − 0.03270.99620.40185 ± 910
Methyl tert-butyl-ether1,2-Dichloroethane-D41–100y = 0.0134x − 0.01930.99480.40180 ± 1013
HexaneToluene-D80.5–100y = 0.1083x − 0.24390.99500.150.590 ± 1318
Dichloromethane1,2-Dichloroethane-D40.2–100y = 0.0894x − 0.23370.99610.060.292 ± 715
Tetrahydrofuran1,2-Dichloroethane-D41–100y = 0.0042x − 0.00140.99850.401100 ± 138
BenzeneToluene-D80.5–100y = 0.1113x − 0.29930.99810.060.283 ± 67
HeptaneToluene-D80.5–100y = 0.7784x − 2.22740.99820.200.580 ± 914
OctaneToluene-D80.2–100y = 0.8472x − 1.31770.99870.080.287 ± 1115
2,2,4-TrimethylpentaneToluene-D81–100y = 0.0095x − 0.0240.99630.40186 ± 911
TolueneToluene-D80.2–100y = 0.8548x − 1.80070.99820.080.288 ± 1412
1,3-DichloropropeneChlorobenzene-D51–100y = 0.0014x − 0.00310.99730.40182 ± 1018
1,1,2-TrichloroethaneChlorobenzene-D51–100y = 0.0019x − 0.00170.99880.40180 ± 917
TetrachloroethyleneChlorobenzene-D50.5–100y = 0.003x − 0.00420.99550.200.584 ± 620
ChlorobenzeneChlorobenzene-D50.5–100y = 0.003x − 0.00460.99580.200.591 ± 77
Ethyl benzeneChlorobenzene-D50.5–100y = 0.0052x + 0.00030.99840.200.592 ± 156
p-Xyleneo-Xylene-D100.2–100y = 0.0031x + 0.00210.99840.080.287 ± 125
m-Xyleneo-Xylene-D100.2–100y = 0.0308x + 0.01940.9980.080.289 ± 148
o-Xyleneo-Xylene-D100.5–100y = 0.0307x + 0.02430.99880.200.589 ± 89
Styreneo-Xylene-D100.2–100y = 1.0526x + 2.00680.99830.080.283 ± 513
1,2,4-TrimethylbenzeneChlorobenzene-D50.5–100y = 0.0094x − 0.00630.9960.200.590 ± 106
1,2,3-TrimethylbenzeneChlorobenzene-D50.5–100y = 0.0017x + 0.00260.99720.200.589 ± 147
p-DichlorobenzeneChlorobenzene-D50.2–100y = 0.0024x + 0.00220.99540.080.283 ± 816
1,2-Dichloroethene1,2-Dichloroethane-D41–100y = 0.0013x − 0.00220.99080.40178 ± 615
1,2-Dichloroethane1,2-Dichloroethane-D41–100y = 0.0021x + 0.99320.99320.40181 ± 812
MetaboliteCalibration Range (ng mL−1) LOD
(ng/mL)
LLOQ (ng/mL)Mean Recovery (LLOQ) ± RSD %Precision, %CV
DL-MA0.5–100y = 110,009x − 88660.200.591 ± 1515
R-MA0.5–100y = 811,288x – 13,3300.200.589 ± 1211
PGA0.4–100y = 9,803,147x + 208,2370.150.481 ± 119
2-MHA0.4–100y = 2,553,189x + 90,7070.150.484 ± 818
3-MHA0.4–100y = 3,723,117x + 58,0010.150.486 ± 915
4-MHA0.4–100y = 2,540,019x + 70,0050.150.481 ± 1214
BMA0.2–100y = 12,223,177x + 855,4580.080.289 ± 79
PMA0.2–100y = 6,690,883x – 411,3070.080.292 ± 1510
HA0.4–100y = 4,412,407x + 1,077,3410.150.4104 ± 1612
Table 4. Detections and concentrations positive for at least one substance in maternal milk samples (n = 3).
Substance Concentration (ng mL−1)
Sample CodeIsopreneBenzeneToluenep,m-XyleneStyreneBMAMA (DL and R)3-MHA
Sample 2n.d. an.d.n.d.0.39 ± 0.14n.d.n.d.0.79 ± 0.21<LLOQ
Sample 3n.d.n.d.n.d.n.d.n.d.<LLOQn.d.n.d.
Sample 4n.d.0.58 ± 0.15n.d.n.d.n.d.n.d.n.d.n.d.
Sample 5<LLOQn.d.n.d.n.d.n.d.n.d.<LLOQn.d.
Sample 120.11 ± 0.06n.d.0.63 ± 0.18n.d.0.40 ± 0.120.31 ± 0.11n.d.n.d.
Sample 18n.d.0.34 ± 0.14n.d.n.d.n.dn.d.n.dn.d.
a: non-detected.
Table 5. Worst-case calculations of EDIs and HQs for toluene, benzene, styrene, xylene and ethyl benzene and HQs and HIs for positive samples.
SubstanceConcentration (ng mL−1)EDI (mg/kg bw per day)NOAEL (mg/kg bw per day) bToxicological
Endpoint
TDI (mg/kg bw per day)TDI/10 (mg/kg bw per day) ***HQ
Toluene0.94 a9.40 × 10−59.7 × 10⁻² [55]Neurological (cognitive function) [62,63]9.7 × 10−39.7 × 10−49.69 × 10⁻²
Benzene0.585.80 × 10−58.4 × 10⁻¹ [57]Reproductive toxicity [57]2.4 × 10−2 *2.4 × 10−32.42 × 10−2
Styrene0.79 c7.90 × 10−520 ppm [27]Depression of the central nervous system (CNS) [56]4.0 × 10−24.0 × 10−31.97 × 10⁻²
Xylene0.59 d5.90 × 10−51.00 [55]Neurobehavioral alterations (motor coordination disturbances) [64]1.3 × 10−21.3 × 10−34.54 × 10⁻²
Ethyl benzene0.79 e7.90 × 10−510.17 [55,65] bCarcinogenicity (oxidative stress, lung tumors) [55]4.1 × 10−14.1 × 10−21.93 × 10⁻³
Isoprene0.111.10 × 10−529.5 [58]Repeated dose toxicity (spinal cord degeneration) [58]2.95 ** [58]2.95 × 10−13.70 × 10−5
HQs
SampleIsopreneBenzeneToluenep,m-XyleneStyreneEthyl benzeneHI
2 (A)na (C)nana4.54 × 10−21.97 × 10⁻²na6.51 × 10−2
2 (B)nanana4.54 × 10−2na1.93 × 10−34.73 × 10⁻²
3nana1.00 × 10−2nanana1.00 × 10−2
4na2.42 × 10−2nananana2.42 × 10−2
5 (A)1.60 × 10⁻⁵nanana6.20 × 10−3na6.22 × 10−3
5 (B)1.60 × 10⁻⁵nananana6.00 × 10−46.16 × 10⁻⁴
123.70 × 10⁻⁵na9.69 × 10−2na1.00 × 10−2na1.07 × 10−1
18na1.41 × 10−2nananana1.41 × 10−2
* for benzene, a NOEL value was used, derived from MADL from reproductive toxicity study; ** for the TDI of isoprene, the LOAEL/2 value was considered in place of the NOAEL (not available) and then divided by a factor of 10 for intraspecies variability to provide the TDI; *** a factor of 10 was considered for the calculations for infants. a: for calculations, the sum of toluene and BMA concentrations was regarded, since, to our knowledge, no TDI for BMA exists; b: related to the provided TDI, for ethyl benzene, it accounts for the benchmark dose (BMDL10); c: for styrene, the maximum concentration was attributed to the detection of MA as an exclusive metabolite of styrene (DL-MA); d: for calculations, the sum of p,m-xylene and 3-MHA (LLOQ/2) in sample 2 concentrations was regarded, since, to our knowledge, no TDI for 3-MHA exists; e: for ethyl benzene, the maximum concentration was attributed to the detection of MA as an exclusive metabolite of ethyl benzene (R-MA). (A): calculations regarded MA as an exclusive metabolite of styrene (DL-MA); (B): calculations regarded MA as an exclusive metabolite of ethyl benzene (R-MA); (C): not applicable.
Table 6. CPFo, CEDI and CR values (worst-case scenario) for benzene and ethylbenzene.
VOCCPFo (mg/kg per Day)CEDI (mg/kg bw per Day)CR
Benzene1.5 × 10−2 [66]5.8 × 10−58.7 × 10−7
Ethylbenzene1.1 × 10−2 [67]7.9 × 10−58.7 × 10−7
Table 7. Findings of the presented work compared to common substances reported in the literature.
Substances’ Concentrations and Ranges (ng mL−1)
TolueneBenzeneStyrenep,m-XyleneBMAReference
0.630.580.400.390.31This work
0.460.080.130.54na[8]
0.46–0.560.06–0.12na 1nana[15]
0.04–2.54 a0.01–0.18 ananana[70]
a: concentration in ng/g, 1: not applicable.
Table 8. VOC concentrations in maternal milk compared to US-EPA HA values for children.
VOCConcentration (mg L−1)HA One-Day (mg L−1)HA Ten-Day (mg L−1)
Benzene0.000580.20.2
Ethylbenzene0.00079303
Styrene0.00040202
Toluene0.00094202
Χylenes0.000594040
Disclaimer/Publisher’s Note: The statements, opinions and data contained in all publications are solely those of the individual author(s) and contributor(s) and not of MDPI and/or the editor(s). MDPI and/or the editor(s) disclaim responsibility for any injury to people or property resulting from any ideas, methods, instructions or products referred to in the content.

