Article

Label-Free Optical Biosensing Using Low-Cost Electrospun Polymeric Nanofibers

by
Paula Martínez-Pérez
1,
Salvador Ponce-Alcántara
1,
Nieves Murillo
2,
Ana Pérez-Márquez
2,
Jon Maudes
2,
Inés Peraile
3,
Laura González-López
4,
Matilde Gil-García
4,
Paloma Lorenzo-Lozano
4 and
Jaime García-Rupérez
1,*
1
Nanophotonics Technology Center, Universitat Politècnica de València, Camí de Vera s/n, 46022 Valencia, Spain
2
TECNALIA Research & Innovation, Mikeletegi Pasealekua, 2, 20009 Donostia-San Sebastián, Spain
3
Ingeniería de Sistemas para la Defensa de España (ISDEFE), 28040 Madrid, Spain
4
Área de Defensa Biológica, Departamento de Sistemas de Defensa NBQ, Instituto Nacional de Técnica Aeroespacial “Esteban Terradas” (INTA)-Campus La Marañosa, Crta. San Martín de la Vega (M−301), km 10.5, 28330 Madrid, Spain
*
Author to whom correspondence should be addressed.
Submission received: 28 October 2020 / Revised: 21 November 2020 / Accepted: 24 November 2020 / Published: 26 November 2020
(This article belongs to the Special Issue Smart Polymer-Based Chemical and Biological Sensors)

Abstract

:
Polymeric nanofiber matrices are promising structures to develop biosensing devices due to their easy and affordable large-scale fabrication and their high surface-to-volume ratio. In this work, the suitability of a polyamide 6 nanofiber matrix for the development of a label-free and real-time Fabry–Pérot cavity-based optical biosensor was studied. For such aim, in-flow biofunctionalization of nanofibers with antibodies, bound through a protein A/G layer, and specific biodetection of 10 µg/mL bovine serum albumin (BSA) were carried out. Both processes were successfully monitored via reflectivity measurements in real-time without labels and their reproducibility was demonstrated when different polymeric nanofiber matrices from the same electrospinning batch were employed as transducers. These results demonstrate not only the suitability of correctly biofunctionalized polyamide 6 nanofiber matrices to be employed for real-time and label-free specific biodetection purposes, but also the potential of electrospinning technique to create affordable and easy-to-fabricate at large scale optical transducers with a reproducible performance.

1. Introduction

Polymeric nanofiber (NF) layers are nanostructured materials made of fibers with diameters in the nanometer range. These NF layers offer, among others, a high surface-to-volume ratio, which has attracted great attention for their use in the development of technologies where a large surface area is required [1,2,3,4]. In addition to their morphological features, NFs are also outstanding because of their low-cost and easy manufacturing by the mainly-employed technique of electrospinning. It is a well-developed, versatile, and efficient method that requires a relatively inexpensive setup [5] and allows the fabrication of low-cost and complex electrospun membranes with a highly-porous 3D network from a wide diversity of polymers [6] and at a large scale, if properly configured [7,8].
By adjusting the electrospinning parameters and the polymer precursor composition, a particular NF diameter and layer thickness can be achieved to create a nanostructured thin film, showing a Fabry–Pérot (FP) cavity response when illuminated in the visible range [9]. This optical response has been previously exploited for the development of FP-based optical biosensors employing different porous materials such as porous silicon, porous alumina, or polymeric track-etched membranes [10,11,12]. These FP-based optical biosensors, as for other optical biosensors, show outstanding features such as a high sensitivity, a compact size, the possibility of performing label-free detection, immunity to electromagnetic interferences, and cost-effectiveness, among others [13]. Additionally, the pores present in the structure of the above-mentioned materials used for their fabrication increase the surface-to-volume ratio of the final biosensing device and allow the analytes to go move into the structure, where they interact with the whole optical field, thus resulting in a better sensitivity of FP-based optical biosensors when compared with evanescent-wave-based optical biosensors.
Taking advantage of the porous structure of NF layers and their FP cavity optical response in the visible range, the aim of the present work was to demonstrate the suitability of nanostructured thin films made of polyamide 6 (PA6) NFs for the development of a FP-based optical biosensor to carry out label-free biodetection assays in real time. For such aims, bovine serum albumin (BSA) model protein as the analyte and anti-BSA antibodies (αBSA) as the bioreceptors were used. Both processes of biofunctionalization and biodetection were performed in flow to follow the shift experienced by the reflectivity spectrum when biomolecules attach to the NF surface in real-time. Such attachment provokes variations in the effective refractive index of the NF layers, and thus, in its effective optical thickness (EOT) and the position of the reflectivity fringes. Finally, the biofunctionalization was demonstrated and the detection of 10 µg/mL BSA was achieved. These results show the suitability of PA6 NFs for the fabrication of feasible FP-based label-free optical biosensors at a lower cost and in an easier way when compared with other porous materials due to the electrospinning process employed for their fabrication.

2. Materials and Methods

2.1. Reagents

For the NF synthesis, a Nanospider 500 from El Marco (Liberec, Czech Republic) was employed. PA6 pellets (Ultramid B24 N 03) were purchased from BASF (Ludwigshafen, Germany). Acetic and formic acids were purchased from Panreac Química SLU (Barcelona, Spain). Pyridine (C5H5N) was purchased from Sigma-Aldrich (San Luis, MO, USA). The resulting NFs were deposited on a monocrystalline Czochralski silicon (c-Si) wafer purchased from Si-Mat (Kaufering, Germany).
For the biofunctionalization and biosensing experiments, recombinant protein A/G (AGp), 2-(4-morpholino)-ethane sulfonic acid (MES), casein blocker solution, and 10× phosphate buffer saline (PBS) solution were purchased from Thermo Fisher Scientific (Waltham, MA, USA). Sheep αBSA (A10-113A) was purchased from bioNova (Madrid, Spain) and BSA was purchased from Sigma-Aldrich (San Luis, MO, USA).

2.2. Nanofiber Fabrication and Stabilization

A solution of 6 wt% PA6 and 5 wt% pyridine salt in a 2:1 mixture of acetic and formic acids was electrospun over several polished silicon pieces of 15 mm × 15 mm at the same time (see Figure 1) using the configuration stated in previous research [9]. Briefly, a voltage of 60–75 kV was applied, a 170-mm distance between the roller and the ground electrode was kept, the deposition time was 20 min, and the temperature and relative humidity were room temperature and 40 ± 5%, respectively. As a result, a massive production of sensing NF layers can be achieved in a short period of time.
In order to improve the optical response of the resulting NF layers, a 3-nm-thick gold layer was deposited over them by sputtering for 3 min to increase the amplitude of the FP fringes in aqueous media [14]. Afterward, in order to stabilize their structure by welding the local contact network at the NF mesh, the NF layers were heated at 190 °C for 3 h under a pressure of approximately 500 g/cm2, allowed to cool down at room temperature, and immersed in water for 1 h [15]. This procedure, together with the deposition of the top gold layer, avoids the swelling of the structure during the flow of liquids at the biofunctionalization and biodetection phases and hence ensures the stability of the reflectivity spectrum along the experiment.

2.3. Flowing Experiments

Both biofunctionalization and biosensing steps were carried out by flowing the reagents over the nanofibers. For this, a microfluidic chamber was assembled on the NFs, which consists of a polymethylmethacrylate (PMMA) cover with an inlet and an outlet tube and a double-sided adhesive with a 100-µm height and a cavity of 2.0 mm × 7.0 mm (width × length) on its center that constitutes the flowing channel. The outlet tube was connected to a syringe pump working in withdraw mode at 20 µL/min (see Figure 2).

2.4. Biofunctionalization

The specificity of antigen–antibody binding was used in this biosensor to ensure a reliable detection of the target analyte. Such binding occurs through the antigen binding fragment (Fab) of the antibodies and the epitope of the analyte, which requires a correct orientation of the antibodies on the NF surface [16]. For this, AGp was used as the intermediate protein, since it can adsorb to the NF surface and bind the constant fragment (Fc) of the antibodies, attaching them to the NFs whilst leaving Fab exposed to the analyte solution [16,17,18].
To achieve such an oriented attachment of the antibodies to the NF surface, a 50 µg/mL AGp solution in 0.1 M MES buffer (pH 4.5) was flowed for 30 min. Then, the excess was removed by flowing 0.1 M MES for 10 min. Afterward, 2.5 mg/mL casein (1X PBS) solution was flowed for 30 min to block the remaining gaps between the AGp molecules in the NF surface, avoiding the unspecific adsorption of subsequent biomolecules to the surface and thus ensuring the specific recognition of αBSA by AGp and of BSA by αBSA. Finally, after removing the excess casein with 1X PBS, 50 µg/mL αBSA solution in 1X PBS was flowed for 25 min and the excess removed by flowing 1X PBS.

2.5. Optical Setup

A goniometer with two arms at 15° from the perpendicular axis was used. In one arm, an optical fiber with a collimator was connected to a HL-2000 tungsten halogen lamp (Ocean Optics, Dunedin, FL, USA) and used to illuminate the NF layer. On the other arm, another optical fiber connected to a Flame T spectrometer (Ocean Optics) collected the reflected light (see Figure 2). Employing the Ocean Optics software, the reflectivity spectrum was recorded every 4 s with a resolution of 207.5 pm and an integration time of 3 ms. To carry out the calibration of the equipment, an aluminum sample was used.

2.6. Data Processing

MATLAB (R2019b, MathWorks, Natick, MA, USA) was used to monitor the shift experienced by the reflectivity spectrum when the refractive index of the surrounding medium changed along the experiment. Raw data obtained from the spectrometer were interpolated to increase the resolution up to 1 pm and filtered to reduce the setup noise. For this, a fast Fourier transform (FFT) of the interpolated data was carried out, then normalized frequencies above 0.02 were eliminated and an inverse FFT was applied to the resulting data to recover the filtered reflectivity spectrum. Afterward, the maximum reflectivity peak to follow was selected and a Gaussian fitting was applied to localize maximum peak position. This process was automatically repeated for all the obtained reflectivity spectra to determine the shift of the maximum peak.

3. Results and Discussion

3.1. Bulk Sensitivity and Structural Characterization of NF Layers

The NF layer employed in this work was constituted of NFs with an initial diameter of 34 ± 5 nm (see Figure 3a). After carrying out the stabilization protocol described in Section 2.2, the contact points between NFs were welded and the NF diameter increased to 57 ± 13 nm because of the pressure and temperature applied (see Figure 3b). As a result, a stable NF layer was obtained and can be employed for in-flow experiments.
To start the in-flow experiment, the microfluidic chamber was assembled on the NF layer and deionized water (DIW) was flowed to characterize its reflectivity spectrum in an aqueous medium. In Figure 3c, a typical optical response of a FP cavity with several fringes in the reflectivity spectrum can be observed. Among all the fringes, the one with its maximum peak centered around 650 nm was the one whose wavelength position was going to be monitored during the in-flow assays, since the light source has a Gaussian power distribution centered around such wavelength region, which provides a higher signal-to-noise ratio.
Before carrying out the in-flow biofunctionalization of NFs, a calibration step was performed to check the bulk sensitivity of the NF layer and its structure stability after the stabilization process. For this aim, DIW (nDIW = 1.333) and 1X PBS (nPBS = 1.335) [19] were flowed for 5 min each. According to the smoothed data in Figure 4, a spectral shift of the maximum peak of 1.22 ± 0.01 nm toward longer wavelengths was obtained for the 2 × 10⁻³ RIU (refractive index unit) change. Since the linear response of this type of NF layer in the range from 2 × 10⁻³ to 2.5 × 10⁻³ RIU has been previously demonstrated [14], sensitivity can be directly estimated to be ca. 610 ± 5 nm/RIU from the spectral shift observed. Additionally, the limit of detection (LOD) can be estimated from the expression:
LOD = 3 σ/S
where σ is the noise of the system during the continuous flow of a certain reagent and S is the estimated sensitivity. In this case, the LOD was estimated to be ca. 4.9 × 10⁻⁵ ± 4 × 10⁻⁷ RIU (considering σ = 0.01 nm, which was estimated from the first two minutes of the smoothed data from the experiment).
Regarding the stability of the NF layer, the fact that the maximum peak position stayed centered at a given wavelength when both DIW and 1X PBS were flowed together with the absence of a drift in the measurement demonstrate that the structure is not swelling, and hence, that it was properly stabilized [14,15].

3.2. In-Flow Biofunctionalization of NFs Surface

Once the NF layer was stabilized and its optical response and sensitivity were characterized, the in-flow biofunctionalization process was carried out and the binding of biomolecules to the NF surface was followed in real-time by monitoring the wavelength position of the reflectivity peak around 650 nm.
The first solution to be flowed was 0.1 M MES to create a reference baseline and then, 50 µg/mL AGp (0.1 M MES) solution for 30 min was flowed to adsorb the protein to the NF surface. To remove the excess protein, 0.1 M MES was flowed again for 10 min. As a result, a positive net spectral shift of 1.95 nm could be observed (see Figure 5). In the end, the fact that the maximum peak reached a stable final spectral position (i.e., a position centered at a given wavelength) when 0.1 M MES was flowed demonstrates that the RI change provoked by the binding of AGp to the surface of the NF layer was stable and thus, its desorption did not occur.
The subsequent step, after the AGp layer formation over the NFs, was flowing a 2.5 mg/mL casein solution in 1X PBS to block the remaining voids between the AGp molecules and avoid the unspecific adsorption of subsequent αBSA and BSA molecules. After removing the excess casein by flowing 1X PBS solution for 10 min, a net spectral shift of 4.2 nm was observed (see Figure 6a).
Finally, a 50 µg/mL solution of αBSA in 1X PBS was flowed. Binding of αBSA by means of their Fc region to AGp led to a final spectral shift of 0.65 nm (see Figure 6b), after flowing 1X PBS and removing the excess of αBSA solution from the medium. The final position of the maximum peak centered at a given wavelength while flowing 1X PBS for the last five minutes demonstrated that the binding of αBSA to AGp was stable and unbinding did not occur.

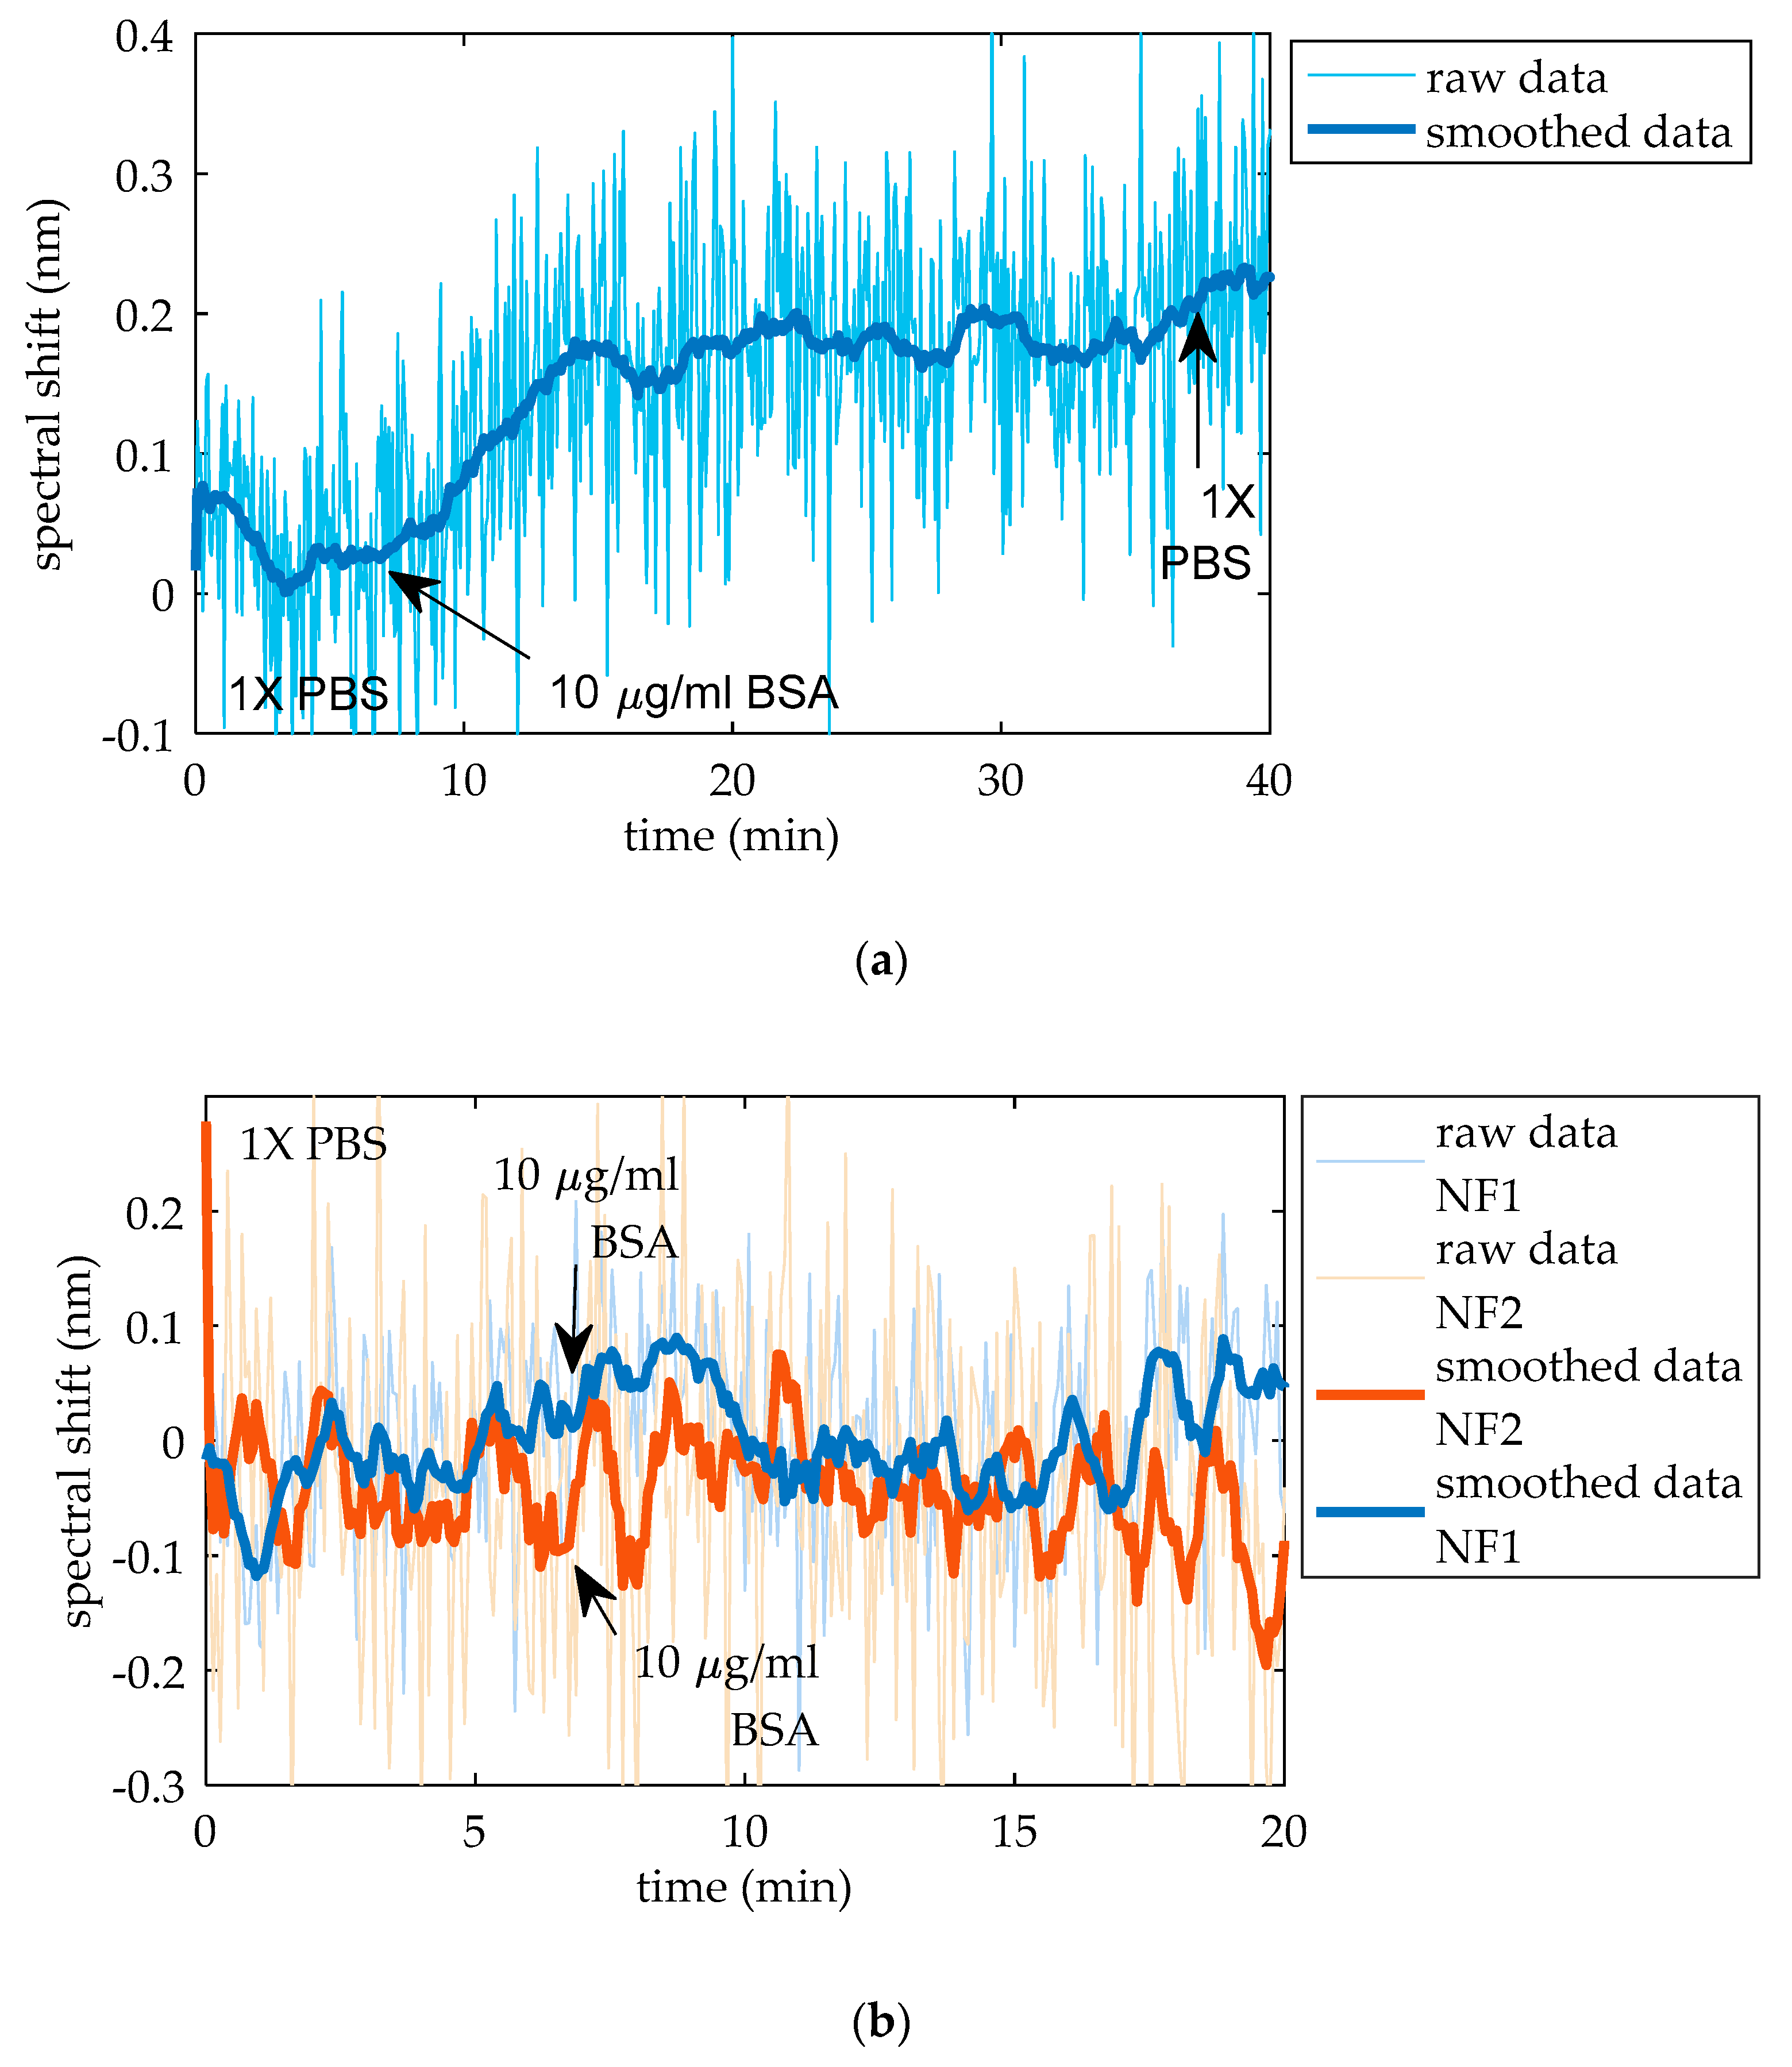
3.3. In-Flow BSA Biodetection

At this point, an AGp–αBSA layer on the NFs surface is created and the in-flow biodetection of BSA can be performed. For such aim, a solution of 10 µg/mL BSA was flowed and a net spectral shift of 200 pm was observed (see Figure 7a).
To discard that the observed spectral shift when BSA was flowed was due to the unspecific adsorption of BSA to the NF surface and to corroborate that BSA was specifically detected by αBSA, 10 µg/mL BSA solution was flowed over two other NF layers (named as NF1 and NF2) of the same electrospinning batch not having the αBSA bioreceptors. To this aim, 50 μg/mL AGp and 2.5 mg/mL casein were flowed over such NFs as previously stated in Section 3.2, but now the αBSA flowing step was avoided. In absence of the bioreceptor, when BSA was flowed, the slope attributed to the binding of BSA by αBSA could not be seen (see Figure 7b), thus demonstrating the specific recognition of BSA by αBSA in the previous experiment.
Once the specificity of BSA detection was demonstrated, both the biofunctionalization and biodetection steps were replicated in two other different NF layers from the same electrospinning batch. The aim was to test whether electrospinning allows for the creation of several NF layers with similar responses during the biofunctionalization and biodetection steps and whether these steps are reproducible when the specific transducer changes. Figure 8 summarizes the experimental results obtained for these three samples, where it is indicated that NF layers from the same batch have a similar response for all the biofunctionalization and biodetection steps. Additionally, these results also confirm the reproducibility of the biofunctionalization and biodetection steps when similar transducers are employed and the suitability of NFs layers for the specific biodetection of BSA. In conclusion, these results demonstrate the suitability of the electrospinning method to ease the fabrication process of optical transducers with a similar response for biodetection purposes.

4. Conclusions

The results presented in this work demonstrate the suitability of electrospun PA6 NF layers for the development of FP-based optical biosensors, which have been shown to be capable of specifically detecting the presence of a certain target analyte in aqueous solution when they are properly biofunctionalized. For this aim, real-time and label-free optical measurements were performed, allowing the monitorization not only of BSA biodetection, but also of NF surface biofunctionalization. Together with the fact that measurements are performed in the visible range, the use of PA6 FP-based biosensors implies cuts in experimental time and costs. Additionally, alternative porous materials such as porous silicon or porous alumina require longer fabrication procedures that require the use of dangerous reagents [21,22], whilst the electrospinning technique employed for the fabrication of NF layers is an easier, safer, and cheaper manufacturing method [23].
Regarding the biodetection results, similar optical responses were observed when both biofunctionalization and biodetection procedures were performed in several samples from the same electrospinning batch, demonstrating the potential of electrospinning for the massive fabrication of transducers with similar characteristics, which would ease the massive production and use of the resulting biosensors. Nevertheless, a weak point of these NF layers as FP-based biosensors is the low Q-factor they show when compared with other photonic structures such as ring resonators [24] or photonic crystals [25], among others. In the last term, this low Q-factor can hinder the biodetection of tiny amounts of the analyte. Therefore, a compromise between sensitivity and low-cost of fabrication and experimental process and setup must be achieved according to the desired application.
In a nutshell, these results pave the way for the use of electrospun PA6 NF matrices for the development of cheaper and easier-to-fabricate at large scales optical biosensing devices for massive use. New biofunctionalization protocols involving bioreceptors different from antibodies may be explored in the near future to make NF layers specific toward different analytes of interest in different application fields.

Author Contributions

Conceptualization, methodology and writing, P.M.-P., J.G.-R., N.M., M.G.-G., and P.L.-L.; Investigation, P.M.-P., S.P.-A., A.P.-M., J.M., I.P., and L.G.-L.; Writing—original draft preparation, P.M.-P.; Writing—review and editing, J.G.-R., N.M., M.G.-G., and P.L.-L.; Funding acquisition, J.G.-R. and N.M. All authors have read and agreed to the published version of the manuscript.

Funding

This research was supported by a co-financed action by the European Union through the operational program of the European Regional Development Fund (FEDER) of the Valencian Community 2014–2020, the Generalitat Valenciana through the PROMETEO project AVANTI/2019/123 and the grant PPC/2020/037, the Spanish government through the project TEC2015-63838-C3-OPTONANOSENS, Universitat Politècnica de València through grant PAID-01-17, and by the Basque government through the project μ4Industry, KK-2019/00101, from the ELKARTEK Program.

Conflicts of Interest

The authors declare no conflict of interest.

References

  1. Kenry; Lim, C.T. Nanofiber technology: Current status and emerging developments. Prog. Polym. Sci. 2017, 70, 1–17. [Google Scholar] [CrossRef]
  2. Al-Enizi, A.M.; Zagho, M.M.; Elzatahry, A.A. Polymer-based electrospun nanofibers for biomedical applications. Nanomaterials 2018, 8, 259. [Google Scholar] [CrossRef] [PubMed] [Green Version]
  3. Bonso, J.S.; Kalaw, G.D.; Ferraris, J.P. High surface area carbon nanofibers derived from electrospun PIM-1 for energy storage applications. J. Mater. Chem. A 2014, 2, 418–424. [Google Scholar] [CrossRef]
  4. Najafi, M.; Frey, M.W. Electrospun nanofibers for chemical separation. Nanomaterials 2020, 10, 982. [Google Scholar] [CrossRef]
  5. Matulevicius, J.; Kliucininkas, L.; Martuzevicius, D.; Krugly, E.; Tichonovas, M.; Baltrusaitis, J. Design and characterization of electrospun polyamide nanofiber media for air filtration applications. J. Nanomater. 2014, 2014, 859656. [Google Scholar] [CrossRef] [Green Version]
  6. Ding, J.; Zhang, J.; Li, J.; Li, D.; Xiao, C.; Xiao, H.; Yang, H.; Zhuang, X.; Chen, X. Electrospun polymer biomaterials. Prog. Polym. Sci. 2019, 90, 1–34. [Google Scholar] [CrossRef]
  7. Wei, L.; Sun, R.; Liu, C.; Xiong, J.; Qin, X. Mass production of nanofibers from needleless electrospinning by a novel annular spinneret. Mater. Des. 2019, 179, 107885. [Google Scholar] [CrossRef]
  8. Teo, W.E.; Inai, R.; Ramakrishna, S. Technological advances in electrospinning of nanofibers. Sci. Technol. Adv. Mater. 2011, 12, 013002. [Google Scholar] [CrossRef] [Green Version]
  9. Ponce-Alcántara, S.; Martín-Sánchez, D.; Pérez-Márquez, A.; Maudes, J.; Murillo, N.; García-Rupérez, J. Optical sensors based on polymeric nanofibers layers created by electrospinning. Opt. Mater. Express 2018, 8, 3163–3175. [Google Scholar] [CrossRef]
  10. Martin-Sanchez, D.; Angelova, T.; Garcia-Ruperez, J. Simultaneous Refractive Index Sensing Using an Array of Suspended Porous Silicon Membranes. IEEE Sens. J. 2020, 20, 8497–8504. [Google Scholar] [CrossRef]
  11. Santos, A.; Balderrama, V.S.; Alba, M.; Formentín, P.; Ferré-Borrull, J.; Pallarès, J.; Marsal, L.F. Tunable fabry-pérot interferometer based on nanoporous anodic alumina for optical biosensing purposes. Nanoscale Res. Lett. 2012, 7, 370. [Google Scholar] [CrossRef] [PubMed] [Green Version]
  12. Martínez-Pérez, P.; García-Rupérez, J. Commercial polycarbonate track-etched membranes as substrates for low-cost optical sensors. Beilstein J. Nanotechnol. 2019, 10, 677–683. [Google Scholar] [CrossRef] [PubMed] [Green Version]
  13. Chen, C.; Wang, J. Optical biosensors: An exhaustive and comprehensive review. Analyst 2020, 145, 1605–1628. [Google Scholar] [CrossRef] [PubMed]
  14. Ponce-Alcantara, S.; Martin-Sanchez, D.; Kovylina, M.; Perez-Marquez, A.; Maudes, J.; Murillo, N.; Garcia-Ruperez, J. Dual refractive index and viscosity sensing using polymeric nanofibers optical structures. IEEE Sens. J. 2019, 19, 11850–11857. [Google Scholar] [CrossRef] [Green Version]
  15. Ponce-Alcántara, S.; Martínez-Pérez, P.; Pérez-Márquez, A.; Maudes, J.; Murillo, N.; García-Rupérez, J. Stabilization of polymeric nanofibers layers for use as real-time and in-flow photonic sensors. Sensors 2019, 19, 3847. [Google Scholar] [CrossRef] [Green Version]
  16. Sharma, S.; Byrne, H.; O’Kennedy, R.J. Antibodies and antibody-derived analytical biosensors. Essays Biochem. 2016, 60, 9–18. [Google Scholar]
  17. Choe, W.; Durgannavar, T.A.; Chung, S.J. Fc-binding ligands of immunoglobulin G: An overview of high affinity proteins and peptides. Materials 2016, 9, 994. [Google Scholar] [CrossRef] [Green Version]
  18. Peraile, I.; Lorenzo-Lozano, P.; Murillo, N.; Maudes, J.; Rozas, G.; González-López, L.; Cabria, J.C.; Gil-García, M. Biofunctionalization of nylon nanofibers to be used in immunobiosensor for biological warfare agents detecting. In Global Progress in Applied Microbiology: A Multidisciplinary Approach; Formatex Research Center: Badajoz, Spain, 2018; pp. 18–22. ISBN 978-84-947512-2-6. [Google Scholar]
  19. Schürmann, M.; Scholze, J.; Müller, P.; Guck, J.; Chan, C.J. Cell nuclei have lower refractive index and mass density than cytoplasm. J. Biophotonics 2016, 9, 1068–1076. [Google Scholar] [CrossRef]
  20. Martínez-Pérez, P.; Gómez-Gómez, M.; Angelova, T.; Griol, A.; Hurtado, J.; Bellieres, L.; García-Rupérez, J. Continuous detection of increasing concentrations of thrombin employing a label-free photonic crystal aptasensor. Micromachines 2020, 11, 464. [Google Scholar] [CrossRef]
  21. Martín-Sánchez, D.; Ponce-Alcántara, S.; Martínez-Pérez, P.; García-Rupérez, J. Macropore Formation and Pore Morphology Characterization of Heavily Doped p-Type Porous Silicon. J. Electrochem. Soc. 2019, 166, B9–B12. [Google Scholar] [CrossRef]
  22. Law, C.S.; Lim, S.Y.; Abell, A.D.; Voelcker, N.H.; Santos, A. Nanoporous anodic alumina photonic crystals for optical chemo-and biosensing: Fundamentals, advances, and perspectives. Nanomaterials 2018, 8, 788. [Google Scholar] [CrossRef] [PubMed] [Green Version]
  23. Varma, M.M. Polymer thin film structures for ultra-low cost biosensing. Optik 2012, 123, 1400–1403. [Google Scholar] [CrossRef]
  24. Ali, L.; Mohammed, M.U.; Khan, M.; Yousuf, A.H.B.; Chowdhury, M.H. High-Quality Optical Ring Resonator-Based Biosensor for Cancer Detection. IEEE Sens. J. 2020, 20, 1867–1875. [Google Scholar] [CrossRef]
  25. Mohammed, N.A.; Hamed, M.M.; Khalaf, A.A.M.; Alsayyari, A.; El-Rabaie, S. High-sensitivity ultra-quality factor and remarkable compact blood components biomedical sensor based on nanocavity coupled photonic crystal. Results Phys. 2019, 14, 102478. [Google Scholar] [CrossRef]
Figure 1. Polymeric nanofiber (NF) layer deposited over several silicon substrates at once in a single electrospinning process (a). It has a white-veil appearance (b) that can be clearly noticed if a clean silicon sample (top) and a silicon sample with a NF layer deposited on it (bottom) are compared. Non-squared pieces were discarded to avoid fabrication heterogeneities in border regions.
Chemosensors 08 00119 g001
Figure 2. Optical setup and microfluidic chamber employed for the optical measurements.
Chemosensors 08 00119 g002
Figure 3. Field emission scanning electron microscopy (FESEM) image of the NF layer (a) before and (b) after the stabilization procedure, which provokes the increase in the NF diameter as a result of the heat and the pressure applied. (c) Reflectivity spectrum of the stabilized NF layer in presence of deionized water and the calibration spectrum of the light source (obtained using an aluminum layer).
Chemosensors 08 00119 g003
Figure 4. Real-time response of the NF layer when a calibration experiment with deionized water (DIW) and 1X PBS buffer solution was carried out.
Chemosensors 08 00119 g004
Figure 5. Real-time monitoring of the attachment of recombinant protein A/G (AGp) to the NFs when a 50 µg/mL solution of such protein was flowed. The stable position of the maximum peak when 0.1 M MES buffer was flowed at 40 min demonstrates that desorption of the AGp did not occur. The spike observed when AGp was flowed can be ascribed to fluidic irregularities and density differences between the AGp solution and 0.1 M MES buffer solution [20].
Chemosensors 08 00119 g005
Figure 6. Real-time monitoring of the attachment of (a) casein to the NF surface and (b) anti-BSA antibody (αBSA) to the AGp molecules. Casein blocks the remaining empty spaces between AGp molecules, avoiding the unoriented attachment of αBSA to the NF surface and forcing its oriented binding to AGp.
Chemosensors 08 00119 g006
Figure 7. Real-time monitoring when 10 µg/mL bovine serum albumin (BSA) solution was flowed over NFs layers (a) covered by αBSA and (b) without αBSA.
Chemosensors 08 00119 g007
Figure 8. Spectral shift observed in three different NF layers fabricated in the same electrospinning process when the same biofunctionalization and biodetection steps (explained in Section 3.2 and Section 3.3) were carried out over them. Similar responses with little variations among samples are shown, demonstrating good reproducibility of the biofunctionalization and biodetection protocols and the potential of electrospinning to produce several transducers with similar performance in a single process.
Chemosensors 08 00119 g008
Publisher’s Note: MDPI stays neutral with regard to jurisdictional claims in published maps and institutional affiliations.

