Electrochemical Impedance Spectroscopy on 2D Nanomaterial MXene Modified Interfaces: Application as a Characterization and Transducing Tool


Abstract
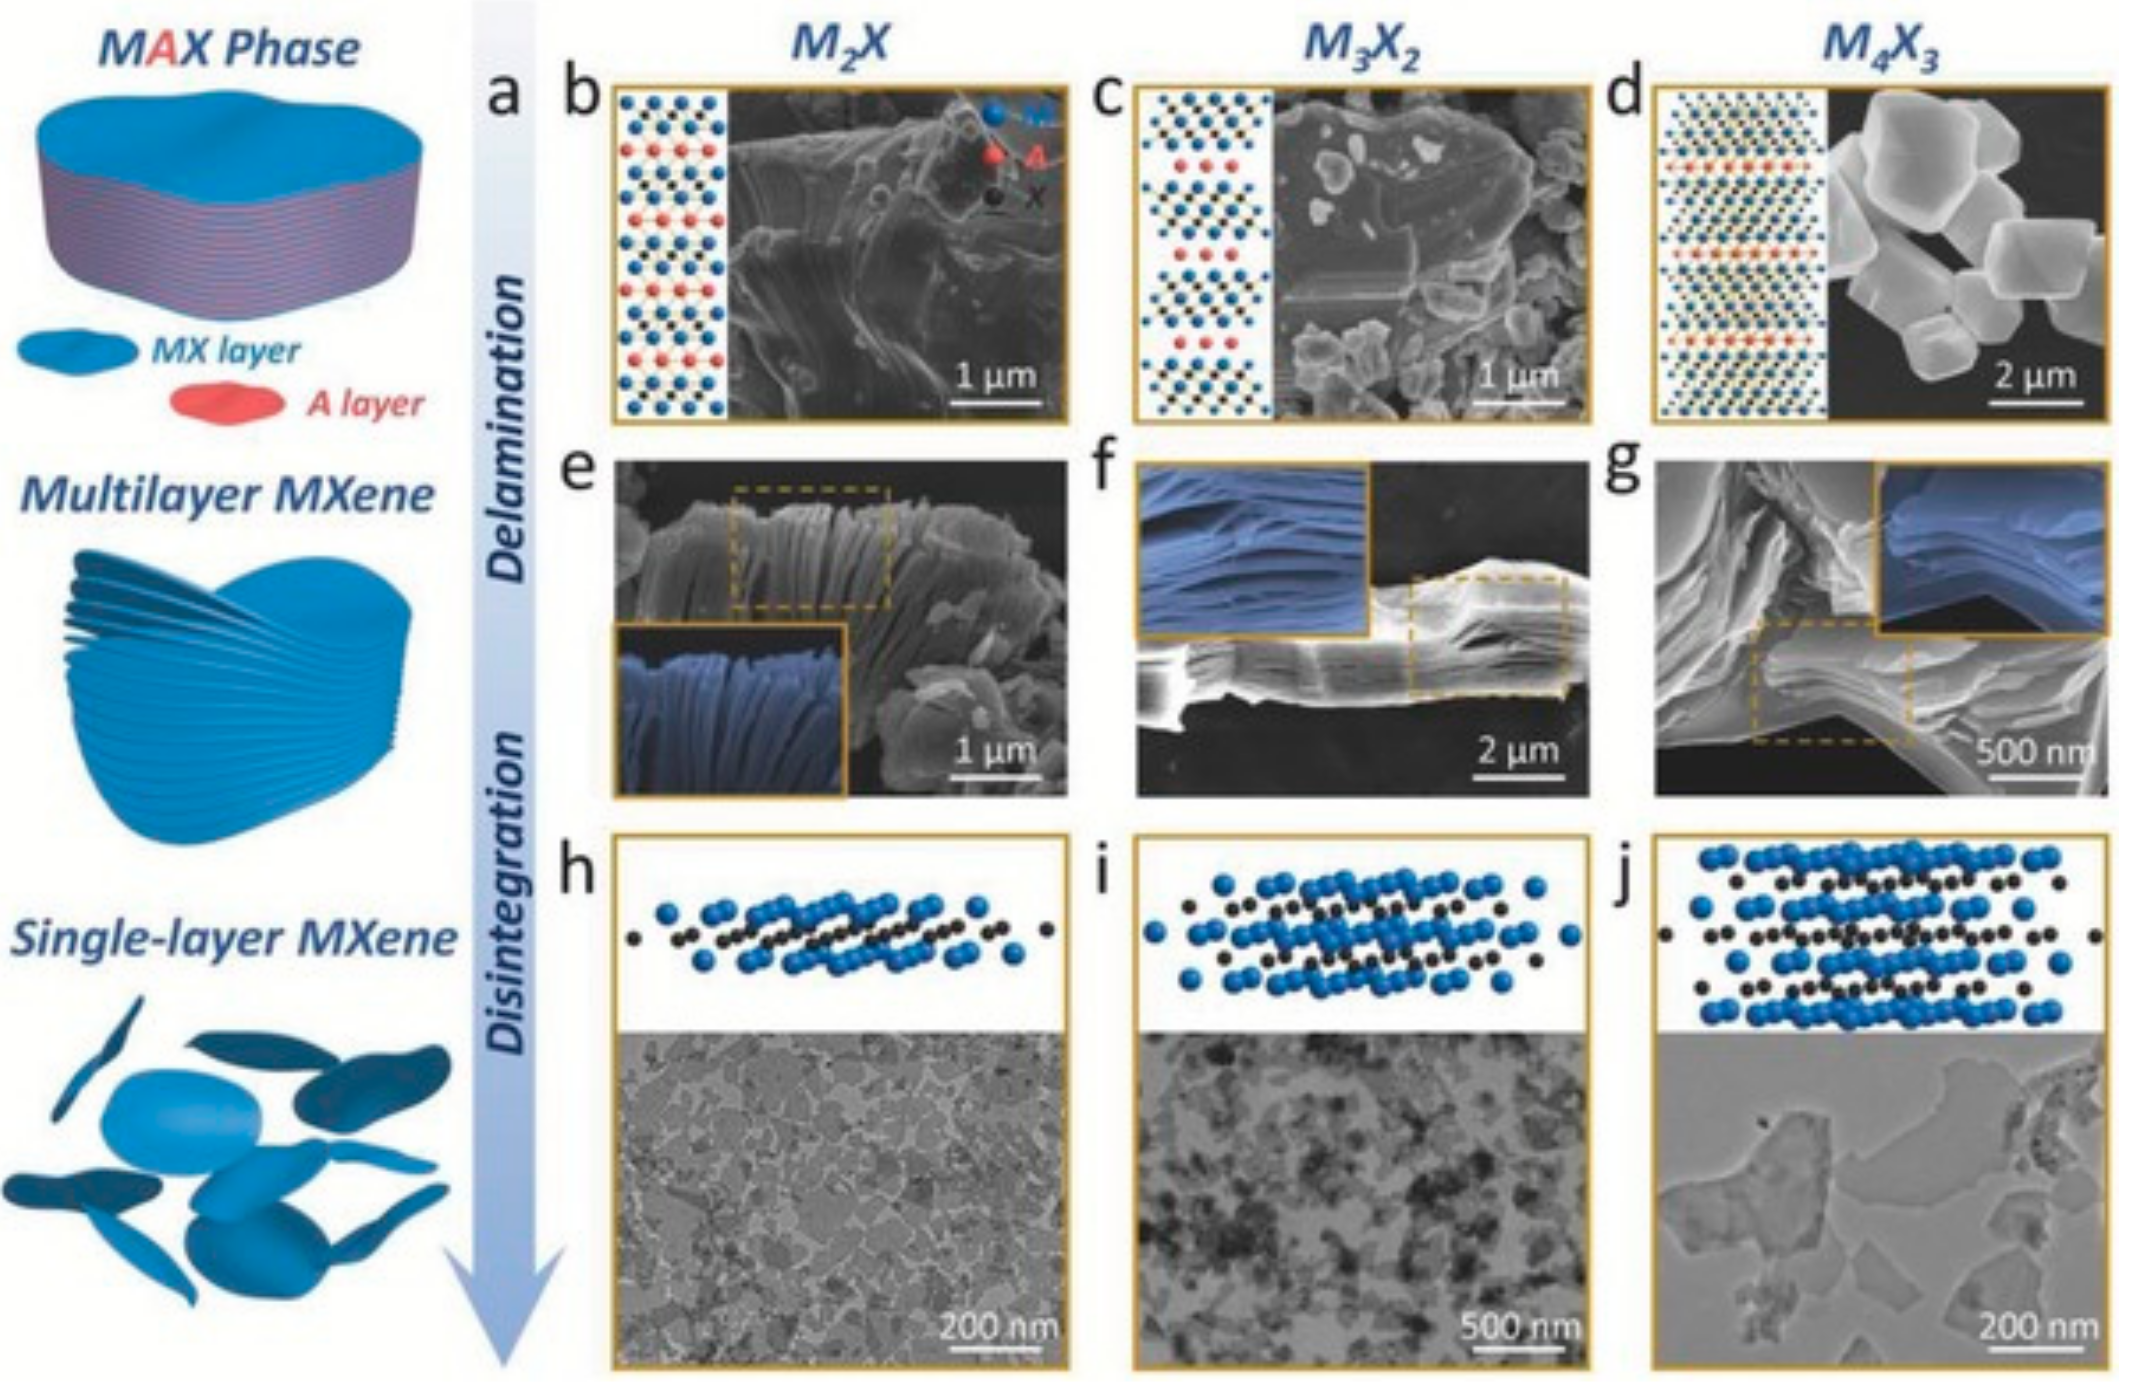
:1. 2D Nanomaterials—MXenes
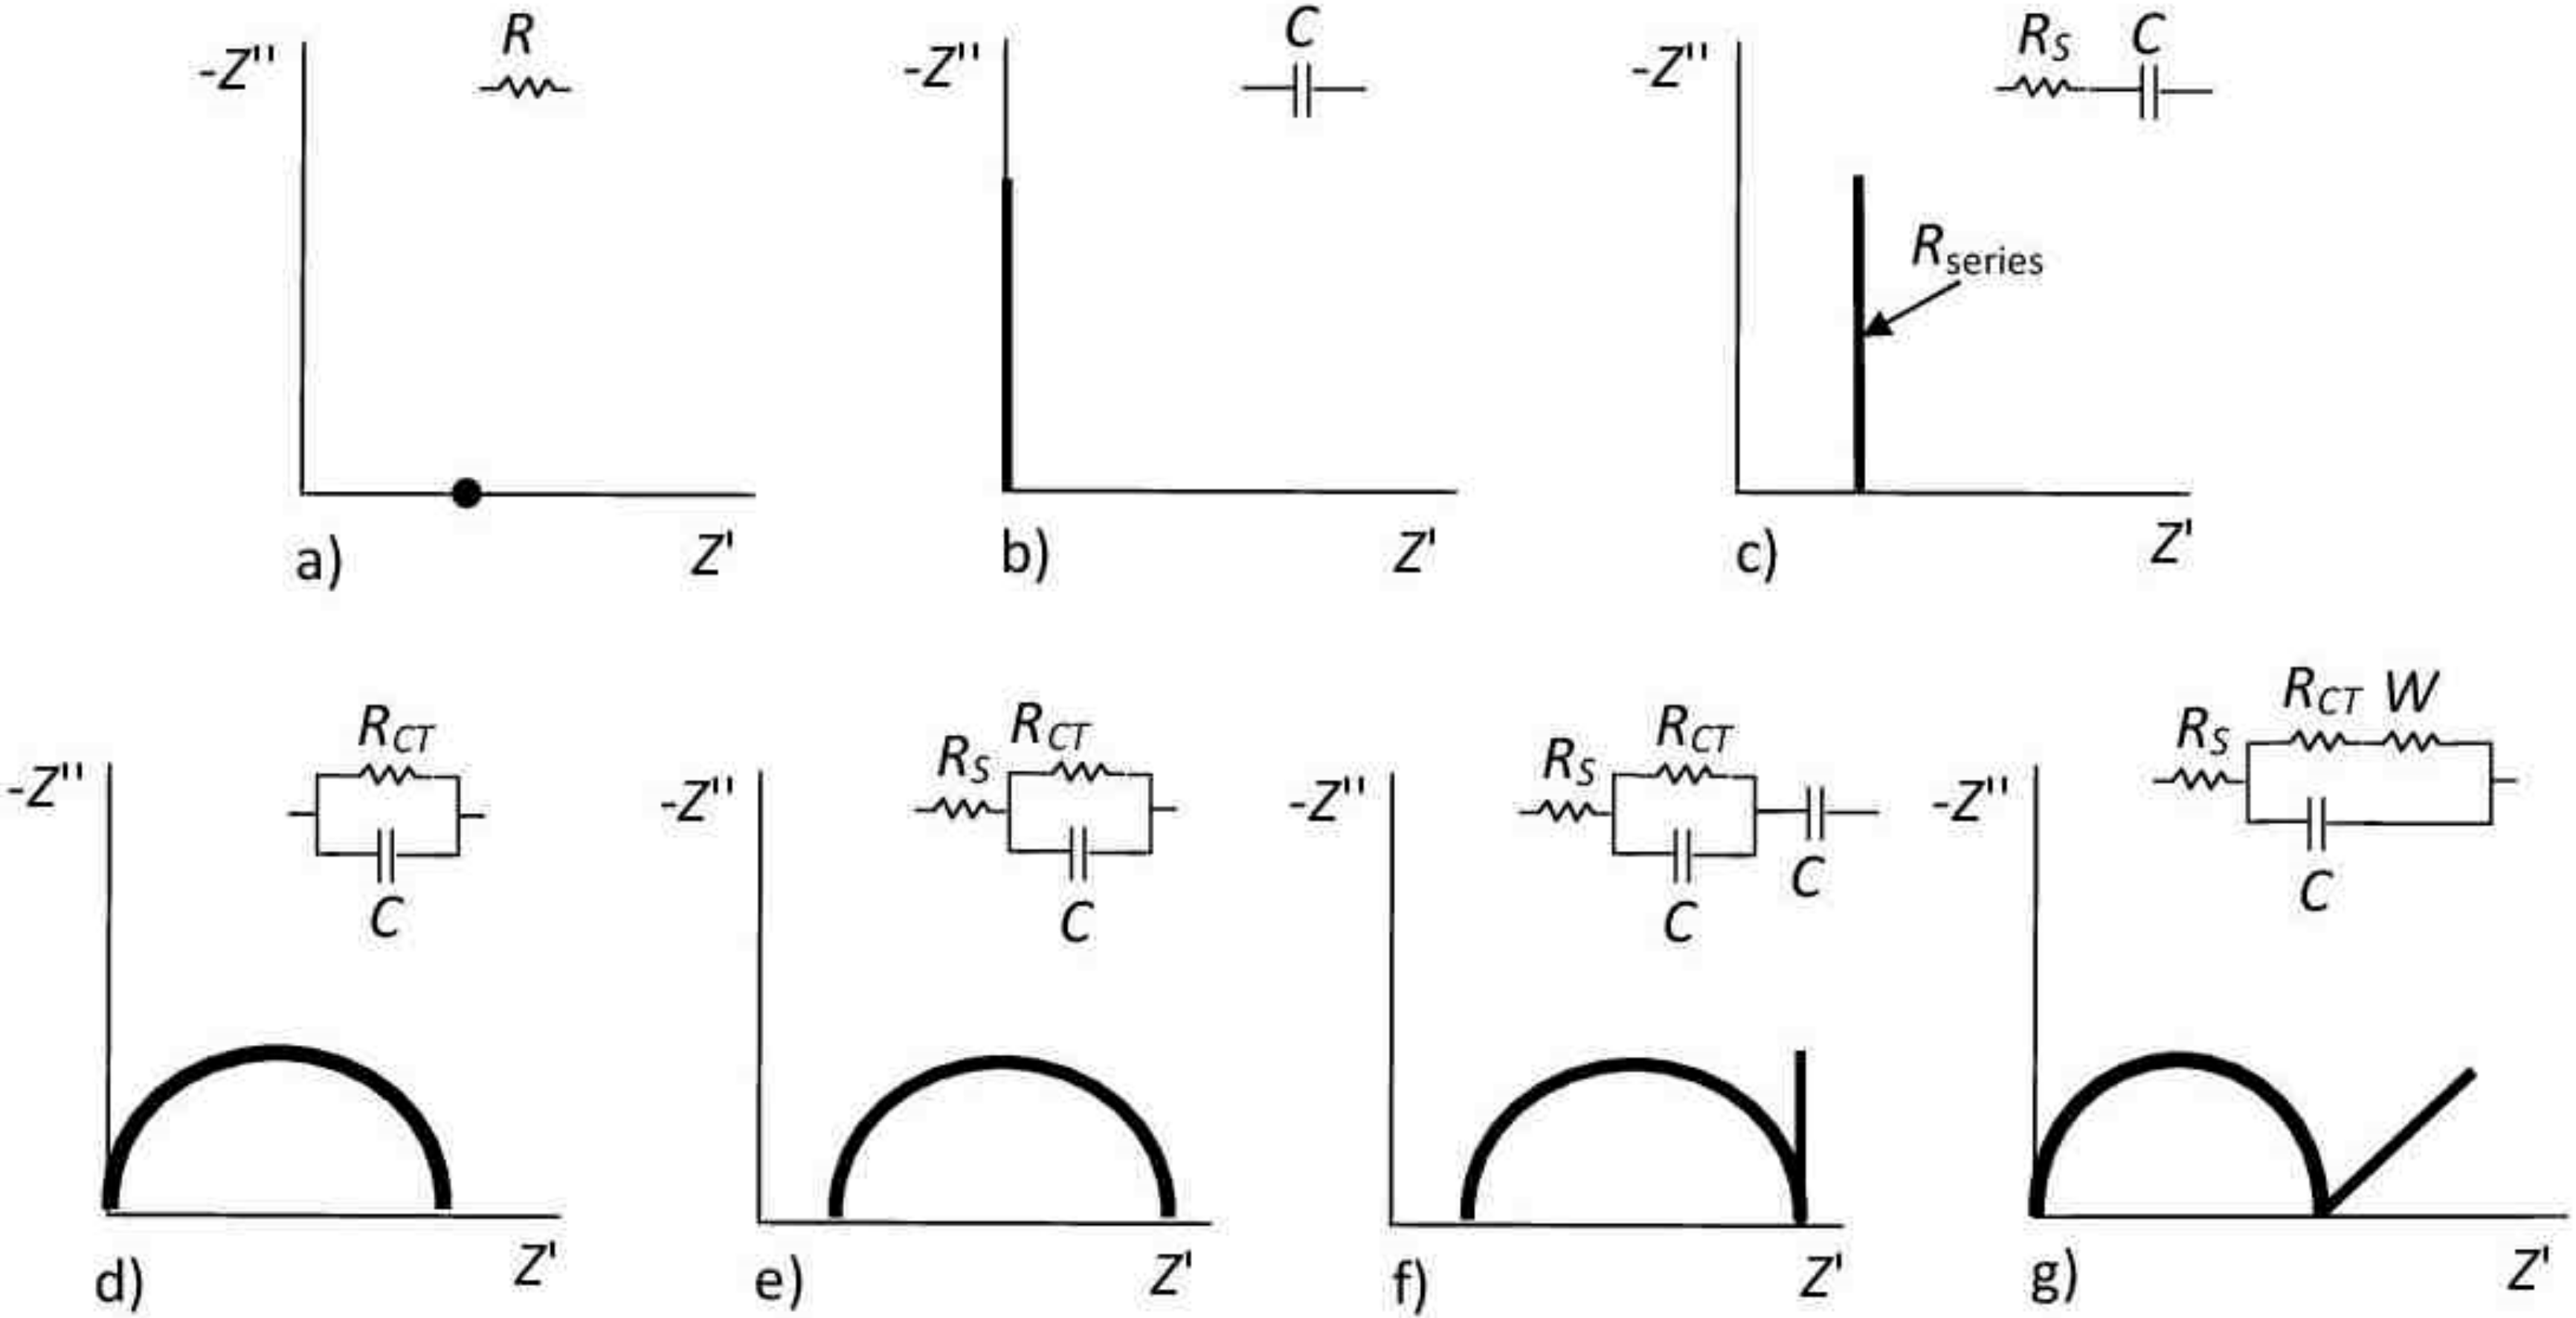
2. Electrochemical Impedance Spectroscopy (EIS): The Right Tool for Investigating Conductive Interfaces
3. Electrochemical Investigation of MXene-Modified Interfaces via EIS
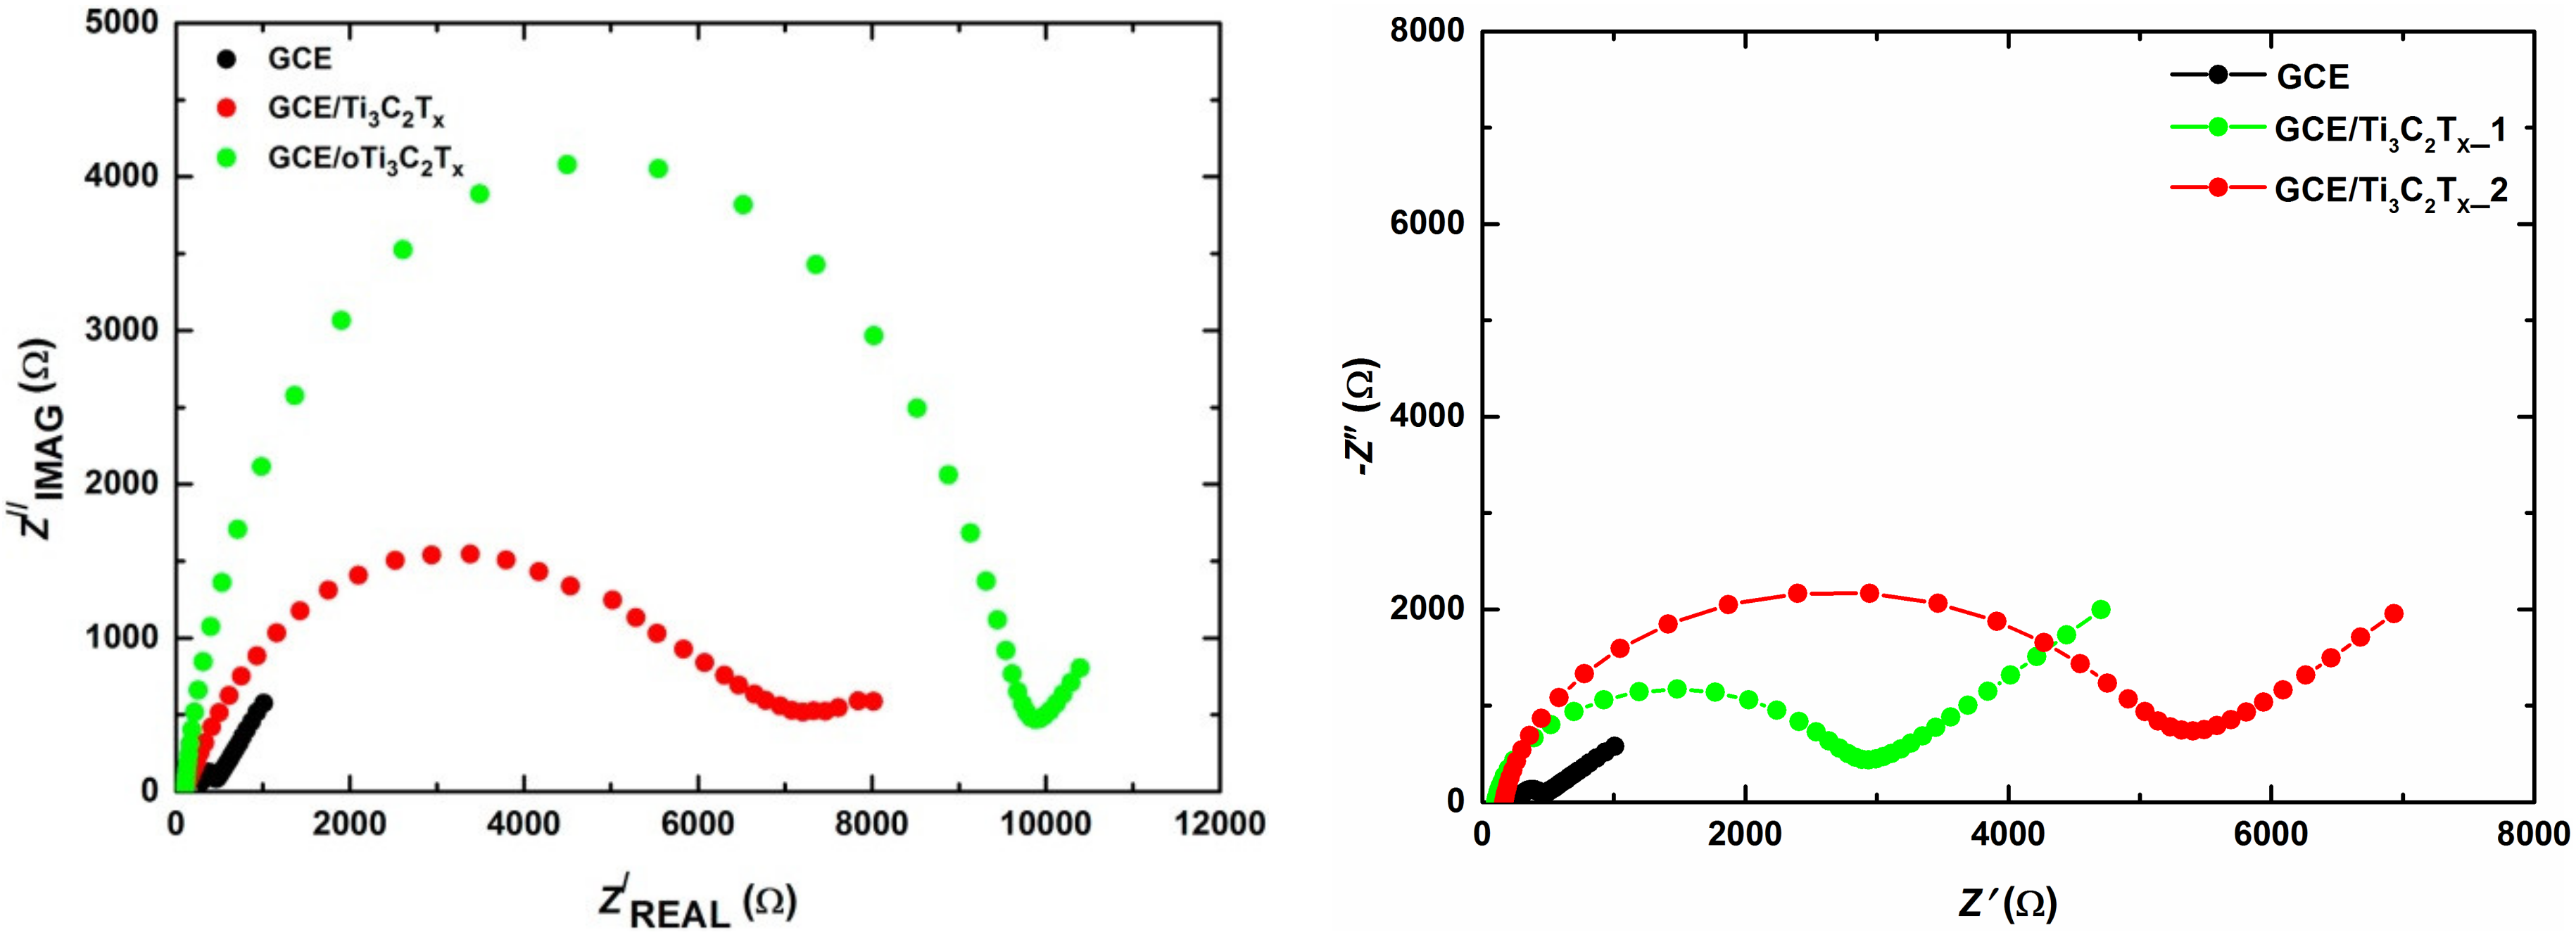
3.1. EIS for Characterization of Redox Stability of MXene-Modified Electrodes and Sensors
3.2. EIS for Redox Characterization of Electrodes Modified with MXenes Prepared Using Two Etching Procedures
3.3. EIS for Electrochemical Characterization of MXene-Modified Electrodes with Grafted Polymers
4. Electrochemical Investigation of MXene-Modified Bio-Interfaces via EIS
4.1. EIS for Electrochemical Investigation of MXene-Modified Enzyme Biosensors
4.2. EIS for Electrochemical Investigation of MXene-Modified Immunosensors
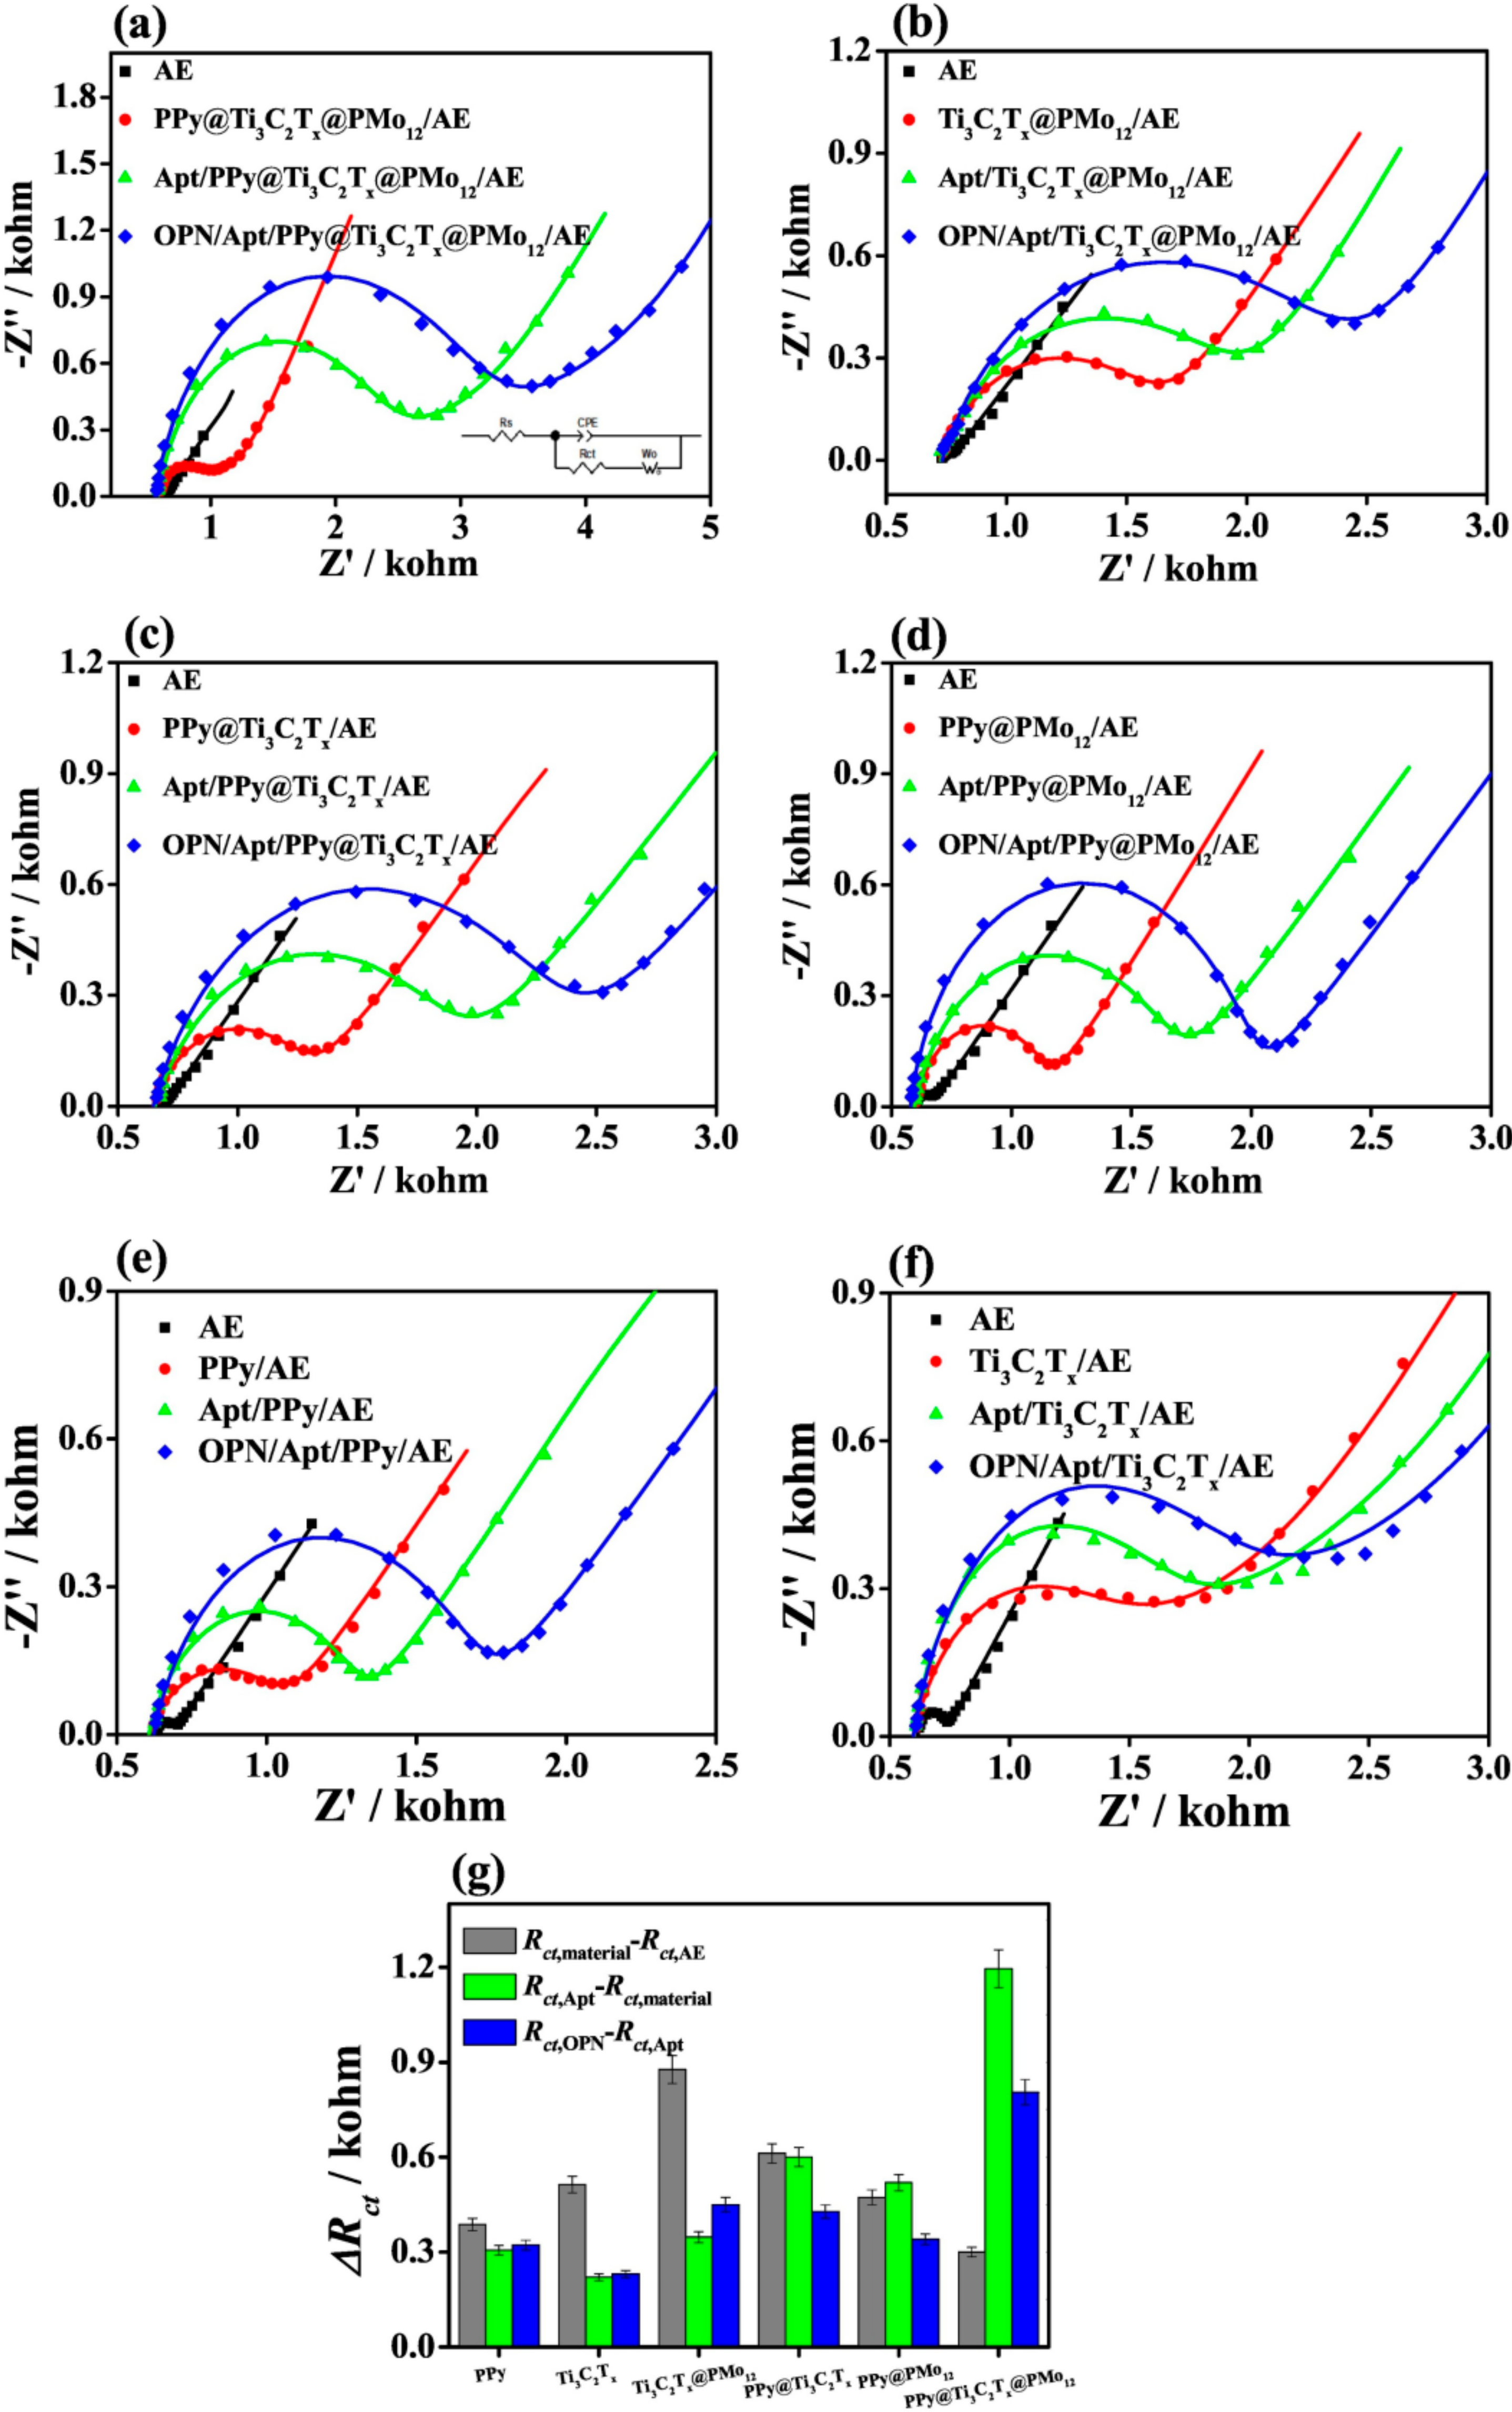
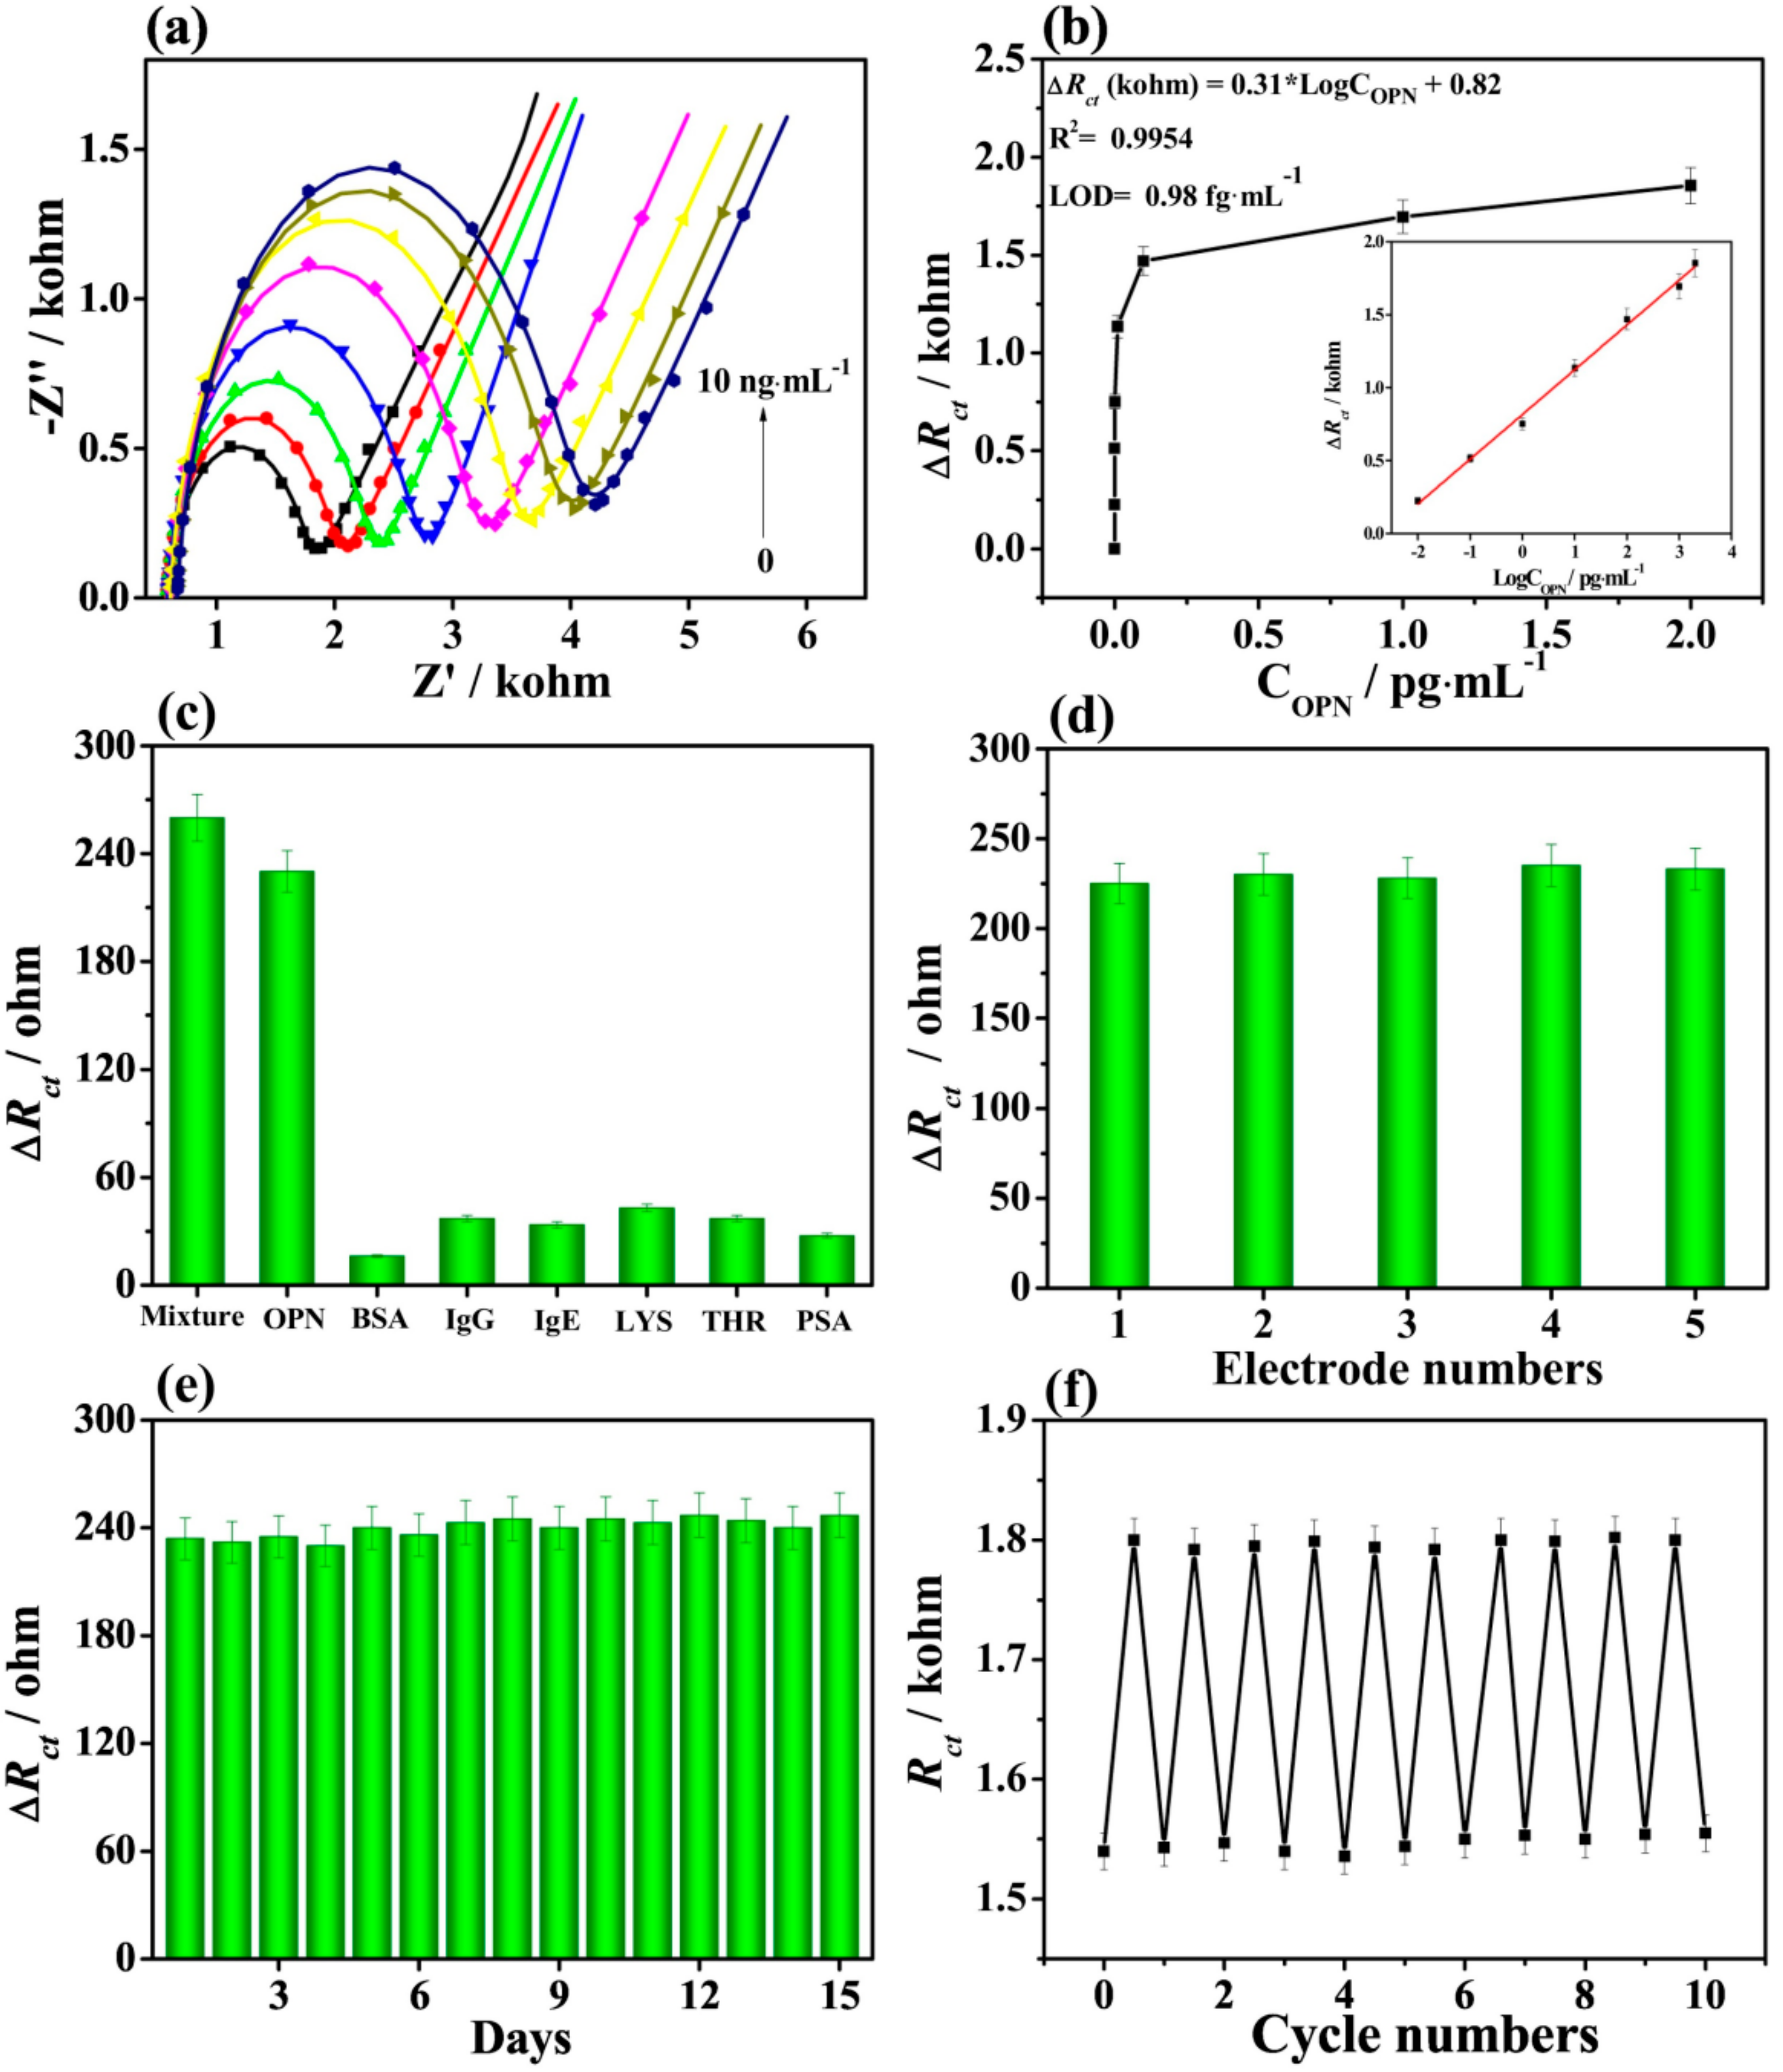
4.3. EIS for Electrochemical Investigation of MXene-Modified Aptasensors
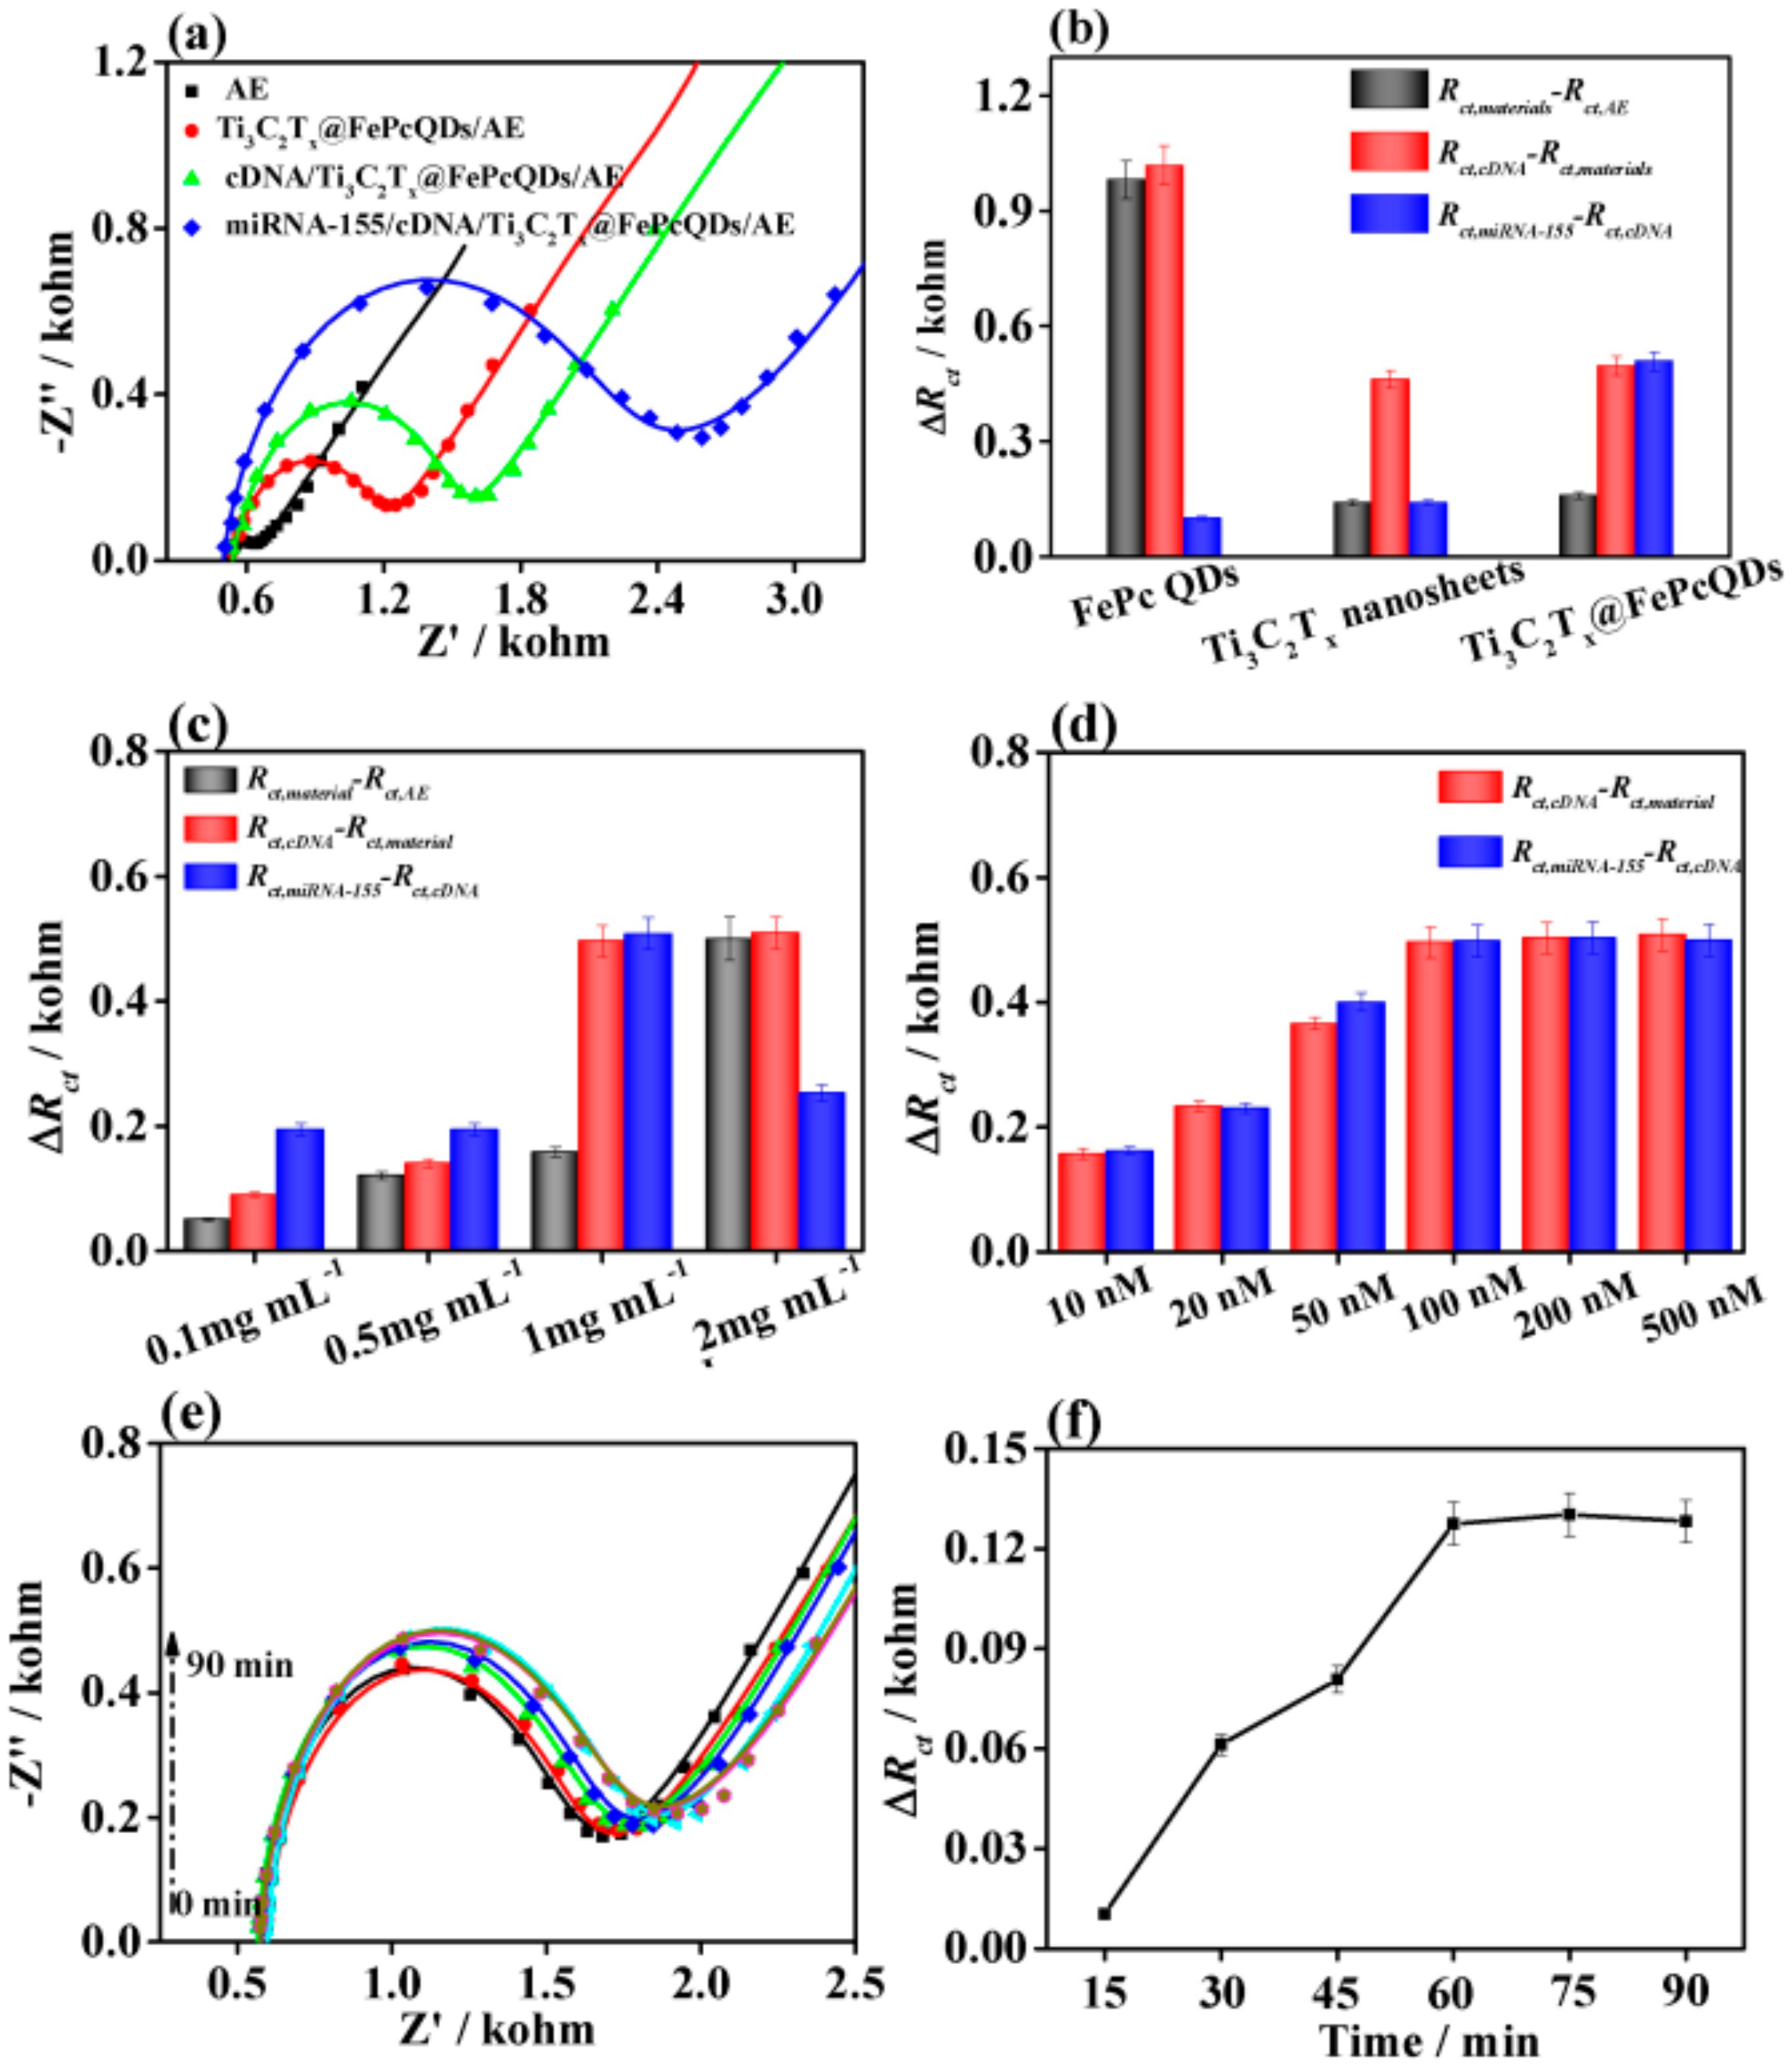
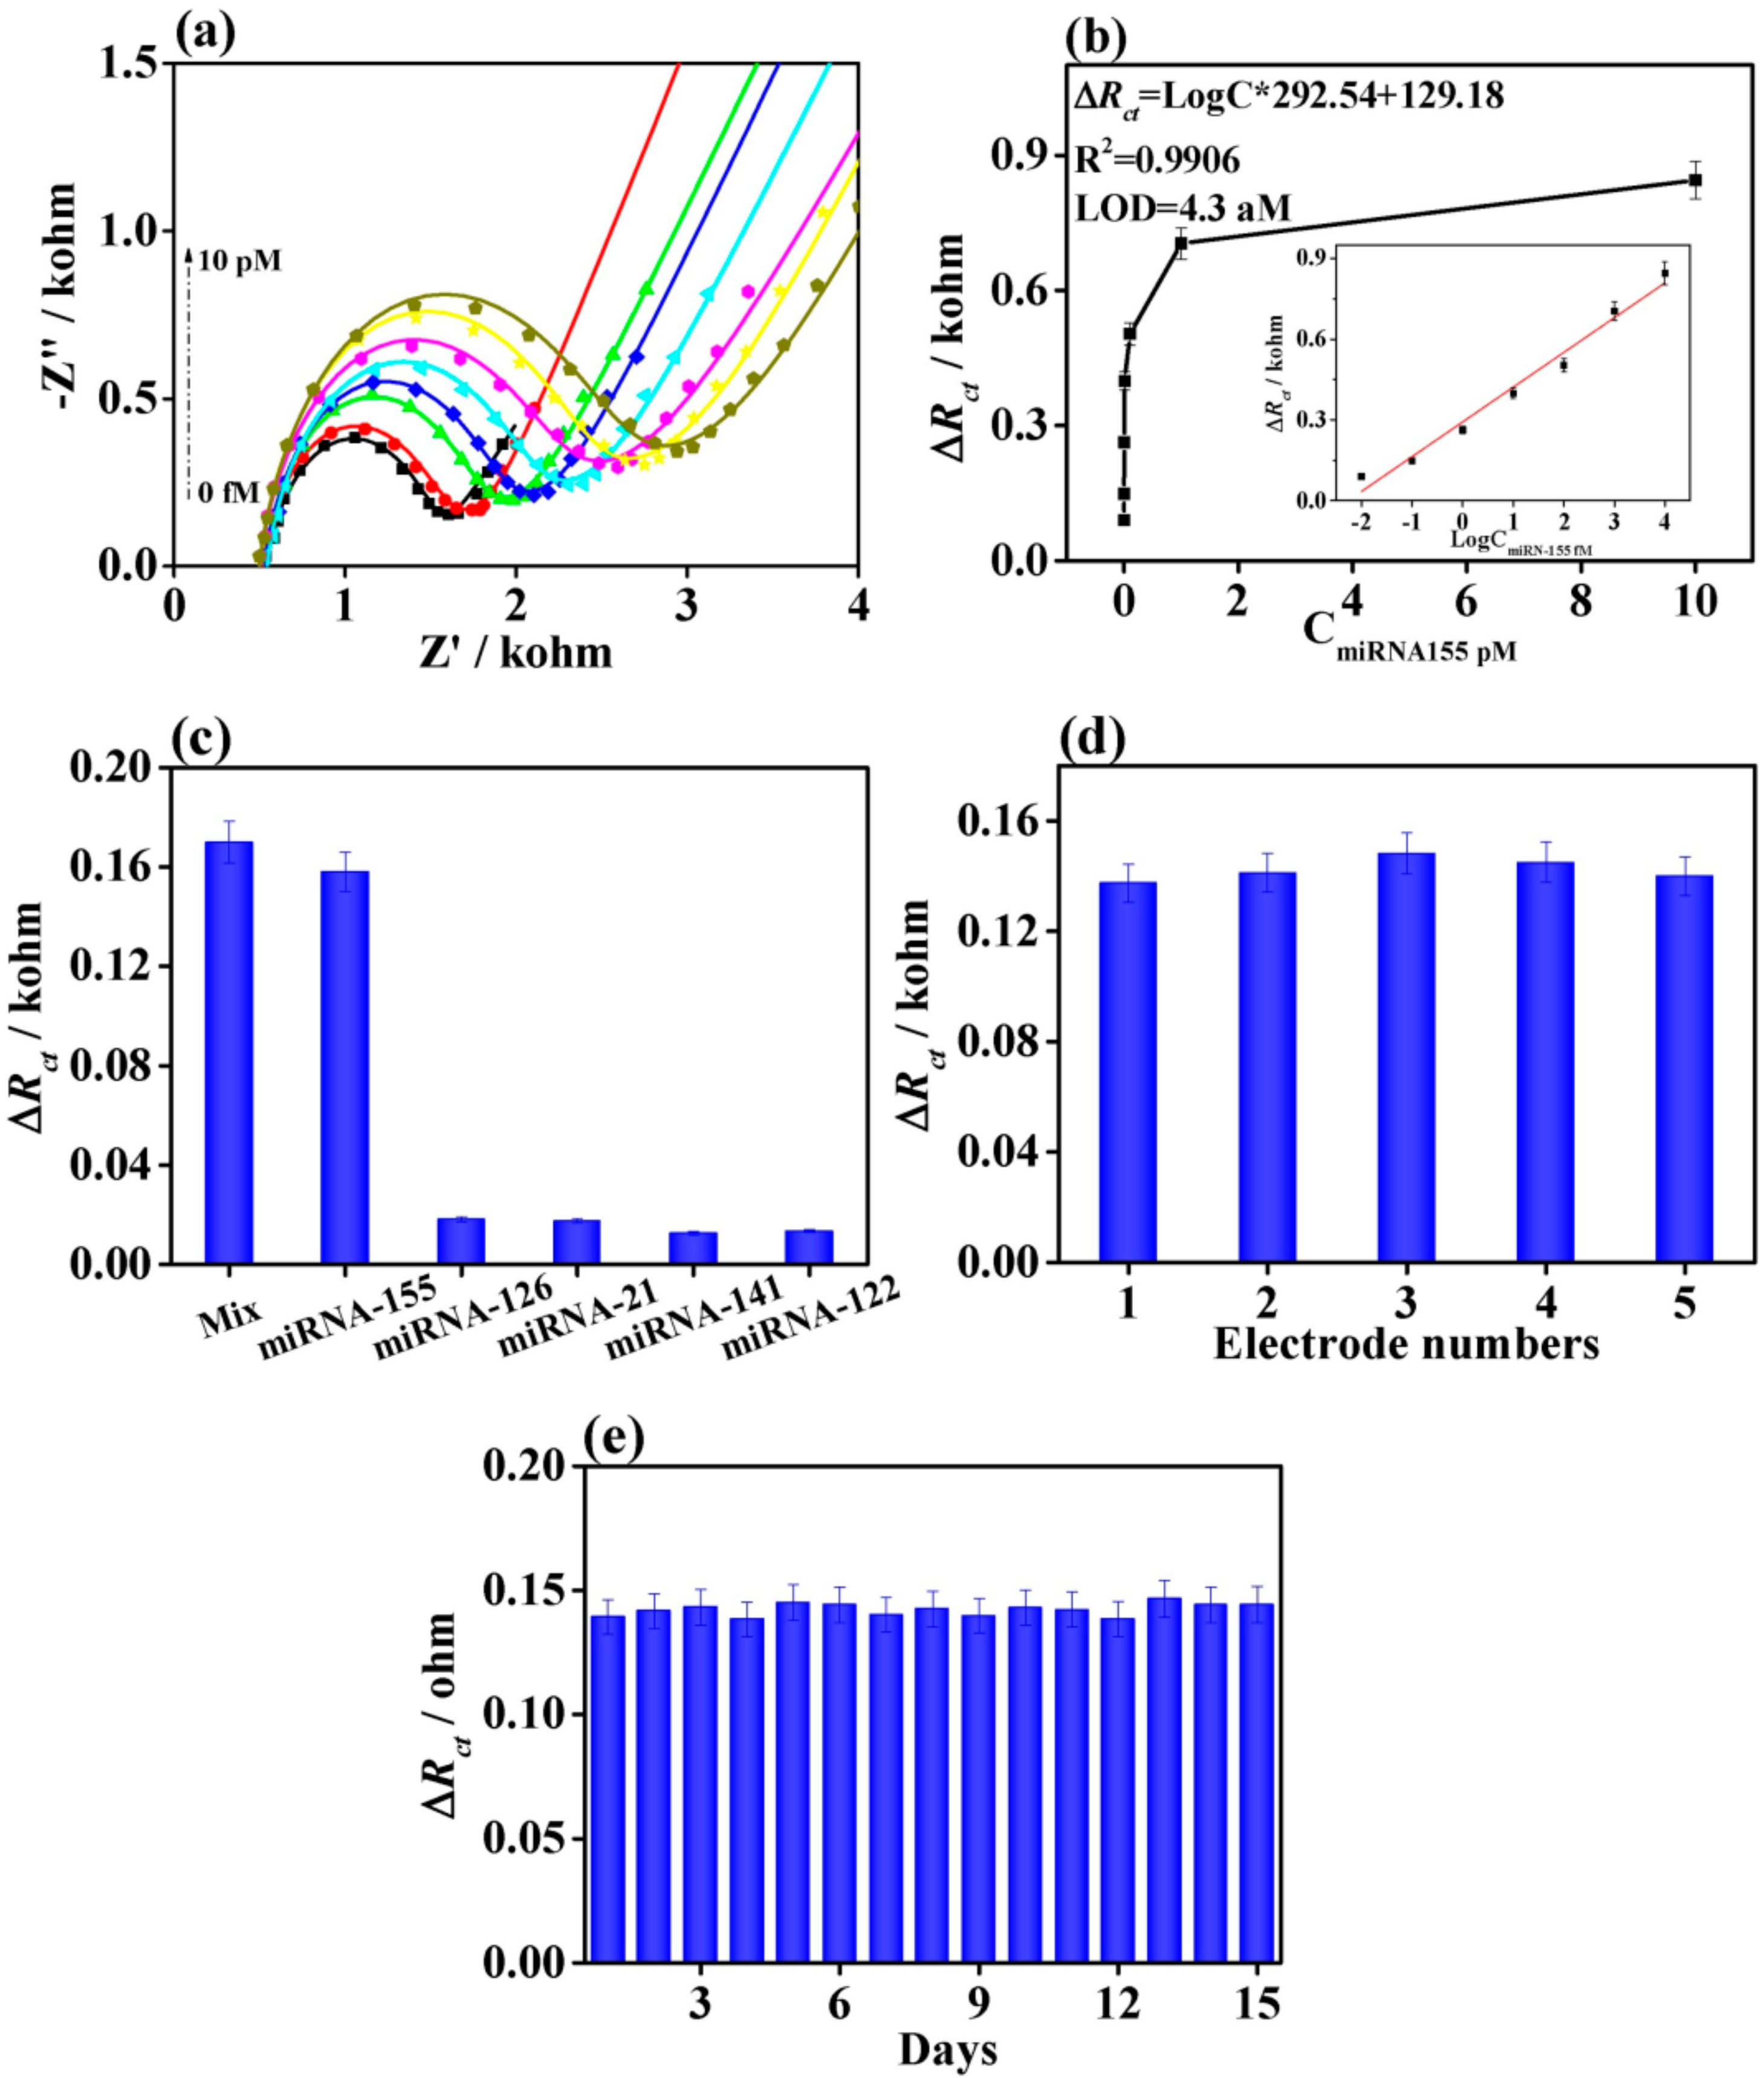
4.4. EIS for Electrochemical Investigation of MXene-Modified Biosensors for Detection of micro RNA (miRNA)
4.5. EIS for Electrochemical Investigation of MXene-Modified Electrodes with Molecularly Imprinted Polymers
5. Conclusions
Author Contributions
Funding
Conflicts of Interest
References
- Naguib, M.; Kurtoglu, M.; Presser, V.; Lu, J.; Niu, J.; Heon, M.; Hultman, L.; Gogotsi, Y.; Barsoum, M.W. Two-Dimensional Nanocrystals Produced by Exfoliation of Ti3AlC2. Adv. Mater. 2011, 23, 4248–4253. [Google Scholar] [CrossRef] [PubMed] [Green Version]
- Khan, K.; Tareen, A.K.; Aslam, M.; Wang, R.; Zhang, Y.; Mahmood, A.; Ouyang, Z.; Zhang, H.; Guo, Z. Recent developments in emerging two-dimensional materials and their applications. J. Mater. Chem. C 2020, 8, 387–440. [Google Scholar] [CrossRef]
- Khan, R.; Andreescu, S. Mxenes-based bioanalytical sensors: Design, characterization, and applications. Sensors 2020, 20, 5434. [Google Scholar] [CrossRef]
- Lorencova, L.; Bertok, T.; Filip, J.; Jerigova, M.; Velic, D.; Kasak, P.; Mahmoud, K.A.; Tkac, J. Highly stable Ti3C2Tx (MXene)/Pt nanoparticles-modified glassy carbon electrode for H2O2 and small molecules sensing applications. Sens. Actuators B Chem. 2018, 263, 360–368. [Google Scholar] [CrossRef]
- Lorencova, L.; Gajdosova, V.; Hroncekova, S.; Bertok, T.; Blahutova, J.; Vikartovska, A.; Parrakova, L.; Gemeiner, P.; Kasak, P.; Tkac, J. 2D MXenes as Perspective Immobilization Platforms for Design of Electrochemical Nanobiosensors. Electroanalysis 2019, 31, 1833–1844. [Google Scholar] [CrossRef]
- Alhabeb, M.; Maleski, K.; Anasori, B.; Lelyukh, P.; Clark, L.; Sin, S.; Gogotsi, Y. Guidelines for Synthesis and Processing of Two-Dimensional Titanium Carbide (Ti3C2Tx MXene). Chem. Mater. 2017, 29, 7633–7644. [Google Scholar] [CrossRef]
- Limbu, T.B.; Chitara, B.; Orlando, J.D.; Garcia Cervantes, M.Y.; Kumari, S.; Li, Q.; Tang, Y.; Yan, F. Green synthesis of reduced Ti3C2Tx MXene nanosheets with enhanced conductivity, oxidation stability, and SERS activity. J. Mater. Chem. C 2020, 8, 4722–4731. [Google Scholar] [CrossRef]
- Habib, T.; Zhao, X.; Shah, S.A.; Chen, Y.; Sun, W.; An, H.; Lutkenhaus, J.L.; Radovic, M.; Green, M.J. Oxidation stability of Ti3C2Tx MXene nanosheets in solvents and composite films. NPJ 2D Mater. Appl. 2019, 3, 8. [Google Scholar] [CrossRef]
- Li, B.; Ma, K.; Lu, S.; Liu, X.; Ma, Z.; Zhang, L.; Wang, X.; Wang, S. Structural health monitoring for polymer composites with surface printed MXene/ink sensitive sensors. Appl. Phys. A 2020, 126, 791. [Google Scholar] [CrossRef]
- Chen, W.Y.; Jiang, X.; Lai, S.-N.; Peroulis, D.; Stanciu, L. Nanohybrids of a MXene and transition metal dichalcogenide for selective detection of volatile organic compounds. Nat. Commun. 2020, 11, 1302. [Google Scholar] [CrossRef] [Green Version]
- Liu, L.; Shangguan, C.; Guo, J.; Ma, K.; Jiao, S.; Yao, Y.; Wang, J. Ultrasensitive SERS Detection of Cancer-Related miRNA-182 by MXene/MoS2@AuNPs with Controllable Morphology and Optimized Self-Internal Standards. Adv. Opt. Mater. 2020. [Google Scholar] [CrossRef]
- Gogotsi, Y.; Stach, E.; Hantanasirisakul, K.; Foucher, A.C.; Anayee, M.; Sarycheva, A.; Goad, A.; Maleski, K.; Mathis, T. Modified MAX Phase Synthesis for Environmentally Stable and Highly Conductive Ti3C2 MXene. ChemRxiv 2020. [Google Scholar] [CrossRef]
- Lorencova, L.; Gajdosova, V.; Hroncekova, S.; Bertok, T.; Jerigova, M.; Velic, D.; Sobolciak, P.; Krupa, I.; Kasak, P.; Tkac, J. Electrochemical Investigation of Interfacial Properties of Ti3C2Tx MXene Modified by Aryldiazonium Betaine Derivatives. Front. Chem. 2020, 8, 553. [Google Scholar] [CrossRef] [PubMed]
- Zhang, C.J.; Pinilla, S.; McEvoy, N.; Cullen, C.P.; Anasori, B.; Long, E.; Park, S.-H.; Seral-Ascaso, A.; Shmeliov, A.; Krishnan, D.; et al. Oxidation Stability of Colloidal Two-Dimensional Titanium Carbides (MXenes). Chem. Mater. 2017, 29, 4848–4856. [Google Scholar] [CrossRef]
- Rozmysłowska-Wojciechowska, A.; Szuplewska, A.; Wojciechowski, T.; Poźniak, S.; Mitrzak, J.; Chudy, M.; Ziemkowska, W.; Chlubny, L.; Olszyna, A.; Jastrzębska, A.M. A simple, low-cost and green method for controlling the cytotoxicity of MXenes. Mater. Sci. Eng. C 2020, 111, 110790. [Google Scholar] [CrossRef] [PubMed]
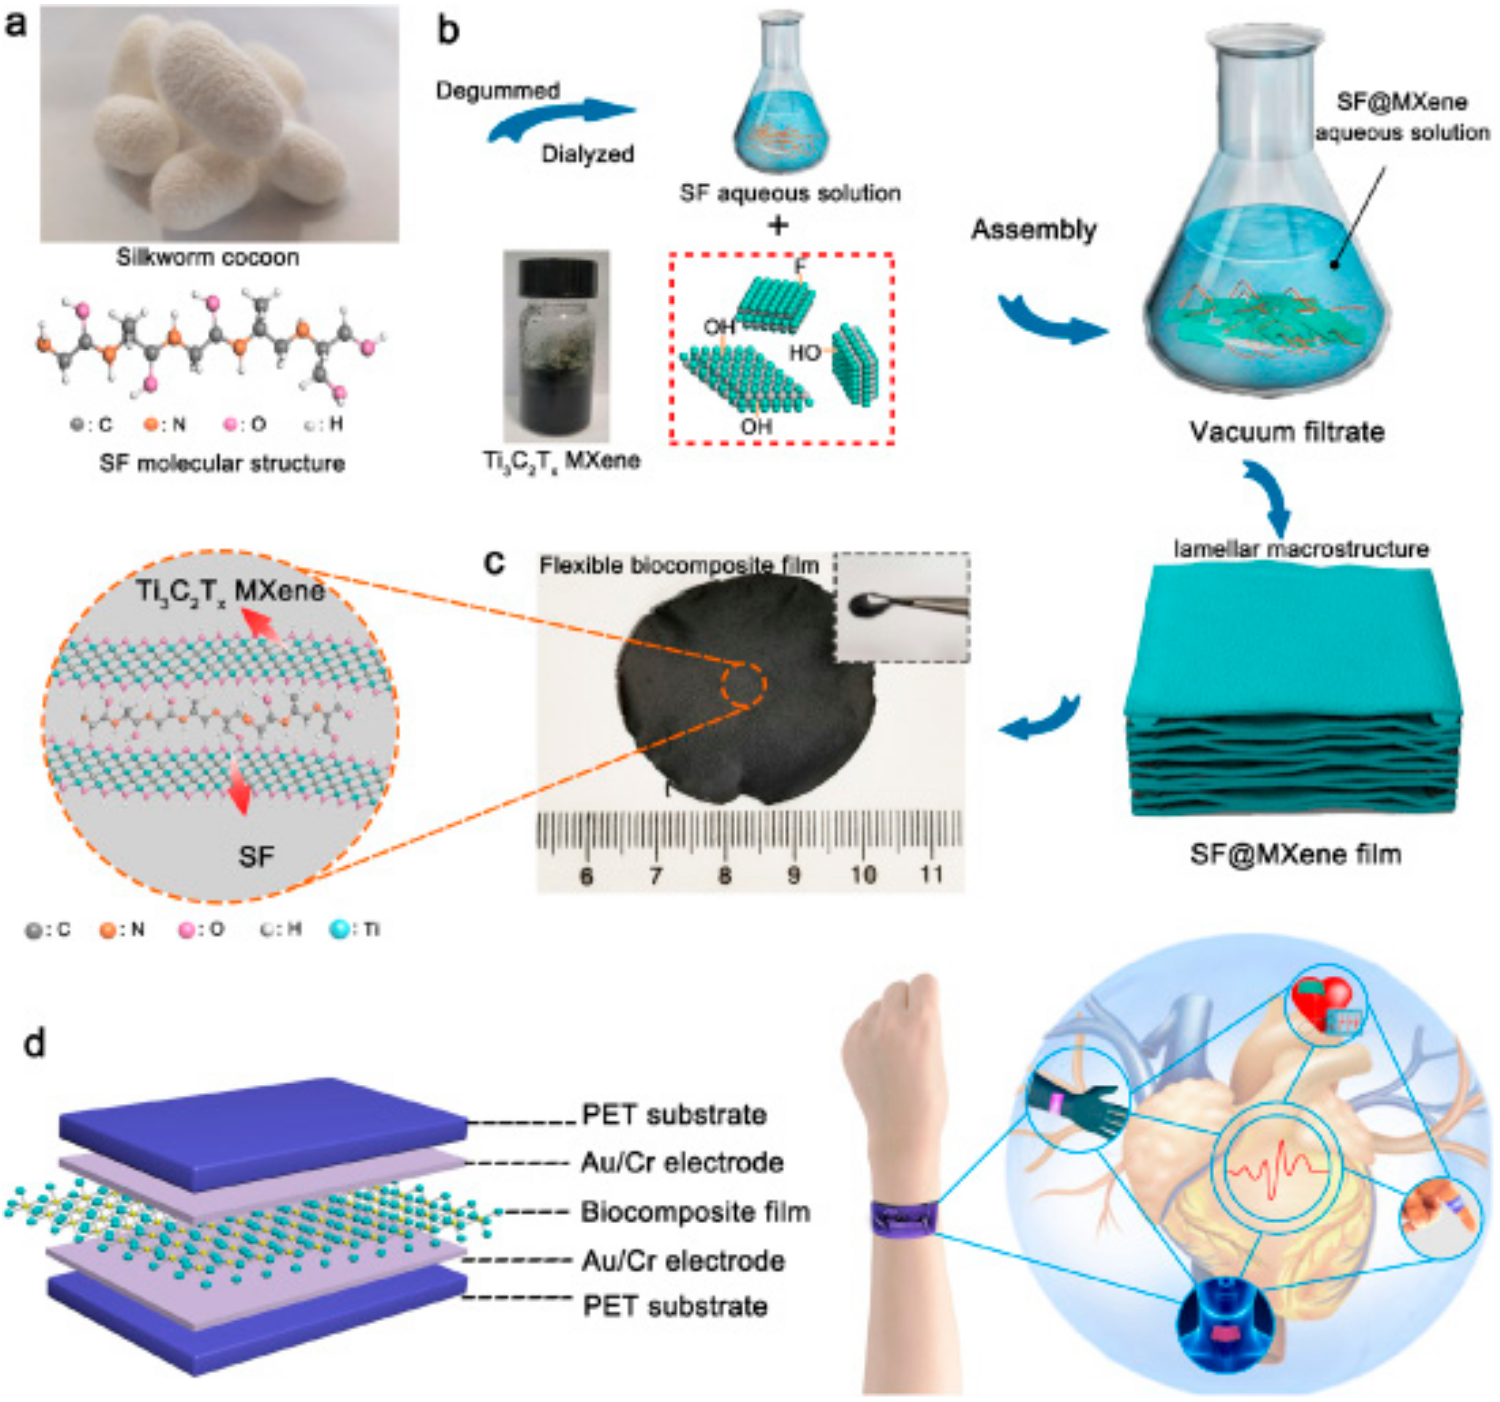
- Wang, D.; Wang, L.; Lou, Z.; Zheng, Y.; Wang, K.; Zhao, L.; Han, W.; Jiang, K.; Shen, G. Biomimetic, biocompatible and robust silk Fibroin-MXene film with stable 3D cross-link structure for flexible pressure sensors. Nano Energy 2020, 78, 105252. [Google Scholar] [CrossRef]
- Li, X.; Liu, F.; Huang, D.; Xue, N.; Dang, Y.; Zhang, M.; Zhang, L.; Li, B.; Liu, D.; Wang, L.; et al. Nonoxidized MXene Quantum Dots Prepared by Microexplosion Method for Cancer Catalytic Therapy. Adv. Funct. Mater. 2020, 30, 2000308. [Google Scholar] [CrossRef]
- Lin, H.; Gao, S.; Dai, C.; Chen, Y.; Shi, J. A Two-Dimensional Biodegradable Niobium Carbide (MXene) for Photothermal Tumor Eradication in NIR-I and NIR-II Biowindows. J. Am. Chem. Soc. 2017, 139, 16235–16247. [Google Scholar] [CrossRef]
- Lin, H.; Wang, X.; Yu, L.; Chen, Y.; Shi, J. Two-Dimensional Ultrathin MXene Ceramic Nanosheets for Photothermal Conversion. Nano Lett. 2017, 17, 384–391. [Google Scholar] [CrossRef]
- Lin, H.; Wang, Y.; Gao, S.; Chen, Y.; Shi, J. Theranostic 2D Tantalum Carbide (MXene). Adv. Mater. 2018, 30, 1703284. [Google Scholar] [CrossRef]
- Nasrallah, G.K.; Al-Asmakh, M.; Rasool, K.; Mahmoud, K.A. Ecotoxicological assessment of Ti3C2Tx (MXene) using a zebrafish embryo model. Environ. Sci. Nano 2018, 5, 1002–1011. [Google Scholar] [CrossRef]
- Dai, C.; Lin, H.; Xu, G.; Liu, Z.; Wu, R.; Chen, Y. Biocompatible 2D Titanium Carbide (MXenes) Composite Nanosheets for pH-Responsive MRI-Guided Tumor Hyperthermia. Chem. Mater. 2017, 29, 8637–8652. [Google Scholar] [CrossRef]
- Gu, M.; Dai, Z.; Yan, X.; Ma, J.; Niu, Y.; Lan, W.; Wang, X.; Xu, Q. Comparison of toxicity of Ti3C2 and Nb2C Mxene quantum dots (QDs) to human umbilical vein endothelial cells. J. Appl. Toxicol. 2020. [CrossRef]
- Szuplewska, A.; Rozmysłowska-Wojciechowska, A.; Poźniak, S.; Wojciechowski, T.; Birowska, M.; Popielski, M.; Chudy, M.; Ziemkowska, W.; Chlubny, L.; Moszczyńska, D.; et al. Multilayered stable 2D nano-sheets of Ti2NTx MXene: Synthesis, characterization, and anticancer activity. J. Nanobiotechnol. 2019, 17, 114. [Google Scholar] [CrossRef] [PubMed]
- Wei, Y.; Soomro, R.A.; Xie, X.; Xu, B. Design of efficient electrocatalysts for hydrogen evolution reaction based on 2D MXenes. J. Energy Chem. 2021, 55, 244–255. [Google Scholar] [CrossRef]
- Sinha, A.; Dhanjai; Zhao, H.; Huang, Y.; Lu, X.; Chen, J.; Jain, R. MXene: An emerging material for sensing and biosensing. TRAC Trends Anal. Chem. 2018, 105, 424–435. [Google Scholar] [CrossRef]
- Zhu, X.; Zhang, Y.; Liu, M.; Liu, Y. 2D titanium carbide MXenes as emerging optical biosensing platforms. Biosens. Bioelectron. 2021, 171, 112730. [Google Scholar] [CrossRef]
- Filip, J.; Zavahir, S.; Lorencova, L.; Bertok, T.; Yousaf, A.B.; Mahmoud, K.A.; Tkac, J.; Kasak, P. Tailoring electrocatalytic properties of Pt nanoparticles grown on Ti3C2Tx MXene surface. J. Electrochem. Soc. 2019, 166, H54–H62. [Google Scholar] [CrossRef]
- Gajdosova, V.; Lorencova, L.; Prochazka, M.; Omastova, M.; Micusik, M.; Prochazkova, S.; Kveton, F.; Jerigova, M.; Velic, D.; Kasak, P.; et al. Remarkable differences in the voltammetric response towards hydrogen peroxide, oxygen and Ru(NH3)63+ of electrode interfaces modified with HF or LiF-HCl etched Ti3C2Tx MXene. Microchim. Acta 2020, 187, 52. [Google Scholar] [CrossRef]
- Shahzad, F.; Zaidi, S.A.; Naqvi, R.A. 2D Transition Metal Carbides (MXene) for Electrochemical Sensing: A Review. Crit. Rev. Anal. Chem. 2020. [Google Scholar] [CrossRef]
- Xin, M.; Li, J.; Ma, Z.; Pan, L.; Shi, Y. MXenes and Their Applications in Wearable Sensors. Front. Chem. 2020, 8, 297. [Google Scholar] [CrossRef] [PubMed] [Green Version]
- Yang, Y.; Cao, Z.; He, P.; Shi, L.; Ding, G.; Wang, R.; Sun, J. Ti3C2Tx MXene-graphene composite films for wearable strain sensors featured with high sensitivity and large range of linear response. Nano Energy 2019, 66, 104134. [Google Scholar] [CrossRef]
- Guo, Y.; Zhong, M.; Fang, Z.; Wan, P.; Yu, G. A Wearable Transient Pressure Sensor Made with MXene Nanosheets for Sensitive Broad-Range Human–Machine Interfacing. Nano Lett. 2019, 19, 1143–1150. [Google Scholar] [CrossRef]
- Li, L.; Fu, X.; Chen, S.; Uzun, S.; Levitt, A.S.; Shuck, C.E.; Han, W.; Gogotsi, Y. Hydrophobic and Stable MXene–Polymer Pressure Sensors for Wearable Electronics. Acs Appl. Mater. Interfaces 2020, 12, 15362–15369. [Google Scholar] [CrossRef] [PubMed]
- Driscoll, N.; Maleski, K.; Richardson, A.G.; Murphy, B.; Anasori, B.; Lucas, T.H.; Gogotsi, Y.; Vitale, F. Fabrication of Ti3C2 MXene Microelectrode Arrays for In Vivo Neural Recording. JoVE 2020, 156, e60741. [Google Scholar]
- Driscoll, N.; Richardson, A.G.; Maleski, K.; Anasori, B.; Adewole, O.; Lelyukh, P.; Escobedo, L.; Cullen, D.K.; Lucas, T.H.; Gogotsi, Y.; et al. Two-Dimensional Ti3C2 MXene for High-Resolution Neural Interfaces. Acs Nano 2018, 12, 10419–10429. [Google Scholar] [CrossRef] [PubMed]
- Huang, H.; Jiang, R.; Yulin, F.; Ouyang, H.; Zhou, N.; Zhang, X.; Wei, Y. Recent development and prospects of surface modification and biomedical applications of MXenes. Nanoscale 2020, 12, 1325–1338. [Google Scholar] [CrossRef]
- Lin, H.; Chen, Y.; Shi, J. Insights into 2D MXenes for Versatile Biomedical Applications: Current Advances and Challenges Ahead. Adv. Sci. 2018, 5, 1800518. [Google Scholar] [CrossRef] [Green Version]
- Si, Z.; Xiaowei, Y.; Wei, P.; Zhou, J.; Jijun, Z. MXene and MBene as efficient catalysts for energy conversion: Roles of surface, edge and interface. J. Phys. Energy 2020. [Google Scholar] [CrossRef]
- Ma, L.; Zhao, T.; Xu, F.; You, T.; Zhang, X. A dual utilization strategy of lignosulfonate for MXene asymmetric supercapacitor with high area energy density. Chem. Eng. J. 2021, 405, 126694. [Google Scholar] [CrossRef]
- Niu, R.; Han, R.; Wang, Y.; Zhang, L.; Qiao, Q.; Jiang, L.; Sun, Y.; Tang, S.; Zhu, J. MXene-based porous and robust 2D/2D hybrid architectures with dispersed Li3Ti2(PO4)3 as superior anodes for lithium-ion battery. Chem. Eng. J. 2021, 405, 127049. [Google Scholar] [CrossRef]
- Gao, H.; Shao, Y.; Shi, R.; Liu, Y.; Zhu, J.; Liu, J.; Zhu, Y.; Zhang, J.; Li, L.; Hu, X. Effect of Few-Layer Ti3C2Tx Supported Nano-Ni via Self-Assembly Reduction on Hydrogen Storage Performance of MgH2. Acs Appl. Mater. Interfaces 2020. [Google Scholar] [CrossRef]
- Qu, J.; Xiao, J.; Chen, H.; Liu, X.; Wang, T.; Zhang, Q. Orbital symmetry matching: Achieving superior nitrogen reduction reaction over single-atom catalysts anchored on Mxene substrates. Chin. J. Catal. 2021, 42, 288–296. [Google Scholar] [CrossRef]
- Huang, K.; Li, C.; Li, H.; Ren, G.; Wang, L.; Wang, W.; Meng, X. Photocatalytic Applications of Two-Dimensional Ti3C2 MXenes: A Review. ACS Appl. Nano Mater. 2020. [Google Scholar] [CrossRef]
- Zhou, Y.; Zhuge, X.; An, P.; Du, S. First-principles investigations on MXene-blue phosphorene and MXene-MoS2 transistors. Nanotechnology 2020, 31, 395203. [Google Scholar] [CrossRef]
- Ihsanullah, D. MXenes (two-dimensional metal carbides) as emerging nanomaterials for water purification: Progress, challenges and prospects. Chem. Eng. J. 2020, 388, 124340. [Google Scholar] [CrossRef]
- Chen, J.; Huang, Q.; Huang, H.; Mao, L.; Liu, M.; Zhang, X.; Wei, Y. Recent progress and advances in the environmental applications of MXene related materials. Nanoscale 2020, 12, 3574–3592. [Google Scholar] [CrossRef]
- Shahzad, F.; Iqbal, A.; Kim, H.; Koo, C.M. 2D Transition Metal Carbides (MXenes): Applications as an Electrically Conducting Material. Adv. Mater. 2020. [Google Scholar] [CrossRef]
- Iqbal, A.; Shahzad, F.; Hantanasirisakul, K.; Kim, M.-K.; Kwon, J.; Hong, J.; Kim, H.; Kim, D.; Gogotsi, Y.; Koo, C.M. Anomalous absorption of electromagnetic waves by 2D transition metal carbonitride Ti3CNTx (MXene). Science 2020, 369, 446–450. [Google Scholar]
- Nnamchi, P.S.; Obayi, C.S. Electrochemical characterization of nanomaterials. In Characterization of Nanomaterials: Advances and Key Technologies; Woodhead Publishing: Cambridge, UK, 2018; pp. 103–127. [Google Scholar]
- Bertok, T.; Lorencova, L.; Chocholova, E.; Jane, E.; Vikartovska, A.; Kasak, P.; Tkac, J. Electrochemical Impedance Spectroscopy Based Biosensors: Mechanistic Principles, Analytical Examples and Challenges towards Commercialization for Assays of Protein Cancer Biomarkers. ChemElectroChem 2019, 6, 989–1003. [Google Scholar] [CrossRef] [Green Version]
- Barsoukov, E.; Macdonald, J.R. Impedance Spectroscopy: Theory, Experiment, and Applications; Wiley: Hoboken, NJ, USA, 2005; pp. 1–595. [Google Scholar]
- Ellis, C.L.C.; Smith, E.; Javaid, H.; Berns, G.; Venkataraman, D. Chapter 6—Ion Migration in Hybrid Perovskites: Evolving Understanding of a Dynamic Phenomenon. In Perovskite Photovoltaics; Thomas, S., Thankappan, A., Eds.; Academic Press: Cambridge, MA, USA, 2018; pp. 163–196. [Google Scholar]
- Uygun, Z.O.; Ertuğrul Uygun, H.D. A short footnote: Circuit design for faradaic impedimetric sensors and biosensors. Sens. Actuators B Chem. 2014, 202, 448–453. [Google Scholar] [CrossRef]
- Melchior, S.A.; Raju, K.; Ike, I.S.; Erasmus, R.M.; Kabongo, G.; Sigalas, I.; Iyuke, S.E.; Ozoemena, K.I. High-Voltage Symmetric Supercapacitor Based on 2D Titanium Carbide (MXene, Ti2CTx)/Carbon Nanosphere Composites in a Neutral Aqueous Electrolyte. J. Electrochem. Soc. 2018, 165, A501–A511. [Google Scholar] [CrossRef] [Green Version]
- Zhang, X.; Liu, Y.; Dong, S.; Ye, Z.; Wei, Y. Low-temperature synthesized nanocomposites with amorphous FeOOH on Ti3C2Tx for supercapacitors. J. Alloy. Compd. 2018, 744, 507–515. [Google Scholar] [CrossRef]
- Syamsai, R.; Grace, A.N. Ta4C3 MXene as supercapacitor electrodes. J. Alloy. Compd. 2019, 792, 1230–1238. [Google Scholar] [CrossRef]
- Zhao, C.; Wang, Q.; Zhang, H.; Passerini, S.; Qian, X. Two-Dimensional Titanium Carbide/RGO Composite for High-Performance Supercapacitors. Acs Appl. Mater. Interfaces 2016, 8, 15661–15667. [Google Scholar] [CrossRef] [PubMed]
- Lorencova, L.; Bertok, T.; Dosekova, E.; Holazova, A.; Paprckova, D.; Vikartovska, A.; Sasinkova, V.; Filip, J.; Kasak, P.; Jerigova, M.; et al. Electrochemical performance of Ti3C2Tx MXene in aqueous media: Towards ultrasensitive H2O2 sensing. Electrochim. Acta 2017, 235, 471–479. [Google Scholar] [CrossRef] [PubMed] [Green Version]
- Huang, R.; Chen, S.; Yu, J.; Jiang, X. Self-assembled Ti3C2/MWCNTs nanocomposites modified glassy carbon electrode for electrochemical simultaneous detection of hydroquinone and catechol. Ecotoxicol. Environ. Saf. 2019, 184, 109619. [Google Scholar] [CrossRef]
- Bertok, T.; Lorencova, L.; Hroncekova, S.; Gajdosova, V.; Jane, E.; Hires, M.; Kasak, P.; Kaman, O.; Sokol, R.; Bella, V. Advanced impedimetric biosensor configuration and assay protocol for glycoprofiling of a prostate oncomarker using Au nanoshells with a magnetic core. Biosens. Bioelectron. 2019, 131, 24–29. [Google Scholar] [CrossRef]
- Bertok, T.; Lorencova, L.; Hroncekova, S.; Gajdosova, V.; Jane, E.; Hires, M.; Kasak, P.; Kaman, O.; Sokol, R.; Bella, V. Synthesis and characterization of Au nanoshells with a magnetic core and betaine derivatives. MethodsX 2019, 6, 1999–2012. [Google Scholar] [CrossRef]
- Zhou, L.; Zhang, X.; Ma, L.; Gao, J.; Jiang, Y. Acetylcholinesterase/chitosan-transition metal carbides nanocomposites-based biosensor for the organophosphate pesticides detection. Biochem. Eng. J. 2017, 128, 243–249. [Google Scholar] [CrossRef]
- Medetalibeyoglu, H.; Kotan, G.; Atar, N.; Yola, M.L. A novel and ultrasensitive sandwich-type electrochemical immunosensor based on delaminated MXene@AuNPs as signal amplification for prostate specific antigen (PSA) detection and immunosensor validation. Talanta 2020, 220, 121403. [Google Scholar] [CrossRef] [PubMed]
- Medetalibeyoglu, H.; Beytur, M.; Akyıldırım, O.; Atar, N.; Yola, M.L. Validated electrochemical immunosensor for ultra-sensitive procalcitonin detection: Carbon electrode modified with gold nanoparticles functionalized sulfur doped MXene as sensor platform and carboxylated graphitic carbon nitride as signal amplification. Sens. Actuators B Chem. 2020, 319, 128195. [Google Scholar] [CrossRef]
- Zhou, S.; Gu, C.; Li, Z.; Yang, L.; He, L.; Wang, M.; Huang, X.; Zhou, N.; Zhang, Z. Ti3C2Tx MXene and polyoxometalate nanohybrid embedded with polypyrrole: Ultra-sensitive platform for the detection of osteopontin. Appl. Surf. Sci. 2019, 498, 143889. [Google Scholar] [CrossRef]
- Duan, F.; Guo, C.; Hu, M.; Song, Y.; Wang, M.; He, L.; Zhang, Z.; Pettinari, R.; Zhou, L. Construction of the 0D/2D heterojunction of Ti3C2Tx MXene nanosheets and iron phthalocyanine quantum dots for the impedimetric aptasensing of microRNA-155. Sens. Actuators B Chem. 2020, 310, 127844. [Google Scholar] [CrossRef]
- Özcan, N.; Medetalibeyoglu, H.; Akyıldırım, O.; Atar, N.; Yola, M.L. Electrochemical detection of amyloid-β protein by delaminated titanium carbide MXene/multi-walled carbon nanotubes composite with molecularly imprinted polymer. Mater. Today Commun. 2020, 23, 101097. [Google Scholar] [CrossRef]
- Kadirsoy, S.; Atar, N.; Yola, M.L. Molecularly imprinted QCM sensor based on delaminated MXene for chlorpyrifos detection and QCM sensor validation. New J. Chem. 2020, 44, 6524–6532. [Google Scholar] [CrossRef]


Publisher’s Note: MDPI stays neutral with regard to jurisdictional claims in published maps and institutional affiliations. |
© 2020 by the authors. Licensee MDPI, Basel, Switzerland. This article is an open access article distributed under the terms and conditions of the Creative Commons Attribution (CC BY) license (http://creativecommons.org/licenses/by/4.0/).
Share and Cite
Aguedo, J.; Lorencova, L.; Barath, M.; Farkas, P.; Tkac, J. Electrochemical Impedance Spectroscopy on 2D Nanomaterial MXene Modified Interfaces: Application as a Characterization and Transducing Tool. Chemosensors 2020, 8, 127. https://0-doi-org.brum.beds.ac.uk/10.3390/chemosensors8040127
Aguedo J, Lorencova L, Barath M, Farkas P, Tkac J. Electrochemical Impedance Spectroscopy on 2D Nanomaterial MXene Modified Interfaces: Application as a Characterization and Transducing Tool. Chemosensors. 2020; 8(4):127. https://0-doi-org.brum.beds.ac.uk/10.3390/chemosensors8040127
Chicago/Turabian StyleAguedo, Juvissan, Lenka Lorencova, Marek Barath, Pavol Farkas, and Jan Tkac. 2020. "Electrochemical Impedance Spectroscopy on 2D Nanomaterial MXene Modified Interfaces: Application as a Characterization and Transducing Tool" Chemosensors 8, no. 4: 127. https://0-doi-org.brum.beds.ac.uk/10.3390/chemosensors8040127