Article

Paracetamol Sensing with a Pencil Lead Electrode Modified with Carbon Nanotubes and Polyvinylpyrrolidone

1
Institute of Science, School of Chemistry, Suranaree University of Technology, 111 University Avenue, Suranaree, Muang, Nakhon Ratchasima 30000, Thailand
2
Division of Biomaterials and Bioengineering, University of California San Francisco, 513 Parnassus Ave, San Francisco, CA 94143, USA
3
National Nanotechnology Center, National Science and Technology Development Agency, Thailand Science Park, Pathum Thani 12120, Thailand
4
Department of Applied Chemistry, Faculty of Science and Liberal Arts, Rajamangala University of Technology Isan, 744, Suranarai Rd., Nakhon Ratchasima 30000, Thailand
*
Authors to whom correspondence should be addressed.
Submission received: 12 November 2020 / Revised: 9 December 2020 / Accepted: 11 December 2020 / Published: 15 December 2020
(This article belongs to the Special Issue Voltammperometric Sensors)

Abstract

:
The determination of paracetamol is a common need in pharmaceutical and environmental samples for which a low-cost, rapid, and accurate sensor would be highly desirable. We develop a novel pencil graphite lead electrode (PGE) modified with single-wall carbon nanotubes (SWCNTs) and polyvinylpyrrolidone (PVP) polymer (PVP/SWCNT/PGE) for the voltammetric quantification of paracetamol. The sensor shows remarkable analytical performance in the determination of paracetamol at neutral pH, with a limit of detection of 0.38 μM and a linear response from 1 to 500 μM using square-wave voltammetry (SWV), which are well suited to the analysis of pharmaceutical preparations. The introduction of the polymer PVP can cause dramatic changes in the sensing performance of the electrode, depending on its specific architecture. These effects were investigated using cyclic voltammetry (CV), electrochemical impedance spectroscopy (EIS), and scanning electron microscopy (SEM). The results indicate that the co-localization and dispersion of PVP throughout the carbon nanotubes on the electrode are key to its superior electrochemical performance, facilitating the electrical contact between the nanotubes and with the electrode surface. The application of this sensor to commercial syrup and tablet preparations is demonstrated with excellent results.

1. Introduction

Paracetamol (N-acetyl-p-aminophenol, also known as acetaminophen) is one of the most widely prescribed drugs for its antipyretic and analgesic properties [1]. However, elevated doses can be toxic, leading to oxidative stress and kidney and liver damage [2,3]. Paracetamol is often found in the aquatic environment around urban areas, in concentrations ranging from µM to mM, due to sewage disposal [4]. Thus, it is considered a priority pollutant on the basis of its potential toxicity and environmental fate [5,6,7]. Several analytical techniques have been used for the quantification of paracetamol in pharmaceutical preparations, biological fluids, and environmental samples [8], including spectroscopy [9], chemiluminescence [10], titration [11], gas chromatography [12], liquid chromatography [13,14], mass spectrometry [15], and electrochemical methods [16,17,18]. Among them, electrochemical methods are particularly attractive due to their high sensitivity, speed of results, and ease of operation [19,20].
Pencil graphite electrodes (PGEs) are becoming increasingly popular to prepare sensitive voltammetric sensors. PGEs offer several advantages, including good electrical conductivity, commercial availability, good mechanical stability, and suitability for fabricating single-use and miniaturized sensors [21,22]. PGEs display high adsorption capacity, and their surface can be modified with conductive polymers [23], metallic nanoparticles [24], carbon nanostructures [25,26], or their combinations [27]. While the electrochemical process taking place on a non-nanostructured electrode surface is often electrochemically irreversible, the combination of a conductive polymer and nanostructured carbon materials deposited on the electrode can accelerate the electron transfer and approximate the ideal electrochemically reversible operation. Among the compounds used for surface modification, carbon nanotubes (CNTs) have been widely applied to accelerate the electron transfer on bare electrodes thanks to their large surface area, strong adsorptive interaction, and high electrical conductivity [28,29]. In particular, single-wall CNTs (SWCNTs), with their 1-D nature, superior specific area, and low charge transfer resistance, are often chosen for electrochemical applications [30,31]. Nevertheless, the practical application of CNTs is hindered by their agglomeration, both in the dry state and in common solvents, which reduces the effectiveness of this modification [32]. To overcome this, CNTs can be combined with surfactants like polyvinylpyrrolidone (PVP).
PVP is a water-soluble, low-cost polymer with desirable properties such as biocompatibility and high thermal stability [33]. Each monomeric unit in PVP displays a polar amide group, making it hydrophilic, whereas the rest of the ring and the polymer backbone are composed of hydrophobic methylene (-CH2-) and methine (-CH<) groups. In an aqueous solution, PVP forms random coils resembling those of proline-rich proteins [34]. Introducing PVP for electrode modification could reduce the agglomeration of nanoparticles through repulsive interactions between PVP backbones [35]. Furthermore, Chan et al. reported a strong interaction and excellent miscibility between PVP and paracetamol [36,37].
Herein, we report the fabrication of a cost-effective voltammetric sensor for the detection of paracetamol based on a SWCNT- and PVP-modified pencil graphite electrode. The PVP/SWCNT/PGE was investigated for its electrochemical behavior in the electro-oxidation of paracetamol by cyclic voltammetry (CV) and square-wave voltammetry (SWV). The resulting voltammetric sensor exhibits notable analytical performance, including low overpotential for paracetamol oxidation and high anodic current, thus achieving excellent sensitivity for paracetamol quantification. The proposed sensor was successfully demonstrated for use with pharmaceutical formulations.

2. Materials and Methods

2.1. Reagents and Materials

Acetaminophen (C8H9NO2, Acros Organics), single-walled carbon nanotubes functionalized with 3–6% -COOH groups (P3-SWCNT, Carbon Solutions, Inc., Riverside, CA, USA), polyvinylpyrrolidone (PVP, Carlo Erba), potassium ferricyanide (K3[Fe(CN)6], Acros Organics), disodium hydrogen phosphate (Na2HPO4, QrëC), potassium dihydrogen phosphate (KH2PO4, QrëC), and potassium chloride (KCl, QrëC) were of analytical grade. All aqueous solutions were prepared with deionized (DI) water.

2.2. Apparatus

All voltammetric experiments were performed using a three-electrode setup equipped with a potentiostat (Metrohm 910 PSTAT Mini, The Netherlands) at room temperature. The three-electrode setup for the voltammetric measurement consisted of a pseudo-Ag/AgCl wire as the reference electrode (RE), a Pt wire as the counter electrode (CE), and a modified PGE as the working electrode (WE). Electrochemical impedance spectroscopy (EIS) was carried out using a PalmSens 4 EIS potentiostat/galvanostat controlled by PSTrace 5.8 software (PalmSens, Houten, The Netherlands). In this case, an Ag/AgCl 3 M KCl reference electrode and a Pt-sheet electrode were employed for impedance measurements of the PGE. The surface morphologies of the PGE electrode surface were investigated using a field-emission scanning electron microscope (Zeiss AURIGA FE-SEM/FIB/EDX) at 1 keV acceleration and 30 µm aperture.

2.3. Preparation of the Pencil Graphite Electrode

A pencil graphite electrode (PGE) was fabricated from commercial pencil rods (Staedtler Mars carbon, 2H, 3 mm diameter) of 5 cm length. A sufficient amount of two-component epoxy resin A and B glue (Alteco, Japan) was mixed thoroughly on a glass slide. The cleaned end of a glass capillary (Dinner = 4 mm, Douter = 6 mm, L = 150 mm) was filled with the prepared epoxy along 1 cm approximately, and it was kept in a vertical position. A pencil rod was then slowly inserted through the epoxy filling and was air-dried for 24 h. The PGE end surface was polished on fine emery paper and polishing cloth with 5, 1, and 0.5 µm alumina slurries, respectively. The PGE was rinsed thoroughly with DI water, soaked in 1% nitric acid, and sonicated in DI water to remove any particles from the electrode surface. The resulting PGE was left to dry in air prior to use or modification. The resulting PGE design is shown in Figure S1.

2.4. Modification of the Working Electrodes

SWCNTs were dispersed in ethanol (4 mg/mL) by ultrasonication in a bath for 1 h. Then, 2 µL of the SWCNT suspension was drop-casted on the surface of the PGE and dried in air at room temperature. While multi-wall carbon nanotubes (MWCNTs) can also be used for electrode modification, SWCNTs may offer shorter response times [30]. Subsequently, 2 µL of PVP suspension in ethanol (0.25% w/v) was casted on the SWCNT/PGE surface and dried at room temperature. In one approach, the PVP polymer solution and the SWCNTs were pre-mixed to obtain a PVP-SWCNT mixture, which was then drop-casted on the PGE surface (Mixed PVP-CNT/PGE). In another approach, the SWCNT suspension was drop-casted as a first layer on the PGE, allowed to dry, and then the PVP solution was casted as a second layer onto the SWCNTs (PVP/SWCNT/PGE). For comparison, PVP/PGE and SWCNT/PGE electrodes were prepared by drop-casting 2 µL of PVP and 2 µL of SWCNT onto the PGE surface, respectively.

2.5. Electrochemical Measurement of the PGE

EIS measurements were performed in a solution containing 5 mM Fe(CN)6 3−/4− in 0.1 M KCl with an open-circuit potential (OCV) of 215 mV, at frequencies in the range 105–0.05 Hz and with an AC amplitude of 5 mV.
The electroactive surface area of the PGE was evaluated by cyclic voltammetry in a solution containing 5 mM K3[Fe(CN)6] and 0.1 M KCl [38]. Results were interpreted using the Randles–Sevcik equation [39]:
Ip = 2.69 × 10⁵ AD1/2 n3/2 υ1/2 C
where Ip is the peak current, A is the area of the electrode surface (cm2), n is the number of electrons transferred in the redox reaction, D is the diffusion coefficient (cm2/s), υ is the scan rate applied to the electrode (V/s), and C is the concentration of the electroactive species (mol/L). Using the known value for the diffusion coefficient of [Fe(CN)6]3−, 6.30 × 10⁻⁶ cm2 s−1, the electroactive surface area of the electrode can be calculated.

3. Results and Discussion

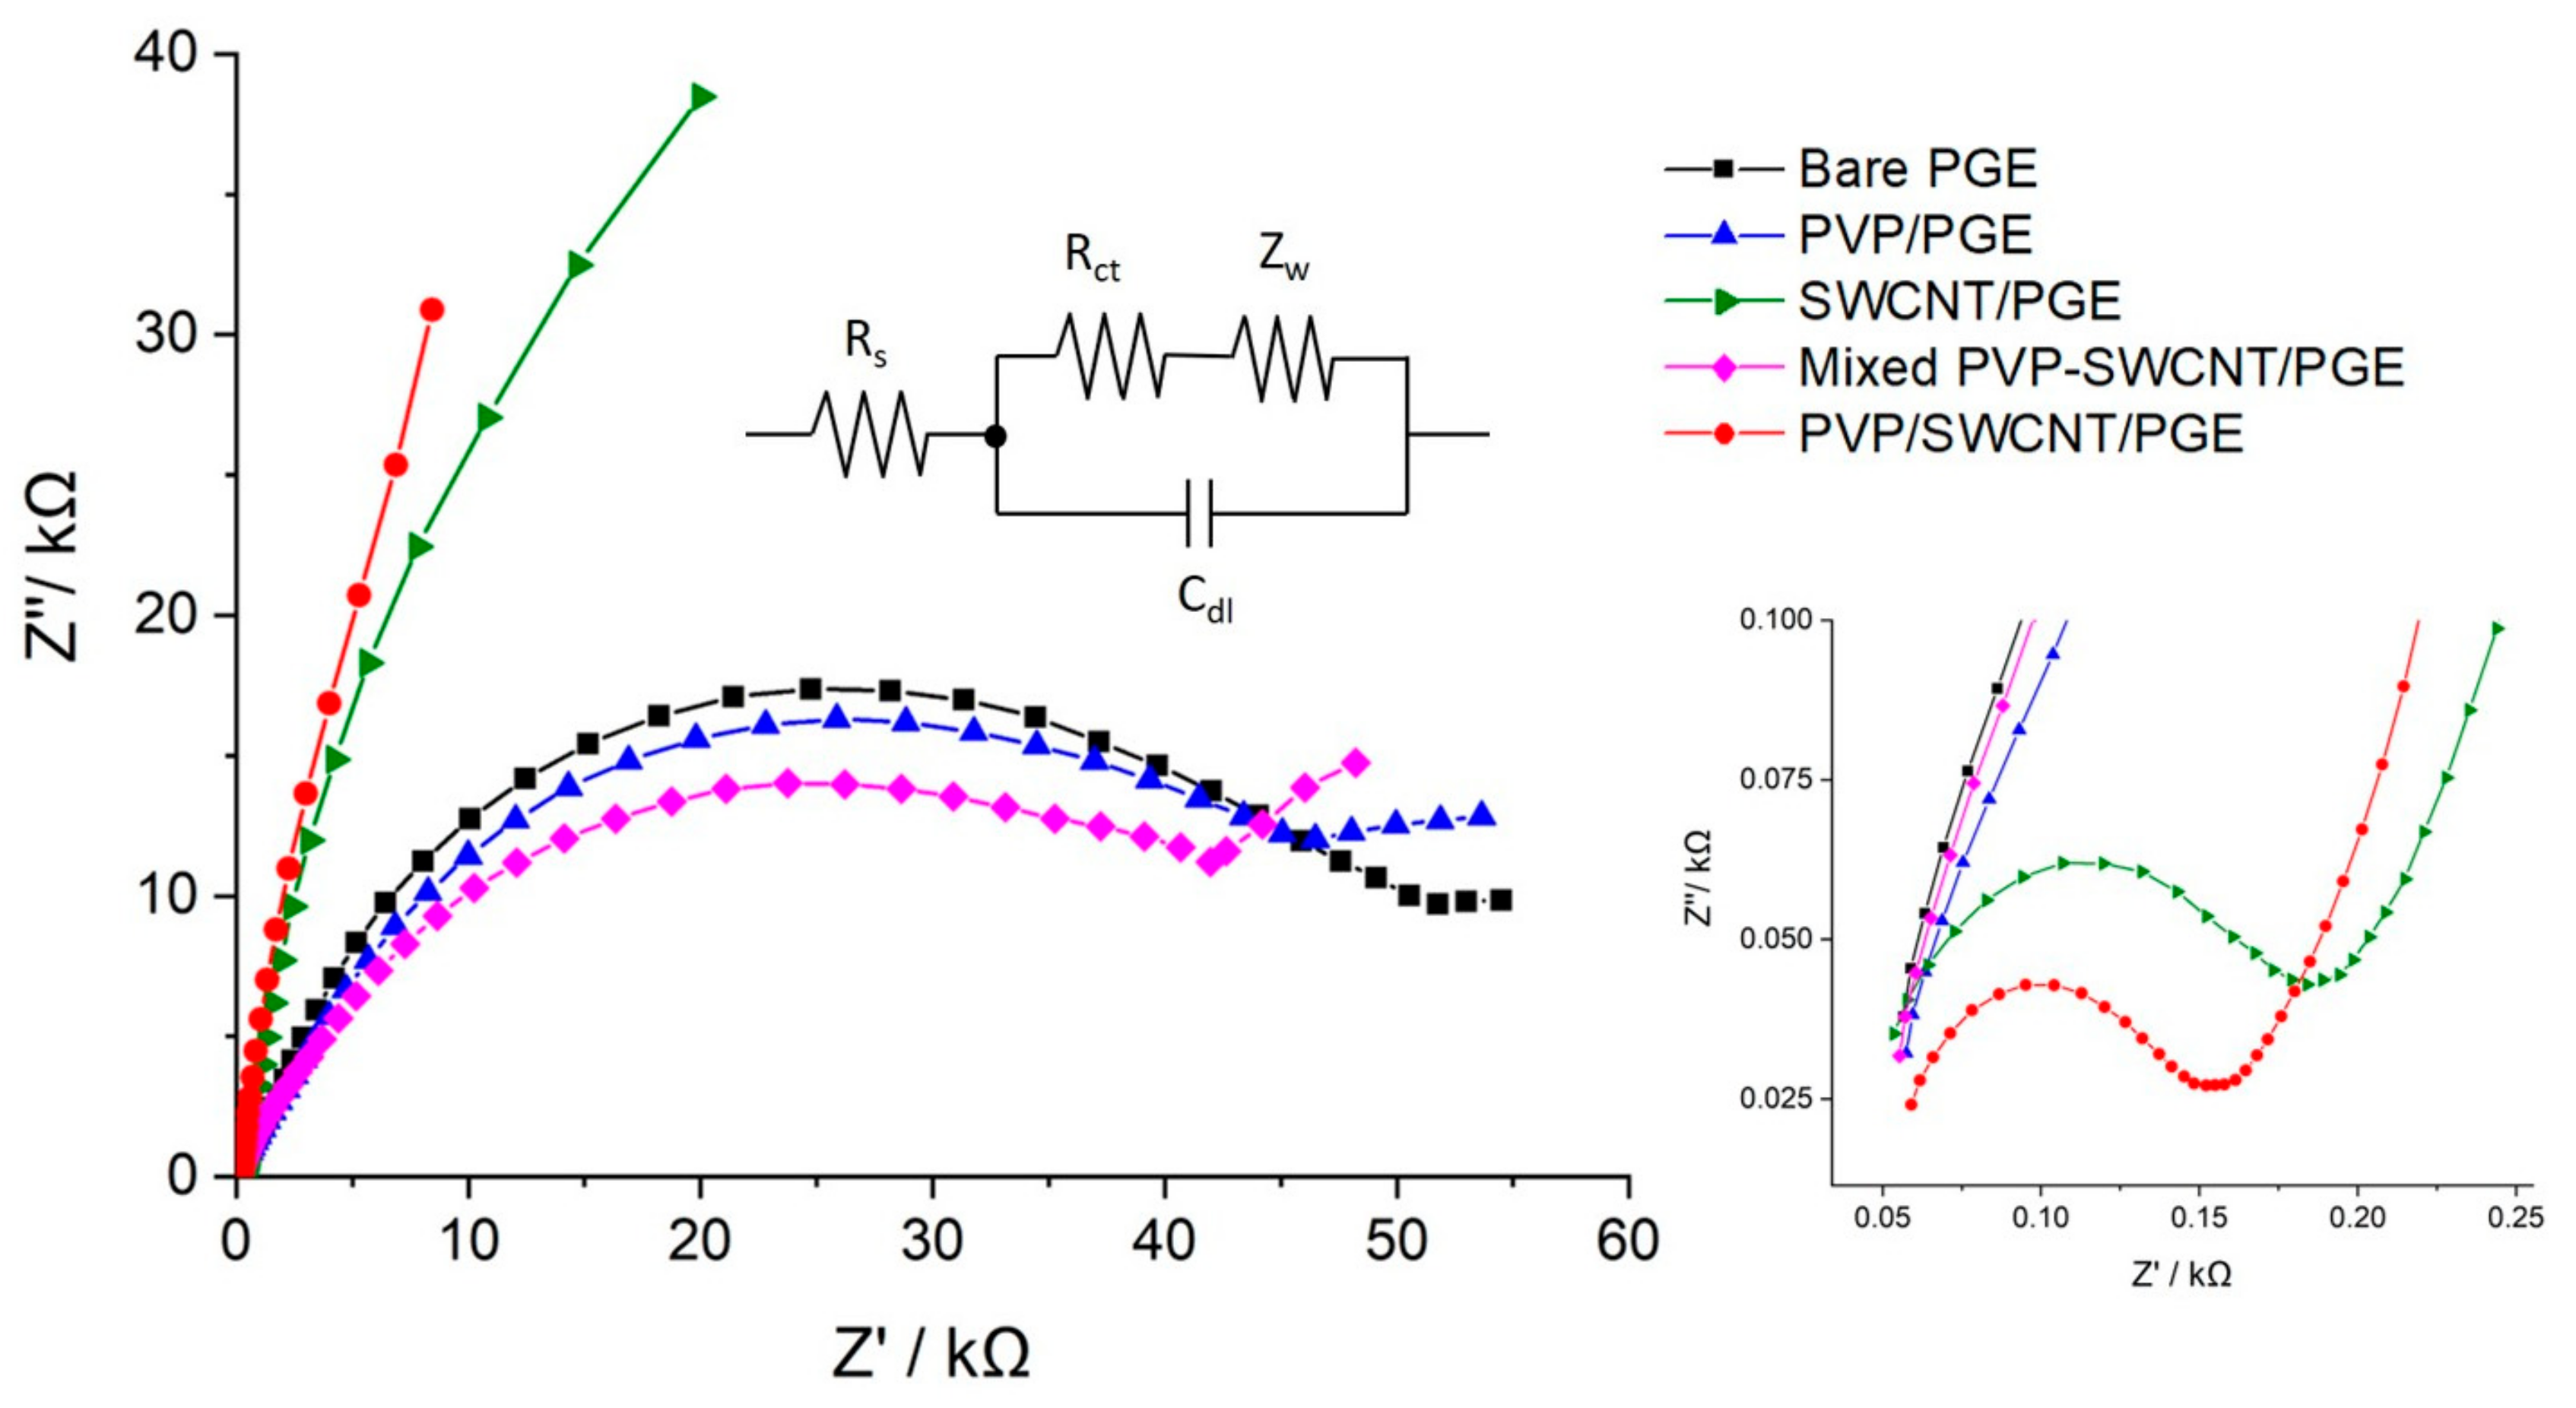
3.1. Effect of the Electrode Architecture

The interfacial charge transfer characteristics of electrodes with different architectures and modifications were investigated using EIS. The Nyquist plots for the EIS measurement of the modified and bare PGEs are shown in Figure 1.
To interpret the results, EIS measurements of a three-electrode cell can be assimilated to the behavior of a Randles circuit, and the parameters of the electric elements can be fitted from the Nyquist diagram [40]. At high sweep frequencies, the impedance of the double layer element (Cdl) drops, and the impedance measured is basically the solution resistance (Rs), which is negligible for this cell setup as the curves converge to the origin of the plot. By contrast, at low frequencies, the impedance is mainly determined by the resistance elements in series, and particularly by the charge transfer resistance element (Rct). The Rct obtained from EIS and the electrode active surface area of the PGEs with different modifications calculated from CV are presented in Table 1. The results for the bare PGE illustrate a large semicircle and the highest Rct for this electrode compared to the other designs. The mixed PVP-SWCNT/PGE design conferred a slight improvement over the bare PGE, with a smaller Rct. By introducing the SWCNTs onto the PGE surface, the Rct was dramatically reduced, indicating that the electrochemical performance could be much superior to the designs without SWCNTs. Notably, the PGE with the sequential modification with SWCNT and PVP layers (PVP/CNT/PGE) displayed an excellent charge transfer with a Rct value of only 82 Ω.

3.2. Surface Morphology of Bare PGE, PVP/PGE, SWCNT/PGE, and PVP/SWCNT/PGE

FE-SEM images of bare PGE, PVP/PGE, SWCNT/PGE, and PVP/SWCNT/PGE are shown in Figure 2. Pencil graphite leads consist of graphite (~65%) as a conductive material, clay (~30%), which confers hardness to the pencil, and non-conductive materials such as wax, resins, or polymers as binders [41]. The exact proportions and mineral used depend on the manufacturer and pencil hardness. Under the electron microscope (Figure 2A), the typical morphology of graphite flakes can be recognized on the pencil graphite surface, in agreement with previous reports [42]. Upon deposition of the amorphous PVP film on the electrode surface, the graphite flakes were covered, as reported by Voronova et al. [43] (Figure 2B). In this case, the surface roughness changed and flakes became exposed. When SWCNTs were coated onto a bare PGE, they were dispersed on the electrode, forming a three-dimensional mesh structure (Figure 2C). When PVP was coated onto SWCNT/PGE, as shown in Figure 2D, a more uniform layer of nanotubes was obtained, with high porosity and good mechanical integrity. The PVP in the nanocomposite can distribute throughout the material once the SWCNTs are drop-casted and adhere to contact points.
The presence of some negatively charged groups on the CNTs might strengthen their interaction with PVP at neutral pH. The areas of higher PVP concentration appear brighter and whiter in Figure 2D. These observations demonstrate the co-localization and dispersion of PVP along the SWCNTs on the PGE, which may contribute to enhancing its performance as a sensor.

3.3. Electrochemical Behavior of Paracetamol
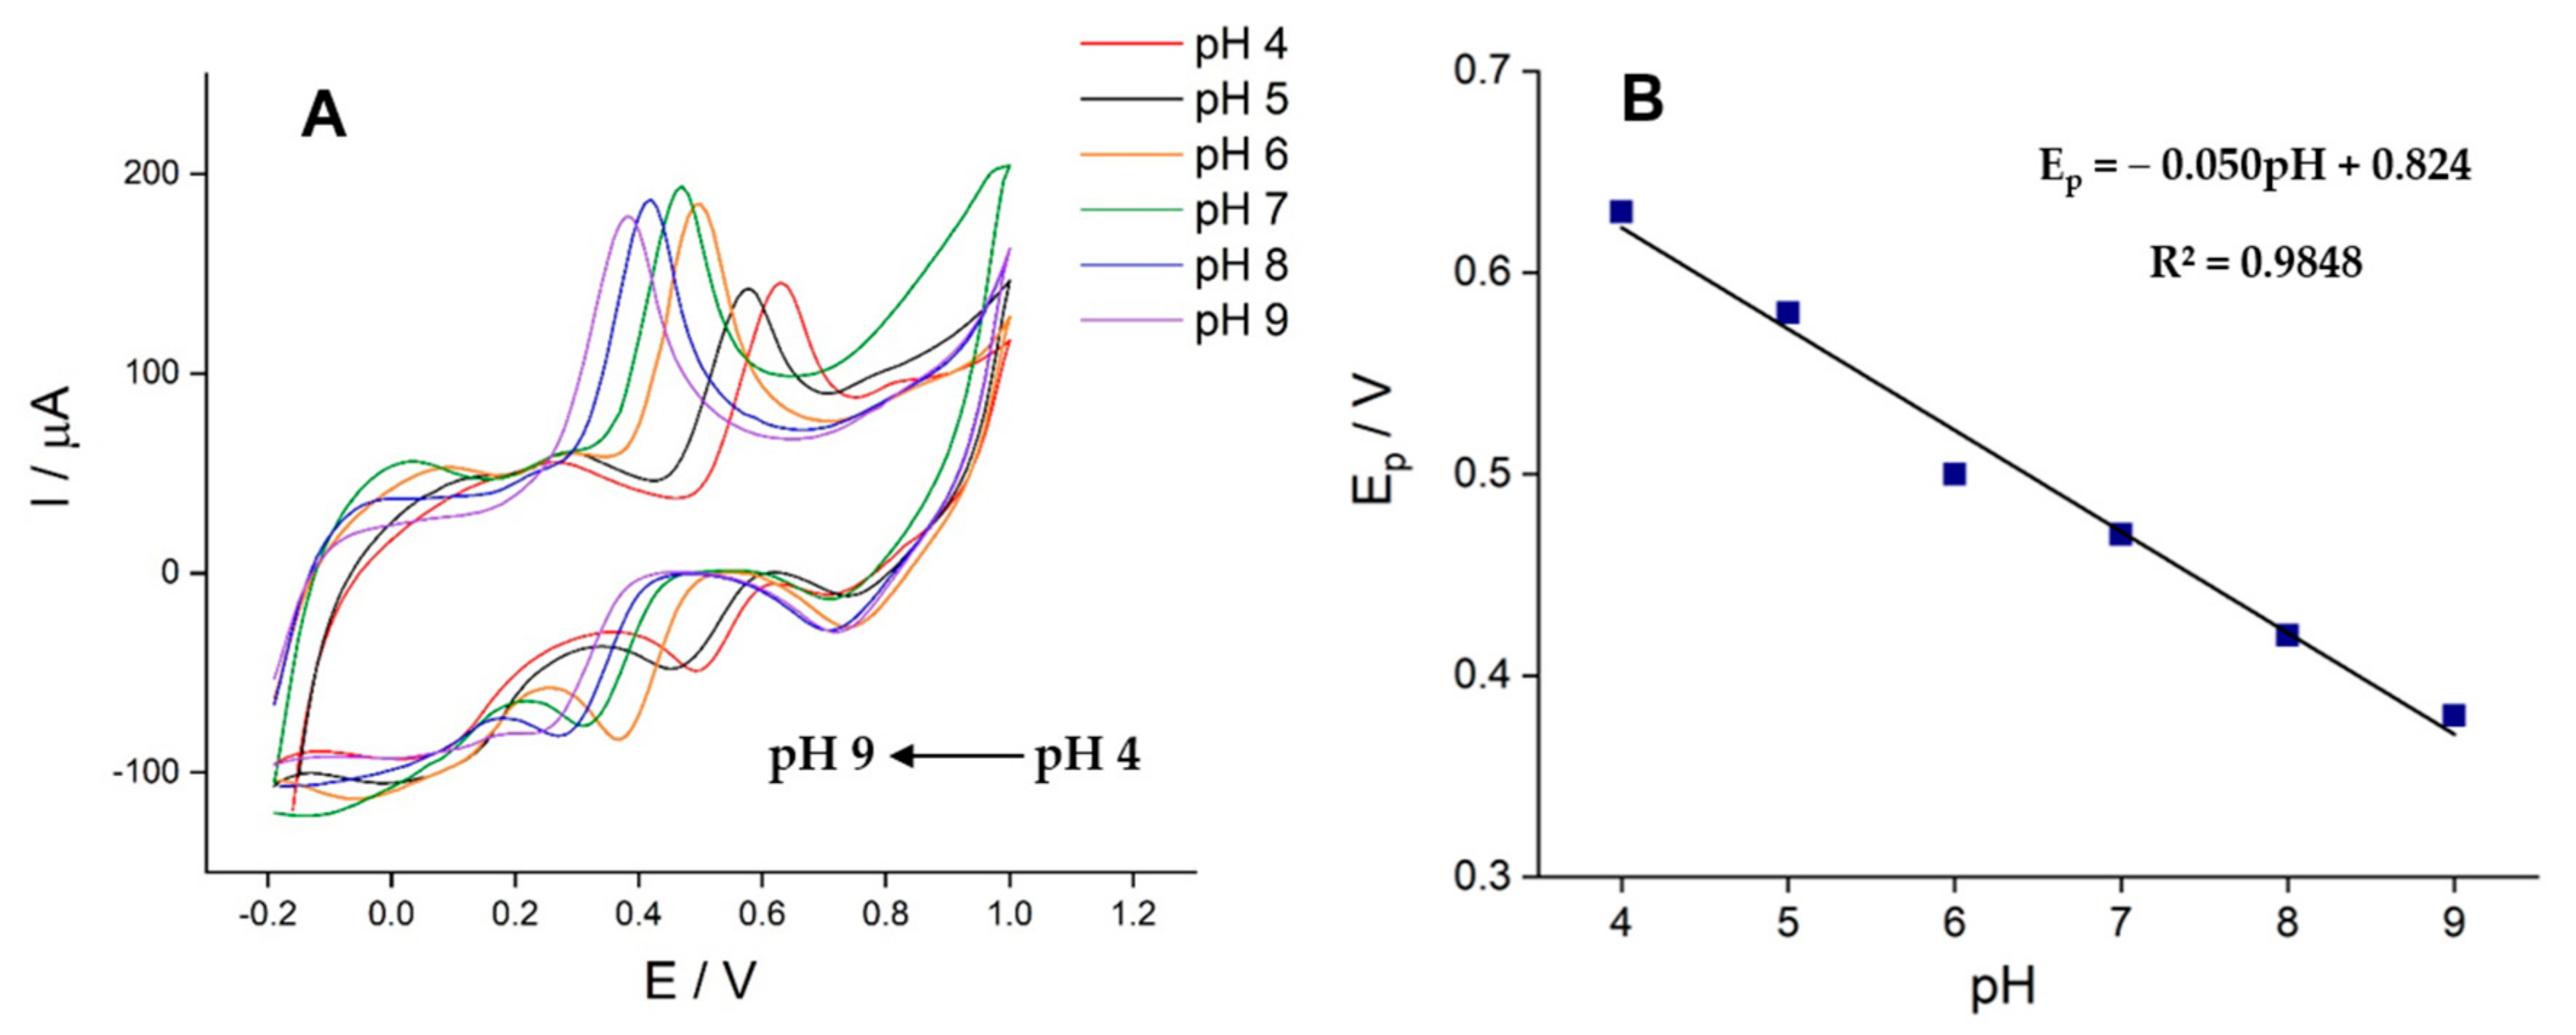
The electrochemical response of 1 mM paracetamol in 0.1 M phosphate buffer pH 7.0 over PGE, PVP/PGE, SWCNT/PGE, and PVP/SWCNT/PGE electrode designs was studied by cyclic voltammetry. The results are shown in Figure 3. On the bare PGE (Figure 3A), an irreversible redox behavior with shallow and broad redox peaks was observed at around 480 mV, corresponding to the oxidation of paracetamol. For PVP/PGE, a small increase in anodic current was observed relative to the bare PGE. By introducing SWCNTs onto the PGE, the anodic peak current significantly increased (Figure 3C). Notice that the PGE modified either with SWCNT or PVP also showed a larger peak current for reduction peak, indicating faster electron transfer compared to the bare electrode. The small peak starting at high potential may be attributed to solvent oxidation.
In the case of PVP/SWCNT/PGE (Figure 3D), a sharp, well-defined voltammogram was obtained, with an anodic peak potential (Epa) of 429 mV and a cathodic peak potential (Epc) of 331 mV. The electrochemical process involves two-electron and two-proton transfers overlapping [44]. The peak separation (∆Ep) of 98 mV indicated a favorable, quasi-reversible electrochemical process [45]. Moreover, the paracetamol oxidation peak current on SWCNT/PGE was twice as high as that on the bare PGE, while it was approximately five times higher for PVP/SWCNT/PGE. Therefore, the modified PVP/SWCNT/PGE significantly accelerated the oxidation of paracetamol. As indicated by the characterization results, the improved performance is due, to a large extent, to the favorable properties contributed by the carbon nanotubes, including low charge transfer resistance and high surface area, which support the high electrocatalytic activity in the oxidation of paracetamol [46]. The increased current response when PVP is subsequently added may be due to the improved electrical contact between the sensor components and also possibly to the more favorable adsorption of the analyte onto functional groups in PVP, such as C=O and C-N [45,47].

3.4. Effect of pH

The effect of the electrolyte pH on the electrochemical response of 1 mM paracetamol on PVP/SWCNT/PGE was investigated using CV. Peak currents varied with the pH of the medium in the range 4 to 9, as shown in Figure 4A. The peak current increased with solution pH up to a pH of 7 (Figure S3). Lower current and broader oxidation peaks were observed when the pH of the electrolyte was either lower or higher than 7, indicating a slower reaction. In addition, when increasing the pH of the medium, the redox peak shifted towards negative values, confirming that the redox reaction involves at least one proton [48]. The peak potential changed linearly with pH in the range from 4 to 9 according to the equation Epa(mV) = −0.050pH + 0.824 (R2 = 0.9848) (Figure 4B). The slope is close to the Nernstian value of −59 mV [49]. This suggests that the redox reaction of paracetamol involves the same number of protons and electrons, likely two electrons and two protons [50]. Based on these results, phosphate buffering at pH 7.0, which is conveniently close to physiological pH, was used in subsequent studies.

3.5. Effect of Scan Rate

The effect of the scan rate (υ) on the anodic and cathodic peak current of paracetamol on the PVP/SWCNT/PGE was investigated. When the scan rate was increased from 10 to 400 mV/s, the observed redox peak currents increased (Figure 5A). The peak current values obtained are plotted against the scan rate in Figure 5B, yielding the linear regression equations Ipa(μA) = 0.504υ(mV/s) + 12.096 (R2 = 0.9995) and Ipc(μA) = −0.326υ(mV/s) − 5.050 (R2 = 0.9978) for the anodic and cathodic peak, respectively. These results indicate that the electrochemical conversion of paracetamol on PVP/SWCNT/PGE is a surface-controlled process.
In addition, according to Laviron’s equation [51], the following relationships hold in the limit of high sweep rates:
E pa   =   E f 0 + 2 . 303 RT ( 1 α ) nF log nF ( 1 α ) k 0 RT   +   2.303 RT ( 1 α ) nF log ( ν ) E pc   =   E f 0 + 2 . 303 RT α nF log nF α k 0 RT     2.303 RT α nF log ( ν )
where (1 − α) is the charge transfer coefficient of paracetamol ( α is the charge transfer coefficient for the reduction of the oxidized product), F is Faraday’s constant (C/mol), R is the gas constant (J/mol·K), T is the temperature (K), and log denotes decimal logarithm. These equations describe a linear relationship between the peak potential and the logarithm of the sweep rate. Indeed, for high scan rates (300 to 400 mV/s), plotting Epa and Epc vs. ln(υ) (Figure 5C) leads to the following straight lines: Epa(V) = 0.159ln(υ) + 0.073 (R2 = 0.9882) and Epc(V) = −0.140ln(υ) + 0.676 (R2 = 0.9772), respectively. Based on the slope of the fit for the cathodic trace at high sweep rates (i.e., conditions close to the irreversible limit), the charge transfer coefficient α was estimated as 0.21. This value suggests that the rate-determining transition state may resemble the oxidized product more than the starting paracetamol substrate [52]. Based on the intercept of the fit, the kinetic rate of the electron transfer was estimated to be in the order of 0.11 s−1, with the formal potential of the redox couple estimated as E0f ≈ E01/2 = 0.372 V.
Having an idea of the rate of the electron transfer step, the electrochemical reversibility can be assessed with the Matsuda–Ayabe parameter [53].
Λ   =   k 0 F D ν R T
where the diffusion coefficient of paracetamol was taken as D = 0.65 × 10⁻⁹ m2 s−1 [54]. For the sweep rates explored in the study, the parameter would take values between 230 at 10 mV/s and 36 at 400 mV/s. These values are relatively close to the critical value Λ cr = 15, further evidencing that the oxidation process is electrochemically quasi-reversible under these conditions.

3.6. Determination of Paracetamol on the PVP/SWCNT/PGE

Square-wave voltammetry (SWV) offers higher sensitivity and resolution and a lower limit of detection (LOD) than cyclic voltammetry. Figure 6A shows the SWV results for different concentrations of paracetamol in 0.1 M phosphate buffer. The Ip varied linearly with paracetamol concentration in the range 1–500 µM, according to the following equation: Ipa(μA) = 0.086 × (μM) + 5.635 (R2 = 0.9960). The detection limit was estimated to be 0.38 μM using 3σ/b, where σ is the standard deviation of the blank, and b is the slope of the calibration curve (sensitivity).
The sensing of paracetamol with PVP/SWCNT/PGE was compared to previously reported paracetamol sensors, summarized in Table 2. The PVP/SWCNT/PGE developed in this study exhibits a low LOD and a very wide linear range. Introducing nanostructured carbon and PVP polymer as PGE modification further improves the ability to sense paracetamol. The sensitivity of the design proposed is only marginally exceeded by few systems, such as β-cyclodextrins, which leverage host–guest interactions, using differential pulse voltammetry [55], and the modification of SWCNTs with expensive rare-earth neodymium [56], to the detriment of the dynamic range of the senor and its fabrication cost.

3.7. Interference Study

The PVP/SWCNT/PGE sensor was investigated for its selectivity towards paracetamol by introducing common interfering species under the conditions optimized for measurement. We considered electroactive species that may be present in pharmaceutical formulations and environmental samples [55]. These include organic compounds like sucrose, glucose, ascorbic acid, caffeine, and methanol, as well as some cations such as NH4+, Ca2+, and Ni2+. The effect of these species on the oxidation peak was evaluated at a concentration of 300 μM paracetamol and a concentration of interferent of 10,000 µM (i.e., 33 times that of paracetamol). We found no significant effect of these interfering substances, with the signal deviation remaining below ±10%. Thus, the PVP/SWCNT/PGE sensor design offers satisfactory selectivity and can be effectively used for the determination of paracetamol in the presence of these common interfering substances.

3.8. Reproducibility, Reusability, and Storage Stability

Reproducibility was investigated by comparing the peak currents for 100 μM paracetamol from five PVP/SWCNT/PGE electrodes built independently. The modified electrode showed good reproducibility with a relative standard deviation (RSD) of 7.22% (n = 5). The reusability of the modified electrodes was also studied by measuring the peak current for 100 μM paracetamol with the same (already used) electrode with five repetitions. An RSD of 3.1% was obtained, which indicated that the proposed electrode can be used multiple times for consecutive measurements.
The evaluation of the long-tern storage stability of the modified electrode for one month (31 days) was conducted by using the same electrode for a daily measurement of the peak current of 100 μM paracetamol. After one month, the peak current had only decreased by ca. 9.5% compared to the signal on the first day, while the RSD for the peak currents was 4.99%.

3.9. Application to Real Samples

The practical application of the PVP/SWCNT/PGE sensor was demonstrated by determining the concentration of paracetamol in commercial paracetamol tablets (nominal paracetamol content of 500 mg) and a commercial drug formulation. A sample of paracetamol syrup was prepared by grinding the commercial tablets and dissolving them in 0.1 M phosphate buffer pH 7. The syrup thus prepared was then used for the determination of paracetamol. The results, shown in Table 3, evidenced excellent accuracy, recovery, and RSD values with the PVP/SWCNT/PGE sensor for both syrup and tablets.

4. Conclusions

We developed an accurate and cost-effective electrochemical sensor for paracetamol determination based on a layered PVP/SWCNT modification of a pencil graphite electrode. The introduction of SWCNTs considerably increased the active surface area and reduced the charge transfer resistance compared to a bare electrode. Improved performance could be achieved by introducing PVP as a layer after casting SWCNTs on the electrode. The results indicate that this improvement may be due to improved electrical contact across the nanotubes and/or the surface electrode. Such an improvement is lost if the nanotubes and the polymer are pre-mixed before casting them on the electrode, which highlights the strong and sometimes nonlinear relationship between architecture and analytical performance in electrochemical sensors. In fact, when sensing paracetamol, PVP may also favor the adsorption of the analyte in a synergistic manner. The modified electrode thus showed one of the best performances reported to date in the quantification of paracetamol, yielding a detection limit of 0.38 μM, a linear range of 1–500 μM, and a notable selectivity to paracetamol in the presence of common interfering substances. Quantification of paracetamol in real samples was also demonstrated with commercial paracetamol syrup and tablets, giving excellent results.

Supplementary Materials

The following are available online at https://0-www-mdpi-com.brum.beds.ac.uk/2227-9040/8/4/133/s1, Figure S1: Home-made PGE design, Figure S2: Cyclic voltammograms of 5 mM K3[Fe(CN)6] containing 0.1 M KCl of the electrodes with different modifications, and Figure S3: The plot of the pH of the peak current vs. pH.

Author Contributions

Conceptualization, S.L. and P.P.; methodology, S.L. and P.P.; validation, S.L., P.P. and V.B.; investigation, S.L. and P.P.; resources, S.L. and K.C.; writing—original draft preparation, P.P. and S.L.; writing—review and editing, S.L., P.P., K.C. and V.B.; visualization, S.L. and V.B.; supervision, S.L., P.P. and V.B.; funding acquisition, S.L., V.B., P.P. and K.C. All authors have read and agreed to the published version of the manuscript.

Funding

This research was funded by the Thailand Research Fund (TRF) and the Office of the Higher Education Commission (MRG) Grant No. MRG6180072 and National Nanotechnology Center Grant No. P1851658. V. Blay thanks the Valencian Ministry of Education for its support (APOSTD/2020/120).

Acknowledgments

The authors thank Suranaree University of Technology for partially providing funding for publishing this work.

Conflicts of Interest

The authors declare no conflict of interest.

References

  1. Bayram, E.; Akyilmaz, E. Development of a new microbial biosensor based on conductive polymer/multiwalled carbon nanotube and its application to paracetamol determination. Sens. Actuators B 2016, 233, 409–418. [Google Scholar] [CrossRef]
  2. Sheen, C.L.; Dillon, J.F.; Bateman, D.N.; Simpson, K.J.; Macdonald, T.M. Paracetamol toxicity: Epidemiology, prevention and costs to the health-care system. QJM Int. J. Med. 2002, 95, 609–619. [Google Scholar] [CrossRef] [PubMed] [Green Version]
  3. Nunes, B.; Antunes, S.C.; Santos, J.; Martins, L.; Castro, B.B. Toxic potential of paracetamol to freshwater organisms: A headache to environmental regulators? Ecotoxicol. Environ. Saf. 2014, 107, 178–185. [Google Scholar] [CrossRef] [PubMed]
  4. Roberts, P.H.; Thomas, K.V. The occurrence of selected pharmaceuticals in wastewater effluent and surface waters of the lower Tyne catchment. Sci. Total Environ. 2006, 356, 143–153. [Google Scholar] [CrossRef] [PubMed]
  5. Bottoni, P.; Caroli, S.; Caracciolo, A.B. Pharmaceuticals as priority water contaminants. Toxicol. Environ. Chem. 2010, 92, 549–565. [Google Scholar] [CrossRef]
  6. Ebele, A.J.; Abou-Elwafa Abdallah, M.; Harrad, S. Pharmaceuticals and personal care products (PPCPs) in the freshwater aquatic environment. Emerg. Contam. 2017, 3, 1–16. [Google Scholar] [CrossRef]
  7. De Voogt, P.; Janex-Habibi, M.-L.; Sacher, F.; Puijker, L.; Mons, M. Development of a common priority list of pharmaceuticals relevant for the water cycle. Water Sci. Technol. 2009, 59, 39–46. [Google Scholar] [CrossRef]
  8. Montaseri, H.; Forbes, P.B.C. Analytical techniques for the determination of acetaminophen: A review. TrAC Trends Anal. Chem. 2018, 108, 122–134. [Google Scholar] [CrossRef]
  9. Sirajuddin; Khaskheli, A.R.; Shah, A.; Bhanger, M.I.; Niaz, A.; Mahesar, S. Simpler spectrophotometric assay of paracetamol in tablets and urine samples. Spectrochim. Acta A 2007, 68, 747–751. [Google Scholar] [CrossRef]
  10. Easwaramoorthy, D.; Yu, Y.-C.; Huang, H.-J. Chemiluminescence detection of paracetamol by a luminol-permanganate based reaction. Anal. Chim. Acta 2001, 439, 95–100. [Google Scholar] [CrossRef]
  11. Kumar, K.G.; Letha, R. Determination of Paracetamol in pure form and in dosage forms using N,N-dibromo dimethylhydantoin. J. Pharm. Biomed. Anal. 1997, 15, 1725–1728. [Google Scholar] [CrossRef]
  12. Migowska, N.; Caban, M.; Stepnowski, P.; Kumirska, J. Simultaneous analysis of non-steroidal anti-inflammatory drugs and estrogenic hormones in water and wastewater samples using gas chromatography–mass spectrometry and gas chromatography with electron capture detection. Sci. Total Environ. 2012, 441, 77–88. [Google Scholar] [CrossRef] [PubMed]
  13. Pugajeva, I.; Rusko, J.; Perkons, I.; Lundanes, E.; Bartkevics, V. Determination of pharmaceutical residues in wastewater using high performance liquid chromatography coupled to quadrupole-Orbitrap mass spectrometry. J. Pharm. Biomed. Anal. 2017, 133, 64–74. [Google Scholar] [CrossRef] [PubMed]
  14. Fernandes, T.A.P.; Aguiar, J.P.; Fernandes, A.I.; Pinto, J.F. Quantification of theophylline or paracetamol in milk matrices by high-performance liquid chromatography. J. Pharm. Anal. 2017, 7, 401–405. [Google Scholar] [CrossRef] [PubMed]
  15. Attygalle, A.B.; Jariwala, F.B.; Pavlov, J.; Yang, Z.; Mahr, J.A.; Oviedo, M. Direct detection and identification of active pharmaceutical ingredients in intact tablets by helium plasma ionization (HePI) mass spectrometry. J. Pharm. Anal. 2014, 4, 166–172. [Google Scholar] [CrossRef] [Green Version]
  16. Fan, Y.; Liu, J.-H.; Lu, H.-T.; Zhang, Q. Electrochemical behavior and voltammetric determination of paracetamol on Nafion/TiO2–graphene modified glassy carbon electrode. Colloids Surf. B 2011, 85, 289–292. [Google Scholar] [CrossRef]
  17. Asadpour-Zeynali, K.; Amini, R. Nanostructured hexacyanoferrate intercalated Ni/Al layered double hydroxide modified electrode as a sensitive electrochemical sensor for paracetamol determination. Electroanalysis 2017, 29, 635–642. [Google Scholar] [CrossRef]
  18. El Bouabi, Y.; Farahi, A.; Labjar, N.; El Hajjaji, S.; Bakasse, M.; El Mhammedi, M.A. Square wave voltammetric determination of paracetamol at chitosan modified carbon paste electrode: Application in natural water samples, commercial tablets and human urines. Mater. Sci. Eng. C 2016, 58, 70–77. [Google Scholar] [CrossRef]
  19. Vasilescu, A.; Fanjul-Bolado, P.; Titoiu, A.-M.; Porumb, R.; Epure, P. Progress in electrochemical (bio)sensors for monitoring wine production. Chemosensors 2019, 7, 66. [Google Scholar] [CrossRef] [Green Version]
  20. Kawde, A.-N.; Baig, N.; Sajid, M. Graphite pencil electrodes as electrochemical sensors for environmental analysis: A review of features, developments, and applications. RSC Adv. 2016, 6, 91325–91340. [Google Scholar] [CrossRef]
  21. Annu; Sharma, S.; Jain, R.; Raja, A.N. Review—pencil graphite electrode: An emerging sensing material. J. Electrochem. Soc. 2019, 167, 037501. [Google Scholar] [CrossRef]
  22. Sağlam, Ö.; Dilgin, D.G.; Ertek, B.; Dilgin, Y. Differential pulse voltammetric determination of eugenol at a pencil graphite electrode. Mater. Sci. Eng. C 2016, 60, 156–162. [Google Scholar] [CrossRef] [PubMed]
  23. Pattar, V.P.; Nandibewoor, S.T. Staircase voltammetric determination of 2-thiouracil in pharmaceuticals and human biological fluids at polyaniline and polypyrrole film modified sensors. Sens. Actuators A 2016, 250, 40–47. [Google Scholar] [CrossRef]
  24. Saleh, G.A.; Askal, H.F.; Refaat, I.H.; Naggar, A.H.; Abdel-aal, F.A.M. Adsorptive square wave voltammetric determination of the antiviral drug valacyclovir on a novel sensor of copper microparticles–modified pencil graphite electrode. Arab. J. Chem. 2016, 9, 143–151. [Google Scholar] [CrossRef] [Green Version]
  25. Eksin, E.; Zor, E.; Erdem, A.; Bingol, H. Electrochemical monitoring of biointeraction by graphene-based material modified pencil graphite electrode. Biosens. Bioelectron. 2017, 92, 207–214. [Google Scholar] [CrossRef]
  26. Blay, V.; Galian, R.E.; Muresan, L.M.; Pankratov, D.; Pinyou, P.; Zampardi, G. Research frontiers in energy-related materials and applications for 2020–2030. Adv. Sustain. Syst. 2020, 4, 1900145. [Google Scholar] [CrossRef]
  27. Torrinha, Á.; Amorim, C.G.; Montenegro, M.C.B.S.M.; Araújo, A.N. Biosensing based on pencil graphite electrodes. Talanta 2018, 190, 235–247. [Google Scholar] [CrossRef]
  28. Lawal, A.T. Synthesis and utilization of carbon nanotubes for fabrication of electrochemical biosensors. Mater. Res. Bull. 2016, 73, 308–350. [Google Scholar] [CrossRef]
  29. Trojanowicz, M. Analytical applications of carbon nanotubes: A review. TrAC Trends Anal. Chem. 2006, 25, 480–489. [Google Scholar] [CrossRef]
  30. Alhans, R.; Singh, A.; Singhal, C.; Narang, J.; Wadhwa, S.; Mathur, A. Comparative analysis of single-walled and multi-walled carbon nanotubes for electrochemical sensing of glucose on gold printed circuit boards. Mater. Sci. Eng. C 2018, 90, 273–279. [Google Scholar] [CrossRef]
  31. Oliveira, T.M.B.F.; Morais, S. New generation of electrochemical sensors based on multi-walled carbon nanotubes. Appl. Sci. 2018, 8, 1925. [Google Scholar] [CrossRef] [Green Version]
  32. Vaisman, L.; Wagner, H.D.; Marom, G. The role of surfactants in dispersion of carbon nanotubes. Adv. Colloid Interface Sci. 2006, 128–130, 37–46. [Google Scholar] [CrossRef] [PubMed]
  33. Koczkur, K.M.; Mourdikoudis, S.; Polavarapu, L.; Skrabalak, S.E. Polyvinylpyrrolidone (PVP) in nanoparticle synthesis. Dalton Trans. 2015, 44, 17883–17905. [Google Scholar] [CrossRef] [PubMed] [Green Version]
  34. Haslam, E. Practical Polyphenolics: From Structure to Molecular Recognition and Physiological Action; Cambridge University Press: New York, NY, USA, 1998. [Google Scholar]
  35. Arul, P.; John, S.A. Size controlled synthesis of Ni-MOF using polyvinylpyrrolidone: New electrode material for the trace level determination of nitrobenzene. J. Electroanal. Chem. 2018, 829, 168–176. [Google Scholar] [CrossRef]
  36. Afrasiabi garekani, H.; Ghazi, A. Increasing the aqueous solubility of acetaminophen in the presence of polyvinylpyrrolidone and investigation of the mechanisms involved. Drug Dev. Ind. Pharm. 2003, 29, 173–179. [Google Scholar] [CrossRef] [PubMed]
  37. Chan, S.-Y.; Qi, S.; Craig, D.Q.M. An investigation into the influence of drug–polymer interactions on the miscibility, processability and structure of polyvinylpyrrolidone-based hot melt extrusion formulations. Int. J. Pharm. 2015, 496, 95–106. [Google Scholar] [CrossRef]
  38. Siswana, M.P.; Ozoemena, K.I.; Nyokong, T. Electrocatalysis of asulam on cobalt phthalocyanine modified multi-walled carbon nanotubes immobilized on a basal plane pyrolytic graphite electrode. Electrochim. Acta 2006, 52, 114–122. [Google Scholar] [CrossRef]
  39. Bard, A.J.; Faulkner, L.R. Electrochemical Methods: Fundamentals and Applications, 2nd ed.; John Wiley & Sons, Incorporated: Hoboken, NJ, USA, 2000. [Google Scholar]
  40. Chang, B.Y.; Park, S.M. Electrochemical Impedance Spectroscopy. Annu. Rev. Anal. Chem. 2010, 3, 207–229. [Google Scholar] [CrossRef]
  41. David, I.G.; Litescu, S.C.; Popa, D.E.; Buleandra, M.; Iordache, L.; Albu, C.; Alecu, A.; Penu, R.L. Voltammetric analysis of naringenin at a disposable pencil graphite electrode—application to polyphenol content determination in citrus juice. Anal. Methods 2018, 10, 5763–5772. [Google Scholar] [CrossRef]
  42. Navratil, R.; Kotzianova, A.; Halouzka, V.; Opletal, T.; Triskova, I.; Trnkova, L.; Hrbac, J. Polymer lead pencil graphite as electrode material: Voltammetric, XPS and Raman study. J. Electroanal. Chem. 2016, 783, 152–160. [Google Scholar] [CrossRef]
  43. Voronova, M.; Rubleva, N.; Kochkina, N.; Afineevskii, A.; Zakharov, A.; Surov, O. Preparation and characterization of polyvinylpyrrolidone/cellulose nanocrystals composites. Nanomaterials 2018, 8, 1011. [Google Scholar] [CrossRef] [PubMed] [Green Version]
  44. Zidan, M.; Tan, W.; Abdullah, A.; Goh, J. Electrochemical oxidation of paracetamol mediated by nanoparticles bismuth oxide modified glassy carbon electrode. Int. J. Electrochem. Sci. 2011, 279–288. [Google Scholar]
  45. Ghadimi, H.; Tehrani, R.M.A.; Ali, A.S.M.; Mohamed, N.; Ab Ghani, S. Sensitive voltammetric determination of paracetamol by poly (4-vinylpyridine)/multiwalled carbon nanotubes modified glassy carbon electrode. Anal. Chim. Acta 2013, 765, 70–76. [Google Scholar] [CrossRef] [PubMed]
  46. Pinyou, P.; Blay, V.; Muresan, L.M.; Noguer, T. Enzyme-modified electrodes for biosensors and biofuel cells. Mater. Horiz. 2019, 6, 1336–1358. [Google Scholar] [CrossRef]
  47. Yaman, Y.T.; Abaci, S. Sensitive adsorptive voltammetric method for determination of bisphenol A by gold nanoparticle/polyvinylpyrrolidone-modified pencil graphite electrode. Sensors 2016, 16, 756. [Google Scholar] [CrossRef] [Green Version]
  48. Manikandan, R.R.; Deepa, P.N.; Narayanan, S.S. Fabrication and characterization of poly 2-napthol orange film modified electrode and its application to selective detection of dopamine. J. Solid State Electrochem. 2017, 21, 3567–3578. [Google Scholar] [CrossRef]
  49. Cheng, K.L. Explanation of misleading Nernst slope by Boltzmann equation. Microchem. J. 1998, 59, 457–461. [Google Scholar] [CrossRef]
  50. Ghorbani-Bidkorbeh, F.; Shahrokhian, S.; Mohammadi, A.; Dinarvand, R. Simultaneous voltammetric determination of tramadol and acetaminophen using carbon nanoparticles modified glassy carbon electrode. Electrochim. Acta 2010, 55, 2752–2759. [Google Scholar] [CrossRef]
  51. Laviron, E. General expression of the linear potential sweep voltammogram in the case of diffusionless electrochemical systems. J. Electroanal. Chem. Interfacial Electrochem. 1979, 101, 19–28. [Google Scholar] [CrossRef]
  52. Manjunatha, R.; Nagaraju, D.H.; Suresh, G.S.; Melo, J.S.; D’Souza, S.F.; Venkatesha, T.V. Electrochemical detection of acetaminophen on the functionalized MWCNTs modified electrode using layer-by-layer technique. Electrochim. Acta 2011, 56, 6619–6627. [Google Scholar] [CrossRef]
  53. Matsuda, H.; Ayabe, Y. The theory of the cathode-ray polarography of Randles-Sevcik. Z. Elektrochem. Angew. Phys. Chem. 1955, 59, 494–503. [Google Scholar]
  54. Ribeiro, A.C.F.; Barros, M.C.F.; Veríssimo, L.M.P.; Santos, C.I.A.V.; Cabral, A.M.T.D.P.V.; Gaspar, G.D.; Esteso, M.A. Diffusion coefficients of paracetamol in aqueous solutions. J. Chem. Thermodyn. 2012, 54, 97–99. [Google Scholar] [CrossRef]
  55. Alam, A.U.; Qin, Y.; Howlader, M.M.R.; Hu, N.-X.; Deen, M.J. Electrochemical sensing of acetaminophen using multi-walled carbon nanotube and β-cyclodextrin. Sens. Actuators B 2018, 254, 896–909. [Google Scholar] [CrossRef]
  56. Arancibia, V.; Penagos-Llanos, J.; Nagles, E.; García-Beltrán, O.; Hurtado, J.J. Development of a microcomposite with single-walled carbon nanotubes and Nd2O3 for determination of paracetamol in pharmaceutical dosage by adsorptive voltammetry. J. Pharm. Anal. 2019, 9, 62–69. [Google Scholar] [CrossRef]
  57. Charithra, M.M.; Manjunatha, J.G. Enhanced voltammetric detection of paracetamol by using carbon nanotube modified electrode as an electrochemical sensor. J. Electrochem. Sci. Eng. 2019, 10, 29–40. [Google Scholar] [CrossRef]
  58. Mulyasuryani, A.; Tjahjanto, R.T.; Andawiyah, R.a. Simultaneous voltammetric detection of acetaminophen and caffeine base on cassava starch—Fe3O4 nanoparticles modified glassy carbon electrode. Chemosensors 2019, 7, 49. [Google Scholar] [CrossRef] [Green Version]
  59. Hao, W.; Zhang, Y.; Fan, J.; Liu, H.; Shi, Q.; Liu, W.; Peng, Q.; Zang, G. Copper Nanowires Modified with Graphene Oxide Nanosheets for Simultaneous Voltammetric Determination of Ascorbic Acid, Dopamine and Acetaminophen. Molecules 2019, 24, 2320. [Google Scholar] [CrossRef] [Green Version]
  60. Zhang, X.; Wang, K.-P.; Zhang, L.-N.; Zhang, Y.-C.; Shen, L. Phosphorus-doped graphene-based electrochemical sensor for sensitive detection of acetaminophen. Anal. Chim. Acta 2018, 1036, 26–32. [Google Scholar] [CrossRef]
Figure 1. Nyquist diagrams of the PGEs with different modifications in 5 mM Fe(CN)63−/4− containing 0.1 M KCl and the equivalent Randles circuit used for fitting the Nyquist plots. Rs is the solution resistance, Rct is the charge resistance transfer, Cdl is the double layer capacitance, and Zw is the Warburg impedance.
Chemosensors 08 00133 g001
Figure 2. FE-SEM images of (A) bare PGE, (B) PVP/PGE, (C) SWCNT/PGE, and (D) PVP/SWCNT/PGE.
Chemosensors 08 00133 g002
Figure 3. Cyclic voltammograms of 1 mM paracetamol on the bare PGE, PVP/PGE, SWCNT/PGE, and PVP/SWCNT/PGE in 0.1 M phosphate buffer pH 7.0 at a scan rate of 50 mV/s.
Chemosensors 08 00133 g003
Figure 4. (A) Cyclic voltammograms of 1 mM paracetamol on PVP/SWCNT/PGE in 0.1 M phosphate buffer at varying pH from 4 to 9. (B) Plot of anodic peak potential vs. pH.
Chemosensors 08 00133 g004
Figure 5. (A) Cyclic voltammograms of 1 mM paracetamol on PVP/SWCNT/PGE in 0.1 M phosphate buffer pH 7.0 at different scan rates (10, 25, 50, 75, 100, 125, 150, 175, 200, 225, 250, 275, 300, 325, 350, 375, and 400 mV/s). (B) Plot of peak current vs. scan rate. (C) Dependence of the redox peak potential with ln(υ).
Chemosensors 08 00133 g005
Figure 6. (A) Square-wave voltammograms of 1–500 μM paracetamol on PVP/SWCNT/PGE in 0.1 M phosphate buffer pH 7.0. (B) Plot of peak current vs. paracetamol concentration.
Chemosensors 08 00133 g006
Table 1. Comparison of the electrode active surface area for the PGEs with different modifications. Charge transfer resistance (Rct) was estimated from EIS measurements, whereas the electroactive surface area was estimated from CV in 0.1 M KCl solution containing 5 mM K3[Fe(CN)6] (Figure S2).
ElectrodeRct (Ω)Electroactive Surface Area (cm2)
Bare PGE2.67 ± 0.08 × 1040.0224 ± 0.0003
PVP/PGE2.31 ± 1.3 × 1040.0385 ± 0.0013
SWCNT/PGE117 ± 9.50.1114 ± 0.0039
Mixed PVP-SWCNT/PGE1.72 ± 0.12 × 1040.0367 ± 0.0006
PVP/SWCNT/PGE82 ± 6.30.1126 ± 0.0006
Table 2. Comparison of recently reported electrochemical sensors for paracetamol.
Modified ElectrodesMethodLOD
(μM)
Linear Range
(μM)
Ref.
Nafion/TiO2-graphene/GCEDPV0.211–100[16]
Hexacyanoferate(III) intercalated Ni−Al layered double hydroxide/GCECA0.803–1500[17]
Chitosan/CPESWV0.510.8–20, 40–100[18]
MWCNT/β-cyclodextrin/GCE DPV0.01150.05–300[55]
SWCNT/Nd2O3/CPESWV0.050.10–9.5[56]
Poly(methyl orange) CNT-paste electrodeDPV0.382–50[57]
Cassava starch-Fe3O4/GCEDPV1650–2000[58]
Nafion/Cu-nanowires/GO/GCEDPV0.041–100[59]
Phosphorus-doped graphene/GCEDPV0.361.5–120[60]
PGE/SWCNT/PVP/PGESWV0.381–500This work
GCE = glassy carbon electrode; CPE = carbon paste electrode; PGE = pencil graphite electrode; GO = graphene oxide; MWCNT = multi-walled carbon nanotube; SWCNT = single-walled carbon nanotube; SWV = square-wave voltammetry; DPV = differential pulse voltammetry; CA = chronoamperometry.
Table 3. Determination of paracetamol in commercial syrup and tablet with PVP/SWCNT/PGE.
SamplePrepared Concentration
(μM)
Added 1
(μM)
Found
(μM)
Recovery
(%)
RSD 2
(%)
Paracetamol syrup49.62-50.14101.591.45
(50 mg/mL)49.621563.4598.192.02
49.623081.02101.761.53
Paracetamol tablet50.62-51.73102.192.94
(250 mg/tablet)50.621567.24102.471.83
50.623081.23100.761.71
1 Standard addition method. 2 Relative standard deviation for three measurements.
Publisher’s Note: MDPI stays neutral with regard to jurisdictional claims in published maps and institutional affiliations.

