Article

Ultrathin PANI-Decorated, Highly Purified and Well Dispersed Array Cncs for Highly Sensitive HCHO Sensors

1
NEST Lab, Department of Physics, College of Science, Shanghai University, Shanghai 200444, China
2
NEST Lab, Department of Chemistry, College of Science, Shanghai University, Shanghai 200444, China
3
State Key Laboratory of Coal Conversion, Institute of Coal Chemistry, Chinese Academy of Sciences, Taiyuan 030001, China
4
School of Materials Science and Engineering, Chongqing University, Chongqing 400044, China
*
Author to whom correspondence should be addressed.
These authors contribute equally to this work.
Submission received: 23 August 2021 / Revised: 18 September 2021 / Accepted: 20 September 2021 / Published: 28 September 2021
(This article belongs to the Special Issue Recent Developments in Electrochemical Sensing)

Abstract

:
The flocculation of small surficial groups on pristine CNCs (carbon nanocoils) bundles limit their application. In this study, we designed and fabricated novel array CNCs with a surficial decoration of polyaniline (PANI) using in situ methods. Atomic layer deposition (ALD) and chemical vapor deposition (CVD) methods were employed to fabricate the highly pure array CNCs. The array CNCs decorated with ultra-thin PANI were confirmed by different characterizations. Furthermore, this material displayed a good performance in its detection of formaldehyde. The detection results showed that the CNCs coated with PANI had a low limit of detection of HCHO, as low as 500 ppb, and the sensor also showed good selectivity for other interfering gases, as well as good repeatability over many tests. Furthermore, after increasing the PANI loading on the surface of the CNCs, their detection performance exhibited a typical volcanic curve, and the value of the enthalpy was extracted by using the temperature-varying micro-gravimetric method during the process of detection of the formaldehyde molecules on the CNCs. The use of array CNCs with surficial decoration offers a novel method for the application of CNCs and could be extended to other applications, such as catalysts and energy conversion.

1. Introduction

As an important carbon material, carbon nanocoils (CNCs) have attracted increasing attention in the study of catalysis templates, wave-absorption and energy conversion-storage due to their unique geometrical and mechanical elegance, light weight, good stability, and electrical properties [1,2,3,4]. For example, carbon nanocoils have exhibited their application potential in terms of the advantages they offer in the design of electromagnetic wave absorbers, flat-panel displays, and catalysis templates [5]. Given the advantages of CNCs, it is interesting to further explore their application in sensors for environmental monitoring. However, there are few studies about their application in gas sensors. Quartz crystal microbalance (QCM), which offers advantages such as high sensitivity, low working temperature, high portability and low power consumption, offers a novel direction for the application of CNCs in gas sensors [6,7].
Sensing materials with large specific surface and surficial groups, such as metal organic framework (MOF) [8], covalent organic framework (COF) [9] and Santa Barbara Amorphous-15 (SBA-15)/ordered mesoporous carbon material FDU-15 (FDU-15) [10,11] offer high QCM detection performance. However, although the CNCs have highly specific surfaces, pristine CNCs haves little surficial groups and could be flocculated into bundles, like carbon nanotubes (CNTs), through van der Waals interaction. It is interesting and important to develop highly dispersed CNCs with surficial decoration of functional groups. Efforts have been made to improve the dispersion of CNCs and to decorate surficial functional groups. The direct fabrication of CNCs on different matrices can lead to good dispersion of CNT, resulting in high mechanicity and a wide range of potential applications [12,13,14]. The surficial decoration of polymers has been widely applied in the form of active gas materials due to its high sensitivity, low working temperature and unique physicochemical properties [15,16,17,18,19,20].
Formaldehyde (HCHO) is widely used in the chemical industry because it is an economical chemical. However, formaldehyde as gaseous pollution from indoor decoration and industrial production, described as a carcinogen by the US National Toxicology Program, is harmful and toxic to human beings [21,22,23,24]. Different methods, including gas/liquid chromatography (GC/LC), colorimetric analysis and mass spectrometry (MS) have been developed to mitigate this. However, these methods are always time-consuming and costly [21,22].
Efforts have been made by researchers to develop portable, sensitive and selective sensors. Functional materials applied as QCM sensors offer a novel direction for the detection of formaldehyde. The reactions between –NH2 and R2CO are always used in the design of formaldehyde-sensing materials [25,26,27]. Polyaniline (PANI) has been widely studied and successfully applied in the surficial decoration of gas sensors (such as H2S, NH3, NO2, CO, acetone, benzene etc.) because of its easy fabrication, good environmental stability and other unique physicochemical properties [15,28,29,30,31,32,33,34,35,36]. The abundant –NH– and –NH2 groups in PANI offer active sites for the adsorption of formaldehyde. Inspired by previous studies, it is interesting to fabricate well dispersed CNCs with PANI surficial decoration for the detection of formaldehyde. Moreover, the hydrophobicity of polyimide can improve the resistance of QCM to humidity [37,38,39,40].
In this work, we employed ALD technology to deposit uniform Cu-based catalysts on graphene. Subsequently, low-temperature CVD was employed to maintain the uniformity of the sites and fabricate in situ array CNCs. The surficial decoration of PANI on the CNCs was carried out by the electrodeposition method. The novel PANI-decorated array CNCs displayed an excellent ability to detect formaldehyde. The formaldehyde sensor coated with CNCs-PANI exhibited the highest sensitivity (70 [email protected] ppm) and good selectivity. The value of the adsorbed enthalpy was extracted by an adsorption isotherm method that we have reported previously. The Action Level and TVA for formaldehyde were 0.5 and 0.75 ppm, respectively. Our sensor met the required LOD. As far as we know, these were the first CNCs to have been used as a mass-type sensing material for the detection of HCHO.

2. Experimental Method

2.1. Preparation of Cu-Based Catalysts

Firstly, grapheme was ultrasonically dispersed for thirty minutes before the ALD. Next, the 2 mL solution was dropped onto quartz wafers and dried in air. Subsequently, the Cu catalysts were deposited by ALD (Chongqing Nuotu Loc., Chongqing, China) in a hot-wall closed-chamber reactor. Bis (2,2,6,6-tetramethyl-3,5-heptanedionato) copper (III) (99%, Alfa Aesar, Shanghai, China) and ozone (O3) were used as precursors in the preparation of the Cu nanoparticles, with N2 (99.999%) as the carrier gas. O3 acts as an oxidant and enables growth over a wide temperature range, as shown in Scheme 1. The deposition temperature was 270 °C. In this work, the Cu-based catalysts with different numbers of cycles by ALD were designated Cux, where x is the number of Cu oxide ALD cycles (100, 150, 200, 400, respectively).

2.2. Synthesis of Array CNCs

After Cu-based catalysts were processed by ALD, the Cu catalysts were transferred into a tube furnace equipped with a quartz tube (60 mm × 1100 mm). The CNCs’ growth temperature was set as 250 °C, at a rate of 10 °C/min, in an H2/Ar (5%/95%) atmosphere. The CNCs’ growth time was 30 min under atmospheric pressure, as shown in Scheme 1. The obtained CNCs were transferred to the HNO3 (68 wt%) solution at 100 °C for about 2 h in order to remove the Cu catalysts. Subsequently, the CNCs were filtered and dried. Finally, the CNCs were dispersed in ethanol for further study.

2.3. Synthesis of Array PANI-CNCs

For the preparation of the PANI-CNCs, CNC was ground with several drops of N-methylpyrrolidone for 30 min, then the black slurry was printed onto the FTO and placed in a vacuum oven at 60 °C for 24 h. The obtained sample was then cooled naturally.
The PANI-CNCs were fabricated through the electrodeposition method, featuring a 100 mL mixed solution containing 100 μL of aniline monomer, and 1 M H2SO4 was used as the electrolyte. The electrochemical deposition was performed in a three-electrode-cell using FTO coated with CNT as the working electrode, a Pt foil as the counter electrode and Ag/AgCl as the reference electrode, at a constant voltage of 0.8 V for 10 min. After electrodeposition, the PANI-CNCs was washed with deionized water and ethanol for several times and dried at 60 °C for 24 h.

2.4. Characterization

The transmission electron micrographs (TEM) and high-resolution TEM (HRTEM) images for the morphologies of the materials were acquired by JEOL-2100F microscope (JEOL, Tokyo, Japan). Field emission scanning electron microscopy (FE-SEM, JSM-6700 F, JEOL, Tokyo, Japan) was also employed to observe the surface morphologies of the materials. The atomic force microscope (AFM) analysis of the samples was performed using Nanosurf Naio AFM (Nanosurf, Liestal, Switzerland).
The adsorption–desorption isotherms for the different samples were carried out by Micromeritics ASAP 2020 (Microm, San Jose, CA, USA). The XRD patterns were collected on a DX-2700 diffractometer, using a Cu Kα1 source (Haoyuan, Dandong, China). The surface area was analyzed by Micromeritics Tristar 3000 at 77 K. The X-ray photoelectron spectroscopy (XPS) data were obtained with a WSCLAB X-ray photoelectron spectroscopy system (Thermal Fisher, Agawam, MA, USA), using an Al Kα source. The attenuated total reflection spectra (ATR) data for the samples were collected on an IS10 spectrometer (Thermal Fisher, IS10, Agawam, MA, USA) with an MCT detector.

2.5. Fabrication of QCM Sensor and Sensing Performance

Piezoelectric quartz crystal QCM resonators (WestSensor Co., Chengdu, China) with silver electrodes on both sides were used as transducers. The change of QCM frequency was related to a change in the silver electrodes’ mass, and the relationship was described by Sauerbrey equation △F = −2.26 × 10⁻⁶f02 △m/A, where f0 is the fundamental resonant frequency, which depends on the nature of the QCM chip, and A is the area of the silver plates coated in quartz crystal. Apart from the invariants mentioned above, the frequency shift (ΔF) was proportional to the mass change of adsorption (Δm) in the electrode surface of the QCM.
Prior to their fabrication, the materials were dispersed in a solution of 25% ethanol and 75% ethanediol by ultrasonic agitation for 2 min. Subsequently, the suspension was dropped onto the silver electrodes of the QCM resonators, which were marked 1-PANI-CNC, 2-PANI-CNC, 3-PANI-CNC, 4-PANI-CNC sensors. Subsequently, the resonators were dried at 50 °C in a vacuum drying oven for 20 min.
The prepared QCM sensors were tested in a laboratory-made sealed chamber with different concentrations of volatile organic compounds (VOC) gas. The analyte VOCs introduced by injection were steadily obtained with a dynamic gas-mixing apparatus.
Nitrogen was used as the carrier gas because there was little difference between the oxygen and nitrogen in the air, and they did not have a special adsorption effect in this experiment. However, the nitrogen test is generally capable of obtaining a more stable baseline, so nitrogen was used in most of our tests [41]. At the start of the measurement, a nitrogen stream was flowed into the chamber until a stable baseline was obtained for the QCM sensors. Next, the analyte vapor was introduced by injection. After obtaining a stable response from the analyte, the reference N2 was re-introduced into the sampling chamber to re-establish the baseline. All the detection experiments were performed in an air-conditioned room at 25 °C.

3. Results and Discussion

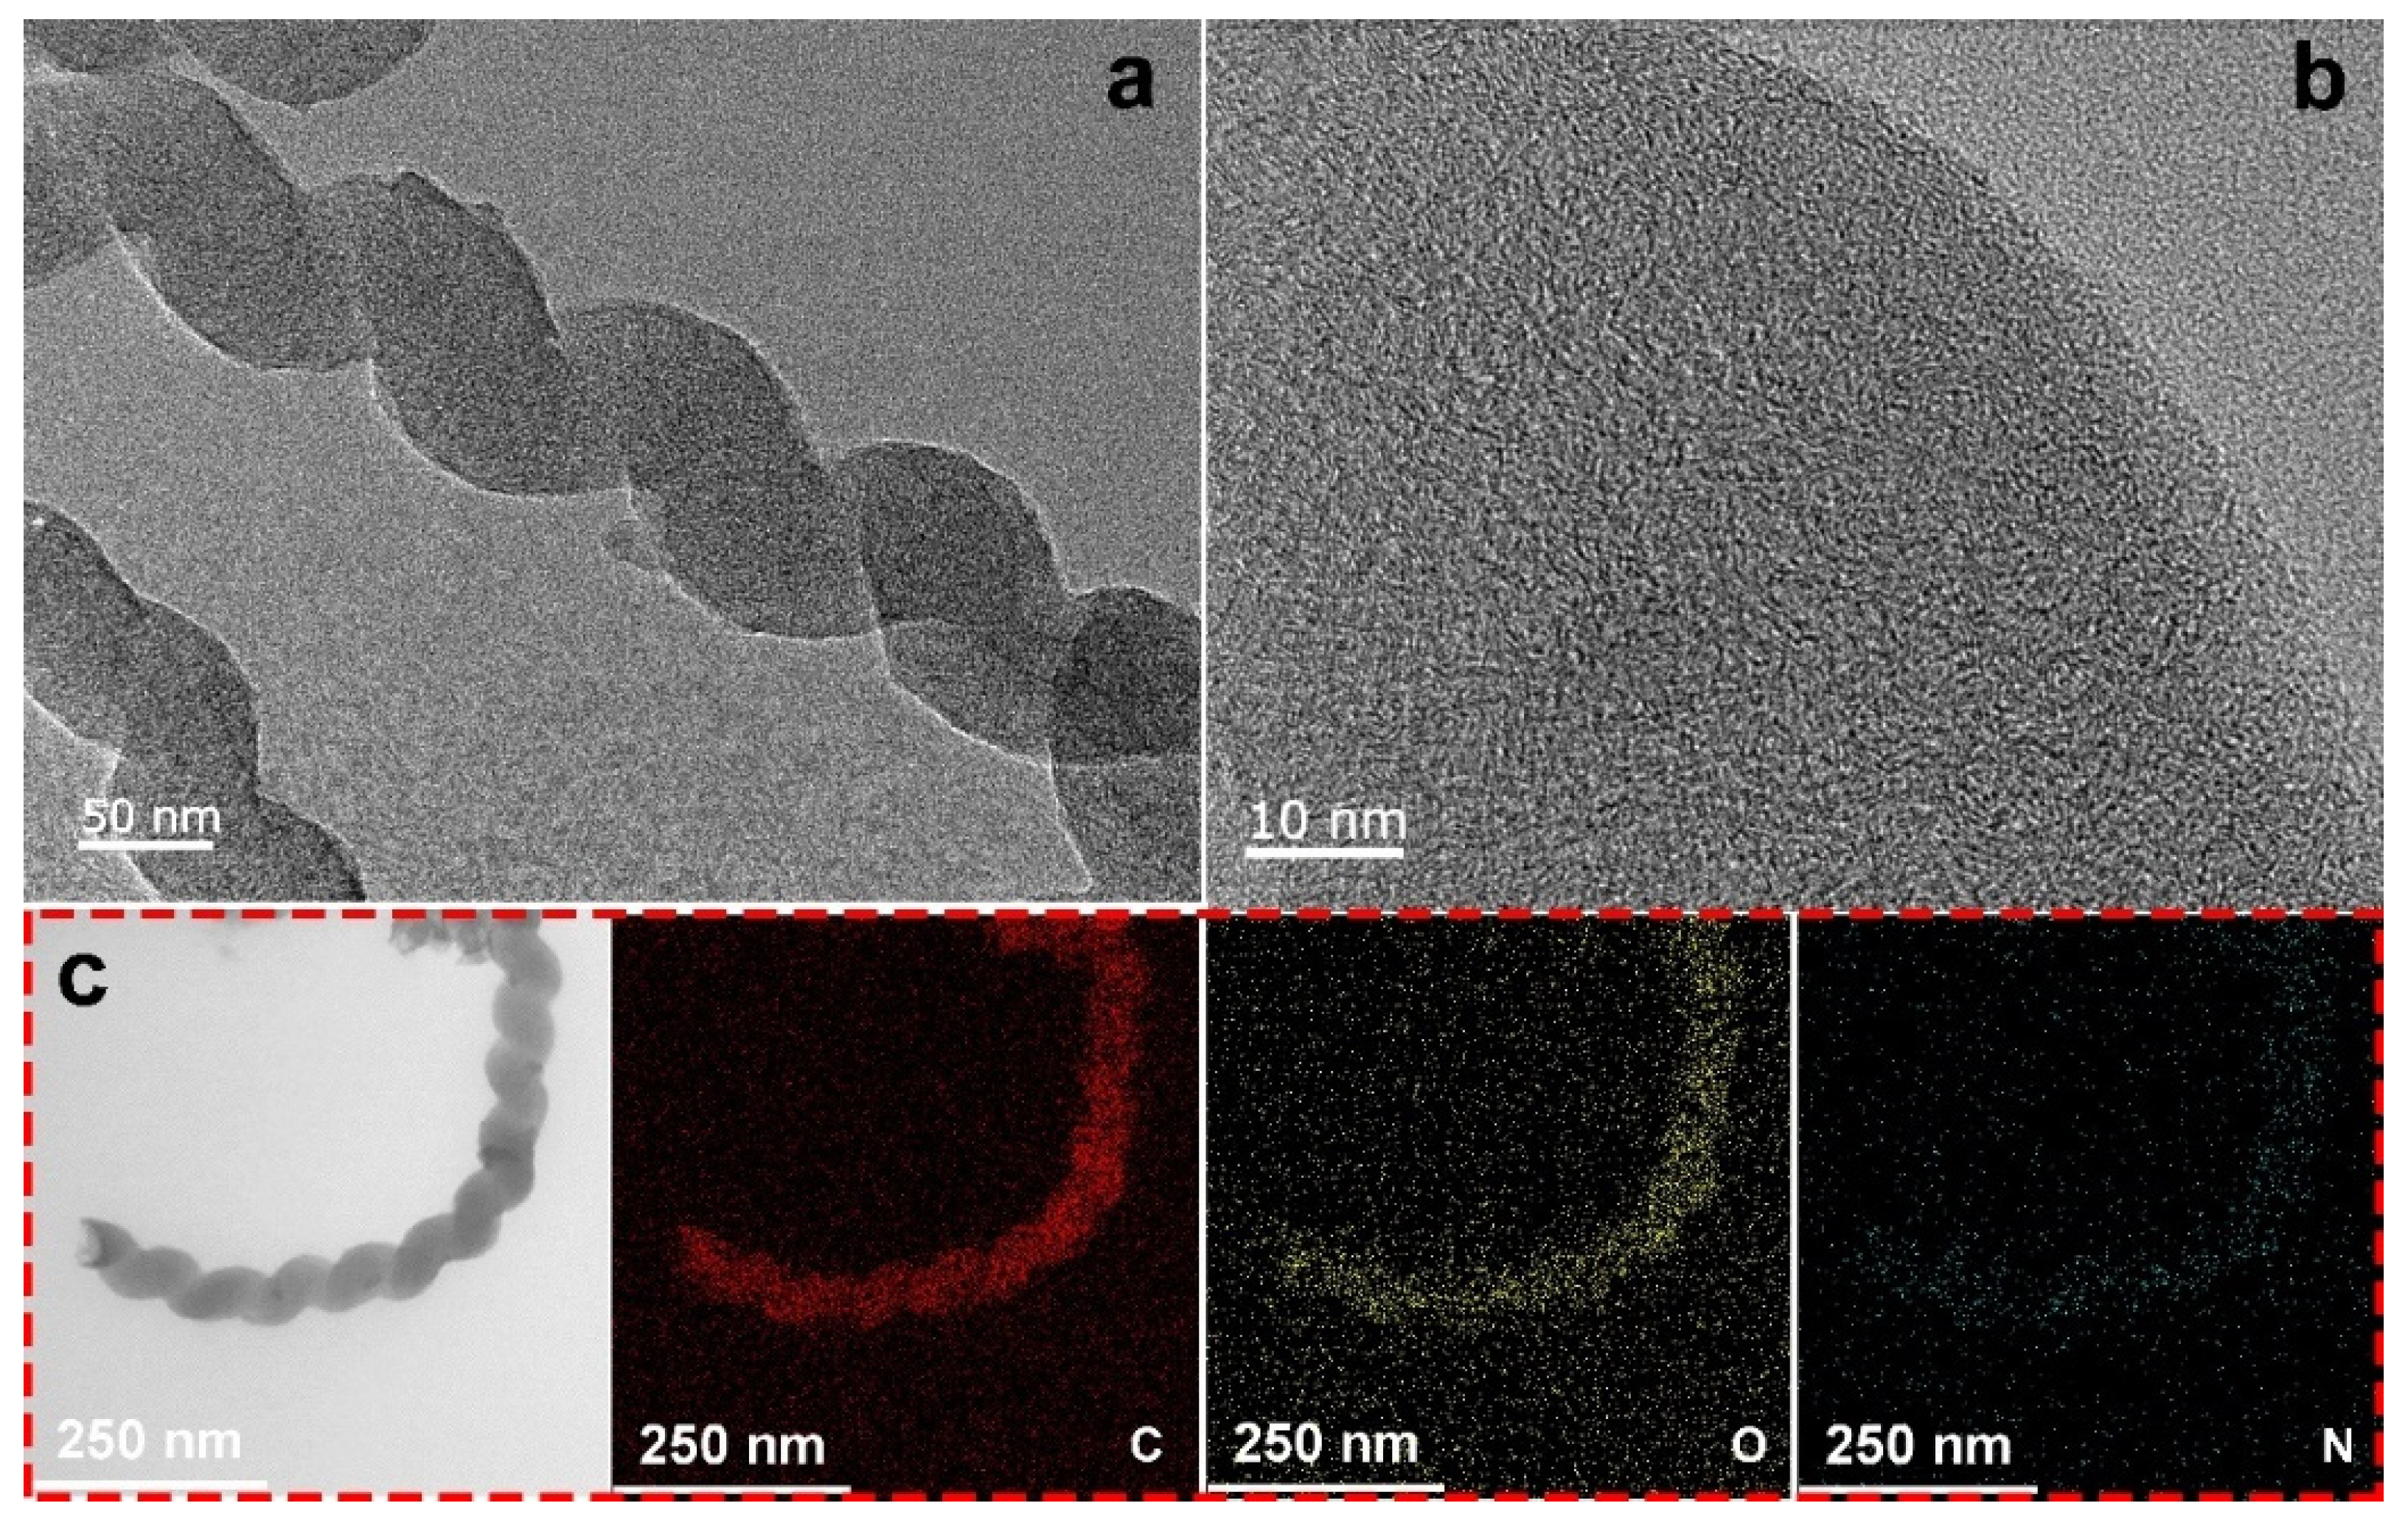
3.1. Fabrication and Characterization of Array CNCs

The reducibility of Cu-based catalysts was analyzed by temperature-programmed reduction (TPR), as shown in Figure 1. There was a strong peak at 245 °C which could have resulted from the reduction of CuO [42]. Therefore, the Cu-based catalyst could have reduced at 250 °C in the H2/Ar atmosphere during the CNCs’ fabrication. The growth of the CNCs could be attributed to the Cu0 or the Cu+. The Cu+ could be attributed to the active species for the growth of CNCs because the Cu+ will have been further reduced to Cu0 by the hydrogen reduction resulting from the acetylene’s decomposition at the high temperature [2].
The morphologies of the Cu-based catalysts after reduction at 250 °C were also characterized by the SEM. As shown in Figure 2, the decorated Cu particles were deposited uniformly on the graphene. The Cu nanoparticles were about 50 nm in diameter for the Cu200 catalysts. Furthermore, the diameter of the Cu nanoparticles increased with the increase of the ALD Cu cycles. After 200 cycles of ALD Cu, the Cu nanoparticles increased in number instead of diameter. After further ALD Cu cycles, the diameter of the Cu nanoparticles increased. Furthermore, the nanoparticles maintained their uniform dispersion after 400 ALD cycles. The Cu800 catalysts displayed a non-homogenous dispersion. This could be attributed to the high content of the Cu catalysts and the agglomeration of the Cu nanoparticles. The uniformly deposited Cu catalysts lead to the well dispersed growth of the CNCs.
The AFM was employed to further confirm the morphology of the Cu200 catalyst. The bright spots in the images in Figure 3 were ascribed to the Cu nanoparticles. The AFM results confirmed that the Cu nanoparticles (<80 nm) were uniformly deposited on the graphene. This was consistent with the SEM results shown in Figure 2, and further confirmed the uniform deposition of Cu nanoparticles.
The morphologies of CNCs were characterized by SEM, as shown in Figure 4. As the ALD Cu cycles increased, the products of the fibers and the CNCs transformed into purified CNCs, and then back into fibers and CNCs. The application of the Cu100 catalyst lead to a mixture of long fibers and, soon afterwards y, CNCs, as revealed by the SEM images (Figure 4a,c). For the Cu400 catalysts, there were long fibers and CNCs on the graphene. By contrast, the highly pure CNCs were fabricated by Cu200 catalysts, as straight fibers were rarely shown on the SEM images, as shown in Figure 4b,d. The CNCs fabricated by Cu200 exhibited uniform coil diameters, demonstrating the uniformity of the Cu200 catalyst and stable growth during the CVD. Most importantly of all, the highly pure CNCs fabricated by Cu200 lead to a nearly upright array on the graphene instead of the array lying on the graphene, as shown by the fibers fabricated by Cu100 and Cu400, which allowed the quick adsorption and desorption of the gas.
The N2 adsorption–desorption isotherms of the CNCs before carbonization, the CNCs, and the 3-PANI-CNCs are shown in Figure 5. They exhibited typical type IV-shaped isotherms for CNC-based samples, according to the International Union of Pure and Applied Chemistry (IUPAC)’s classification. These were attributed to the physical adsorption of N2 on the CNCs with nonporous nanotube walls. The Brunauer-Emmett-Teller (BET) model was employed for the analysis of the surface areas. The BET surface areas were calculated to be 104.8, 248.4 and 312.3 m2g−1 for the CNCs before carbonization, the CNCs and the 3-PANI-CNCs, respectively. After the decoration of the PANI, the BET surface area of the 3-PANI-CNCs increased compared with that of the CNCs. This was attributed to the mesoporous structure of the ultra-thin layer of the PANI.

3.2. Confirmation of Surficial Decoration of PANI on Array CNCs

TEM was employed to further investigate the morphology of these CNCs and the decoration of the PANI on the CNCs’ surfaces. As shown in Figure 6, the morphology of the CNCs with a diameter of 50–80 nm was consistent with the SEM results. From the HRTEM image, as shown in Figure 6b, there was no obvious lattice fringe. This could be attributed to the low degree of crystallinity of the CNCs or the amorphous CNCs. As shown in Figure 6c, the HAADF-STEM and EDX (energy-dispersive X-ray spectroscopy, JEOL-2100F microscope, JEOL, Tokyo, Japan) mapping were employed to confirm the decoration of the PANI on the CNCs surface. It was clear that the distribution of the N element was uniform on the surface of the CNCs, confirming the successful decoration of the PANI on the CNCs’ surfaces. The N maintained the morphology of the pristine CNCs. The pale distribution of the N elements belonged to the ultra-thin layer of the PANI.
Further confirmation of the decoration of the PANI layer on the CNCs was obtained through the performance of X-ray photoelectron spectra (XPS) to. As shown in Figure 7, the XPS spectra revealed that there were N, C and O on the surface of the 3-PANI-CNCs. The XPS results indicated the successful decoration of the PANI on the surface of the CNCs. As shown in the surface elements analysis spectrum, there were three peaks for O1s, N1s and C1s. There was no Cu peak in the surface elements analysis spectrum, revealing the successful coating of the PANI and the complete removal of the catalysts.
The ATR-IR spectra for the bare CNCs and the 3-PANI-CNCs are shown in Figure 8. There were no obvious peaks on the bare CNCs spectrum. There were peaks on the 3-PANI-CNCs spectrum. The peaks at 1486, 1415, 1304, 1213, 1160 and 822 cm−1 were the characteristic peaks of the PANI. The peak centered at 1486 and 1411 cm−1 was attributed to the stretching of the C=C group in the benzenoid or quinoid ring. The peaks located at 1304 cm−1 and 1213 cm−1 were attributed to the stretching of the C–N group on the secondary aromatic amines [43]. The broad peak located at 1160 cm−1 was attributed to the stretching of N=Q=N (where Q means the quinone-type rings), which is a characteristic peak of the “electronic-like band”. The peak at 822 was attributed to the stretching of the C–H in the benzenoid ring. The presence of the N=Q group and the C–N group offered active sites for the adsorption of the formaldehyde because of the preferred adsorption of R2CO and the Schiff-base reaction between the R2CO and the N=Q C–N groups [25,44].
Further confirmation of the crystal structure of the coating of the CNC and PANI-CNC samples was obtained through XRD. As shown in Figure 9, there were two broad peaks in the CNCs’ XRD curves, which was caused by the amorphous structure of the CNCs. The XRD results of the CNCs further verified the HRTEM results. For the 3-PANI-CNC, there were new peaks located at about 12° and 25°, which were attributed to (001) and (002) of the graphitized prism-shaped hollow carbon [43]. This confirmed that with the deposition of PANI, the 3-PANI-CNCs’ surfaces increased as the new graphitized prism-shaped hollow carbon emerged.
The ATR-IR further proved the deposition of the PANI on the CNCs, which was consistent with the EDS mapping and XPS results. Furthermore, the functional group of the C–N group confirmed by IR could be the active sites for the adsorption of the HCHO. The XRD further confirmed the graphitized crystal of the PANI.

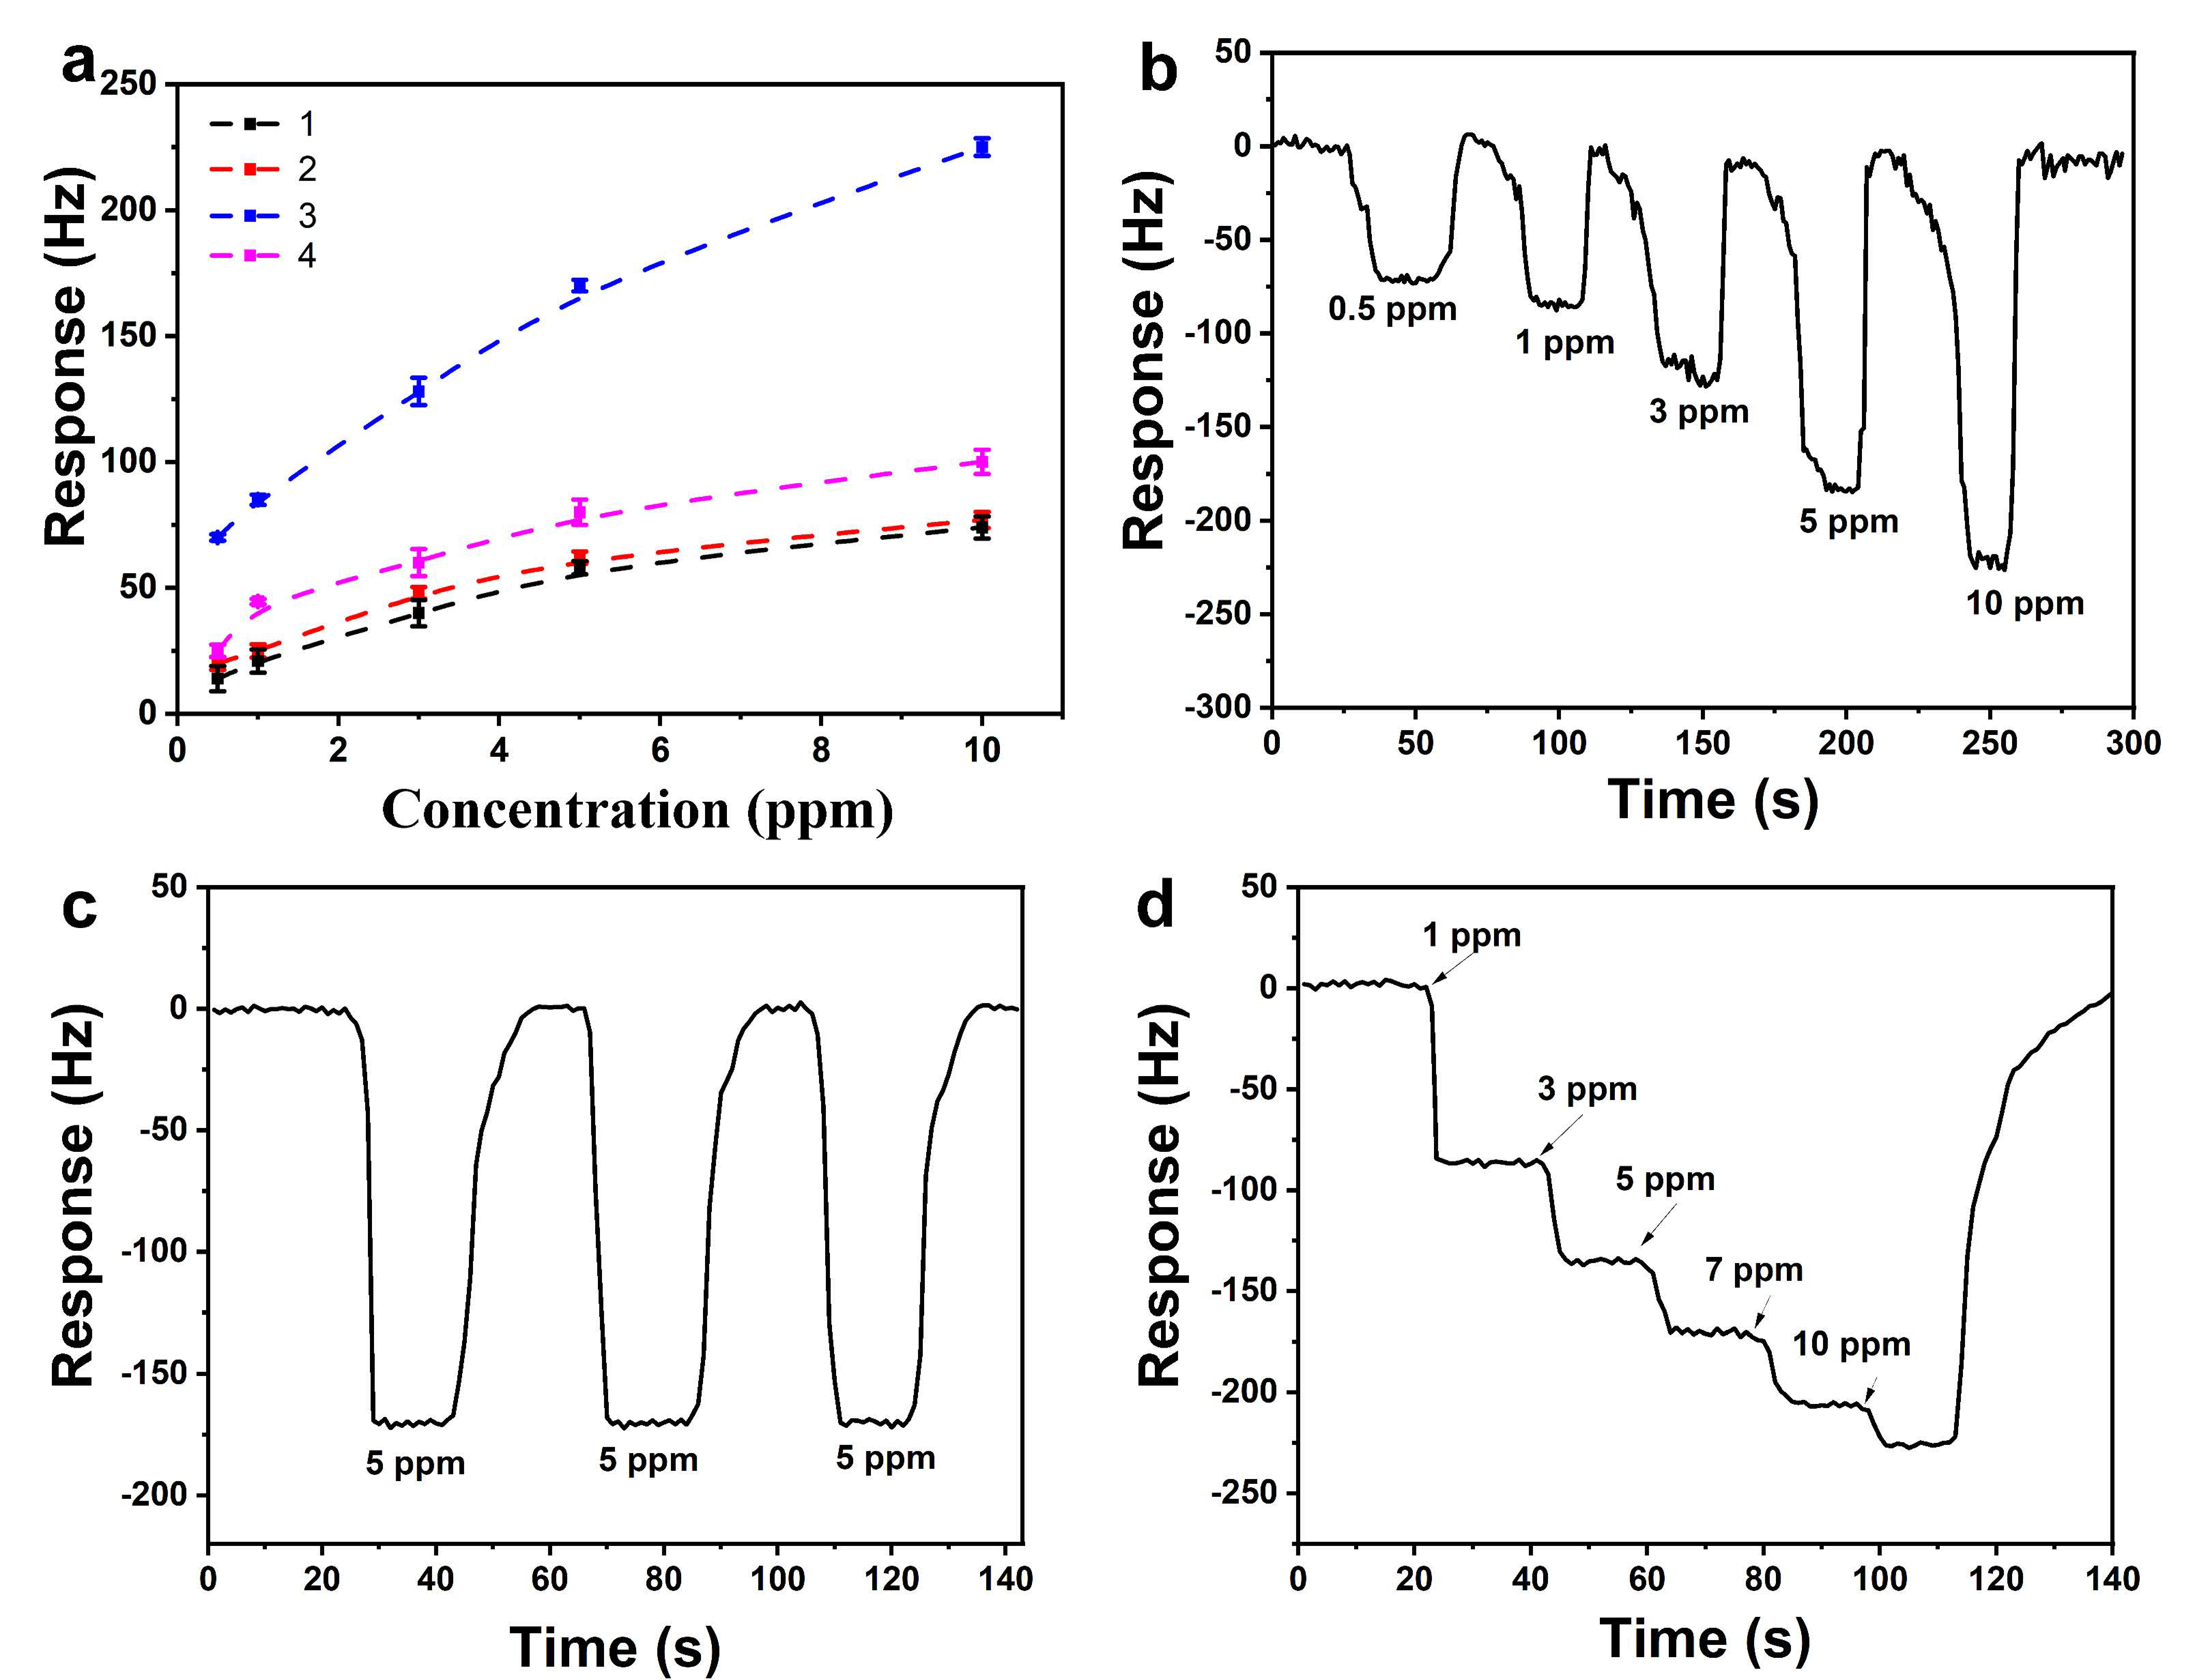
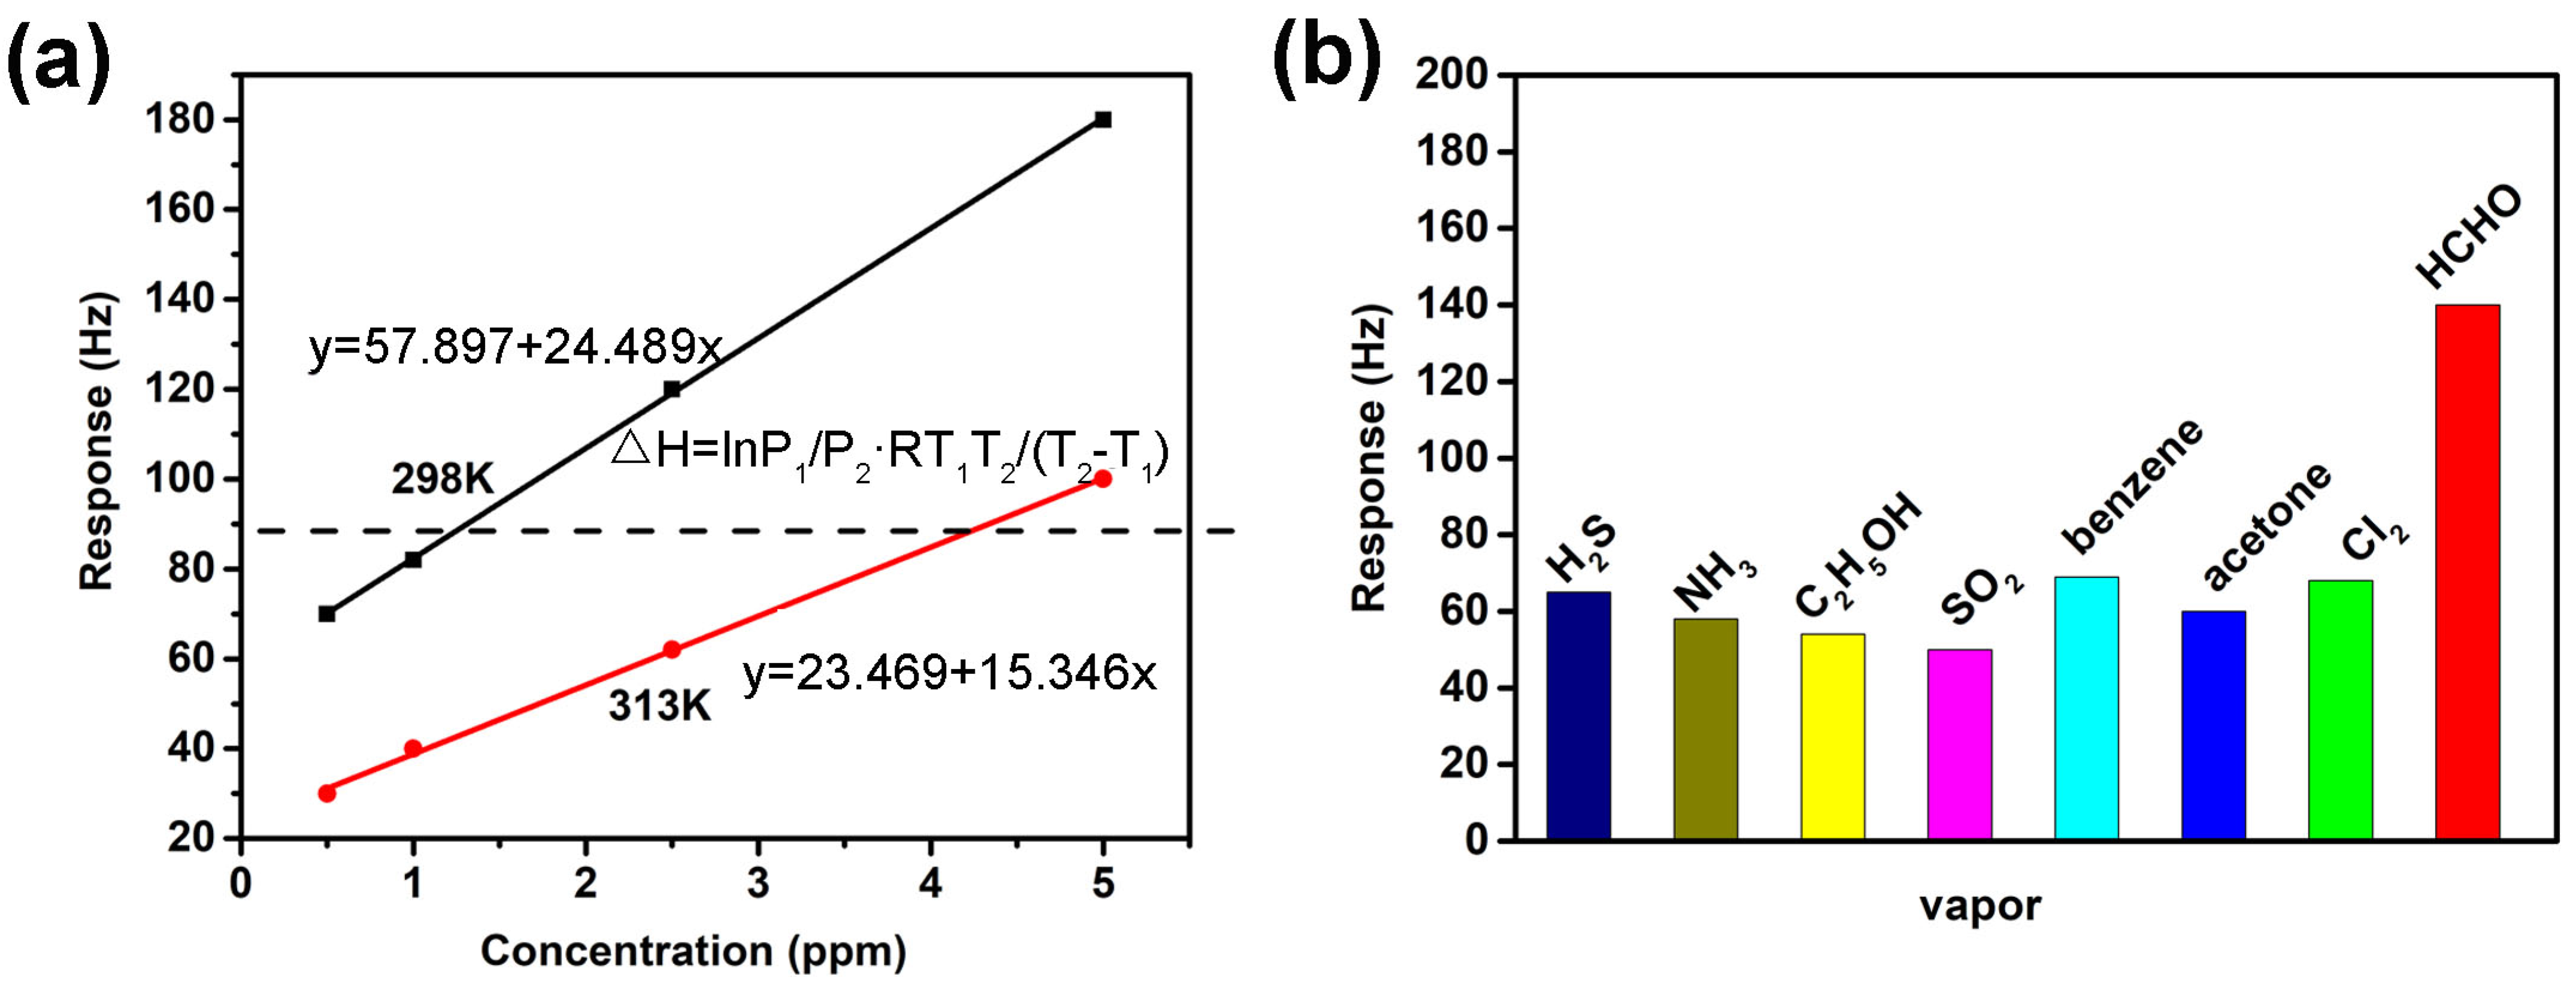
3.3. Detection Performance of Array PANI-CNC-Based QCM Sensors

It is well known that there is a special interaction between the amino group and the formaldehyde molecule. Therefore, the QCM sensors coated with polyaniline were employed to investigate its response to formaldehyde.
From Figure 10a, it can be seen that the 3-PANI-CNC samples had a higher response to the formaldehyde compared with the other three samples at the different concentrations. The reason for this result is that, on the one hand, the amino loading on the surface of the four carbon helical structures gradually increased, which was conducive to the improvement of gas-sensing performance. On the other hand, the greater polyaniline loading lead to a decrease in specific surface area and pore size, which is a critical factor for gas response. Under the influence of these two aspects, the gas sensitivity of the four samples finally showed a volcanic change. Comparing the samples of 1-PANI-CNC, 2-PANI-CNC and 4-PANI-CNC, it can be clearly seen that the response value of the 4-PANI-CNC was greater than those of the 1-PANI-CNC and the 2-PANI-CNC due to the increase in amino loading.
Figure 10b exhibits the response curve of the 3-PANI-CNC to formaldehyde at various concentrations. It is obvious that the frequency shift of the 3-PANI-CNC sample changed more and more with the increase of the gas concentration form 0.5 ppm to 10 ppm. When the gas concentration was 0.5 ppm, the response value was about 75 Hz, and the signal-to-noise ratio was larger than 5 in this experiment; therefore, the logical limit of detection (LOD) of the PANI-CNC-modified QCM sensor for HCHO was 260 ppb. This was calculated by using the calibration curve (y = 57.897x + 24.489, R2 = 0.99978) with data from Figure 4b, through the equation: LOD = 3σ/S. The square of R represents the correlation of the fitted straight line, and the value 0.9998 proves that the fitting of the straight line was reliable. The error variance of the baseline was less than 5; here, we used the maximum value of 5, so the logical limit of detection of this sensor can be inferred as 260 ppb. In addition, the response/recovery time of the QCM sensor was also satisfied. Based on the results in Figure 10a, the response time was about 12 s and then reached an equilibrium state of adsorption and desorption. When the formaldehyde vapor was blown away, the desorption of formaldehyde vapor was very quick and there was little drift in the baseline during continuous testing.
Another key factor is the repeatability of the QCM sensor. As shown in Figure 10c, the sensor was tested three times for its ability to detect 5 ppm formaldehyde. The differences between the response values across the three tests was less than 5 Hz, which reflected the good repeatability of the sensor.
Figure 10d is a successive response curve of the 3-PANI-CNC samples to 1–10 ppm formaldehyde. With the continuous increase of the gas concentration, the response value also gradually increased, however, the frequency shift caused by the increase of the same concentration (2 ppm) became smaller and smaller. This result meant that the sensitivity of the material decreased as the amount of adsorption increased. This was consistent with the Langmuir sorption theory. The results could be attributed to the decrease of the PANI surficial active sites. Furthermore, the 3-PANI-CNC showed a high level of long-term stability: after three months of testing, the error range did not exceed 8 Hz, as shown in Figure S1.
Compared with previous research into formaldehyde gas sensors (Table 1), this QCM sensor not only showed a satisfactory response and recovery speed, but also high sensitivity. The high detection performance of the PANI-CNCs was attributed to the array CNC, which was beneficial for the diffusion and the ultra-thin decoration of the PANI offering the active sites. Considering the sensitivity and stability of the HCHO sensor, it is more reliable to use this sensor when the sensitivity requirement is not particularly high.
It is known that the enthalpy of adsorption (ΔH) is a key parameter in adsorption-induced mass-type detection; according to classical physical-chemical adsorption theories, weak reversible physical adsorption without selectivity occurs when the ΔH value is greater than −40 kJ/mol but less than 0 kJ/mol. Irreversible chemistry reactions occur when the value of ΔH is less than −80 kJ/mol [51]. If selectivity and reversibility are considered carefully, reversible chemical adsorption is ideal for meeting the needs of the gas sensor when the value of ΔH is in the range of −80 kJ/mol to −40 kJ/mol. Therefore, we used a temperature-varying micro-gravimetric method to extract the ΔH. Combined with Figure 10b,d, two adsorption isotherms were fitted; they are shown in Figure 11a. The ΔH was calculated to be −64.76 kJ/mol, according to the Clausius–Clapeyron equation. The moderate ΔH indicated a reversible Schiff base addition reaction and an –NH2 functional group of PANI.
Besides sensitivity, response/recovery time, and repeatability, selectivity for target molecules (i.e., cross-sensitivity) is also a critical parameter of sensors. Herein, seven different gases were used to evaluate the selectivity of the HCHO sensor. As shown in Figure 11b, the 3-PANI-CNC sensor displayed the highest response to the HCHO, of up to 140 Hz@3 ppm; with the responses of the other interfering gases were all lower than 70 Hz at the same concentration. The negligible interfering signals of these other gases may be ascribed to the inevitable physical/nonspecific adsorption.

3.4. Discussion

Based on the results, the successful decoration of the ultra-thin PANI layer was confirmed. The PANI-CNC sensors’ sensitivity to formaldehyde increased at first and then decreased along with the increasing of the PANI layer. The reason for the increase in the sensor’s performance was attributed to the gradually increase of the amino loading on the surface of the four carbon helical structures, which was conducive to the improvement of the gas sensor’s performance. The reason for this increase in detection performance was a decrease in the specific surface area and pore size, which is a critical factor for gas response, along with a further increase in polyaniline loading.
The high response/recovery performance was attributed to the fact that the formaldehyde molecules quickly diffused in the array PANI-CNCs. Moreover, the helical PANI-CNCs reinforced the Knudsen diffusion, which increased the probability between the formaldehyde molecules and the PANI layer, which in turn lead to the high response and low detection limits. As shown in Figure 12, the –NH– group and the –NH2 group acted as active sites in the Schiff-base reaction and caused the formaldehyde molecules to be absorbed on the surface of the PANI-CNCs. Both the quick diffusion of the formaldehyde molecules between the array PANI-CNCs and the Schiff-base reaction between the –NHx (–NH– and –NH2) and the formaldehyde molecules lead to a good detection performance.

4. Conclusions

In summary, we fabricated highly purified array CNCs through the optimization of ALD Cu-based catalysts. The ultra-thin PANI layer was decorated on the surfaces of the CNCs through electrodeposition. The element mapping, XPS, ATR-IR and XRD results confirmed the successful decoration of the ultra-thin layer of the PANI on the CNCs. The array PANI-CNC showed a high HCHO detection performance. The detection limit of the sensor for formaldehyde was lower than 500 ppb. The thermodynamic experiments indicated that CNCs-PANI material is suitable for formaldehyde detection due to the moderate value of adsorption ΔH (−64.76 kJ/mol). The good detection performance was attributed to the reversible Schiff base reaction between the –NH– group and the HCHO. The high response/recovery performance was due to the array-distributed CNC. This study offers a novel direction for the design and application of CNCs in gas detection, which demonstrate good selectivity, sensitivity and repeatability with formaldehyde. Furthermore, the surficial decoration of ultra-thin PANI on nanomaterial also offers a novel strategy for the functional decoration of materials in order to increase the adsorption of target gas.

Supplementary Materials

The following are available online at https://0-www-mdpi-com.brum.beds.ac.uk/article/10.3390/chemosensors9100276/s1. Figure S1: The long-term stability of the 3-PANI-CNC sensor.

Author Contributions

Conceptualization and data curation, Q.H., Z.M. and J.Y.; methodology, T.G., Y.W., Z.D. and X.L.; writing—original draft preparation, Q.H., Z.M.; writing—review, editing and supervision, W.Z., S.Z. and J.X. All authors have read and agreed to the published version of the manuscript.

Funding

This work was supported by the Shanghai Natural Science Foundation (19ZR1418900) and the Key Basic Research Program of the Science and Technology Commission of Shanghai Municipality (20JC1415300). We also gratefully appreciate the financial support from China Scholarship Council (CSC).

Institutional Review Board Statement

Not applicable.

Informed Consent Statement

Not applicable.

Data Availability Statement

The data presented in this study are available on request from the corresponding author.

Conflicts of Interest

The authors declare no conflict of interest.

References

  1. Wang, G.; Gao, Z.; Tang, S.; Chen, C.; Duan, F.; Zhao, S.; Lin, S.; Feng, Y.; Zhou, L.; Qin, Y. Microwave Absorption Properties of Carbon Nanocoils Coated with Highly Controlled Magnetic Materials by Atomic Layer Deposition. ACS Nano 2012, 6, 11009–11017. [Google Scholar] [CrossRef] [PubMed]
  2. Wang, G.; Ran, G.; Wan, G.; Yang, P.; Gao, Z.; Lin, S.; Fu, C.; Qin, Y. Size-Selective Catalytic Growth of Nearly 100% Pure Carbon Nanocoils with Copper Nanoparticles Produced by Atomic Layer Deposition. ACS Nano 2014, 8, 5330–5338. [Google Scholar] [CrossRef] [PubMed]
  3. Ge, H.; Zhang, B.; Gu, X.; Liang, H.; Yang, H.; Gao, Z.; Wang, J.; Qin, Y. A Tandem Catalyst with Multiple Metal Oxide Interfaces Produced by Atomic Layer Deposition. Angew. Chem. 2016, 55, 7081–7085. [Google Scholar] [CrossRef] [PubMed]
  4. Gao, Z.; Dong, M.; Wang, G.; Sheng, P.; Wu, Z.; Yang, H.; Zhang, B.; Wang, G.; Wang, J.; Qin, Y. Multiply Confined Nickel Nanocatalysts Produced by Atomic Layer Deposition for Hydrogenation Reactions. Angew. Chem. 2015, 54, 9006–9010. [Google Scholar] [CrossRef] [PubMed]
  5. Gao, Z.; Qin, Y. Design and Properties of Confined Nanocatalysts by Atomic Layer Deposition. Acc. Chem. Res. 2017, 50, 2309–2316. [Google Scholar] [CrossRef] [PubMed]
  6. Wang, L.; Zhu, Y.; Xiang, Q.; Cheng, Z.; Chen, Y.; Xu, J. One novel humidity-resistance formaldehyde molecular probe based hydrophobic diphenyl sulfone urea dry-gel: Synthesis, sensing performance and mechanism. Sens. Actuators B Chem. 2017, 251, 590–600. [Google Scholar] [CrossRef]
  7. Wang, L.; Wang, Z.; Xiang, Q.; Chen, Y.; Duan, Z.; Xu, J. High Performance Formaldehyde Detection Based on a Novel Copper (II) Complex Functionalized QCM Gas Sensor. Sens. Actuators B Chem. 2017, 248, 820–828. [Google Scholar] [CrossRef]
  8. Wang, L. Metal-organic frameworks for QCM-based gas sensors: A review. Sens. Actuators A Phys. 2020, 307, 111984. [Google Scholar] [CrossRef]
  9. Zhang, S.; Yang, Q.; Xu, X.; Liu, X.; Li, Q.; Guo, J.; Torad, N.L.; Alshehri, S.M.; Ahamad, T.; Hossain, M.S.A.; et al. Assembling Well-Arranged Covalent Organic Frameworks on MOF-Derived Graphitic Carbon for Remarkable for-Maldehyde Sensing. Nanoscale 2020, 12, 15611–15619. [Google Scholar] [CrossRef]
  10. Znamenskaya, Y.; Björklund, S.; Kocherbitov, V.; Alfredsson, V. Effect of Hydration and Dehydration on the Properties of SBA-15 Layer Studied by Humidity Scanning QCM-D. Microporous Mesoporous Mater. 2016, 230, 58–65. [Google Scholar] [CrossRef]
  11. Lou, H.; Shen, C.; Xiang, Q.; Xu, J.; Lou, T. FDU-12 Mesoporous Materials Detection Hg (II) Ions by QCM. Nano 2016, 11, 1650094. [Google Scholar] [CrossRef]
  12. Zhang, Q.; Zhao, M.; Liu, Y.; Cao, A.; Qian, W.; Lu, Y.; Wei, F. Energy-Absorbing Hybrid Composites Based on Alternate Car-Bon-Nanotube and Inorganic Layers. Adv. Mater. 2009, 21, 2876–2880. [Google Scholar] [CrossRef]
  13. Zhao, M.-Q.; Zhang, Q.; Jia, X.-L.; Huang, J.-Q.; Zhang, Y.-H.; Wei, F. Hierarchical Composites of Single/Double-Walled Carbon Nanotubes Interlinked Flakes from Direct Carbon Deposition on Layered Double Hydroxides. Adv. Funct. Mater. 2010, 20, 677–685. [Google Scholar] [CrossRef]
  14. Lv, R.; Cui, T.; Jun, M.-S.; Zhang, Q.; Cao, A.; Su, D.S.; Zhang, Z.; Yoon, S.-H.; Miyawaki, J.; Mochida, I.; et al. Open-Ended, N-Doped Carbon Nanotube-Graphene Hybrid Nanostructures as High-Performance Catalyst Support. Adv. Funct. Mater. 2011, 21, 999–1006. [Google Scholar] [CrossRef]
  15. Fratoddi, I.; Venditti, I.; Cametti, C.; Russo, M.V. Chemiresistive polyaniline-based gas sensors: A mini review. Sens. Actuators B Chem. 2015, 220, 534–548. [Google Scholar] [CrossRef]
  16. Choi, H.H.; Lee, J.; Dong, K.-Y.; Ju, B.-K.; Lee, W. Gas Sensing Performance of Composite Materials Using Conducting Polymer/Single-Walled Carbon Nanotubes. Macromol. Res. 2012, 20, 143–146. [Google Scholar] [CrossRef]
  17. Wu, Z.; Chen, X.; Zhu, S.; Zhou, Z.; Yao, Y.; Quan, W.; Liu, B. Enhanced Sensitivity of Ammonia Sensor Using Graphene/Polyaniline Nanocomposite. Sens. Actuators B Chem. 2013, 178, 485–493. [Google Scholar] [CrossRef]
  18. Yang, M.; He, J. Graphene Oxide as Quartz Crystal Microbalance Sensing Layers for Detection of Formaldehyde. Sens. Actuators B Chem. 2016, 228, 486–490. [Google Scholar] [CrossRef]
  19. Wang, Z.; Peng, X.; Huang, C.; Chen, X.; Dai, W.; Fu, X. CO Gas Sensitivity and Its Oxidation Over TiO2 Modified by PANI under UV Irradiation at Room Temperature. Appl. Catal. B Environ. 2017, 219, 379–390. [Google Scholar] [CrossRef]
  20. Tanrıverdi, E.E.; Uzumcu, A.T.; Kavas, H.; Demir, A.; Baykal, A. Conductivity Study of Polyaniline-Cobalt Ferrite (PANI-CoFe2O4) Nanocomposite. Nano-Micro Lett. 2011, 3, 99–107. [Google Scholar] [CrossRef] [Green Version]
  21. Im, D.; Kim, D.; Jeong, D.; Park, W.I.; Chun, M.; Park, J.-S.; Kim, H.; Jung, H. Improved Formaldehyde Gas Sensing Properties of Well-Controlled Au Nanoparticle-Decorated In2O3 Nanofibers Integrated on Low Power MEMS platform. J. Mater. Sci. Technol. 2019, 38, 56–63. [Google Scholar] [CrossRef]
  22. Yan, D.; Xu, P.; Xiang, Q.; Mou, H.; Xu, J.; Wen, W.; Li, X.; Zhang, Y. Polydopamine Nanotubes: Bio-Inspired Synthesis, Formaldehyde Sensing Properties and Thermodynamic Investigation. J. Mater. Chem. A 2016, 4, 3487–3493. [Google Scholar] [CrossRef]
  23. Xu, L.; Ge, M.; Zhang, F.; Huang, H.; Sun, Y.; He, D. Nanostructured of SnO2/NiO Composite as a Highly Selective Formaldehyde Gas Sensor. J. Mater. Res. 2020, 35, 3079–3090. [Google Scholar] [CrossRef]
  24. Li, N.; Fan, Y.; Shi, Y.; Xiang, Q.; Wang, X.; Xu, J. A Low Temperature Formaldehyde Gas Sensor Based on Hierarchical SnO/SnO2 Nano-Flowers Assembled from Ultrathin Nanosheets: Synthesis, Sensing Performance and Mechanism. Sens. Actuators B Chem. 2019, 294, 106–115. [Google Scholar] [CrossRef]
  25. Liu, X.-Y.; Yin, X.-M.; Yang, S.-L.; Zhang, L.; Bu, R.; Gao, E.-Q. Chromic and Fluorescence-Responsive Metal–Organic Frameworks Afforded by N-Amination Modification. ACS Appl. Mater. Interfaces 2021, 13, 20380–20387. [Google Scholar] [CrossRef] [PubMed]
  26. Akbar, S.A.; Mardhiah, A.; Saidi, N.; Lelifajri, D. The Effect of Graphite Composition on Polyaniline Film Performance for Formalin Gas Sensor. Bull. Chem. Soc. Ethiop. 2021, 34, 597–604. [Google Scholar] [CrossRef]
  27. Srinives, S.; Sarkar, T.; Mulchandani, A. Primary Amine-Functionalized Polyaniline Nanothin Film Sensor for Detecting Formal-Dehyde. Sens. Actuators B Chem. 2014, 194, 255–259. [Google Scholar] [CrossRef]
  28. Lim, J.-H.; Phiboolsirichit, N.; Mubeen, S.; Deshusses, M.A.; Mulchandani, A.; Myung, N.V. Electrical and Gas Sensing Properties of Polyaniline Functionalized Single-Walled Carbon Nanotubes. Nanotechnology 2010, 21, 75502. [Google Scholar] [CrossRef] [PubMed] [Green Version]
  29. Parmar, M.; Balamurugan, C.; Lee, D.-W. PANI and Graphene/PANI Nanocomposite Films-Comparative Toluene Gas Sensing Behavior. Sensors 2013, 13, 16611–16624. [Google Scholar] [CrossRef] [PubMed]
  30. Wang, Q.; Dong, X.; Pang, Z.; Du, Y.; Xia, X.; Wei, Q.; Huang, F. Ammonia Sensing Behaviors of TiO2-PANI/PA6 Composite Nanofibers. Sensors 2012, 12, 17046–17057. [Google Scholar] [CrossRef] [Green Version]
  31. Huang, J.; Yang, T.; Kang, Y.; Wang, Y.; Wang, S. Gas Sensing Performance of Polyaniline/ZnO Organic-Inorganic Hybrids for Detecting VOCs at Low Temperature. J. Nat. Gas. Chem. 2011, 20, 515–519. [Google Scholar] [CrossRef]
  32. Kim, M.-J.; Kim, K.H.; Yang, X.; Yu, Y.; Lee, Y.-S. Improvement in NO Gas-Sensing Properties Using Heterojunctions between Polyaniline and Nitrogen on Activated Carbon Fibers. J. Ind. Eng. Chem. 2019, 76, 181–187. [Google Scholar] [CrossRef]
  33. Bai, H.; Shi, G. Gas Sensors Based on Conducting Polymers. Sensors 2007, 7, 267–307. [Google Scholar] [CrossRef] [Green Version]
  34. Reddy, K.R.; Sin, B.C.; Ryu, K.S.; Kim, J.-C.; Chung, H.; Lee, Y. Conducting Polymer Functionalized Multi-Walled Carbon Nanotubes with Noble Metal Nanoparticles: Synthesis, Morphological Characteristics and Electrical Properties. Synth. Met. 2009, 159, 595–603. [Google Scholar] [CrossRef]
  35. Bai, H.; Sheng, K.; Zhang, P.; Li, C.; Shi, G. Graphene Oxide/Conducting Polymer Composite Hydrogels. J. Mater. Chem. 2011, 21, 18653–18658. [Google Scholar] [CrossRef]
  36. Zhang, T.; Nix, M.B.; Yoo, B.-Y.; Deshusses, M.A.; Myung, N.V. Electrochemically Functionalized Single-Walled Carbon Nano-tube Gas Sensor. Electroanalysis 2006, 18, 1153–1158. [Google Scholar] [CrossRef]
  37. Zhao, Y.; Zhang, Z.; Yu, L.; Jiang, T. Hydrophobic Polystyrene/Electro-Spun Polyaniline Coatings for Corrosion Protection. Synth. Met. 2017, 234, 166–174. [Google Scholar] [CrossRef]
  38. Ding, H.; Zhu, C.; Zhou, Z.; Wan, M.; Wei, Y. Hydrophobicity of Polyaniline Microspheres Deposited on a Glass Substrate. Macromol. Rapid Commun. 2006, 27, 1029–1034. [Google Scholar] [CrossRef]
  39. Leng, W.; Zhou, S.; Gu, G.; Wu, L. Wettability Switching of SDS-Doped Polyaniline from Hydrophobic to Hydrophilic Induced by Alkaline/Reduction Reactions. J. Colloid Interface Sci. 2012, 369, 411–418. [Google Scholar] [CrossRef]
  40. Fan, H.; Wang, H.; Guo, J.; Zhao, N.; Xu, J. SDBS-Assisted Preparation of Novel Polyaniline Planar-Structure: Morphology, Mechanism and Hydrophobicity. J. Colloid Interface Sci. 2013, 414, 46–49. [Google Scholar] [CrossRef] [PubMed]
  41. Ma, Z.; Yuan, T.; Fan, Y.; Wang, L.; Duan, Z.; Du, W.; Zhang, D.; Xu, J. A Benzene Vapor Sensor Based on a Metal-Organic Framework-Modified Quartz Crystal Microbalance. Sens. Actuators B Chem. 2020, 311, 127365. [Google Scholar] [CrossRef]
  42. Luo, M.-F.; Fang, P.; He, M.; Xie, Y.-L. In Situ XRD, Raman, and TPR Studies of CuO/Al2O3 Catalysts for CO Oxidation. J. Mol. Catal. A Chem. 2005, 239, 243–248. [Google Scholar] [CrossRef]
  43. Li, X.; Yu, L.; Zhao, W.; Shi, Y.; Yu, L.; Dong, Y.; Zhu, Y.; Fu, Y.; Liu, X.; Fu, F. Prism-Shaped Hollow Carbon Decorated with Polyaniline for Microwave Absorption. Chem. Eng. J. 2020, 379, 122393. [Google Scholar] [CrossRef]
  44. Ariyageadsakul, P.; Vchirawongkwin, V.; Kritayakornupong, C. Determination of Toxic Carbonyl Species Including Acetone, Formaldehyde, and Phosgene by Polyaniline Emeraldine Gas Sensor Using DFT Calculation. Sens. Actuators B Chem. 2016, 232, 165–174. [Google Scholar] [CrossRef]
  45. Huang, W.; Wang, X.; Jia, Y.; Li, X.; Zhu, Z.; Li, Y.; Si, Y.; Ding, B.; Wang, X.; Yu, J. Highly Sensitive Formaldehyde Sensors Based on Polyvinylamine Modified Polyacrylonitrile Nanofibers. RSC Adv. 2013, 3, 22994–23000. [Google Scholar] [CrossRef]
  46. Zhang, J.; Guan, P.; Li, W.; Shi, Z.; Zhai, H. Synthesis and Characterization of a Polyaniline/Silver Nanocomposite for the Deter-Mination of Formaldehyde. Instrum. Sci. Technol. 2015, 44, 249–258. [Google Scholar] [CrossRef]
  47. Carquigny, S.; Redon, N.; Plaisance, H.; Reynaud, S. Development of a Polyaniline/Fluoral-P Chemical Sensor for Gaseous Formaldehyde Detection. IEEE Sens. J. 2011, 12, 1300–1306. [Google Scholar] [CrossRef]
  48. Zhang, L.; Li, X.; Mu, Z.; Miao, J.; Wang, K.; Zhang, R.; Chen, S. A Novel Composite of CdS Nanorods Growing on a Polyaniline-Cd2+ Particles Surface with Excellent Formaldehyde Gas Sensing Properties at Low Temperature. RSC Adv. 2018, 8, 30747–30754. [Google Scholar] [CrossRef] [Green Version]
  49. Feng, L.; Feng, L.; Li, Q.; Cui, J.; Guo, J. Sensitive Formaldehyde Detection with QCM Sensor Based on PAAm/MWCNTs and PVAm/MWCNTs. ACS Omega 2021, 6, 14004–14014. [Google Scholar] [CrossRef] [PubMed]
  50. Haghighi, E.; Zeinali, S. Formaldehyde Detection Using Quartz Crystal Microbalance (QCM) Nanosensor Coated by Nanoporous MIL-101(Cr) Film. Microporous Mesoporous Mater. 2020, 300, 110065. [Google Scholar] [CrossRef]
  51. Cao, Y.; Fan, Y.; Ma, Z.; Cheng, Z.; Xiang, Q.; Duan, Z.; Xu, J. Urea-Functionalized SBA-15 Hybrids: Post-grafting Synthesis, High-Performance Organophosphorus Sensing and Their Response Mechanism. Sens. Actuators B Chem. 2018, 273, 1162–1169. [Google Scholar] [CrossRef]
Scheme 1. Illustration for the fabrication of the PANI-CNC.
Chemosensors 09 00276 sch001
Figure 1. TPR profile for the Cu200 catalyst.
Chemosensors 09 00276 g001
Figure 2. The SEM images for different Cux catalysts after reduction.
Chemosensors 09 00276 g002
Figure 3. AFM images for the Cu200 catalysts after reduction.
Chemosensors 09 00276 g003
Figure 4. SEM images for CNCs. (a,d) CNCs synthesized by Cu100, (b,e) CNCs synthesized by Cu200, (c,f) CNCs synthesized by Cu 400.
Chemosensors 09 00276 g004
Figure 5. The BET surface of the different samples.
Chemosensors 09 00276 g005
Figure 6. (a) TEM for PANI-CNCs, (b) HRTEM images for PANI-CNCs, (c) HAADF-STEM and EDS mapping for the PANI-CNCs.
Chemosensors 09 00276 g006
Figure 7. XPS spectra for 3-PANI-CNCs. (a) N1s spectrum, (b) O1s spectrum and (c) surface elements analysis spectrum.
Chemosensors 09 00276 g007
Figure 8. ATR-IR spectra for the bare CNCs and the 3-PANI-CNCs.
Chemosensors 09 00276 g008
Figure 9. XRD Profiles for the CNC and 3-PANI-CNCs.
Chemosensors 09 00276 g009
Figure 10. (a) The frequency responses of x-PANI-CNCS (x = 1, 2, 3 and 4) with 0.5–10 ppm formaldehyde gas, (b) response of the PANI-CNC-based QCM sensors to HCHO at different concentrations in the range of 0.5–10 ppm, (c) cycling stability of PANI-CNC-based QCM to 5 ppm HCHO vapor, (d) dynamic responses of PANI-CNC-based QCM to 1–10 ppm HCHO vapor.
Chemosensors 09 00276 g010
Figure 11. (a) Based on the experimental results in Figure 10a,c, two isotherms were plotted to calculate the adsorption heat (ΔH), (b) response of PANI-CNC-based QCM to different vapors in 3 ppm (25 °C).
Chemosensors 09 00276 g011
Figure 12. The mechanism of the 3-PANI-CNCs.
Chemosensors 09 00276 g012
Table 1. Room-temperature detection properties of various sensing materials based on QCM.
MaterialTarget GasResponse/
Recovery Time
Limit of
Detection
Reference
PAN-PVAHCHO120 s/Not given0.5 ppm[45]
Pristine PANIHCHONot given12.87 ppm[27]
PLY-PANIHCHONot given1.11 ppm[27]
LYS-PANIHCHONot given0.4 ppm[27]
A polyaniline/silverHCHONot given1.24 ppm[46]
PANI/Fluoral-PHCHO42 s/Not given3.7 ppm[47]
PVAmHCHO120 s/Not given0.5 ppm[45]
Graphene oxideHCHONot given0.06 ppm[18]
PANI--Cd2+HCHO25 s/30 sNot given[48]
PAAm/MWCNTsHCHO80 s/100 s0.5 ppm[49]
MIL-101(Cr)HCHO24 s/75 s1.79 ppm[50]
PANI-CNCHCHO12 s/14 s260 ppbThis work
Publisher’s Note: MDPI stays neutral with regard to jurisdictional claims in published maps and institutional affiliations.

