Article

Paper-Based Device for Sweat Chloride Testing Based on the Photochemical Response of Silver Halide Nanocrystals

by
Tatiana G. Choleva
,
Christina Matiaki
,
Afroditi Sfakianaki
,
Athanasios G. Vlessidis
and
Dimosthenis L. Giokas
*
Department of Chemistry, University of Ioannina, 45110 Ioannina, Greece
*
Author to whom correspondence should be addressed.
Submission received: 10 July 2021 / Revised: 1 October 2021 / Accepted: 4 October 2021 / Published: 8 October 2021
(This article belongs to the Special Issue Paper-Based Sensors and Microfluidic Devices)

Abstract

:
A new method for the determination of chloride anions in sweat is described. The novelty of the method relies on the different photochemical response of silver ions and silver chloride crystals when exposed to UV light. Silver ions undergo an intense colorimetric transition from colorless to dark grey-brown due to the formation of nanosized Ag while AgCl exhibits a less intense color change from white to slightly grey. The analytical signal is obtained as mean grey value of color intensity on the paper surface and is expressed as the absolute difference between the signal of the blank (i.e., in absence of chloride) and the sample (i.e., in the presence of chloride). The method is simple to perform (addition of sample, incubation in the absence of light, irradiation, and offline measurement in a flatbed scanner), does not require any special signal processing steps (the color intensity is directly measured from a constant window on the paper surface without any imager processing) and is performed with minimum sample volume (2 μL). The method operates within a large chloride concentration range (10–140 mM) with good detection limits (2.7 mM chloride), satisfactory recoveries (95.2–108.7%), and reproducibility (<9%). Based on these data the method could serve as a potential tool for the diagnosis of cystic fibrosis through the determination of chloride in human sweat.

1. Introduction

Cystic fibrosis (CF) is one of the most common and severe inherited genetic disorders, especially among Caucasian populations, with an estimated incidence between 1 to 2500 and 1 to 7000 births in Europe [1]. Its main effect is the gradual accumulation of mucus in the lungs, airways, and digestive tract with respiratory consequences that lead to morbidity and mortality. Therefore, timely diagnosis is important to ensure early treatment that can ease symptoms and reduce complications, improving in the quality of life and the median life expectancy of CF patients.
For over 60 years the gold standard method to diagnose CF and monitor the response of patients to therapeutic treatment is sweat testing which is based on the determination of abnormally elevated sweat chloride concentrations (i.e., >60 mM) or total sweat conductivity (i.e., >90 mM) [2,3]. On the other hand, values <40 mM Cl- (or <60 mM conductivity) indicate a negative diagnosis while values between 40–60 mM (or 60–80 mM conductivity) is a borderline, intermediate situation which requires further examination (for example, by immunoreactive trypsinogen analysis in blood) [2]. The standard sweat chloride test consists of three steps: (a) the cholinergic stimulation of sweating with pilocarpine iontophoresis; (b) the collection of sweat with filter paper, gauze, or plastic capillary tubing (e.g., Macroduct coils) and (c) the determination of chloride concentration [4]. Although apparently simple, the test requires expensive bench instrumental detectors which deters the transition of chloride testing from central laboratories to point-of-need (i.e., remote and decentralized healthcare units, resource-limited settings, etc.) or point-of-care applications (i.e., personalized diagnostics). The conventional detectors used in CF testing such as ion-selective electrodes (ISE), coulometry, conductivity, or colorimetry, cost from several thousand to tens thousands of euros [5,6]. In addition, the minimum volume of sweat that is required for analysis by these devices (15 μL) is unfavorably large for infants and this is a major restriction in the successful CF screening [7]. Even if adequate sample volume is collected, trained and experienced operators are required to ensure appropriate handling of the sweat samples to avoid sample loss and evaporation.
To circumvent these limitations and meet the demand for convenient sweat analysis in non-centralized healthcare facilities and personalized diagnostics, several alternative methods based on colorimetric or fluorescence probes have been developed [5,6,7]. A lot of research has been also directed towards solid state devices impregnated with the appropriate indicator reagents that react to the presence of chloride producing a colorimetric or an electrochemical signal. In this manner, no solutions need to be prepared before analysis; the user has only to add the sample and read the signal in the appropriate detector thus minimizing user intervention, streamline analysis and offer improved portability. In this line, Mu et al. [8] used an anion exchange paper to capture chloride anions and release hydroxide anions which change the color of a pH test paper. This approach is easy to use and safe for direct skin contact but other anions present in sweat (such as lactate and bicarbonate) are also exchanged, inducing a colorimetric change. The determination of sodium ions was also proposed as a biomarker of CF using the inorganic electrochromic semiconductor of WO3 which, however, undergoes color changes in the presence of various inorganic cations after the application of voltage [9]. Both methods require small sample volumes (1.5–3 μL) and produce results that are comparable to the approved conductimetric CF test. The latter enables diagnosis based on the conductivity of sweat which is approximately 15-20 mM higher than Cl- concentrations. Cinti et al., (2018) developed a paper-based electrochemical device that can selectively measure the concentration of Cl- ions by exploiting the reaction of chloride with a silver working electrode [10]. The device requires at least 10 μL of sample (which is similar to that required for conventional tests) and it could be coupled to a dedicated low-cost potentiostat, significantly simplifying sweat analysis for the end-users and at the point-of-care. Recently, a paper-based analytical device for the diagnosis of CF with a simple ruler was developed that exploits the Mohr argentometric method for chloride determination. This paper-based method is based on the measurement of the distance covered by a white AgCl precipitate on a paper device modified with silver chromate ions [11]. A similar principle is also employed by the CF Quantum® Sweat Test System (CFQT) where a white AgCl precipitate is formed on a paper surface when chloride anions replace the chromate anions in the silver chromate complex [12]. The surface area of the white precipitate in the middle of the patch compared to the total surface area within the red ring is used to calculate the sweat chloride concentration. These methods give fast results (a few minutes) but require manual measurement of distance or circle diameter, which is prone to the user’s efficiency and familiarization with the method, to avoid reliability and reproducibility problems [11,12,13].
In this work we describe a new paper-based analytical device for the determination of the concentration of chloride anions that is inspired by the principles of early photography. The novelty of the method is based on the sensing mechanism which relies on the different photosensitivity of silver ions and silver halide crystals. Upon exposure to UV light, silver ions turn to dark grey-brown which is indicative of the formation of nano-sized Ag. When chloride anions are added, AgCl crystals are spontaneously formed which stereochemically protect Ag ions from direct photoreduction yielding a light grey coloration. The difference in the mean grey value of color intensity in the presence and absence of chloride is used to determine the concentration of chloride. The method does not require any image manipulation while signal acquisition is performed using a flatbed scanner to obtain a colored image of the device and then measure the mean grey value of color intensity on the paper surface from a constant window within the sensing area, it employs only a small sample volume (2 μL) and offers high selectivity and good analytical features in terms of working concentration range, detection limits, recoveries and reproducibility.

2. Materials and Methods

2.1. Chemicals and Materials

Paper devices were prepared using Whatman No. 1 Chromatography paper. Sodium sulfate decahydrate, sodium iodide, sodium bicarbonate, sulfur, D(+)-glucose, and iron sulfate heptahydrate were purchased from Acros Organics, Geel, Belgium). Potassium chloride, DL-alanine, uric acid, urea, creatinine, lactic acid, magnesium chloride hexahydrate, D-pantothenic acid calcium salt, sodium hydroxide, and dehydroascorbic acid were obtained from Sigma-Aldrich (Steinheim, Germany). Copper (II) chloride dihydrate, sodium phosphate anhydrous monobasic, and AgNO3 (>99%) were obtained from Alfa Aesar (Karlsruhe, Germany).

2.2. Equipment and Instrumentation

The equipment setup employed in this work was the same used in our previous work [14]. It consisted of a UV illumination chamber (Vilber Lourmat Bio-Link® BLX Crosslinker,Marne-la-Vallée, France, 4 W cm−2, Available online: https://www.vilber.com/bio-link/, accessed on 7 October 2021) that was used to illuminate the sensing areas of the paper devices with 5 lamps (254 nm) of 8 Watt each (total 40 W). The chamber ensures constant exposure to UV light throughout the experiments. A flatbed scanner operated in reflectance mode (PerfectionV370 Photo, Epson, Nagano, Japan) was used to capture the images of the devices.

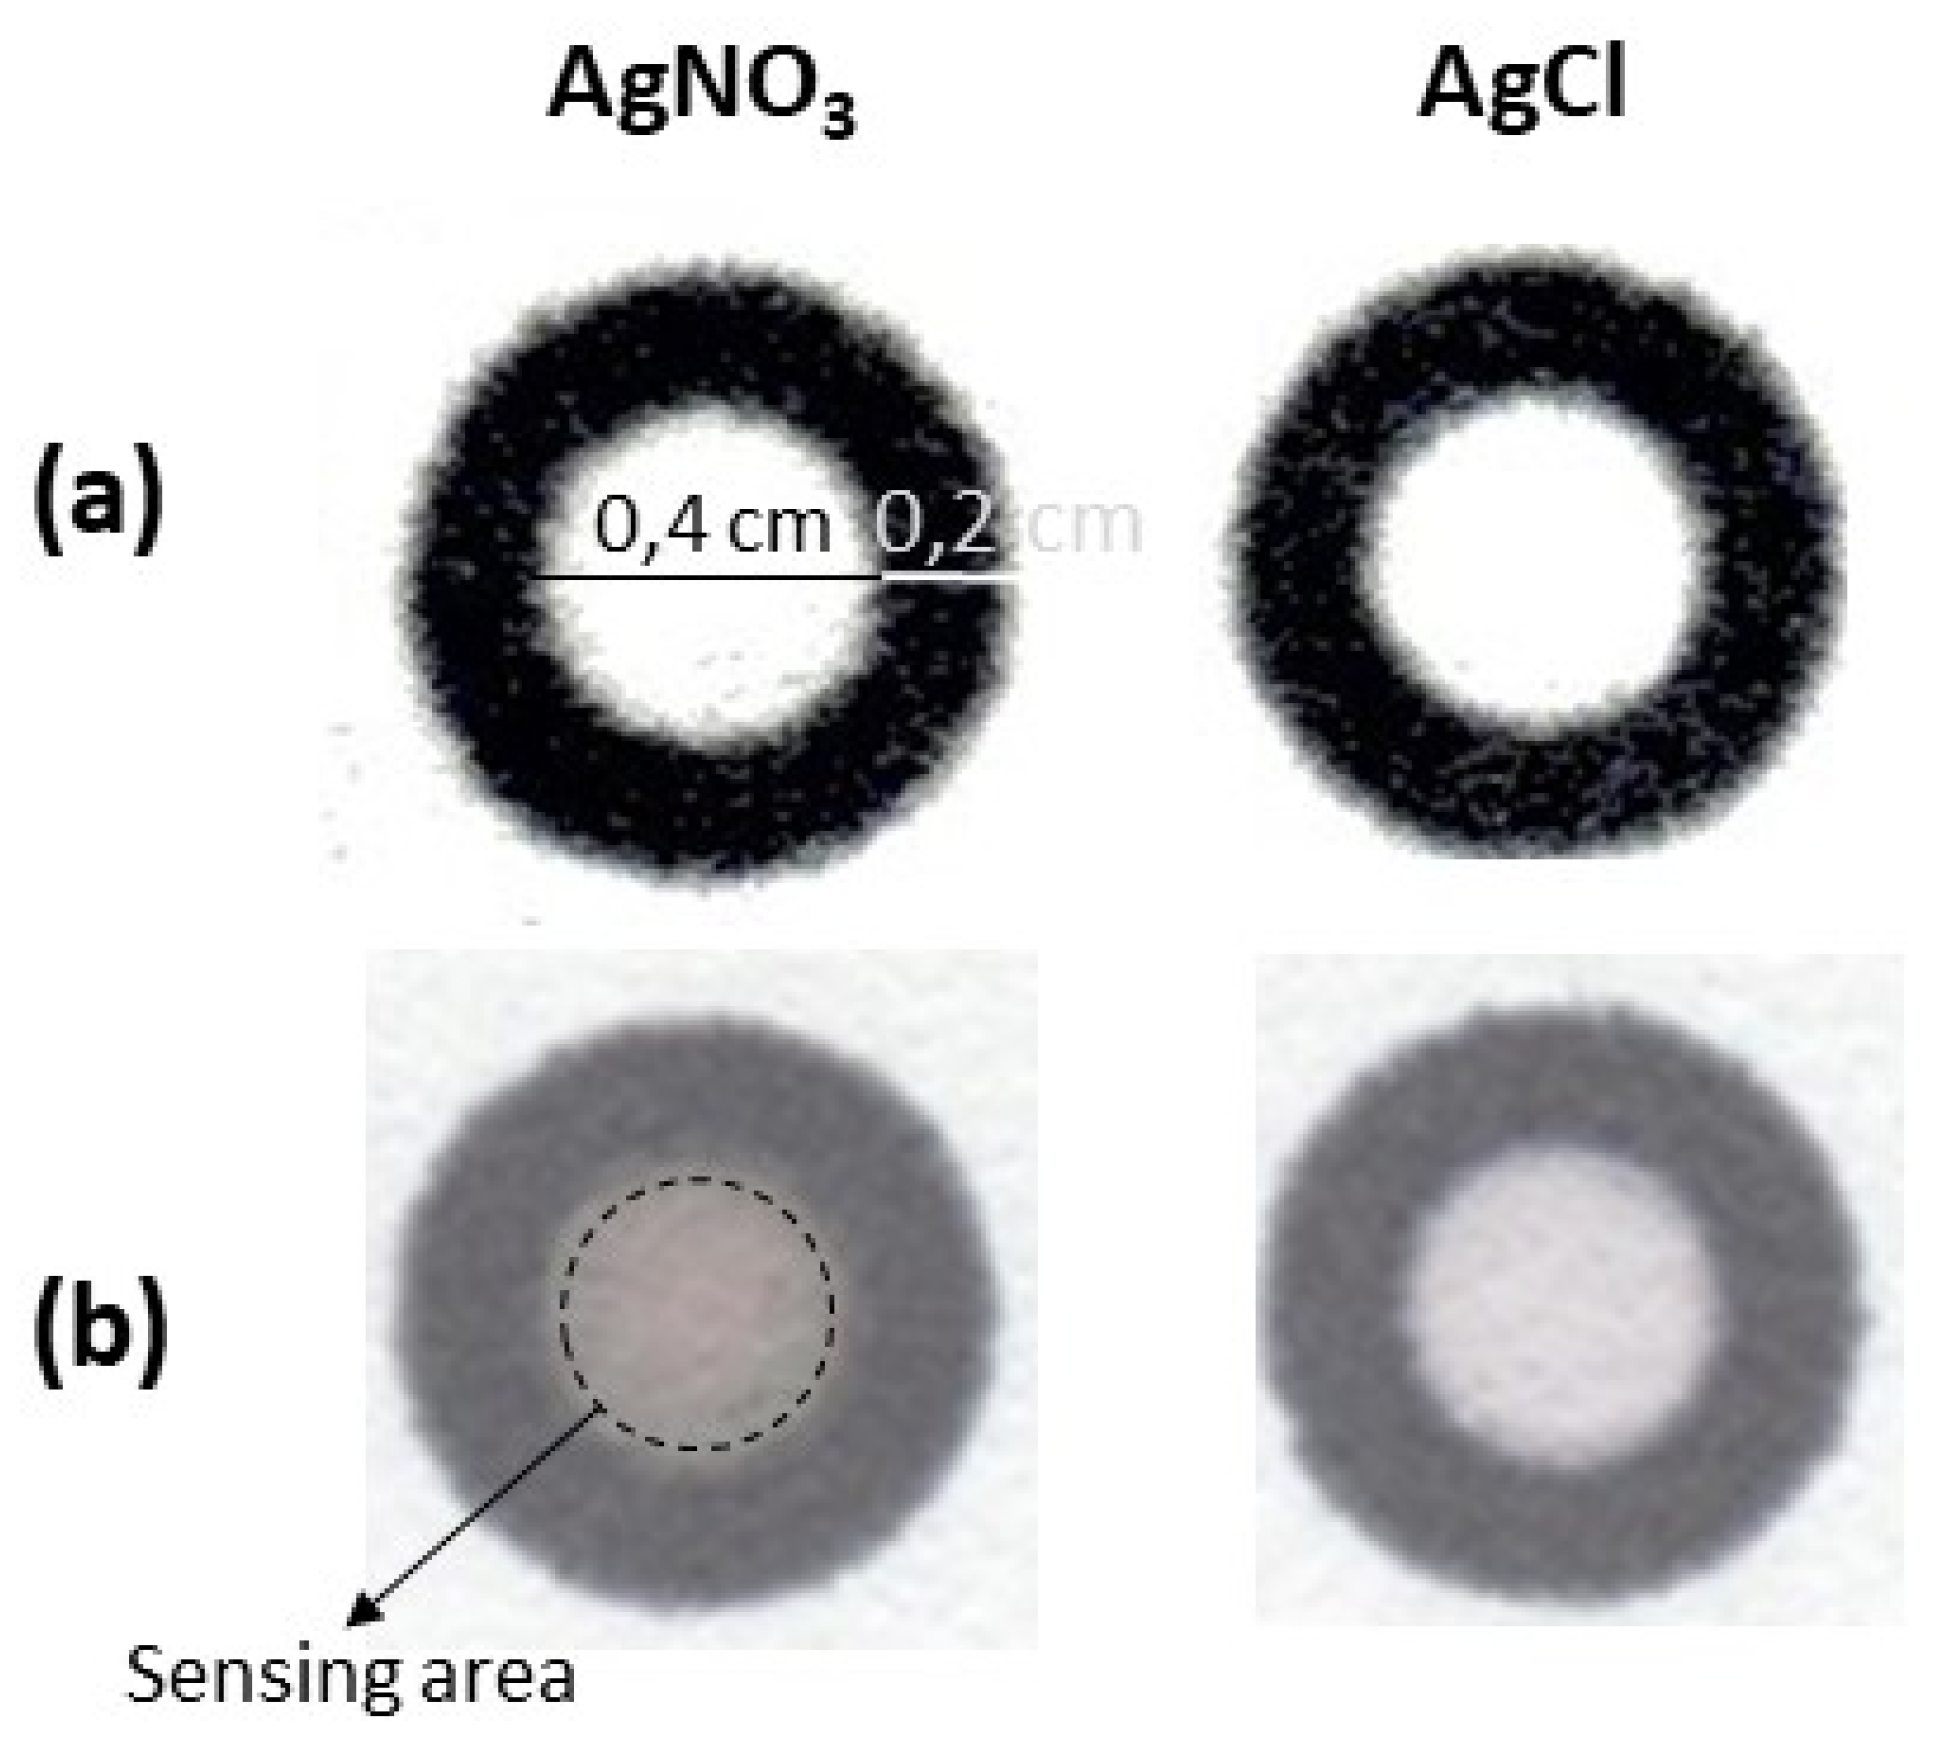
2.3. Fabrication of the Paper Devices

Each paper device had a circular pattern that was designed in MS PowerPoint in a white background and printed on Whatman No.1 Chromatography paper using a solid-ink printer (ColorQube 8580DN, Xerox, Norwalk, CT, USA). To isolate the sensing area, we heated the devices in a furnace at 140 ± 5 °C for 120 s to melt the printed ink. Each device had a total diameter of 0.80 cm and consisted of an internal area (i.e., sensing zone) of 0.40 cm diameter and a (wax) circular barrier of 0.20 cm thickness.
On the center of the sensing zone, we added 2 μL of 40 mM AgNO3 and dried them in darkness under ambient conditions. Drying was necessary to facilitate their storage for future use while darkness was used to avoid light exposure of AgNO3, which is photosensitive. This procedure was performed in each device separately to avoid differences in light exposure during preparation. Then, each of the devices were stored for no longer than 1 month in an inert atmosphere inside dark zipper bags containing a moisture absorbing silica gel pack in the refrigerator (4 °C). Before use, the devices were incubated at room temperature for 10 min at ambient temperature (25 °C) protected from light.

2.4. Samples

Artificial sweat was prepared based on a detailed protocol that uses biologically relevant chemical constituents at concentrations that match human sweat [15]. To prepare 100 mL of comprehensive artificial sweat containing approximately 2.3 × 10⁻³ M chloride, 80 mL of aerated distilled and deionized water was added to an Erlenmeyer flask, and placed on a heated magnetic stirrer (LLG uniSTIRRER 5) equipped with a remote PT1000 temperature probe. The solution was warmed and thermostated to 36 °C to match human skin temperature and stirred continuously. The reagents were added according to the following order: Electrolytes and other ionic constituents (Na2SO4: 5.83 × 10² g L1, NaI: 1.1 × 10⁵ g L1, CuCl2·2H2O: 1.60 × 10⁴ g L1, sulfur: 7.37 × 10² g L1, NaHCO3: 2.5 × 101 g L1, FeSO4·7H2O: 2.7 × 10³ g L1, KCl: 0.455 g L1, NaCl: 0.975 g L1), organic acids and carbohydrates (lactic acid: 1.26 g L1, glucose: 3 × 10² g L1), amino acids (DL-alanine 5.11 × 10² g L1), nitrogenous substances (uric acid: 9.9 × 10³ g L1, urea: 0.6 g L1, creatinine: 9.5 × 10³ g L1), and vitamins (D-Pantothenic acid calcium salt: 2.48 g L1). The pH of the mixture was adjusted to 5.3 by the dropwise addition of NaOH while monitoring using a calibrated pH electrode (Metter Toledo F20). The final volume of the solution was then brought up to 100 mL using distilled water. The prepared sweat solution was finally filtered through a 0.2 μm pore size filter to minimize potential microbial growth during storage. The sweat solution was stored at 4 °C for one week.
Sweat samples were voluntarily provided by two healthy donors (age 23–25) after physical exercise. Two sweat samples (~150–200 μL) were collected from the forehead of the volunteers with a plastic Pasteur pipette directly from the skin surface and placed in Eppendorf tubes. The samples were placed in a refrigerator (4 °C) to avoid evaporation and analyzed within a few hours after sampling.

2.5. Experimental Procedure

A 2.0 μL sample aliquot was retrieved with an automatic pipette (Orange Scientific, 0.5–10 μL) and dispensed on the sensing area. The device was left to dry at ambient conditions away from light for 35 min and exposed to UV light (254 nm, 40 W) for 1.5 min. After exposure we captured images of the devices as Joint Photographic Experts Group (JPEG) files at a resolution of 300 dpi using a flatbed scanner (PerfectionV370 Photo, Epson) in reflectance mode. All automatic correction factors used by the software (Easy Photo Scan, v.1.00.08, Epson) were disabled before scanning to avoid image manipulation. The “oval” tool was used to manually select 90% of the total sensing surface area (from the center of the device and towards the edges). Signal acquisition was performed using the default algorithm embedded in Image J (NIH, USA) which measures the brightness of the image as mean grey value in the RGB color space. Specifically, RGB pixels are converted to brightness values using the formula: value = (red + green + blue)/3.

3. Results

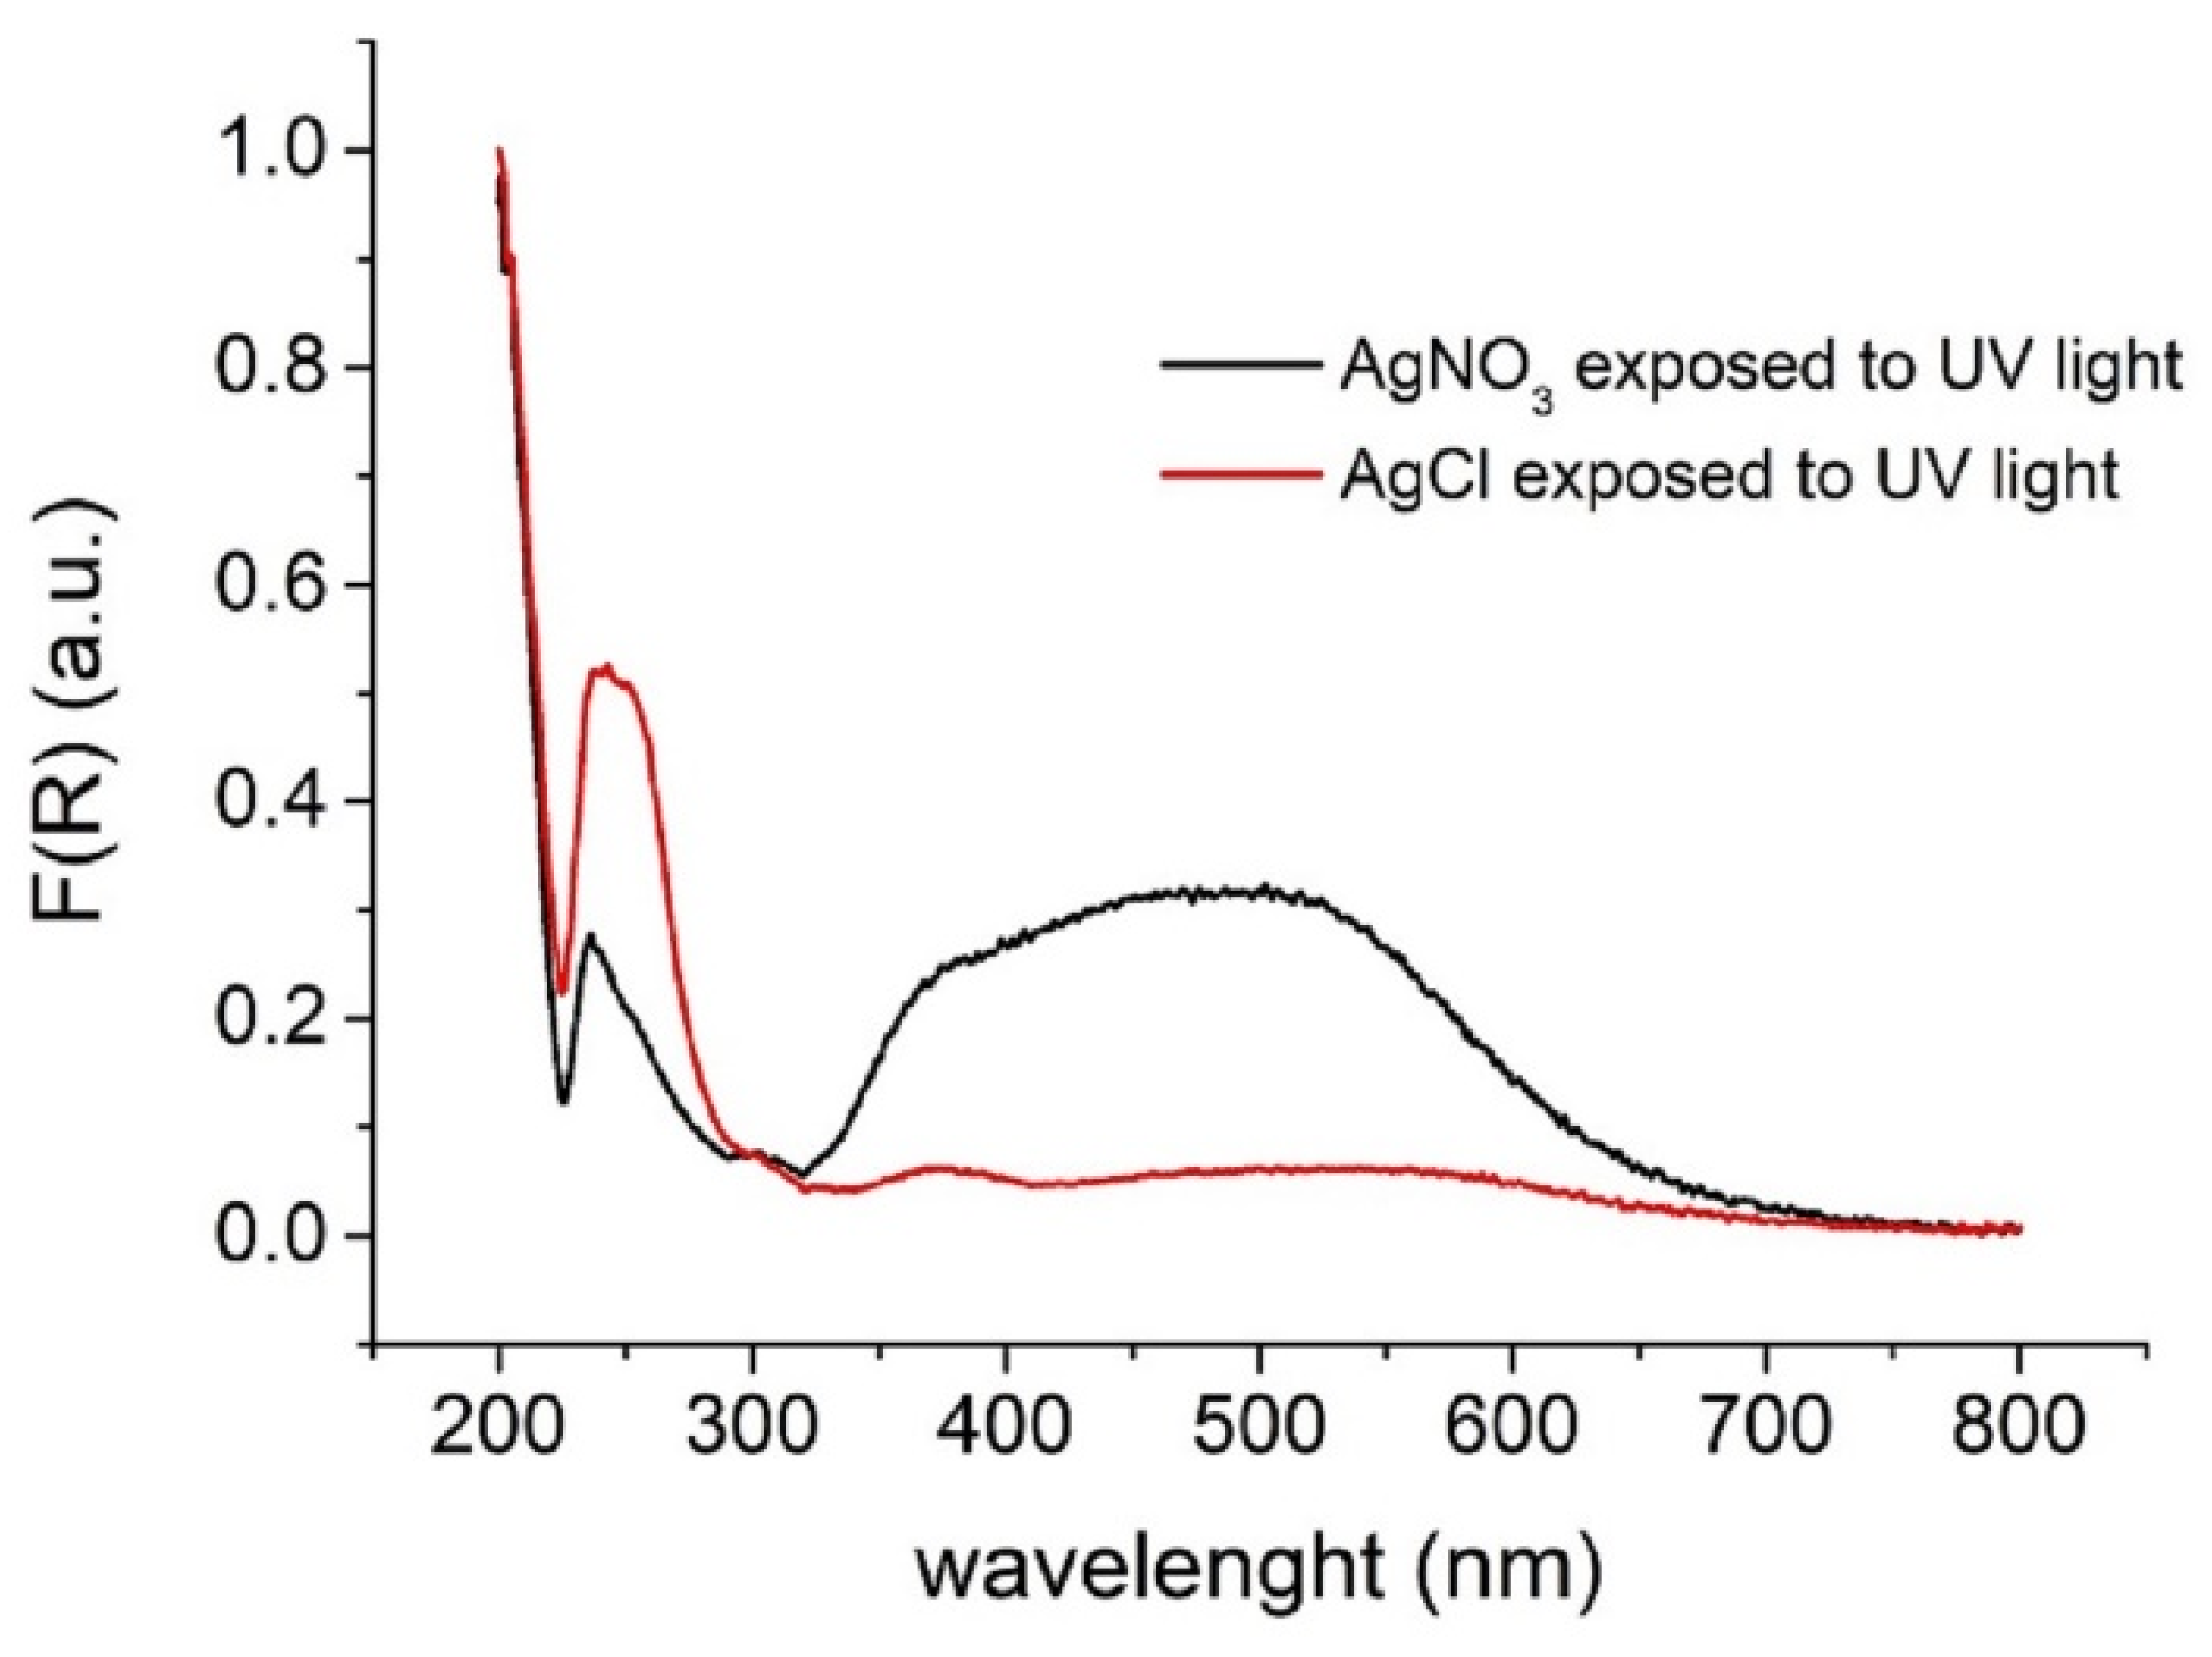
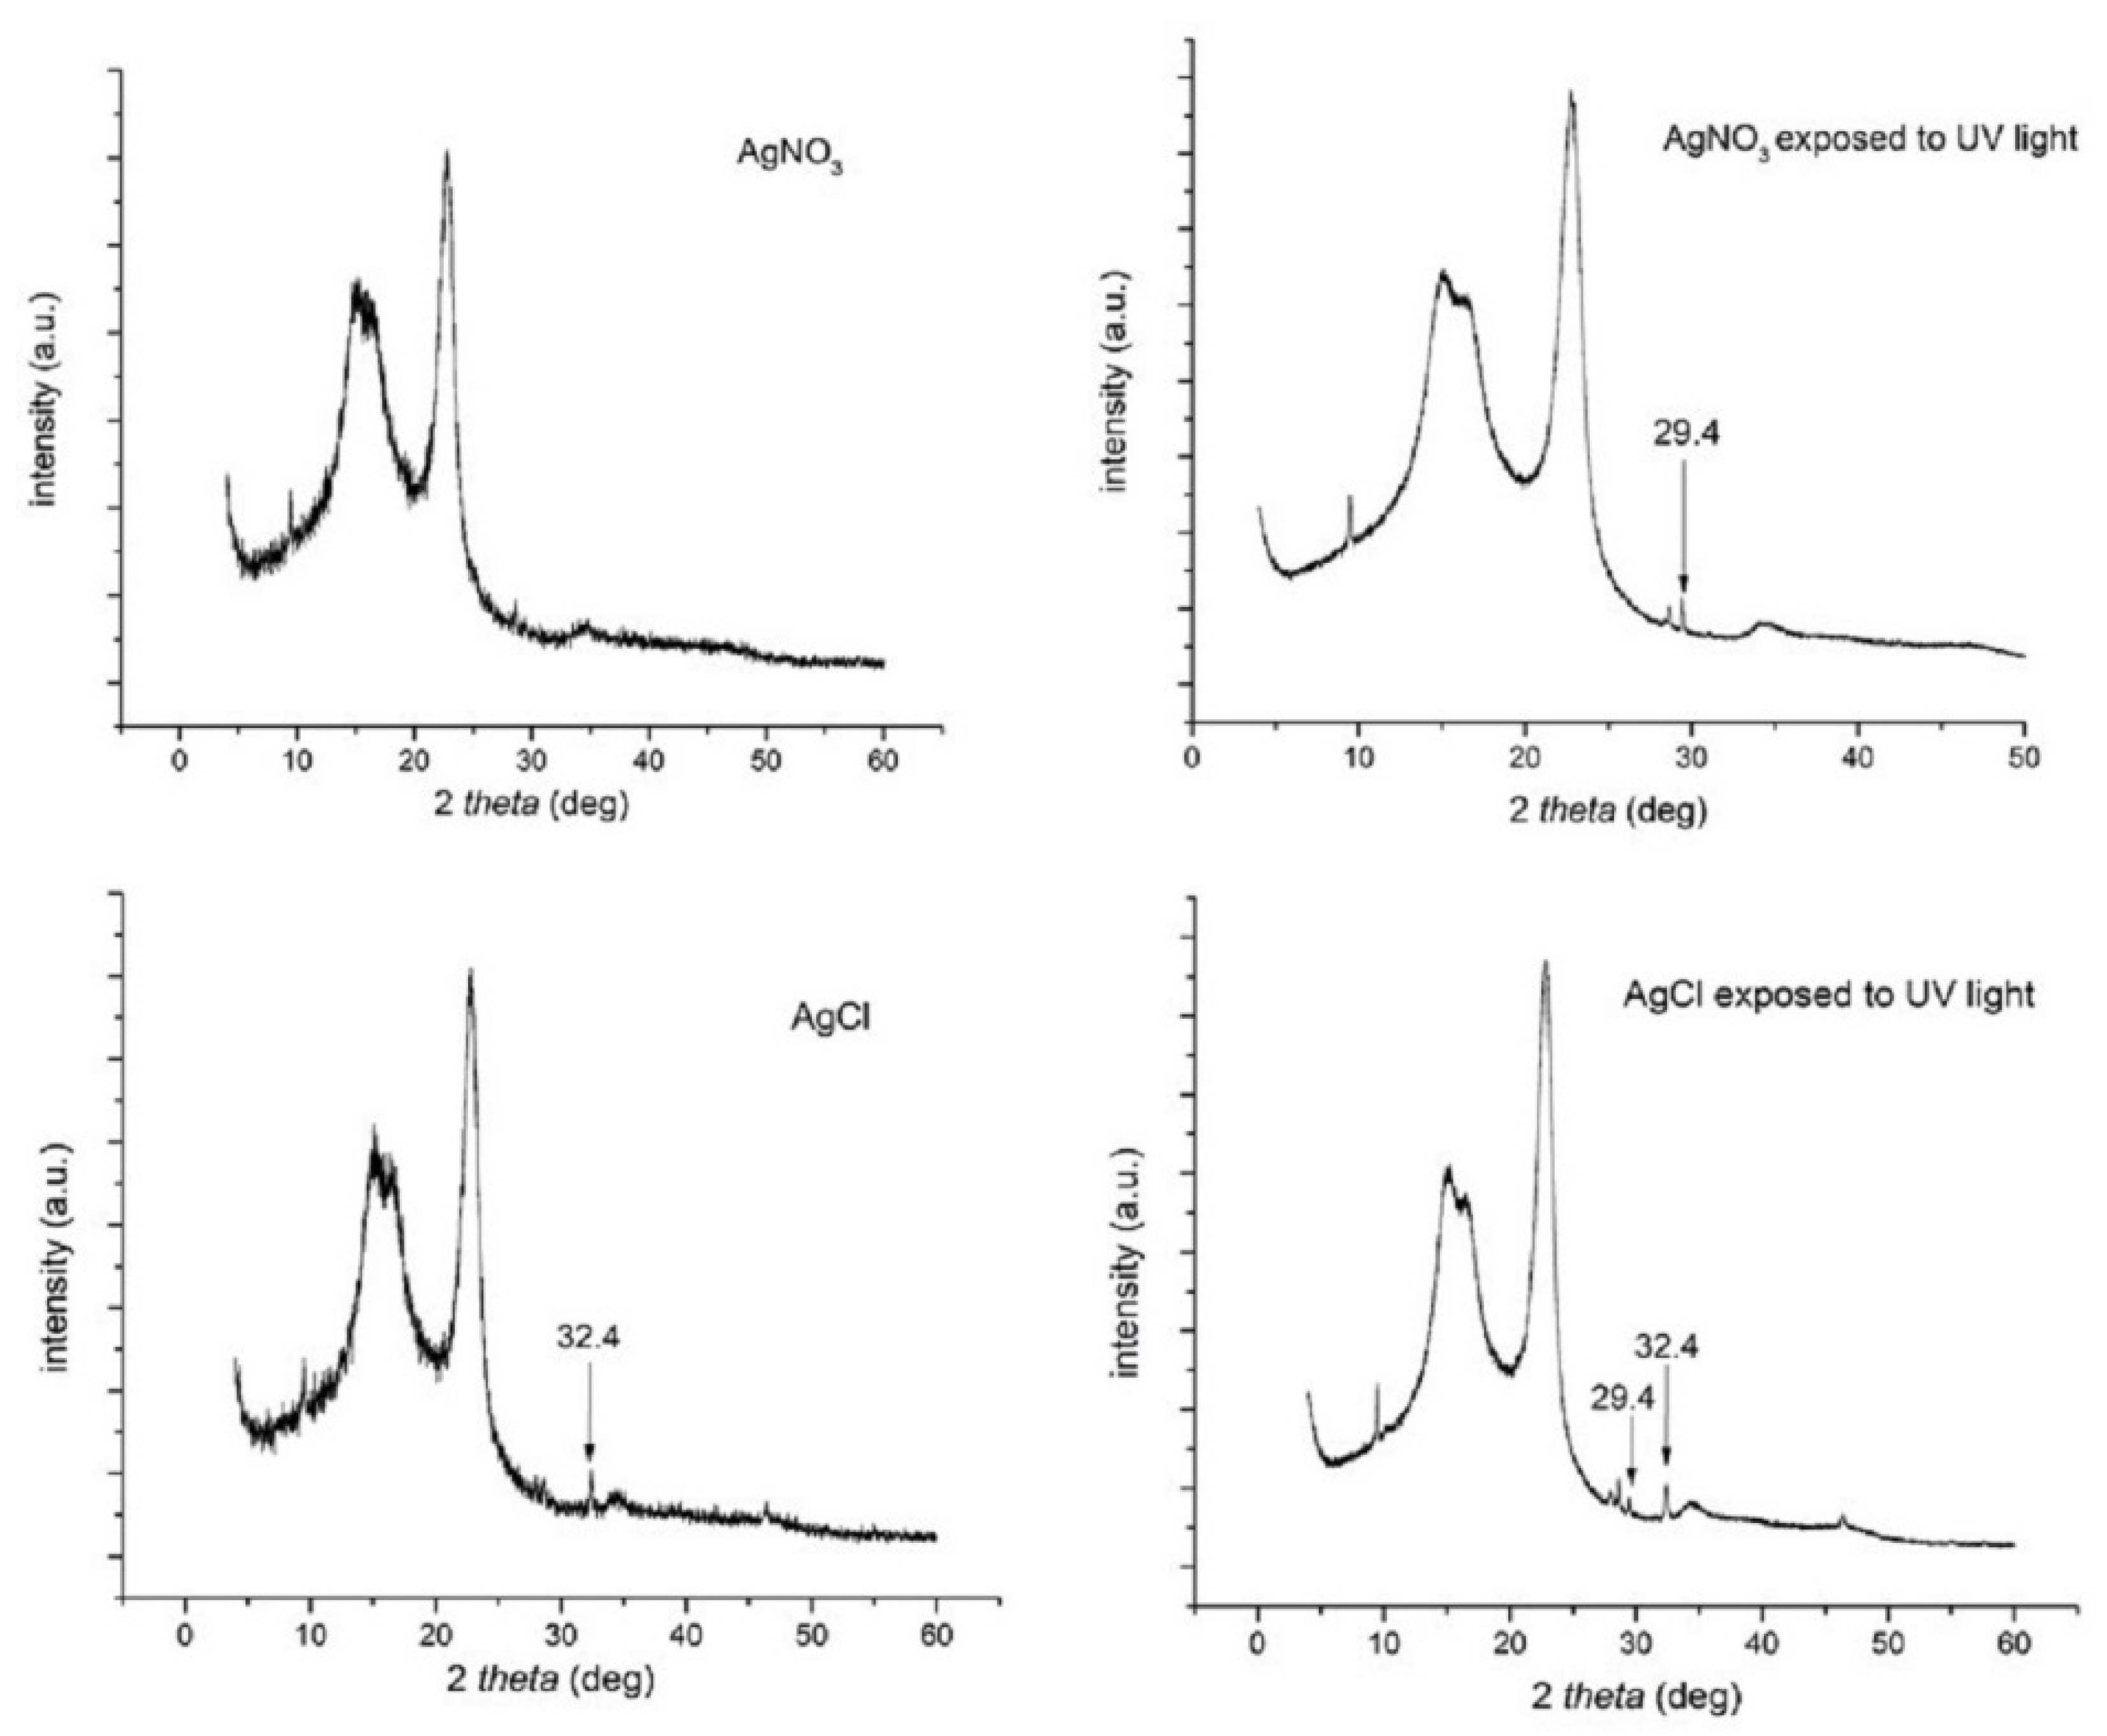
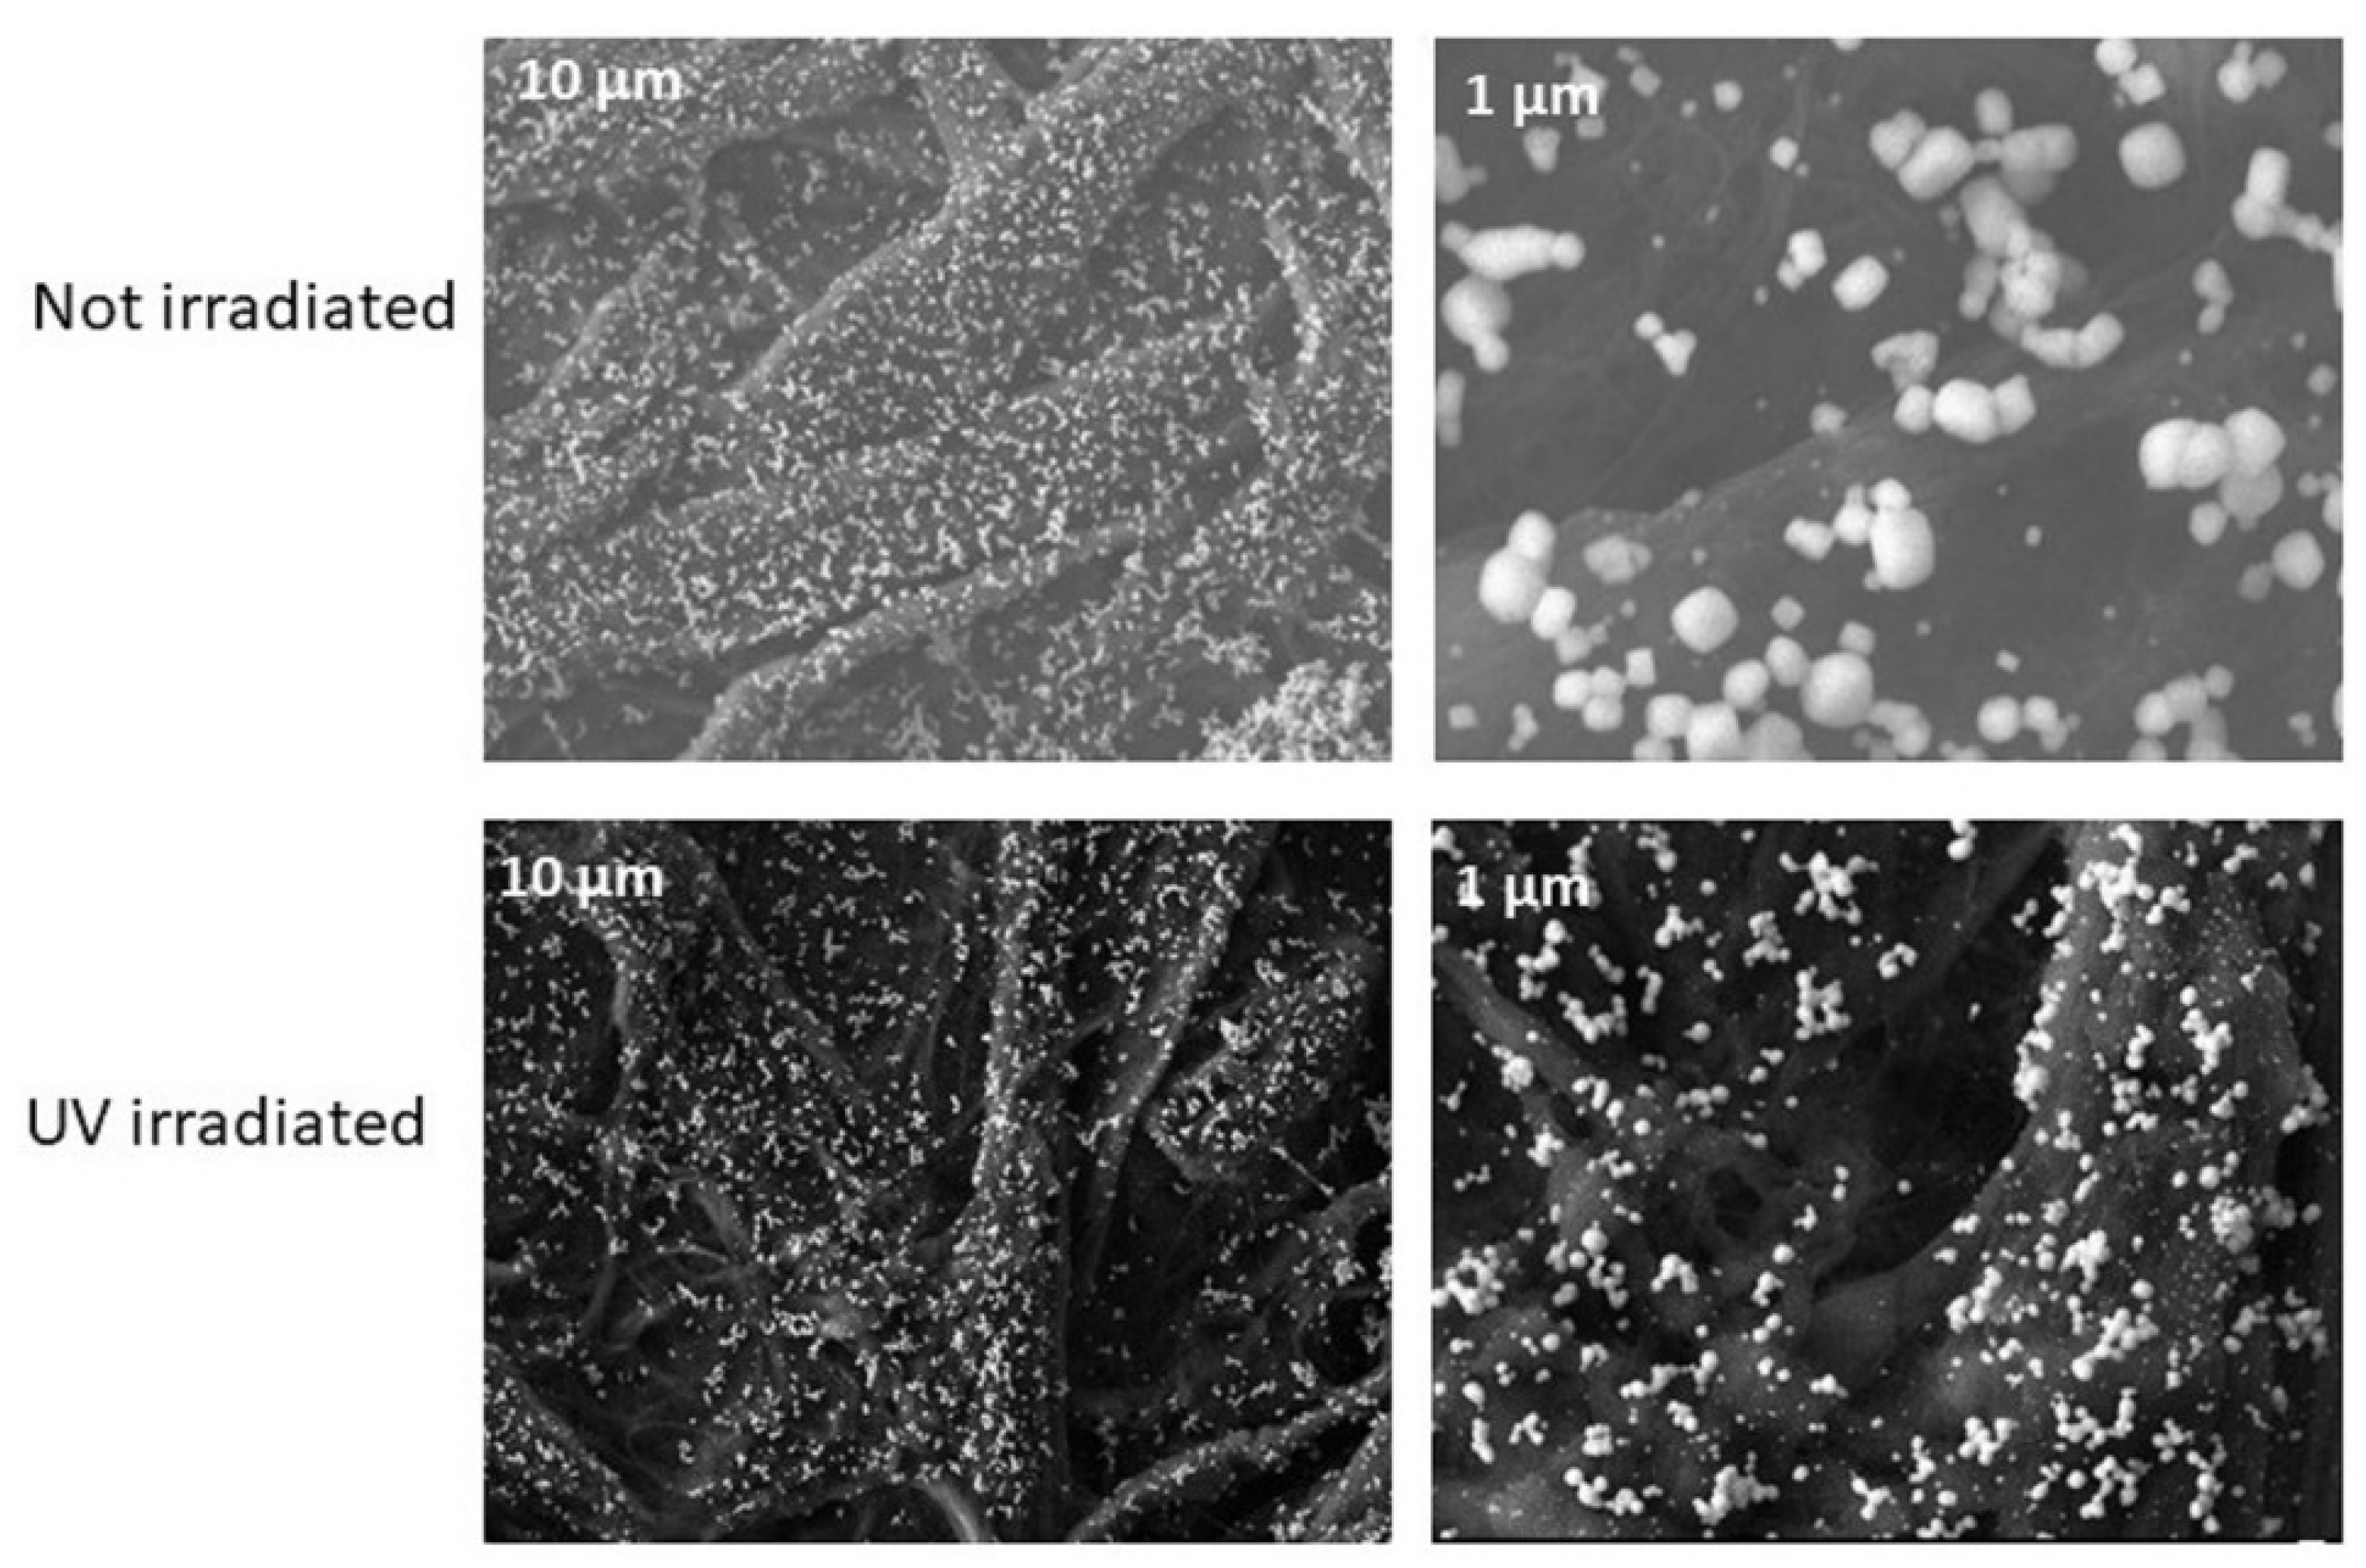
3.1. Sensing Mechanism

The principle of chloride sensing on the developed paper devices is based on the principles of early photography and it uses the photosensitivity of silver halides to control the photoreduction of silver. Firstly, AgNO3 is deposited and immobilized on the paper surface. We believe that Ag+ ions are physically immobilized on paper and not chemically bound on it, because paper is mainly made of cellulose, which is rich in hydroxyl groups that constitute excellent ligands for hard metal ions while Ag+ is a soft metal ion. Therefore, the formation of coordinate complexes between Ag+ and hydroxyl groups (e.g., cellulose-OAg complexes) should not be favored. After drying, the sample containing NaCl is added on the paper surface. The hydration of paper results in the mobilization of Ag+ ions which react with chloride to from the white precipitate of AgCl. Since AgNO3 is colorless and AgCl precipitate is white, the addition of reagents and the sample do not discolor the sensing area of the paper that is also white (Figure 1a).
After exposure to UV light (Figure 1b), the paper surface containing only AgNO3 turns to dark grey-brown indicating the reduction of Ag ions while the surface containing AgCl turns darker than plain paper (from light grey to grey depending on exposure time) but brighter than the paper containing only AgNO3.
The UV–Vis diffuse–reflectance spectra (Figure 2) of the paper devices shown in Figure 1b reveal that AgCl mainly absorbs in the UV region (λmax = 242 nm) and exhibits a weak absorption in the visible region. On the other hand, the paper devices containing silver ions, after photoreduction exhibited a wider absorption range including both the UV and visible regions. The adsorption of visible light can be assigned to some kind of nano-sized silver particles with localized surface plasmonic resonance and agrees with the observed color transitions on the paper surface.
The photoreduction of silver and silver chloride on the paper surface was also examined by powder X-ray diffraction (pXRD) analysis (Figure 3). When only AgNO3 was present no peaks were observed (other than those corresponding to the paper substrate) while AgCl exhibited a characteristic peak at 32.4° which is coincident with the AgCl {200} layer [16,17]. After photoreduction a new peak at 29.4° appears on both AgNO3 and AgCl impregnated paper devices indicating the appearance of a new crystalline phase which is attributed to nano-sized silver.
These observations and the concurrent difference in the grayscale transitions on the paper surface are determined by the properties and structure of AgCl crystals. The AgCl crystal structure comprises of two displaced face-centered cubic lattices; one is composed of silver ions, the other contains the chloride ions [17,18]. The chloride ions, due to their large size, remain immobile in their sites. On the other hand, a small fraction of silver cations is omitted from its usual position in the lattice and (in order to maintain electrical neutrality) it is placed within a non-lattice, interstitial position, creating defects (called Frenkel pairs) [19,20]. Interstitial silver ions are found mainly within the bulk of the crystal but due to their small size, they can move throughout the cubic lattice structure [21]. Since AgCl crystals have a direct band gap of 5.15 eV (241 nm) and an indirect band gap of 3.25 eV (382 nm) [22], they can only absorb UV light. When a photon of UV light strikes a silver chloride crystal, it frees an electron from the chloride ion. The electron moves to an area of shallow electron level (electron traps), which is a defect in the crystal structure (edge dislocation) creating a ‘sensitivity speck’ in the surface of the crystal. The trapped electron attracts an interstitial silver ion to form a silver atom. This process may be repeated several times forming a cluster of silver atoms, which in photography is called “latent image”. At low exposure times to UV irradiation, the “latent image” is not visible by the naked eye while at long exposure times the number of silver clusters increases leading to the appearance of a faint greyscale coloration (Figure 1b-right image). In traditional photography the transformation of the “latent image” into a visible photograph is made by exposing the photosensitized surface (i.e., AgCl crystals containing the silver atom clusters) to a solution of a reducing agent so that the clusters can catalyze the reduction of the overall AgCl crystal that contains them [18,23].
In this work, we used these mechanisms to determine the concentration of chloride ions by forming AgCl on the paper surface thus protecting silver ions from direct photoreduction as a “latent image” in the AgCl crystal. In other words, the more AgCl formed on the paper surface, the brighter the color of the surface due to the protection of Ag ions in the form of a “latent image”. To obtain a better insight of this mechanism we obtained SEM images of the AgCl crystals before and after exposure to UV light (254 nm, 40 W, 1.5 min). The images of Figure 4 show that exposure of the AgCl crystals on the paper surface to UV irradiation, causes them to break down into smaller particles and disperse on the paper surface. This observation agrees with our previous study [13]. The observed decomposition and deformation of AgCl crystals is attributed to the overgrowth of reduced silver on the Ag-halide crystals (due to increased exposure) [24] leading to the appearance of a light grayish coloration (Figure 1-right bottom image).

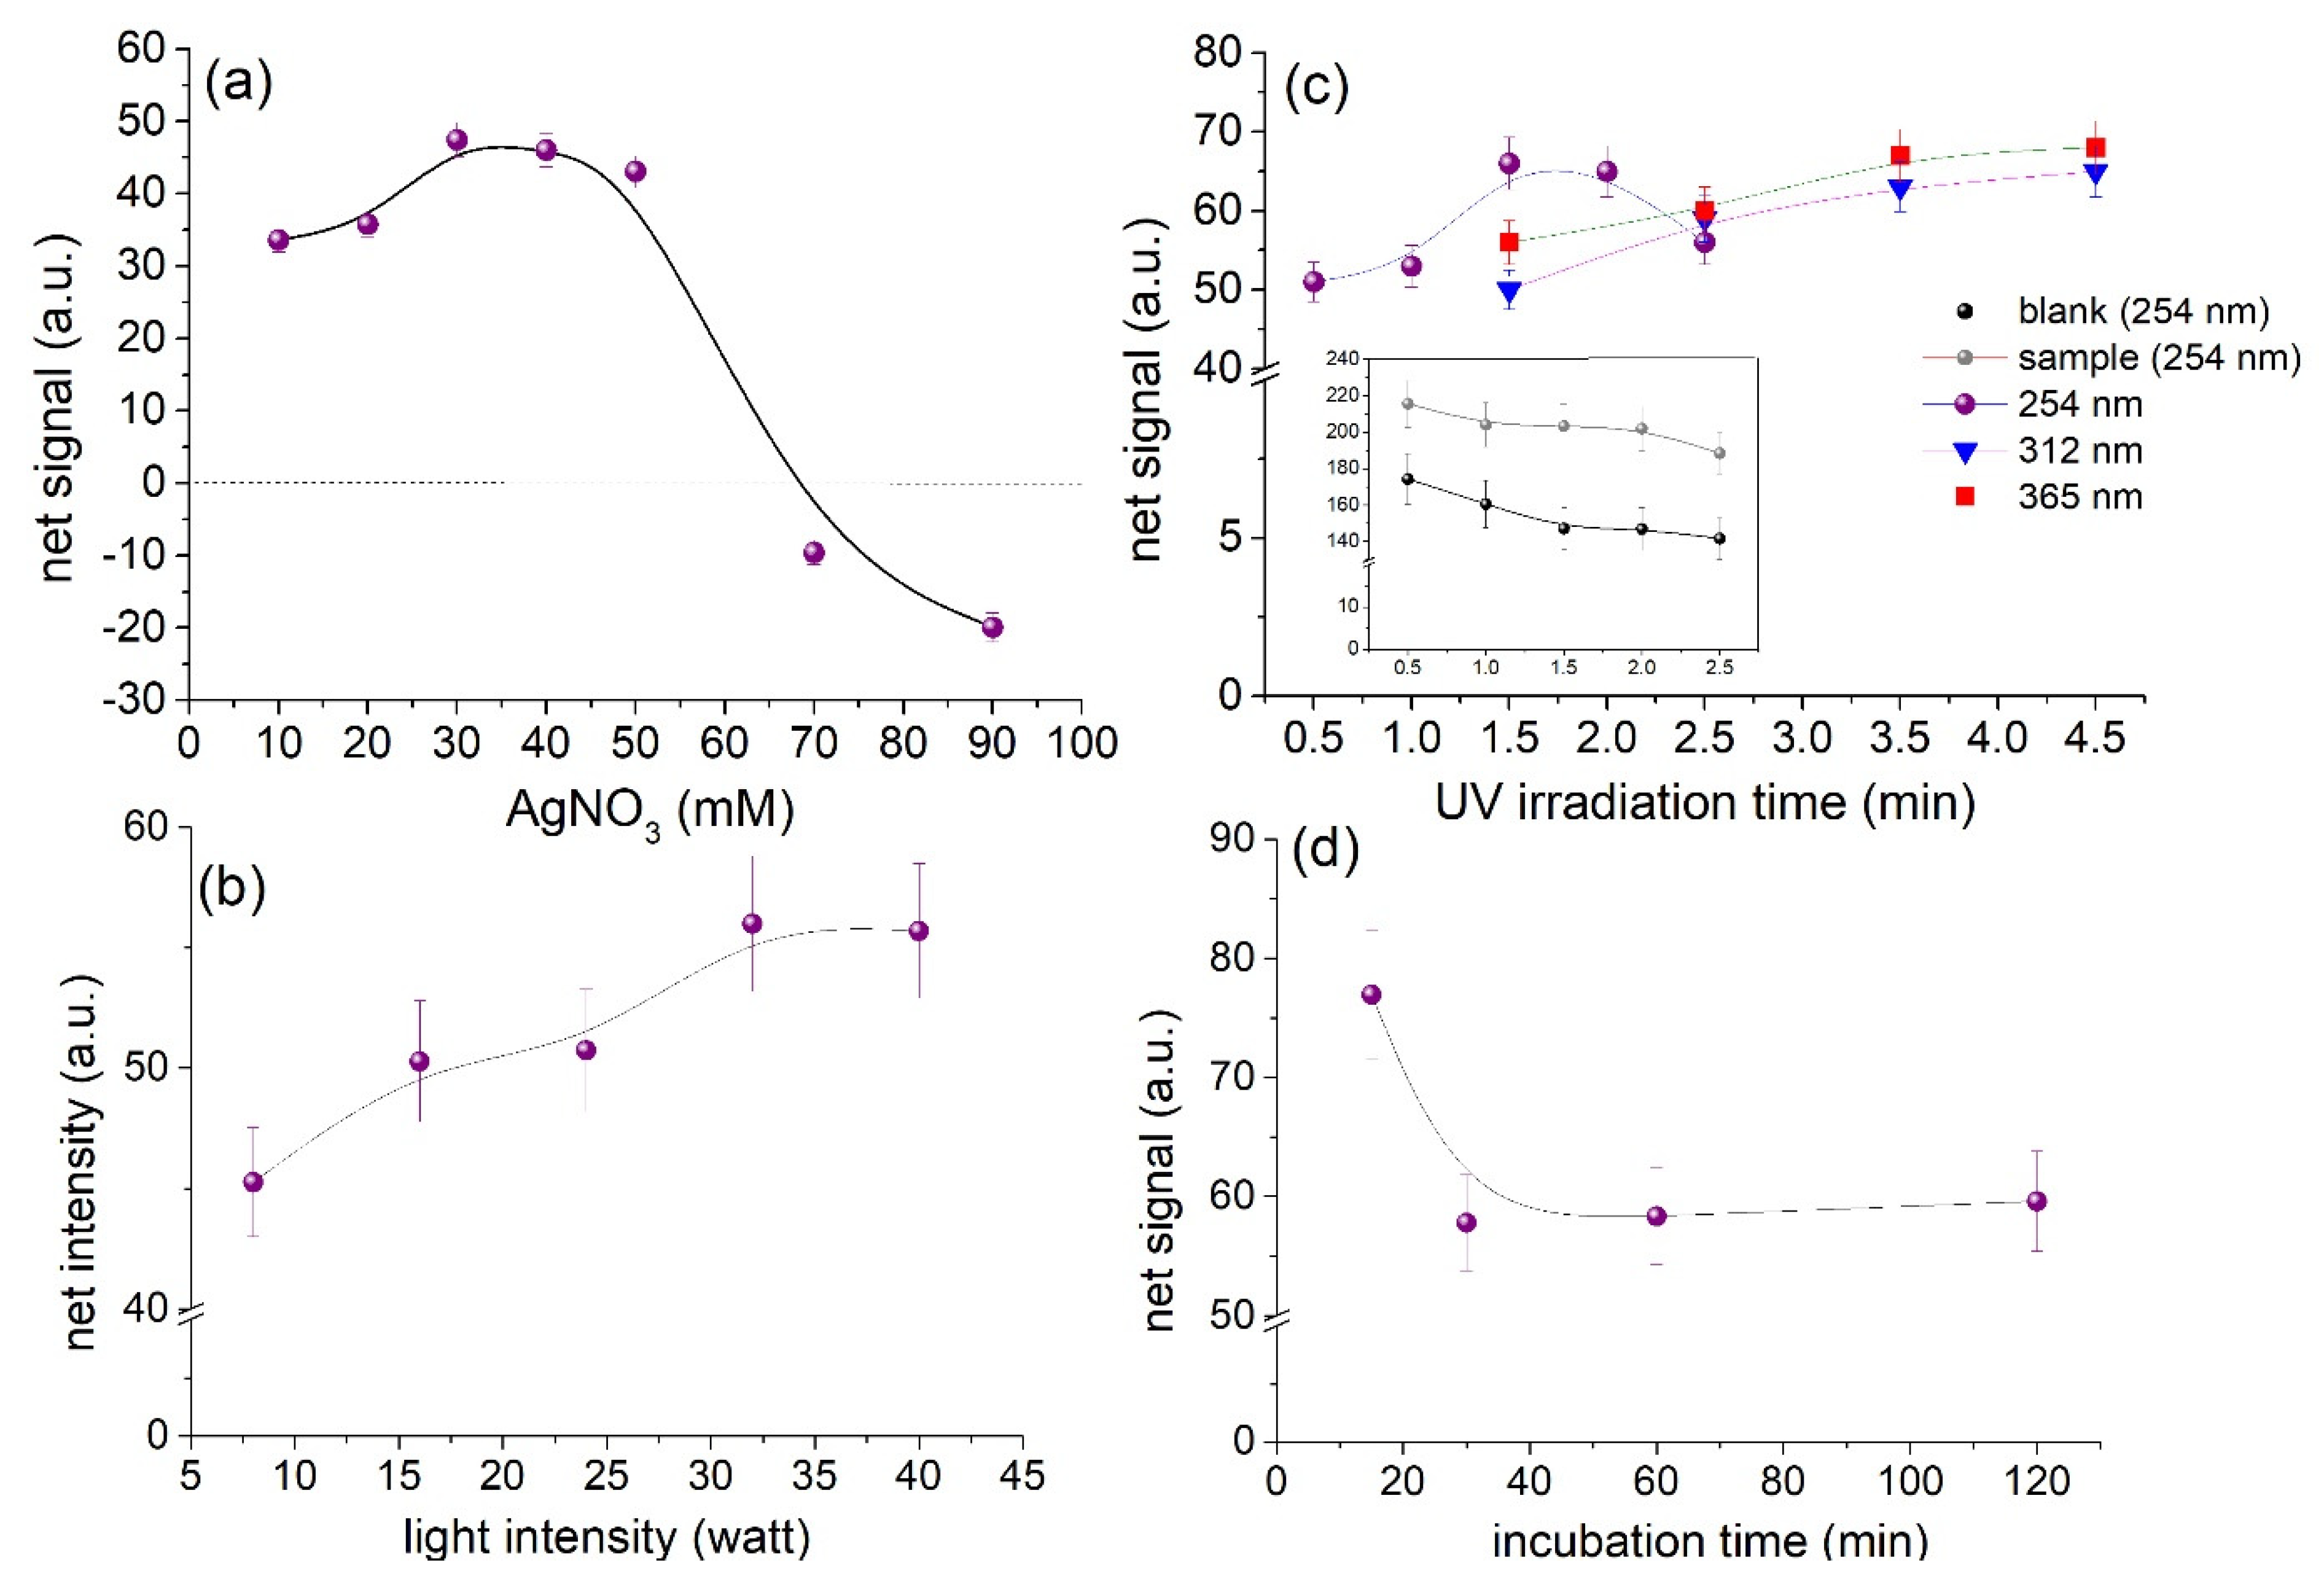
3.2. Optimization of the Assay

Based on the sensing mechanism described previously the factors affecting the photoreduction of silver ions and AgCl crystals were optimized. These factors include the concentration of AgNO3, the UV irradiation wavelength, intensity, and exposure time as well as the incubation time of the devices before exposure to UV light. The optimum conditions were defined as those yielding the maximum net analytical signal. For simplicity, the net analytical signal was calculated as the mean grey area intensity of the blank sample minus the mean grey area intensity of the sample. The results from the optimization study are depicted in Figure 5.
The optimum concentration of AgNO3 lay between 30–50 mM AgNO3 (Figure 5a). Since 50 mM of NaCl solution was used for the optimization study, the chloride anions were in excess compared to Ag ions ensuring the formation of AgCl. At AgNO3 concentrations higher than 50 mM, the residual amount of Ag ions remained free and was photoreduced producing darker images. As a result, the net signal intensity yields negative values due to the increase in the signal of the blank. Taking into consideration that the sweat chloride levels that indicate a negative CF diagnosis is <40 mM [2], a concentration of 40 mM of AgNO3 was used as optimum in order to ensure adequate AgCl formation at the lower end of the diagnostic range.
The time at which the paper devices should be exposed to UV irradiation to accomplish the maximum difference in the grayscale intensity of the blank and the sample, was investigated from 0.5–2.5 min at 254 nm. The plot of Figure 5b shows that the net signal increases up to 1.5 min and no further improvement is obtained at longer exposure times. As shown in the inset graph of the same plot, this is attributed to the gradual reduction in the signal intensity of both the blank and the sample (i.e., they turn darker with increasing irradiation). Therefore, the irradiation time was fixed at 1.5 min throughout the study.
The use of longer wavelengths was also studied by exposing the devices at 40 W of light intensity at 312 nm and 365 nm. The line plots of Figure 5b (red and blue) show that similar results may be obtained at the examined wavelengths, but longer exposure times are required to acquire an analytical signal equivalent to that obtained at 254 nm due to the fact that AgCl mainly absorbs at λ ≈ 242 nm (Figure 2). This is advantageous since no specific UV light source is required to perform the assay. Any UV light source is suitable provided that both calibration and analysis are performed under the same conditions and by increasing the irradiation time. In that sense, LED light sources at 365 nm could be well-suited for portable devices because they readily available more cost effective.
The effect of UV light intensity was then optimized by varying the exposure intensity from 8–40 W at 254 nm. According to Figure 5c the net signals improve with increasing power and reached a plateau after 32 W. Therefore, to obtain the highest signals and lower irradiation time the devices were irradiated at 254 nm, 40 W for 1.5 min.
The incubation time of the sample with the reagents before exposure to UV light was also considered. This is important when analyzing multiple samples simultaneously in order to ensure constant reaction conditions during the analysis of samples and the calibration curve. In that regard, the storage time of the devices from the time of sample deposition until exposure to UV light was assessed between 15–120 min. From the data of Figure 5d we can infer that short incubation times produce high signals while at lower incubation times the signal decreases but reaches an equilibrium. By observing the grey area intensity of the paper surfaces we observed that the signal of the blank samples increases by approximately 20% with storage time from 15 to 30 min under dark conditions but stabilizes thereafter. This may be possibly attributed to the reduction of silver ions from paper constituents or impurities and it is not observed with AgCl. To ensure that all measurements are performed under the same conditions, we stored the devices in dark for 35 min (after sample addition) before exposure to UV light.

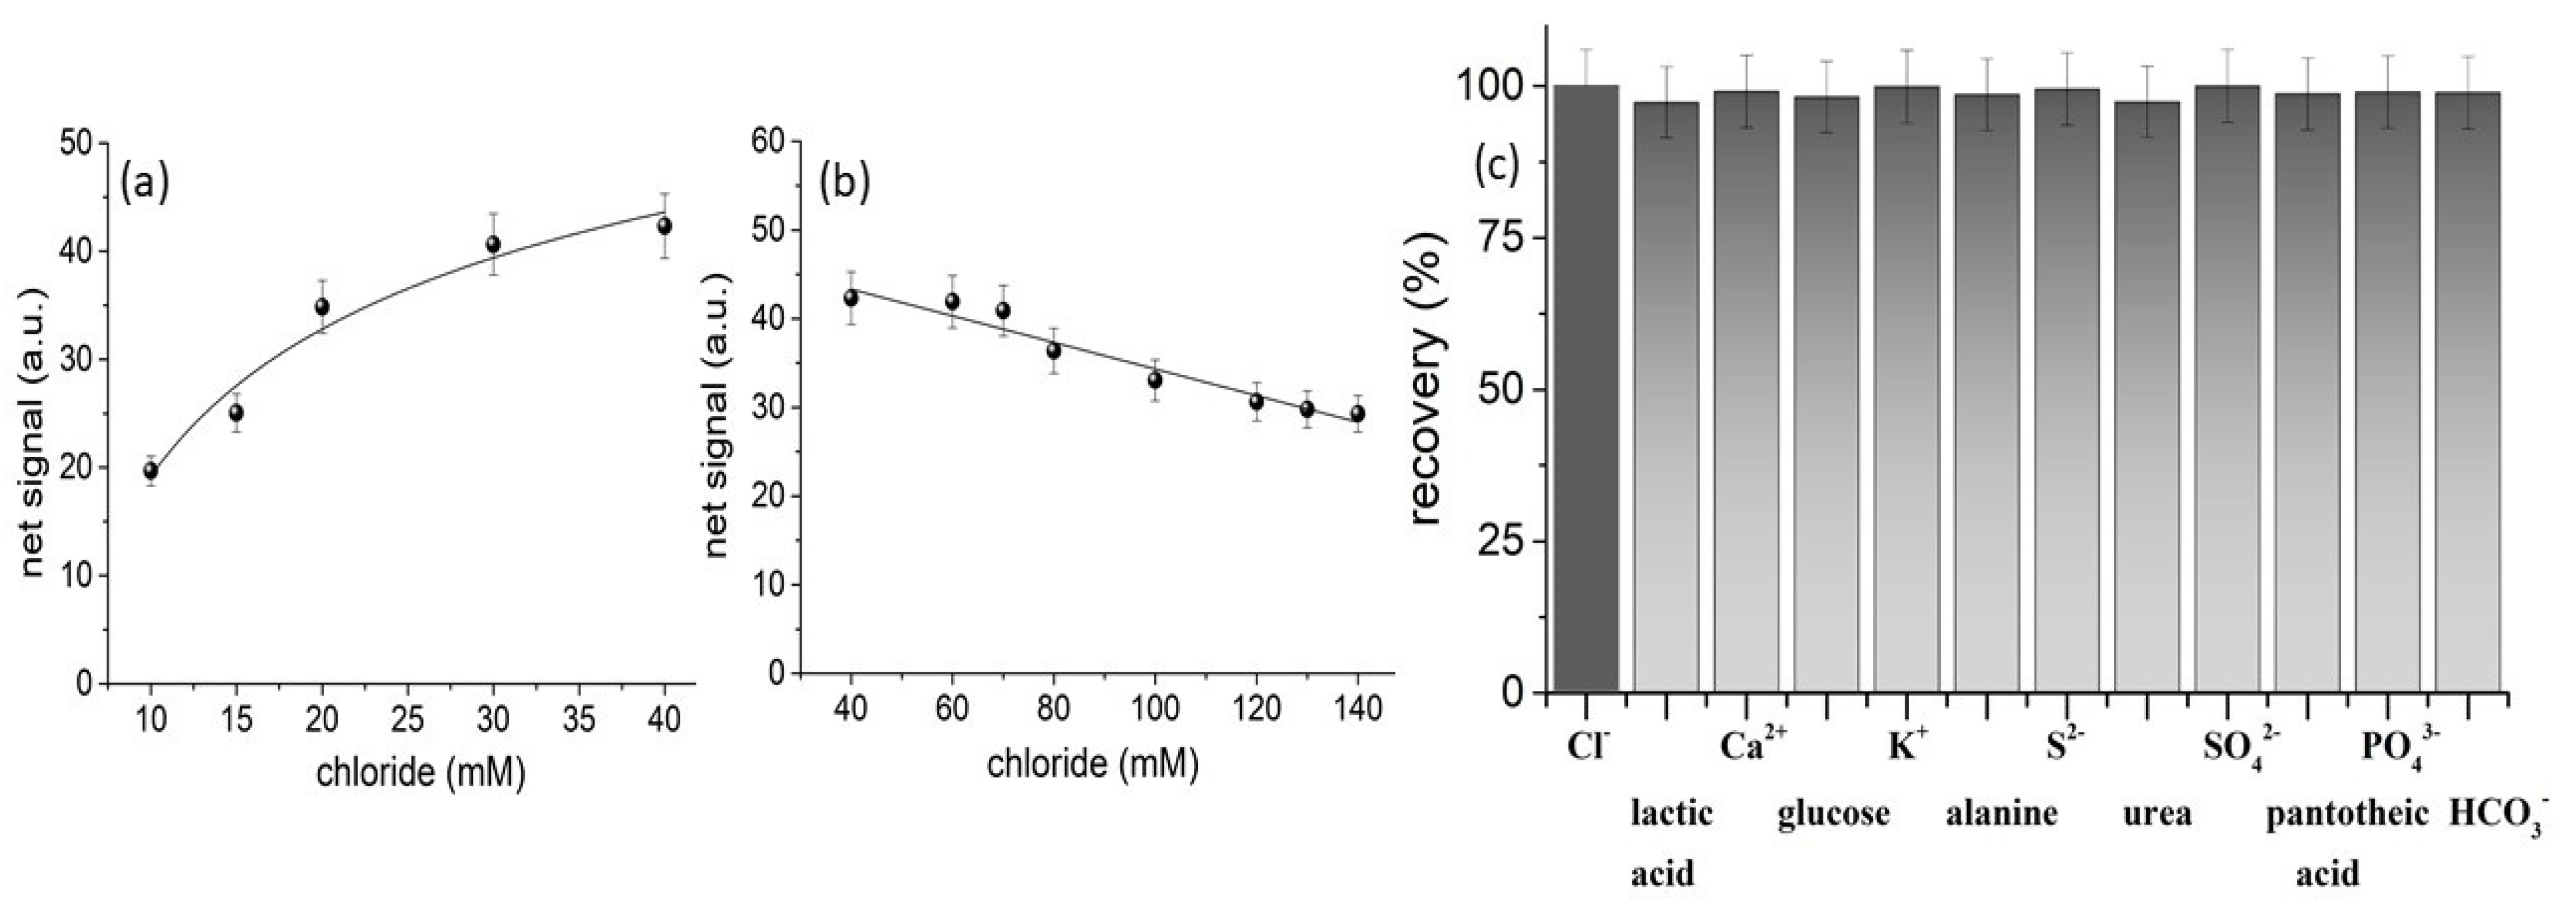
3.3. Analytical Merits and Selectivity

The analytical performance of the assay to the determination of chloride was tested by preparing standard solutions of NaCl at different concentration levels and formulating a calibration curve of the analytical signal (i.e., mean gray intensity of sensing area) vs. the concentration of chloride in the tested solutions. The calibration functions, linearity, precision, and detection limits of the method are summarized in Table 1. The calibration curves of Figure 6a,b show two ranges; a short range from 10 to 40 mM that exhibits a logarithmically increasing signal with chloride concentration and a wider range from 40–140 mM that decreases linearly with chloride concentration. The switching point between the two curves is the chloride concentration of 40 mM which coincides with concentration of silver ions on the paper device (i.e., 40 mM AgNO3). Therefore, the application of the method requires an additional dilution step of the initial sample. If the signal of the diluted sample increases with dilution, then the calibration range from 40–140 mM shall be used. On the other hand, if the signal decreases with dilution, then the first, logarithmic, working range from 10–40 mM shall be used.
This apparently uncommon pattern profile is explained by the size and photosensitivity of AgCl. At low chloride concentrations, small AgCl crystals are formed that have stable {200} faces and are cubic, offering a lower surface area for photoreduction [25]. At high chloride concentrations, AgCl crystals grow in size due to Ostwald’s and coalescence ripening [26,27]. Larger AgCl crystals have {111} faces and octahedral crystal shape [25] and are more sensitive to radiation and are photoreduced much faster than smaller crystals because in large-sized crystals a much larger area is affected [27]. For these reasons, the light intensity on the paper surface gradually becomes darker with increasing chloride concentration above 40 mM concurrently producing a decreasing net signal response.
Finally, we evaluated the selectivity of the paper-based assay by examining the individual interference of major sweat components and by performing matrix-matched calibration in artificial sweat [15]. The recovery of chloride in the presence of each major sweat component at biologically relevant concentration levels in human sweat is depicted in the bar plots of Figure 6c. It is evident that the major sweat components such as amino acids, inorganic ions (i.e., Na+, K+, Ca2+, SO42−, PO43−, and CO32−), and common biomolecules (i.e., glucose, urea, and vitamins) do not interfere with the analytical signal. In addition, the slope of the calibration curves in artificial sweat were 17.8 in the lower concentration range and 0.14 in the higher concentration range, which are almost identical to those obtained in distilled water (Table 1), indicating the lack of interference from the sweat matrix. Based on these results, we concluded that the method offers good selectivity for the analysis of real samples.

3.4. Stability Tests

We tested the stability of the devices under storage by enclosing them in an inert atmosphere (N2) in dark zipper bags containing silica gel packs and kept them in the refrigerator for 1 month. We considered that the devices maintain their stability when the signal intensity does not deviate more than 10% compared to that obtained with newly prepared devices. Under these conditions there was no alteration of the devices for at least 1 month. We believe that longer storage times are feasible since the inert atmosphere, the absence of light and humidity and the cold conditions can deter and significantly slow down the reduction of Ag [28].

3.5. Analysis of Real Samples

The applicability of the method was evaluated by the analysis of artificial sweat with chemical constituents and concentrations that match human sweat [14] as well as by the analysis of real sweat samples that were voluntarily provided by two of our collaborators. In addition, the real samples were spiked with known amount of chloride (as sodium chloride) and analyzed them again to calculate the recovery. Since the samples were provided from healthy volunteers, the chloride levels were below 40 mM which indicates a negative diagnosis for CF. Therefore, spiking was performed at two concentration levels in order to evaluate the accuracy of the method in the intermediate situation which requires further examination and at levels indicating a positive CF diagnosis. The results, summarized in Table 2, show that the method could accurately determine the chloride concentration in artificial sweat. The measured recoveries in real samples lie between 95.2 and 108.7%, indicating the good accuracy of the assay. On the other hand, the precision of the measurements (including both the variability of the method and the device-specific variability) ranged from 5.8–8.8% (average 7%) which is satisfactory. These data agree with previous colorimetric assays performed on paper-based devices which typically display a low level of precision, but relatively good accuracy (provided that several samples are analyzed to average the results) [29,30].

4. Conclusions

In this work, we developed a paper-based device for the determination of chloride in human sweat. The sensing mechanism relies on the different photochemical response of silver and silver halide crystals upon exposure to UV light and uses only one sensing reagent; silver nitrate. Therefore, the device is easy to fabricate for mass production. The method is performed offline using only 2 μL of sample and it is portable (low-cost, hand-held battery-operated UV lamps could be employed). The user has to add the sample, let it dry, irradiate the device, and then measure the signal using inexpensive, ubiquitous electronic imaging devices. Provided that the method undergoes clinical testing and validation, the device holds promise as a preliminary CF diagnosis tool in resource-limited settings, decentralized healthcare units and personalized diagnostics, before resorting to more specialized diagnostic methods. Further work could be devoted to the combined use of silver nitrate with UV-responsive, electron-donor compounds, or nanomaterials in order to enhance the photoreduction of silver ions. Such an approach could increase the sensitivity of the method and enable its application with even smaller sample volumes or reduce the overall analysis time.

Author Contributions

Conceptualization, D.L.G.; Data curation, A.G.V., C.M. and D.L.G.; Investigation, T.G.C., C.M. and A.S.; Methodology, A.G.V. and D.L.G.; Supervision, D.L.G.; Validation, T.G.C., C.M. and A.S.; Writing—original draft, T.G.C., A.S. and A.G.V.; Writing—review and editing, C.M. and D.L.G. All authors have read and agreed to the published version of the manuscript.

Funding

This research was co-financed by Greece and the European Union (European Social Fund- ESF) through the Operational Programme “Human Resources Development, Education and Lifelong Learning 2014-2020” in the context of the project “Development of novel analytical methods and signal transduction techniques for the optical analysis of biomarkers in biological fluids using common imaging devices” (MIS 5047630).

Informed Consent Statement

Informed consent was obtained from all subjects involved in the study.

Conflicts of Interest

The authors declare no conflict of interest. The funders had no role in the design of the study; in the collection, analyses, or interpretation of data; in the writing of the manuscript, or in the decision to publish the results.

References

  1. Scotet, V.; Gutierrez, H.; Farrell, P.M. Newborn Screening for CF across the Globe—Where Is It Worthwhile? Int. J. Neonatal Screen. 2020, 6, 18. [Google Scholar] [CrossRef] [PubMed] [Green Version]
  2. LeGrys, V.A.; Yankaskas, J.R.; Quittell, L.M.; Marshall, B.C.; Mogayzel, P.J. Cystic Fibrosis Foundation Diagnostic sweat testing: the Cystic Fibrosis Foundation guidelines. J. Pediatr. 2007, 151, 85–89. [Google Scholar] [CrossRef]
  3. Collie, J.T.B.; Massie, R.J.; Jones, O.A.H.; LeGrys, V.A.; Greaves, R.F. Sixty-five years since the New York heat wave: Advances in sweat testing for cystic fibrosis. Pediatr. Pulmonol. 2014, 49, 106–117. [Google Scholar] [CrossRef]
  4. DeMarco, M.L.; Dietzen, D.J.; Brown, S.M. Sweating the small stuff: Adequacy and accuracy in sweat chloride determination. Clin. Biochem. 2015, 48, 443–447. [Google Scholar] [CrossRef]
  5. Gokdemir, Y.; Karadag, B.T. Sweat Testing and Recent Advances. Front. Pediatr. 2021, 9, 649904. [Google Scholar] [CrossRef]
  6. Zhang, C.; Kim, J.P.; Creer, M.; Yang, J.; Liu, Z. A smartphone-based chloridometer for point-of-care diagnostics of cystic fibrosis. Biosens. Bioelectron. 2017, 97, 164–168. [Google Scholar] [CrossRef] [PubMed]
  7. Wang, J.; Wu, X.; Chon, C.; Gonska, T.; Li, D. A novel device for quantitative measurement of chloride concentration by fluorescence indicator. Meas. Sci. Technol. 2012, 23, 025701. [Google Scholar] [CrossRef]
  8. Mu, X.; Xin, X.; Fan, C.; Li, X.; Tian, X.; Xu, K.-F.; Zheng, Z. A paper-based skin patch for the diagnostic screening of cystic fibrosis. Chem. Commun. 2015, 51, 6365–6368. [Google Scholar] [CrossRef] [PubMed]
  9. De Matteis, V.; Cannavale, A.; Blasi, L.; Quarta, A.; Gigli, G. Chromogenic device for cystic fibrosis precocious diagnosis: A “point of care” tool for sweat test. Sens. Actuators B Chem. 2016, 225, 474–480. [Google Scholar] [CrossRef]
  10. Cinti, S.; Fiore, L.; Massoud, R.; Cortese, C.; Moscone, D.; Palleschi, G.; Arduini, F. Low-cost and reagent-free paper-based device to detect chloride ions in serum and sweat. Talanta 2018, 179, 186–192. [Google Scholar] [CrossRef] [PubMed]
  11. Taghizadeh-Behbahani, M.; Hemmateenejad, B.; Shamsipur, M.; Tavassoli, A. A paper-based length of stain analytical device for naked eye (readout-free) detection of cystic fibrosis. Anal. Chim. Acta 2019, 1080, 138e145. [Google Scholar] [CrossRef]
  12. Rock, M.J.; Makholm, L.; Eickhoff, J. A new method of sweat testing: The CF Quantum® sweat test. J. Cyst. Fibros. 2014, 13, 520–527. [Google Scholar] [CrossRef] [PubMed] [Green Version]
  13. Rock, M.; LeGrys, V. The CF quantum sweat test: Not ready for clinical use. Am. Soc. Clin. Lab. Sci. 2020, 30, ascls-119. [Google Scholar] [CrossRef] [Green Version]
  14. Kappi, F.A.; Tsogas, G.Z.; Routsi, A.-M.; Christodouleas, D.C.; Giokas, D.L. Paper-based devices for biothiols sensing using the photochemical reduction of silver halides. Anal. Chim. Acta 2018, 1036, 89–96. [Google Scholar] [CrossRef] [PubMed]
  15. Harvey, C.J.; LeBouf, R.F.; Stefaniak, A.B. Formulation and stability of a novel artificial human sweat under conditions of storage and use. Toxicol. Vitr. 2010, 24, 1790–1796. [Google Scholar] [CrossRef]
  16. Choi, M.; Shin, K.-H.; Jang, J. Plasmonic photocatalytic system using silver chloride/silver nanostructures under visible light. J. Colloid Interface Sci. 2010, 341, 83–87. [Google Scholar] [CrossRef]
  17. Marchetti, A.P.; Eachus, R.S. The Photochemistry and Photophysics of the Silver Halides. In Advances in Photochemistry; Volman, D.H., Hammond, G.S., Neckers., D.C., Eds.; John Wiley and Sons: Hoboken, NJ, USA, 2007. [Google Scholar] [CrossRef]
  18. Bjelkhagen, H.I. Silver-Halide Recording Materials; Springer Series in Optical Sciences; Springer: Berlin/Heidelberg, Germany, 1995; Volume 66, ISBN 9783540586197. [Google Scholar]
  19. Funke, K. Solid State Ionics: From Michael Faraday to green energy—The European dimension. Sci. Technol. Adv. Mater. 2013, 14, 043502. [Google Scholar] [CrossRef] [PubMed] [Green Version]
  20. Brewer, P.; Brown, R. Effect of Structural Design of Silver/Silver Chloride Electrodes on Stability and Response Time and the Implications for Improved Accuracy in pH Measurement. Sensors 2009, 9, 118–130. [Google Scholar] [CrossRef]
  21. Hudson, R.A.; Farlow, G.C.; Slifkin, L.M. Individual formation parameters of charged point defects in ionic crystals: Silver chloride. Phys. Rev. B 1987, 36, 4651–4659. [Google Scholar] [CrossRef] [PubMed]
  22. Glaus, S.; Calzaferri, G. The band structures of the silver halides AgF, AgCl, and AgBr: A comparative study. Photochem. Photobiol. Sci. 2003, 2, 398. [Google Scholar] [CrossRef]
  23. Allen, E.; Triantaphillidou, S. (Eds.) The Manual of Photography and Digital Imaging; Routledge: Abingdon, UK, 2012; ISBN 9780080926803. [Google Scholar]
  24. Trivelli, A.P.H.; Sheppard, S.E. On the Visible Decomposition of Silver Halide Grains by Light. J. Phys. Chem. 1925, 29, 1568–1582. [Google Scholar] [CrossRef]
  25. Hamilton, J.F. Conventional Photographic Materials. In Handbook of Imaging Materials; Diamond, A.S., Weiss, D.S., Eds.; CRC Press: Boca Raton, FL, USA, 2018; ISBN 9780367396572. [Google Scholar]
  26. Fujita, S. Organic Chemistry of Photography; Springer: Berlin/Heidelberg, Germany, 2004; ISBN 9783642059025. [Google Scholar]
  27. Kappi, F.A.; Papadopoulos, G.A.; Tsogas, G.Z.; Giokas, D.L. Low-cost colorimetric assay of biothiols based on the photochemical reduction of silver halides and consumer electronic imaging devices. Talanta 2017, 172, 15–22. [Google Scholar] [CrossRef] [PubMed]
  28. Fischer, G. Stabilizers for Photographic Silver Halide Emulsions: Progress in Chemistry and Application; Springer: Boston, MA, USA, 2004; ISBN 9781461347965. [Google Scholar]
  29. Chaplan, C.A.; Mitchell, H.T.; Martinez, A.W. Paper-based standard addition assays. Anal. Methods 2014, 6, 1296–1300. [Google Scholar] [CrossRef] [Green Version]
  30. Giannoulas, G.; Tsogas, G.Z.; Giokas, D.L. Single-point calibration and standard addition assays on calibrant-loaded paper-based analytical devices. Talanta 2019, 201, 149–155. [Google Scholar] [CrossRef]
Figure 1. Greyscale transitions on paper devices containing AgNO3 and AgCl (a) before and (b) after exposure to UV light (40 mM AgNO3, 50 mM NaCl, optimum irradiation conditions, as defined in the text. The devices shown in the photographs are not at real scale.
Chemosensors 09 00286 g001
Figure 2. UV–Vis diffuse-reflectance spectra (Kubelka–Munk transformed diffuse reflectance spectra) of paper devices containing AgNO3 (blank) and AgCl (sample). Experimental conditions: AgNO3 40 mM, NaCl 50 mM, optimum irradiation conditions, as defined in the text.
Chemosensors 09 00286 g002
Figure 3. pXRD pattern of AgNO3 and AgCl (40 mM AgNO3, 50 mM NaCl) before and after exposure to UV light under the optimum irradiation conditions, as defined in the text.
Chemosensors 09 00286 g003
Figure 4. SEM images of the paper devices containing AgCl (40 mM AgNO3, 50 mM NaCl) before and after exposure to UV light under the optimum irradiation conditions, as defined in the text.
Chemosensors 09 00286 g004
Figure 5. Optimization of experimental parameters. (a) Effect of AgNO3 concentration, (b) optimization of light intensity, (c) optimization of irradiation time as a function of wavelength, and (d) influence of incubation time (before exposure to UV light). Error bars represent the standard deviation from triplicate measurements on different devices.
Chemosensors 09 00286 g005
Figure 6. Calibration plot for chloride concentrations (a) 10–40 mM and (b) 40–140 mM. Data points represent the average values from triplicate measurements on different devices. (c) Selectivity against major sweat constituents at biologically relevant concentration levels (lactic acid 1.4 × 10⁻² M, Ca2+ 5.2 × 10⁻³ M, glucose 1.7 × 10⁻⁴ M, K+ 6.1 × 10⁻³ M, alanine 3.6 × 10⁻⁴ M, sulfur 2.3 × 10⁻³ M, urea 1.0 × 10⁻² M, SO42- 4.2 × 10⁻⁴ M, pantothenic acid 1.3 × 10⁻¹ M, PO43− 3.1 × 10⁻⁴ M, and NO3 3.0 × 10⁻³ M) [15].
Chemosensors 09 00286 g006
Table 1. Analytical figures of merit of the assay.
Calibration Range (mM)Calibration FunctionR2RSD (%, n = 5)LOD (mM) a
Chloride10–40y = 17.5 lnx − 20.40.975.81 (20 mM)2.7
40–140y = −0.15 x + 49.60.966.34 (50 mM)-
Chemosensors 09 00286 i001
a LOD = 3S/N.
Table 2. Results from the analysis of real samples and recoveries from spiked samples.
SampleChloride
(mM)
Spiked
(mM)
Found
(mM)
Recovery (%)RSD
(%, n = 5)
Artificial sweat23.00.024.5106.56.4
10.031.794.36.9
40.063.5102.15.8
Sweat 131.520.050.095.27.1
40.073.0104.78.8
Sweat 227.620.049.0105.16.7
40.070.0108.77.8
Publisher’s Note: MDPI stays neutral with regard to jurisdictional claims in published maps and institutional affiliations.

