Communication

Concentration-Dependent Fluorescence Emission of Quercetin

by
Tatiana Prutskij
1,*,
Alexandra Deriabina
2,
Francisco J. Melendez
3,
María Eugenia Castro
1,
Leticia Castillo Trejo
1,
German D. Vazquez Leon
2,
Eduardo Gonzalez
2 and
Tatiana S. Perova
4,*
1
Sciences Institute, Autonomous University of Puebla (BUAP), Puebla 72570, Mexico
2
Faculty of Physical and Mathematical Sciences, Autonomous University of Puebla (BUAP), Puebla 72570, Mexico
3
Faculty of Chemical Sciences, Autonomous University of Puebla (BUAP), Puebla 72570, Mexico
4
School of Engineering, Trinity College Dublin, The University of Dublin, D02 PN40 Dublin, Ireland
*
Authors to whom correspondence should be addressed.
Submission received: 11 October 2021 / Revised: 2 November 2021 / Accepted: 4 November 2021 / Published: 7 November 2021

Abstract

:
Quercetin (Q) is an important antioxidant with high bioactivity and the potential of being used as SARS-CoV-2 inhibitor. The fluorescence (FL) emission from Q solutions made with different polar and non-polar solvents (methanol, acetone, and chloroform) was measured and compared with the FL emission from Q powder and from Q crystals. In the FL spectra of the solutions with high Q concentration, as well as in the spectra of Q in solid state, two features, at 615 nm and 670 nm, were observed. As the solution concentration decreases, the intensity of those peaks decreases and a peak at 505 nm arises. The FL emission of low concentration solutions displayed only that peak. Calculations for the Q molecule in each solvent, performed using time-dependent density functional theory (TDDFT), show that the emission at 505 nm is associated with the excited state intramolecular proton transfer (ESIPT) of the –OH3 group proton. Our calculations also show that the feature at 615 nm, which is observed in solid state Q and also in the emission of the high concentrated solutions, is related to the –OH5 proton transfer.

1. Introduction

Flavonoids are substances with numerous useful nutritional and pharmaceutical properties. Quercetin (Q), one of the most abundant flavonoids in nature, has been in the spot of numerous experimental and theoretical studies in the past decade due to its great biological and medical importance [1,2]. It has been known for antiviral activity, anti-inflammatory effects [3], cardiovascular protection [4], and even for some anti-cancer properties [5]. It was recently shown that flavonoids, including Q, can be used as the SARS-CoV inhibitory compounds with a wide range of inhibitory activity [6,7,8]. On the other hand, significant attention has been paid to the photophysical properties of Q, in particular to the dual FL emission due to the excited state intramolecular proton transfer (ESIPT) and its enhancement in aggregated state, known as aggregation-induced emission (AIE) [9]. Due to that, natural flavonoids, as well as Q, are considered valuable fluorescent sensors for chemical detection and biological sensing [10,11].
The summary of the sensor applications of flavonoids, including Q, can be found in the recent review [9]. However, there have been a few studies on the concentration dependence of the fluorescence (FL) emission of Q. To our knowledge, only one study [12] of the FL spectra dependence on Q concentration in tetrahydrofuran solvent was published, and only for Q concentrations less than 30 µM. In this work we present the dependence of the FL emission spectra of Q on the concentration in different solvents (methanol, acetone, and chloroform) together with the FL spectra obtained from solid state phase of Q. Our results show that the changes in the FL spectra are much stronger due to the aggregation effects that have been reported previously in Ref. [12]. We also present the computational results of the FL emission obtained using TDDFT/M06-2X/6-31G++(d,p) level of theory for these three solvents, obtaining a good agreement with our experimental findings.

2. Materials and Methods

2.1. Experimental Setup

The FL emission was recorded on a conventional experimental set-up, including a TRIAX550 monochromator, and a liquid-nitrogen-cooled charge-coupled-device (CCD) detector. Optical excitation was provided by a laser diode with a wavelength of 405 nm or by a solid-state laser with a wavelength of 532 nm. To avoid degradation, a low excitation light intensity of approximately 5 mW was used in all measurements.
Quercetin anhydrous (Q4951 powder with 95% purity) have been acquired from the Sigma-Aldrich. Methanol (>99.5%), acetone (>99.60%), and chloroform (>99.8%) were purchased from J. T. Baker.

2.2. Computational Details

The density functional theory (DFT) [13] method was used for full geometry optimization and for vibrational frequency calculations to assure the minimum on the potential energy surface of the Q molecule, while for excited states computation and their corresponding vibrational frequencies, the time dependent DFT (TDDFT) [14] approach was used, by means of the Minnesota functional M06-2X [15] and 6-31++G(d,p) basis set [16,17,18], including polarization and diffuse functions implemented in Gaussian 09 [19]. The influence of the solvents (methanol, acetone, chloroform) to the FL emission wavelength was simulated by using the polarizable continuum model (PCM) within self-consistent reaction field (SCRF) method [20].

3. Results and Discussion

3.1. FL Spectra of Q in Solutions

Solubility is a very important property of any flavonoid since it significantly influences their bioactivity. The solubility rate characterizes the intermolecular interactions and depends on the specific solvent. To clarify the role of the solvent in the molecules’ dispersion, three representative solvents were chosen: methanol as a protic polar, acetone as an aprotic polar, and chloroform as non-polar solvent. Of those three solvents, methanol has the highest rate of dissolution, in contrast with the solubility of Q in chloroform, which was found to be much lower. Moreover, it takes some amount of time to dissolve Q molecules in any solvent. In several previous publications [21,22] we have found that the FL spectra were measured on “fresh” solutions of Q in methanol. Although authors of those studies put emphasis in that aspect, they did not report any details of the solution preparation procedure. However, our experience of preparing Q solutions show that some considerable time, from 3 to 30 days is needed to reach the dissolution of the corresponding Q powder amount. That time can be even longer if the solubility is low. In that case, the use of a higher temperature of 40–50 °C is needed in order to increase the dissolution velocity.
Solubility of Q in chloroform showed to be very low, and, therefore, preparation of the solutions of Q in chloroform has lasted a long time. As far as we know, there is no bibliographic data on the solubility of Q in chloroform, thus, we have started from a saturated solution, for which the amount of approximately 1 mg of Q powder for 10 mL of chloroform was used. To reach the Q dissolution, that solution was first heated to approximately 40 °C and then was left for the time of approximately 4–5 weeks. Then, only the saturated solution from the top of the volume, avoiding the solid particles from the bottom was used. Concentration of that solution was reduced step by step until it was as low as possible, i.e., until the FL emission intensity was yet high enough to be measured.
In Figure 1, FL spectra of Q solutions with different concentrations in three different solvents are shown. The emission spectra of all Q solutions with a highest concentration have a dominant peak at 670 nm. The spectra of methanol and acetone solutions also display a shoulder at 615 nm. The spectrum of high-concentrated chloroform solution is wide and thus includes the feature at 615 nm. In the emission spectra of the solutions with lower concentrations, another peak at lower wavelength is also observed. In addition, the full width at half maximum (FWHM) of the spectra decreases when the solution concentration decreases. Thus, Figure 1 shows that when the concentration decreases to the certain value, only the peak at 505 nm is observed, and then, the lower the Q concentration the smaller the FL peak intensity, while the shape of the spectrum does not change significantly. Moreover, comparing the spectra of the solutions with different Q concentrations, it can be seen that the shift of the maximum of the FL spectrum toward shorter wavelength is due to the redistribution of the FL emission intensity between different peaks: the intensity of the peak at 670 nm decreases, while the intensity of peak at 505 nm increases when the solution concentration is reduced.
It can be seen also that the same change of the FL spectra with Q concentration is observed in the solutions made with polar, protic and aprotic, or with non-polar solvent. Besides, the emission spectra of the Q solutions in different solvents contain the same features and, thus, no dependence of the characteristic emission wavelengths on the solvent type is observed.
There are a small number of previous studies reporting measurements of the FL spectra of Q solutions. However, in Ref. [23] the FL spectrum of Q solution in methanol with the concentration of 50 µM have been shown. The excitation wavelength in that study was of 350 nm. That spectrum had two maxima at approximately 450 and 530 nm. In our measurements, the spectrum of the Q solution in methanol with the similar concentration has only one maximum at 505 nm. This is probably due to the fact that a different excitation wavelength (405 nm) was used in our study. Another possible reason for that discrepancy is that the measured solution of Q in the methanol [23] was relatively fresh and the Q molecules were yet not dissipated. Unfortunately, the data about the time between the solution preparation and its measurement was absent in that reference.

3.2. FL Spectra of Q in the Solid State

Crystals of Q were grown from its saturated solutions in methanol and in acetone by slow evaporation at room temperature. The images of grown crystals obtained from scanning electron microscope (SEM) are shown in Figure 2. The crystals grown from Q solutions in different solvents had the same size and the same morphology of needle-like crystals.
The FL spectra of Q crystals were measured and compared with that of the powder. Q powers were measured as such received from supplier, i.e., without any additional treatment.
Figure 3 shows the FL emission spectra of Q crystal and Q powder measured using two different excitation wavelengths. The FL spectra from Q crystal and Q powder excited by the laser line of 405 nm are broad and have the same spectral maximum position at approximately 615 nm. To reveal the fine structure of the emission spectra, the FL emission from the Q crystal at low temperature was measured. In Figure 3 the FL spectra obtained from the Q crystal at 300 K and 10 K are shown. At low temperature, the position of the FL spectrum maximum is slightly blue-shifted and has practically the same FWHM value, which indicates that the kinetic energy of the molecule does not affect the parameters of the emission spectra. Nevertheless, we were able to reveal the fine structure of the FL spectrum by changing the excitation wavelength. The FL emission spectrum excited by 532 nm contains two features, at 615 nm and at 670 nm, whereas the spectrum of the emission excited by 405 nm has a greater value of the FWHM, and thus can be seen as the result of addition of that two features with smaller values of the FWHM, i.e., the sum of two peaks gives only one wide peak with the maximum at 615 nm. Moreover, the same peaks were observed in the emission spectra of the solutions with high Q concentration.

3.3. Computation of FL Characteristic Wavelengths

For theoretical part of the study, the functional M06-2X was selected as one capable to reproduce the non-planarity of the Q molecule. The importance of the non-planarity for the FL emission in flavonoids was described in Ref. [9]. Furthermore, this functional describes correctly non-covalent interactions [15], such as hydrogen bonds (H-bonds) that can be formed in Q molecule.
The structure of the molecule of Q (3,3′,4′,5,7-pentahydroxyflavone) is shown in Figure 4. The Q molecule has two co-planar rings, A and C, and a B-ring, which can be rotated around the C2–C1 single bond. Five hydroxyl groups can take different possible orientations forming up to 48 different conformers. Each hydroxyl group has two orientations (rotating 180° around the C–O bond) arising thus, 25 possible arrangements of five OH group positions for each “anti” and “syn” positions of B ring (as it was defined in Ref. [24]) giving a number of 64 possibilities. However, 16 conformers are excluded because of steric hinderance between H3′ and H4′ when facing each other, leaving a total of 48 conformers. Our analysis performed using M06-2X/6-31++G(d,p) functional, shows that the conformation corresponding to the minimum energy of the Q molecule (Q_M enol form) in vacuum is that shown in Figure 4a. On other hand, Figure 4b shows another considered Q molecule conformer (Q_A enol form) that was obtained from the diffraction data for anhydrous Q crystal [25].
There are three intra-molecular H-bonds in the Q_M, enol form: O3-H3…O4 and O5-H5…O4 in the double A-C ring, and O4′-H4′…O3′ in the B-ring (see Figure 4a). Whereas the Q_A enol form has one H-bond less, since the H3 hydrogen is rotated off the plane of the molecule forming the H-bond with the adjacent Q molecule in the Q crystal arrangement (see Figure 4b).
The transfer of proton has been proposed as an explanation for the FL emission for flavonoids, including Q, in Ref. [22]. The red-shifted wavelength of the “double emission” observed in that study has been attributed to the “excited state intramolecular proton transfer” (ESIPT), in particular, on the –OH3 group proton transfer [26,27]. Solvent effect on ESIPT in a number of solvents was studied in Ref. [28] for the 2-(2-hydroxyphenyl) benzothiazole molecule. On the other hand, the FL emission of Q molecule have been studied in the dichloromethane solvent using TDDFT-B1B95/6-31G(d,p) [29]. In that study the emission wavelengths of 566 and 593 nm were obtained for –OH3 and –OH5 groups’ proton transfers, respectively. However, until now there were no computational studies made for Q in other solvents.
The terms “keto” for the tautomer with transferred proton, and “enol” for the Q molecule in its normal form were introduced by Yang et. al. [29]. We will use these terms, specifying “keto OH3” and “keto OH5” for the –OH3 and –OH5 transfers. The keto tautomers for Q_M and Q_A conformers are shown in Figure 5.
In Table 1 our results of calculations of absorption and emission wavelengths for the enol Q_M and Q_A conformers (see Figure 4) and for the three keto forms (Figure 5) are shown.
Our computational results for Q_M enol form in different solvents show that using the 405 nm laser-line for the excitation, we cannot detect the FL emission (λab is 329 nm, λem changes from 381 to 388 nm). Both keto forms of the Q_M conformer are stable in the excited state, S1, for all three solvents. In the ground state, S0, only the keto OH3 form has a local minimum, thus, to estimate the wavelength of absorption due to the keto OH5 transition, the restriction on H5 proton position was imposed for the ground state (corresponding values in the Table 1 are shown in cursive). Computation of the Q_M keto OH3 absorption displays values from 415 to 424 nm, while our estimation for the absorption due to the keto OH5 transition shows the values from 397 to 405 nm, and thus, both can be excited by the laser-line of 405 nm.
The calculated emission wavelengths for all the considered solvents are very close to each other for both Q_M keto tautomers: 485–487 nm for the keto OH3 and 551–558 nm for the keto OH5. This is consistent with our findings that for all the used solvents the FL emission peaks observed experimentally on the Q solutions with low concentration have the same spectral positions. The oscillator strength (fem) for the –OH5 transition related to the FL emission is almost a half (0.41 in average) of that related with the –OH3 transition (0.76 in average), thus, the probability to observe the FL emission due to the keto OH3 transition is greater than that of the keto OH5. The measured FL peaks are wide indicating the FL emission has several components, therefore, the emission line with the maximum at approximately 550 nm corresponding to the keto OH5 transition, is probably also present in the spectra, but this emission line could be covered by peaks having higher intensity. On the other hand, for calculations of the FL absorption and emission wavelengths for Q in solid state, the optimized molecule geometry starting from the configuration Q_A enol form shown in Figure 4b was used. The results show that during the geometry optimization of Q_A enol form in the first excited state S1 in vacuum, the spontaneous H5 proton transition toward O4 oxygen takes place, originating thus the FL emission with the spectral maximum at 630 nm due to Q_A keto OH5. This value is in a good agreement with the spectral feature at 615 nm experimentally observed in Q solid state. The fact that this feature was also observed in high concentration solutions points to the presence of undissolved clusters of Q molecules.

4. Conclusions

We can summarize our findings as follows:
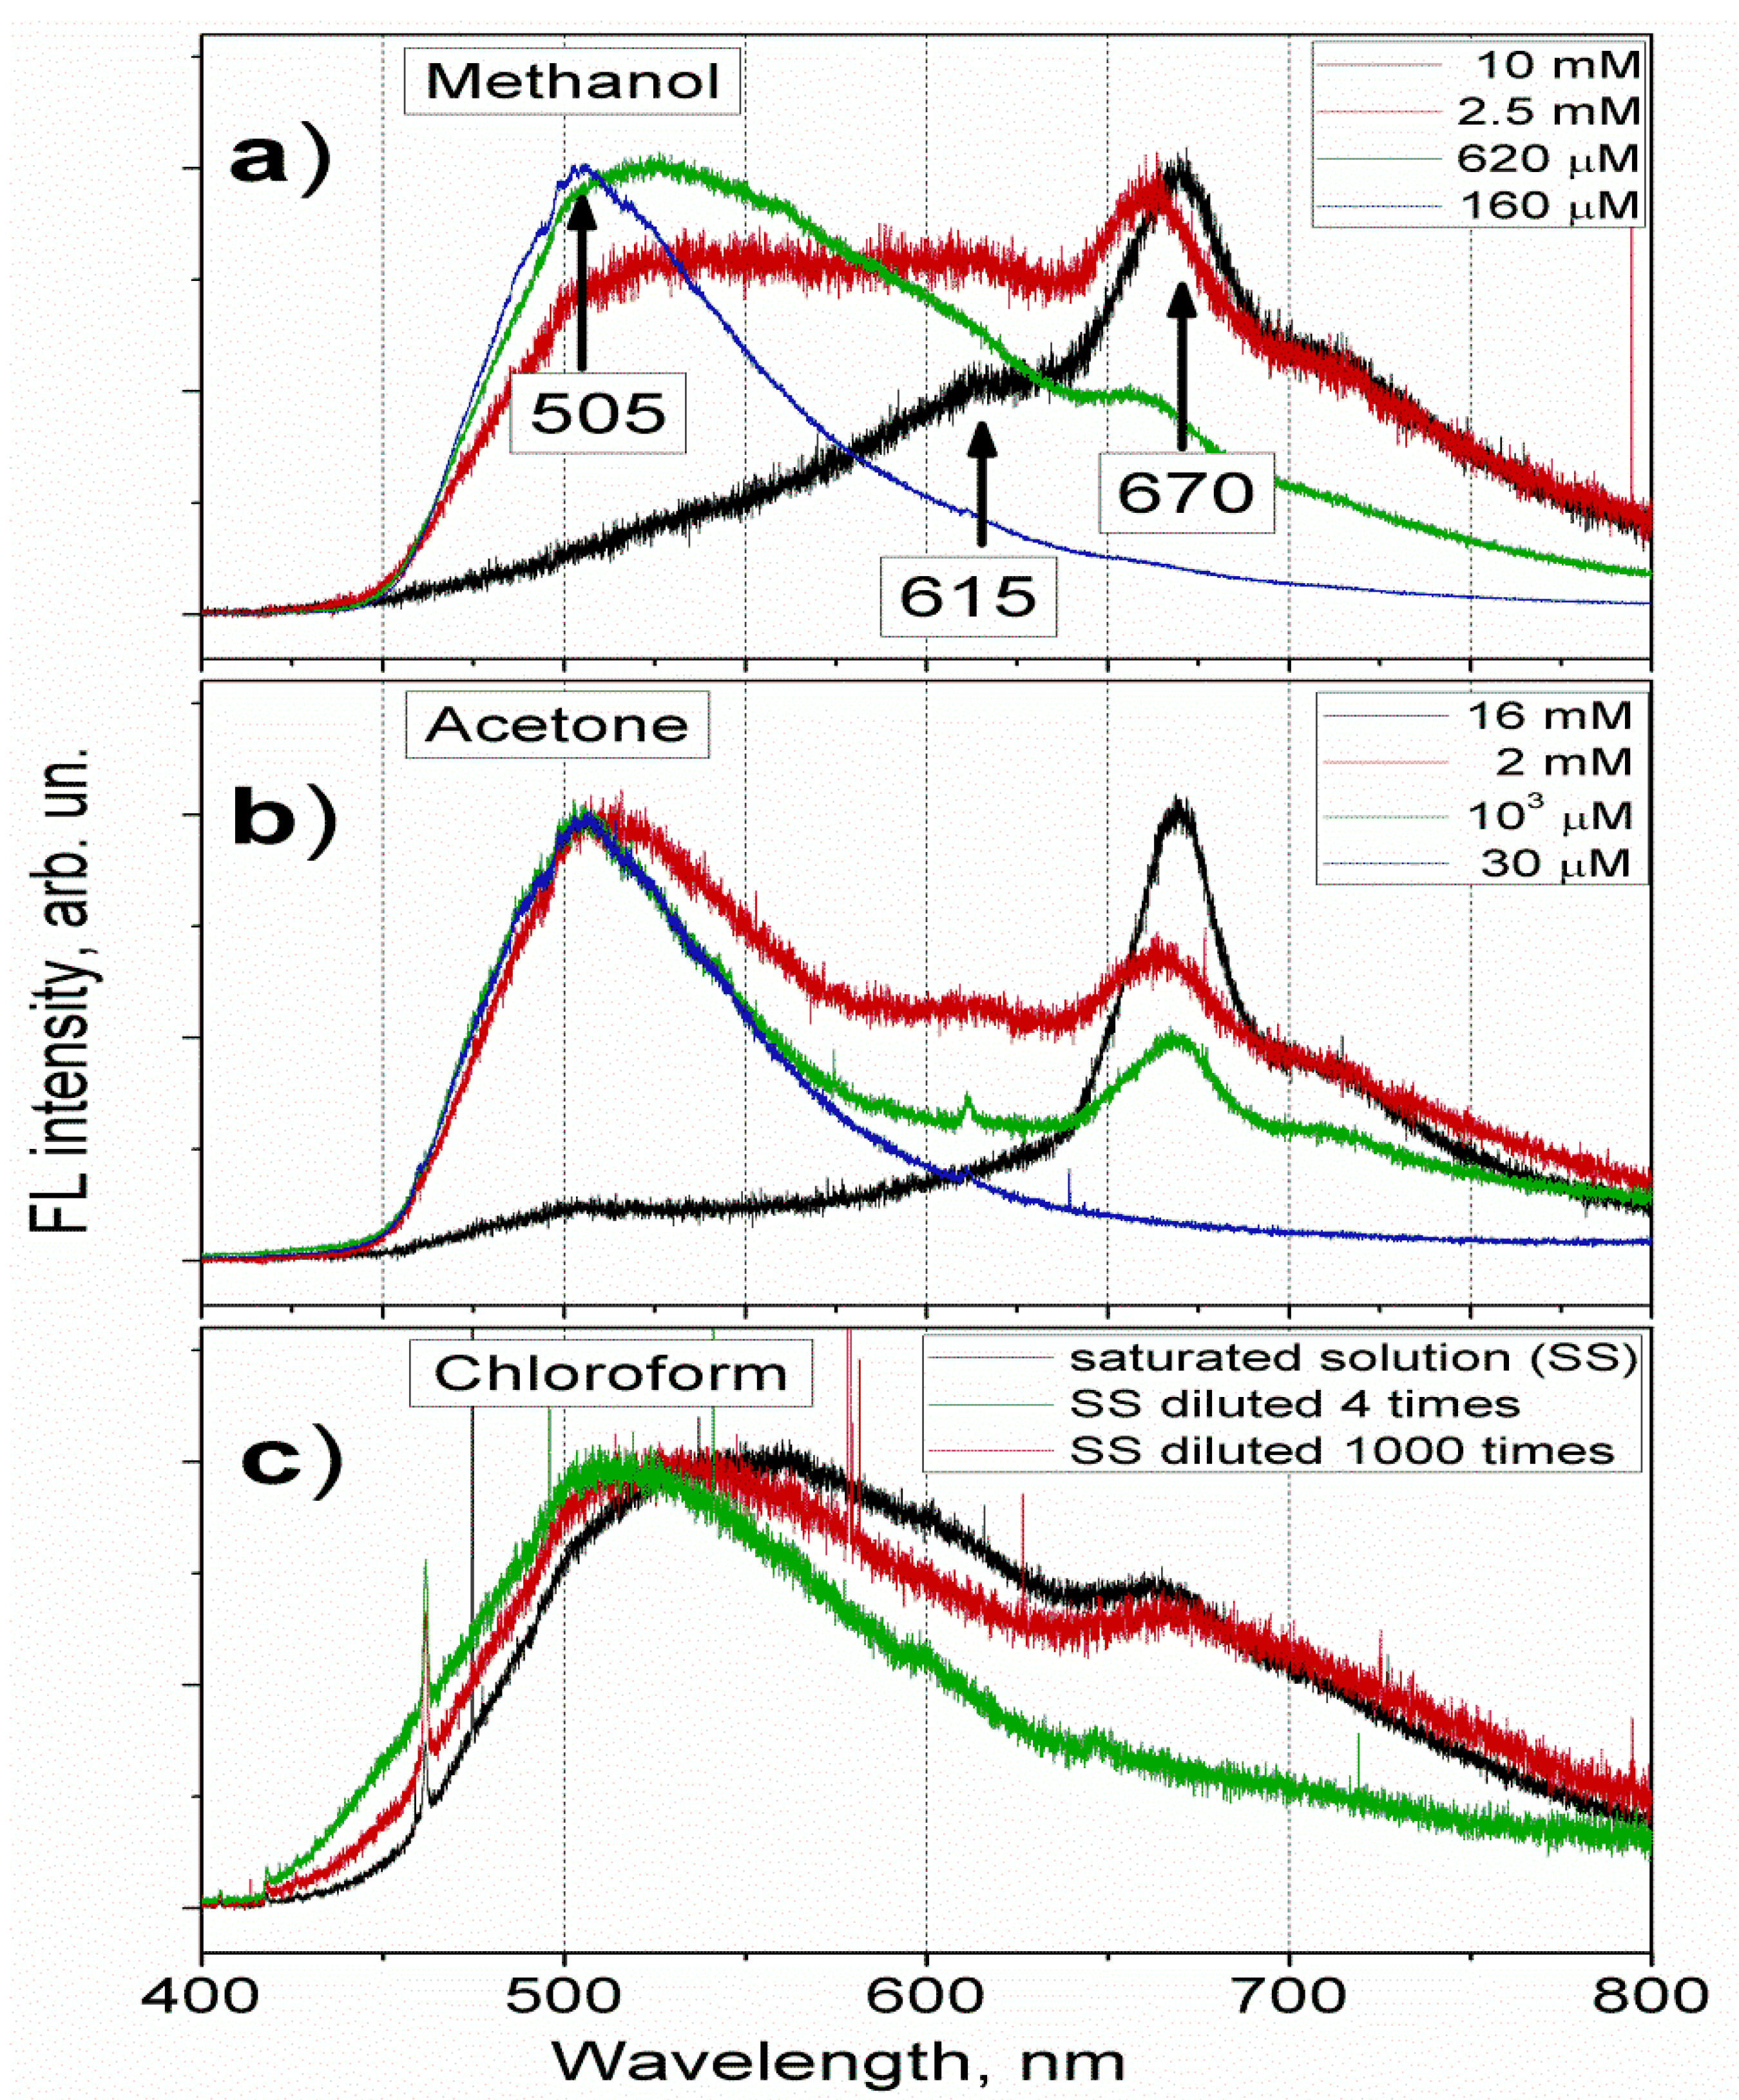
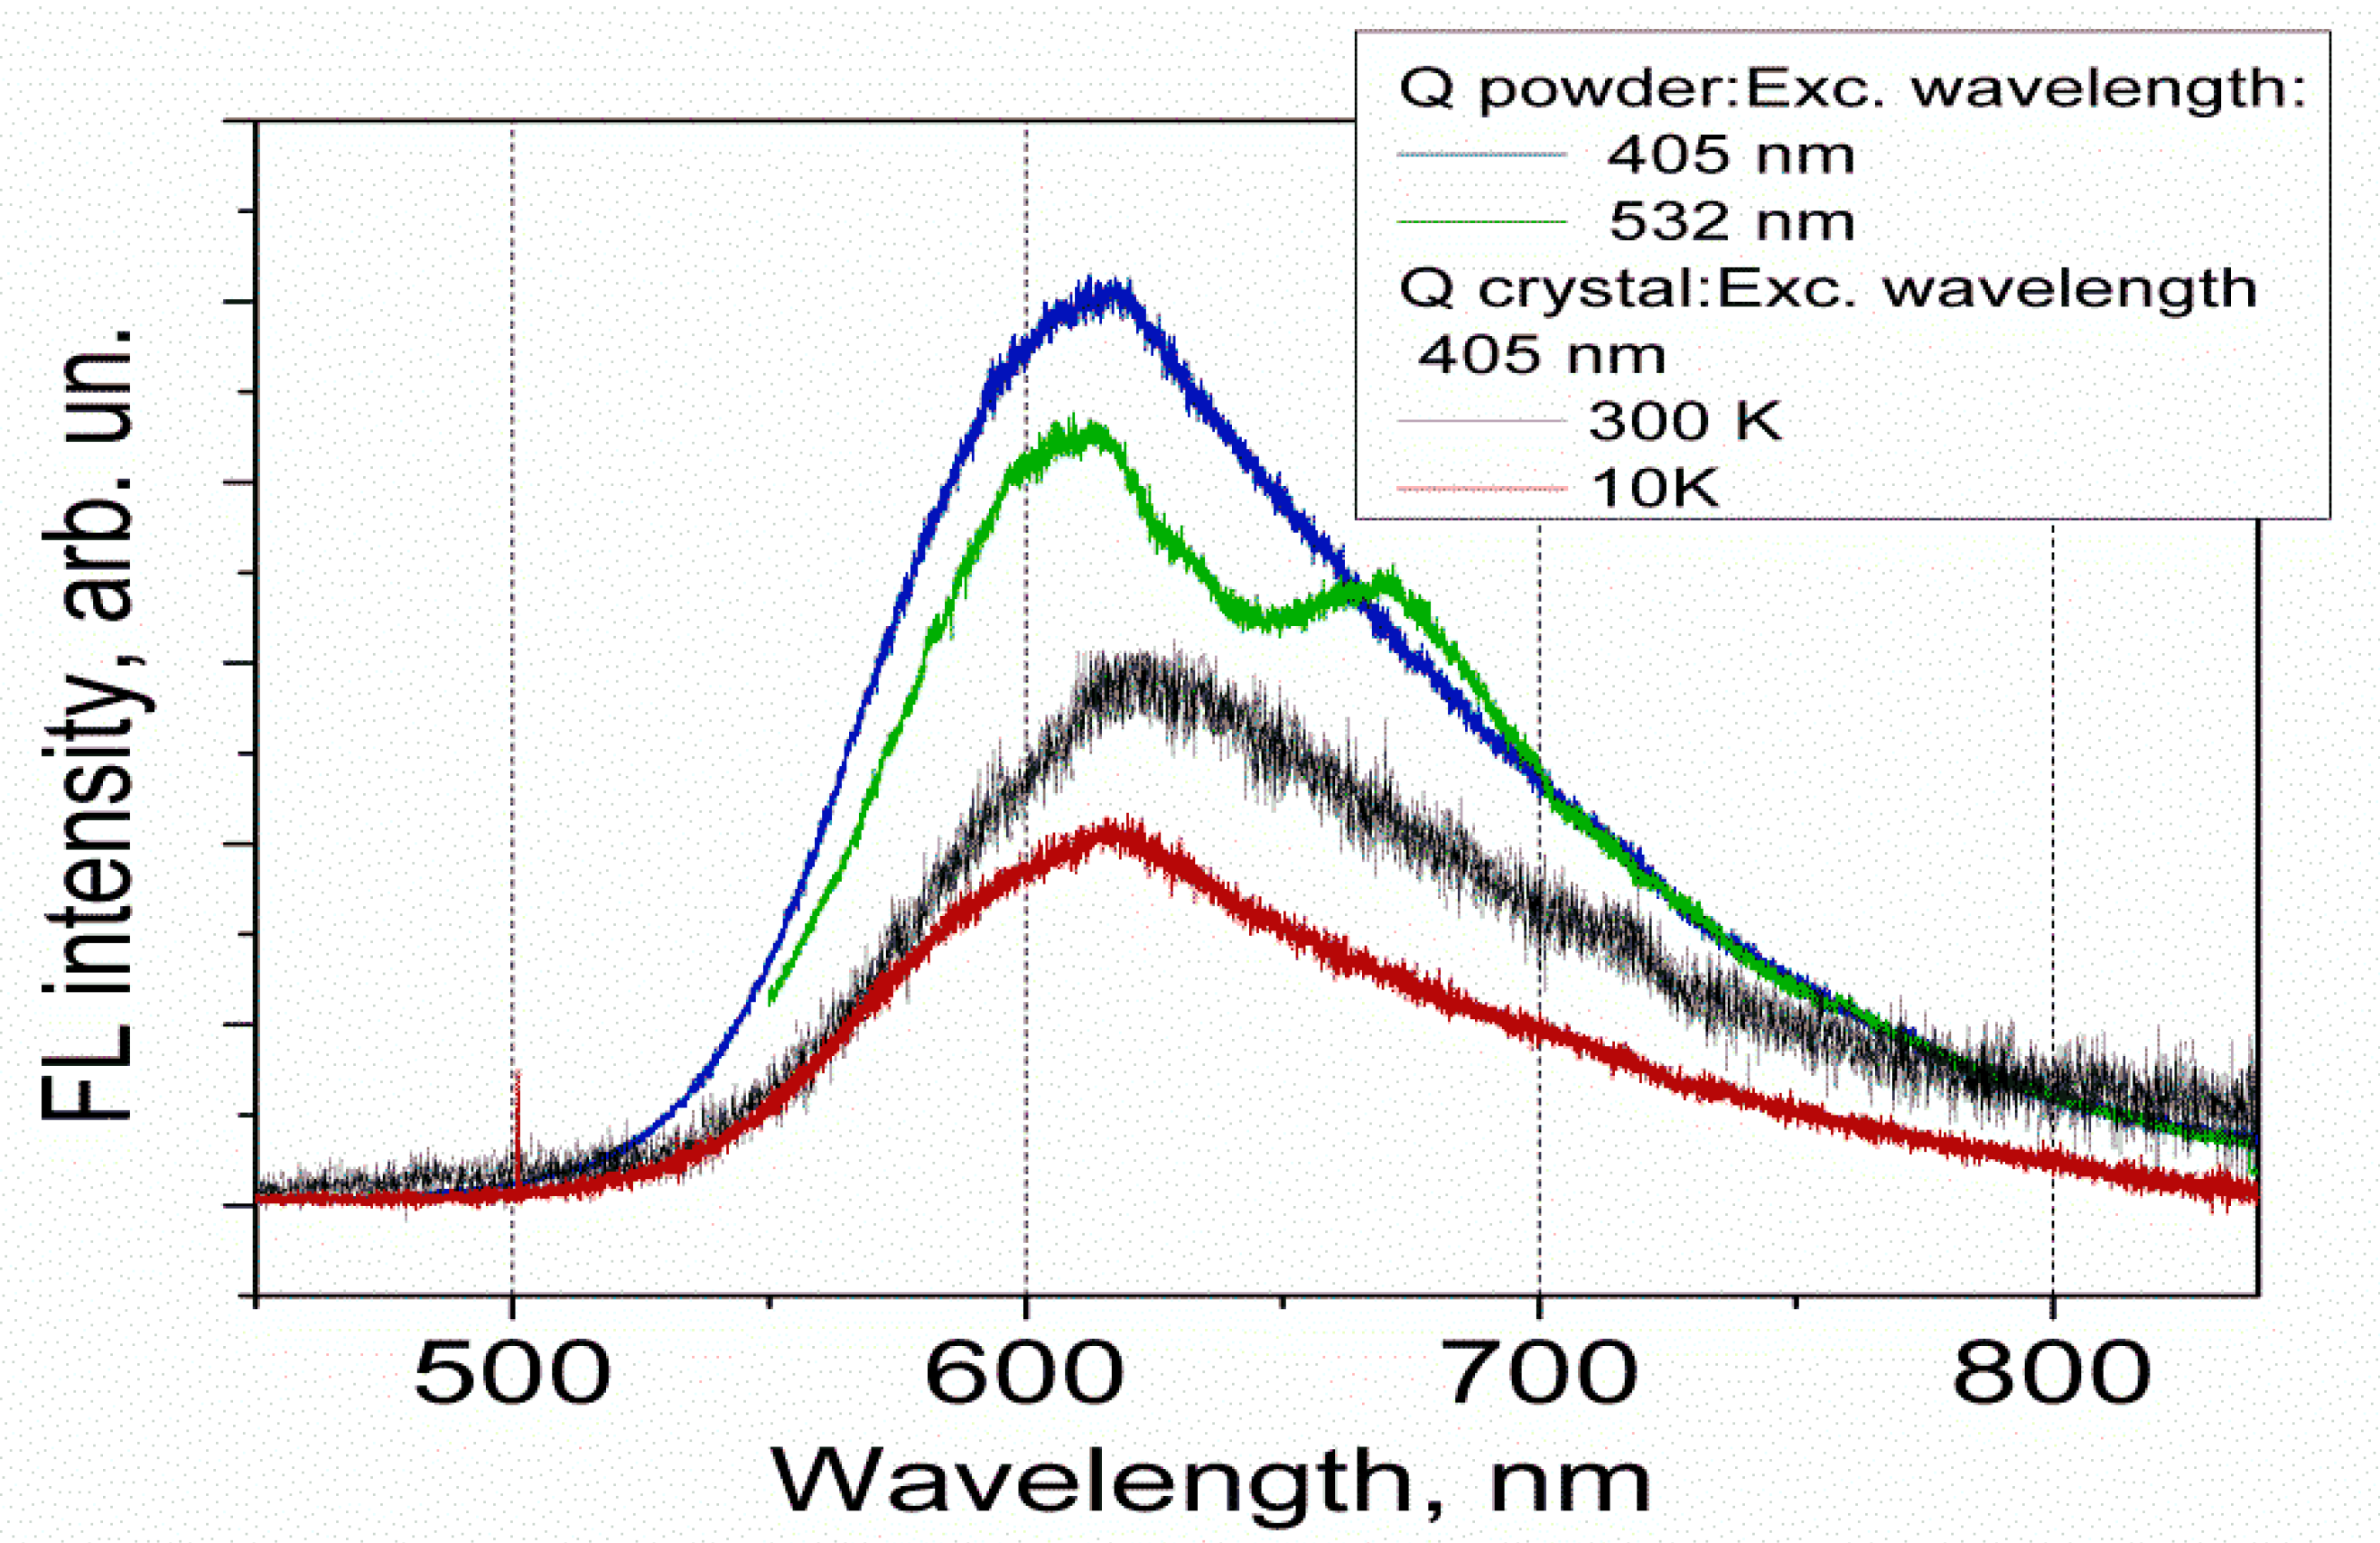
  • The FL spectra were measured for Q solutions in different types of solvents (non-polar, polar protic and polar aprotic), for Q crystals and Q anhydrous powder, using excitation laser-line of 405 nm. Only one peak with maximum at 505 nm was observed for low concentration solutions for all the solvents used. For powder and solutions with high concentrations the same spectral features at 615 and 670 nm were observed in the FL emission spectra.
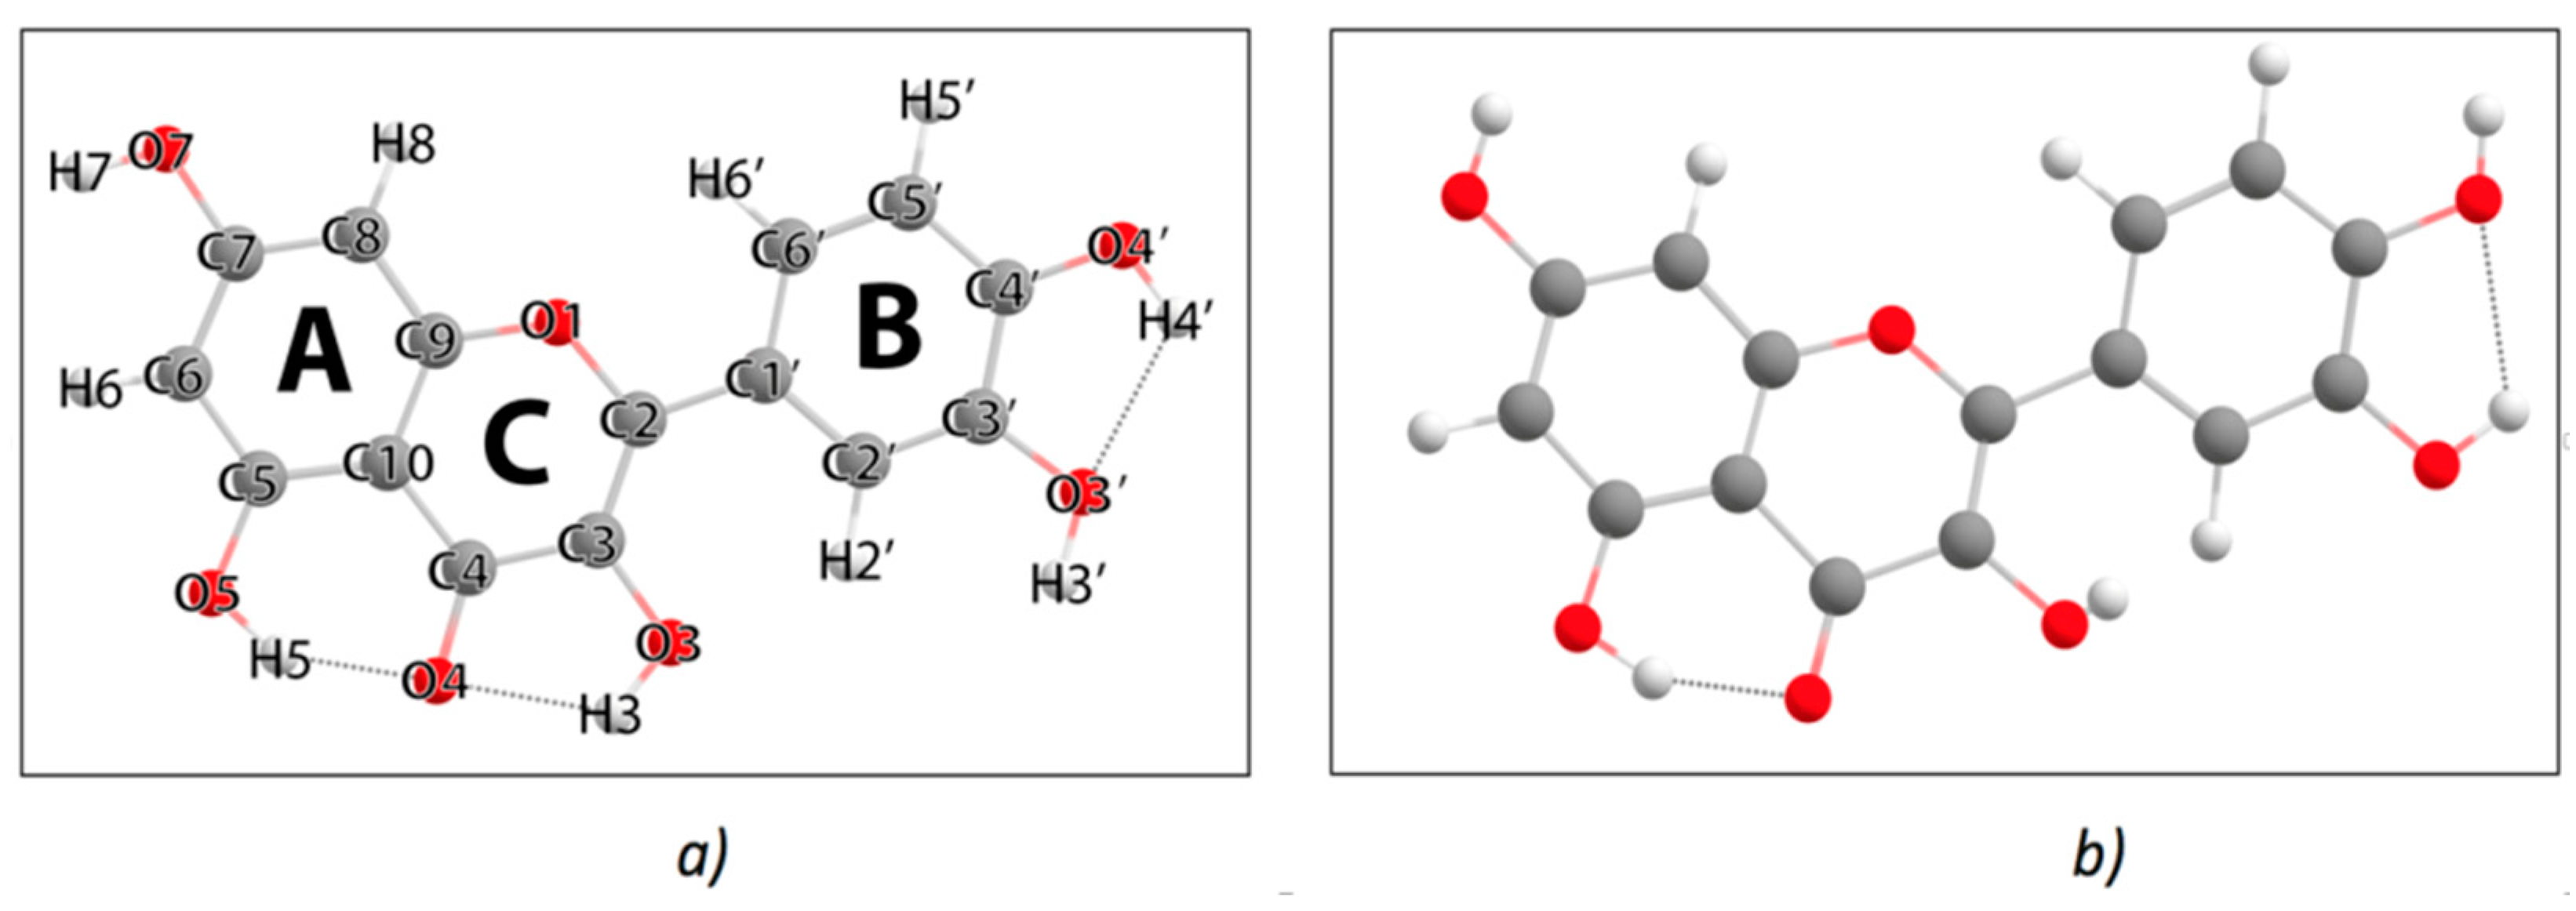
  • The TDDFT-M06-2X/6-31++G(d,p) approach was successfully used to calculate the characteristic wavelengths of the FL emission of Q molecule in solvents and vacuum. As far as we know, this methodology was applied for the first time to find the absorption and emission energies of Q molecule in methanol, acetone, and chloroform solvents. Besides, the spontaneous transition of –OH5 group proton in the first excited state for Q molecule in vacuum was not reported before.
  • The FL emission peak observed for all Q solutions in methanol, acetone, and chloroform with low concentration (505 nm) is due to the Q_M keto OH3 transition with calculated values of 485–487 nm.
  • Computational results of the FL emission wavelength for Q molecule in the solid state using the molecule configuration corresponding to Q_A keto O5 form in vacuum (630 nm), show a good agreement with the experimental data (615 nm). The spectral feature at 615 nm observed in the FL emission spectra of the solutions with high concentrations, can be related to the presence of undissolved clusters of Q molecules.

Author Contributions

Conceptualization, T.P. and A.D.; methodology, T.P., A.D., F.J.M., M.E.C.; software, A.D., F.J.M., M.E.C., L.C.T., G.D.V.L.; investigation, T.P., T.S.P., A.D., F.J.M., M.E.C., L.C.T., G.D.V.L. and E.G.; resources, T.P. and A.D.; data curation, T.P., T.S.P.; writing—original draft preparation, T.P. and A.D.; writing—review and editing, F.J.M., M.E.C., T.S.P.; visualization, T.P., A.D. and L.C.T.; funding acquisition, T.P., A.D. and E.G. All authors have read and agreed to the published version of the manuscript.

Funding

This research was funded by Autonomous University of Puebla, grant number 100517025-VIEP2021.

Institutional Review Board Statement

Not applicable.

Informed Consent Statement

Not applicable.

Data Availability Statement

Data is contained within the article and can also be obtained from the corresponding authors.

Acknowledgments

The authors gratefully acknowledge the Notre Dame University Integrated Imaging Facility for help provided in the characterization of the structures and the Laboratorio Nacional de Supercomputo del Sureste de Mexico, a member of the CONACYT network of national laboratories, for computer resources, technical advice and support.

Conflicts of Interest

The authors declare no conflict of interest.

References

  1. Jan, A.T.; Kamli, M.R.; Murtaza, I.; Singh, J.B.; Ali, A.; Haq, Q.M.R. Dietary Flavonoid Quercetin and Associated Health Benefits—An Overview. Food Rev. Int. 2010, 26, 302–317. [Google Scholar] [CrossRef]
  2. Boots, A.W.; Haenen, G.R.M.M.; Bast, A. Health Effects of Quercetin: From Antioxidant to Nutraceutical. Eur. J. Pharmacol. 2008, 585, 325–337. [Google Scholar] [CrossRef] [PubMed]
  3. Boots, A.W.; Drent, M.; de Boer, V.C.J.; Bast, A.; Haenen, G.R.M.M. Quercetin Reduces Markers of Oxidative Stress and Inflammation in Sarcoidosis. Clin. Nutr. 2011, 30, 506–512. [Google Scholar] [CrossRef] [PubMed] [Green Version]
  4. Russo, M.; Spagnuolo, C.; Tedesco, I.; Bilotto, S.; Russo, G.L. The Flavonoid Quercetin in Disease Prevention and Therapy: Facts and Fancies. Biochem. Pharmacol. 2012, 83, 6–15. [Google Scholar] [CrossRef]
  5. Wiseman, R.L.; Zhang, Y.; Lee, K.P.K.; Harding, H.P.; Haynes, C.M.; Price, J.; Sicheri, F.; Ron, D. Flavonol Activation Defines an Unanticipated Ligand-Binding Site in the Kinase-RNase Domain of IRE1. Mol. Cell 2010, 38, 291–304. [Google Scholar] [CrossRef] [Green Version]
  6. Solnier, J.; Fladerer, J.-P. Flavonoids: A Complementary Approach to Conventional Therapy of COVID-19? Phytochem. Rev. 2021, 20, 773–795. [Google Scholar] [CrossRef]
  7. Jo, S.; Kim, S.; Shin, D.H.; Kim, M.-S. Inhibition of SARS-CoV 3CL Protease by Flavonoids. J. Enzym. Inhib. Med. Chem. 2020, 35, 145–151. [Google Scholar] [CrossRef] [Green Version]
  8. Di Pierro, F.; Iqtadar, S.; Khan, A.; Ullah Mumtaz, S.; Masud Chaudhry, M.; Bertuccioli, A.; Derosa, G.; Maffioli, P.; Togni, S.; Riva, A.; et al. Potential Clinical Benefits of Quercetin in the Early Stage of COVID-19: Results of a Second, Pilot, Randomized, Controlled and Open-Label Clinical Trial. IJGM 2021, 14, 2807–2816. [Google Scholar] [CrossRef]
  9. Tong, C.; Shi, F.; Tong, X.; Shi, S.; Ali, I.; Guo, Y. Shining Natural Flavonols in Sensing and Bioimaging. TrAC Trends Anal. Chem. 2021, 137, 116222. [Google Scholar] [CrossRef]
  10. Alva-Ensastegui, J.C.; Palomar-Pardavé, M.; Romero-Romo, M.; Ramírez-Silva, M.T. Quercetin Spectrofluorometric Quantification in Aqueous Media Using Different Surfactants as Fluorescence Promoters. RSC Adv. 2018, 8, 10980–10986. [Google Scholar] [CrossRef] [Green Version]
  11. Nghia, N.N.; Huy, B.T.; Lee, Y.-I. Highly Sensitive and Selective Optosensing of Quercetin Based on Novel Complexation with Yttrium Ions. Analyst 2020, 145, 3376–3384. [Google Scholar] [CrossRef] [PubMed]
  12. He, T.; Niu, N.; Chen, Z.; Li, S.; Liu, S.; Li, J. Novel Quercetin Aggregation-Induced Emission Luminogen (AIEgen) with Excited-State Intramolecular Proton Transfer for In Vivo Bioimaging. Adv. Funct. Mater. 2018, 28, 1706196. [Google Scholar] [CrossRef]
  13. Parr, R.G.; Weitao, Y. Density-Functional Theory of Atoms and Molecules; Oxford University Press: Oxford, UK, 1994; ISBN 978-0-19-535773-8. [Google Scholar]
  14. Bauernschmitt, R.; Ahlrichs, R. Treatment of Electronic Excitations within the Adiabatic Approximation of Time Dependent Density Functional Theory. Chem. Phys. Lett. 1996, 256, 454–464. [Google Scholar] [CrossRef]
  15. Zhao, Y.; Truhlar, D.G. The M06 Suite of Density Functionals for Main Group Thermochemistry, Thermochemical Kinetics, Noncovalent Interactions, Excited States, and Transition Elements: Two New Functionals and Systematic Testing of Four M06-Class Functionals and 12 Other Functionals. Theor. Chem. Acc. 2008, 120, 215–241. [Google Scholar] [CrossRef] [Green Version]
  16. Ditchfield, R.; Hehre, W.J.; Pople, J.A. Self-Consistent Molecular-Orbital Methods. IX. An Extended Gaussian-Type Basis for Molecular-Orbital Studies of Organic Molecules. J. Chem. Phys. 2003, 54, 724. [Google Scholar] [CrossRef]
  17. Clark, T.; Chandrasekhar, J.; Spitznagel, G.W.; Schleyer, P.V.R. Efficient Diffuse Function-Augmented Basis Sets for Anion Calculations. III. The 3-21+G Basis Set for First-Row Elements, Li–F. J. Comput. Chem. 1983, 4, 294–301. [Google Scholar] [CrossRef]
  18. Frisch, M.J.; Pople, J.A.; Binkley, J.S. Self--consistent Molecular Orbital Methods 25. Supplementary Functions for Gaussian Basis Sets. J. Chem. Phys. 1998, 80, 3265. [Google Scholar] [CrossRef]
  19. Frisch, M.J.; Trucks, G.W.; Schlegel, H.B.; Scuseria, G.E.; Robb, M.A.; Cheeseman, J.R.; Scalmani, G.; Barone, V.; Mennucci, B.; Petersson, G.A.; et al. Gaussian∼09 Revision D.01; Gaussian Inc.: Wallingford, CT, USA, 2009. [Google Scholar]
  20. Tomasi, J.; Mennucci, B.; Cammi, R. Quantum Mechanical Continuum Solvation Models. Chem. Rev. 2005, 105, 2999–3094. [Google Scholar] [CrossRef]
  21. Simkovitch, R.; Huppert, D. Excited-State Intramolecular Proton Transfer of the Natural Product Quercetin. J. Phys. Chem. B 2015, 119, 10244–10251. [Google Scholar] [CrossRef] [PubMed]
  22. Mezzetti, A.; Protti, S.; Lapouge, C.; Cornard, J.-P. Protic Equilibria as the Key Factor of Quercetin Emission in Solution. Relevance to Biochemical and Analytical Studies. Phys. Chem. Chem. Phys. 2011, 13, 6858–6864. [Google Scholar] [CrossRef]
  23. Simkovitch, R.; Huppert, D. Intramolecular Excited-State Hydrogen Transfer in Rutin and Quercetin. Isr. J. Chem. 2017, 57, 393–402. [Google Scholar] [CrossRef]
  24. Olejniczak, S.; Potrzebowski, M.J. Solid State NMR Studies and Density Functional Theory (DFT) Calculations of Conformers of Quercetin. Electronic Supplementary Information (ESI) Available: TGA Profiles for Samples 1 and 2 and 13C NMR Shielding Parameters. Org. Biomol. Chem. 2004, 2, 2315. [Google Scholar] [CrossRef] [PubMed]
  25. Vasisht, K.; Chadha, K.; Karan, M.; Bhalla, Y.; Jena, A.K.; Chadha, R. Enhancing Biopharmaceutical Parameters of Bioflavonoid Quercetin by Cocrystallization. CrystEngComm 2016, 18, 1403–1415. [Google Scholar] [CrossRef]
  26. Guharay, J.; Sengupta, P.K. Excited-State Proton-Transfer and Dual Fluorescence of Robinetin in Different Environments. Spectrochim. Acta Part A Mol. Biomol. Spectrosc. 1997, 53, 905–912. [Google Scholar] [CrossRef]
  27. Sengupta, P.K. Pharmacologically Active Plant Flavonols as Proton Transfer Based Multiparametric Fluorescence Probes Targeting Biomolecules: Perspectives and Prospects. In Reviews in Fluorescence 2016; Geddes, C.D., Ed.; Springer International Publishing: Cham, Switzerland, 2017; pp. 45–70. ISBN 978-3-319-48259-0. [Google Scholar]
  28. Yang, Y.; Chen, Y.; Zhao, Y.; Shi, W.; Ma, F.; Li, Y. Under Different Solvents Excited-State Intramolecular Proton Transfer Mechanism and Solvatochromic Effect of 2-(2-Hydroxyphenyl) Benzothiazole Molecule. J. Lumin. 2019, 206, 326–334. [Google Scholar] [CrossRef]
  29. Yang, Y.; Zhao, J.; Li, Y. Theoretical Study of the ESIPT Process for a New Natural Product Quercetin. Sci. Rep. 2016, 6, 32152. [Google Scholar] [CrossRef] [Green Version]
Figure 1. FL emission spectra measured at room temperature on Q solutions in: (a) methanol, (b) acetone, and (c) chloroform, with different concentrations. To facilitate comparison, all the spectra were normalized to one by dividing each spectrum by its highest value.
Chemosensors 09 00315 g001
Figure 2. SEM images of Q crystals grown from saturated solutions of Q in methanol (a,b) and in acetone (c,d).
Chemosensors 09 00315 g002
Figure 3. FL emission spectra of Q crystal at 10 K (red curve) and at 300 K (black curve), and FL spectra of Q powder at 300 K measured with two different excitation wavelengths (blue and green curves). To facilitate comparison the spectra are shown in arbitrary units.
Chemosensors 09 00315 g003
Figure 4. (a) Structure of the quercetin molecule (Q_M enol form). The orientations of hydroxyl groups and position of B-ring correspond to the global minimum (M06-2X/6-31++G(d,p)) in vacuum. The numbering of the atoms is also shown. (b) Q molecule conformer found in crystal structures of anhydrous Q crystal (Q_A enol form).
Chemosensors 09 00315 g004
Figure 5. Keto forms of quercetin conformers: (a) Q_M keto OH3, (b) Q_M keto OH5, and (c) Q_A keto OH5.
Chemosensors 09 00315 g005
Table 1. Absorption and emission of Q molecule obtained at TDDFT-M06-2X/6-31++G(d,p) level of theory.
ES0 (a.u)
S0 opt
ES1 (a.u)
S0 opt
ES1–ES0 (eV)λab (nm)fab ES1* (a.u)
S1 opt
ES0* (a.u)
S1 opt
ES1*–ES0* (eV)λem (nm)fem
Q_M enol (Figure 4a)
Methanol−1103.8499−1103.71123.775328.460.69−1103.7212−1103.83853.194388.271.00
Acetone−1103.8494−1103.71073.773328.650.70−1103.7205−1103.83823.201387.410.99
Chloroform−1103.8453−1103.70683.769329.010.73−1103.7155−1103.83513.252381.310.91
Q_M keto OH3 (Figure 5a)
Methanol−1103.8229−1103.71322.983415.630.78−1103.7215−1103.81542.554485.520.78
Acetone−1103.8223−1103.71302.976416.670.78−1103.7210−1103.81492.553485.660.78
Chloroform−1103.8175−1103.71002.925423.880.71−1103.7174−1103.81092.544487.450.71
Q_M keto OH5 (Figure 5b)
Methanol
Acetone
Chloroform
−1103.8310−1103.71623.122397.170.46−1103.7354−1103.81802.249551.290.46
−1103.8296−1103.71543.105399.290.45−1103.7349−1103.81752.250551.620.45
−1103.8257−1103.71343.057405.590.32−1103.7307−1103.81232.221558.250.31
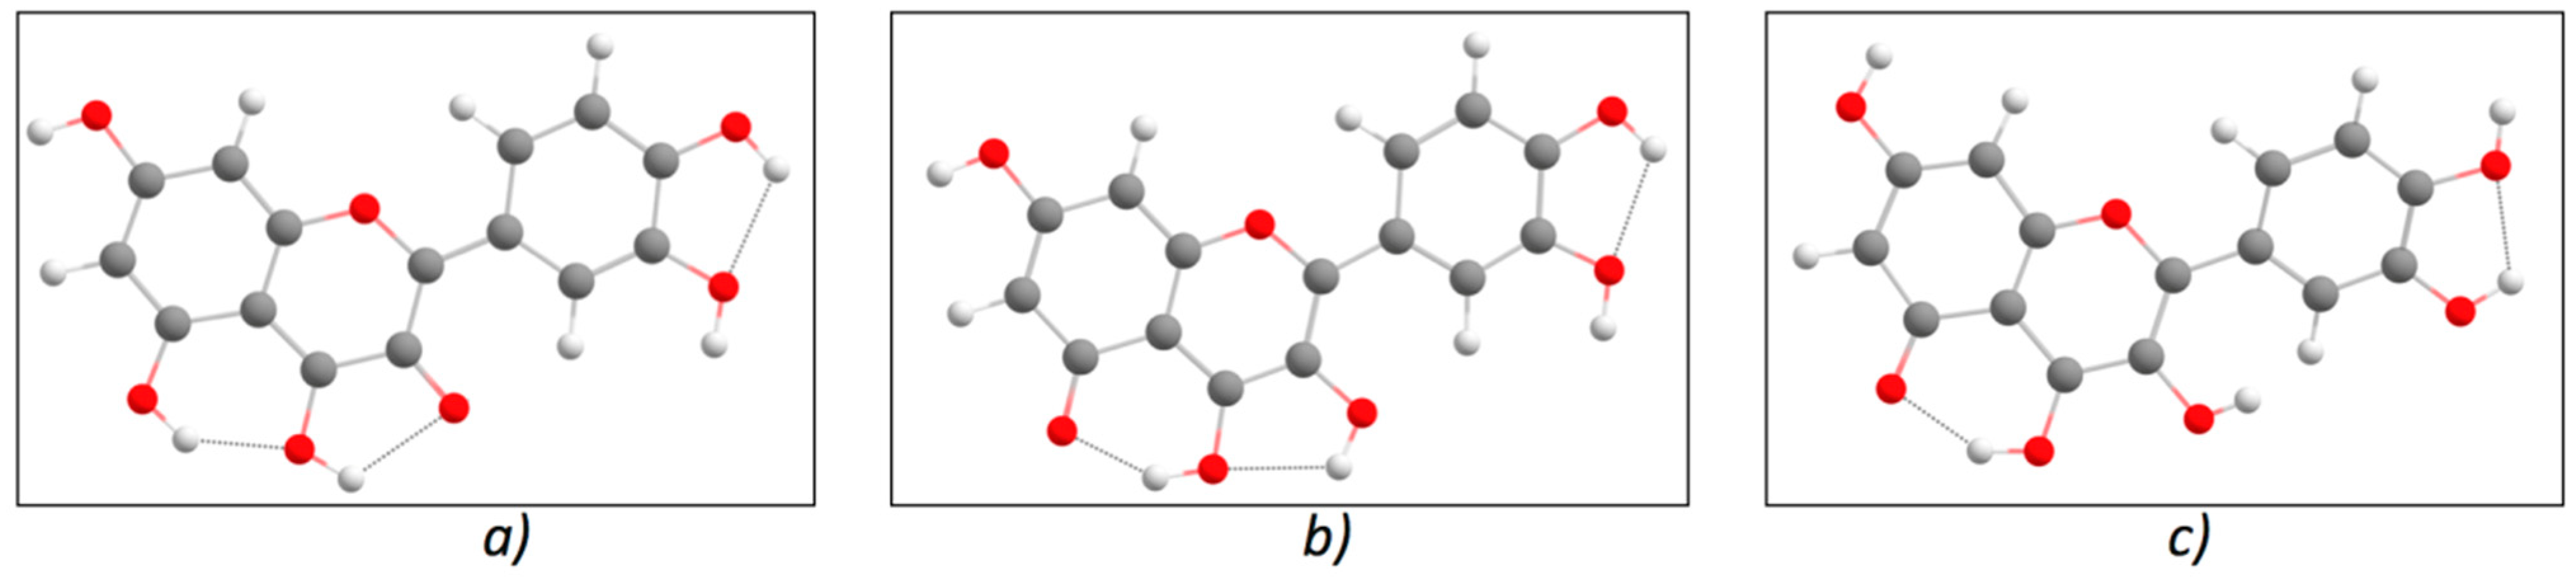
Q_A enol (Figure 4b)
Vacuum−1103.8183−1103.66674.124300.650.35-----
Q_A keto OH5 (Figure 5c)
Vacuum−1103.8001−1103.68623.098400.230.20−1103.7045−1103.77681.965630.870.06
Note: ES0 is the energy of the molecule optimized in the ground state S0; ES1 is the energy of the first excited state, S1, at the ground state optimized geometry, S0, from the non-equilibrium solvation state-specific calculation. For vacuum ES1 is the energy of the first excited state, S1, at the ground state optimized geometry, S0; ES1* is the energy of the first excited state, S1, at its optimized geometry from the equilibrium solvation state-specific calculation. For vacuum ES1* is the energy of the first excited state, S1, at its optimized geometry; ES0* is the energy of the ground state, S0, with non-equilibrium solvation, at the optimized geometry of the excited state, S1. For vacuum ES0* is the energy of the ground state, S0, at the optimized geometry of the excited state, S1; fem and fab are the oscillator strengths for emission and absorption, respectively.
Publisher’s Note: MDPI stays neutral with regard to jurisdictional claims in published maps and institutional affiliations.

