Article

Cost-Effective Foam-Based Colorimetric Sensor for Roadside Testing of Alcohol in Undiluted Saliva

by
Krittapas Kaewnu
1,2,
Kiattisak Promsuwan
1,2,3,4,
Apichai Phonchai
1,2,
Adul Thiangchanya
1,
Dongsayam Somapa
5,
Namchoke Somapa
5,
Kunanunt Tayayuth
6 and
Warakorn Limbut
1,2,3,4,*
1
Division of Health and Applied Sciences, Faculty of Science, Prince of Songkla University, Hat Yai, Songkhla 90112, Thailand
2
Forensic Science Innovation and Service Center, Prince of Songkla University, Hat Yai, Songkhla 90112, Thailand
3
Center of Excellence for Trace Analysis and Biosensors (TAB-CoE), Prince of Songkla University, Hat Yai, Songkhla 90112, Thailand
4
Center of Excellence for Innovation in Chemistry, Faculty of Science, Prince of Songkla University, Hat Yai, Songkhla 90112, Thailand
5
Master Lab Incorporation Company Limited, 12 Prayasuren, 35 Bangchun Klongsamwa, Bangkok 10510, Thailand
6
Science Park, Hat Yai Campus of Extension Southern Institute of Science Park, Prince of Songkla University, Moo 6, Thung Yai, Hat Yai, Songkhla 90110, Thailand
*
Author to whom correspondence should be addressed.
Submission received: 16 October 2021 / Revised: 10 November 2021 / Accepted: 14 November 2021 / Published: 28 November 2021
(This article belongs to the Special Issue Optical Chemical Sensors and Spectroscopy)

Abstract

:
A novel foam-based colorimetric alcohol sensor was developed for the detection of alcohol in saliva. Detection was based on the color change of a potassium dichromate-sulfuric acid solution absorbed by melamine foam. In the presence of alcohol, the orange colorimetric sensor changed color to brown, green and, ultimately, blue, depending on the concentration of alcohol in the sample. The response of the proposed sensor toward alcohol was linear from 0.10 to 2.5% v/v. The limit of detection was 0.03% v/v. Alcohol concentration could be determined using the naked eye in the range of 0.00 to 10% v/v. The developed alcohol sensor presented good operational accuracy (RSD = 0.30–1.90%, n = 8) and good stability for 21 days when stored at 25 °C and 75 days when stored at 4 °C. The results of alcohol detection with the developed sensor showed no significant difference from the results of spectrophotometric detection at a 95% confidence level (p > 0.05). The sensor was easy to use, small, inexpensive and portable, enabling drivers to accurately measure their own blood alcohol level and providing convenient speed in forensic applications.

Graphical Abstract

1. Introduction

Alcohol (ethanol; C2H5OH) is widely used in the medical, chemical and beverage industries. Alcohol is a popular drink throughout the world [1] but it interferes with the brain’s communication pathways and can affect the ways in which the brain works, changing mood, behavior, mental clarity and coordination [2,3]. In 2018, the World Health Organization (WHO) reported global data on road traffic deaths arising from the consumption of alcohol. It estimated that 5–35% of all reported road deaths involved the consumption of alcohol. Driving after drinking alcohol also significantly increases the risk of a crash and the severity of the crash. To reduce the number of road accidents, many countries have passed driving laws limiting the maximum permitted blood alcohol concentration (BAC) to 0.05% [4,5]. A BAC of 0.02% can be detected in saliva and this is helpful in forensic investigations, and in medical and research settings [6,7,8]. Therefore, a cost-effective method for the rapid, roadside detection of alcohol in undiluted saliva is of interest.
Alcohol concentration has been determined by high-performance liquid chromatography (HPLC) [3,9,10], gas chromatography [11,12,13,14], mass spectrometry [15,16], electrochemistry [17], capillary electrophoresis [18] and Raman spectroscopy [19]. However, these methods require dedicated instrumentation and the assays are expensive and generate high volumes of waste [20,21]. Colorimetry has attracted great attention in the field of sensor development for alcohol determination. Colorimetric sensors are commonly used in conjunction with spectrophotometry in the quantitative analysis of alcohol [22,23,24] but easy-to-use, portable devices have been successfully developed that provide rapid screening at low cost [20,23,25,26,27,28,29]. Colorimetric sensing using an indicator solution adsorbed on melamine foam has already been developed and described [11,30,31]. This type of sensor is ideal for these applications because the response of the foam-based colorimetric sensor can be followed with the naked eye and a smartphone can be used to analyze the color change due to alcohol.
In the present work, a simple and portable colorimetric alcohol sensor was developed for the rapid roadside testing of alcohol in undiluted saliva contained in exhaled air. An aqueous solution of potassium dichromate presents a reddish orange color when dissolved in sulfuric acid, which is a strong oxidizer of the dichromate ion (Cr6+). Sulfuric acid removes alcohol from the exhaled air into the test solution and also provides the necessary acidic conditions. When this strong oxidizer reacts with alcohol, the dichromate ion (Cr6+) is reduced to the chromate ion (Cr3+), producing a green color and forming acetic acid. This innovation for analyzing alcohol in saliva is proposed in response to demands for alcohol testing in the workplace with a noninvasive device for on-the-spot analysis of alcohol concentrations in saliva.

2. Materials and Methods

2.1. Chemicals and Apparatus

Potassium dichromate (K2Cr2O7) was from Ajax Finechem (Taren Point, Australia). Ethanol (C2H5OH) and sulfuric acid (H2SO4) were from Merck (Darmstadt, Germany). All chemical solutions were prepared using deionized water with resistivity of more than 18.2 MΩ·cm from the BarnsteadTM Easy PureTM II water purification system (Thermo Scientific TM, Waltham, MA, USA). Melamine foam was from Stronger Intergroup Co., Ltd. (Bangkok, Thailand). Working standard alcohol solutions were daily prepared by diluting a stock standard of ethanol (99%) with ultrapure water in a series of 0.00, 0.10, 0.50, 1.0, 2.5, 5.0, 7.5 and 10% v/v for calibration curve construction. The morphology of the foam-based colorimetric sensor was characterized using scanning electron microscopy (SEM, Quanta 400, FEI, Hillsboro, OR, USA). Digital images were recorded with a Digital Microscope 4.3 LED Screen Display 720P 10X-1000X magnification (Bangkok, Thailand). Energy-dispersive X-ray fluorescence (EDXRF, Horiba, Japanese) was used to analyze the elements in the foam-based colorimetric sensor. UV–Vis spectrophotometry (T60, PG Instruments, Lutterworth, UK) and a digital breath alcohol tester (AT600, Beijing, China) were applied to determine the concentrations of alcohol obtained from the developed foam-based colorimetric alcohol sensor.

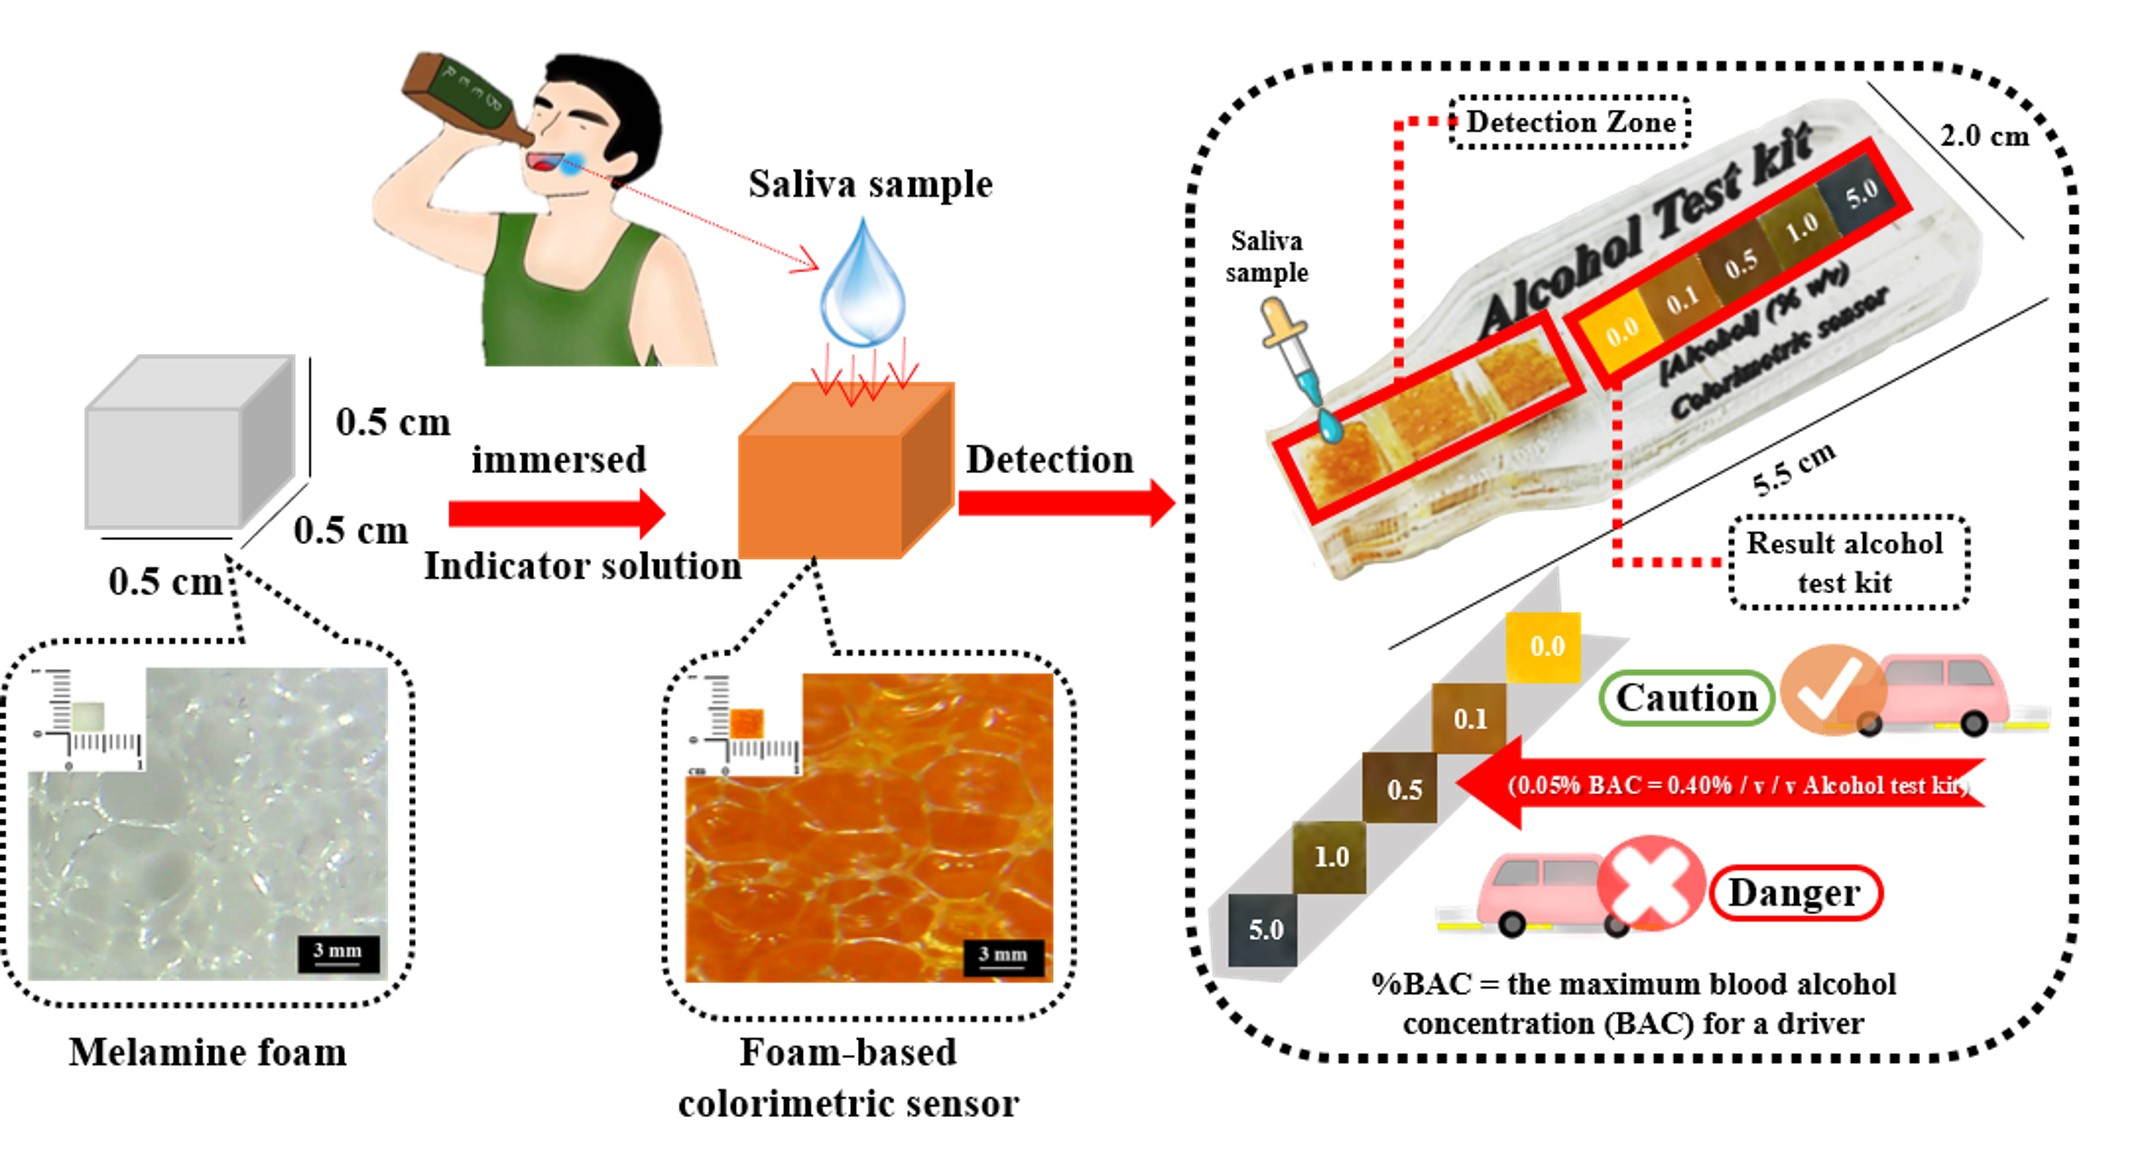
2.2. Preparation of Foam-Based Alcohol Colorimetric Sensor

The foam-based material for the colorimetric sensor was fabricated using cubes of melamine foam measuring 0.50 × 0.50 × 0.50 cm3. The colorimetric reagent for alcohol detection was prepared using 0.50 mol L−1 K2Cr2O6 containing 5.0 mol L−1 H2SO4 (optimized concentration). Foam cubes were immersed in the colorimetric reagent for 60 min and dried in an oven at 70 °C for 60 min (Figure 1A). The obtained foam-based colorimetric alcohol sensors were kept at 4 °C until used.

2.3. RGB Image Processing and Statistical Analysis

The iPhone 6S smartphone (Apple Inc., Los Altos, CA, USA) with a 12-megapixel camera resolution was used to photograph samples after completion of the colorimetric reaction. A 2.0 mL colorless polypropylene micro-centrifuge tube with a lid was used as a sample container. A lab-made accessory constructed with a black acrylic sheet measuring 24 × 29 × 53 cm3 was used to improve the quality and reproducibility of the images (Figure 1B). All recorded images were automatically analyzed to evaluate RGB intensity values using the Color Assist application. The original images were digitally analyzed to return numerical values ranging from 0 to 255 for each channel: red (R), green (G) and blue (B). The image was then imported for RGB analysis. The RGB values from six test zones (n = 6) were reported as the mean color intensity. The red (R) channel showed the highest intensity and therefore the red channel was used to indicate the concentration of alcohol for the construction of the calibration curve and for alcohol determination.

2.4. Optimization of the Sensing Conditions of Foam-Based Alcohol Colorimetric Sensor

The fabrication and operational conditions of the foam-based colorimetric alcohol sensor were optimized in terms of the concentrations of colorimetric reagent components ([K2Cr2O6] and [H2SO4]), the adsorption time of the colorimetric reagent on the melamine foam and the alcohol sample volume. These parameters were optimized to obtain the best color intensity from the interaction between the colorimetric reagent and alcohol, and the highest sensitivity of each parameter was considered as the optimal condition. The sensitivity of each parameter was determined by the slope of the plot between the color intensity of the foam-based colorimetric sensor and the concentration of alcohol at concentrations ranging from 0.10 to 1.0% v/v (six replicates for each concentration).

2.5. Method Validation

The performance of the proposed alcohol detection method was evaluated in terms of linearity, limits of detection (LOD), stability, precision, accuracy and selectivity. The relationship between color intensity and alcohol concentration was plotted as a calibration curve. LOD was calculated based on the intercept of the calibration curve (yB) and the standard deviation of the blank (SB) from LOD = yB + 3SB [32]. Storage stability was expressed in terms of the percentage of relative error (%RE) = [ C A C B C B ] × 100 , where CA is the measured concentration of the analyte in the sample, and CB is the nominal concentration of the analyte in the sample [33]. Inter-day precision of the sensor was studied to determine reproducibility, which was evaluated using the relative standard deviation (%RSD) according to AOAC guidelines [34]. Accuracy was determined in terms of recovery. The possible interfering species contained in human saliva were used in the interference study.

2.6. Determination of Alcohol in Saliva Samples

Six saliva samples were obtained from volunteers who had consumed alcohol. One saliva sample was obtained from sober people. The 30 µL saliva sample without any pretreatment or diluting was loaded into the foam-based colorimetric alcohol sensor. The proposed foam-based colorimetric alcohol sensor directly analyzed the amount of alcohol in the saliva within 3 min under optimal conditions. To check accuracy, the same samples were analyzed by the spectrophotometric method, and with a digital breath alcohol tester. The results from the three methods were statistically analyzed by paired-sample t-test (p > 0.05). The accuracy of the developed foam-based colorimetric alcohol sensor was evaluated by analyzing known concentrations of alcohol (0.50, 1.0 and 5.0% v/v) in spiked saliva samples.

3. Results and Discussion

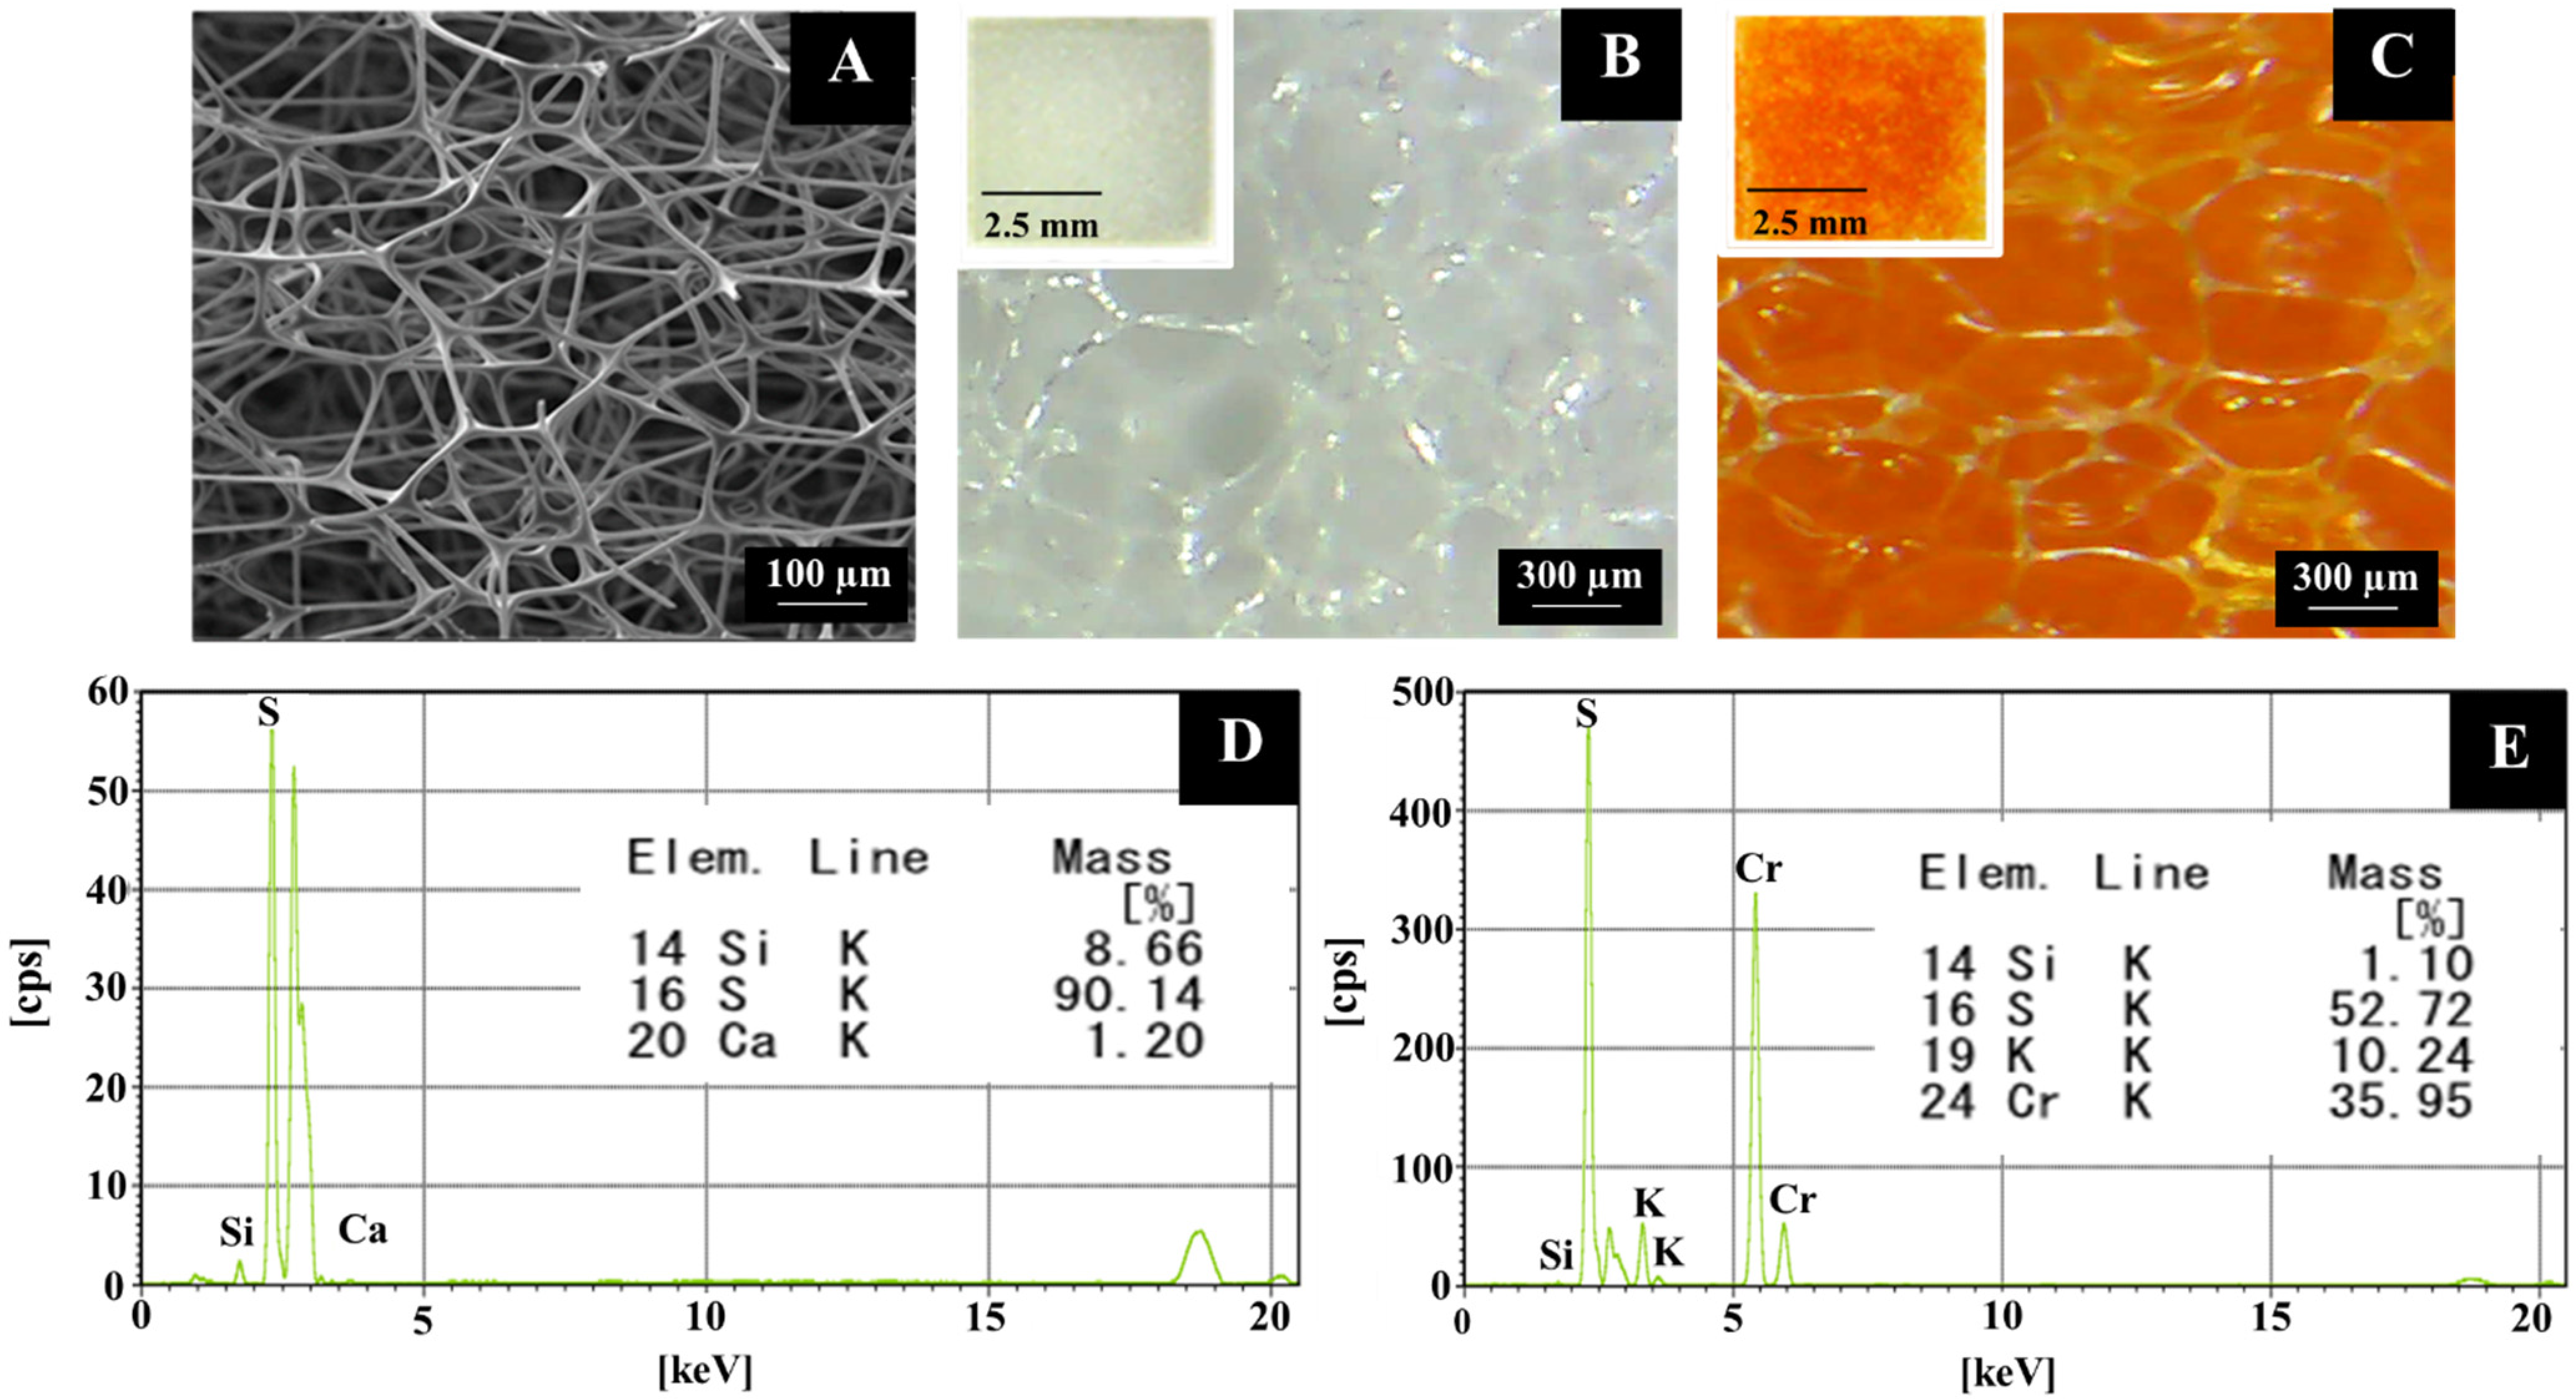
3.1. Design and Characterization of Foam-Based Alcohol Colorimetric Sensor

SEM images of the melamine supporting foam show a porous structure with a pore size of 296.8 ± 0.3 µm (Figure 2A). The porous structure of the foam immobilized and entrapped the colorimetric reagent via hydrogen bonding [35]. Digital images of the supporting foam before and after adsorption of the colorimetric reagent show a clear white supporting material before (Figure 2B) and a reddish orange supporting foam after (Figure 2C). The reddish orange color of the foam was the same as the color of the colorimetric reagent, indicating that the reagent was well-adsorbed on the supporting foam. To confirm the adsorption of the colorimetric reagent, EDXRF analysis was employed to characterize the elemental composition of the foam before and after adsorption. The EDXRF spectrum of the supporting foam before adsorption of the colorimetric reagent showed only the elements Si, S and Ca (Figure 2D). After adsorption of the colorimetric reagent, the spectrum (Figure 2E) showed the elements S, K and Cr, confirming that the colorimetric reagent containing K2Cr2O6 and H2SO4 was successfully adsorbed on the supporting foam.

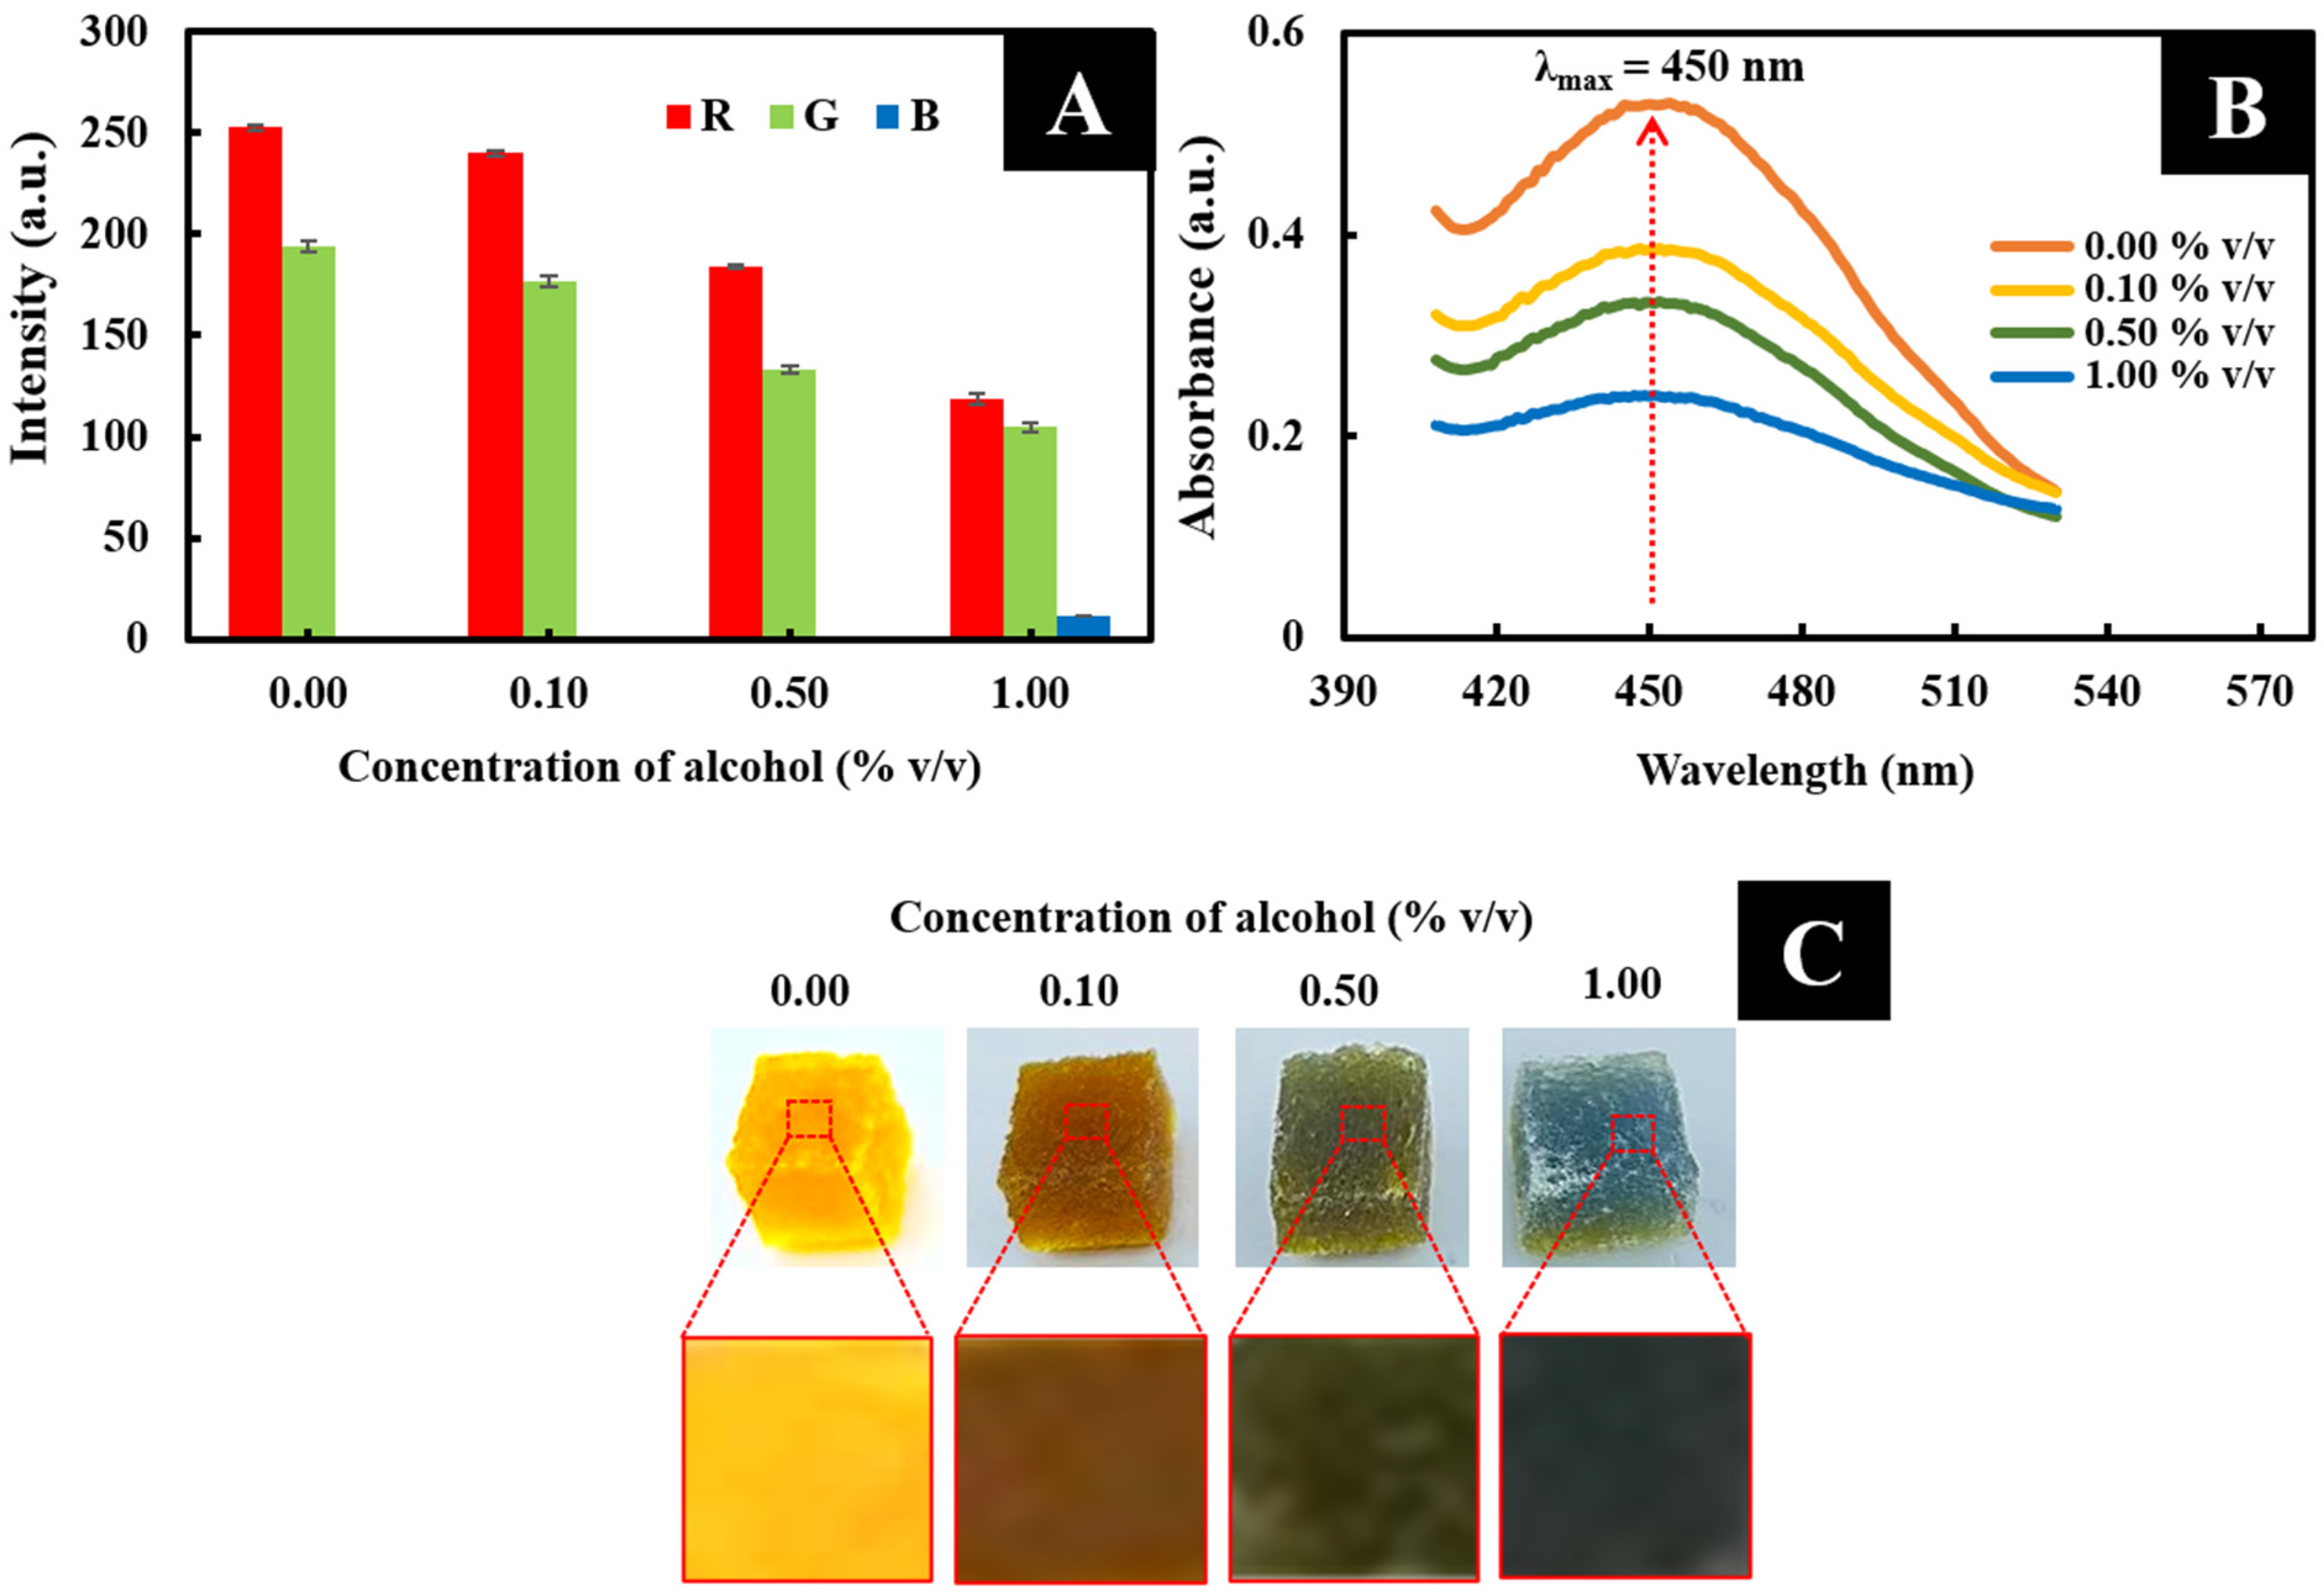
3.2. The Choice of Color Channel (RGB Value) Providing the Analytical Signal
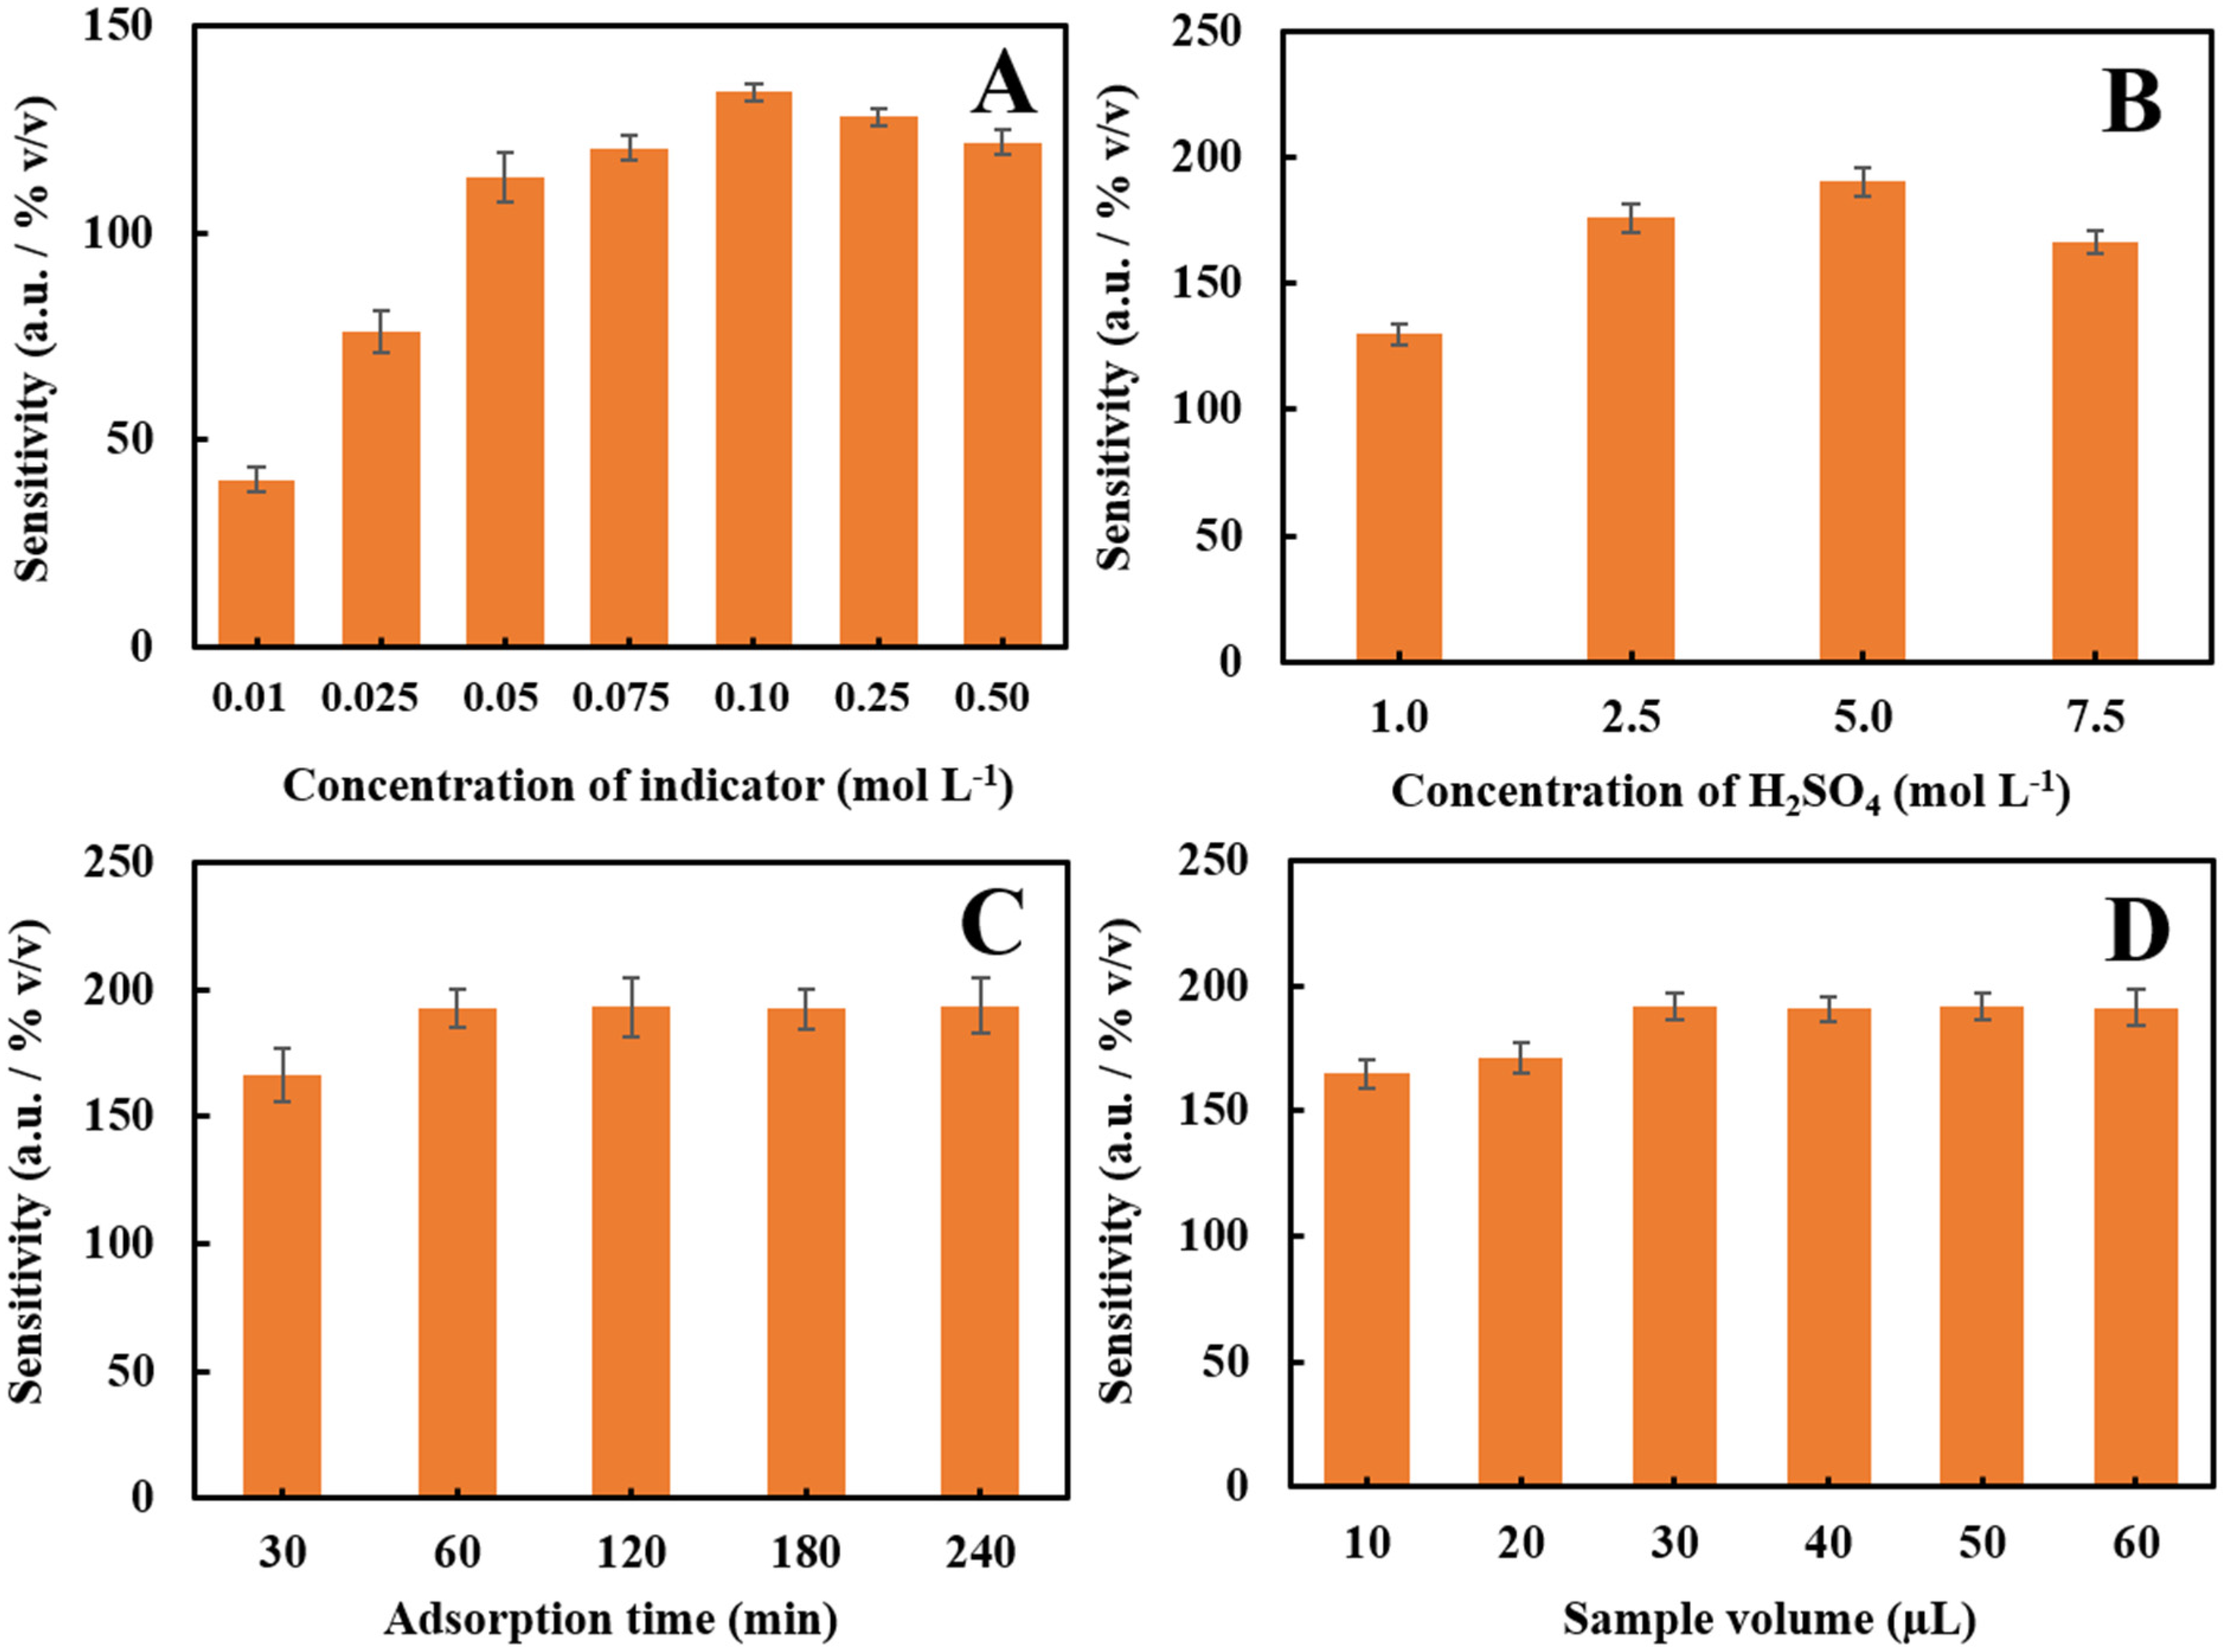
To obtain the best sensitivity of the colorimetric assay, the effect of the color detection mode was evaluated. The RGB color channel values were measured at four concentrations of alcohol. The intensity of the red color channel was higher than that of the green and blue color channels (Figure 3A) because the green–blue alcohol colorimetric product absorbed red light [33]. The maximum absorbance of the colorimetric sensor occurred at roughly 450 nm (Figure 3B). Hence, the red color mode was chosen for the determination of alcohol concentration since it provided higher sensitivity.

3.3. Optimization

The sensitivity of the foam-based colorimetric alcohol sensor depended on various parameters, including the colorimetric reagent concentration, the adsorption time of the colorimetric reagent on the supporting foam and the sample volume. To maximize sensitivity, these parameters were optimized.

3.3.1. Concentration of the Colorimetric Reagent

The colorimetric reagent for alcohol detection was a mixture of potassium dichromate (K2Cr2O6) and sulfuric acid (H2SO4). The mechanism of the reaction between the colorimetric reagent and alcohol can be explained as follows:
2K2Cr2O7 + 8H2SO4 + 3CH3CH2OH→2Cr2(SO4)3 + 2K2SO4 + 3CH3COOH + 11H2O
Potassium dichromate can be formed as a strong oxidizer of the dichromate ion (Cr6+), taking a reddish orange color in the presence of sulfuric acid. This strong oxidizer of the dichromate ion (Cr6+) can be reduced to the chromate ion (Cr3+) by reaction with alcohol, producing a green color. At the same time, ethanol was oxidized to acetic acid [36]. The concentrations of potassium dichromate (K2Cr2O6) and sulfuric acid (H2SO4) affected the color change in the reaction with alcohol.
The effect of the potassium dichromate concentration on sensitivity toward alcohol was investigated at 0.01, 0.025, 0.05, 0.075, 0.10, 0.25 and 0.50 mol L−1. The highest sensitivity was obtained at 0.10 mol L−1 (Figure 4A and Supplementary Material Table S1). Therefore, 0.10 mol L−1 potassium dichromate was used for further study. The effect of the sulfuric acid concentration was examined at 1.0, 2.5, 5.0 and 7.5 mol L−1 in solution with 0.10 mol L−1 potassium dichromate (Figure 4B and Supplementary Material Table S2). Sensitivity increased with increments of sulfuric acid concentration up to 5.0 mol L−1, then slightly decreased. Based on the parameters that provided the best sensitivity of alcohol detection, the colorimetric reagent for alcohol detection with the foam-based colorimetric sensor was prepared with sulfuric acid at 5.0 mol L−1 and potassium dichromate at 0.10 mol L−1.

3.3.2. Adsorption Time of the Colorimetric Reagent by Foam-Based Sensor

The effect of the duration of adsorption of the colorimetric reagent on the supporting foam was evaluated at 30, 60, 120, 180 and 240 min. The supporting foam was immersed in the optimized colorimetric reagent and, at 60 min, the sensitivity for alcohol detection reached a level that remained almost unchanged thereafter (Figure 4C and Supplementary Material Table S3), due to the saturation of the supporting foam. Therefore, 60 min was selected for the adsorption of the colorimetric reagent on the supporting foam.

3.3.3. The Loading of Sample Volume

The volume of sample loaded into the foam-based alcohol colorimetric sensor was optimized at 10, 20, 30, 40, 50 and 60 µL (Figure 4D and Supplementary Material Table S4). Sensitivity increased with increments of sample volume to 30 µL and then remained stable, indicating the completion of the reaction between the colorimetric reagent and the alcohol sample. Hence, a sample volume of 30 µL was applied.

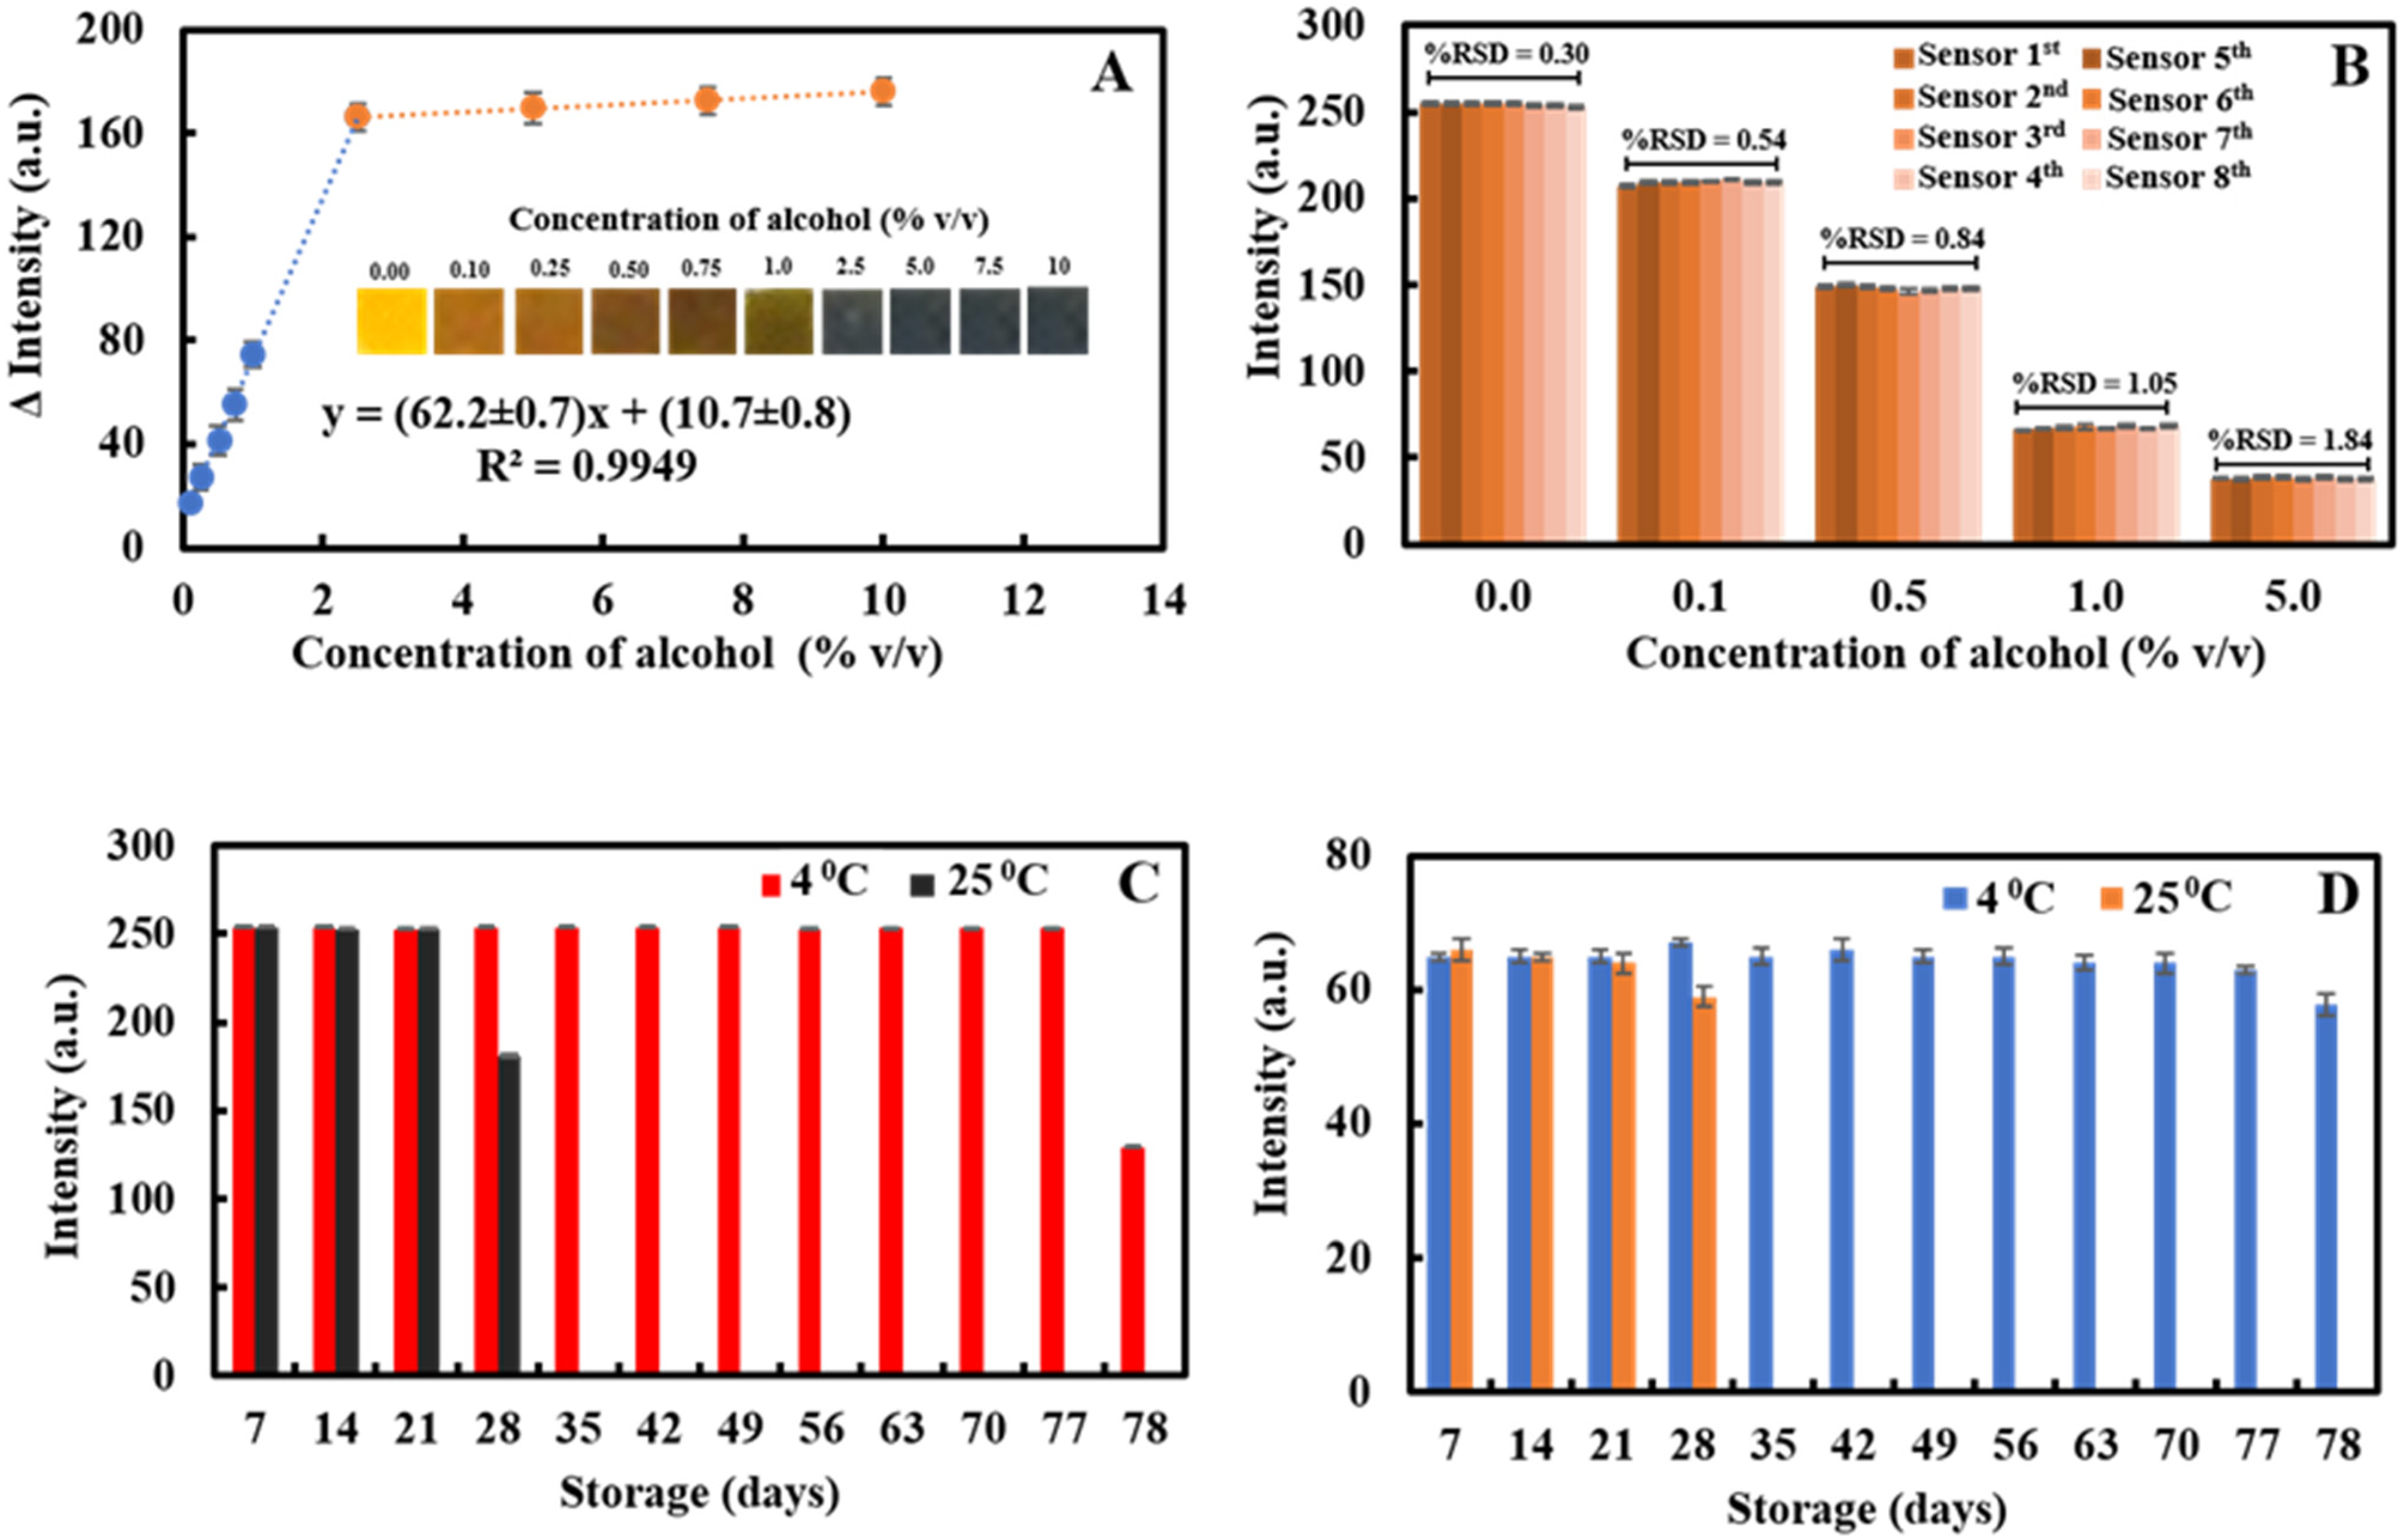
3.4. Analytical Future of the Foam-Based Alcohol Colorimetric Sensor

The analytical performance of the proposed foam-based colorimetric alcohol sensor was evaluated in the optimized conditions. The linearity of detection of the developed colorimetric sensor toward alcohol was investigated using alcohol concentrations from 0.00 to 10% v/v as shown in Figure 5A. The linear response to concentrations from 0.10 to 2.5% v/v produced a regression equation of y = (62.2 ± 0.7)x + (10.7 ± 0.8) with a coefficient of regression R2 = 0.9949. The response could be observed by the naked eye from 0.00 to 10% v/v. Based on the calibration curve, the LOD was calculated to be 0.03% v/v.
The reproducibility of the developed sensor was evaluated via inter-day precision and reported in terms of RSDs. Eight sensors were prepared on consecutive days under the same conditions and each sensor was used to detect alcohol at concentrations of 0.0, 0.1, 0.5, 1.0 and 5.0% v/v (Figure 5B). The blank (0.0% v/v alcohol) produced an RSD of 0.30% (n = 8), indicating the consistency of the preparation of the sensor. When each of the developed sensors was used to detect alcohol, RSDs of 0.54%, 0.84%, 1.05% and 1.84% were obtained at 0.1, 0.5, 1.0 and 5.0% v/v, respectively. These RSD values are below the acceptable values according to AOAC guidelines, which recommend an RSD lower than 2.70% for 1% of an analyte and 1.90% for 10% of an analyte [34]. The precision of the foam-based colorimetric alcohol sensor was excellent.
The storage stability of the developed sensor was investigated by evaluating the stability of the color intensity of the colorimetric reagent in the supporting foam and the stability of colorimetric products after storage at 25 °C (room temperature) and 4 °C. For this study, all the foam-based alcohol sensors were prepared on the same day in the same conditions. We examined the stability of the colorimetric reagent in the developed foam-based alcohol colorimetric sensor. The colorimetric reagent of sensors stored at 25 °C exhibited stable color intensities for 21 days (%RE = −0.39), after which the color intensity decreased, reducing to −40.31% on day 28 (Figure 5C). The colorimetric reagent of sensors stored at 4 °C exhibited stable color intensity for 77 days (%RE = −0.20%), and the color intensity decreased to 49.05% on day 78. This result indicated that the colorimetric reagent in the supporting foam remained stable for 21 and 77 days when the sensor was stored at 25 °C and 4 °C, respectively. In addition, sensors stored at 25 °C and 4 °C were tested with freshly prepared standard alcohol (1.0% v/v) (n = 6). After storage at 25 °C for 21 days, the color intensity of the alcohol colorimetric product was reduced by 3.03%, and after 28 days, the color intensity was reduced by 10.64% (Figure 5D). After storage at 4 °C for 77 days, color intensity shifted by −4.54%, and after 78 days, by −12.62%. These results suggested that the developed foam-based colorimetric alcohol sensor exhibited excellent stability and could be stored until needed for up to 21 days at 25 °C and for more than 2 months at 25 °C.

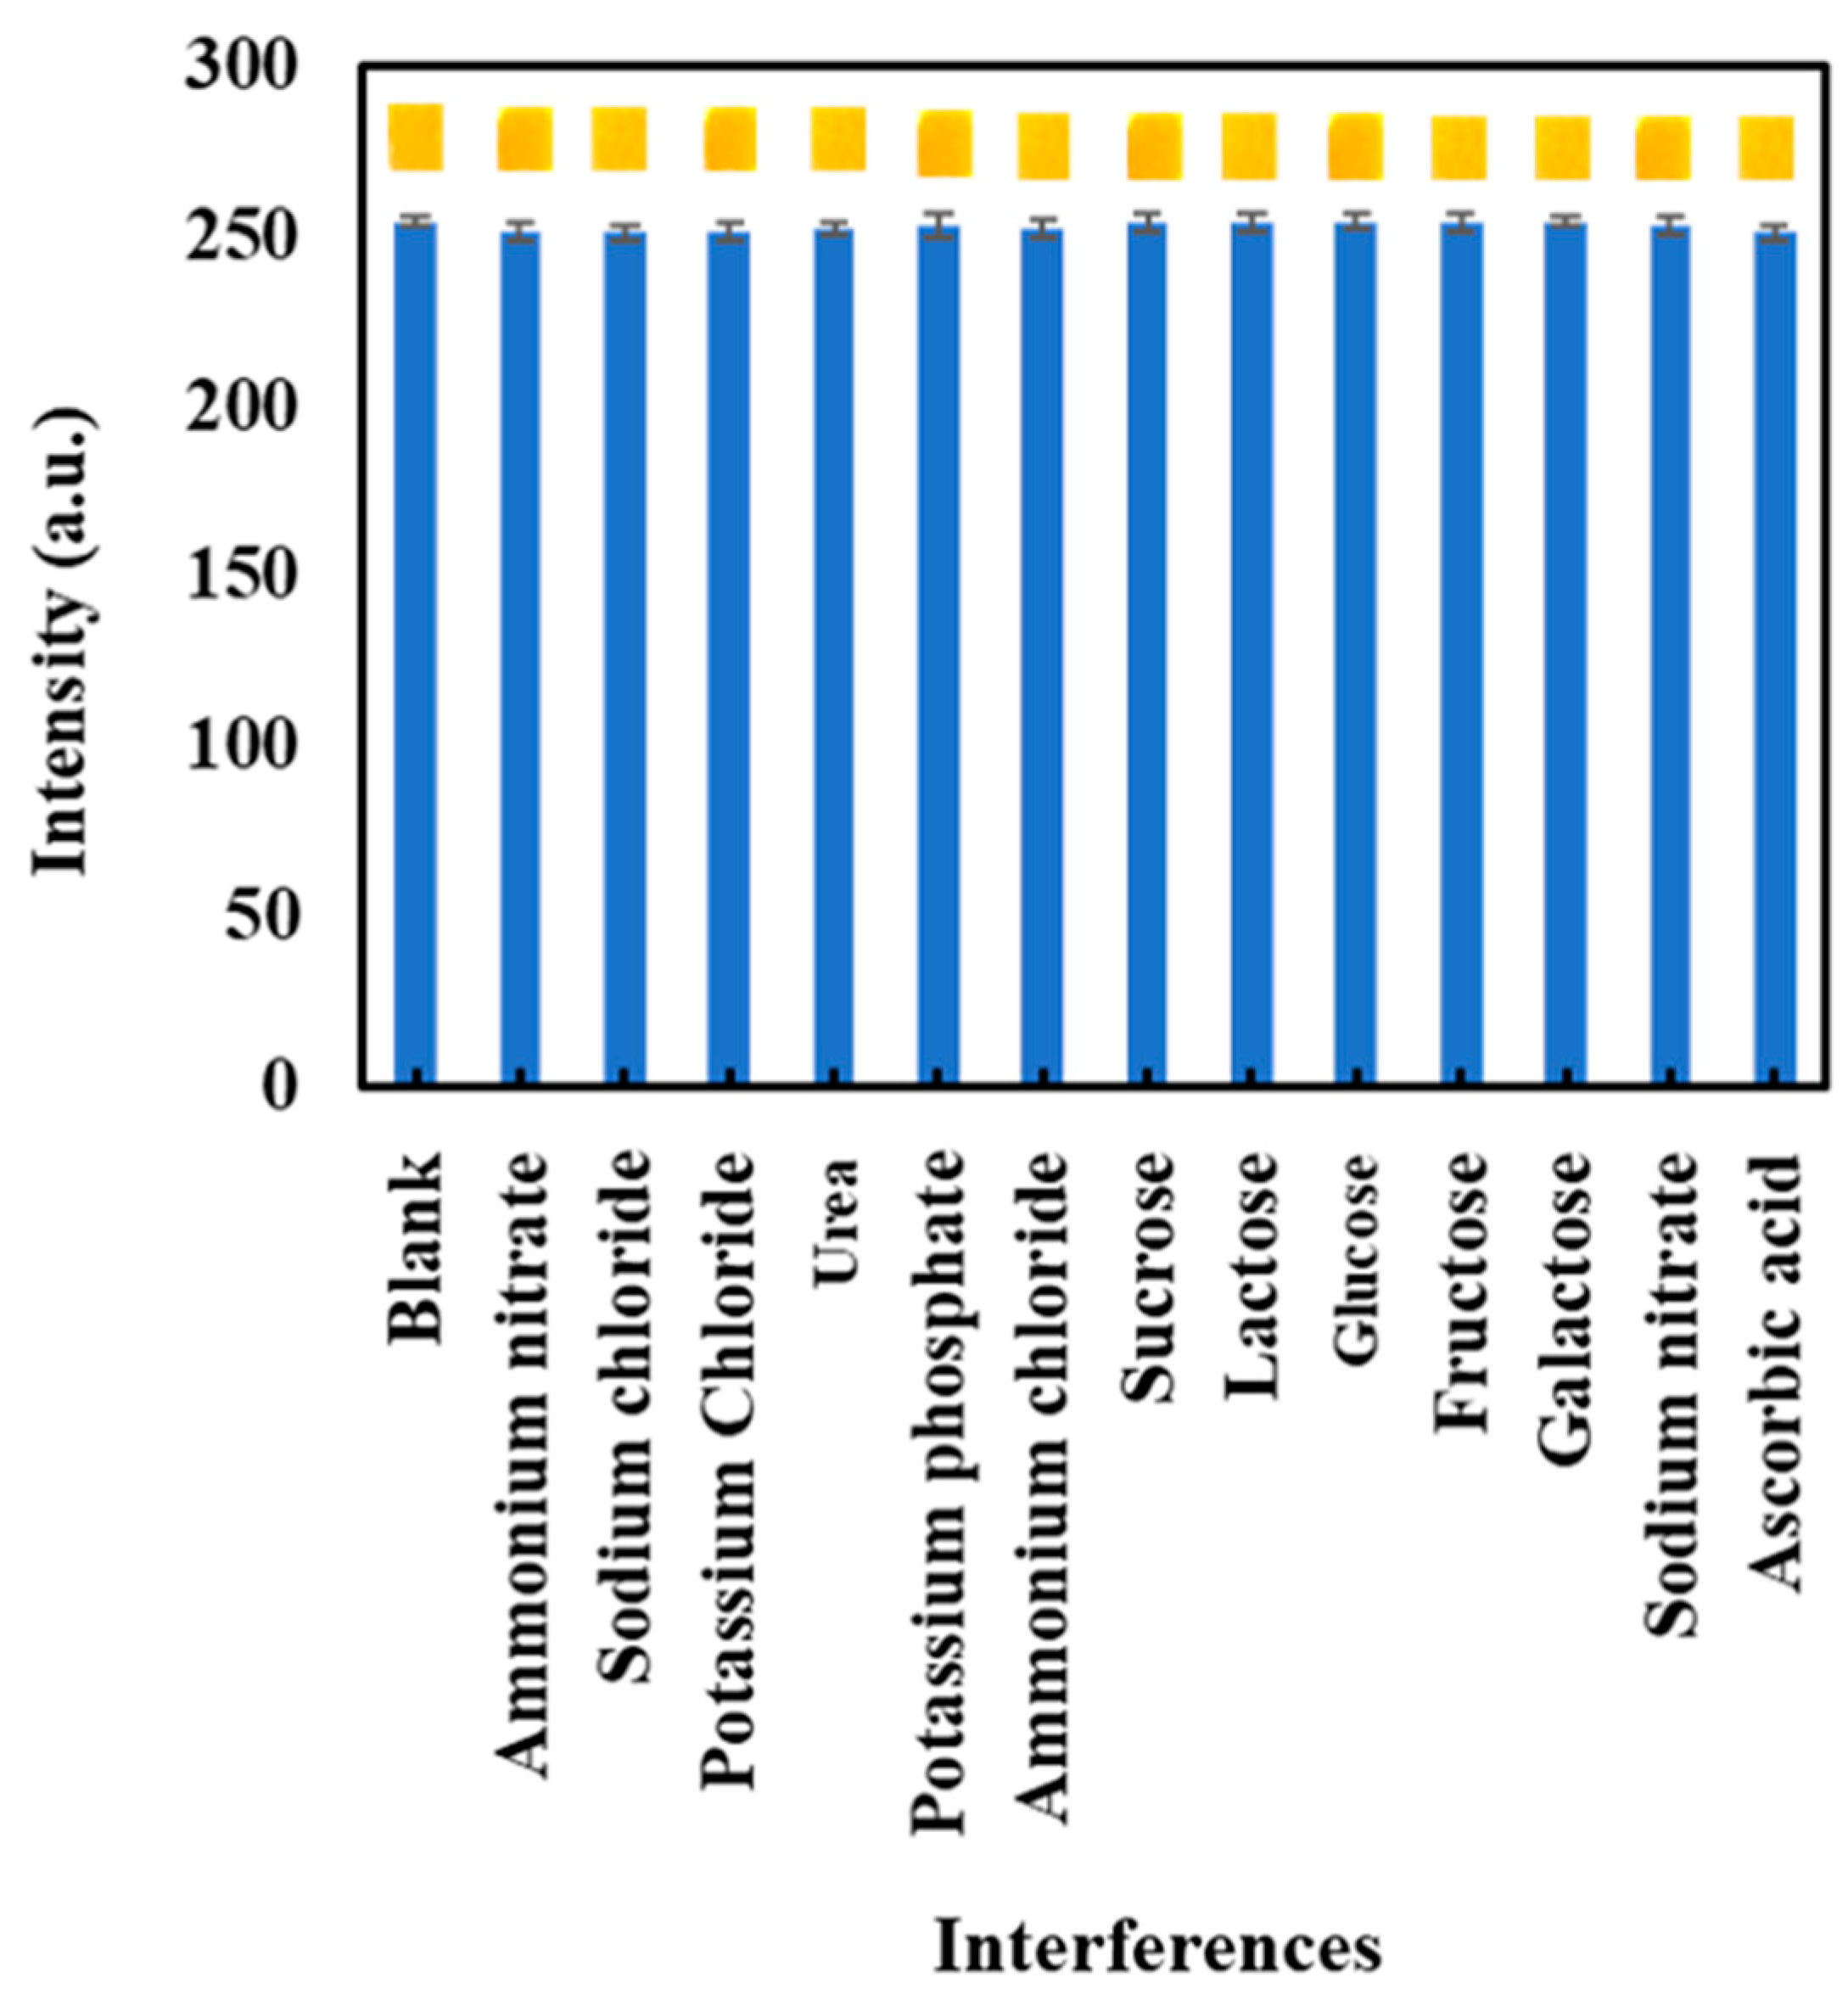
3.5. Interference Study

Since the developed foam-based colorimetric alcohol sensor would be applied to analyze alcohol levels in the saliva samples of drinkers, it was assessed for tolerance of the possible inorganic and organic interferences that might be found in saliva samples. These species included NH4NO3, NaCl, KCl, K2PO4, NH4Cl, NaNO3, urea, sucrose, lactose, glucose, fructose, galactose, ascorbic acid [37] and different types of alcohol (methanol, ethanol and propanol). The effect of an interference was indicated by a change of less than ±5% in the color intensity of the foam-based colorimetric alcohol sensor [38]. Figure 6 and Supplementary Material Table S5 display the effects of interfering species on color intensity. The highest concentrations of each interference dissolved in water were 1640-fold for NH4NO3, 1500-fold for NaCl, 1100-fold for KCl, 1000-fold for urea, 800-fold for KH2PO4, 54-fold for NH4Cl, 34-fold for sucrose and lactose, 18-fold for glucose fructose and galactose, 7-fold for NaNO3 and 2-fold for ascorbic acid. At these concentrations, these substances induced no perceptible change in color intensity. In the presence of methanol, ethanol and propanol at 1% v/v, the color intensity of the foam-based colorimetric alcohol sensor changed but showed the same color intensity as the colorimetric product. However, if the only alcohol in the saliva was ethanol, methanol and propanol were impossible to detect. These results confirmed that the developed foam-based colorimetric alcohol sensor could be applied to detect alcohol by evaluating the ethanol concentration in saliva and good selectivity could be expected.

3.6. Analysis of Alcohol in Saliva Samples

To confirm the applicability of the developed sensor, it was used to detect alcohol in real saliva samples. The results obtained were compared with the results from a spectrophotometric method and a commercial alcohol meter. Six real saliva samples were obtained from healthy male volunteer drinkers. One sample of saliva was obtained from sober people. The alcohol concentrations found in real saliva samples from the proposed sensor, the spectrophotometric method and the commercial alcohol meter are listed in Table 1. There was no statistically significant difference between results from the proposed sensor, the spectrophotometric method and the commercial alcohol meter at a 95% confidence level, determined using a paired t-test (p > 0.05). Moreover, the concentration of alcohol in all saliva samples obtained from the third method showed higher than 0.05% BAC (0.40% v/v), which is the maximum legal BAC for a driver. These results indicated that the proposed method was suitable for the quantitative analysis of alcohol in saliva. To prove the accuracy of the developed foam-based colorimetric alcohol sensor, three concentrations of alcohol (0.5, 1.0 and 5.0% v/v) were spiked into the saliva samples to evaluate the recovery values of the proposed method and the spectrophotometric method. The results are shown in Table 1. The obtained recoveries from the proposed method and the spectrophotometric method were in the range of 97.2 ± 0.01 to 101.9 ± 0.08% and 98.2 ± 0.01 to 102.0 ± 0.01%, respectively.
To evaluate the possible appearance of false positives of the developed sensor, the real saliva sample (saliva 7) obtained from sober people was also tested. The result shows that saliva obtained from sober people cannot be detected for alcohol by the three methods, indicating no false positive effect when analyzing the saliva of sober people by the developed sensor. In addition, to check accuracy, three concentrations of alcohol (0.50, 1.0 and 5.0% v/v, which are around the legal limit value) were spiked into the saliva of sober people and detected by the developed sensor and spectrophotometric method. We found that the recovered values were obtained in the range of 99.3 ± 0.04% to 100.4 ± 0.03% and 98.4 ± 0.03% to 100.1 ± 0.02% for the developed sensor and spectrophotometric method, respectively. These results suggest that the proposed colorimetric sensor is highly accurate and can be applied to the determination of alcohol in real-world saliva samples.

4. Conclusions

A novel foam-based colorimetric alcohol sensor for the detection of alcohol in undiluted saliva was successfully constructed using potassium dichromate in sulfuric acid as a colorimetric reagent. The reddish orange colorimetric reagent changed color when reacting with alcohol to form a green–blue product. Semi-quantitative analysis of alcohol in undiluted saliva samples could be performed with the naked eye and a smartphone. The color intensity of the green–blue product was digitized into RGB values. The response of the proposed sensor was linear in a concentration range of alcohol from 0.1 to 2.5% v/v with a coefficient of 0.9945 and showed a LOD of 0.03% v/v. Moreover, it can be observed by the naked eye in the range of 0.00 to 10% (v/v). The response of a sensor stored at 4 °C remained stable for 77 days. The developed sensor successfully detected different concentrations of alcohol in undiluted saliva from seven volunteers. The advantages of the foam-based colorimetric sensor compared to a commercial breath alcohol test are as follows: one-step detection, no washing step necessary, fast analysis, low sample volume, simple test procedure, no need for battery-based power sources and low cost. In addition, our sensor can prevent the spread of illness, as many germs (bacterial and viral) are spread via breath alcohol tests. When compared to strip tests, our developed sensor could detect alcohol in the sample without pretreatment and could use an accurate sample volume, leading to high precision. Additionally, our sensor could also detect alcohol in qualitative and semi-quantitative analysis by using the naked eye and quantitative analysis using a smartphone, which covers the legal limit value at 0.05% BAC (0.40% v/v), which is the maximum legal BAC for a driver. These advantages support the potential of the proposed foam-based colorimetric sensor in practical applications for the roadside testing of alcohol in undiluted saliva.

Supplementary Materials

The following are available online at https://0-www-mdpi-com.brum.beds.ac.uk/article/10.3390/chemosensors9120334/s1, Table S1: Effect of indicator concentration (n = 6), Table S2: Effect of sulfuric acid concentration (n = 6), Table S3: Effect of adsorption time (n = 6), Table S4: Effect of sample volume the reaction (n = 6), Table S5: Effect of potential interferences on the analytical determination of alcohol (n = 6).

Author Contributions

Conceptualization, K.K., K.P., A.P., A.T., D.S., N.S., K.T. and W.L.; methodology, K.K., K.P., A.P., A.T. and W.L.; validation, K.K., K.P., A.P., A.T., D.S., N.S. and W.L.; formal analysis, K.K., K.P., A.P., A.T., D.S., N.S., K.T. and W.L.; writing—original draft preparation, K.K., K.P. and W.L.; writing—review and editing, K.K., K.P., A.P., A.T., D.S., N.S., K.T. and W.L.; project administration, W.L.; funding acquisition, W.L. All authors have read and agreed to the published version of the manuscript.

Funding

This research was supported by the National Science, Research and Innovation Fund (NSRF) and Prince of Songkla University (Grant No SCI6405081S).

Institutional Review Board Statement

Not applicable.

Informed Consent Statement

Written informed consent has been obtained from the patient(s) to publish this paper.

Data Availability Statement

The data presented in this study are available on request from the corresponding author.

Acknowledgments

This paper was supported by the Center of Excellence for Innovation in Chemistry (PERCH-CIC), Ministry of Higher Education, Science, Research and Innovation, the Center of Excellence for Trace Analysis and Biosensors (TAB-CoE), the Departments of Applied Science and Chemistry, the Graduate School and the Faculty of Science at Prince of Songkla University of Thailand. The authors would like to thank Thomas Duncan Coyne for his assistance with the English.

Conflicts of Interest

The authors declare no conflict of interest.

References

  1. Biancolillo, A.; Bucci, R.; Magrì, A.L.; Magrì, A.D.; Marini, F. Data-fusion for multiplatform characterization of an Italian craft beer aimed at its authentication. Anal. Chim. Acta 2014, 820, 23–31. [Google Scholar] [CrossRef]
  2. Paasma, R.; Hovda, K.E.; Jacobsen, D. Methanol poisoning and long term sequelae—A six years follow-up after a large methanol outbreak. BMC Clin. Pharmacol. 2009, 9, 5. [Google Scholar] [CrossRef] [Green Version]
  3. Paine, A.; Dayan, A. Defining a tolerable concentration of methanol in alcoholic drinks. Hum. Exp. Toxicol. 2001, 20, 563–568. [Google Scholar] [CrossRef] [PubMed]
  4. Thepchuay, Y.; Sonsa-Ard, T.; Ratanawimarnwong, N.; Auparakkitanon, S.; Sitanurak, J.; Nacapricha, D. Based colorimetric biosensor of blood alcohol with in-situ headspace separation of ethanol from whole blood. Anal. Chim. Acta 2020, 1103, 115–121. [Google Scholar] [CrossRef] [PubMed]
  5. World Health Organization. Global Status Report on Road Safety 2018: Summary; World Health Organization: Geneva, Switzerland, 2018. [Google Scholar]
  6. Gubaa, W.; Zuba, D. Saliva as an alternative specimen for alcohol determination in the human body. Pol. J. Pharmacol. 2002, 54, 161–165. [Google Scholar]
  7. Rao, T.M.; Reddy, D.S.P.; Ramani, P.; Premkumar, P.; Anuja, N.; Sherlin, H.J. Detection of alcohol in saliva for blood alcohol concentration using alcohol saliva strip test: A forensic aid. J. NTR Univ. Health Sci. 2015, 4, 24. [Google Scholar]
  8. Amal, A.S.S.; Hussain, S.; Jalaluddin, M. Preparation of artificial saliva formulation. In Proceedings of the ICB Pharma II “Current Breakthrough in Pharmacy Materials and Analyse”, Surakarta, Indonesia, 31 October 2015. [Google Scholar]
  9. Stupak, M.; Kocourek, V.; Kolouchova, I.; Hajslova, J. Rapid approach for the determination of alcoholic strength and overall quality check of various spirit drinks and wines using GC–MS. Food Control 2017, 80, 307–313. [Google Scholar] [CrossRef]
  10. Wang, M.-L.; Wang, J.-T.; Choong, Y.-M. A rapid and accurate method for determination of methanol in alcoholic beverage by direct injection capillary gas chromatography. J. Food Compos. Anal. 2004, 17, 187–196. [Google Scholar] [CrossRef]
  11. Choengchan, N.; Mantim, T.; Wilairat, P.; Dasgupta, P.K.; Motomizu, S.; Nacapricha, D. A membraneless gas diffusion unit: Design and its application to determination of ethanol in liquors by spectrophotometric flow injection. Anal. Chim. Acta 2006, 579, 33–37. [Google Scholar] [CrossRef] [Green Version]
  12. Dorubeţ, D.; Moldoveanu, S.; Mircea, C.; Butnaru, E.; Astărăstoae, V. Development and validation of a quantitative determination method of blood ethanol by gas chromatography with headspace (GC-HS). Rom. J. Leg. Med. 2009, 4, 303–308. [Google Scholar] [CrossRef] [Green Version]
  13. Kristoffersen, L.; Stormyhr, L.-E.; Smith-Kielland, A. Headspace gas chromatographic determination of ethanol: The use of factorial design to study effects of blood storage and headspace conditions on ethanol stability and acetaldehyde formation in whole blood and plasma. Forensic Sci. Int. 2006, 161, 151–157. [Google Scholar] [CrossRef] [PubMed]
  14. Monteiro, C.; Proença, P.; Tavares, C.; Castañera, A.; Real, F.C. Interference of anesthetics in blood alcohol analysis by HS-GC-FID: A case report. Forensic Sci. Int. 2016, 265, 65–69. [Google Scholar] [CrossRef] [PubMed]
  15. Møller, J.K.; Catharino, R.R.; Eberlin, M.N. Electrospray ionization mass spectrometry fingerprinting of whisky: Immediate proof of origin and authenticity. Analyst 2005, 130, 890–897. [Google Scholar] [CrossRef] [PubMed] [Green Version]
  16. Garcia, J.S.; Vaz, B.G.; Corilo, Y.E.; Ramires, C.F.; Saraiva, S.A.; Sanvido, G.B.; Schmidt, E.M.; Maia, D.R.; Cosso, R.G.; Zacca, J.J.; et al. Whisky analysis by electrospray ionization-Fourier transform mass spectrometry. Food Res. Int. 2013, 51, 98–106. [Google Scholar] [CrossRef] [Green Version]
  17. Dias, A.A.; Cardoso, T.M.; Chagas, C.L.; Oliveira, V.X.; Munoz, R.A.; Henry, C.S.; Santana, M.H.; Paixão, T.R.; Coltro, W.K. Detection of analgesics and sedation drugs in whiskey using electrochemical paper-based analytical devices. Electroanalysis 2018, 30, 2250–2257. [Google Scholar] [CrossRef]
  18. Heller, M.; Vitali, L.; Oliveira, M.A.L.; Costa, A.C.O.; Micke, G.A. A rapid sample screening method for authenticity control of whiskey using capillary electrophoresis with online preconcentration. J. Agric. Food Chem. 2011, 59, 6882–6888. [Google Scholar] [CrossRef]
  19. Boyaci, I.H.; Genis, H.E.; Guven, B.; Tamer, U.; Alper, N. A novel method for quantification of ethanol and methanol in distilled alcoholic beverages using Raman spectroscopy. J. Raman Spectrosc. 2012, 43, 1171–1176. [Google Scholar] [CrossRef]
  20. Nogueira, S.A.; Lemes, A.D.; Chagas, A.C.; Vieira, M.L.; Talhavini, M.; Morais, P.A.; Coltro, W.K. Redox titration on foldable paper-based analytical devices for the visual determination of alcohol content in whiskey samples. Talanta 2019, 194, 363–369. [Google Scholar] [CrossRef]
  21. Chen, J.C.; Naglak, T.J.; Wang, H.Y. An amperometric alcohol sensor based on chemically permeabilized methylotrophic microorganisms. Biotechnol. Prog. 1992, 8, 161–164. [Google Scholar] [CrossRef]
  22. Jornet-Martínez, N.; Gómez-Ojea, R.; Tomás-Huercio, O.; Herráez-Hernández, R.; Campíns-Falcó, P. Colorimetric determination of alcohols in spirit drinks using a reversible solid sensor. Food Control 2018, 94, 7–16. [Google Scholar] [CrossRef]
  23. Wongniramaikul, W.; Limsakul, W.; Choodum, A. A biodegradable colorimetric film for rapid low-cost field determination of formaldehyde contamination by digital image colorimetry. Food Chem. 2018, 249, 154–161. [Google Scholar] [CrossRef]
  24. Ratnarathorn, N.; Chailapakul, O.; Henry, C.S.; Dungchai, W. Simple silver nanoparticle colorimetric sensing for copper by paper-based devices. Talanta 2012, 99, 552–557. [Google Scholar] [CrossRef]
  25. Choodum, A.; Keson, J.; Kanatharana, P.; Limsakul, W.; Wongniramaikul, W. Selective pre and post blast trinitrotoluene detection with a novel ethylenediamine entrapped thin polymer film and digital image colorimetry. Sens. Actuators B Chem. 2017, 252, 463–469. [Google Scholar] [CrossRef]
  26. Choodum, A.; Kanatharana, P.; Wongniramaikul, W.; Daeid, N.N. Using the iPhone as a device for a rapid quantitative analysis of trinitrotoluene in soil. Talanta 2013, 115, 143–149. [Google Scholar] [CrossRef] [PubMed]
  27. Huang, X.-W.; Zou, X.-B.; Shi, J.-Y.; Li, Z.-H.; Zhao, J.-W. Colorimetric sensor arrays based on chemo-responsive dyes for food odor visualization. Trends Food Sci. Technol. 2018, 81, 90–107. [Google Scholar] [CrossRef]
  28. Apilux, A.; Siangproh, W.; Praphairaksit, N.; Chailapakul, O. Simple and rapid colorimetric detection of Hg (II) by a paper-based device using silver nanoplates. Talanta 2012, 97, 388–394. [Google Scholar] [CrossRef] [PubMed]
  29. Thipwimonmas, Y.; Jaidam, J.; Samoson, K.; Khunseeraksa, V.; Phonchai, A.; Thiangchanya, A.; Chang, K.H.; Abdullah, A.F.L.; Limbut, W. A Simple and Rapid Spectrophotometric Method for Nitrite Detection in Small Sample Volumes. Chemosensors 2021, 9, 161. [Google Scholar] [CrossRef]
  30. Fletcher, P.J.; Van Staden, J.F. Determination of ethanol in distilled liquors using sequential injection analysis with spectrophotometric detection. Anal. Chim. Acta 2003, 499, 123–128. [Google Scholar] [CrossRef]
  31. Vicente, S.; Zagatto, E.A.; Pinto, P.C.; Saraiva, M.L.M.; Lima, J.L.; Borges, E.P. Exploiting gas diffusion for non-invasive sampling in flow analysis: Determination of ethanol in alcoholic beverages. An. Acad. Bras. Ciênc. 2006, 78, 23–29. [Google Scholar] [CrossRef] [Green Version]
  32. Horwitz, W. Official Methods of Analysis of AOAC International. Volume I, Agricultural Chemicals, Contaminants, Drugs; William, H., Ed.; AOAC International: Gaithersburg, MD, USA, 1997. [Google Scholar]
  33. Phonchai, A.; Rattana, S.; Thongprajukaew, K. A portable sol-gel urea colorimetric method for the determination of urea in feedstuffs. Food Chem. 2020, 319, 126545. [Google Scholar] [CrossRef] [PubMed]
  34. AOAC. Official Methods of Analysis of AOAC International; AOAC International: Rockville, MD, USA, 2016; ISBN 978-0-935584-87-5. [Google Scholar]
  35. Xu, Z.; Miyazaki, K.; Hori, T. Dopamine-Induced Superhydrophobic Melamine Foam for Oil/Water Separation. Adv. Mater. Interfaces 2015, 2, 1500255. [Google Scholar] [CrossRef]
  36. Timmer, W.C. An experiment in forensic chemistry: The Breathalyzer. J. Chem. Educ. 1986, 63, 897. [Google Scholar] [CrossRef]
  37. Sarkar, A.; Goh, K.K.; Singh, H. Colloidal stability and interactions of milk-protein-stabilized emulsions in an artificial saliva. Food Hydrocoll. 2009, 23, 1270–1278. [Google Scholar] [CrossRef]
  38. Peng, B.; Chen, G.; Li, K.; Zhou, M.; Zhang, J.; Zhao, S. Dispersive liquid-liquid microextraction coupled with digital image colorimetric analysis for detection of total iron in water and food samples. Food Chem. 2017, 230, 667–672. [Google Scholar] [CrossRef]
Figure 1. Procedure for preparation of foam-based colorimetric sensor (A), and colorimetric sensor for detection of alcohol (B).
Chemosensors 09 00334 g001
Figure 2. SEM images of the supporting foam (A). Digital images and EDXRF spectra of the supporting foam before (B,D) and after (C,E) adsorption of the colorimetric reagent.
Chemosensors 09 00334 g002
Figure 3. The RGB values (A) and absorption spectra (B) of alcohol from 0.00 to 1.00% v/v. Full-foam photographs with their cropped images before and after exposure to the alcohol at 0.10, 0.50 and 1.0% v/v (C).
Chemosensors 09 00334 g003
Figure 4. The effect on the sensitivity of alcohol detection of potassium dichromate concentration (A), sulfuric acid concentration (B), adsorption time of colorimetric reagent (C) and sample volume (D).
Chemosensors 09 00334 g004
Figure 5. Plot of Δ intensity against alcohol concentration: inset shows images of the foam-based colorimetric sensor obtained after testing with alcohol at concentrations of 0.1 to 10% v/v (A). The reproducibility of the developed foam-based alcohol colorimetric sensor (B). The stability of response of the proposed sensor after storage at 25 °C and 4 °C before (C) and after (D) detection of 1.0% (v/v) alcohol.
Chemosensors 09 00334 g005
Figure 6. The effect of possible interferences in saliva on the detection of alcohol by the foam-based colorimetric sensor. The digital color images of the foam-based colorimetric alcohol sensor in the presence of 1640-fold for NH4NO3, 1500-fold for NaCl, 1100-fold for KCl, 1000-fold for urea, 800-fold for KH2PO4, 54-fold for NH4Cl, 34-fold for sucrose and lactose, 18-fold for glucose fructose and galactose, 7-fold for NaNO3 and 2-fold for ascorbic acid.
Chemosensors 09 00334 g006
Table 1. Comparison of results from the determination of alcohol in saliva samples of seven volunteers (n = 6) by the proposed method, a spectrophotometric method and an alcohol tester. (Note that the legal blood alcohol concentration (%BAC) for drivers cannot exceed 0.05% [4,5].)
SampleFoam-Based Alcohol Colorimetric Sensor (n = 6)%Recovery Spectrophotometric
Method (n = 3)
%Recovery Alcohol Meter (n = 3)
Found AddedFound Added(% v/v)%BAC
Saliva 1 1.31 ± 0.050.597.2 ± 0.011.33 ± 0.050.5100.7 ± 0.021.10 ± 0.020.15 ± 0.01
1.0101.4 ± 0.011.0102.0 ± 0.01
5.0101.9 ± 0.085.098.9 ± 0.08
Saliva 21.34 ± 0.020.5101.4 ± 0.011.30 ± 0.020.599.9 ± 0.021.17 ± 0.030.16 ± 0.01
1.098.7 ± 0.021.099.5 ± 0.03
5.099.3 ± 0.075.0100.8 ± 0.06
Saliva 3 0.49 ± 0.030.598.3 ± 0.010.51 ± 0.020.598.2 ± 0.011.03 ± 0.030.14 ± 0.01
1100.2 ± 0.021.098.3 ± 0.02
5101.2 ± 0.045.099.1 ± 0.04
Saliva 41.04 ± 0.010.5101.9 ± 0.011.01 ± 0.010.5101.6 ± 0.041.10 ± 0.020.15 ± 0.0
1.099.8 ± 0.021.0101.1 ± 0.02
5.099.8 ± 0.065.0100.0 ± 0.03
Saliva 5 0.35 ± 0.010.599.4 ± 0.010.37 ± 0.010.599.2 ± 0.011.03 ± 0.020.14 ± 0.01
1.0101.4 ± 0.011.0100.5 ± 0.01
5.099.6 ± 0.035.0100.5 ± 0.03
Saliva 61.23 ± 0.030.599.4 ± 0.021.26 ± 0.030.599.2 ± 0.011.10 ± 0.010.15 ± 0.01
1.0101.4 ± 0.011.0101.2 ± 0.01
5.099.9 ± 0.045.0100.8 ± 0.03
0.5100.4 ± 0.03 0.599.5 ± 0.01
Saliva 7 *N.D.1.099.8 ± 0.04N.D.1.0100.1 ± 0.02N.D.N.D.
5.099.3 ± 0.04 5.098.4 ± 0.03
* Saliva of sober; N.D. = Not detected.
Publisher’s Note: MDPI stays neutral with regard to jurisdictional claims in published maps and institutional affiliations.

