1. Introduction
Complexation of the DNA molecules with the polymeric and macrocyclic carriers has become popular in recent decades due to growing interest in the application of DNA vaccines and oligonucleotide-based drugs [
1]. Thus, four DNA anti-COVID-19 vaccines are presently available for animal use [
2] but are not licensed for humans. Several nucleic acid vaccines are in development for the COVID-19 prophylaxis [
3]. Nuclear acid medicines are applied for treatment of pancreatic cancer [
4]; multiple sclerosis [
5]; hepatic venoocclusive disease [
6]; viral, bacterial or parasitic diseases [
7]; as well as in gene therapy of cardiovascular diseases [
8].
Medical application of oligonucleotides and DNA shows the importance of developing protection and storage systems preventing enzymatic digestions of biopolymers and their target delivery and release in target tissues [
9]. Chemical encapsulation via multiple non-covalent interactions is considered as one of the most promising issues in this area of research [
10]. It includes the formation of polyelectrolyte complexes with natural [
11] and synthetic [
12,
13] counterparts, self-assembling of solid lipid nanoparticles, liposomes and vesicles [
14,
15,
16]. Their behavior in living beings, including drug release or changes in accessibility of DNA domains for biospecific interactions, are regulated by external stimuli, i.e., pH and ionic strength shifts [
17], fluorescence, UV and IR irradiation, etc. [
18]. Further progress in this area depends on the development of novel materials able to assemble with DNA and sensitive to microenvironment structural changes near the DNA binding sites.
It is expected that new supramolecular systems will be designed for both DNA binding and small molecules release. They are demanded in the development of DNA-based vaccines, drug delivery systems and DNA sensors for the determination of drugs, toxins and contaminants in biological liquids, foodstuffs and environment. Polyfunctional compounds similar to dendrimers or hyper-branched polymers with hydrophilic terminal groups are one of the promising candidates in this area. They are able to electrostatic interactions with phosphate groups of the DNA backbone and can participate in flexible rearrangements to meet specific DNA configurations and provide access for small reactants involved in specific DNA interactions. High variability of the structure of such compounds is achieved by implementation of the charged and polar groups and variation in the length of spacers between the core of the molecule and the binding sites. Macrocyclic compounds, e.g., cyclodextrins [
19,
20], pillararenes [
21,
22], and calixarene derivatives [
23], have been described in the formation of supramolecular complexes with participation of DNA and small molecules able to specifically bind DNA. Thus, complexation of daunorubicin with β-cyclodextrin accelerated the intercalation of DNA [
24]. Formulations with DNA and carboxymethyl-β-cyclodextrin showed high stability, indicating high incorporation of DNA within the macrocycle [
25]. Pillar[5]arene derivatives were tested in DNA compactization [
26] and assembling of nanocontainers in gene therapy [
27]. Being flexible and effective in target interactions, such compounds exert some limitations related to hydrophobic–hydrophilic balance and related problems of solubility and applicability in sensor format.
Recently, several derivatives of thiacalix[4]arene with cationic functional groups have been synthesized and applied in the DNA study [
28,
29,
30]. The aggregation and self-aggregation of the macrocycles were promoted by the DNA binding. This made it possible to assemble solid lipid nanoparticles with inclusion of hydrophobic guests and to determine the DNA intercalators with electrochemical sensors. In these works, the importance of the microenvironment of the macrocyclic core on the aggregation and the DNA binding abilities was confirmed. However, no examples of the use of asymmetrical thiacalix[4]arene derivatives of dendrimer-like structure were found in the literature for the DNA binding and aggregation. In this work, the influence of various factors on the interaction of DNA with the thiacalixarene derivative bearing eight amino groups has been explored by means of redox probes different in their charge and ability to specific interactions with DNA.
2. Materials and Methods
2.1. Reagents
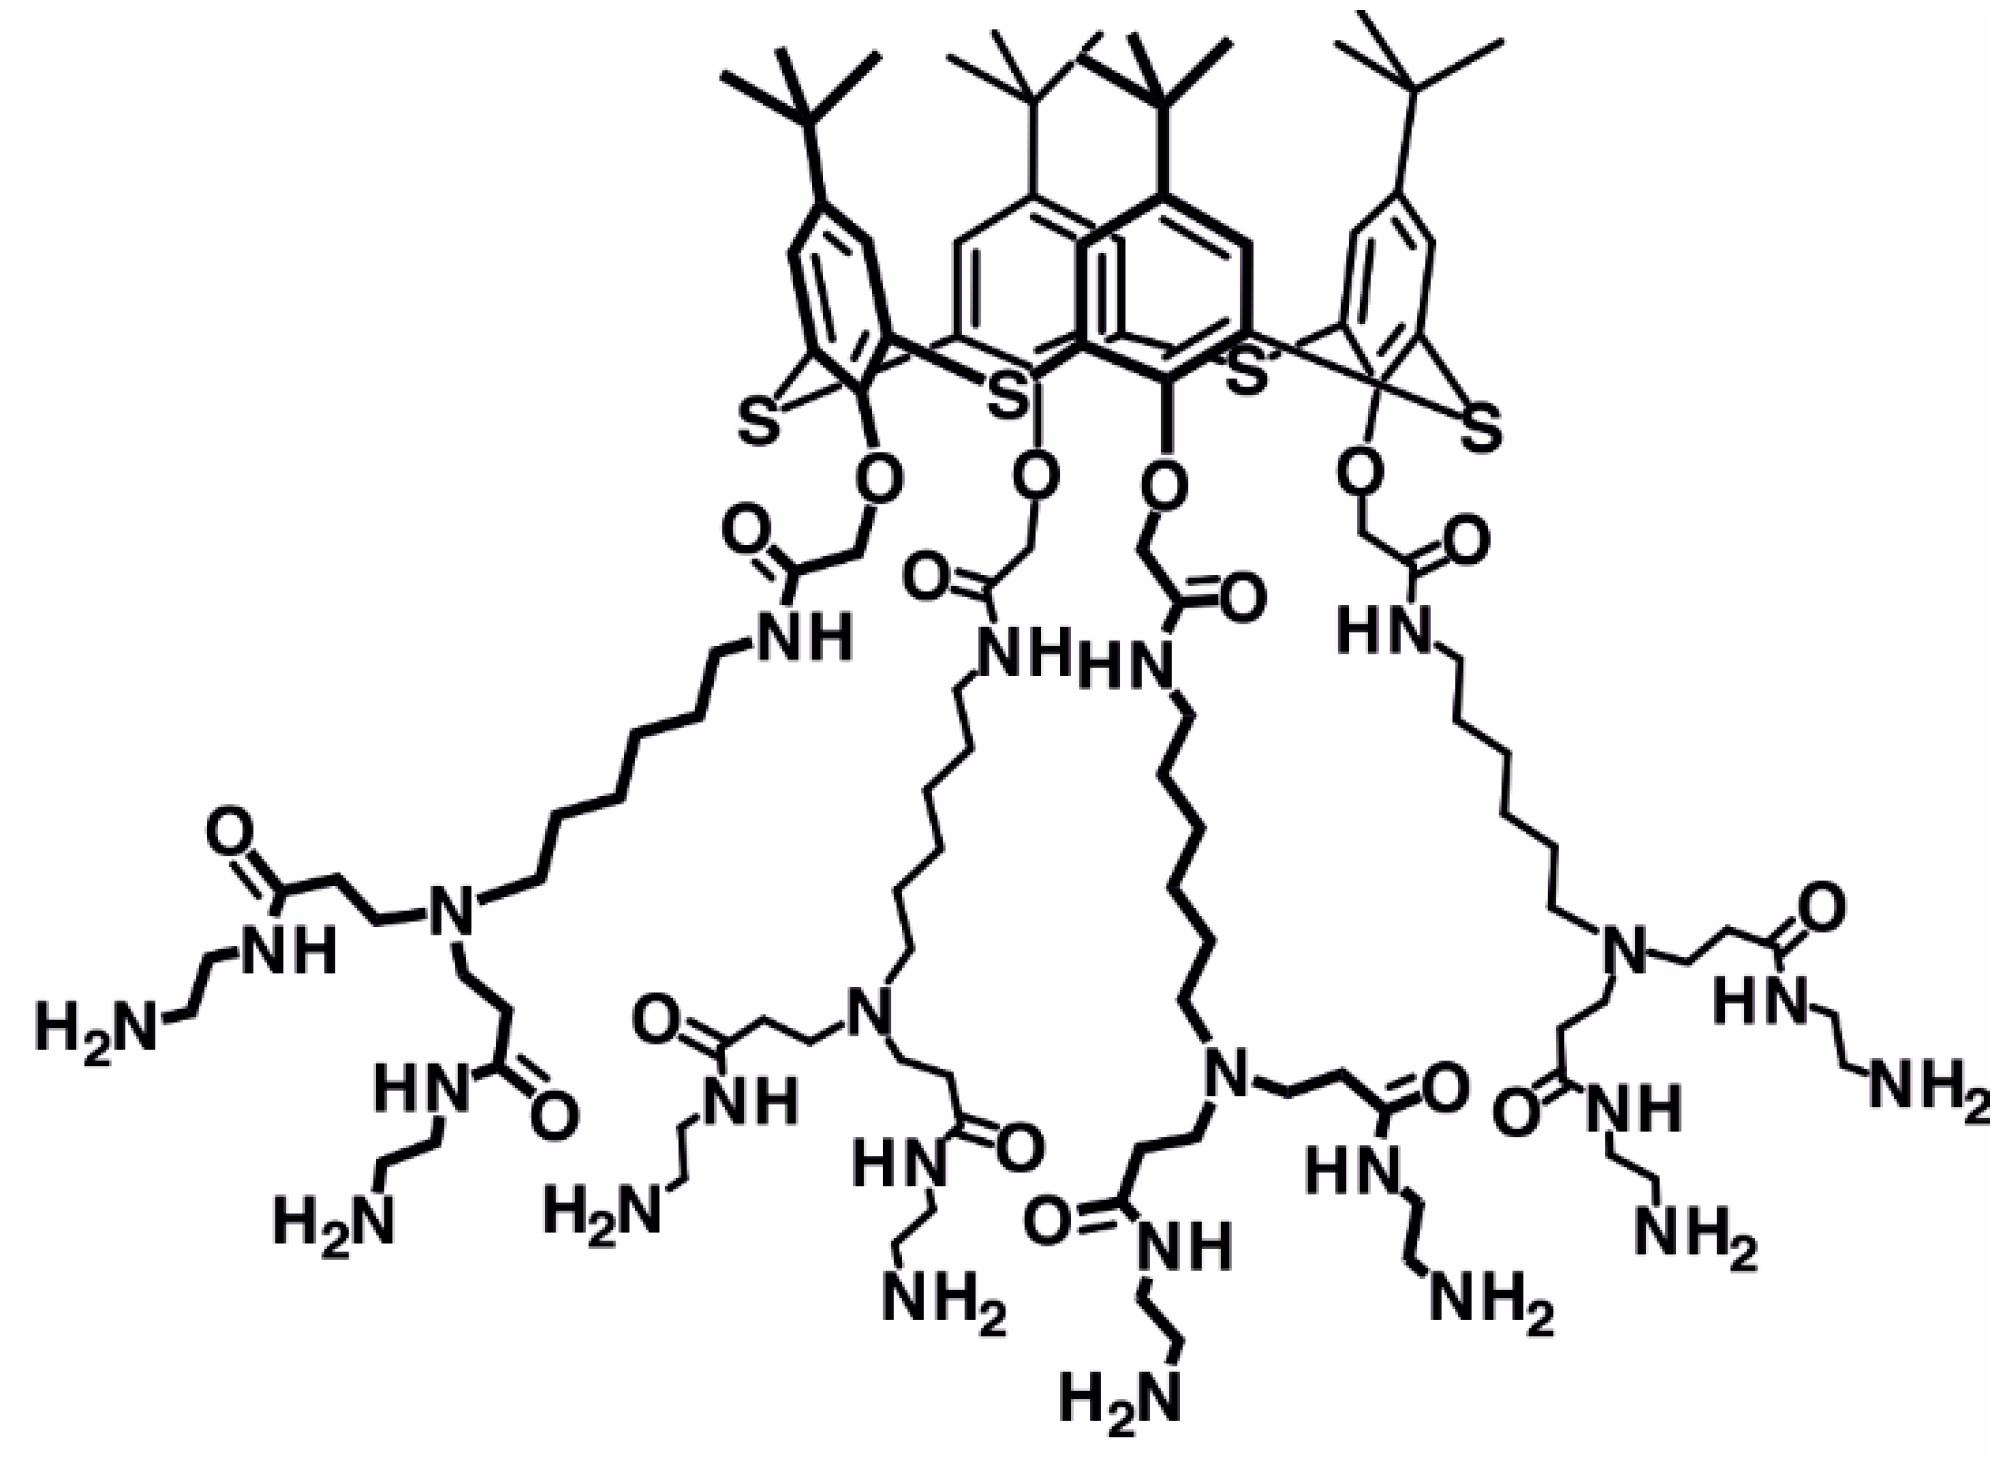
5,11,17,23-Tetra-
tert-butyl-25,26,27,28-tetrakis[
N-(6-(
N,N-di(
N-(2-aminoethyl)carbamoylethyl)amino)hexyl)carbamoylmethoxy]-2,8,14,20-tetrathiacalix[4]arene (TC) was synthesized at the Organic and Medicinal Chemistry Department of Kazan Federal University, as described elsewhere [
31]. The structure and purity of the compound were proved by
1H NMR and
13C NMR spectroscopy, MALDI mass-spectrometry, FTIR ATR spectroscopy and elemental analysis. The structure of the compound is presented in
Figure 1.
Low-molecular DNA from salmon tests (liophylized powder, <5% protein, A260/280 1.4), doxorubicin hydrochloride ((7S,9S)-7-[(2R,4S,5S,6S)-4-amino-5-hydroxy-6-methyloxan-2-yl]oxy-6,9,11-trihydroxy-9-(2-hydroxyacetyl)-4-methoxy-8,10-dihydro-7H-tetracene-5,12-dione, 98–102%), potassium hexacyanoferrate (III) (99%) and potassium hexacyanoferrate (II) (98.5–102%) were purchased from Sigma-Aldrich, Dortmund, Germany; chitosan (mol. weight 100,000–30,000 D) from Acros Organics; and carbon black (CB, >99.95% C) from Imerys. All the working solutions were prepared using Millipore Q® water (Simplicity® water purification system, Merck-Millipore, Molsheim, France). Other reagents were of analytical grade. Electrochemical measurements were performed in 0.1 M HEPES, pH = 7.0.
2.2. Apparatus
Direct current linear sweep voltammetry was used for electrode characterization at room temperature using Autolab PGSTAT 302N (Metrohm Autolab b.v., Utrecht, The Netherlands). All the measurements were performed in the 5 mL three-electrode cell equipped with GCE (ALS Co Ltd., Tokyo, Japan, Cat. No 012744, working area 0.283 cm2) modified with CB, TC and DNA as working electrode; Pt wire (ALS Co Ltd., Tokyo, Japan, Cat. No 002233) as auxiliary electrode; and the Ag/AgCl/3 M KCl reference electrode (Metrohm Autolab Cat. No 6.0726.107). Electrochemical impedance spectroscopy (EIS) measurements were performed with the FRA 2 module of the Autolab PGSTAT 302N. The potential frequency was varied from 100 kHz to 0.04 Hz, amplitude of sine potential was equal to 5 mV and equilibrium potential was calculated as a half sum of peak potentials on cyclic voltammograms recorded on the modified electrode in the equimolar mixture of 10 mM [Fe(CN)6]3−/4− ions. The EIS parameters were calculated from the Nyquist diagram corresponding to the R(RC)(RC) equivalent circuit using the NOVA 1.11 software (Metrohm Autolab).
Scanning electron microscopy (SEM) images of the electrode coatings were obtained with the high-resolution field emission scanning electron microscope Merlin™ (Carl Zeiss, Jena, Germany).
2.3. GCE Modification
Glassy carbon electrode (GCE) was mechanically polished and cleaned by washing with acetone and deionized water. After that, its potential was cycled in the range from −1.0 to 1.0 V in 0.1 M H2SO4 until the background current stabilization. Then, the GCE was washed with deionized water and dried at ambient temperature. The CB suspension was prepared by sonication of the CB in chitosan (1.35 mg in 1 mL of 0.375% solution of chitosan in 0.05 M HCl). For electrode modification, 2 μL of the CB suspension were mixed with 1 μL of 1.0 M NaOH placed on the GCE working area and dried for 50 °C for 20 min. After that, the electrode was gently washed with deionized water to remove a whitish film of excessive salts. The electrode was dried again and 5 μL of TC solution in the concentration ranged from 5.0 μM to 0.5 mM taken separately or together with 0.4 mg/mL DNA from salmon sperm were put on the surface. In some experiments, the concentration of DNA was varied from 0.1 to 1.0 mg/mL. Thermal denaturation of DNA was performed by slow heating of the DNA solution to 90 °C, incubation for 30 min and sharp cooling to ambient temperature in ice bath. Here, final concentrations of reagents after their mixing are presented. The assembling of the surface layer was monitored using SEM and EIS measurements. The interaction of the DNA molecules with TC was assessed by direct current sweep voltammetry with methylene green, potassium ferricyanide or hydroquinone as redox probes. Changes in the peak currents were estimated as a measure of the surface layer permeability and charge distribution on the electrode interface.
3. Results
As was shown previously [
32], salmon sperm DNA can bind thiacalix[4]arene derivatives containing four amidoammonium fragments at the lower rim of the macrocycle. The complexation was studied by the UV spectroscopy, dynamic light scattering and transmission electron microscopy and resulted in formation of the aggregates with the size within 200 nm. Here, the interaction of the same DNA and a new thiacalix[4]arene derivative bearing twice more (eight) terminal amino groups was studied on the electrode interface. It was supposed that terminal amino groups of the macrocycle could be protonated and interact with the phosphate groups of the DNA backbone. The use of
cone conformation with maximal asymmetry of the spatial distribution of the amino groups resulted in dependence of the binding abilities on the conditions of the reaction including biospecific DNA interactions. Compactness and charge of the surface layer formed in the contact of DNA and TC were characterized using a number of small redox active species (ferricyanide ion, methylene green, and hydroquinone). They could penetrate the non-conductive layer of the TC/DNA complex and participate in the redox conversion on the electrode. Electrostatic interactions with the macrocycle and DNA molecules changed diffusion abilities and the surface concentration of the redox probes. In all the cases, cyclic voltammograms were recorded with appropriate redox probes added to the solution. The dependence of the peak currents on the ratio of the TC and DNA and on the other measurement conditions was considered for each redox probe.
3.1. Ferricyanide Ion
K
3[Fe(CN)
6] is a common redox indicator that is frequently used for the characterization of the DNA sensor assembling [
25,
33,
34]. Moreover, it is a part of redox pair applied in the faradaic EIS technique for assessment of the conditions of electron exchange on the modified electrodes including electrochemical biosensors. High density of negative charge, chemical and electrochemical stability make ferricyanide ion attractive for specific detection of any DNA changes at the electrode interface.
In this work, we started studying the TC–DNA interactions by recording the ferricyanide voltametric signal because it is negatively charged and hence cannot be accumulated on the aggregates formed on the electrode interface. Reversible pair of the peaks was recorded in ferricyanide solution on the GCE with physically adsorbed TC or TC/DNA mixture (
Figure S1). TC and DNA solutions were mixed prior to deposition on the electrode. The conditions of their interaction were similar to those previously established for the same reactants in solution [
31]. The shape of the ferricyanide peaks on voltammograms did not differ dramatically from those obtained on bare GCE. This might result from rather high permeability of the surface layer due to aggregation of the modifiers, which could not significantly affect the electrode reaction of highly charged [Fe(CN)
6]
3− ions.
To increase the sensitivity of the redox probe signal, the GCE was covered with the CB dispersed in chitosan. The CB particles have a roundish shape and exert good electroconductivity and sorption capacity applicable for assembling of biosensors with enzymes [
35]. Based on the Randles–Sevcik equation, the ratio of real and geometric surface area calculated from the ferricyanide cathodic peak current was equal to 1.8.
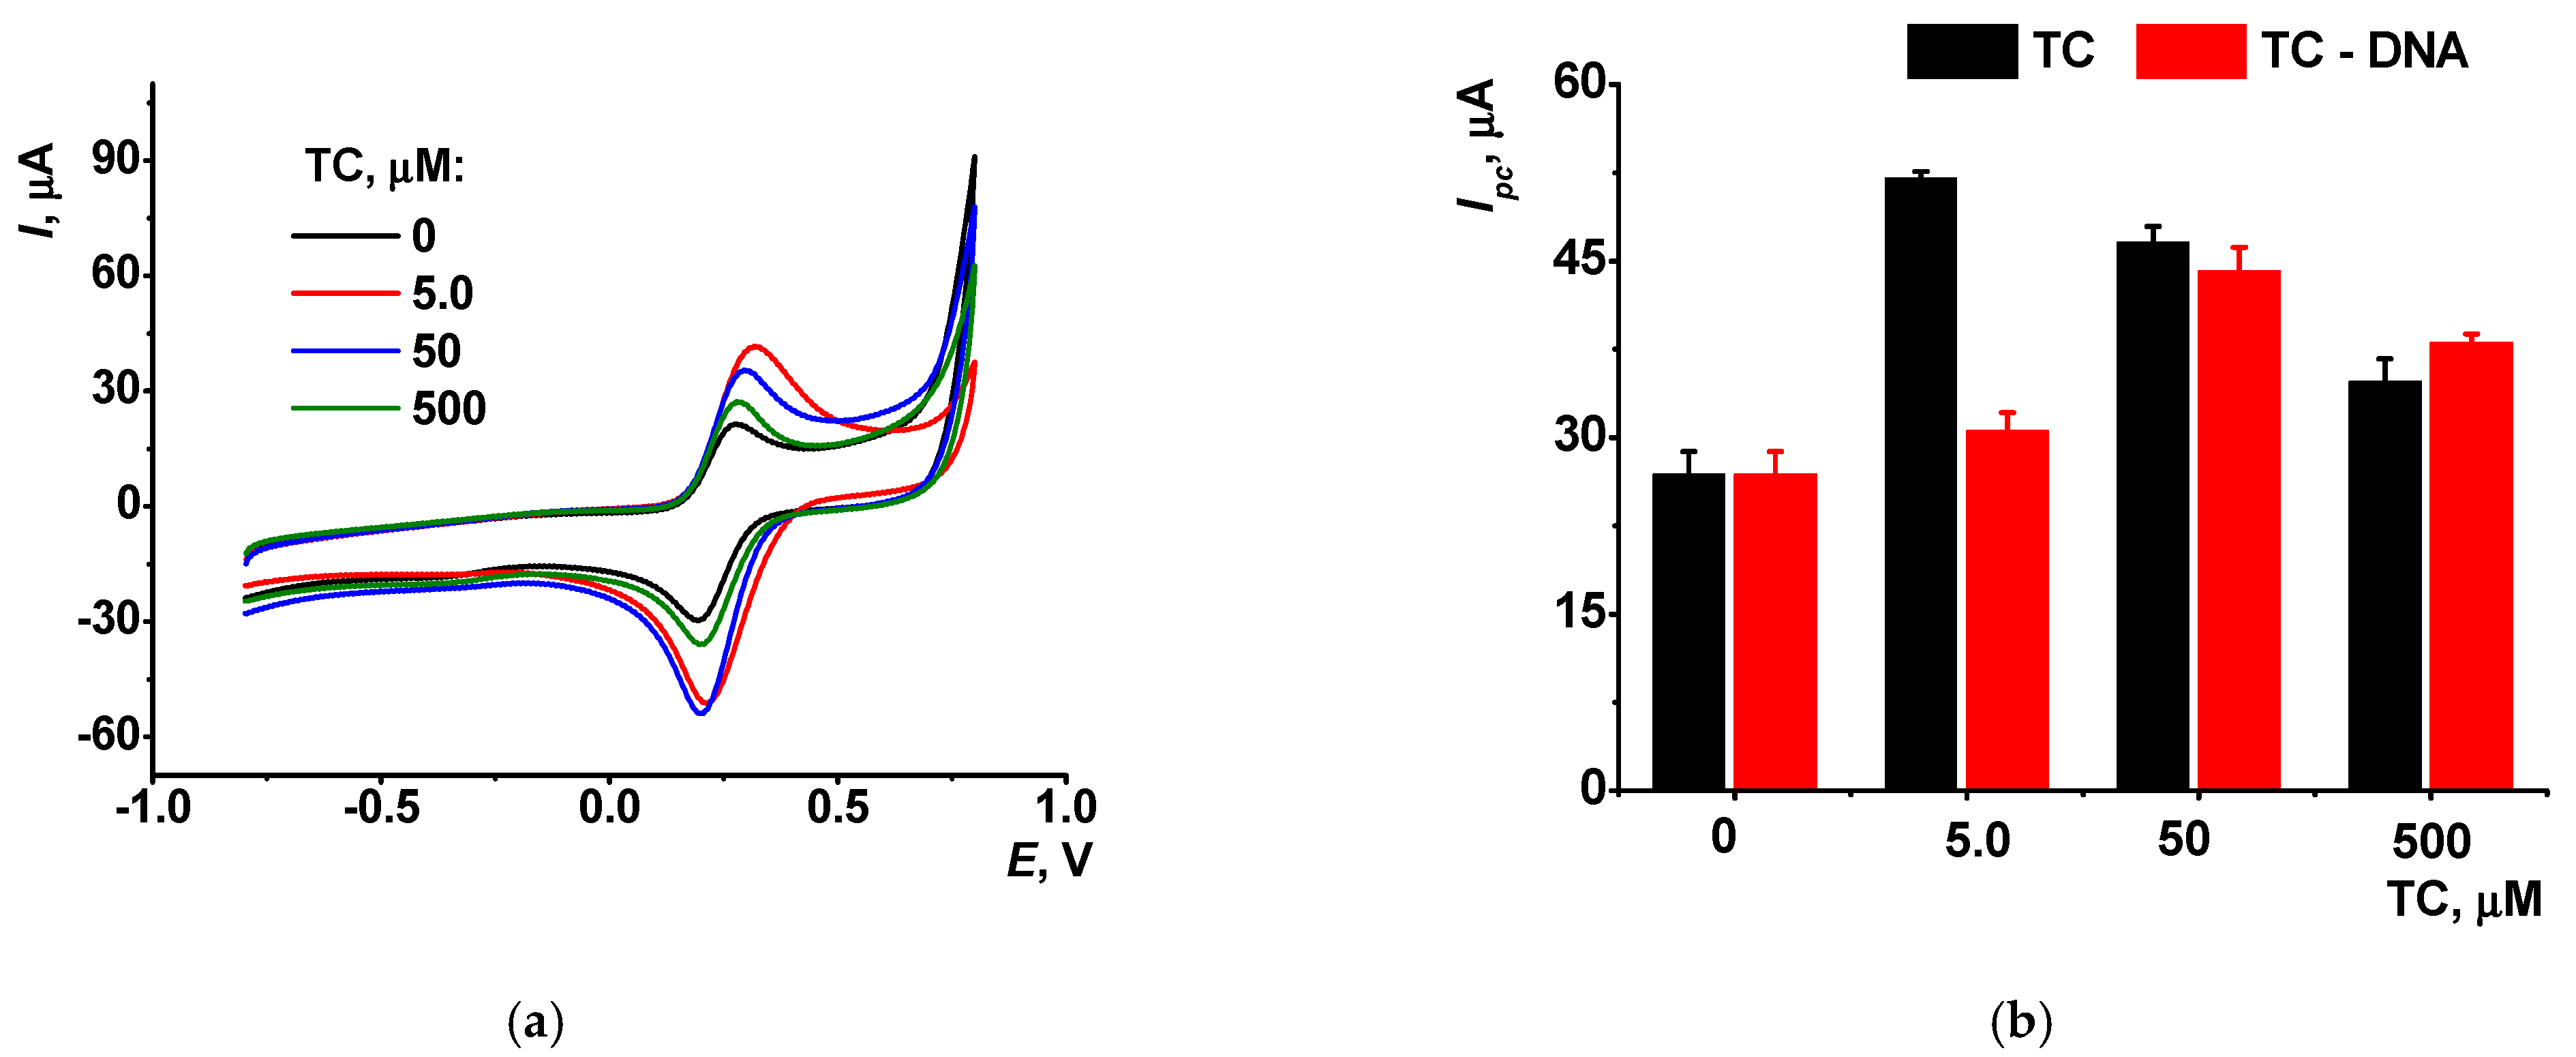
Adsorption of TC alone on the CB layer resulted in an increase in the [Fe(CN)
6]
3− peak currents probably due to compensation of the negative charge of the CB particles related to the carboxylate groups on their surface. Maximal influence of the macrocycle was observed for 5.0 μM TC (5 μL per electrode,
Figure 2).
Increase in the macrocycle concentration decreased the ferricyanide currents due to the formation of a thicker layer of non-conductive macrocycle and lower rate of the diffusional transfer of the redox probe to the electrode interface.
Interaction of the TC with DNA resulted in suppression of the TC effect at its lowest concentration. This might be due to neutralization of the positive charge of the macrocycle terminal groups in complexation with polyanionic DNA molecules. Meanwhile, such an effect of DNA became negligible at higher TC concentrations (
Figure 2b).
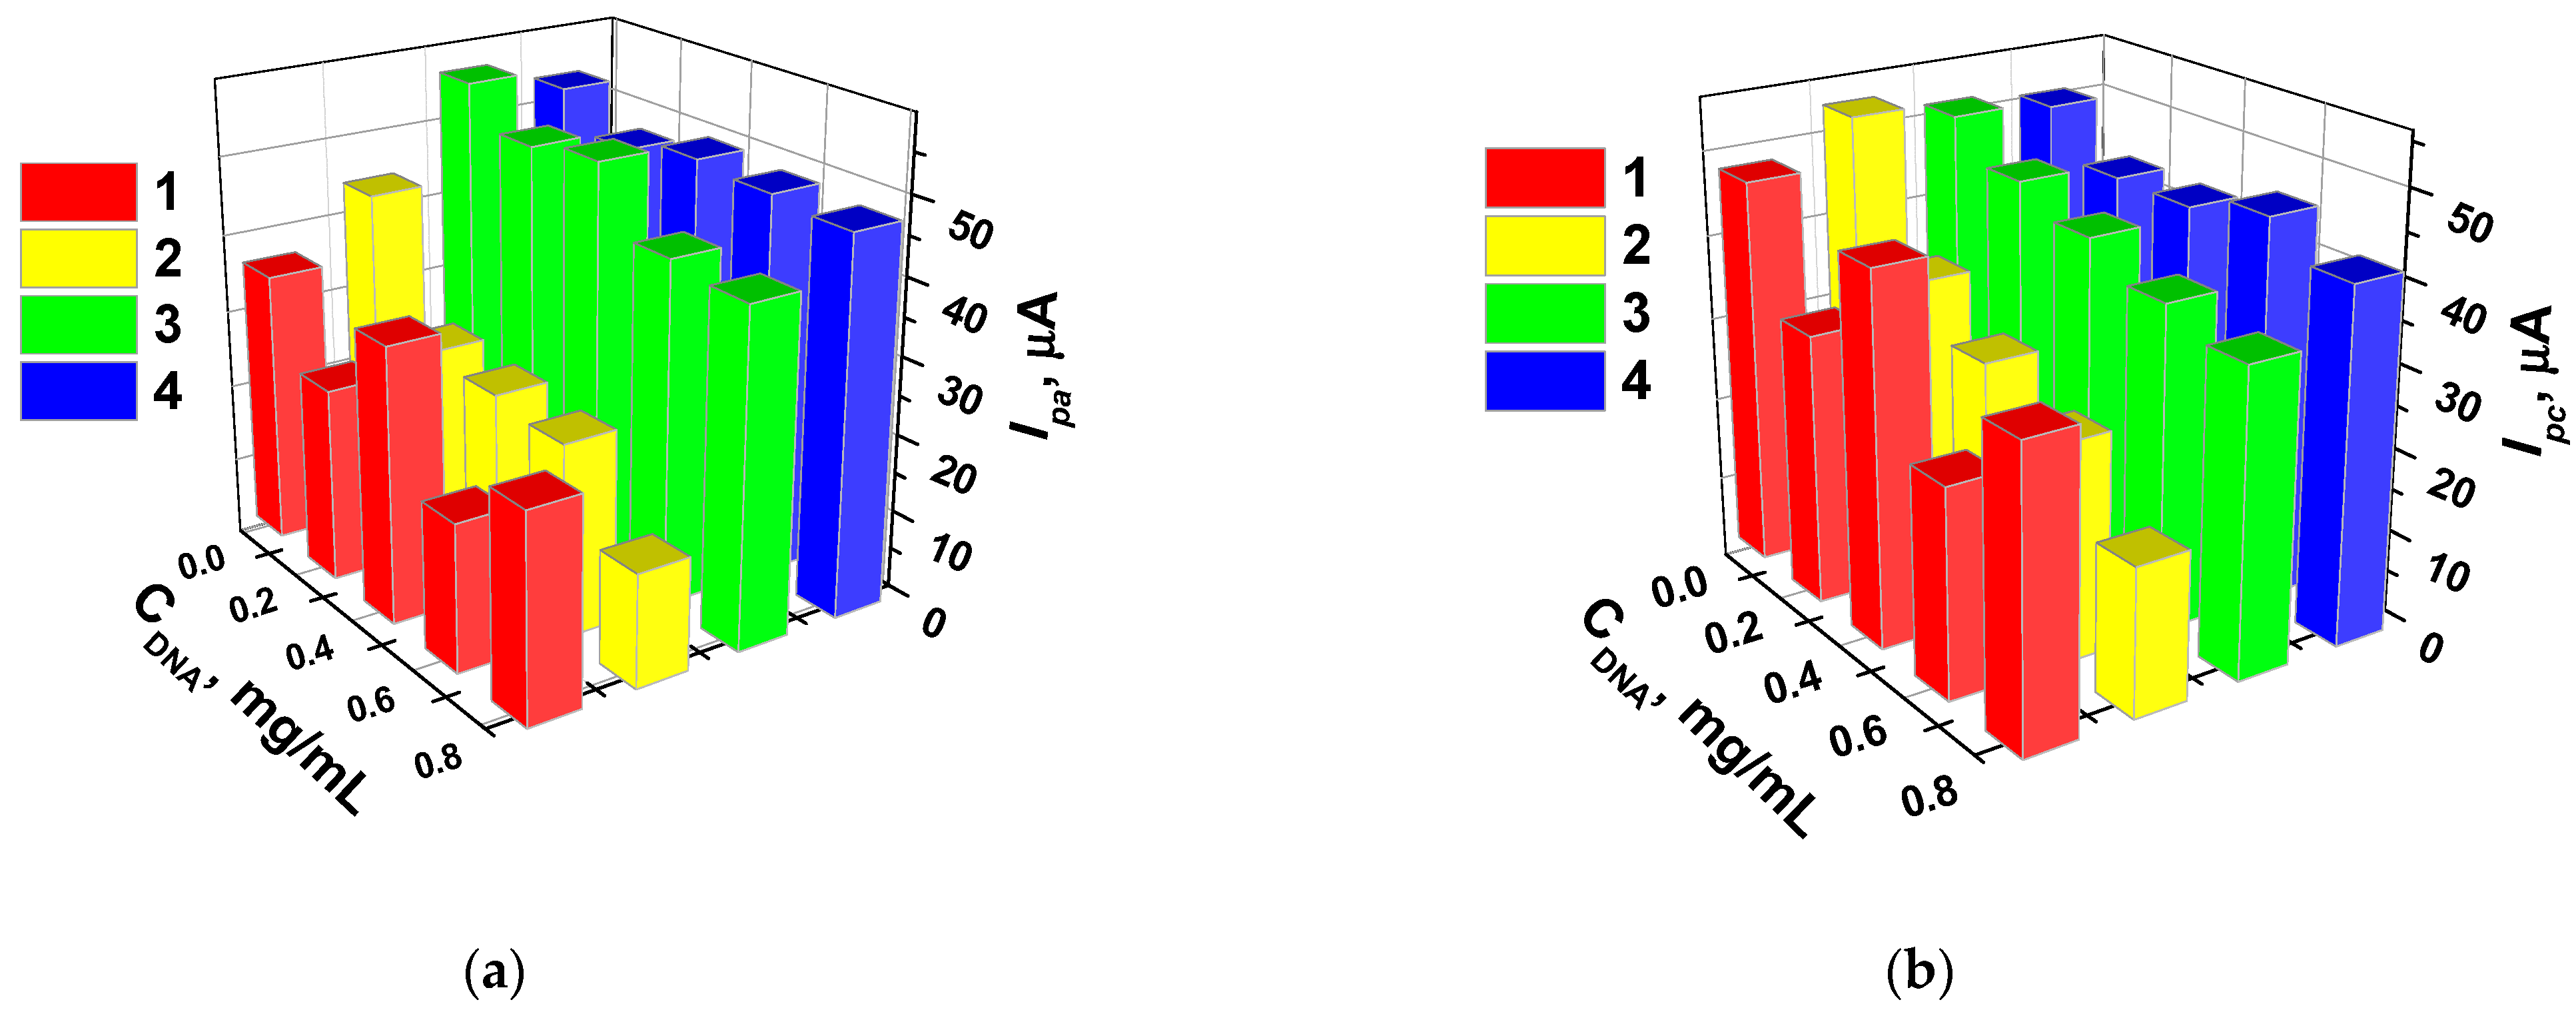
The influence of the DNA concentration was investigated in the presence of a constant quantity of TC (5.0 or 50 μM, 5 μL per electrode) in a similar manner. Appropriate anodic and cathodic ferricyanide peak currents are presented in
Figure 3 for various DNA concentrations taken on the complexation step.
Bigger DNA quantities mixed with the TC regularly decreased both cathodic and anodic ferricyanide peak currents. The effect is more pronounced for cathodic peak current and lower TC concentration. This might result from the changes in the charge of the complexes and variation of the electrostatic repulsion/attraction with anionic ferricyanide ion. It should be also mentioned that the
cone configuration of the macrocycle (see
Figure 1) can result in a not full compensation of the charge of the DNA phosphate residues even at high excess of the macrocycle.
As expected, the bare GCE showed lower changes in the ferricyanide peak currents against the CB-covered electrode. Surprisingly, deposition of the CB decreased the currents of the redox probe recorded in the presence of the TC and TC/DNA against those obtained with bare GCE. This might result from the effect of chitosan as a film-forming material or from a higher influence of the charge separation in comparison with the changes in the ferricyanide diffusion rate within the surface layer.
This statement was confirmed by comparison of the ferricyanide peak currents recorded on the electrodes covered with DNA with no macrocycle (
Figure S2). The addition of the TC to DNA always increased the ferricyanide peak currents due to partial shielding of the negative charge of phosphate groups of the backbone. The dependence is generally smoothened with a minor maximum at 0.4 mg/mL DNA.
3.2. EIS and SEM Measurements
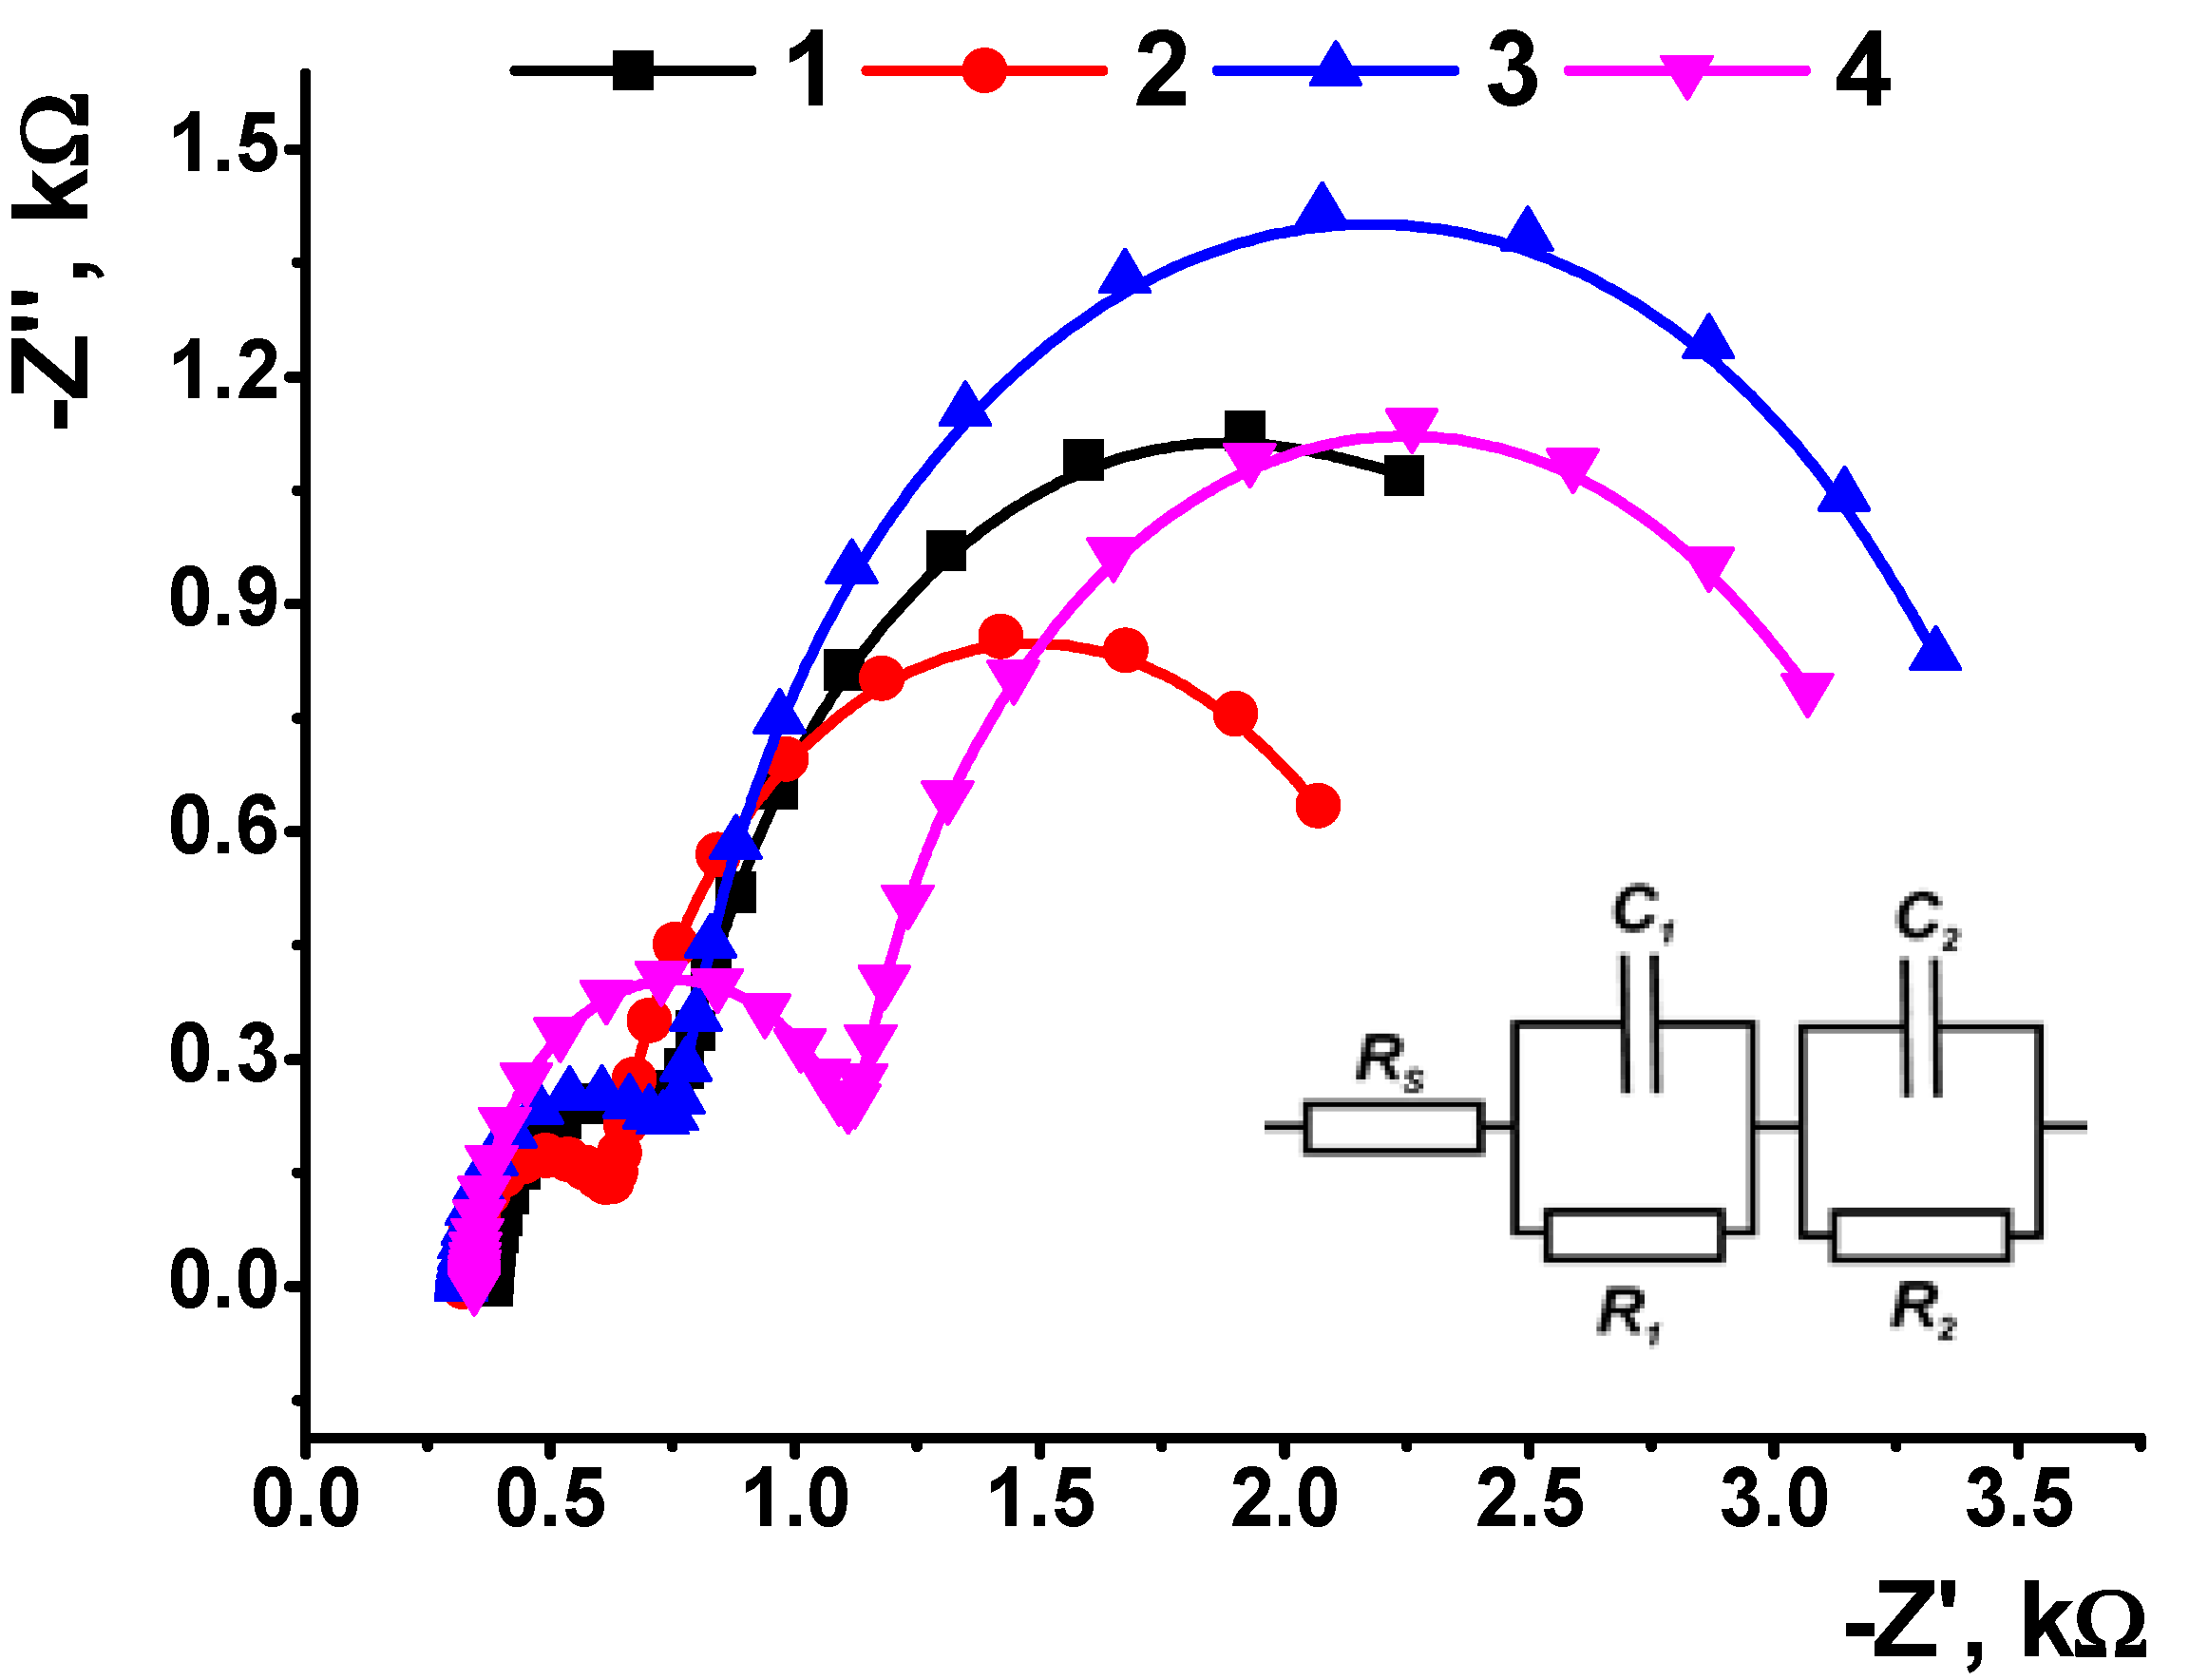
The transfer of the TC and the TC/DNA complex on the GCE was confirmed by the EIS experiments performed in the presence of 5 mM K
3[Fe(CN)
6] and 5 mM K
4[Fe(CN)
6]. The Nyquist diagrams contained two semi-circles in the area of high frequencies that corresponded to the limitation of the electron exchange on the inner (electrode–modifier) and outer (modifier–solution) interfaces (
Figure 4). The exponent factor of the constant phase element (
n) in all the experiments was very close to 1.0, demonstrating its ideal capacitance behavior.
The DNA adsorption did not affect the charge transfer resistance but decreased the capacitance on both interfaces. This coincides with the changes in the signals recorded with ferricyanide redox probe. The EIS parameters obtained for variously modified electrodes are summarized in
Table 1.
The introduction of the TC/DNA mixture onto the CB layer slightly increased the charge transfer resistance but decreased the capacitance on both interfaces due to neutralization of the negative charge of the layer by the amino groups of the macrocycle. The formation of the aggregates TC/DNA makes the EIS parameters more sensitive to the diffusional transfer of the ferri/ferrocyanide ions than to their electrostatic repulsion from anionic centers of the layer.
The fact of DNA inclusion was confirmed by incubation of the electrode in the solution of doxorubicin. This anticancer dye is often applied to detect the formation of double-stranded DNAs because it can intercalate the DNA helix and change its size and shape. In this study, doxorubicin treatment proved the accessibility of the DNA molecules interacted with the macrocycle for biospecific interactions. Furthermore, changes in the EIS parameters coincided well with the suggestion of DNA aggregation. Its intercalation decreased the density of the phosphate group charge and increased charge separation in the layer. As a result, the surface film became denser and thicker so that the charge transfer resistance increased against TC/DNA coating.
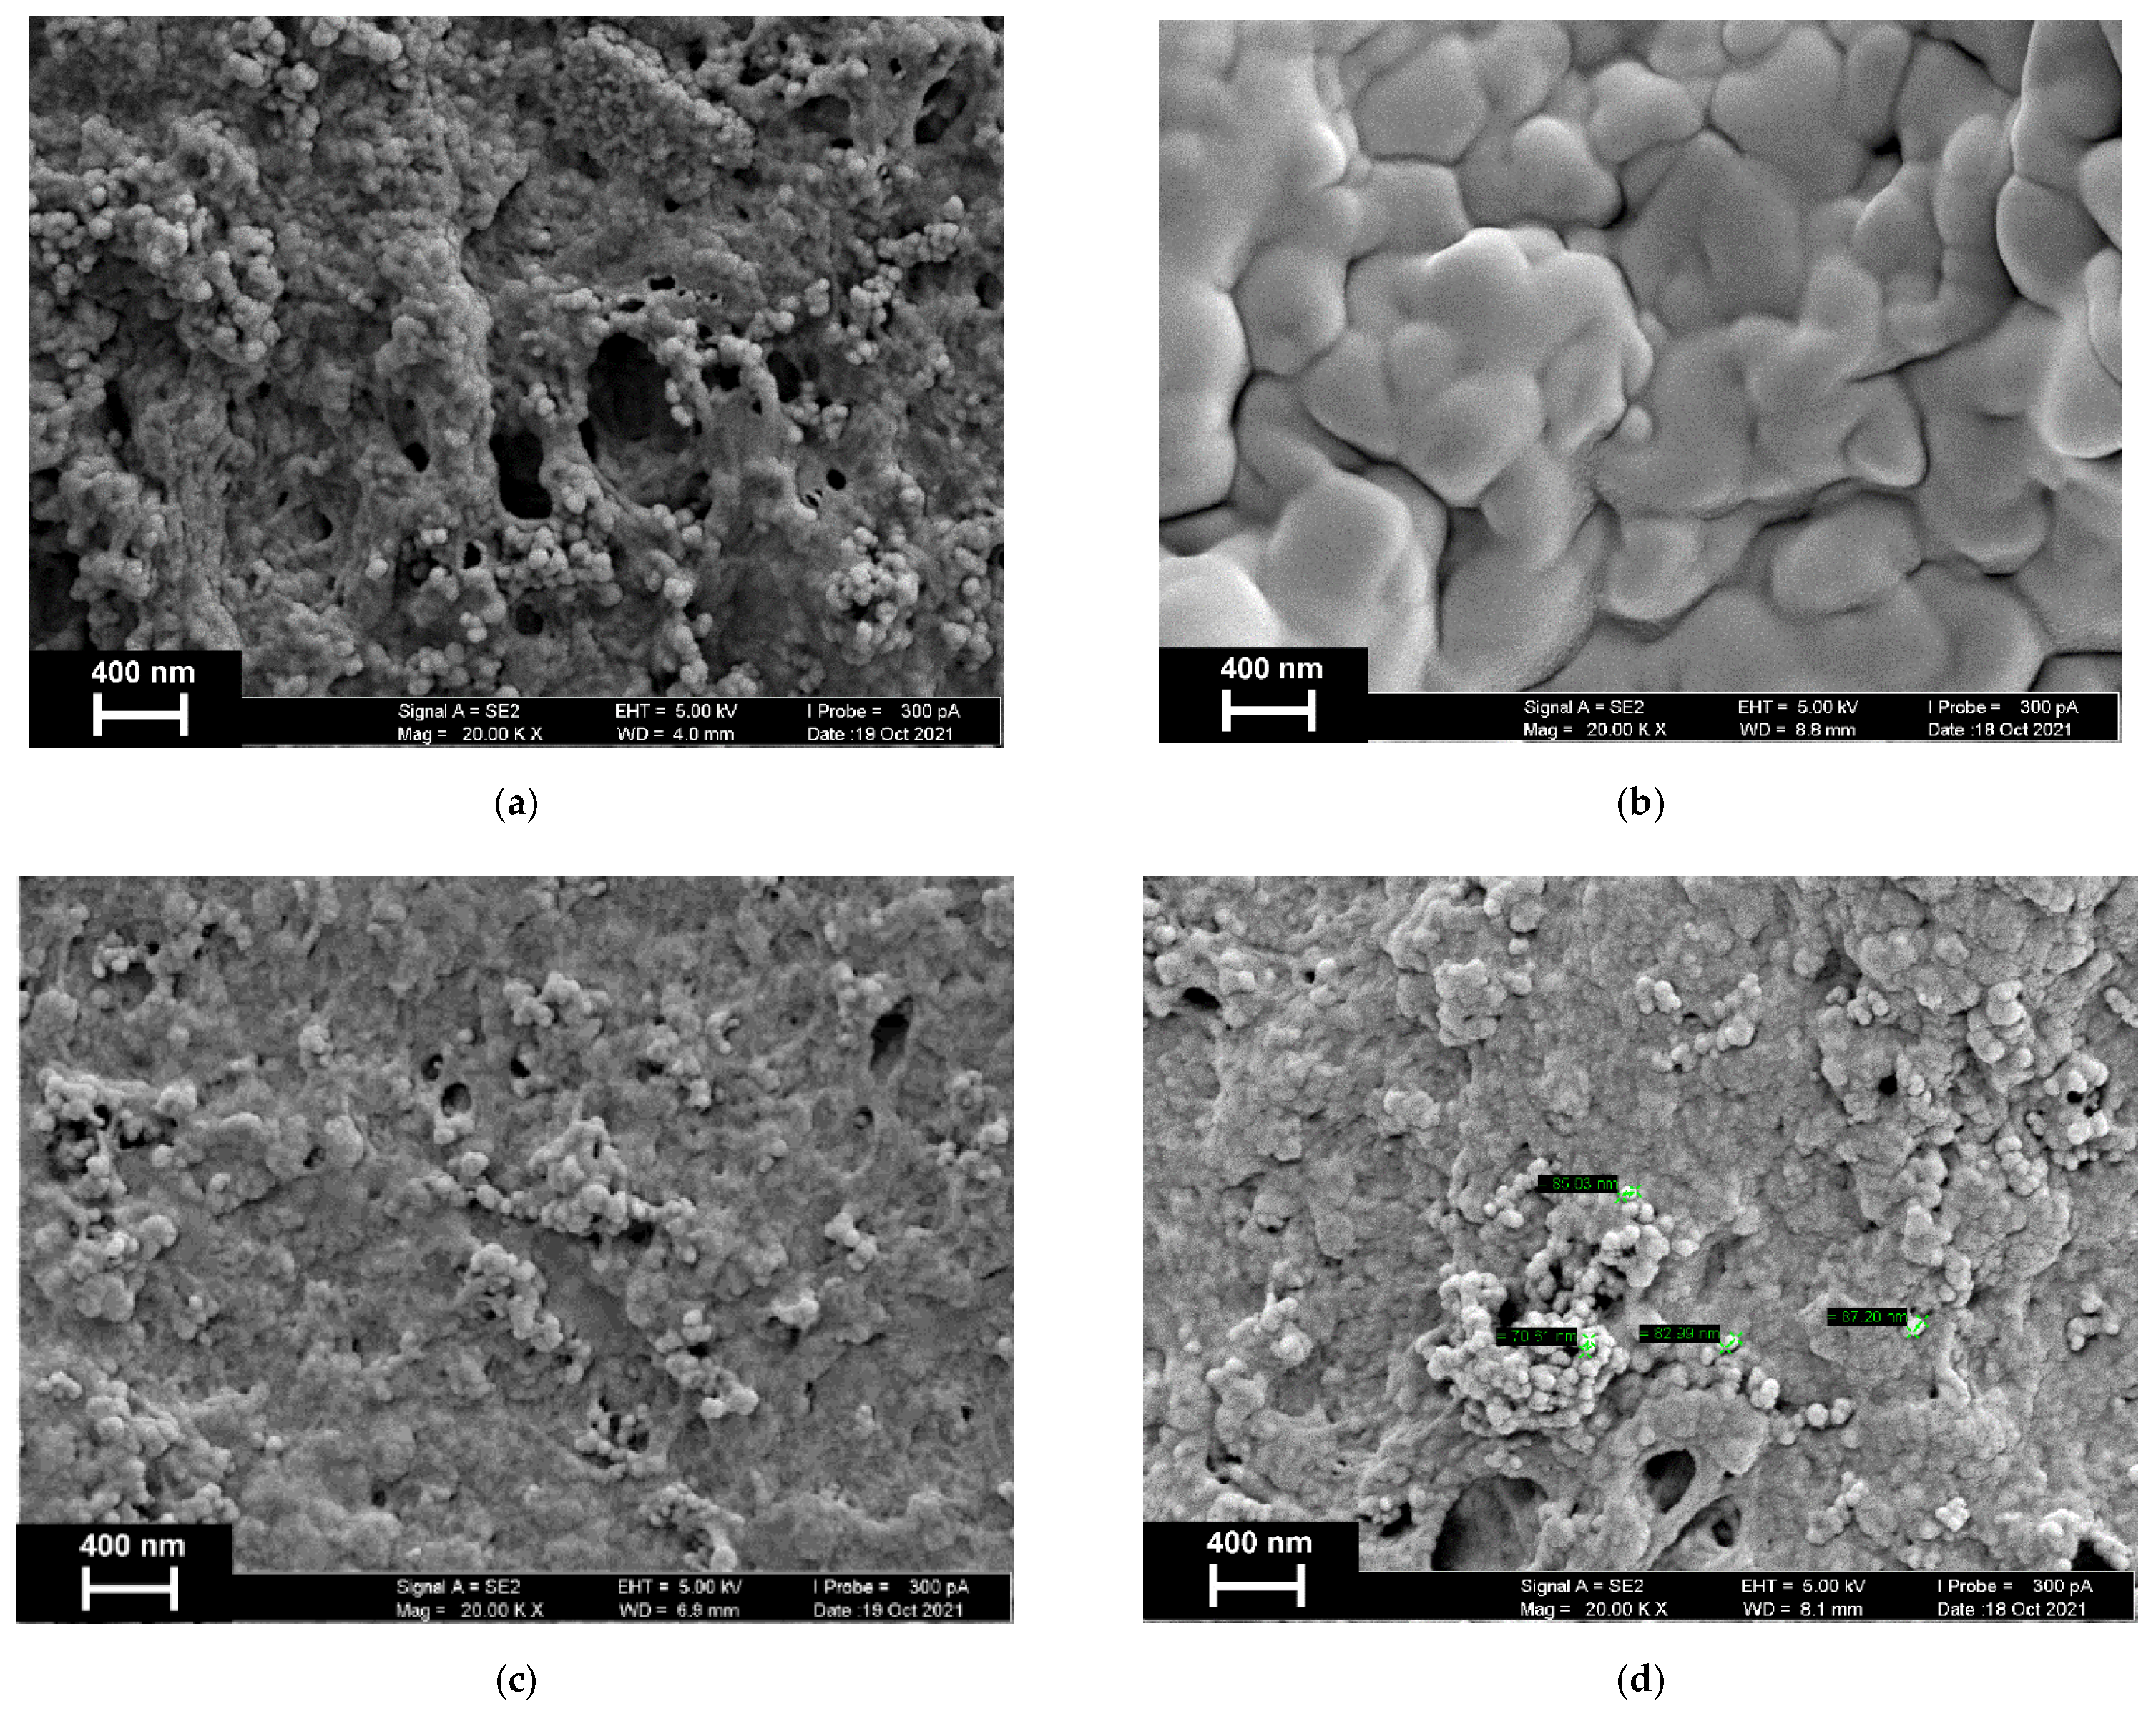
SEM images obtained for variously modified GCE also showed high aggregation of the surface layer components deposited on the CB layer (
Figure 5).
On these images, one could see that the CB coating (
Figure 5a) contained the film-forming chitosan matrix that formed rather big holes and left partially covered particles accessible for electron transfer. When added alone, the TC fully covered the CB layer with the formation of a soft crumpled film (
Figure 5b). The addition of DNA to the TC on the stage of preliminary mixing results in partial restoring of the initial morphology. For low DNA concentration (
Figure 5c), the TC film leaves a small number of roundish articles with the size of 60–80 nm. Its number increases with the DNA concentration so that they could be attributed to the TC/DNA aggregates (
Figure 5d).
3.3. Methylene Green
Methylene green is a phenothiazine dye used in electrochemical sensors and biosensors as a mediator of electron transfer and peroxidase substrate [
36,
37]. Being similar to the methylene blue, a popular DNA intercalator, methylene green cannot intercalate double-stranded DNA because of the nitro group in the aromatic core of the molecule [
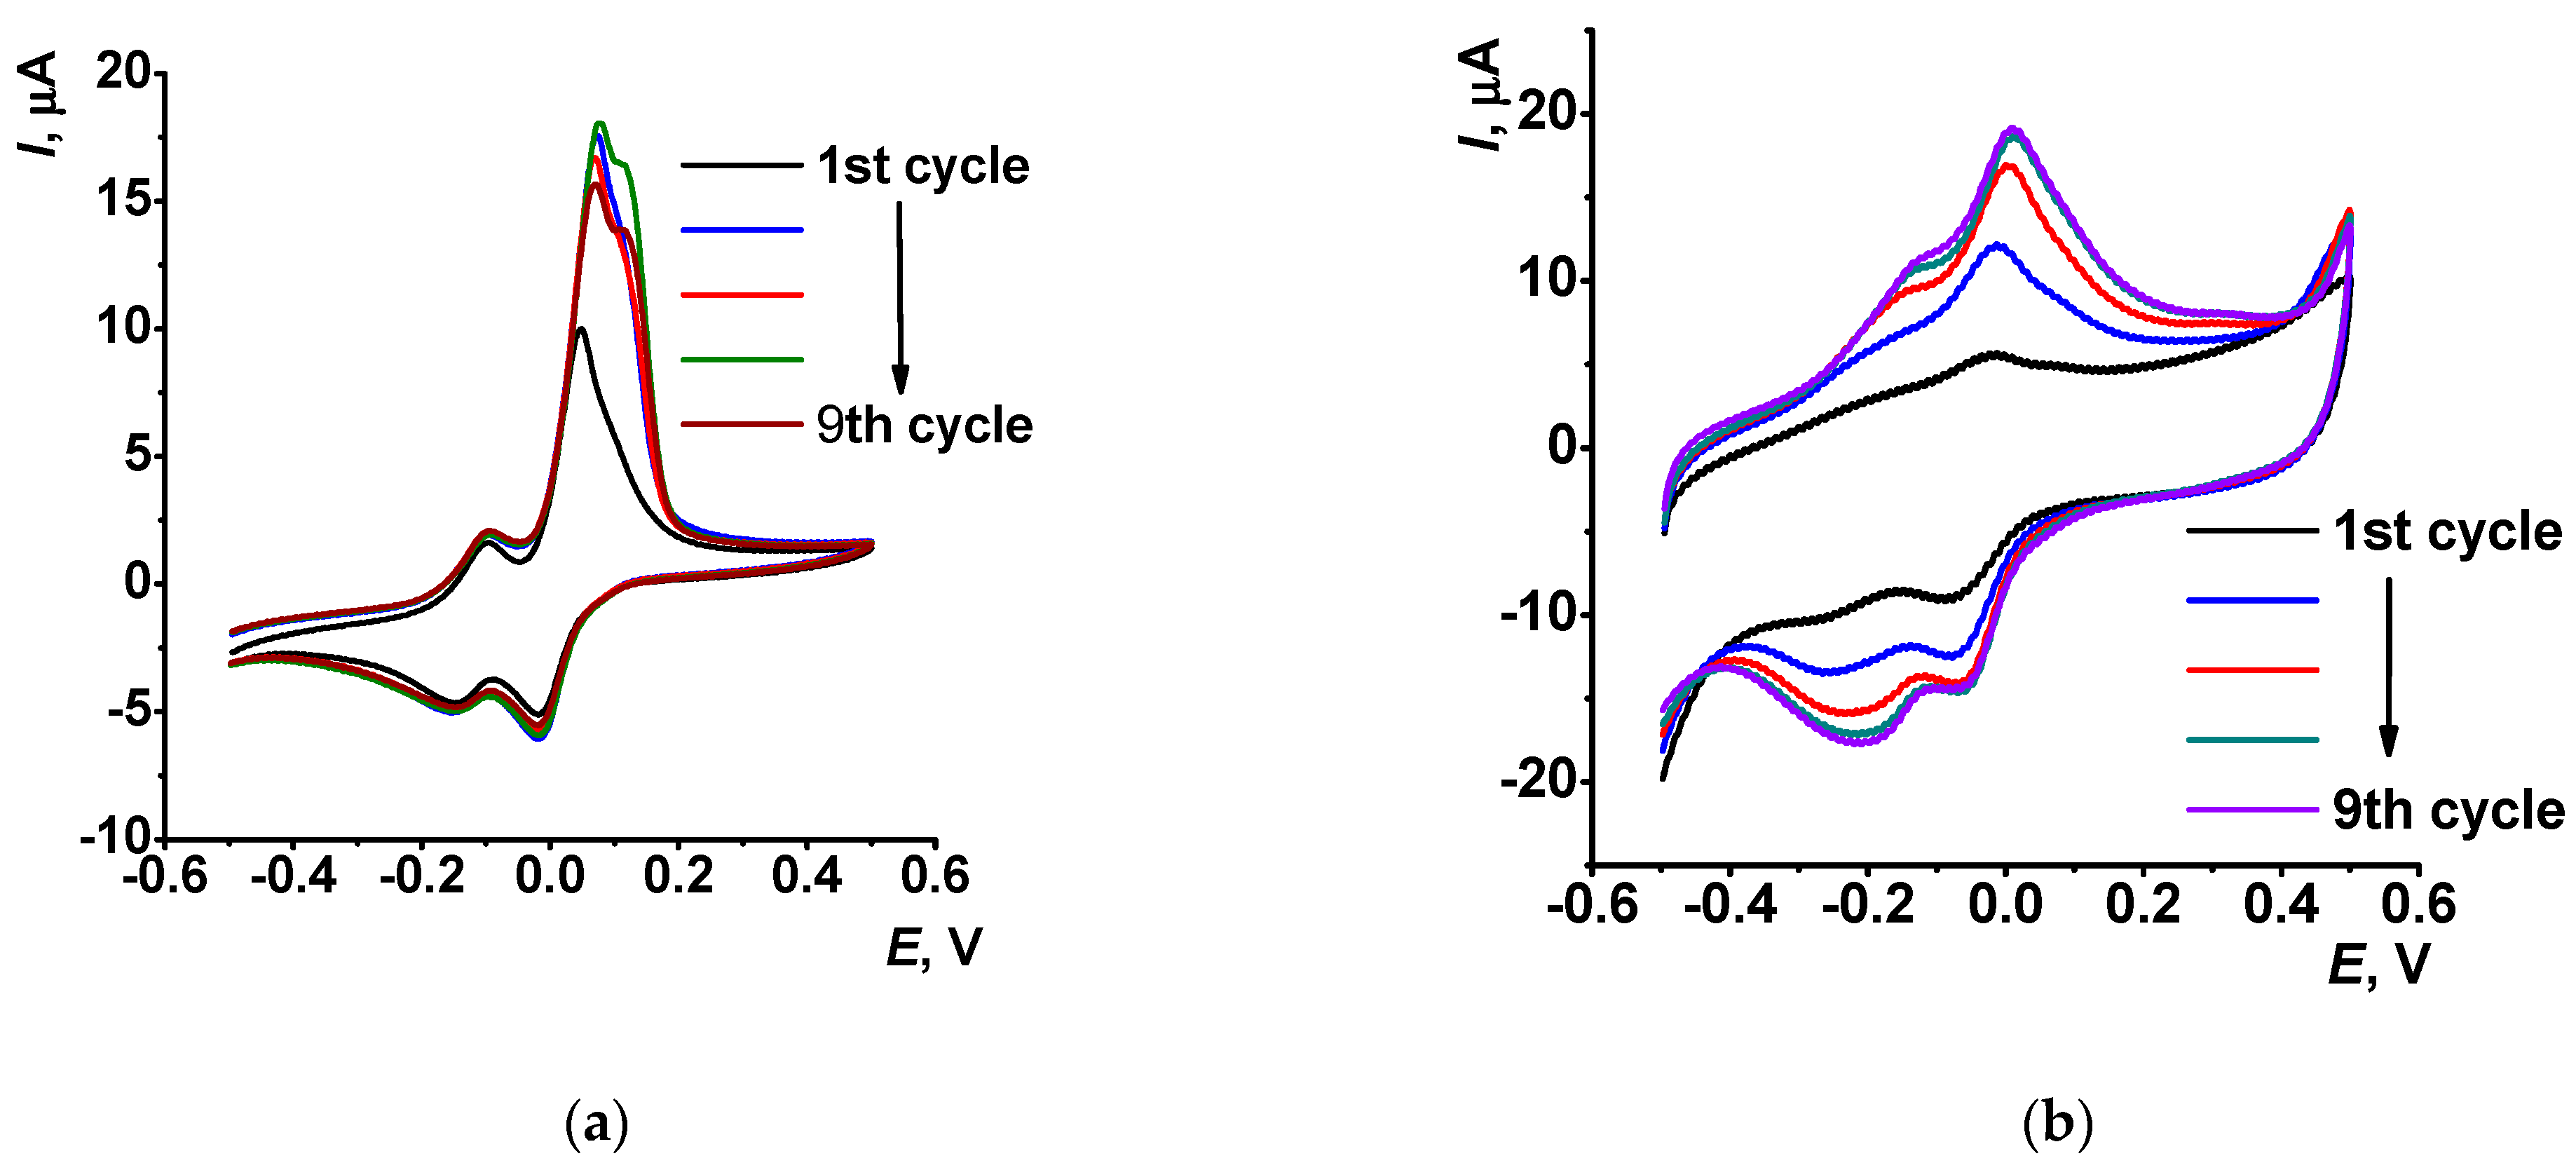
38]. As a result, methylene green is accumulated in the minor grooves of the DNA helix due to electrostatic interactions. Voltammogram of the 0.5 mM methylene green recorded on the GCE contained two reversible peak pairs. Smaller peaks at −0.154–−0.097 V can be attributed to the redox conversion of dye present in the solution. Their peak currents were stable in the multiple cycling of the potential. The second peak pair at −0.014–−0.049 V corresponds to the dye adsorbed on the electrode interface. Its height increased in consecutive cycling due to surface accumulation of the positively charged oxidation product. Deposition of the CB on GCE changed the shape of all the peaks. They became much broader and slightly shifted to more negative potentials (
Figure 6).
This coincides with the negative charge of the carbon particles stimulating the electrostatic adsorption of the dye. To improve the reproducibility of the measurement results, cyclic voltammogram records were repeated until stabilization of the currents (normally 5th–8th cycle). The ratio of the peak currents also changed, and, in some cases, the peaks amalgamated in one broaden peak with a split top. The adsorption of DNA in the range from 0.1 to 1.0 mg/mL (aliquot 5 μL per electrode) decreased the currents of methylene green due to the decrease in the active electrode area. The influence of the DNA content was rather small and irregular. Appropriate changes in the peak currents were within 5% of the average value (
Figure S3 for 10th cycle).
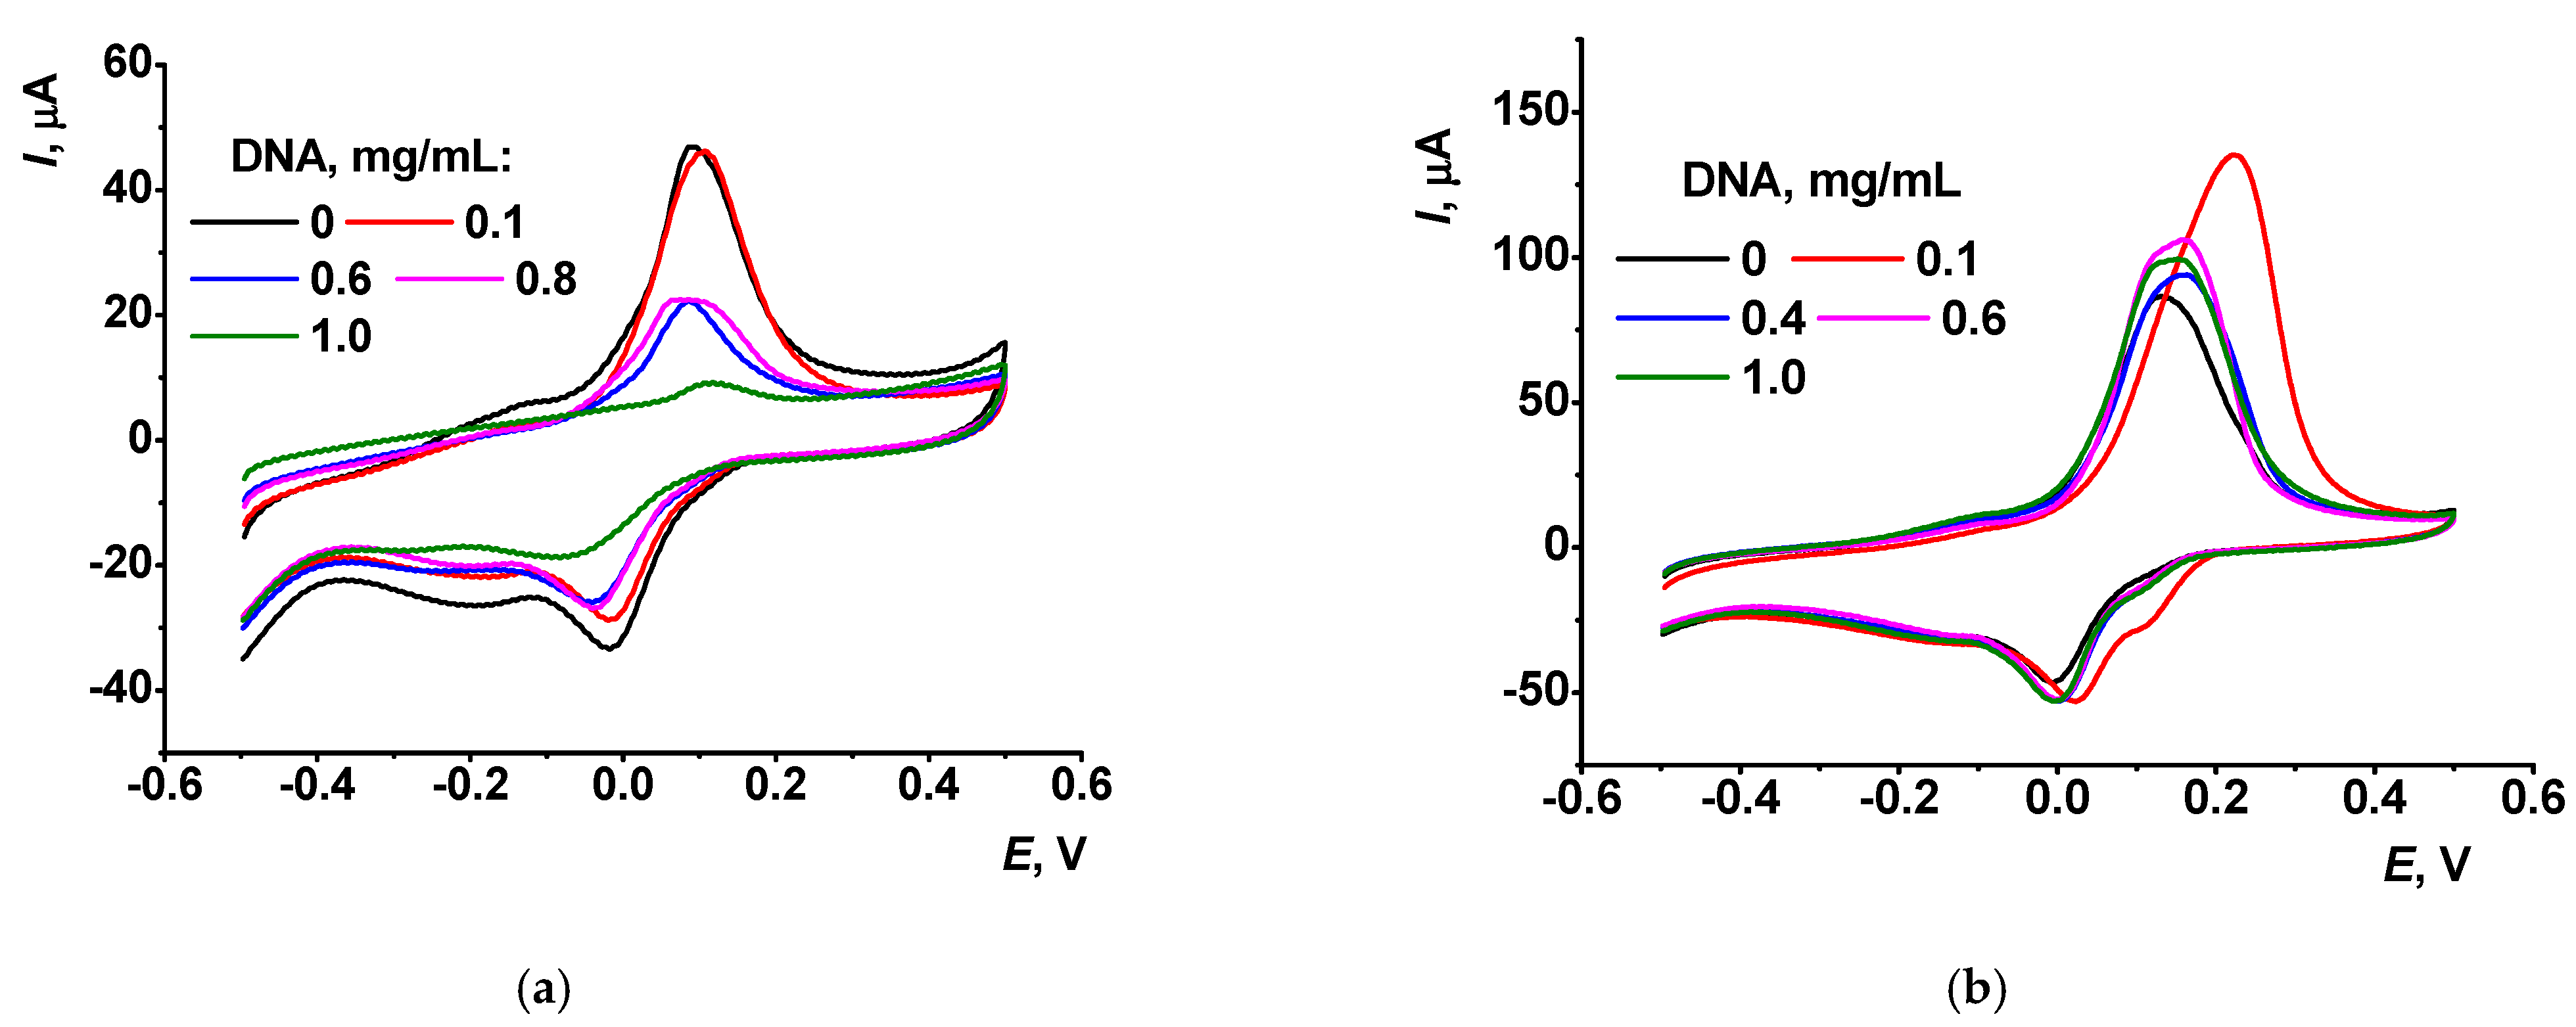
Then, the concentration of methylene green was increased to 5.0 mM to be equal to that of ferricyanide ions (see
Section 3.1). In these experiments, the transfer of the TC/DNA mixture on the GCE/CB surface resulted in a dramatic growth of the methylene green. The anodic peak current reached a twofold increase for the 50 μM TC mixed with 0.1–0.4 mg/mL DNA at first scan of the potential and about a sixfold increase at 10th scan (
Figure 7). Thus, the competition of cationic species (TC and methylene green) for the DNA binding sites on the electrode interface resulted in making dye molecules more accessible for the electron exchange. The changes mentioned were much more pronounced at anodic branch of the voltammograms, where the concentration of oxidized (cationic) form of methylene green reached a maximum. Meanwhile, the DNA influence assessed for the constant TC concentration was much higher at the first scan and equalized to the tenth cycle of the potential (
Figure S4). An enormous increase in the peak current and equalization of the peaks on voltammograms obtained with different content of the DNA in the layer differ the behavior of the ferricyanide ions and of the methylene green taken in the same concentration. This indicates importance of the accessibility of the redox probe on the electrode altered by their interactions with TC/DNA.
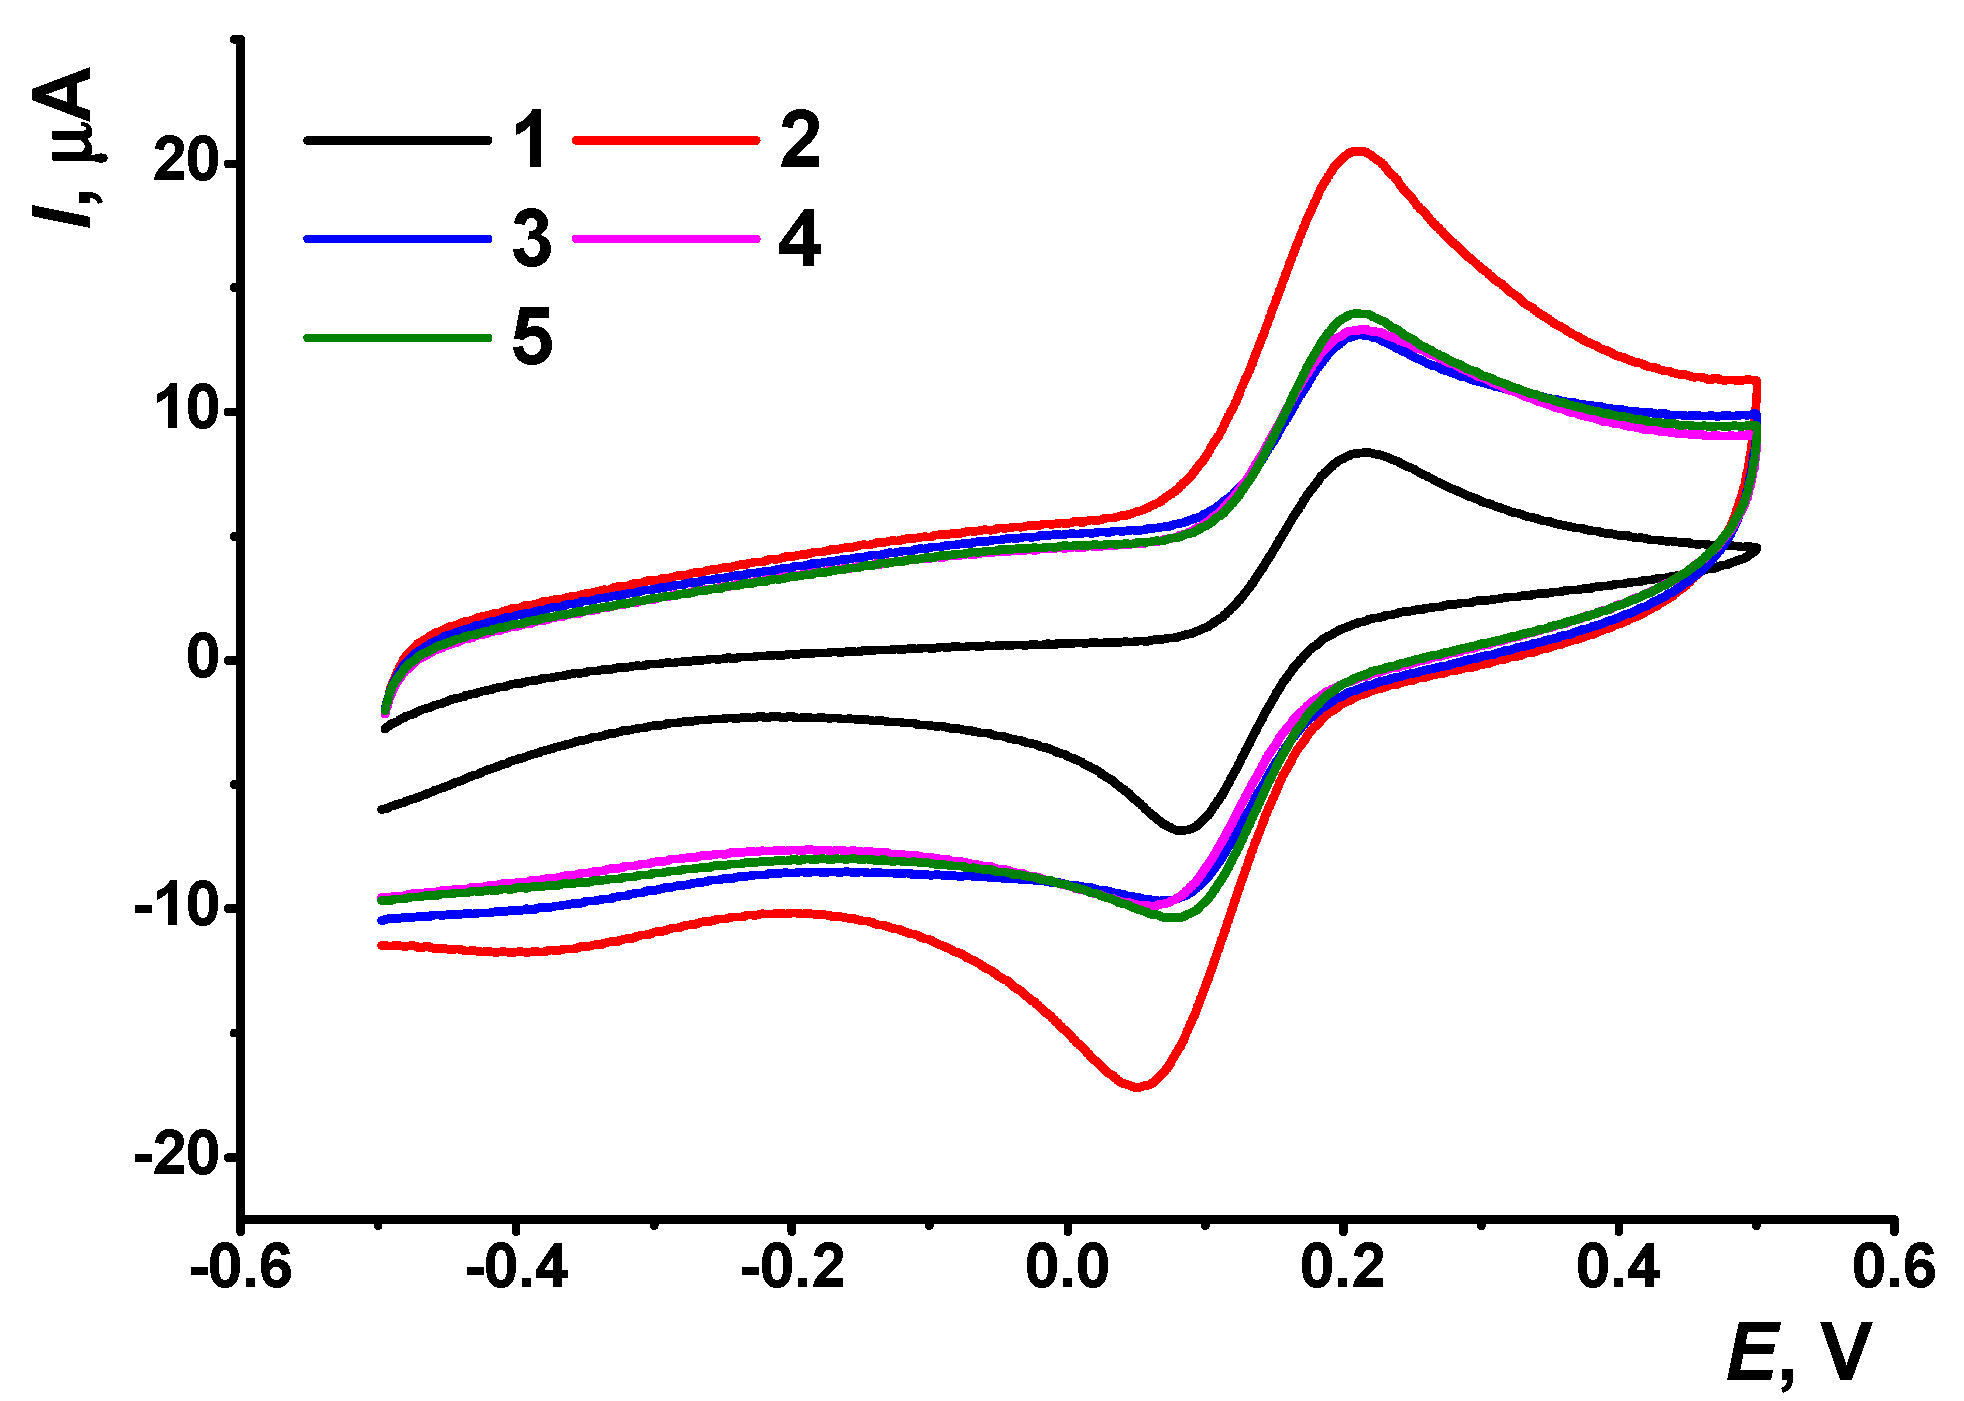
3.4. Hydroquinone
It was interesting to compare the behavior of the TC/DNA complex on the GCE in the presence of hydroquinone. Hydroquinone is rarely used as a redox probe, but it might be important in this study because both hydroquinone and the product of its oxidation, benzoquinone, are neutral compounds and not sensitive to the charge distribution in the surface layer. The hydroquinone concentration was taken to be the same as in the case of ferricyanide ion (0.5 mM). A pair of reversible peaks at 0.08 and 0.20 V was obtained on the voltammogram. Contrary to ferricyanide ions and methylene green, the shape and peak ratio showed no adsorption of the reactant. The peak currents increased with modification of the GCE with CB to the same extent as those of ferricyanide ion but decreased at deposition of TC and TC/DNA layer (
Figure 8). This made it possible to conclude that variations in the behavior of other redox probes with electrode modification were mostly caused by shielding the negative charge of the DNA molecules with positively charged groups of the macrocycle.
It is interesting to note that the DNA thermal denaturing did not alter the peaks on voltammograms, though this process should affect the density of the surface layer due to formation of more flexible and randomly folded parts of denatured DNA. Indeed, the hydroquinone responded on thermal denaturing only at minimal loading of the biopolymer on the electrode. The application of 0.1 mg/mL DNA resulted in about a 40% decrease in the peak current after thermal denaturing. Contrary to that, ferricyanide decreased its current after the DNA denaturing and methylene green increased the peaks on voltammograms but only at high DNA content (
Figure S5). Ferricyanide ions showed maximal deviation in the peak current recorded in the presence of denatured DNA because of higher influence of electrostatic repulsion. This complicates the assessment of this parameter. The effect of denaturation regularly decreased with the DNA quantities. Most of the redox probes showed the biggest difference in the peaks recorded in the presence of native and thermally denatured DNA at its concentration on 0.1 mg/mL and the lowest one at 1.5 mg/mL (aliquot 5 μL per electrode in all experiments).
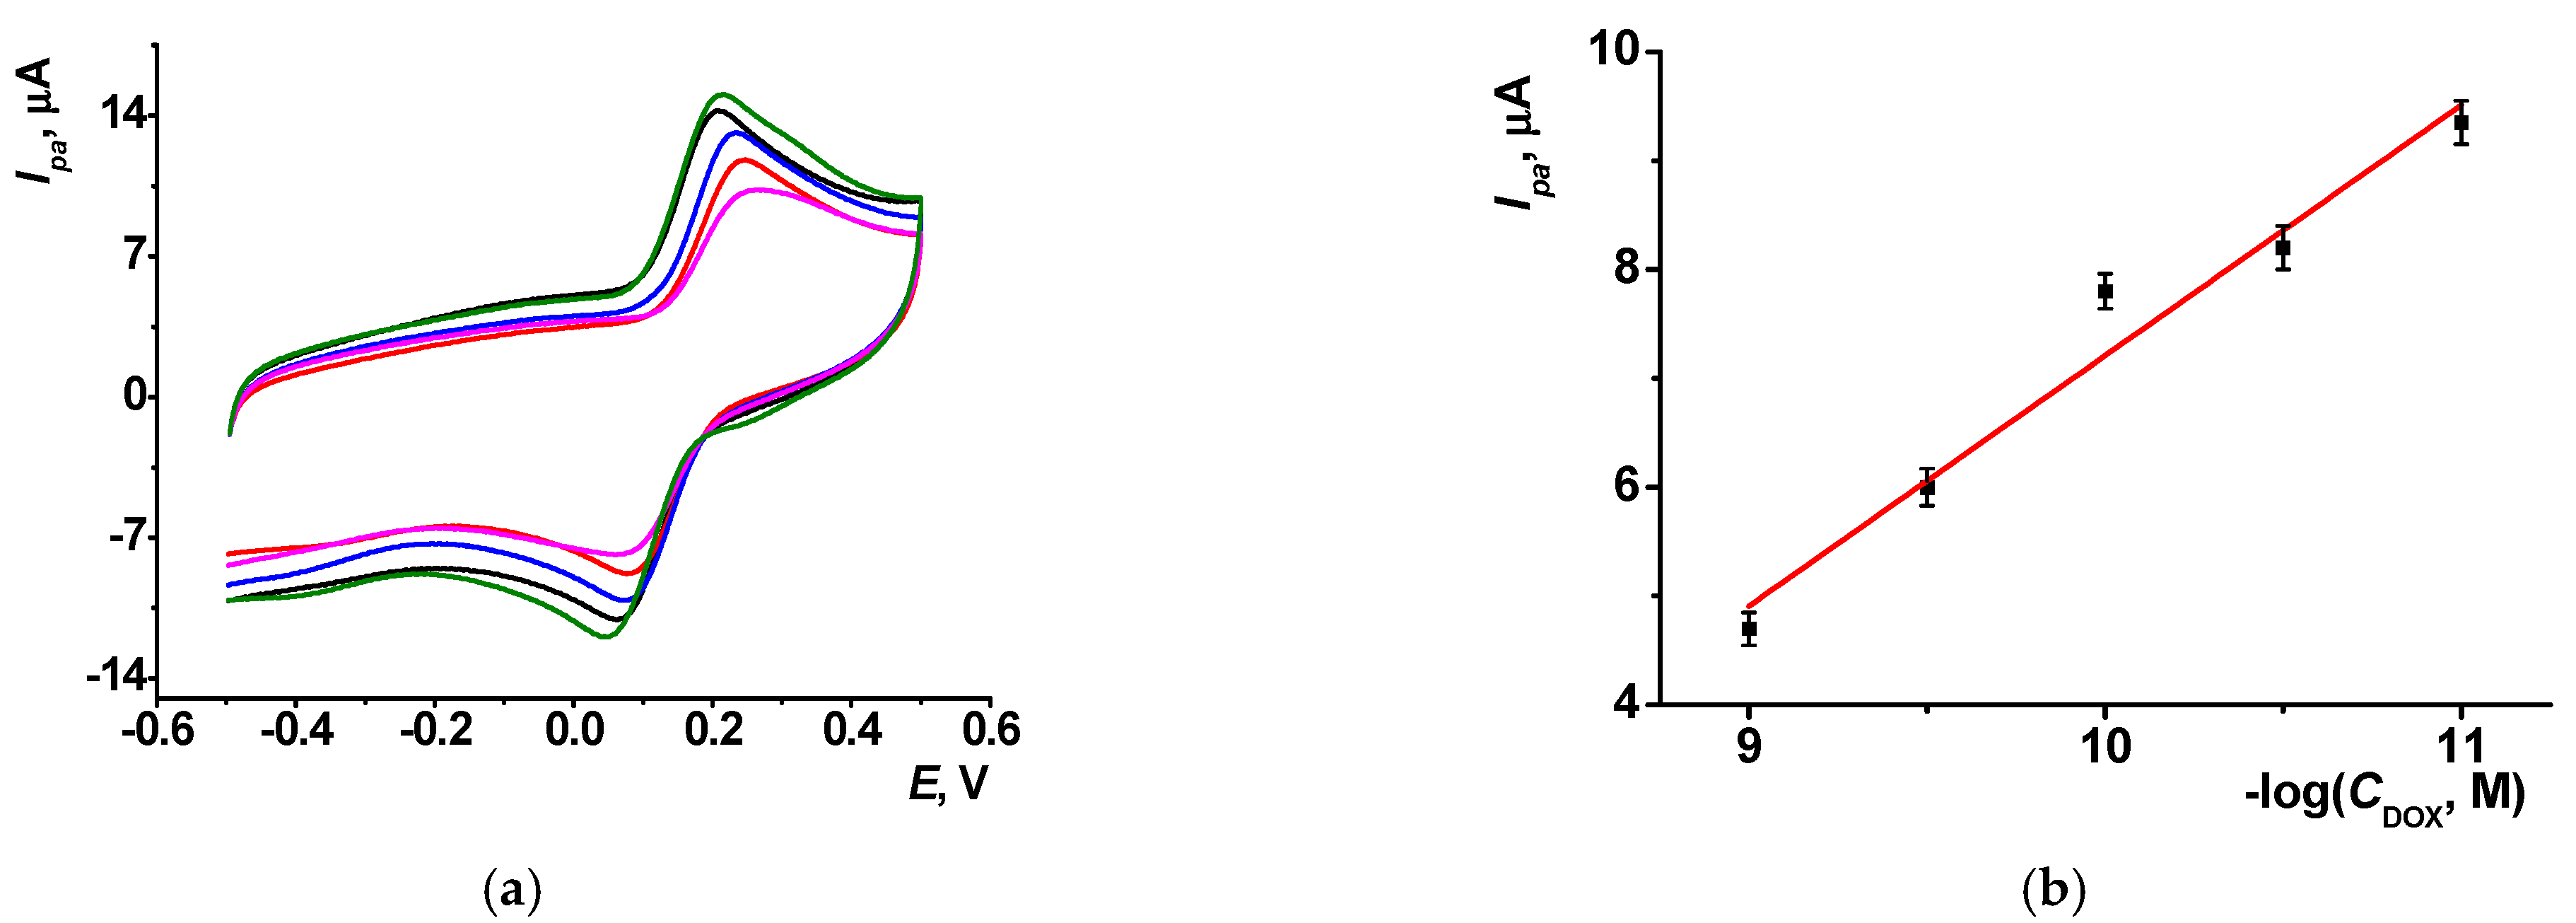
The attribution of the current peak changes to the thermal damage of double-stranded DNA was confirmed with the experiments with doxorubicin. In them, hydroquinone was chosen as redox probe to avoid interferences with the own charge of the indicator. The 10 min incubation of the sensor in doxorubicin solution changed the hydroquinone peak current in the range from 10 pM to 1.0 nM (logarithmic scale) in accordance with Equation (1) and
Figure 9.
The limit of detection (LOD) of doxorubicin estimated for S/N = 3 criterion was found to be 3 pM. Thermal denaturation of DNA remarkably decreased the slope of the same curve from 2.3 μA/pC (see Equation (1)) to 0.2 μA/pC. Moreover, the lowest detectable concentration was 0.1 nM against 0.01 nM for native DNA of the same concentration. Thus, DNA in the mixture with TC retains its accessibility toward intercalators and changes the parameters of hydroquinone oxidation with no respect of the electrostatic interactions in the layer.
It should be noted that the reaction with doxorubicin was used in this study to confirm the introduction of DNA in the surface layer and its interaction with the TC molecules. Nevertheless, high sensitivity of the response to doxorubicin can be mentioned. The LOD found was lower than the characteristics of DNA sensors based on redox active polymers of carbonaceous nanomaterials, where the doxorubicin reaction resulted in changes in intrinsic redox activity of the layer (poly(Azure B), 90 pM [
39]; poly(neutral red), 100 pM [
40]; carbon nanotubes–polylysine, 100 nM [
41]; and single-walled carbon nanotubes 60, pM [
42]).
The DNA sensor described above for doxorubicin determination was tested on the commercial medications Doxorubicin-TEVA® (Pharmachemie b.v., Haarlem, The Netherlands) and Doxorubicin-LANS® (Veropharm, Moscow, Russia). They were dissolved in deionized water and then diluted with 0.1 M HEPES buffer. The DNA sensor was first incubated in the diluted medication and then transferred to the hydroquinone solution. The recovery of doxorubicin was estimated for its nominal concentration of 1.0 and 0.1 nM and found to be 110–115% for all the samples. It was preliminarily established that stabilizers present in these medicines (lactose and mannitol) did not accumulate in the surface layer of the DNA sensors and hence did not interfere with the measurement of the hydroquinone signals after transfer in its solution.
4. Discussion
Adsorption of the DNA and thiacalix[4]arene derivative bearing eight terminal amino groups in
cone configuration on the GCE modified with CB alters the conditions of the electron transfer monitored by the redox probes. The formation of the aggregates previously observed in homogeneous conditions [
27] affects both the charge and diffusional permeability of the layer. The resulting changes in the redox activity depend on the ratio of reactants. Presence of DNA in the surface layer as well as variability of the surface morphology have been confirmed by the SEM and EIS measurements as well as by the experiments with doxorubicin as a DNA intercalator.
Although the formation of the TC/DNA aggregates is governed by the characteristics of the macrocycle and biopolymer, their detection on the electrode depended on the redox probe used. Thus, negatively charged ferricyanide ion changes its current peaks on voltammograms mostly due to partial shielding of the electrode surface by the aggregates. Contrary to that, methylene green at a low concentration is probably located on free DNA binding sites and competes with the TC cationic centers. Hydroquinone, being neutral, is mostly sensitive toward changes in the active area of the electrode. It is important that DNA implemented in the surface area remained accessible for the interactions with specific species. Thus, the ability to intercalation can be predicted by the application of thermally denatured DNA. The difference in the signals recorded with native and denatured DNA showed sensitivity of the doxorubicin determination. The slope of the calibration curve decreased tenfold by DNA denaturing. Using hydroquinone redox probe, the DNA sensors made it possible to determine from 10 pM to 1.0 nMdoxorubicin (LOD 3 pM) after 10 min incubation. Stabilizers commonly used in commercial medications did not interfere with the signal measurement because the redox probe current was measured after transfer of the DNA sensor to the buffer with no sample matrix. Variation of the ratio of the TC and DNA quantities as well changes in the redox probe used offer additional opportunities for changing the accessibility of DNA toward small agents and for the detection of the DNA thermal damage and drugs intercalation. This might be also useful for the further application of aggregates of the macrocycles and DNA as nanocontainers and smart drug delivery systems.


 ,
, 


