Article

Functionalized Surfaces as a Tool for Virus Sensing: A Demonstration of Human mastadenovirus Detection in Environmental Waters

by
Juliana Schons Gularte
1,2,*,
Roana de Oliveira Hansen
3,
Meriane Demoliner
1,2,
Jacek Fiutowski
3,
Ana Karolina Antunes Eisen
1,2,
Fagner Henrique Heldt
1,2,
Paula Rodrigues de Almeida
1,2,
Daniela Müller de Quevedo
4,
Horst-Günter Rubahn
3 and
Fernando Rosado Spilki
1,2
1
Laboratório de Microbiologia Molecular, Universidade Feevale, ERS 239, 2755, Novo Hamburgo RS 93352-000, Brazil
2
Laboratório de Saúde Única, Feevale Techpark, Universidade Feevale, Av. Edgar Hoffmeister, 600–Zona Industrial Norte, Campo Bom RS 93700-000, Brazil
3
NanoSYD, The Mads Clausen Institute, University of Southern Denmark, Alsion 2, 6400 Sønderborg, Denmark
4
Programa de Pós-Graduação em Qualidade Ambiental, Universidade Feevale, ERS 239, 2755, Novo Hamburgo RS 93352-000, Brazil
*
Author to whom correspondence should be addressed.
Submission received: 16 December 2020 / Revised: 12 January 2021 / Accepted: 18 January 2021 / Published: 21 January 2021
(This article belongs to the Section Materials for Chemical Sensing)

Abstract

:
The main goal of this study was to apply magnetic bead surface functionalization in the form of immunomagnetic separation (IMS) combined with real-time polymerase chain reaction (qPCR) (IMS-qPCR) to detect Human mastadenovirus species C (HAdV-C) and F (HAdV-F) in water samples. The technique efficiency was compared to a nonfunctionalized method (ultracentrifugation) followed by laboratory detection. Tests were carried out to standardize IMS parameters followed by tests on 15 water samples concentrated by IMS and ultracentrifugation. Microscopic analyses detected a successful beads–antibody attachment. HAdV was detected up to dilutions of 10−6 by IMS-qPCR, and samples concentrated by IMS were able to infect cell cultures. In water samples, HAdV-C was detected in 60% (monoclonal) and 47% (polyclonal) by IMS-qPCR, while 13% of samples concentrated by ultracentrifugation gave a positive result. HAdV-F was positive in 27% of samples by IMS-qPCR (polyclonal) and ultracentrifugation and 20% by IMS-qPCR (monoclonal). The rate of detection varied from 4.55 × 10² to 5.83 × 10⁶ genomic copies/L for IMS-qPCR and from 2.00 × 10² to 2.11 × 10³ GC/L for ultracentrifugation. IMS showed to be a more effective concentration technique for HAdV than ultracentrifugation, improving the assessment of infectious HAdV in water resources.

1. Introduction

Contamination of water resources by domestic sewage releases remains a concern for human health. This impact is greater in places with developing agricultural systems, industry, and urbanization but with lack of investments in wastewater treatment [1]. A large number of microbial pathogens may reach water bodies through human fecal contamination [2]. Every year, diarrheal diseases cause about 1.4 million deaths (data from 2016) [3], with viral pathogens considered as the major cause of waterborne diseases [4]. Enteric viruses are found in the gastrointestinal tract and transmitted by a variety of routes, including person-to-person contact, zoonotic, and mainly fecal–oral [4,5]. A wide variety of viruses can occur in human sewage, including DNA and RNA viruses such as adenovirus, polyomavirus, enterovirus, norovirus, rotavirus, astrovirus, hepatitis A, and E viruses [2,4].
Human mastadenovirus (HAdV) is a double-stranded nonenveloped DNA virus with an icosahedral capsid measuring approximately 90 nm in diameter. HAdV belongs to the Adenoviridae family and Mastadenovirus genus comprising 86 genotypes classified into seven species (HAdV-A through to HAdV-G) [6,7,8]. HAdV is responsible for a wide range of diseases in humans, including respiratory infections, conjunctivitis, hemorrhagic cystitis, and gastroenteritis [7,8,9,10]. The fecal–oral route is the main route of HAdV transmission; some serotypes can be eliminated in feces of the host asymptomatically and excreted for months and even years [8,9,11]. This enteric virus is used as a reliable indicator of fecal contamination in different aquatic environments [12,13,14,15]. Its wide use in fecal contamination monitoring is due to its greater stability under adverse conditions, such as physical and chemical treatments, UV light, and pH and temperature changes [16]. Therefore, HAdV is considered to be one of the most resistant viruses in the environment [17].
Even though viruses are discarded in large quantities from the feces of infected individuals, they may be present in very low concentrations in water resources due to dilution, making direct analysis detection a challenge and requiring large sample volumes [18,19]. To overcome this issue, analysis of viruses in water samples is divided into two main steps, namely sample concentration or enrichment and virus detection [18,20,21]. Nevertheless, rapid and reliable methods are needed to detect a small number of viral particles, especially infectious ones, in environmental samples [20].
Ultracentrifugation technique is a concentration method that separates viral particles based on their density and size [21]. This method needs minimal manipulation, is fast, and does not introduce external polymerase chain reaction (PCR) inhibitory substances like other concentration methods [22]. The main drawbacks are the high costs and system portability, which hinders its use at sampling sites [21], along with the fact that inhibitory substances present in the water sample are present in the final concentrate [22]. Another method that is well recognized but not widely used is immunomagnetic separation (IMS), which can concentrate viral particles by an antibody–antigen complex. In this assay, paramagnetic particles are coated with a specific antibody for a target pathogen. The pathogen binds to the specific antibody, and the antigen–antibody complex can be easily concentrated in a small volume by applying an external magnetic field [18,21,23]. IMS is considered as a versatile assay because, depending on the target pathogen, it is possible to vary the antibodies, bead type, and size accordingly with very high specificity [23].
Among the viral detection methods, molecular applications have the highest level of sensitivity and specificity. Therefore, the PCR method is widely used to detect viruses in environmental samples [20]. As an improvement in viral analyses, the use of quantitative real-time PCR (qPCR), which is a rapid and quantitative technique of detection, has been an important advance for molecular analyses [16,21]. However, qPCR also has some disadvantages. Firstly, this method alone cannot discriminate between infectious and noninfectious viral particles, leading to an overestimation of the presence of viruses in water samples [16,21]. Another problem is the PCR inhibitory substance concentration, which is found in water samples, along with viruses; these substances can result in false negatives and consequently underestimation [20,24].
Surface modification and functionalization are good approaches to improve device efficiency [25] and sensor selectivity [26,27,28]. To overcome the drawbacks of both concentration and detection steps, the use of surface functionalization of magnetic beads and IMS combined with PCR (IMS-PCR), and their variations such as IMS-qPCR, may lead to an important and reliable method, especially for detection of infectious viruses. This method detects viral genomes packed in capsid proteins rather than naked viral genomes and reduces PCR inhibitory substances, which improves the sensibility of molecular assay [24,29,30,31].
The main goal of this study was to detect HAdV species C and F in different sources of water samples by IMS-qPCR. The specific aims were to investigate the capacity of the IMS technique to concentrate HAdV infectious particles, to establish a more adequate antibody (monoclonal or polyclonal) for a better viral capture rate, and to compare the difference in the viral concentration methods between ultracentrifugation and IMS in water samples.

2. Materials and Methods

2.1. Samples and Sampling

2.1.1. Samples for Standardization of IMS Parameters

In order to evaluate the efficiency of viral capture using the IMS approach, HAdV serial dilutions were used with standard samples to be concentrated by IMS. For this, 10-fold serial dilutions were performed from a standard HAdV-5 with known quantification of 1.13 × 10⁸ genomic copies (GC)/mL, detected by digital PCR (dPCR) as described below. The dilutions went from 10−1 to 10−13. Besides the concentrated samples by IMS, these dilutions were also analyzed without performing any prior concentration step. These steps were repeated three times following the same protocol. The samples were submitted to DNA extraction, nested PCR, qPCR, and viral isolation as described below. We also used HAdV-5 samples to carry out microscopic analyses and an effluent sample from wastewater treatment without previous knowledge about its HAdV contamination.

2.1.2. Validation in Naturally Contaminated Water Samples

Seberi is a city in Rio Grande do Sul, Southern Brazil, with an area of 301.223 km2, a population of 10,897 people, and a demographic density of 36.15 hab/km2 (data described in the most recent census in 2010 [32]). According to 2016 figures, only 16% of residences in Seberi had adequate sanitary sewage; the average child mortality rate in the city was 11.49 per 1000 live births, and hospitalization due to diarrhea was 3 per 1000 inhabitants [32]. The city reported a major diarrhea outbreak in 2019, and tap, well, and surface water samples were collected soon after the event and evaluated for the presence of HAdV. A total of 15 water samples were collected in sterilized glass bottles in April 2019. The sources of these samples were varied over the city, with both potable and nonpotable water sources. The samples were submitted to both ultracentrifugation and IMS concentrations techniques before DNA extraction and molecular analyses.

2.2. Magnetic Bead Functionalization

Both monoclonal (mouse antiadenovirus clone B025-AD51) and polyclonal (goat antiadenovirus) anti-HAdV antibodies from Bio-Rad AbD Serotec Ltd. (Oxford, UK) were used to couple with paramagnetic beads. Before magnetic bead coupling, the antibodies were conjugated with biotin using the LYNX Rapid Plus Biotin (Type 2) Antibody Conjugation Kit® (Bio-Rad AbD Serotec Ltd., Oxford, UK.) following the manufacturer’s instructions.
Then, 1 μm of Dynabeads® MyOne™ Streptavidin C1 (Invitrogen, Carlsbad, CA, USA) with streptavidin coating covalently linked to the bead surfaces was coupled to biotinylated antibodies following the protocol described by Ahmed et al. [23] with some modifications. Briefly, 1 mg (~108) of washed beads and antibodies (1 μg) was suspended in 1 mL of phosphate-buffered saline buffer at pH 7.4 + 0.01% Tween 20 (PBST) and incubated at room temperature for 30 min with rotation of 1000 rpm in a shaker. After the bond, the antibody-coated beads (immunomagnetic beads (IMBs)) were separated with a magnet for 3 min, and the supernatant was disposed of. The coated IMBs were washed two times with PBST and resuspended in 1 mL of the same buffer. The process is illustrated in Figure 1.

2.3. Concentration Steps
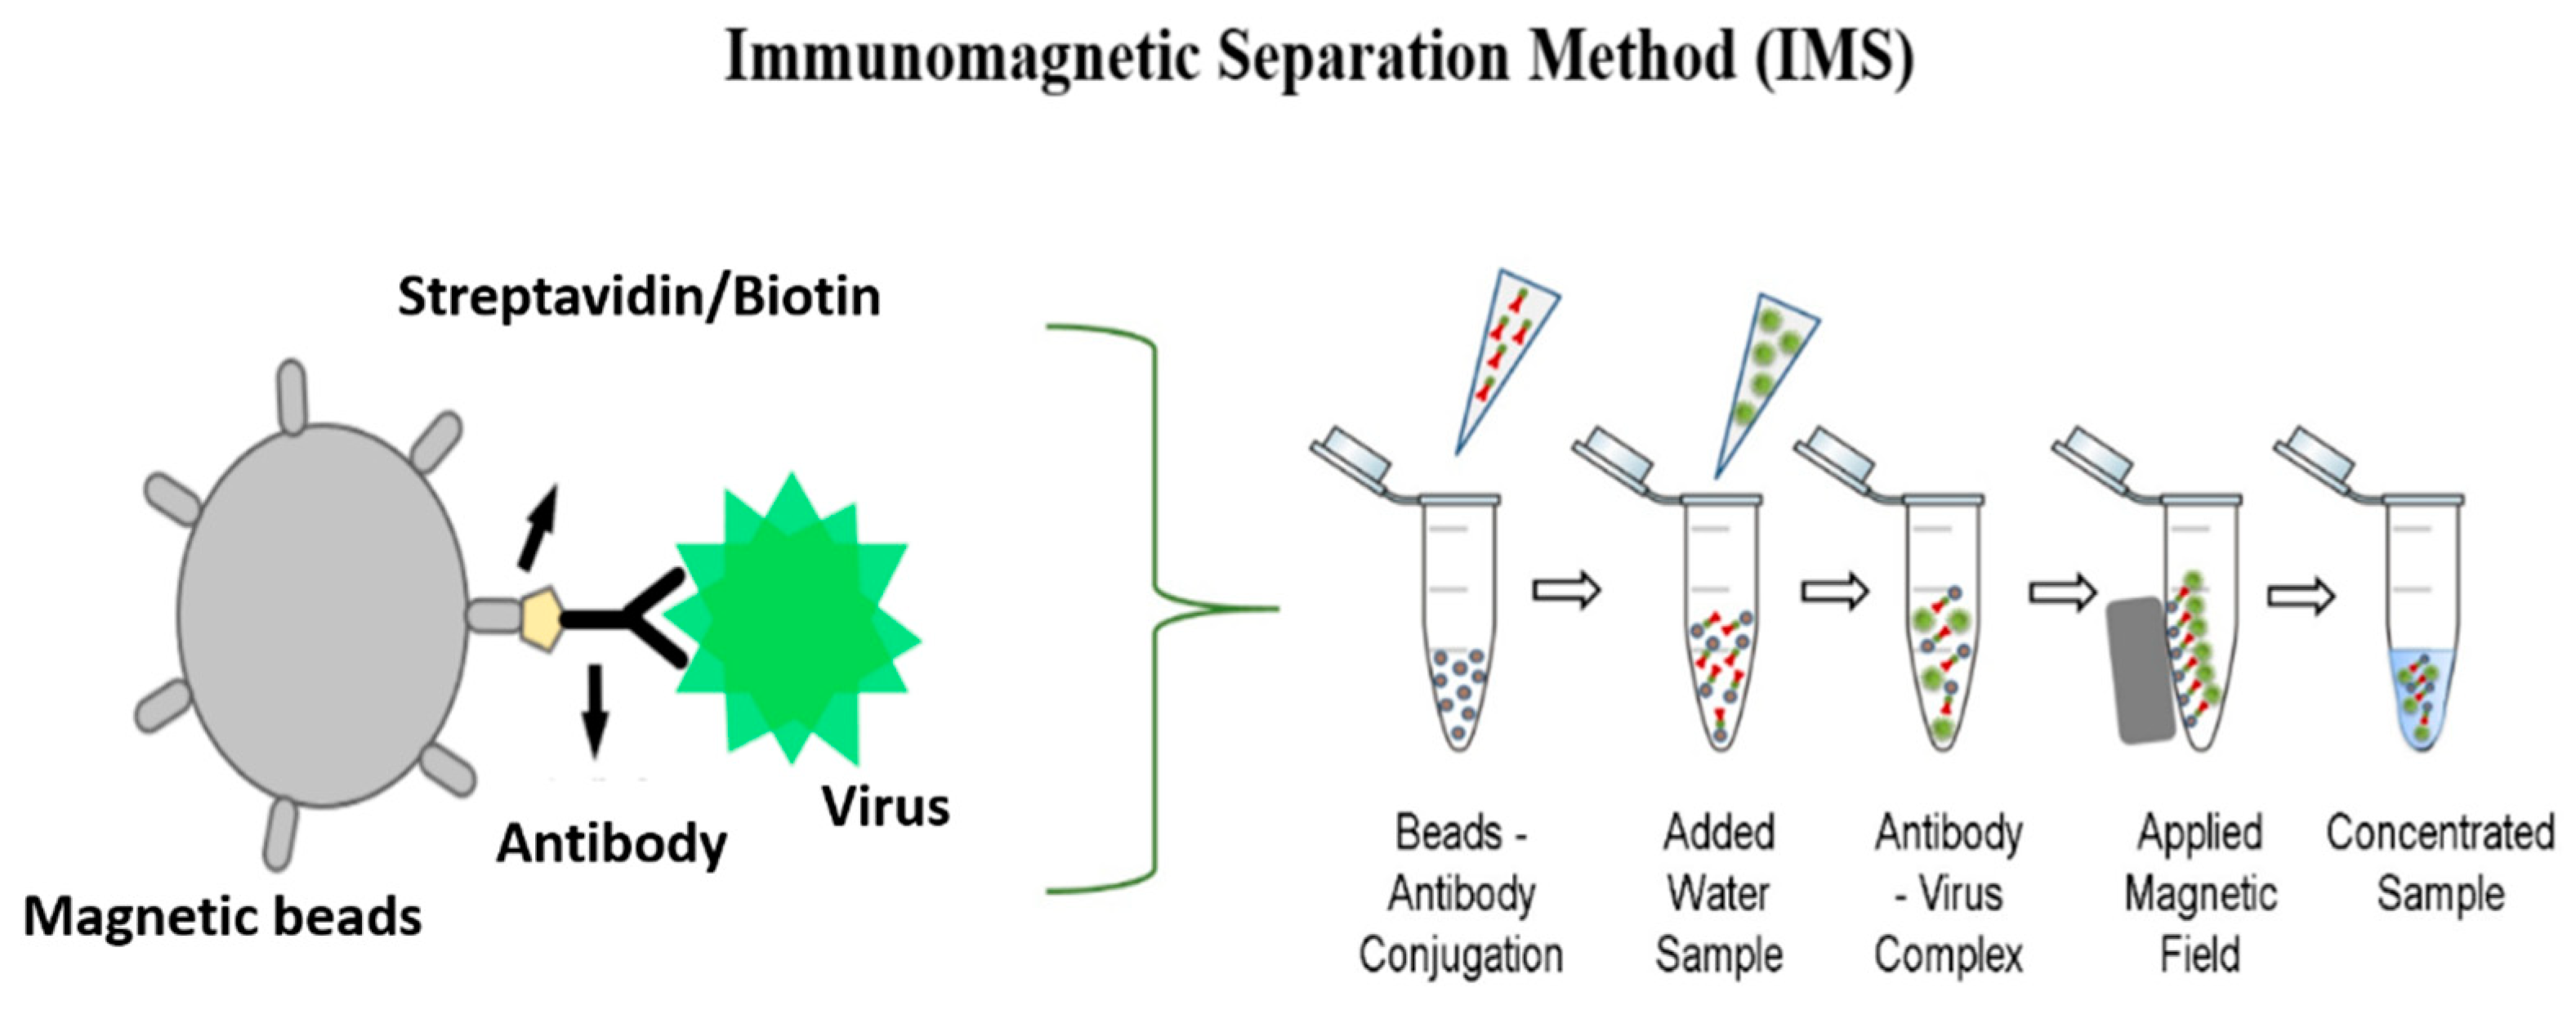
2.3.1. IMS Method

IMS was carried out following the protocol described by Ahmed et al. [23] with some modifications. Briefly, 50 μL of IMB was incubated with 1 mL of the sample at room temperature for 30 min with rotation of 1000 rpm in a shaker. After the bond, the coated IMBs were separated with a magnet for 3 min, and the supernatant was disposed of. The coated IMBs were washed three times with phosphate-buffered saline buffer at pH 7.4 containing 0.1% bovine serum albumin (PBS–BSA) and resuspended in 200 μL of the same buffer. The extraction process was immediately carried out with the resuspended samples.

2.3.2. Ultracentrifugation Method

Here, 36 mL of water was concentrated by the ultracentrifugation method following the protocol described by Girardi et al. [13]. Briefly, the samples were centrifuged at a rate of 41,000× g at 8 °C for 3 h. The centrifugation pellet was resuspended in 2 mL of Tris-ethylenediaminetetraacetic acid (EDTA) buffer (pH 8.0) and homogenized by vortexing for 1 min. The resuspended samples were aliquoted and stored at −80 °C until the extraction process.

2.4. Viral Extraction

Here, 200 mL of each sample was used for DNA extraction using the Viral Mini Spin Plus extraction kit (Biopur®, Pinhais, Brazil) following the manufacturer’s protocol. The IMS concentrate was extracted with the same kit, but only one modification was carried out to remove the beads. After the first step responsible for sample lysis, the beads were separated from the concentrate by a magnet, and the supernatant was used in the next extraction steps [24].

2.5. Quantitative Real-Time Polymerase Chain Reaction

qPCR was performed to analyze HAdV molecular detection using primers and probe sequences to HAdV-C (VTB2) and HAdV-F (VTB1) [33]. Their sequence and location in the HAdV genomes are given in Table 1. The volumes used were as follows: 5 μL of extracted DNA, 1 μL of each primer and probe, 10 μL of GoTaq® Probe qPCR Master Mix (consisting of GoTaq® Hot Start Polymerase, MgCl2, dNTPs, and a reaction buffer; Promega, Madison, WI, USA), and 2 μL of ultrapure water (RNAse/DNAse-free water). The final reaction volume was 20 μL. Assays were performed in duplicate in 384-well plates adding positive and negative controls. To generate standard curves, 10-fold serial dilutions of standards with known quantification were prepared of HAdV-5 and HAdV-41. Both no template control (NTC) and negative controls of ultrapure water (RNase/DNase-free) were included in each run to confirm the lack of contamination. Dilutions of DNA were performed when needed to dilute the possible inhibitors present in the samples. The plate was inserted into a CFX384 optical reaction module combined with a C1000TM thermal cycler (Bio-Rad Laboratories, Hercules, CA, USA). Results were analyzed using Bio-Rad CFX Manager 3.1 software, and the sensitivity of the reactions was 5.65 GC/5 μL. The reaction steps followed the protocol described by Wolf et al. [33], namely initial activation of the Hot Star polymerase at 95 °C for 5 min, followed by a two-step cycling protocol comprising denaturation step at 95 °C for 15 s and an annealing/extension step at 59 °C for 1 min over 45 cycles. Fluorescence data were collected during the annealing/extension step.

2.6. Nested Polymerase Chain Reaction (Nested PCR)

Nested PCR was carried out to amplify a partial sequence of the DNA polymerase gene. The reaction was carried out for a final volume of 50 μL as follows: 25 μL of GoTaq® Colorless Master Mix (Promega), 18 μL of ultrapure water (RNAse/DNAse-free water), 1 μL of each primer (Pol-F and Pol-R) [34] described in Table 1, and 5 μL of nucleic acid extracted. After initial incubation at 94 °C for 5 min, 40 cycles of amplification were performed. These consisted of denaturation at 94 °C for 30 s, annealing at 50 °C for 30 s (−0.5 °C per cycle), extension at 72 °C for 1 min, and a final extension at 72 °C for 10 min. Amplification was performed in a Bio-Rad® thermal cycler. The last PCR reaction was performed using the same reagents, quantities, and amplification cycles as the first reaction, with changes in the use of the product of the first PCR, i.e., sample and replacement of both primers (Pol-nF and Pol-nR), as described in Table 1. After amplification, PCR products were analyzed on 2% agarose gel with 0.5 mg of ethidium bromide/mL added. The running time was 60 min at 70 V. The molecular size of the products was compared to a 100 bp DNA standard (Ludwig). The bands were visualized in UV light, and the images were photographed with an Easy Doc 200 UV transilluminator equipment.

2.7. Digital Polymerase Chain Reaction

To quantify the viral strains used as qPCR control and artificially contaminated samples in IMS analyses, 10 serial 10-fold dilutions of HAdV-5 and HAdV-41 were made to undergo dPCR. Dilutions were applied to find the proper target concentration in order to achieve an acceptable level of precision of below 5% confidence interval (CI) in the quantification results. dPCR was carried out in such a way that the target molecules were dispensed into a wider number of partitions following a Poisson distribution. As positive partitions may contain more than one target molecule, Poisson statistics was applied to correctly estimate the number of the target within the analyzed sample presuming that each molecule had the same chance of landing in any partition [35]. dPCR reaction was carried out in a QuantStudio 3D® system (Thermo Fisher Scientific™), with the assays in a final volume of 14.5 μL as follows: 7.25 μL of the Master Mix v2 kit (QuantStudio 3D®, Thermo Fisher Scientific™, Frederick, MD, USA), 5.05 μL of ultrapure water (RNAse/DNAse-free water), 0.75 μL of primer and probe assay targeting VTB2 for HAdV-5 and VTB1 for HAdV-41 [33] (Table 1), and 1.45 μL of DNA sample. The chips used in the reactions presented 20,000 partitions (QuantStudio™ 3D Digital PCR 20K Chip Kit v2). Chips were loaded with the final reaction and sealed in a QuantStudio 3D sealer. Amplification was performed in a ProFlex® thermal cycler (Applied BiosystemsTM, Frederick, MD, USA). The reaction steps followed an initial stage at 95 °C for 15 min, followed by 40 cycles at 95 °C for 10 s, 55 °C for 20 s, and 72 °C for 15 s. A QuantStudio 3D® chip reader was used to read the chips, and the results were analyzed using the AnalysisSuite dPCR application provided by Thermo Fisher ConnectTM. The results had 1.83% of precision for HAdV-5 and 1.44% for HAdV-41.

2.8. Phylogenetic Analysis

Samples that were positive for AdV were also submitted to DNA sequencing for species identification. Sequencing was carried out by Ludwig Biotec, Alvorada, Brazil (Sequencing Service) using an automated sequencer (ABI PRISM 3500 Genetic Analyzer Applied Biosystems). The assessment was performed by comparing the genomic sequences obtained by direct DNA sequencing with other nucleotide fragments available from GenBank according to the neighbor-joining methodology [36]. The phylogenetic tree was elaborated with the calculation of evolutionary distances with the Kimura parameter 2 method [37] and the Molecular Evolutionary Genetics Analysis software version 7 (MEGA7) [38].

2.9. Viral Isolation

A549 cell culture was used to value the presence of HAdV infectious particles in samples following the same protocol described by Gularte et al. [15] with some modifications. Briefly, 24-well plates were used to carry out the assays. Samples were tested to identify the capacity of HAdV concentrated by IMS to be viable particles. Thus, the test was performed using different types of sample preparation for inoculation into the cells. Two 10-fold serial dilutions of standard HAdV-5 with known quantification were prepared and concentrated by IMS. One volume was immediately used for inoculation. The others were frozen and thawed three times at −20 and −80 °C to examine the possibility of viral particles being released from the complex antibody–virus; one part was used directly for inoculation, and the other was filtered through 0.22 μm diameter membrane filters coupled with sterile needles to avoid possible negative interaction between beads and cells. All samples were previously diluted in Eagle’s minimal essential medium MEM (1:2) to prevent cell cytotoxicity. A final volume (200 μL) of each sample was inoculated into A549 cell monolayers and submitted to two passages of five days each, with the samples compared to control cells under a light microscope to identify potential cytopathic effects (CPE). All samples were treated with DNAse, submitted to a DNA extraction protocol, and tested using the same qPCR protocol as described above.

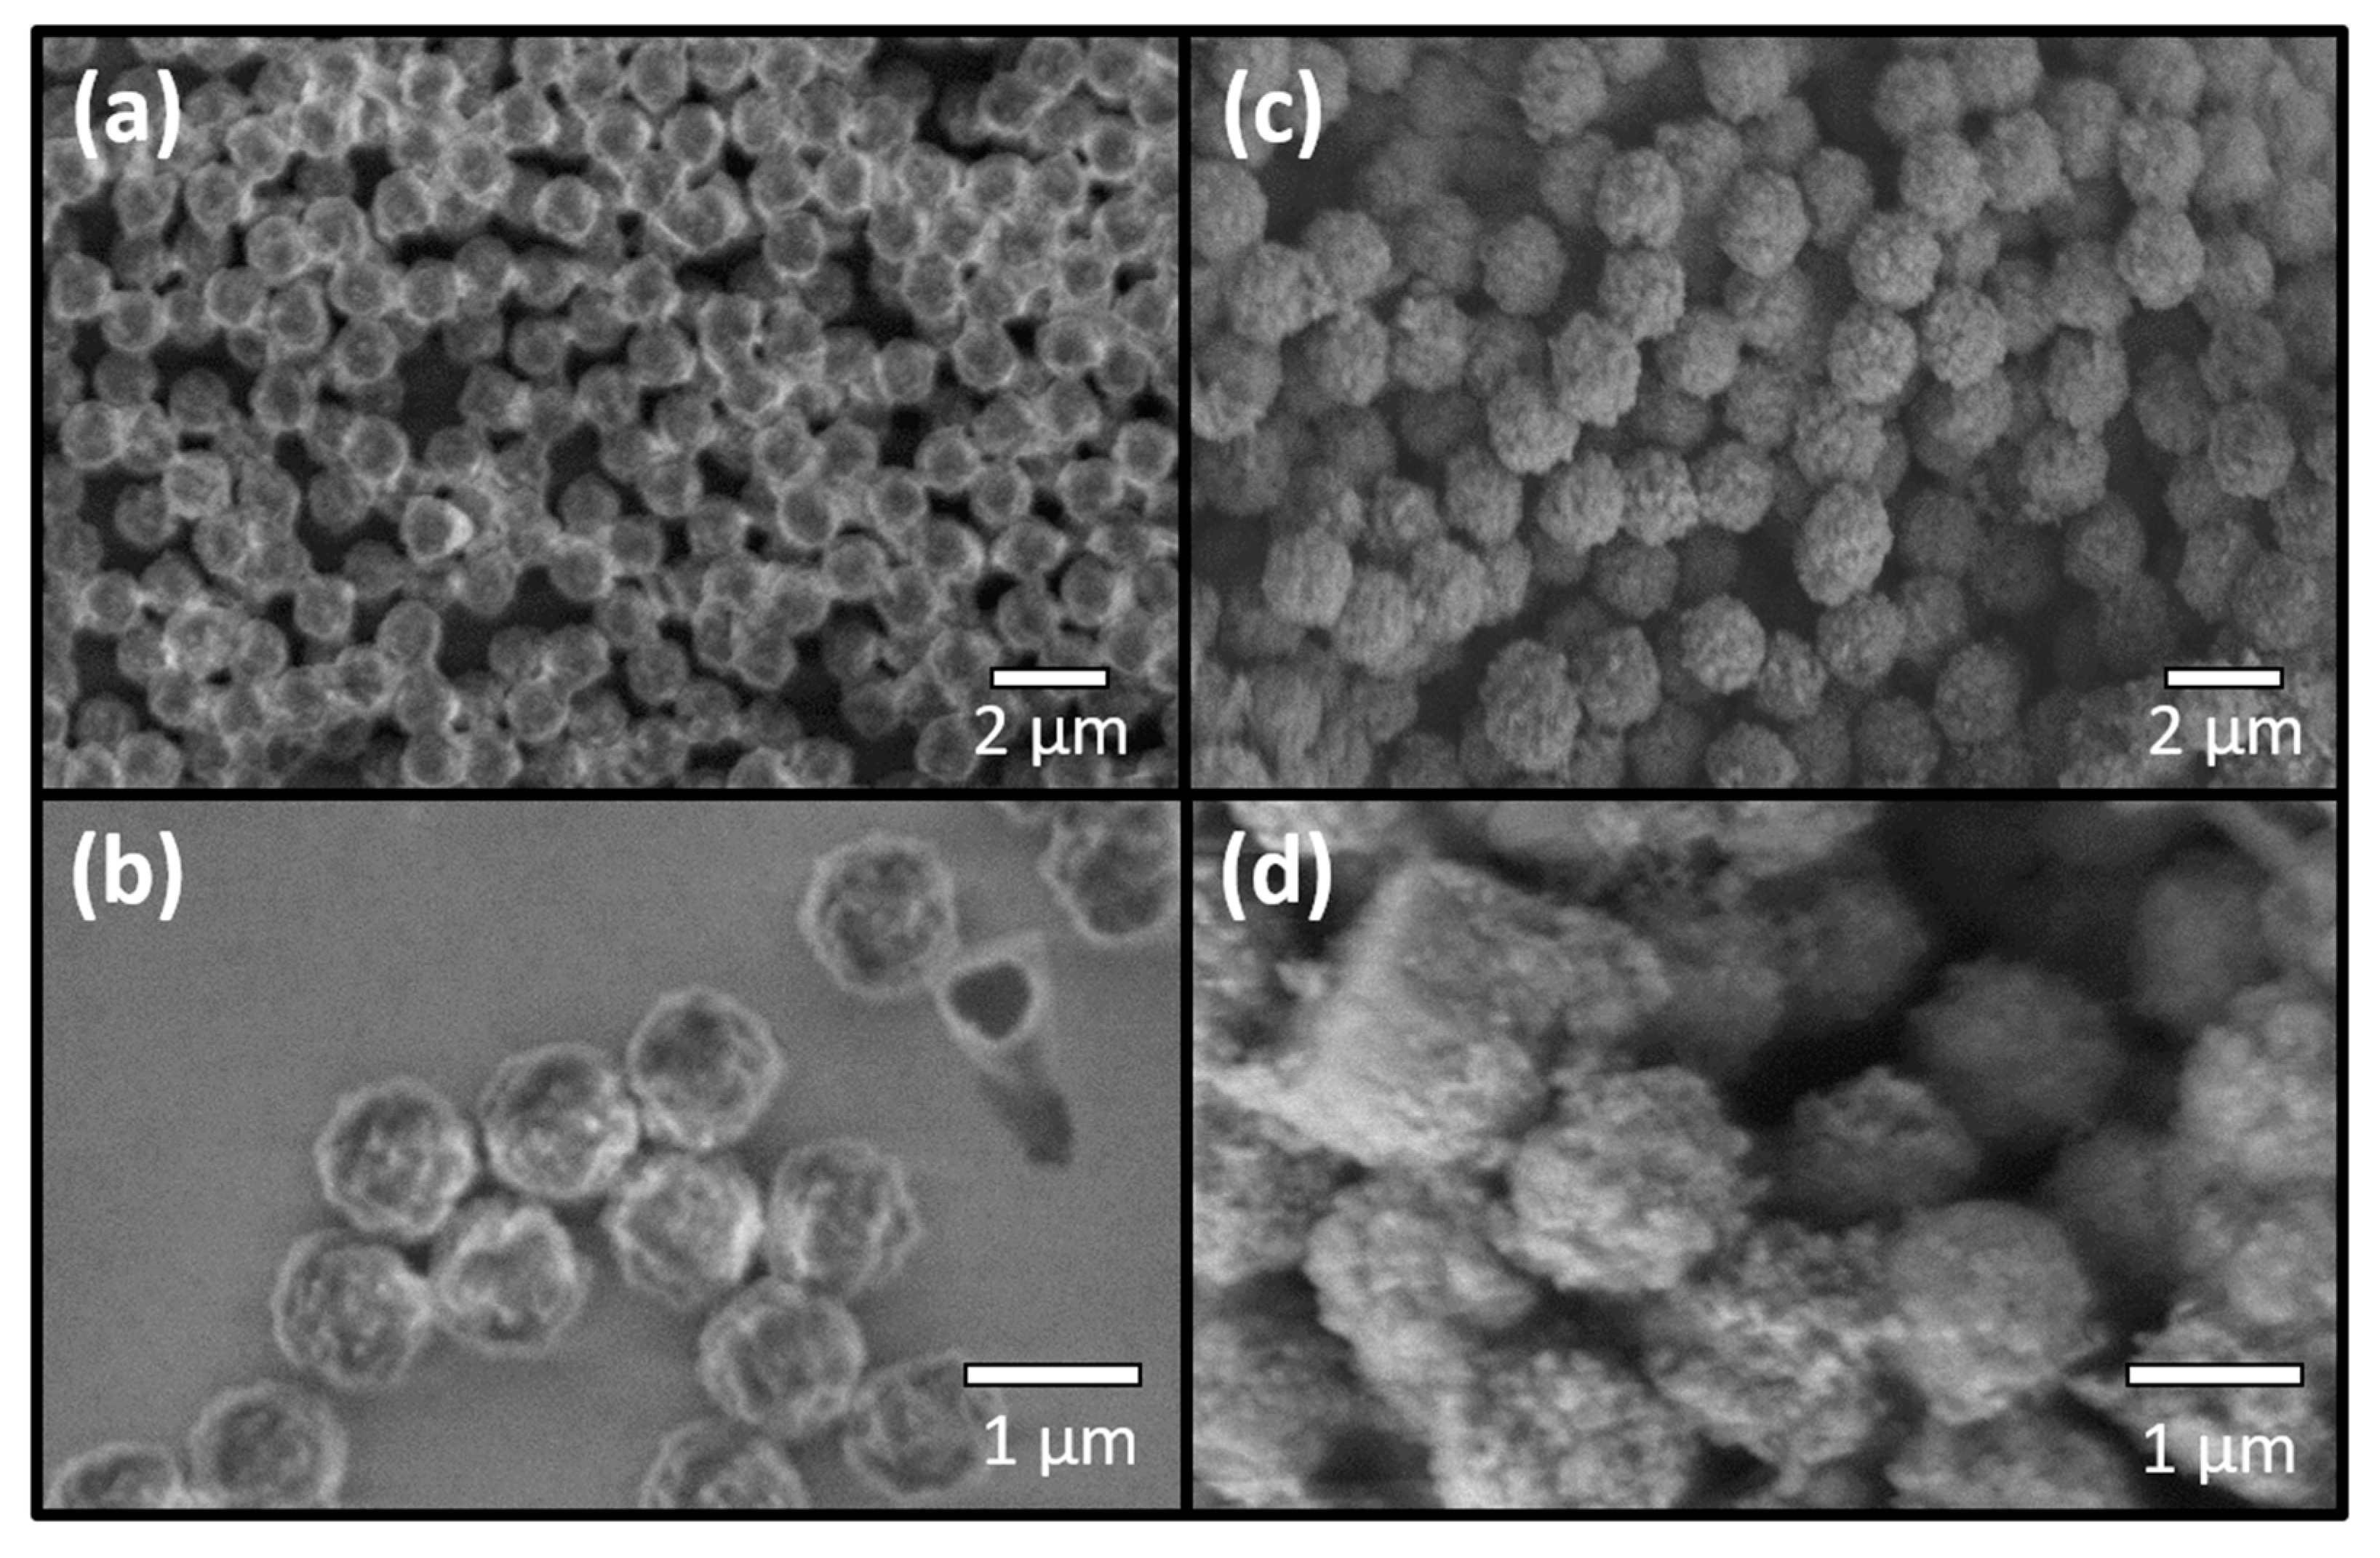
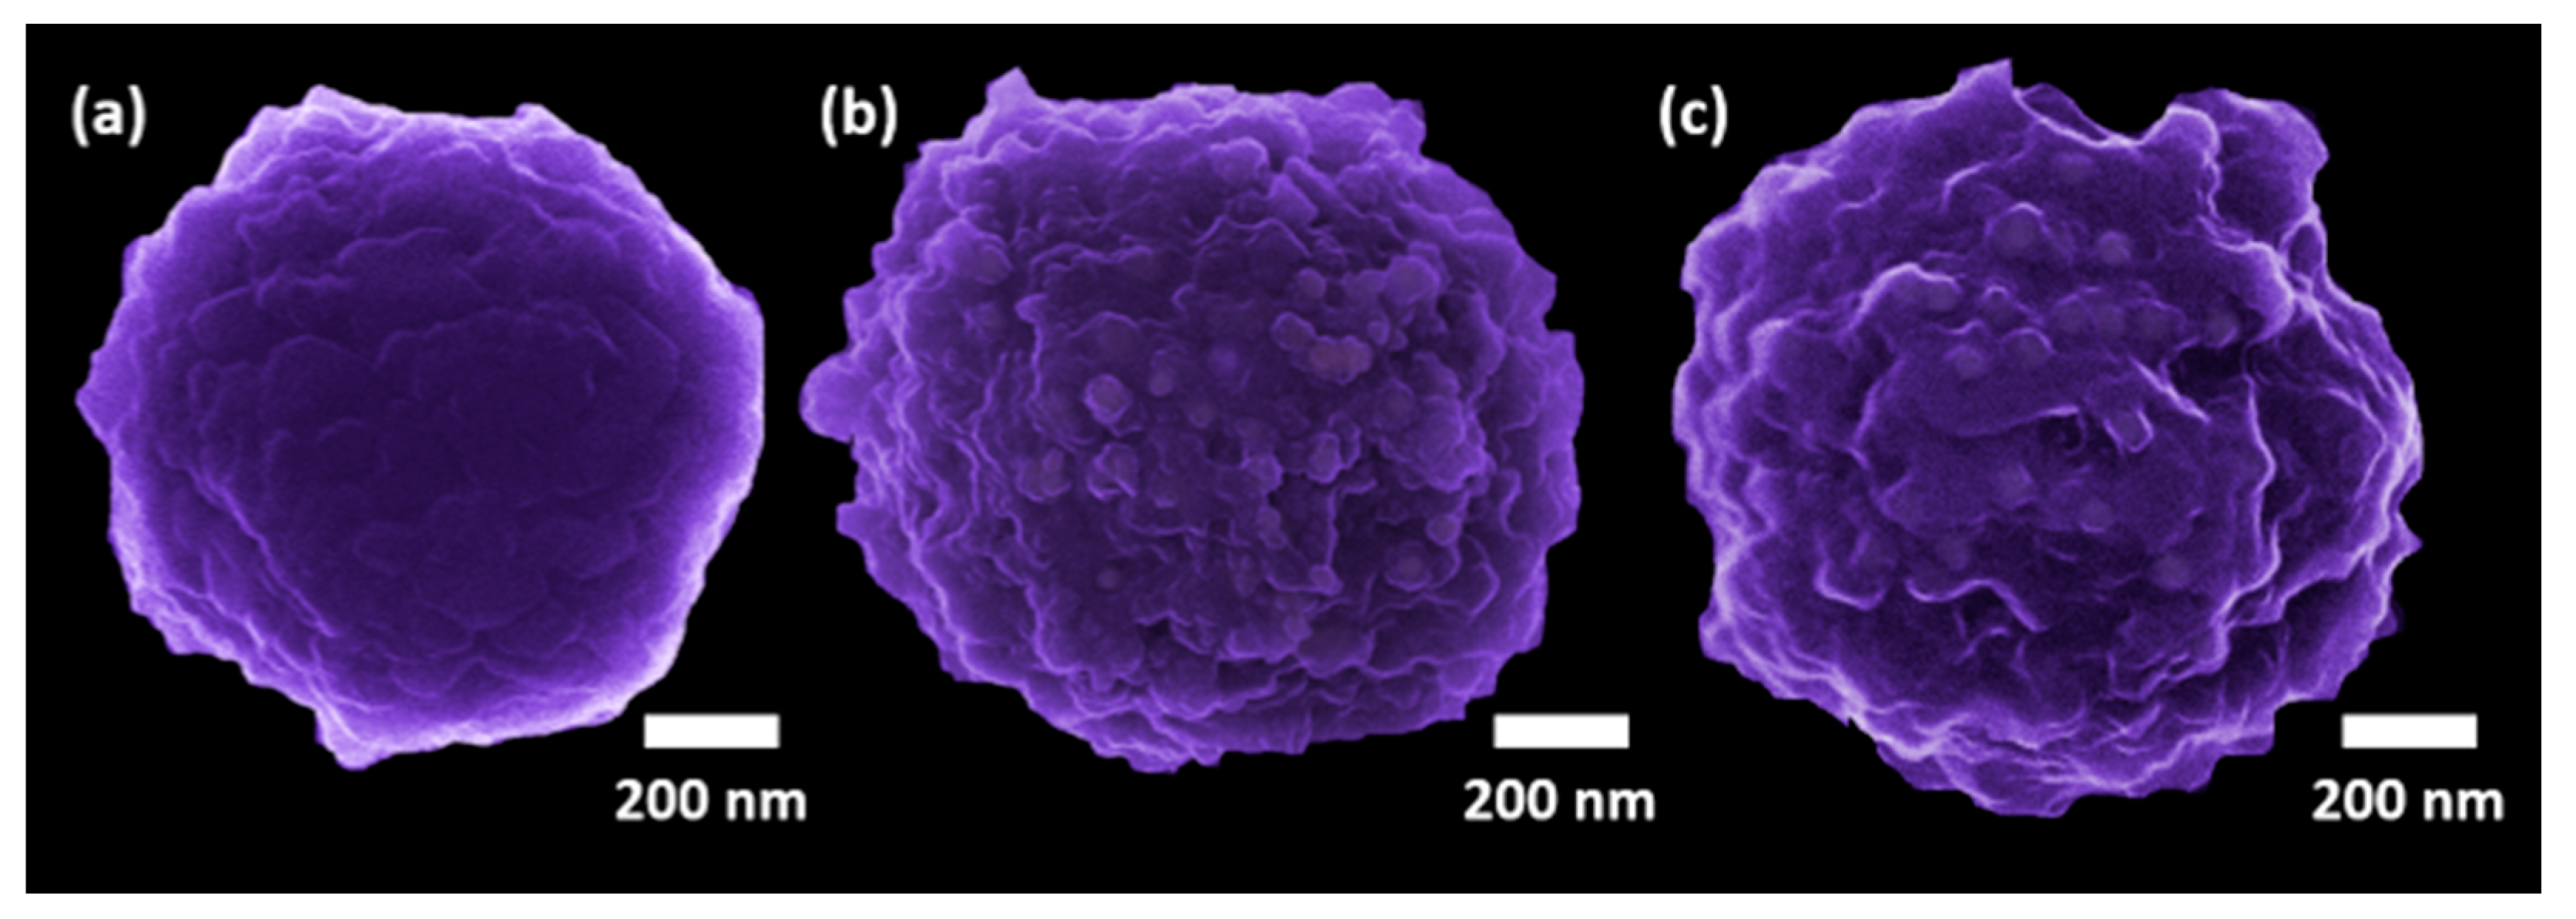
2.10. Microscopic Analysis

The microscopy images were generated using two microscopes—ORION NanoFab helium ion microscope (HIM) (Carl Zeiss, Germany) and Hitachi S-4800 scanning electron microscope (SEM)—at the University of Southern Denmark. The beads were morphologically characterized with the following steps: before and after antibody binding and after binding with concentrated HAdV and effluent samples from a sewage treatment plant. HIM was carried out at 25 keV beam energy with a probe current ranging from 0.1 to 0.3 pA. No conductive coatings were applied to the samples prior to imaging in order to preserve the sample surface information. Charge compensation was ensured through a low-energy electron beam (flood gun, 600 eV) directed at the sample [39]. SEM was carried out at 3 keV in magnetic mode.

2.11. Viral Recovery

Viral recovery (%) was performed with results found in the standardization tests to evaluate the best antibody to detect HAdV concentration by IMS and make comparisons with the unconcentrated samples. The calculation used to provide the viral recovery was the mean of virus detected (GC/mL) by each approach divided by the known quantification of HAdV-5 inoculated (GC/mL) multiplied by 100.

2.12. Statistical Analysis

The variables analyzed were the data found in standardization tests (samples concentrated by IMS using monoclonal and polyclonal antibody and unconcentrated samples) and water analyses (samples concentrated by IMS using monoclonal and polyclonal antibody and ultracentrifugation). The statistical analyses were performed using SPSS 24.0 software, with p < 0.05 used to determine statistical significance. To verify the normal distribution of data, the Kolmogorov–Smirnov’s test was applied, which showed the data did not present normal distribution. Therefore, the nonparametric Friedman test was performed in the analyses of the results of standardization tests, and the nonparametric multiple comparisons Kruskal–Wallis test was carried out in the analyses of the results of water sample tests.

3. Results

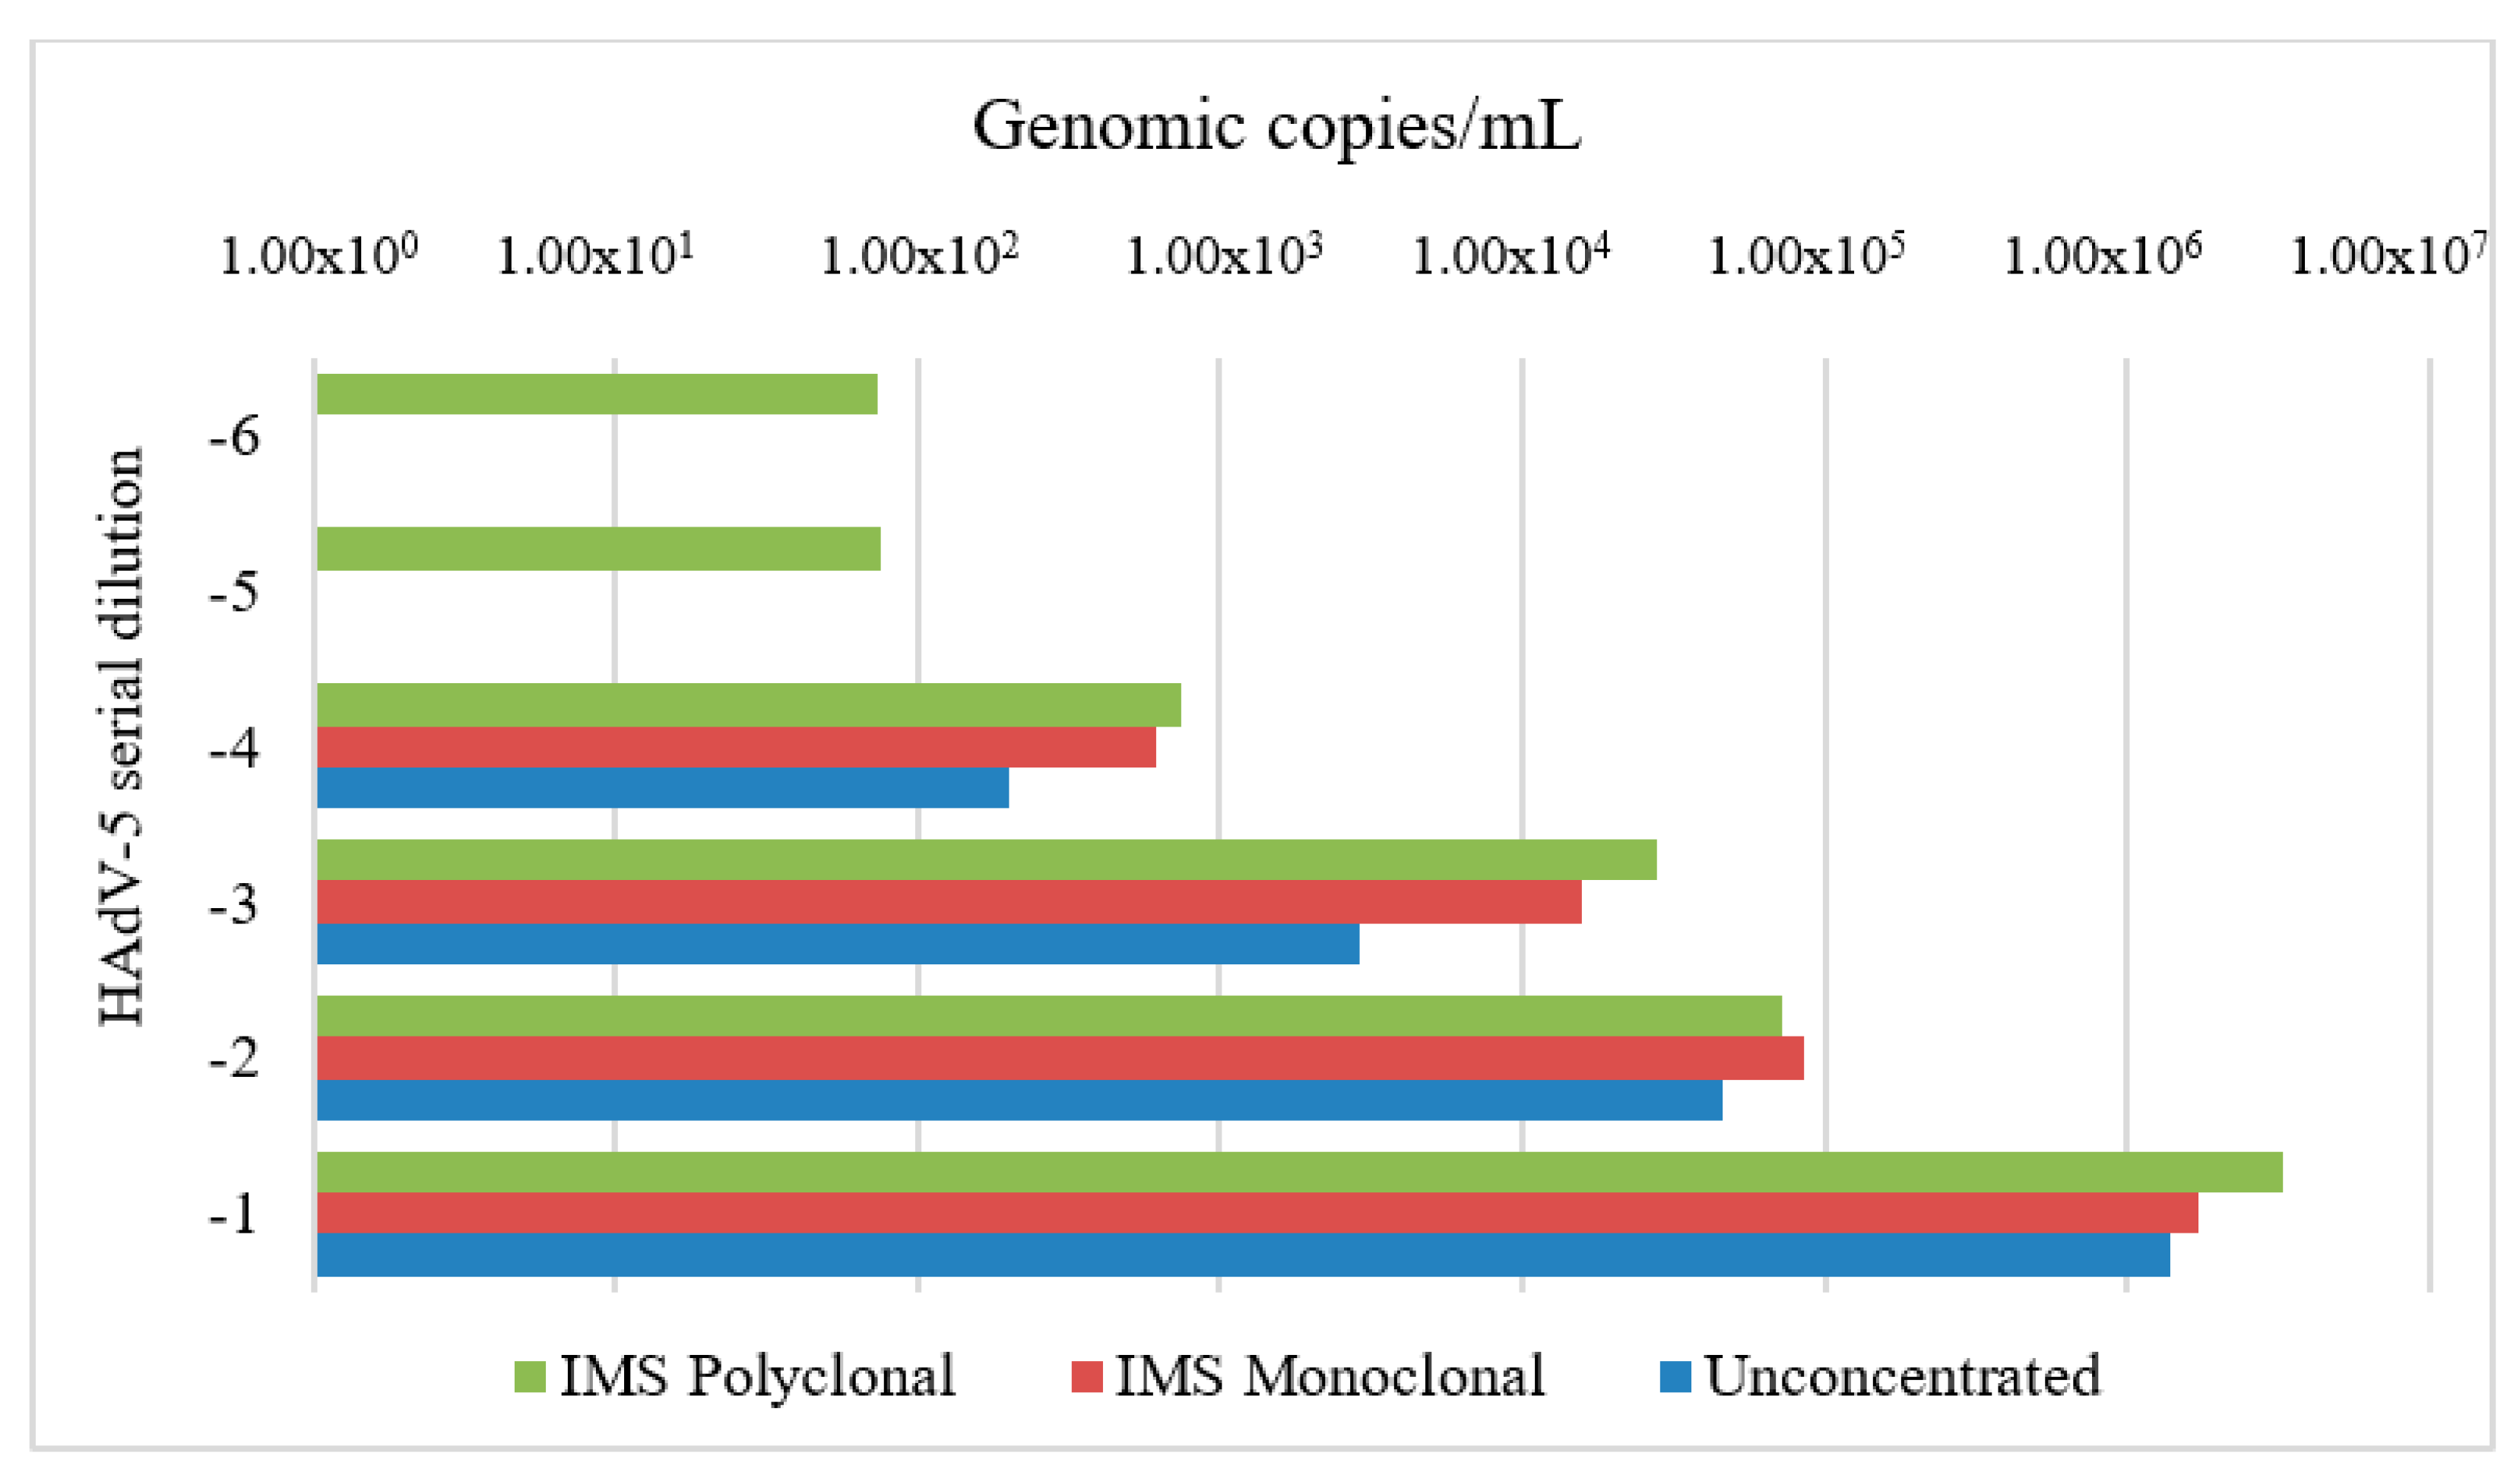
3.1. Standardization of IMS Parameters

In order to analyze the success of the conjugation between magnetic beads and antibodies, we performed microscopic analyses in order to identify morphological differences in the surface of the beads. Figure 2 shows the images generated by SEM of magnetic beads before conjugation (a, b) and after complex beads–antibody (IMBs) coupling (c, d). According to these images, we may differentiate morphological characteristics, such as increased thickness and roughness, after the antibody conjugation.
A preliminary IMS test was also performed using effluent from a sewage treatment plant as a sample to detect the binding of IMBs to possible HAdV viral particles present in the effluent, and the results were compared with a standard HAdV-5 sample. In the images generated by HIM (Figure 3b), we could notice visible protuberances in the beads that were exposed to these samples. In order to confirm viral particle attachment, beads exposed to standard HAdV-5 sample were analyzed by HIM (Figure 3c), and the resulting morphology was consistent with the protuberant morphology found on the beads exposed to wastewater (Figure 3b). The characteristic sizes of these protuberances, combined with high antibody binding selectivity as well as similar morphology on wastewater and standard samples, indicated capture of viral particles by the bead–antibody conjugate.
The IMS technique was performed with both monoclonal and polyclonal antibodies using serial dilutions of HAdV-5 standard strain as samples. For virus detection, after the concentration step, a nested PCR was performed with the DNA extracted from the samples that were concentrated by IMS. For comparison, we also analyzed the same standard HAdV samples but without the previous concentration process. According to the PCR result, the presence of HAdV was detected in the three sample groups (Supplementary Materials—Figure S1).
The qPCR analyses were performed for both viral genomic fragment detection and quantification in genomic copies of samples in dilutions from 10−1 to 10−13. As shown in Figure 4 (Supplementary Materials—Table S1), positive results were found in samples of the three groups (monoclonal, polyclonal, and unconcentrated). However, the unconcentrated samples and the samples concentrated by IMS (monoclonal) presented positives results until dilution of 10−4, and samples concentrated by IMS (polyclonal) showed detection until dilution of 10−6. Polyclonal antibody presented the best averages of detection in most dilutions. This same pattern was also seen in the analysis of viral recovery. The highest values of HAdV recovery were found in samples concentrated by polyclonal antibody in all dilutions, followed by monoclonal antibody and unconcentrated samples (Supplementary Materials—Table S1). These results were also corroborated with the statistical analyses. According to the Friedman test, results showed a significant difference (p < 0.05) between samples concentrated by IMS (polyclonal) and unconcentrated samples (Supplementary Materials—Figure S2). Ultrapure water was also concentrated by IMS with both antibodies to evaluate the possibility of nonspecific binding to occur during the concentration assay, but these samples were negative as expected.
Results of the viral infectivity showed that HAdV-5 concentrated by IMS might be considered as an infectious virus as all samples were positive in viral isolation in cell culture followed by qPCR (Figure 5). In the first passage of inoculation, the sample that was directly inoculated into cells presented better results in almost all antibodies and dilutions when compared to other types of samples. Unexpectedly, the sample that was frozen at −80 °C and afterwards thawed and filtered showed the worst results among almost all evaluated data in both passages. In the first passage, the highest value detected was 2.10 × 10⁶ GC/5µL in dilution sample 10−1, and in the second passage, it was 1.70 × 10⁷ GC/5µL in dilution sample 10−2, with both of these values being concentrated with polyclonal antibody as shown in Figure 5 (Supplementary Materials—Table S2).

3.2. Water Samples Analyses

AdV detection in water samples was performed by nested PCR. The samples that were concentrated by IMS using monoclonal antibody presented 13% (2/15) positivity (Supplementary Materials—Figure S3a), and those using polyclonal antibody showed 7% (1/15) positivity (Supplementary Materials—Figure S3b). These samples were also concentrated by the ultracentrifugation method; however, no samples were positive for this analysis (Supplementary Materials—Table S3). Nucleotide sequencing and phylogenetic analysis were performed on the positive samples. The result of these analyses confirmed that HAdV-C was the species found in these water samples (Figure 6).
HAdV was detected in all sampling sites by qPCR assays as represented by potable and nonpotable water sources. HAdV-C was positive in 60% (9/15) of the samples concentrated using monoclonal antibody, 47% (7/15) of the samples using polyclonal antibody, and 13% (2/15) using ultracentrifugation. The highest value of HAdV-C was detected at site 5688, represented by 5.83 × 10⁶ GC/L (monoclonal antibody). HAdV-F was positive in 27% (4/15) of the water samples that were concentrated using polyclonal antibody and ultracentrifugation and 20% (3/15) in samples concentrated using monoclonal antibody. The highest value of HAdV-F was detected at site 5689, represented by 5.68 × 10⁴ GC/L (monoclonal antibody; Figure 7) (Supplementary Materials—Table S3). The statistical analysis, according to the Kruskal–Wallis test, showed a significant difference (p < 0.05) in positivity to HAdV-C between water samples concentrated by IMS (monoclonal) and samples concentrated by ultracentrifugation (Supplementary Materials—Figure S4).

4. Discussion

4.1. Standardization of IMS Parameters

The images generated from the microscopy analyses demonstrated morphological changes, including spikes and protrusions on the surface of the magnetic particles, which is evidence of the binding between beads and antibody, forming the expected complex (IMBs). Preliminary testing with an effluent sample from a wastewater treatment plant and HAdV-5 also demonstrated the presence of attached projection on the IMBs that may correspond to HAdV particles. Furthermore, we could confirm this evidence through the use of molecular analyses, which have shown important results on HAdV detection by demonstrating that IMS is an important technique for concentrating virus and other pathogens as previously reported [23,31,40].
Evaluating the results presented in Figure 5, it was possible to ensure the ability of the IMS technique to concentrate viral particles as it was possible to the detect them until the dilution of 10−6. The test was applied in replicates, and the results had the same pattern in all assessments. We also used ultrapure water as a negative control that was concentrated by IMS for both antibodies. These results did not show contamination; consequently, it demonstrated the specificity of the technique as nonspecific binding was not found. Our results are corroborated by other studies that have also demonstrated important findings on the capacity of IMS to concentrate viruses and on the increase of sensibility when combined with a molecular approach such as PCR or qPCR [29,31,41,42]. A result that must be noted is the increase of efficiency in detecting samples with low amounts of HAdV genomic copies when these were concentrated by IMS. This finding is very useful in environmental studies as a huge problem in this field is the potential dilution of viral particles in water resources, which may compromise viral detection [19,43].
In this step, we noticed some differences between the results obtained when comparing the two types of antibodies. Polyclonal antibody presented a better average of detected genomic copies and viral recovery in standard HAdV samples. In addition, it was more sensitive in detecting lower viral concentrations when compared to monoclonal antibody. Antibodies have the same function and structure, but they have different characteristics, such as their origin, production, and specificity. Monoclonal antibodies are produced by a single clone of cells; thus, they have a single epitope detection and consequently have high specificity and sensitivity. In contrast, polyclonal antibodies are produced by numerous clones and are more tolerant of variation in epitopes without losing the recognition of specific antigens. They are also more resistant to degradation and are recognized as a better choice to be used in immunological tests [44]. The antibodies we used can recognize a wide range of HAdV (following the manufacturer’s description). The monoclonal antibody used reacts with adenovirus-specific hexon polypeptide and polyclonal with numerous adenovirus proteins, including hexon protein. As no significant difference was seen while comparing the use of these antibodies in standardization analyses, both antibodies can be good options to use in IMS-qPCR.
We tested samples of HAdV-5 that were concentrated by IMS and seeded into A549 cells in order to see the capacity of these samples to infect cells after the concentration step. As we had no previous knowledge about the possibility of beads interfering in monolayer cells, different types of processing were carried out. All samples were successfully detected as infectious virus particles, not only in CEP but also in posterior qPCR. In the first passage, samples that were seeded directly into cells showed the best results, indicating that beads did not cause damage to the cells. Unexpectedly, samples that were frozen–thawed at −80 °C and filtered presented the worst results. This could be an indication that viruses were not released, and the complex was stuck in the filter, decreasing the number of detected viable particles. Our detection results were similar to another study that investigated the detection of infectious human enteroviruses. The study compared the results of IMS-qPCR with plaque assay, and it was found that the two protocols provided the same detection sensitivity [45]. These results support our claim about the advantages of using the IMS-qPCR approach in environmental virology analyses. The main benefit is the decreased detection of nonviable viruses as damage in the viral capsid may change the antigenic properties. Consequently, the antibody will not be able to bind into the viral antigen or naked genomic material [20,24,29]. The detection of infectious viral particles in water resources is very important to estimate the health risk associated with human contact with contaminated waters [21]. HAdV is described as a difficult virus to propagate in cells due to its slow growth in cell cultures without always producing cytopathogenic effects [16,46]. Therefore, IMS combined with a qPCR can be an important tool to quantify the number of infectious viruses in aquatic resources, contributing to relevant and valuable data for microbiological risk assessment [31].

4.2. Water Sample Analyses

The positive water samples detected by nested PCR were sequenced and identified as HAdV-C. The qPCR results also showed HAdV-C as the most prevalent species in water samples concentrated by IMS to both antibodies. In the literature, HAdV-C has also shown to be more prevalent than other HAdV species in environmental analyses. In samples of sewage sludge from wastewater treatment distributed throughout continental U.S., there was an average of 78% prevalence of HAdV-C [47]. This species has been described as the most prevalent HAdV species circulating in Brazil as well. A study carried out in Rio de Janeiro identified 28 of the 36 sequenced water samples as having HAdV-C, while qPCR analysis detected HAdV-C in 93% of the water samples [48]. Coastal areas of Santa Catarina, Brazil, were evaluated for the presence of HAdV, and the phylogenetic analyses showed HAdV-C as the most common circulating species on these beaches [49]. In a recent study carried out on the beaches of southern Brazil, the phylogenetic analysis showed a prevalence of HAdV-C in environmental samples. The results detected 14% (22/160) of the samples as being representative of species C, while qPCR analysis also showed HAdV-C as the most detected species (26% or 42/160) [15]. Although HAdV-C has been related especially with cases of respiratory infections [50,51,52], it has been frequently detected in stools [53,54] and water samples as described above.
On the other hand, a study conducted in recreational waters in the south of Brazil presented different findings when concentrated and unconcentrated water samples were analyzed. The most prevalent HAdV species in the concentrated samples was species F (10.9%) followed by C (7.2%), while both species F and C presented the same results in the unconcentrated samples (10.9%) [13]. Although HAdV-F was not the most prevalent species found in our study, the rate of detection was higher than the previously cited research for all concentration techniques used. This may be explained by the fact that this city reported an outbreak of gastroenteritis before the sampling, and HAdV-F is mainly responsible for acute gastrointestinal infections, especially in children and immunocompromised individuals [8,51,55].
The assessment of HAdV in water samples provided interesting results when the two concentration approaches were compared. Analyzing the findings of HAdV-C and -F together, six water samples concentrated by the ultracentrifugation method presented positivity. However, samples concentrated by IMS showed important results in HAdV detection, with 11 and 12 positive water samples using polyclonal and monoclonal antibodies, respectively. The different antibodies used did not present a significant difference in the detection of HAdV-C and -F when testing water samples that were naturally contaminated. Therefore, both antibodies can be successfully used to concentrate HAdV as we saw with the results of artificially contaminated samples. However, the statistical analysis showed a significant difference between the water samples concentrated by ultracentrifugation and IMS (monoclonal) for the detection of HAdV-C. Thus, we emphasize that the IMS technique proved to be a better concentration methodology when compared to ultracentrifugation. IMS provides better sensitivity due to higher specificity as the functionalized particles search and bind to the specific target due to antibody–antigen compatibility. Ultracentrifugation separates the particles due to their physical properties, which is not as specific as immune binding. It is true that ultracentrifugation allows for higher volume handling, but it might not be necessary to handle such large volumes, especially in waters contaminated through anthropic activities, such as in Brazilian water resources.
Another relevant result corresponds to variation in genomic copies. While samples concentrated by ultracentrifugation ranged from 2.00 × 10² to 2.11 × 10³ GC/L, samples concentrated by IMS showed values ranging from 4.55 × 10² to 5.83 × 10⁶ GC/L. Other studies have used the ultracentrifugation method to concentrate viral particles with good results [15,56]. However, this approach has some drawbacks that should be considered, such as the capacity to concentrate inhibitory substances that can interfere on PCR analyses, thereby decreasing the sensibility of detection and even providing false negatives [22]. The presence of inhibitory substances in samples concentrated by IMS is very rare because this technique is very specific and has more than one wash step, which considerably increases the possibility of concentrating only desired viral particles [18,21]. The ability to remove inhibitory substances has been previously described in seawater [29], food samples [57], and stool samples [30]. Probably, these differences between concentration methods can explain the increase in positive samples and genomic copy results found in the qPCR analyses for water concentrated by IMS.
Currently, various concentration methods for virus analysis have been developed; however, different kinds of water and enteric viral species have hampered the standardization of only one concentration technique [43]. A reliable concentration step should have some important characteristics, such as being technically viable, having a high recovery rate, producing a small volume of concentrate, and being cost-effective and suitable for a wide range of different viruses [21]. The IMS technique was found to have most of these qualities except when the analysis required a wide range of viruses to be concentrated. Therefore, this method is very specific and only the desired virus can be concentrated at a time. If the goal is to concentrate more species of viruses, IMS could be used as a second concentration step. Even with this drawback, other researches have shown the benefits of using IMS combined with a molecular assay to detect enteric viruses in water samples, as has been already described for rotavirus [29,31] and HAdV-F [24]. Nevertheless, to our knowledge, this is the first research to use IMS to detect HAdV-F and HAdV-C using monoclonal and polyclonal antibodies and to compare the IMS and ultracentrifugation concentration methods in water samples.
For the next advance, microfluidic-based techniques have emerged in recent years as an approach to detect biological matter in fluidic samples [58,59]. These techniques allow for miniaturized solutions with a lab-on-chip approach with reduced costs and high resolution. IMS combined with microfluidic technology to produce a lab-on-chip platform for pathogen detection is a promising method to improve the response of in situ detection [60]. After the standardization of IMS parameters, the data may be used for applications in an on-chip microfluidic environment, as has been already shown for food-related bacteria [23,60]. Therefore, data generated in this study could be applied to microfluidic technology in the future with the aim of establishing real-time, faster, cheaper, simpler, more specific, and more sensitive alternatives for detection devices that may help in water safety monitoring.

5. Conclusions

In this study, it was possible to establish the use of IMS as a concentration method for the detection of HAdV-C and -F in water samples. To our knowledge, this is the first time that microscopic analyses using SEM and HIM helped assess the surface of magnetic beads coated with antibody and sample. We showed that both monoclonal and polyclonal antibodies demonstrated important advantages to capture HAdV in water samples. Therefore, both antibodies can be used in future studies to generate significant results.
Comparing the ultracentrifugation and IMS approaches, it was possible to notice that IMS-qPCR demonstrated a higher number of samples positive to HAdV and provided a higher rate of genomic copy detection as well. The same method was also more efficient at detecting few HAdV particles in samples. As viruses can be dispersed in waterbodies, this technique seems to be a good choice to avoid false-negative samples.
The most important advantages of IMS combined with qPCR include processing samples in shorter time, concentrating no inhibitory substances, and increasing the possibility of detecting viable viral particles. These advantages confirm this approach as an important tool for virological analyses in environmental samples. The data generated by IMS-qPCR may be used for more accurate results in risk assessment studies and help in watershed management by identifying and controlling sources of contamination to prevent outbreak of waterborne disease. These public decisions would directly impact the quality of life of the population.
Furthermore, the possibility of integrating this approach as an enrichment step on microfluidic platforms may be an important stage in the development of new sensors. Biosensors will be the next generation of technologies to improve the detection of pathogens in water resources in an easy and precise real-time manner, thereby contributing to more accurate microbial source tracking.

Supplementary Materials

The following are available online at https://0-www-mdpi-com.brum.beds.ac.uk/2227-9040/9/2/19/s1, Table S1: qPCR results to HAdV standard analyses in unconcentrated and concentrated samples by IMS method, Table S2: Results of HAdV-5 infectious particles concentrated by IMS and detected by Viral isolation and subsequent Qpcr, Table S3: HAdV in water samples comparing ultracentrifugation and IMS methods. The results of HAdV-F and C were established by qPCR and AdV by Nested PCR, Figure S1: Nested PCR results with the unconcentrated HAdV standard samples and concentrated by the IMS technique, Figure S2: Statistical analysis of results found in HAdV standard analyses of unconcentrated and concentrated samples by IMS method, Figure S3: Nested PCR results in water samples that were carried out after IMS concentration using monoclonal antibody (a) and polyclonal antibody (b), Figure S4: Statistical analysis of results found in naturally contaminated water samples concentrated by IMS and ultracentrifugation methods (1: Ultracentrifugation, 2: IMS—Monoclonal, 3: IMS—Polyclonal).

Author Contributions

Conceptualization, J.S.G., R.d.O.H., and F.R.S.; methodology, J.S.G. and R.d.O.H.; validation, J.S.G. and R.d.O.H.; formal analysis, D.M.d.Q.; investigation, J.S.G., R.d.O.H., M.D., J.F., A.K.A.E., F.H.H., and P.R.d.A.; resources, H.-G.R. and F.R.S.; writing—original draft preparation, J.S.G.; writing—review and editing, R.d.O.H., J.F., H.-G.R., and F.R.S.; supervision, R.d.O.H., H.-G.R., and F.R.S.; funding acquisition, H.-G.R. and F.R.S. All authors have read and agreed to the published version of the manuscript.

Funding

Roana de Oliveira Hansen thanks the European Regional Development Fund Interreg Deutschland-Danmark under project number 096-1.1-18 (access and acceleration). Jacek Fiutowski thanks the European Regional Development Fund Interreg Deutschland-Danmark under project number 086-1.1-17 (CheckNano). Feevale University thanks the Brazilian Coordination for the Improvement of Higher Level Personnel (CAPES), Foundation for Research Support of the State of Rio Grande do Sul (FAPERGS), and Brazilian National Council for Scientific Development (CNPq).

Institutional Review Board Statement

Not applicable.

Informed Consent Statement

Not applicable.

Data Availability Statement

The data presented in this study are available in this article and in the Supplementary Material.

Acknowledgments

We would like to thank Antje Labes from the Biotechnology Department at the University of Applied Sciences in Flensburg, Germany, for assisting with laboratory facilities and fruitful discussion.

Conflicts of Interest

The authors declare no conflict of interest.

References

  1. Val, A.L.; de Bicudo, C.E.M.; de Bicudo, D.C.; Florencio, D.G.; Spilki, F.R.; de Nogueira, I.S.; Hespanhol, I.; Cirilo, J.A.; Tundisi, J.G.; Val, P.; et al. Water quality in Brazil. In Water Quality in the Americas: Risks and Opportunities; Roldán, G., Tundisi, J., Jiménez, B., Vammen, K., Vaux, H., González, E., Doria, M., Eds.; Inter American Network of Academies of Sciences (IANAS): Trieste, Italy, 2019; pp. 104–126. ISBN 978-607-8379-33-0. [Google Scholar]
  2. Girones, R.; Ferrús, M.A.; Alonso, J.L.; Rodriguez-Manzano, J.; Calgua, B.; de Abreu Corrêa, A.; Hundesa, A.; Carratala, A.; Bofill-Mas, S. Molecular detection of pathogens in water—The pros and cons of molecular techniques. Water Res. 2010, 44, 4325–4339. [Google Scholar] [CrossRef] [PubMed]
  3. World Health Organization. The Top 10 Causes of Death. Available online: https://www.who.int/news-room/fact-sheets/detail/the-top-10-causes-of-death (accessed on 10 March 2020).
  4. Bosch, A.; Guix, S.; Sano, D.; Pintó, R.M. New tools for the study and direct surveillance of viral pathogens in water. Curr. Opin. Biotechnol. 2008, 19, 295–301. [Google Scholar] [CrossRef]
  5. Carter, M.J. Enterically infecting viruses: Pathogenicity, transmission and significance for food and waterborne infection. J. Appl. Microbiol. 2005, 98, 1354–1380. [Google Scholar] [CrossRef]
  6. ICTV—International Commitee on Taxonomy of Viruses. Adenoviridae. 2018. Available online: https://talk.ictvonline.org/ictv-reports/ictv_9th_report/dsdna-viruses-2011/w/dsdna_viruses/93/adenoviridae (accessed on 20 May 2020).
  7. Ryu, W.-S. Adenoviruses. In Molecular Virology of Human Pathogenic Viruses; Elsevier: London, UK, 2017; pp. 111–124. ISBN 9780128037089. [Google Scholar]
  8. Santos, N.S.O.; Soares, C.C. Viroses entéricas. In Virologia Humana; Santos, N.S.O., Romanos, M.T.V., Wigg, M.D., Eds.; Guanabara Koogan: Rio de Janeiro, Brazil, 2015; pp. 189–231. [Google Scholar]
  9. Haramoto, E.; Katayama, H.; Oguma, K.; Ohgaki, S. Quantitative analysis of human enteric adenoviruses in aquatic environments. J. Appl. Microbiol. 2007, 103, 2153–2159. [Google Scholar] [CrossRef] [Green Version]
  10. Mena, K.D.; Gerba, C.P. Waterborne adenovirus. Rev. Environ. Contam. Toxicol. 2009, 198, 133–167. [Google Scholar] [PubMed]
  11. Albinana-Gimenez, N.; Miagostovich, M.P.; Calgua, B.; Huguet, J.M.; Matia, L.; Girones, R. Analysis of adenoviruses and polyomaviruses quantified by qPCR as indicators of water quality in source and drinking-water treatment plants. Water Res. 2009, 43, 2011–2019. [Google Scholar] [CrossRef] [PubMed]
  12. Vecchia, A.D.; Rigotto, C.; Staggemeier, R.; Soliman, M.C.; de Souza, F.G.; Henzel, A.; Santos, E.L.; Do Nascimento, C.A.; De Quevedo, D.M.; Fleck, J.D.; et al. Surface water quality in the Sinos River basin, in Southern Brazil: Tracking microbiological contamination and correlation with physicochemical parameters. Environ. Sci. Pollut. Res. 2015, 22, 9899–9911. [Google Scholar] [CrossRef]
  13. Girardi, V.; Demoliner, M.; Rigotto, C.; Schneider, V.E.; Paesi, S.; Spilki, F.R. Assessment of diversity of adenovirus DNA polymerase gene in recreational waters facilitated by ultracentrifugal concentration. J. Water Health 2018, 1–10. [Google Scholar] [CrossRef] [Green Version]
  14. Verani, M.; Federigi, I.; Donzelli, G.; Cioni, L.; Carducci, A. Human adenoviruses as waterborne index pathogens and their use for Quantitative Microbial Risk Assessment. Sci. Total Environ. 2019, 651, 1469–1475. [Google Scholar] [CrossRef]
  15. Gularte, J.S.; Girardi, V.; Demoliner, M.; de Souza, F.G.; Filippi, M.; Eisen, A.K.A.; Mena, K.D.; De Quevedo, D.M.; Rigotto, C.; de Barros, M.P.; et al. Human mastadenovirus in water, sediment, sea surface microlayer, and bivalve mollusk from southern Brazilian beaches. Mar. Pollut. Bull. 2019, 142, 335–349. [Google Scholar] [CrossRef]
  16. Fong, T.-T.; Lipp, E.K. Enteric viruses of humans and animals in aquatic environments: Health risks, detection, and potential water quality assessment tools. Microbiol. Mol. Biol. Rev. 2005, 69, 357–371. [Google Scholar] [CrossRef] [PubMed] [Green Version]
  17. Thurston-enriquez, J.A.; Haas, C.N.; Riley, K.; Gerba, C.P.; Jacangelo, J. Inactivation of Feline Calicivirus and Adenovirus Type 40 by UV Radiation Inactivation of Feline Calicivirus and Adenovirus Type 40 by UV Radiation. Appl. Environ. Mcrobiol. 2003, 69, 577–582. [Google Scholar] [CrossRef] [PubMed] [Green Version]
  18. Rodríguez, R.A.; Pepper, I.L.; Gerba, C.P. Application of PCR-based methods to assess the infectivity of enteric viruses in environmental samples. Appl. Environ. Microbiol. 2009, 75, 297–307. [Google Scholar] [CrossRef] [PubMed] [Green Version]
  19. Lodder, W.J.; Van Den Berg, H.H.J.L.; Rutjes, S.A.; De Roda Husman, A.M. Presence of enteric viruses in source waters for drinking water production in the Netherlands. Appl. Environ. Microbiol. 2010, 76, 5965–5971. [Google Scholar] [CrossRef] [Green Version]
  20. Hamza, I.A.; Jurzik, L.; Überla, K.; Wilhelm, M. Methods to detect infectious human enteric viruses in environmental water samples. Int. J. Hyg. Environ. Health 2011, 214, 424–436. [Google Scholar] [CrossRef] [PubMed]
  21. Hamza, I.A.; Bibby, K. Critical issues in application of molecular methods to environmental virology. J. Virol. Methods 2019, 266, 11–24. [Google Scholar] [CrossRef] [PubMed]
  22. Prata, C.; Ribeiro, A.; Cunha, Â.; Gomes, N.C.M.; Almeida, A. Ultracentrifugation as a direct method to concentrate viruses in environmental waters: Virus-like particle enumeration as a new approach to determine the efficiency of recovery. J. Environ. Monit. 2012, 14, 64–70. [Google Scholar] [CrossRef]
  23. Ahmed, S.; Rubahn, H.-G.; Erdmann, H. Development of an Immunomagnetic Separation Method for Viable Salmonella Typhimurium Detected by Flow Cytometry. Online J. Biol. Sci. 2016, 16, 165–174. [Google Scholar] [CrossRef] [Green Version]
  24. Haramoto, E.; Kitajima, M.; Katayama, H.; Ohgaki, S. Real-time PCR detection of adenoviruses, polyomaviruses, and torque teno viruses in river water in Japan. Water Res. 2010, 44, 1747–1752. [Google Scholar] [CrossRef]
  25. Kjelstrup-Hansen, J.; Tavares, L.; de Oliveira Hansen, R.; Liu, X.; Bordo, K.; Rubahn, H.-G. Optical properties of microstructured surface-grown and transferred organic nanofibers. J. Nanophotonics 2011, 5, 051701. [Google Scholar] [CrossRef]
  26. Wang, Y.; Costa, C.A.B.; Sobolewska, E.K.; Fiutowski, J.; Brehm, R.; Albers, J.; Nebling, E.; Lofink, F.; Wagner, B.; Benecke, W.; et al. Micro-cantilevers for optical sensing of biogenic amines. Microsyst. Technol. 2018, 24, 363–369. [Google Scholar] [CrossRef]
  27. Costa, C.A.B.; Grazhdan, D.; Fiutowski, J.; Nebling, E.; Blohm, L.; Lofink, F.; Rubahn, H.G.; de Oliveira Hansen, R. Meat and fish freshness evaluation by functionalized cantilever-based biosensors. Microsyst. Technol. 2020, 26, 867–871. [Google Scholar] [CrossRef]
  28. Korsa, M.T.; Maria Carmona Domingo, J.; Nsubuga, L.; Hvam, J.; Niekiel, F.; Lofink, F.; Rubahn, H.G.; Adam, J.; Hansen, R.D.O. Optimizing piezoelectric cantilever design for electronic nose applications. Chemosensors 2020, 8, 114. [Google Scholar] [CrossRef]
  29. Grinde, B.; Jonassen, T.; Ushijima, H. Sensitive detection of group A rotaviruses by immunomagnetic separation and reverse transcription-polymerase chain reaction. J. Virol. Methods 1995, 55, 327–338. [Google Scholar] [CrossRef]
  30. Yao, L.; Wu, Q.; Wang, D.; Kou, X.; Zhang, J. Development of monoclonal antibody-coated immunomagnetic beads for separation and detection of norovirus (genogroup II) in faecal extract samples. Lett. Appl. Microbiol. 2009, 49, 173–178. [Google Scholar] [CrossRef]
  31. Yang, W.; Gu, A.Z.; Zeng, S.Y.; Li, D.; He, M.; Shi, H.C. Development of a combined immunomagnetic separation and quantitative reverse transcription-PCR assay for sensitive detection of infectious rotavirus in water samples. J. Microbiol. Methods 2011, 84, 447–453. [Google Scholar] [CrossRef]
  32. IBGE Seberi, RS, BR. Available online: https://cidades.ibge.gov.br/brasil/rs/seberi/panorama (accessed on 27 October 2019).
  33. Wolf, S.; Hewitt, J.; Greening, G.E. Viral multiplex quantitative PCR assays for tracking sources of fecal contamination. Appl. Environ. Microbiol. 2010, 76, 1388–1394. [Google Scholar] [CrossRef] [Green Version]
  34. Li, Y.; Ge, X.; Zhang, H.; Zhou, P.; Zhu, Y.; Zhang, Y.; Yuan, J.; Wang, L.F.; Shi, Z. Host range, prevalence, and genetic diversity of adenoviruses in bats. J. Virol. 2010, 84, 3889–3897. [Google Scholar] [CrossRef] [Green Version]
  35. Majumdar, N.; Wessel, T.; Marks, J. Digital PCR Modeling for Maximal Sensitivity, Dynamic Range and Measurement Precision. PLoS ONE 2015, 10, e0118833. [Google Scholar] [CrossRef]
  36. Saitou, N.; Nei, M. The Neighbor-joining Method: A New Method for Reconstructing Phylogenetic Trees’. Mol. Biol. Evol. 1987, 4, 406–425. [Google Scholar] [CrossRef]
  37. Kimura, M. A simple method for estimating evolutionary rates of base substitutions through comparative studies of nucleotide sequences. J. Mol. Evol. 1980, 16, 111–120. [Google Scholar] [CrossRef] [PubMed]
  38. Kumar, S.; Stecher, G.; Tamura, K. MEGA7: Molecular Evolutionary Genetics Analysis Version 7.0 for Bigger Datasets. Mol. Biol. Evol. 2016, 33, 1870–1874. [Google Scholar] [CrossRef] [PubMed] [Green Version]
  39. Novikov, S.M.; Popok, V.N.; Evlyukhin, A.B.; Hanif, M.; Morgen, P.; Fiutowski, J.; Beermann, J.; Rubahn, H.-G.; Bozhevolnyi, S.I. Highly Stable Monocrystalline Silver Clusters for Plasmonic Applications. Langmuir 2017, 33, 6062–6070. [Google Scholar] [CrossRef] [PubMed]
  40. Chen, Q.; Li, Y.; Tao, T.; Bie, X.; Lu, F.; Lu, Z. Development and application of a sensitive, rapid, and reliable immunomagnetic separation-PCR detection method for Cronobacter spp. J. Dairy Sci. 2016, 100, 961–969. [Google Scholar] [CrossRef] [PubMed]
  41. Ha, J.-H.; Kim, M.L.; Choi, C.; Choi, I.-S.; Myoung, J.; Ha, S.-D. Recovery of structurally intact norovirus from food-contact surfaces. Food Control. 2015, 47, 564–568. [Google Scholar] [CrossRef]
  42. Lee, H.-M.; Yang, J.-S.; Yoon, S.-R.; Lee, J.Y.; Kim, S.-J.; Lee, H.-W.; Kim, S.H.; Ha, J.-H. Immunomagnetic separation combined with RT-qPCR for evaluating the effect of disinfectant treatments against norovirus on food contact surfaces. LWT 2018, 97, 83–86. [Google Scholar] [CrossRef]
  43. Haramoto, E.; Kitajima, M.; Hata, A.; Torrey, J.R.; Masago, Y.; Sano, D.; Katayama, H. A review on recent progress in the detection methods and prevalence of human enteric viruses in water. Water Res. 2018, 135, 168–186. [Google Scholar] [CrossRef]
  44. Singh, A.; Chaudhary, S.; Agarwal, A.; Verma, A.S. Antibodies: Monoclonal and polyclonal. In Animal Biotechnology: Models in Discovery and Translation; Verma, A.S., Singh, A., Eds.; Elsevier: Amsterdam, The Netherlands, 2014; pp. 265–287. ISBN 978-0-12-416002-6. [Google Scholar]
  45. Hwang, Y.; Leong, O.M.; Chen, W.; Yates, M. V Comparison of a Reporter Assay and Immunomagnetic Separation Real-Time Reverse Transcription-PCR for the Detection of Enteroviruses in Seeded Environmental Water Samples. Appl. Environ. Microbiol. 2007, 73, 2338–2340. [Google Scholar] [CrossRef] [Green Version]
  46. Ko, G.; Cromeans, T.L.; Sobsey, M.D. Detection of infectious Adenovirus by mRNA RT-PCR in cell culture. Appl. Environ. Microbiol. 2003, 69, 7377–7384. [Google Scholar] [CrossRef] [Green Version]
  47. Bibby, K.; Peccia, J. Prevalence of respiratory adenovirus species B and C in sewage sludge. Environ. Sci. Process. Impacts 2013, 15, 336–338. [Google Scholar] [CrossRef] [Green Version]
  48. Staggemeier, R.; Heck, T.M.S.; Demoliner, M.; Ritzel, R.G.F.; Röhnelt, N.M.S.; Girardi, V.; Venker, C.A.; Spilki, F.R. Enteric viruses and adenovirus diversity in waters from 2016 Olympic venues. Sci. Total Environ. 2017, 586, 304–312. [Google Scholar] [CrossRef]
  49. Moresco, V.; Viancelli, A.; Nascimento, M.A.; Souza, D.S.M.; Ramos, A.P.D.; Garcia, L.A.T.; Simões, C.M.O.; Barardi, C.R.M. Microbiological and physicochemical analysis of the coastal waters of southern Brazil. Mar. Pollut. Bull. 2012, 64, 40–48. [Google Scholar] [CrossRef]
  50. Couceiro, N.S.O. Viroses respiratórias. In Virologia Humana; Santos, N.S.O., Romanos, M.T.V., Wigg, M.D., Eds.; Guanabara Koogan: Rio de Janeiro, Brazil, 2015; pp. 101–140. [Google Scholar]
  51. Rames, E.; Roiko, A.; Stratton, H.; Macdonald, J. Technical aspects of using human adenovirus as a viral water quality indicator. Water Res. 2016, 96, 308–326. [Google Scholar] [CrossRef]
  52. Zhao, M.; Guo, Y.; Qiu, F.; Wang, L.; Yang, S.; Feng, Z.; Li, G. Molecular and clinical characterization of human adenovirus associated with acute respiratory tract infection in hospitalized children. J. Clin. Virol. 2020, 123, 104254. [Google Scholar] [CrossRef]
  53. Vetter, M.R.; Staggemeier, R.; Vecchia, A.D.; Henzel, A.; Rigotto, C.; Spilki, F.R. Seasonal variation on the presence of adenoviruses in stools from non-diarrheic patients. Braz. J. Microbiol. 2015, 46, 749–752. [Google Scholar] [CrossRef] [Green Version]
  54. Kosulin, K.; Geiger, E.; Vécsei, A.; Huber, W.D.; Rauch, M.; Brenner, E.; Wrba, F.; Hammer, K.; Innerhofer, A.; Pötschger, U.; et al. Persistence and reactivation of human adenoviruses in the gastrointestinal tract. Clin. Microbiol. Infect. 2016, 22, 381.e1–381.e8. [Google Scholar] [CrossRef] [Green Version]
  55. La Rosa, G.; Della Libera, S.; Petricca, S.; Iaconelli, M.; Donia, D.; Saccucci, P.; Cenko, F.; Xhelilaj, G.; Divizia, M. Genetic diversity of human adenovirus in children with acute gastroenteritis, Albania, 2013-2015. Biomed. Res. Int. 2015, 1–7. [Google Scholar] [CrossRef] [Green Version]
  56. Girardi, V.; Mena, K.D.; Albino, S.M.; Demoliner, M.; Gularte, J.S.; de Souza, F.G.; Rigotto, C.; Quevedo, D.M.; Schneider, V.E.; Paesi, S.O.; et al. Microbial risk assessment in recreational freshwaters from southern Brazil. Sci. Total Environ. 2019, 651. [Google Scholar] [CrossRef]
  57. Summa, M.; von Bonsdorff, C.H.; Maunula, L. Evaluation of four virus recovery methods for detecting noroviruses on fresh lettuce, sliced ham, and frozen raspberries. J. Virol. Methods 2012, 183, 154–160. [Google Scholar] [CrossRef]
  58. Chaturvedi, A.; Gorthi, S.S. Automated blood sample preparation unit (ABSPU) for portable microfluidic flow cytometry. SLAS Technol. 2017, 22, 73–80. [Google Scholar] [CrossRef] [Green Version]
  59. Chen, S.L.; Chang, W.H.; Wang, C.H.; You, H.L.; Wu, J.J.; Liu, T.H.; Lee, M.S.; Lee, G. Bin An integrated microfluidic system for live bacteria detection from human joint fluid samples by using ethidium monoazide and loop-mediated isothermal amplification. Microfluid. Nanofluidics 2017, 21, 1–12. [Google Scholar] [CrossRef]
  60. Ahmed, S.; Noh, J.W.; Hoyland, J.; de Oliveira Hansen, R.; Erdmann, H.; Rubahn, H.-G. On-chip immunomagnetic separation of bacteria by in-flow dynamic manipulation of paramagnetic beads. Appl. Phys. A 2016, 122, 955. [Google Scholar] [CrossRef]
Figure 1. Magnetic bead surface functionalization with antibodies and immunomagnetic separation (IMS) procedure.
Chemosensors 09 00019 g001
Figure 2. Images of the beads generated by SEM before the conjugation with antibodies (a,b) and after the conjugation (c,d).
Chemosensors 09 00019 g002
Figure 3. Images of the magnetic beads generated by HIM after conjugation with antibody (a), after exposure to wastewater effluent (b), and after the exposure to standard HAdV-5 sample (c).
Chemosensors 09 00019 g003
Figure 4. Averages of qPCR results to standard HAdV analyses of unconcentrated and concentrated samples by the IMS method.
Chemosensors 09 00019 g004
Figure 5. Detection of viral infectious particles in HAdV-5 serial dilution samples concentrated by the IMS method.
Chemosensors 09 00019 g005
Figure 6. Phylogenetic analysis in water samples positive to HAdV using IMS as a concentration method.
Chemosensors 09 00019 g006
Figure 7. Results of HAdV-C and -F in water samples comparing ultracentrifugation and IMS methods detected by qPCR.
Chemosensors 09 00019 g007
Table 1. Primers and probes used to detect Human mastadenovirus (HAdV) in nested PCR and qPCR.
VirusTarget GeneNameSequence (5′–3′)SenseProduct LengthReferences
HAdV-C (1,2,5,6)HexonVTB2-HAdVCfGAGACGTACTTCAGCCTGAAT+101 bp[33]
VTB2-HAdVCrGATGAACCGCAGCGTCAA-
VTB2-HAdVCprobeCCTACGCACGACGTGACCACAGA+
HAdV-F (40,41)HexonVTB1-HAdVFfGCCTGGGGAACAAGTTCAGA+137 bp[33]
VTB1-HAdVFrGCGTAAAGCGCACTTTGTAAG-
VTB1-HAdVFprobeCAGTCGCTGYGACCTGTCTGTGGTT-
AdVDNA polymerasePol-FCAGCCKCKGTTRTGYAGGGT+261 bp[34]
Pol-RGCHACCATYAGCTCCAACTC-
Pol-nFGGGCTCRTTRGTCCAGCA+
Pol-nRTAYGACATCTGYGGCATGTA-
Publisher’s Note: MDPI stays neutral with regard to jurisdictional claims in published maps and institutional affiliations.

