Article

Integration of Spectral Reflectance Indices and Adaptive Neuro-Fuzzy Inference System for Assessing the Growth Performance and Yield of Potato under Different Drip Irrigation Regimes

1
Agricultural Engineering, Evaluation of Natural Resources Department, Environmental Studies and Research Institute, University of Sadat City, Minufiya 32897, Egypt
2
Department of Plant Production, College of Food and Agriculture Sciences, King Saud University, KSA, P.O. Box 2460, Riyadh 11451, Saudi Arabia
3
Department of Agronomy, Faculty of Agriculture, Suez Canal University, Ismailia 41522, Egypt
4
Civil Engineering Department, College of Engineering, University of Bisha, Bisha 61922, Saudi Arabia
5
Irrigation and Hydraulics Department, Faculty of Engineering, Tanta University, Tanta 31734, Egypt
6
Agricultural Engineering Department, Faculty of Agriculture, Mansoura University, Mansoura 35516, Egypt
7
Department of Horticulture, Faculty of Agriculture, Kafrelsheikh University, Kafr El-Sheikh 33516, Egypt
*
Author to whom correspondence should be addressed.
Submission received: 28 January 2021 / Revised: 4 March 2021 / Accepted: 9 March 2021 / Published: 12 March 2021
(This article belongs to the Special Issue Practical Applications of Spectral Sensing in Food and Agriculture)

Abstract

:
Simultaneous and timely assessment of growth and water status-related plant traits is critical for precision irrigation management in arid regions. Here, we used proximal hyperspectral sensing tools to estimate biomass fresh weight (BFW), biomass dry weight (BDW), canopy water content (CWC), and total tuber yield (TTY) of two potato varieties irrigated with 100%, 75%, and 50% of the estimated crop evapotranspiration (ETc). Plant traits were assessed remotely using published and newly constructed vegetation and water spectral reflectance indices (SRIs). We integrated genetic algorithm (GA) and adaptive neuro-fuzzy inference system (ANFIS) models to predict the measured traits based on all SRIs. The different plant traits and SRIs varied significantly (p < 0.05) between the three irrigation regimes for the two varieties. The values of plant traits and majority SRIs showed a continuous decrease from the 100% ETc to the 50% ETc. Water-SRIs performed better than vegetation-SRIs for estimating the four plant traits. Almost all indices of the two SRI types had a weak relationship with the four plant traits (R2 = 0.00–0.37) under each irrigation regime. However, the majority of vegetation-SRIs and all water-SRIs showed strong relationships with BFW, CWC, and TTY (R2 ≥ 0.65) and moderate relationships with BDW (R2 ≥ 0.40) when the data of all irrigation regimes and varieties were analyzed together for each growing season or the data of all irrigation regimes, varieties, and seasons were combined together. The ANFIS-GA model predicted plant traits with satisfactory accuracy in both calibration (R2 = 1.0) and testing (R2 = 0.72–0.97) modes. The results indicate that SRI-based ANFIS models can improve plant trait estimation. This analysis also confirmed the benefits of applying GA to ANFIS to estimate plant responses to different growth conditions.

1. Introduction

Limited freshwater supplies are a serious problem worldwide, particularly in arid and semiarid countries, where accessible reservoirs are decreasing due to increased agricultural and urban development, population growth, low precipitation, and competing demands from industry [1,2,3]. Under arid and semiarid climates, moisture stress is a critical factor affecting crop growth and final productivity. In addition, climate change and global warming sharply increase evaporation rates. Hence, depletion of freshwater resources and increased drought are a severe threat to global food security [4,5].
The potato (Solanum tuberosum L.) is one of the world’s most economically relevant plant species. It is the fourth most important food crop globally behind rice, wheat, and maize [6]. In developing countries, it is an affordable and rich source of starch that can be cultivated under a wide range of climatic conditions. Additionally, global potato production increased by 21% from 1991 to 2007 [7], which indicates its importance as a staple food crop. Although the potato is one of the most water-efficient use crops, it is very sensitive to water deficit stress due to there being no balance between the size of root system and foliage characteristics. Therefore, insufficient water supply for this crop causes a considerable reduction in final tuber yield and quality. Several studies have reported that exposure of potato plants to deficit water stress especially during tuber bulking and ripening growth stages can lead to over 50% reduction in tuber yield [8,9,10,11,12,13].
In general, water deficit stress limits the growth and development of plants by affecting several normal physiological and biochemical functions at the whole canopy, leaf, tissue, and cellular levels. The disturbance in plant functions subsequently translates into a substantial reduction in several morpho-physiological attributes, including chlorophyll content, water content, photosynthetic efficiency, stomatal conductance, leaf expansion, green leaf area, biomass accumulation, and formation of sink organs. The reduction in these growth attributes ultimately leads to significant losses in potato tuber yield and quality [12,14,15,16,17]. Therefore, accurate estimation of water requirements for potato plants through early detection and monitoring of the traits related to plant growth and water status changes could be an effective way to better irrigation scheduling decisions and help farmers reach the targeted yield and profit goals under deficit irrigation water regimes [12,14,18,19,20,21]. Increasing crop productivity to meet the increased food demand requires advanced irrigation water management techniques [22,23,24] that rely on a deep understanding of crop traits responses to environmental stresses [25]. Unfortunately, the classical plant-sampling techniques used to detect and monitor growth and water status traits are laborious, destructive, tedious, and not feasible on a large-scale. Therefore, it is fundamental to develop quick, non-destructive, and large-scale techniques to monitor plant morpho-physiological traits and advance precision agriculture irrigation practices in regions with water scarcity [12,18].
The use of proximal remote sensing technologies based on canopy spectral reflectance is increasing and this approach is becoming one of the main strategies for managing the irrigation schedule [26,27,28,29]. Proximal remote sensing can detect the spectral reflectance from the plant canopy from visible (VIS) to shortwave infrared (SWIR) light spectrum wavelengths (350 to 2500 nm). Hence, this tool is effective to rapidly and non-destructively monitor changes that take place in various vegetative and biochemical plant characteristics [12,18,30,31,32,33,34]. However, to employ the canopy spectral reflectance data and translate it into valuable information on plant characteristics, several studies report the use of spectral reflectance indices (SRIs), which incorporating specific wavelengths from VIS, red-edge, near-infrared (NIR), and SWIR. These SRIs were used to track the changes in biochemical and biophysical plant attributes, including leaf pigments, photosynthetic efficiency, stomatal conductance, biomass accumulation, leaf area index, water status, and grain yield. Because the spectral signatures of the canopy at NIR wavelengths (from 750 to 1300 nm) are highly influenced by several internal leaf structural factors such as leaf cuticles, intercellular air spaces, and the relationship between palisade mesophyll and spongy mesophyll, several specific wavelengths from this region were used to create effective water-SRIs such as normalized water indices (NWIs) and used it as indirect indicators of the plant water status [12,31]. Although the wavelengths in the VIS region (400–700 nm) does not have water bands, the spectral signatures of the canopy at specific wavelengths in this region could be indirectly used to assess plant water status via detecting the effects of dehydration on leaf pigments [35,36]. Therefore, several studies have employed the photochemical reflectance index (PRI), which includes two wavelengths from VIS region (531 and 570 nm), as a good indicator for crop water stress detection [37,38,39,40]. Al-Gaadi et al. [18] found that potato yield was associated with the soil adjusted vegetation index (SAVI) and the normalized difference vegetation index (NDVI); with the coefficient of determination (R2) values of the relationship between observed and predicted tuber yield based on these indices ranged from 0.39 to 0.65 in center pivot irrigated fields. Romero et al. [12] reported that the SRIs combining the VIS, red-edge, and water bands wavelengths from the NIR region were strongly correlated with different potato traits, including plant water content, leaf area index, foliar area index, and relative growth rate of potato tubers across different irrigation regimes. Different models of the SRIs that formulated based on wavelengths from VIS, red-edge, and NIR regions explained most of the variation in yield between soybean genotypes grown under different water regimes [23].
Although SRIs are easy to calculate, they represent relationships of reflectance values at a very few wavelengths (two to three wavelengths) across the full spectrum. The low number of wavelength makes SRIs very sensitive to factors that affect canopy spectral signatures and less efficient in estimating plant traits across different growth conditions (i.e., cultivars, treatment, crop phenological growth stages, and year) because they used very limited of the information contained in hyperspectral data. Furthermore, the majorities of regression analyses to assess plant traits are based on single index and discard the majority of published SRIs. Therefore, there are compelling reasons for incorporating various SRIs in a single index to improve the plant traits analysis and prediction capacity.
Recently, data driven modeling (DDM), including the adaptive neuro-fuzzy inference system (ANFIS), has boosted the creation and application of novel computational resources to different fields of research. ANFIS focuses on the analysis of the data that characterizes the system being studied. It uses models that can be defined without detailed knowledge of the physical behavior by identifying links between the system’s parameters (input, internal, and output variables) [41]. ANFIS uses a large number of input parameters to improve the prediction of target measurements. This approach incorporates the fuzzy inference system (FIS) into the adaptive network architecture, benefiting in a single framework from both artificial neural networks (ANN) and fuzzy techniques. [42,43]. One of ANFIS’ primary advantages over fuzzy systems is that it solves the fundamental problem of specifying the membership function parameters and acquiring a set of fuzzy if-then rules [44,45]. DDM was widely used for estimating and predicting different crop traits. For instance, ANN and support vector machine regression (SVMR) were used to predict plant water status, growth, and contents of chlorophyll, nitrogen, phosphorus, and potassium [14,46,47,48]. However, the integration of different techniques, such as genetic algorithms (GA), ANN, and FISs, has not yet been used to predict plant traits. Here, we tested the performance of ANFIS to predict traits of two potato crop varieties grown under different irrigation regimes and over two growing seasons.
ANFIS was linked to a GA to pinpoint the optimal root mean square error (RMSE) values and to create a powerful computational methodology in case of each output. Recent studies have used GA in plant tissue culture to reduce computational volumes. GA uses an intelligent approach focused on bio-inspired operators such as selection, crossover, and mutation to achieve optimal solutions to one of the well-known evolutionary computer-based optimization algorithms [49,50].
The primary objectives of this study were (i) to quantify the effects of different irrigation regimes on different plant traits related to growth, production, and water states of two potato varieties, (ii) to remotely assess the different plant traits of each potato crop variety across all irrigation regimes, for each irrigation regime across two varieties, and across all conditions (irrigation regimes, varieties, and growing seasons) using different SRIs; (iii) to evaluate the performance of ANFIS-GA models based on all SRIs to predict the different plant traits across all conditions.

2. Materials and Methods

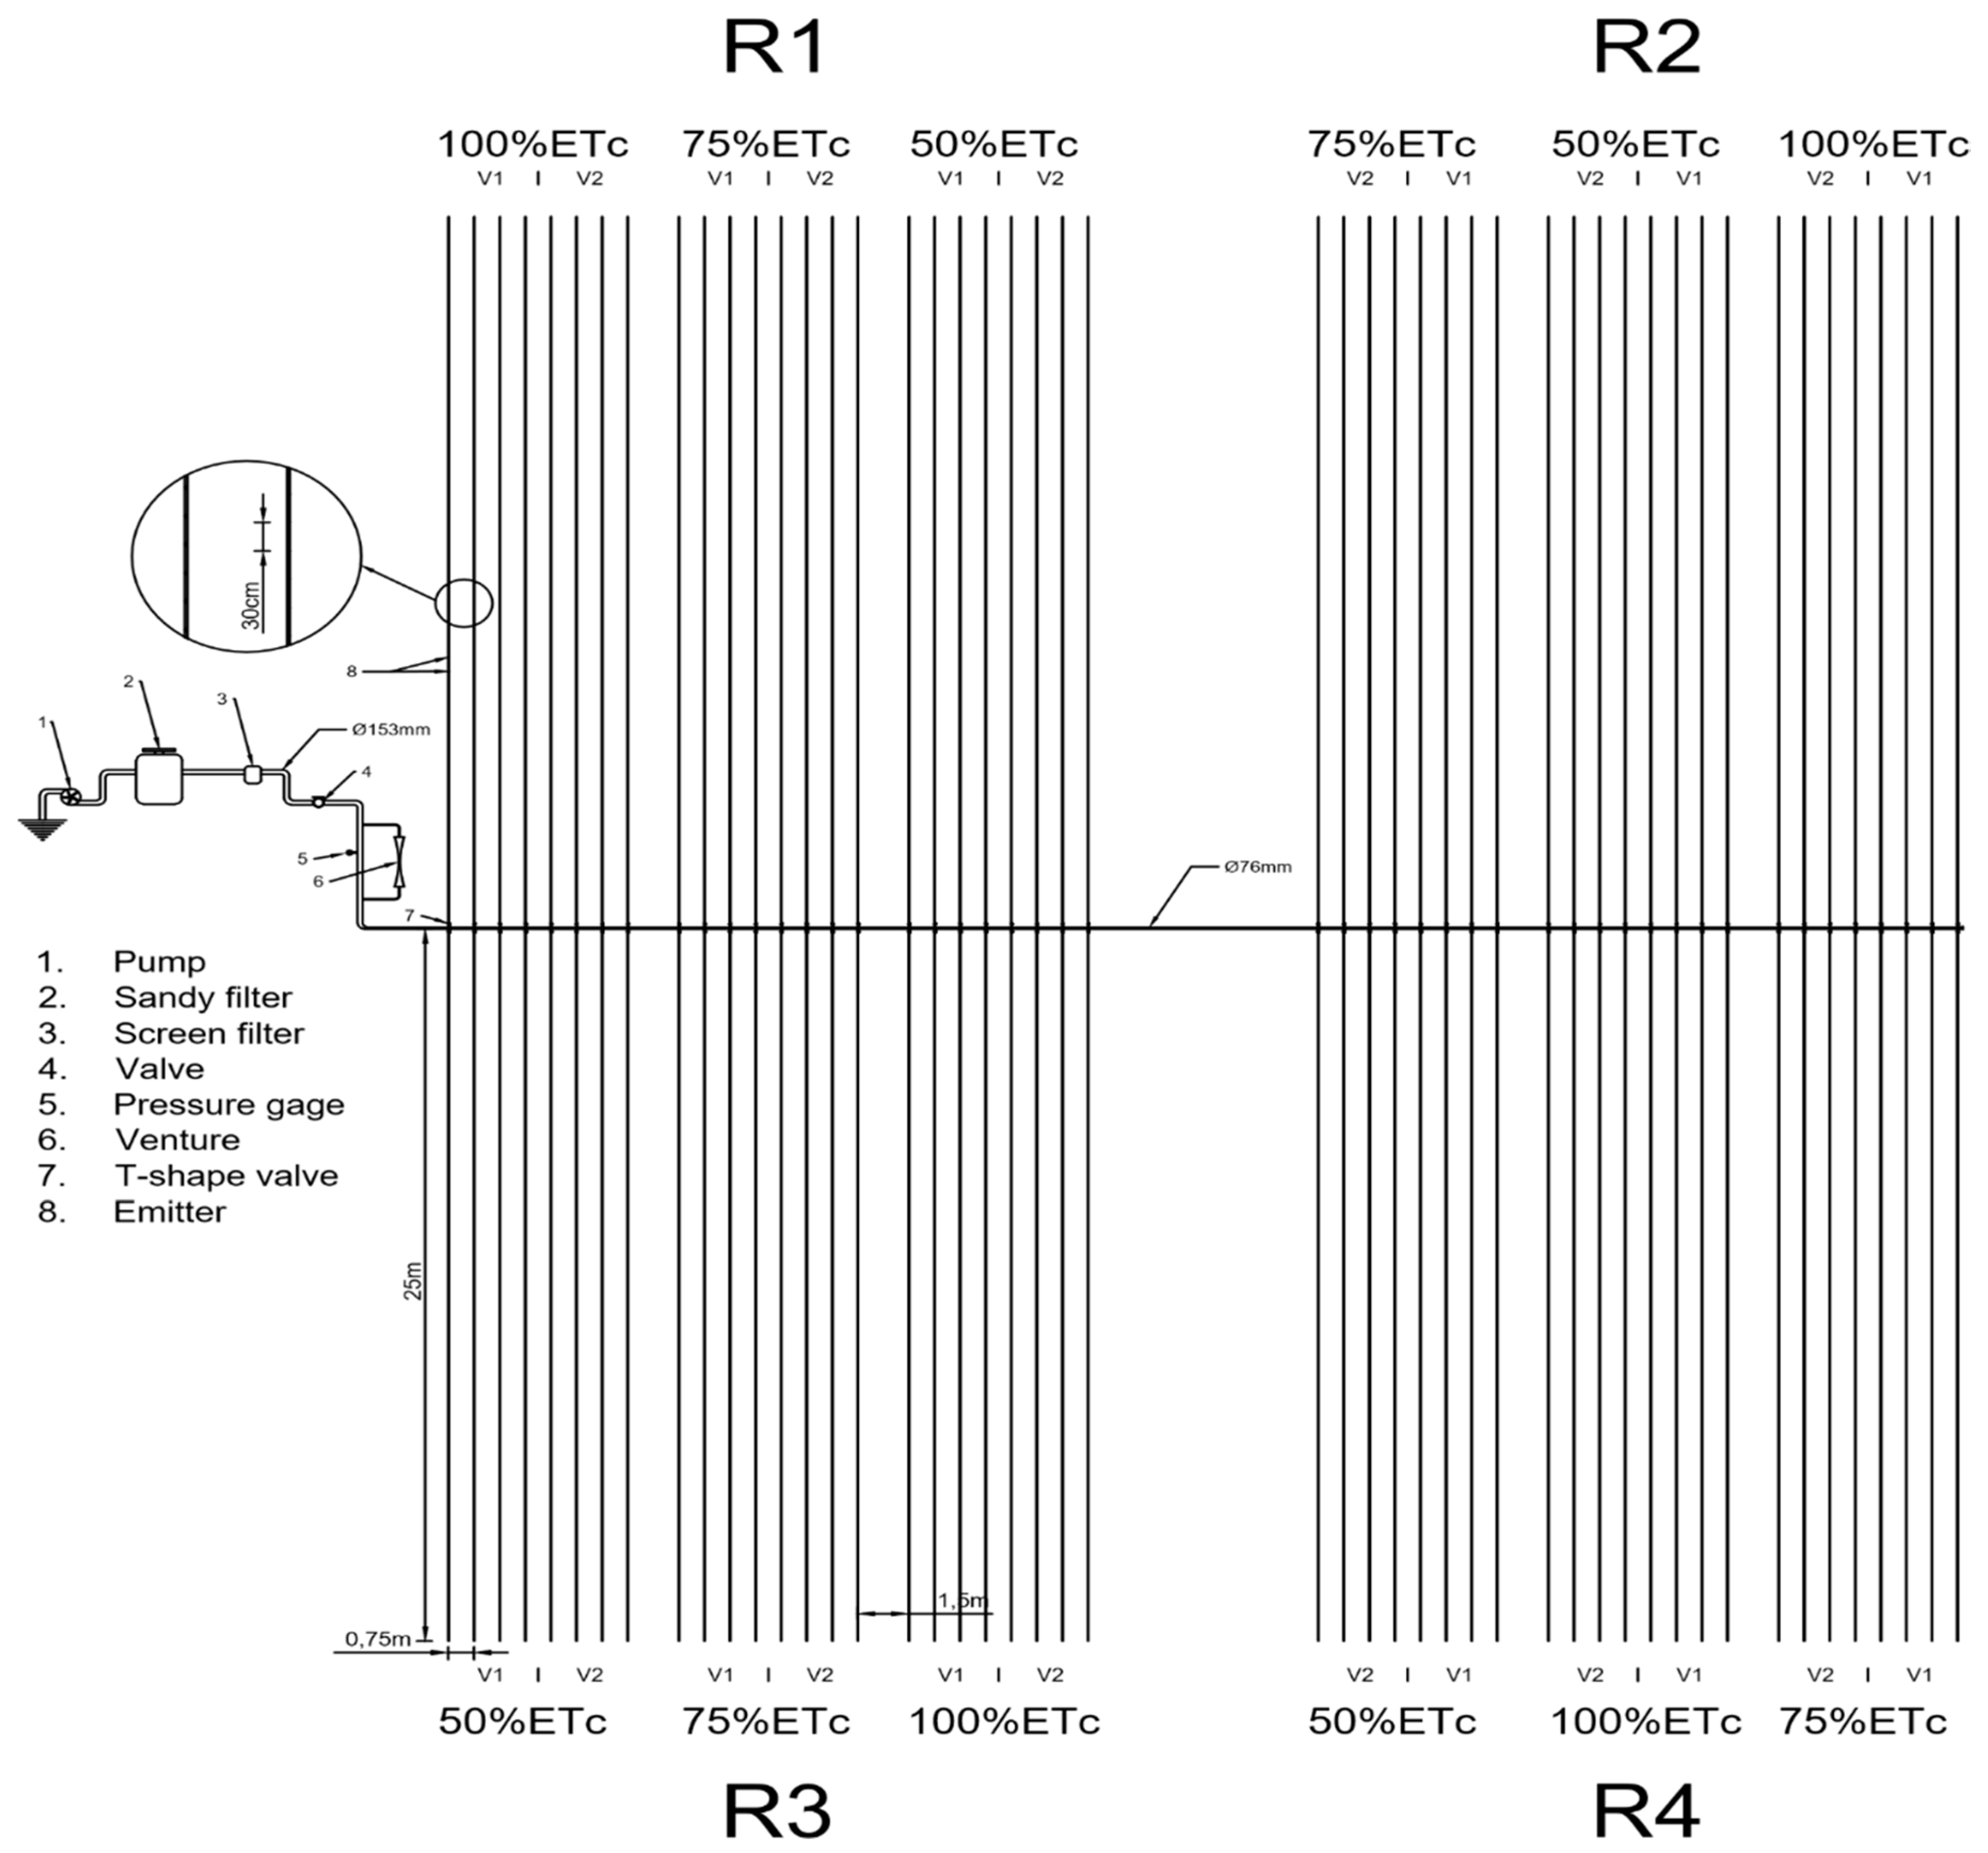
2.1. Experimental Site, Conditions, Design, Agronomic Practices, and Irrigation Treatments

Two field experiments on drip-irrigated potato crops were conducted from February to May during the 2019 and 2020 growing seasons at the Research Station of the University of Sadat City, Egypt (30°2′41.2″ N and 31°14′8.2″ E). The experimental site conditions were characterized by an arid climate with mild cold winters and warm summers. Table 1 shows the detailed climatic parameters of the Sadat city region during the experimental periods. The soil at the experimental site is a sandy loam texture (69.8% sand, 22.3% silt, and 7.9% clay), with a bulk density, electrical conductivity (EC), field capacity, wilting point, and available water content of 1.45 g cm−3, 1.15 dS m−1, 0.2785 m3m−3, 0.1465 m3m−3, and 0.1320 m3m−3, respectively. In addition, the salinity of water used for irrigation was within normal, with an EC of 1.20 dS m−1.
The experiments in both growing seasons were laid out in a split-plot design with four replicates. Three irrigation regimes and two potato varieties (Arizona and Bellini) were evaluated in this study. The irrigation treatments and two varieties were distributed randomly in the main plots and the sub-plots, respectively.
To apply the different irrigation regimes, the drip irrigation system was divided into four main sectors, with each sector representing one replicate. All irrigation regimes and potato varieties were represented within each sector. Irrigation regimes and varieties were randomly distributed in each sector. The irrigation system within each sector consisted of eight polyethylene lateral drip lines for the main plots (Twin-wall IV, 16 mm in diameter), with four lateral drip lines assigned to each variety for the sub-plots. The lateral drip lines (30 m long and with emitters spaced 0.30 m apart) were placed along each variety row, separated 0.75 m. To control water flow to the lateral drip lines, each lateral drip line was equipped with a manual T-shape valve at the connection with the sub-mainline (50 mm in diameter) (Figure 1). The drippers had a discharge rate of 4 L h−1. The sub-plot area within each irrigation regime was 90.0 m2. Healthy potato tubers of uniform size from each variety were planted around each dripper on February 1, 2019, and January 30, 2020, and were dug out on May 10 on both growing seasons.
All treatments received 75 m3 ha−1, 200 kg ha−1, and 300 kg ha−1 of composted animal manure, phosphorous, and sulfur, respectively. The total dose of these fertilizers was applied to the soil during the preparation for planting. Phosphorus and sulfur fertilizers were applied in the form of single furrow-banded calcium superphosphate (15.5% P2O5) and elemental S, respectively. Nitrogen fertilization was done by applying 400 kg ha−1 of ammonium nitrate (33.5% N) in four equal doses. The first dose was applied during soil preparation, while the other three doses were applied at 30, 45, and 60 days after planting through the fertigation system. Potassium fertilization was done by applying 100 kg ha−1 of potassium sulfate in two equal doses. The first dose was applied during soil preparation, while the second dose was applied through the fertigation system with the third dose of the nitrogen fertilizer.
To ensure full germination and good seedling establishment, all plants were fully irrigated at 4-day intervals during the first 25 days after sowing. Subsequently, the plants in each irrigation regime were irrigated according to the irrigation treatments described below.
The three irrigation regimes tested in this study were 100%, 75%, and 50% of the estimated crop evapotranspiration (ETc). The FAO CROPWAT software v.8 was used to determine the irrigation time and calculate the amount of water applied for the full irrigation regime (100% ETc). This software estimates the reference evapotranspiration (ETo) using the modified FAO Penman-Monteith equation reported by Allen et al. [51]. The different daily climatic parameters collected from the nearest meteorological station (Table 1) were applied to this equation to estimate the ETo in mm day−1. The potato crop coefficient (Kc), which reflect the ETc to ETo ratio, was adjusted based on wind velocity and relative humidity data measured at a 2 m height. The ETo and Kc values were applied to the following equation to calculate the water requirement for the 100% ETc treatment:
ETc = ETo × Kc.
The 100% ETc value was reduced to 75% ETc and to 50% for the other two tested treatments. The water volumes applied for each irrigation regime are presented in Table 1.

2.2. Spectral Reflectance Measurements

The diffuse reflection characteristics of potato canopies were measured at the bulking growth stage using a passive bi-directional reflectance spectroradiometer (Handy Spec Field®, tec5, Oberursel, Germany). Measurements were done under cloudless conditions, within ±12 h of solar noon, at nadir orientation, and approximately 0.8 m above each variety’s canopy. The passive reflectance sensor has two units. The first unit is connected to a diffuser to measure the light radiation as a reference signal, while the second unit captures the spectral reflectance from the canopy at 302–1148 nm of the light spectrum and with spectral resolution of 2 nm band width using an optical fiber sensor. The aperture of the optical fiber was 12°, covering a field view with a diameter of approximately 23 cm. During data collection in the field, the sensor outputs were co-recorded in parallel to the GPS coordinates. The actual sensor output was co-referenced and recorded. Readings of ten scans were taken within each subplot, while the values obtained were later averaged to a single value per sub-plot. The canopy reflectance was derived by correcting readings from the spectrometer unit with a calibration factor obtained from a gray reference standard.

2.3. Plant Trait Measurements

At the bulking growth stage and after the spectral reflectance data were collected, biomass fresh weight (BFW) and biomass dry weight (BDW) were determined for 20 plants randomly harvested from the ground level at the middle two lateral drip lines of each sub-plot and within the scanned area. The harvested plants were immediately weighed to record BFW. The harvested plants were then cut into small pieces, dried at 70 °C for 72 h, and weighed to record BDW. BFW and BDW data were applied to the following equation to obtain the percentage of canopy water content (CWC):
CWC (%) = (BFW − BDW)/BFW.
At harvest time, total tuber yield (TTY) per ha was obtained by hand-harvesting an area of two lateral drip lines 15 m in length (22.5 m2). Then, the tubers were weighed and the TTY per ha was expressed as Mg ha−1 based on the harvested area.

2.4. Selection of Newly Constructed and Published Spectral Reflectance Indices

Based on the canopy spectral reflectance data, 14 indices commonly used in published studies and 6 indices newly constructed in this study were selected, and their performance for estimating measured plant traits (BFW, BDW, CWC, and TTY) was evaluated. Indices were selected based on their sensitivity to changes in biomass accumulation, leaf pigmentation, leaf/tissue structure, and plant water content. Formula for calculation and references for published indices are listed in Table 2. The newly developed indices were constructed based on contour maps established using the pooled data of irrigation regimes, varieties, replications, and years (n = 48). They were then selected based on the hot spot regions of the coefficients of determination (R2), which show the relationship between plant traits and all possible combinations of two individual wavelengths in the entire spectrum range (302–1148 nm) (Figure 2). The results of contour maps found that the best R2 regions were identified when the wavelengths within VIS and red-edge regions on the horizontal axis were combined with the wavelengths within VIS, red-edge, and NIR regions on the vertical axis, as well as when the wavelengths within NIR region on the horizontal axis were combined with the wavelengths within VIS and NIR regions on the vertical axis (Figure 2). Therefore, the newly developed SRIs were constructed based on VIS-vs.-VIS, VIS-vs.-red-edge, VIS-vs.-NIR, red-edge-vs.-NIR, and NIR-vs.-NIR wavelengths.
The different contour maps were drawn using the lattice package in R statistics v. 3.0.2 (R Foundation for Statistical Computing, 2013). The new indices were formulated based on ratio form, while the published indices were formulated based on both ratio form and normalized difference form (Table 2).

2.5. Statistical Analysis

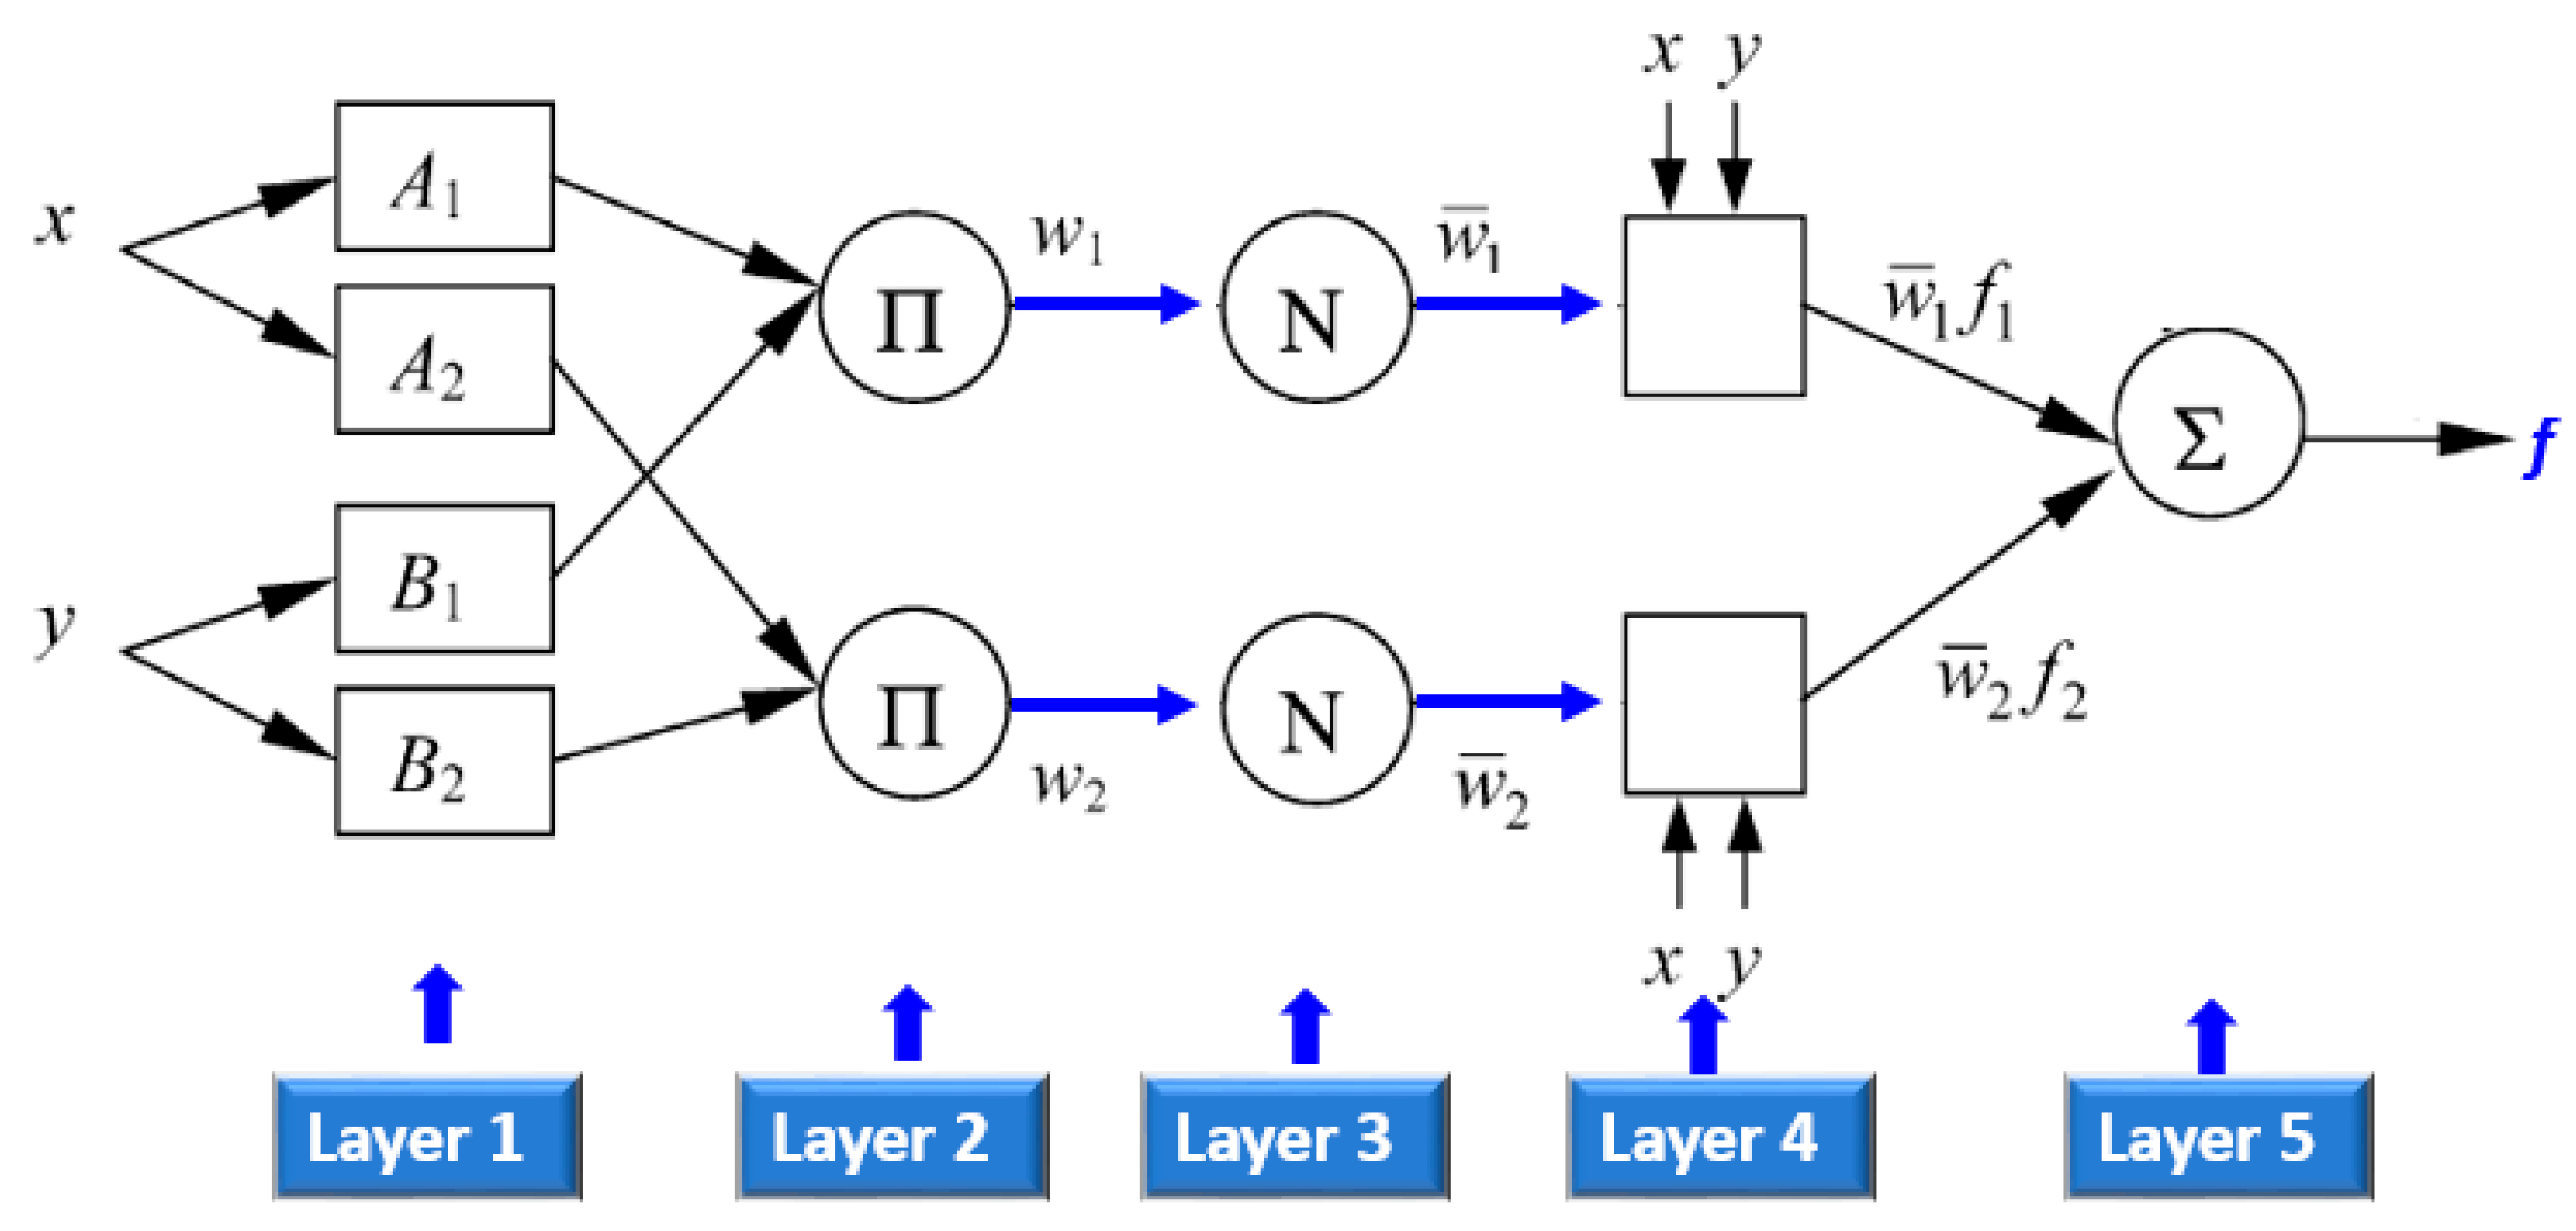
2.5.1. Adaptive Nuro-Fuzzy Inference System Modeling

The ANFIS is a FISs that is formulated as a feed-forward neural network. The benefits of a fuzzy system can thus be combined with a learning algorithm [52,53]. ANFIS hypothesizes the Fuzzy Inference System (FIS) by using different output or input data and typically modifies its membership criteria by using a backpropagation algorithm. Figure 3 shows a schematic diagram of the ANFIS methodology used to predict different plant traits in this study. The ANFIS model was integrated with the different SRIs listed in Table 2 to predict BFW, BDW, CWC, and TTY values. The ANFIS model was developed and trained using a GA based on a population algorithm. The developed GA-ANFIS models were performed using Matlab. Figure 4 illustrates the ANFIS structural design with a multilayered feed-forward configuration that is linked to an incoherent x and y input network. It is essential to mention that the FIS consists mainly of 5 functional blocks. The Sugeno model has a rule base with the formulas [54,55]:
Through   putting   a = A 1   and   b = B 1   we   have   f 1 = p 1 × a + q 1 × b + r 1
Through   putting   a = A 2   and   b = B 2   we   have   f 2 = p 2 × a + q 2 × b + r 2
Specifically, fi is the output within the inconsistent zone indicated by the fuzzy principle, Ai and Bi are the membership values, a and b are indirect identifying functions, and pi, qi, and ri are the consequential restrictions that are modified within the forward pass within the learning algorithm.
If the fuzzy sets Ai and Bj,’s membership functions are μ A i and μ B i correspondingly, as illustrated, the five layers involving ANFIS are defined:
For layer number 1, the throughput Q1,i, is calculated as follows.
Q 1 , i = μ A i x ,   where   i = 1   and   2   or   Q 1 , i = μ B i 2 x   where   i =   3   and   4
with a and b being the inputs to the i t h node, and A i or B i 2 is regarded as a component derived by past occurrences. For the bell-shaped membership function, μ A i is calculated with the equation:
μ A i = e 1 2 x c i a i 2   i = 1 , 2
where ai and ci are sigma and central represent the membership function parameters.
Rule layer with a fixed nod that multiples the signals coming into the system and send the product out. Each output represents the firing strength of the rule:
Q 2 , i = w i = μ A i   ( x )   μ B i   ( y )   for   i = 1   and   2 .
Each node in layer number 3 is a circle labeled N and calculates the ratio of the ith rule’s firing strength to the sum of all rule’s firing strengths to fulfill the demand of normalized firing strengths:
Q 3 , i = w ¯ i = w i w 1 + w 2 ,   i = 1   and   2
In layer number 4, which has parameters termed as resultant parameters, the nodes are adaptive nodes. The output of each node in this layer includes a set of a linear amalgamation of inputs magnified by normalized firing power :
Q 4 , i = w i   f i = w i   p i   x + q i   y + r i
The single node in this layer is circle node labeled ∑ that computes the overall output as the summation of all incoming signals, i.e.,
Layer number 5 has a single node that computes the overall output:
Q 5 , i = w i ¯   f i = i = 1 w i f i i = 1 w i .
In this study, ANFIS was utilized to excerpt the relationship of SRIs and plant traits and classify them as fuzzy “if-then” regulations. The postulate part of fuzzy “if-then” rules included SRIs data. The consequent part includes BFW, BDW, CWC, and TTY. A fuzzy system of the Sugeno type was applied with a linear output membership function and a standard bell input membership function.

2.5.2. Genetic Algorithm

The fundamental principles of GAs which are based on Darwinian principles of selection, mutation, and recombination (crossover) in the operator were set forth by John Holland in the 1970s [56,57]. GA is a heuristic algorithm that can find exact or approximate results in optimization or search problems. The GA analysis begins with a randomly generated chromosome population linked by genetic operators to optimize solution evaluation by generating iterations of fitter chromosomes [58]. The selection process is mostly used to choose chromosomes with superior reproduction fitness values in the genetic pool or to create unique offspring then roulette wheel selection was applied and this process is maintained until an acceptable compliance value or unique solution is reached.
In this study, the GA algorithm was employed to solve the single-objective optimization problem and used for updating two ANFIS parameter types: premise parameters and consequent parameters. Premise parameters correspond to the function of gauss membership described as {ai} in Equation (6). In all membership functions, the cumulative number of premise parameters is equivalent to the summation of the parameters. Consequent parameters are those used in the defuzzification layer, shown in Equation (9) as {pi, qi, ri}. These parameters are optimized with GA to reduce the error between the ANFIS output and the measured data to a minimum. A block diagram showing this structure is in Figure 3. A root mean square error (RMSE) function obtained with Equation (11) is used for determining the error value of the solution. The RMSE indicates the absolute fit of the model to the data sets (how closer the experimental data is to the predicted values of the model). It tests the optimal absolute value, with the best match being shown by smaller RMSE values. RMSE is given by the following formula:
RMSE = i = 1 n P o i P f i 2 n .
Po represents the observed values, Pf represents the predicted values by the model, and n is the length of data series.
We applied all 20 SRIs as the input for training an ANFIS with GA to estimate the four plant traits of interest. To create the models, the measured datasets were randomly divided into the two sets of progressions, i.e., 70% training and 30% testing datasets. There were eight membership functions for each input; a total of 160 functions were composed. Two premise criteria were used in each of the membership functions. Therefore, 320 parameters were successfully optimized. During the network learning process, the optimal selection of the parameters related to the membership functions was achieved using the GA with a population size of 100, a crossover rate of 0.8, and a mutation rate of 0.01.
Finally, the performance of the two models was evaluated using the following criteria: coefficient of determination (R2), Nash-Sutcliffe coefficient (E), RMSE, and mean absolute deviations (MAD).

2.5.3. Data Analysis

Plant trait (BFW, BDY, CWC, and TTY) and selected SRIs data were subjected to an analysis of variance (ANOVA) appropriate for a split-plot design, with the irrigation regimes as the main factor and variety as the split factor. A combined ANOVA was applied to analyze the differences among irrigation regimes and varieties across the two growing seasons, the Shapiro–Wilk test was used for the normality distribution of the residuals and the Bartlett’s test for the homogeneity of variances. Irrigation regime, variety, and their interaction were considered fixed effects, while replicate, growing season, and their interaction were considered random effects. The mean differences among the tested three irrigation regimes for each variety were compared using Duncan’s test at a p ≤ 0.05 significance level. This statistical analysis was performed using SPSS (v. 12.0, SPSS Inc., Chicago, IL, USA). Additionally, a simple linear regression of the relationship between the selected SRIs and the different plant traits under each irrigation regime (n = 16), each variety (n = 24), each season (n = 24), and across two seasons (n = 48) was performed using Sigma Plot (v. 11.0, SPSS, Chicago, IL, USA). The significance level of the coefficients of determination (R2) for these relationships was set at the 0.05 probability level.

3. Results and Discussion

3.1. Response Plant Traits of Potato Varieties to Different Irrigation Regimes

In general, the assessment of plant traits that related to dry matter accumulation and water status can inform better irrigation management decisions and help overcome the negative impacts of irrigation water shortage on crop productivity. For example, BDW is an important plant trait widely used for detecting photosynthetic efficiency and crop growth status under particular growing conditions [59,60]. BFW and CWC reflect the immediate plant water status response to water stress conditions [29,61]. Therefore, frequent assessment of these plant traits could be critical for enhancing potato production under irrigation water shortage through better irrigation scheduling and scaling practices [12,62,63]. In this study, the four plant traits (BFW, BDW, CWC, and TTY), showed significant differences (p < 0.05) between three irrigation regimes and this was true for both potato varieties. The highest values for these traits occurred with the full irrigation regime (100% ETc). The 75% ETc and 50% ETc treatments resulted in decreases in BFW of 24.0% and 48.0%, BDW of 6.4% and 18.0%, CWC of 3.6% and 10.1%, and TTY of 13.3% and 36.7%, respectively, when compared with the 100% ETc treatment (Table 3). This decrease was similar in both varieties (Table 3). These results indicate that these plant traits, particularly BFW and TTY, could be used as direct indicators to evaluate the responses of potato plants to different irrigation water regimes as well as to determine water stress resistance in this crop plants [12,15,16].
Previous studies have reported that exposure of potato plants to water deficit, especially during sensitive growth stages, resulted in a significant reduction in traits closely associated with growth performance and water status, which ultimately led to lower final tuber yields in both quantity and quality [64,65,66,67,68,69]. Cantore et al. [65] found that the reduction in potato tuber yield could reach 25.9 and 63.6% at 50% of full irrigation and rainfed conditions, respectively, when compared with the full irrigation treatment. However, Bohman et al. [17] found that the water requirement for potato crops could be decreased by 15% without a significant reduction in TTY. Yuan et al. [70] reported that the marketable tuber yield of potato significantly increased with increasing irrigation regimes. They also suggested that when using a pan evaporation factor as a guideline for irrigating potato crops under regulated environmental conditions, irrigating potato plant at a pan Kc factors less than 0.75 resulted in a significant reduction in TTY. These results and our finding further confirm that because there is a close relationship between the plant traits associated with the status of plant growth and water content as well as plant production and soil moisture status, the simultaneous and frequent assessment of such plant traits could play an important role in improving irrigation water management through determine irrigation thresholds and better irrigation scheduling. However, the success of irrigation scheduling depends on methods that allow quick, easy, and non-destructive frequent evaluation of large-scale fields; these methods will be explored in detail below.

3.2. Performance of SRIs for Assessment of Different Measured Plant Traits

Exposure of plants to abiotic stress leads to substantial changes in biophysical and biochemical characteristics of vegetation canopies. This generates substantial changes in the spectral signatures reflected from the canopy at specific wavelengths within the VIS, NIR, and SWIR regions of the spectrum [12,29,71]. Previous studies reported that several wavelengths within the VIS, red-edge, and NIR regions are more sensitive to changes in plant biomass accumulation and water content of several field crops under diverse environmental conditions [12,71,72,73]. El-Hendawy et al. [71] found that VIS (532, 557, and 693 nm), red-edge (733, 737, 738, 748, and 750 nm), and NIR (751, 769, 814, 1061, and 1066 nm) wavelengths are strongly correlated with the shoot dry weight per square meter, water content of aboveground biomass, and final grain yield of 30 spring wheat recombinant inbred lines under full and limited irrigation regimes. Gutierrez et al. [73] also reported that the water absorption wavelengths in the NIR region are well correlated with the leaf water content of wheat plants under drought stress because they can penetrate deeply into the canopy. Zhang et al. [72] also found that the wavelength intervals of 553–556, 689–720, 755–842, 950–970, 1013–1034, and 1055–1075 nm have significant relationships with the leaf water content of cotton grown under saline conditions. Therefore, previous studies have successfully explored canopy spectral reflectance values at specific and effective wavelengths and formulated simple SRI, which ultimately be used as indirect indicators to assess different plant traits accurately.
Our results showed that the published and newly developed SRIs showed significant differences (p < 0.05) between the three irrigation regimes for both potato varieties. Additionally, the values of all tested SRIs showed a continuous decrease from the 100% ETc to the 50% ETc treatments; the opposite was true for PRI, normalized water indices (NWIs), and developed water index (DWI1000-952 and DWI1100-734), which they continuous increased with decreasing irrigation regimes (Table 3). These findings indicate that water deficit stress leads substantial changes in the spectral reflectance of the canopy at the VIS, red-edge, and NIR regions of the spectrum. Likewise, Romero et al. [12] reported that the spectral reflectance of canopy of potato plants at water wavebands regions (940–970 nm) before irrigation was slightly higher than after irrigation. This may explain why the indices based on the water wavebands were increased with decreasing irrigation regimes. This result further confirmed that SRIs based on specific wavelengths from the three regions of spectrum (VIS, red-edge, and NIR wavelengths) could be reliable for assessing different plant traits under different irrigation water regimes. The reason for this may be that the wavelengths in the VIS region are related to plant pigment status, vigor, photosynthetic capacity, and other factors that are fundamental for crop growth and production capacity. Additionally, VIS wavelengths were also found to be sensitive to changes in the plant traits related to plant water status such as relative water content, equivalent water thickness, and leaf water potential, as seen in wheat and soybean under different irrigation regimes [3]. The red-edge wavelengths have been used as an indirect stress indicator in plants growing in adverse conditions. This is likely because the spectral reflectance at specific wavelengths in this region carry important information about plant vigor, health, and biomass [48,74,75]. NIR wavelengths are mainly affected by properties of internal leaf structures, including intercellular air spaces, the arrangement of cells within the mesophyll layer, the ratio between palisade and spongy mesophylls, and intercellular air and water spaces [73,76,77,78,79]. The water absorption wavelengths in the NIR region can penetrate deeper into the leaves and, thus, spectral reflectance at these wavelengths is highly sensitive to plant water status [73,80]. Therefore, these findings reflect that the tested SRIs that based on specific wavelengths from VIS, red-edge, and NIR regions could be effectively to assess the different plant traits related to growth, production, and water status under different growth conditions, which tested in the sections below.

3.3. Ability of SRIs for Assessment of Plant Traits under Different Growth Conditions

SRIs are usually categorized into two types: vegetation and water-SRIs. Most vegetation-SRIs are constructed from wavelengths in the VIS and red-edge regions. This type of SRIs are effective for tracking the changes that take place in the photosynthetic efficiency, pigment content, plant vigor, green leaf area index, biomass accumulation, and other characteristics related to the growth and health of vegetation canopy [12,49,74,81,82,83,84]. Water-SRIs, which incorporate wavelengths from red-edge and NIR regions, are sensitive to changes in the leaf biochemical characteristics and water status and are thus effective to estimate plant parameters associated with aboveground biomass and plant water status [3,12,19,61,73,85]. In this study, we investigated the relationships between measured plant traits and vegetation-SRIs (Top 10 indices in Table 4) or water-SRIs (bottom 10 indices in Table 4) for each variety across irrigation regimes (n = 24). The results showed that the majority of indices of the two types of SRIs were more effective for estimating BFW, CWC, and TTY than BDW; this was true for both varieties (Table 4). Water-SRIs performed better than vegetation-SRIs for estimating all measured traits. Water-SRIs correlated well with BFW, CWC, and TTY (R2 = 0.65–0.87) and moderately with BDW (R2 = 0.39–0.53) for both varieties. This result is because the spectral reflectance properties, particularly the NIR region, depended in part on the amount of water stored in the leaf cell. Additionally, the water wavebands in this region have ability to penetrate deeper into the canopy and, therefore, may detect the plant traits related to plant water status more accurately than other kinds of SRIs [3,72,73,80].
More than 50% of vegetation-SRIs exhibited strong relationship with BFW, CWC, and TTY (R2 ≥ 0.65) for the Arizona variety, whereas most had a weak to moderate relationship with the same three traits for Bellini; the exceptions were PRI, dry Zea N index (DZNI), and modified chlorophyll absorption ratio index (MCARI), which showed a strong relationship with those plant traits (Table 4). These results indicate that, because the genetic variability in drought tolerance depends on various mechanisms, the ability of different SRIs for estimating plant traits may also be highly genotype-dependent. In addition, the two tested varieties likely have significant differences in the ability to maintain an adequate leaf water status under drought stress, explaining why water-SRIs were more accurate in estimating the measured plant traits than the vegetation-SRIs. Similarly, Gutierrez et al. [73] reported that water-SRIs showed consistency and higher relationships with wheat grain yield than the vegetation-SRIs under diverse environmental conditions. The weak efficiency of most vegetation-SRIs for estimating plant traits in Bellini variety might be related of less degradation of chlorophyll content in this variety under the deficit water stress. Indeed, Romero et al. [12] found that leaf chlorophyll content increased significantly in response to drought stress in several potato varieties. Therefore, vegetation-SRIs that detect chlorophyll and nitrogen contents such as PRI, MCARI, and DZNI are better to estimate plant traits in Bellini (Table 4).
Regarding the relationships between plant traits and SRIs for each irrigation regime (n = 16), almost all indices of the two SRI types had a weak relationship with the four plant traits (R2 = 0.00–0.37) under each irrigation regime (Figure 5). However, the majority of vegetation-SRIs and all water-SRIs showed strong relationships with BFW, CWC, and TTY (R2 ≥ 0.65) and moderate relationships with BDW (R2 ≥ 0.40) when the data of all irrigation regimes and varieties were analyzed together for each growing season (n = 24) or the data of all irrigation regimes, varieties, and seasons were combined together (n = 48) (Figure 6). These findings indicate that the methodological conditions of canopy spectral reflectance measurements could influence SRI efficiency in indirect estimating the measured plant traits. Our results also confirmed that to improve the fit between SRIs, either vegetation or water, and plant traits, measurements of all different growth conditions of canopy spectral reflectance should be used. Combining the data removes the adverse impact of high leaf area index (LAI), high biomass accumulation, and soil background reflectance on the canopy spectral properties [3,31,86]. For example, high LAI and high biomass accumulation under full irrigation may lead to SRIs saturation, particularly at early growth stages. Under severe stress conditions that significantly decrease the LAI, the canopy spectral reflectance can be influenced significantly by soil background reflectance due to exposure of a large amount of bare soil [28,86,87]. Consequently, once the adverse effects of these factors were removed by using combined SRIs data across all growth conditions, the indirect assessment of plant traits improved. Previous studies on soybean and wheat crops have also reported that the relationships between SRIs and several plant traits improved when the data from different growth conditions (irrigation, growth stages, and varieties) were used [3,19,29,73,88]. For example, El-Hendawy et al. [3] and Garriga et al. [73] reported that SRIs correlated better with wheat plant traits when multiple irrigation treatments were used instead of only one. Elmetwalli et al. [29] also found that different SRIs were more effective for estimating plant traits related to growth and water states when the data were combined across irrigation regimes for individual growth stages or vice versa.

3.4. Performance of ANFIS Models to Predict the Measured Parameters

Although simple SRIs combining only two to three specific wavelengths and are widely used to indirectly estimate plant traits, the canopy spectral signatures are mixed or affected by soil background reflectance or vegetation saturation. This can alter the relationship between these indices and plant traits, as discussed above. Therefore, combining various SRIs in a single index can enhance the accuracy of plant trait assessment and prediction [3,19,89]. In this study, all 20 SRIs were applied to ANFIS with GA in order to estimate the four plant traits. Once the best-performing ANFIS model was selected through ANFIS training, the forecast values of the selected performance were estimated and the predicted and measured values were compared. Measured data plotted against the predicted BFW and BDW values as well as against the predicted CWC and TTY is presented in Figure 7 and Figure 8, respectively. Table 5 presents the performance of the proposed ANFIS model based on the calculated performance criteria: R2, RMSE, MAD, and E. The RMSE and MAD values for all predicted output traits were 0, and R2 and E were 1, indicating that the ANFIS model produced accurate results. The ANFIS model had a small drop in performance quality (R2, RMSE, and MAD) from the training to testing periods for all four plant traits. However, the drop was significant for CWC, which had a negative E value (Table 5). A more discriminating insight emerges in Figure 8, which displays the difference between predicted and measured CWC values for the testing period. The overall results indicate that the proposed ANFIS models based on all SRIs can improve the accuracy plant trait estimates. Moreover, the results confirmed the benefits of applying the GA to ANFIS modeling to increase accuracy. Few agriculture studies have used ANFIS models based on spectra data to assess plant growth, crop water status, and yield in field crops. Odabas et al. [90] successfully used ANFIS to assess the effects of water and salt stress on the spectral reflectance of hypericum leaves. Abyaneh et al. [91] found that ANFIS models produced reasonable predictions of water requirements using garlic crop ETc values measured with a lysimeter. Several studies have used DDM models (ANN and SVMR) for estimating different plant traits. Poblete et al. [92] found that an ANN based on spectral wavelengths (550, 570, 670, 700, and 800 nm) could predict the stem water potential of Vine, with an R2 ranging from 0.56 to 0.86. In addition, Osco et al. [47] found that the early stages of water stress in lettuce plants can be defined with high precision with an ANN approach applied to spectra bands from 325 to 1075 nm. Our work adds new insights into the use of ANFIS to predict plant traits base on SRI data.

4. Conclusions

The results of this study indicated that the ability of different SRIs (vegetation- and water-SRIs) for assessing different plant traits dependent on varieties, irrigation regimes, and the combinations between both conditions. Overall, water-SRIs were better than vegetation-SRIs for assessing plant traits, particularly BFW, CWC, and TTY, for the two varieties and across all irrigation regimes. However, both types of SRIs failed to assess all plant traits under individual irrigation regimes across the two varieties. Furthermore, both types of SRIs provided a more accurate estimate for the four plant traits when SRI mean values were calculated across all treatments (irrigation regimes, varieties, and seasons). The ANFIS models integrated with GA provided a precise estimate of the four measured traits in the training and testing models (R2 was 1.00 in the training models and from 0.72 to 0.97 in the testing models). Finally, this work’s main conclusion is that combining ANFIS model results with proximal remote sensing can provide a useful tool for predicting potato crop traits. Our models are simple and can be used in non-destructive and large-scale approaches to quickly and accurately predict plant morpho-physiological traits and inform precision agriculture irrigation practices in regions with water scarcity.

Author Contributions

Conceptualization, S.E., O.E., W.D., and S.E.-H.; methodology, M.K., W.D., S.E. and S.E.-H.; software, M.K., Y.H.D., N.A.-S., M.U.T. and M.M.; validation, S.E.-H., S.E., M.K., W.D., O.E., and N.A.-S.; formal analysis, S.E.-H., M.K., S.E., O.E., Y.H.D., W.D., and M.M.; investigation, S.E.-H., S.E., M.K. and W.D.; resources, S.E.-H., S.E., Y.H.D. and N.A.-S.; data curation, S.E.-H., W.D., S.E. and M.K.; writing—original draft preparation, S.E.-H., S.E., and M.K.; writing—review and editing, S.E.-H.; visualization, S.E., M.K., S.E.-H., and W.D.; supervision, S.E.-H. and S.E.; project administration, S.E. and S.E.-H.; funding acquisition, S.E.-H., Y.H.D. and N.A.-S. All authors have read and agreed to the published version of the manuscript.

Funding

This research was funded by Deanship of Scientific Research at the King Saud University, Saudi Arabia, grant number RG-1440-024.

Institutional Review Board Statement

Not applicable.

Informed Consent Statement

Not applicable.

Data Availability Statement

The data presented in this study are fully available in this article.

Acknowledgments

The authors extend their appreciation to the Deanship of Scientific Research at the King Saud University, Saudi Arabia for funding this work through Research Group No. (RG-1440-024), and the Researchers Support & Services Unit (RSSU) for their technical support.

Conflicts of Interest

The authors declare no conflict of interest.

References

  1. Wu, I.P.; Gitlin, H.M. Irrigation Efficiencies of Surface, Sprinkler and Drip Irrigation. In Proceedings of the Second World Congress, International Water Resources Association, New Delhi, India, 12–16 December 1975; pp. 191–199. [Google Scholar]
  2. Al-Jamal, M.S.; Ball, S.; Sammis, T.W. Comparison of sprinkler, Ttrickle and furrow irrigation efficiencies for onion production. Agric. Water Manag. 2001, 46, 253–266. [Google Scholar] [CrossRef]
  3. El-Hendawy, S.E.; Al-Suhaibani, N.; Elsayed, S.; Hassan, W.M.; Dewir, Y.H.; Refay, Y.; Abdella, K.A. Potential of the existing and novel spectral reflectance indices for estimating the leaf water status and grain yield of spring wheat exposed to different irrigation rates. Agric. Water Manag. 2019, 217, 356–373. [Google Scholar] [CrossRef]
  4. Hirich, A.; Fatnassi, H.; Ragab, R.; Choukr-Allah, R. Prediction of climate change impact on corn grown in the south Morocco using the saltmed model. Irrig. Drain. 2016, 65, 9–18. [Google Scholar] [CrossRef]
  5. Lei, Y.; Zhang, H.; Chen, F.; Zhang, L. How rural land use management facilitates drought risk adaptation in a changing climate- A case study in arid northern China. Sci. Total Envion. 2016, 550, 192–199. [Google Scholar] [CrossRef] [PubMed]
  6. FAOSTAT. Food and Agriculture Organization of the United Nations Statistics Database. 2020. Available online: http://www.fao.org/faostat/en/#data/QC (accessed on 21 June 2020).
  7. Birch, P.R.J.; Bryan, G.; Fenton, B.; Gilroy, E.M.; Hein, I.; Jones, J.T.; Prashar, A.; Taylor, M.A.; Torrance, L.; Toth, I.K. Crops that feed the world 8: Potato: Are the trends of increased global production sustainable? Food Secur. 2012, 4, 477–508. [Google Scholar] [CrossRef]
  8. Ati, A.S.; Iyada, A.D.; Najim, S.M. Water use efficiency of potato (Solanum tuberosum L.) under different irrigation methods and potassium fertilizer rates. Ann. Agric. Sci. 2012, 57, 99–103. [Google Scholar] [CrossRef] [Green Version]
  9. Badr, M.A.; El-Tohamy, W.A.; Zaghloul, A.M. Yield and water use efficiency of potato grown under different irrigation and nitrogen levels in an arid region. Agric. Water Manag. 2012, 110, 9–15. [Google Scholar] [CrossRef]
  10. El-Mokh, F.; Nagaz, K.; Masmoudi, M.M.; Ben Mechlia, N. Yield and water productivity of drip-Irrigated potato under different nitrogen levels and irrigation regime with saline water in arid Tunisia. Am. J. Plant Sci. 2015, 6, 501–510. [Google Scholar] [CrossRef] [Green Version]
  11. Matovic, G.; Brocic, Z.; Djuricin, S.; Gregoric, E.; Bodroza, D. Profitability assessment of potato production applying different irrigation methods. Irrig. Drain. 2016, 65, 502–513. [Google Scholar] [CrossRef] [Green Version]
  12. Romero, A.P.; Alarcón, A.; Valbuena, R.I.; Galeano, C.H. Physiological assessment of water stress in potato using spectral information. Front. Plant Sci. 2017, 8, 1608. [Google Scholar] [CrossRef] [PubMed]
  13. Ierna, A.; Mauromicale, G. Potato growth, yield and water productivity response to different irrigation and fertilization regimes. Agric. Water Manag. 2018, 201, 21–26. [Google Scholar] [CrossRef]
  14. Zakaluk, R.; Sri Ranjan, R. Artificial neural network modelling of leaf water potential for potatoes using RGB digital images: A greenhouse study. Potato Res. 2007, 49, 255–272. [Google Scholar] [CrossRef]
  15. Walworth, J.; Carling, D. Tuber initiation and development in irrigated and non-irrigated potatoes. Am. J. Potato Res. 2002, 79, 387–395. [Google Scholar] [CrossRef]
  16. Stark, C.; Love, S.; King, B.; Marshall, J.; Bohl, H.; Salaiz, T. Potato cultivar response to seasonal drought patterns. Am. J. Potato Res. 2013, 90, 207–216. [Google Scholar] [CrossRef]
  17. Bohman, B.J.; Rosen, C.J.; Mulla, D.J. Evaluation of variable rate nitrogen and reduced Irrigation management for potato production. Agron. J. 2019, 111, 2005–2017. [Google Scholar] [CrossRef]
  18. Al-Gaadi, K.A.; Hassaballa, A.A.; Tola, E.; Kayad, A.G.; Madugundu, R.; Alblewi, B.; Fahad Assiri, F. Prediction of potato crop yield using precision agriculture techniques. PLoS ONE 2016, 11, e0162219. [Google Scholar] [CrossRef] [PubMed]
  19. Elsayed, S.; Elhoweity, M.; Ibrahim, H.H.; Dewir, Y.H.; Migdadic, H.M.; Schmidhalter, U. Thermal imaging and passive reflectance sensing to estimate the water status and grain yield of wheat under different irrigation regimes. Agric. Water Manag. 2017, 189, 98–110. [Google Scholar] [CrossRef]
  20. Wijewardana, C.; Henry, W.B.; Reddy, K.R. Evaluation of drought tolerant maize germplasm to induced drought stress. Miss. Acad. Sci. 2017, 62, 316–329. [Google Scholar]
  21. El-Hendawy, S.E.; Al-Suhaibani, N.; Al-Ashkar, I.; Alotaibi, M.; Tahir, M.U.; Solieman, T.; Hassan, W.M. Combining genetic analysis and multivariate modeling to evaluate spectral reflectance indices as indirect selection tools in wheat breeding under water deficit stress conditions. Remote Sens. 2020, 12, 1480. [Google Scholar] [CrossRef]
  22. Behmann, J.; Steinrucken, J.; Plumer, L. Detection of early plant stress responses in hyperspectral images. ISPRS J. Photogramm. Remote Sens. 2014, 93, 98–111. [Google Scholar] [CrossRef]
  23. Christenson, B.S.; Schapaugh, W.T.; Nan, A.J.; Price, K.P.; Prasad, V.; Fritz, A.K. Predicting soybean relative maturity and seed yield using canopy reflectance. Crop Sci. 2016, 56, 625–643. [Google Scholar] [CrossRef] [Green Version]
  24. Maimaitiyiming, M.; Ghulam, A.; Bozzolo, A.; Wilkins, J.L.; Kwasniewski, M.T. Early detection of plant physiological responses to different levels of water stress using reflectance spectroscopy. Remote Sens. 2017, 9, 745. [Google Scholar] [CrossRef] [Green Version]
  25. Ihuoma, S.O.; Madramootoo, C.A. Recent advances in crop water stress detection. Comput. Electron. Agric. 2017, 141, 267–275. [Google Scholar] [CrossRef]
  26. Ranjan, R.; Sahoo, R.; Chopra, U.; Pramanik, M.; Singh, A.; Pradhan, S. Assessment of water status in wheat (Triticum aestivum L.) using ground based hyperspectral reflectance. Proc. Natl. Acad. Sci. India Sect. B Biol. Sci. 2015. [Google Scholar] [CrossRef]
  27. Bayat, B.; van der Tol, C.; Verhoef, W. Remote sensing of grass response to drought stress using spectroscopic techniques and canopy reflectance model inversion. Remote Sens. 2016, 8, 557. [Google Scholar] [CrossRef] [Green Version]
  28. Garriga, M.; Romero-Bravo, S.; Estrada, F.; Escobar, A.; Matus, I.A.; del Pozo, A.; Astudillo, C.A.; Lobos, G.A. Assessing wheat traits by spectral reflectance: Do we really need to focus on predicted trait-values or directly identify the elite genotypes group? Front. Plant Sci. 2017, 8, 280. [Google Scholar] [CrossRef] [PubMed] [Green Version]
  29. Elmetwalli, A.H.; El-Hendawy, S.E.; Al-Suhaibani, N.; Alotaibi, M.; Tahir, M.U.; Mubushar, M.; Hassan, W.M.; El-Sayed, S. Potential of hyperspectral and thermal proximal sensing for estimating growth performance and yield of soybean exposed to different drip irrigation regimes under arid conditions. Sensors 2020, 20, 6569. [Google Scholar] [CrossRef] [PubMed]
  30. Suarez, L.; Zarco-Tejada, P.; Berni, J.; Gonzalez-Dugo, V.; Fereres, E. Orchard water stress detection using high resolution imagery. Acta Hortic. 2011, 922, 35–39. [Google Scholar] [CrossRef]
  31. Winterhalter, L.; Mistele, B.; Jampatong, S.; Schmidhalter, U. High throughput phenotyping of canopy water mass and canopy temperature in well-watered and drought stressed tropical maize hybrids in the vegetative stage. Eur. J. Agron. 2011, 35, 22–32. [Google Scholar] [CrossRef]
  32. Mariotto, I.; Thenkabail, P.S.; Huete, A.; Slonecker, E.T.; Platonov, A. Hyperspectral versus multispectral crop-productivity modeling and type discrimination for the HyspIRI mission. Remote Sens. Environ. 2013, 139, 291–305. [Google Scholar] [CrossRef]
  33. Rossini, M.; Fava, F.; Cogliati, S.; Meroni, M.; Marchesi, A.; Panigada, C.; Giardino, C.; Busetto, L.; Migliavacca, M.; Amaducci, S.; et al. Assessing canopy PRI from airborne imagery to map water stress in maize. ISPRS J. Photogramm. Remote Sens. 2013, 86, 168–177. [Google Scholar] [CrossRef]
  34. Miloš, B.; Josef, H.; Jana, M.; Kateřina, S.; Alica, K. Dehydration-induced changes in spectral reflectance indices and chlorophyll fluorescence of Antarctic lichens with different thalluscolor, and intrathallinephotobiont. Acta Physiol. Plant. 2018, 40, 177. [Google Scholar] [CrossRef]
  35. Carter, G.A. Primary and secondary effects of water content on the spectral reflectance of leaves. Am. J. Bot. 1991, 78, 916–924. [Google Scholar] [CrossRef]
  36. Vescovo, L.; Wohlfahrt, G.; Balzarolo, M.; Pilloni, S.; Sottocornola, M.; Rodeghiero, M.; Gianelle, D. New spectral vegetation indices based on the near-infrared shoulder wavelengths for remote detection of grassland phytomass. Int. J. Remote Sens. 2012, 33, 2178–2195. [Google Scholar] [CrossRef] [PubMed] [Green Version]
  37. Penuelas, J.; Garbulsky, M.F.; Filella, I. Photochemical reflectance index (PRI) and remote sensing of plant CO2 uptake. New Phytol. 2011, 191, 596–599. [Google Scholar] [CrossRef] [PubMed]
  38. Cheng, X.J.; Wang, D. Estimating canopy water content in wheat based on new vegetation water index. Spctrosc. Spectral Anal. 2014, 34, 3391–3396. [Google Scholar]
  39. Panigada, C.; Rossini, M.; Meroni, M.; Cilia, C.; Busetto, L.; Amaducci, S.; Boschetti, M.; Cogliati, S.; Picchi, V.; Pinto, F.; et al. Fluorescence, PRI and canopy temperature for water stress detection in cereal crops. Int. J. Appl. Earth Observ. Geoinf. 2014, 30, 167–178. [Google Scholar] [CrossRef]
  40. Dangwal, N.; Patel, N.; Kumari, M.; Saha, S. Monitoring of water stress in wheat using multispectral indices derived from Landsat-TM. Geocart Int. 2015, 31, 1–26. [Google Scholar]
  41. Solomatine, D.; See, L.M.; Abrahart, R.J. Data-driven modelling: Concepts, approaches and experiences. In Practical Hydroinformatics. Water Science and Technology Library; Abrahart, R.J., See, L.M., Solomatine, D.P., Eds.; Springer: Berlin/Heidelberg, Germany, 2009; Volume 68, pp. 17–30. [Google Scholar]
  42. Ahmed, A.M.; Shah, S.M. Application of adaptive neurofuzzy inference system (ANFIS) to estimate the biochemical oxygen demand (BOD) of Surma River. J. King Saud Univ. Eng. Sci. 2017, 29, 237–243. [Google Scholar]
  43. Rahimzadeh, A.; Ashtiani, F.Z.; Okhovat, A. Application of adaptive neuro-fuzzy inference system as a reliable approach for prediction of oily wastewater microfiltration permeate volume. J. Environ. Chem. Eng. 2016, 4, 576–584. [Google Scholar] [CrossRef]
  44. Jang, J.S.R. ANFIS: Adaptive network-based fuzzy inferencesystem. IEEE Trans. Syst. Man Cybern. Syst. 1993, 23, 665–685. [Google Scholar] [CrossRef]
  45. Chau, K. A review on integration of artificial intelligence into water quality modelling. Mar. Pollut. Bull. 2006, 52, 726–733. [Google Scholar] [CrossRef] [Green Version]
  46. Zhai, Y.; Cui, L.; Zhou, X.; Gao, Y.; Fei, T.; Gao, W. Estimation of nitrogen, phosphorus, and potassium contentsin the leaves of different plants using laboratory-based visible and near-infrared reflectance spectroscopy: Comparison of partial least-square regression and support vector machine regression methods. Int. J. Remote Sens. 2013, 34, 2502–2518. [Google Scholar]
  47. Osco, L.P.; Ramos, A.P.M.; Moriya, É.A.S.; Bavaresco, L.G.; de Lima, B.C.; Estrabis, N.; Pereira, D.R.; Creste, J.E.; Júnior, J.M.; Gonçalves, W.N.; et al. Modeling hyperspectral response of water-stress induced lettuce plants using artificial neural networks. Remote Sens. 2019, 11, 2797. [Google Scholar] [CrossRef] [Green Version]
  48. El-Hendawy, S.E.; Al-Suhaibani, N.; Elsayed, S.; Refay, Y.; Alotaibi, M.; Dewir, Y.H.; Hassan, W.M.; Schmidhalter, U. Combining biophysical parameters, spectral indices and multivariate hyperspectral models for estimating yield and water productivity of spring wheat across different agronomic practices. PLoS ONE 2019, 14, e0212294. [Google Scholar]
  49. Jamshidi, S.; Yadollahi, A.; Ahmadi, H.; Arab, M.; Eftekhari, M. Predicting in vitro culture medium macro-nutrients composition for pearrootstocks using regression analysis and neural network models. Front. Plant Sci. 2016, 7, e274. [Google Scholar] [CrossRef]
  50. Arab, M.M.; Yadollahi, A.; Shojaeiyan, A.; Ahmadi, H. Artificial neural network genetic algorithm as powerful tool to predict and optimize in vitro proliferation mineral medium for G× N15 rootstock. Front. Plant Sci. 2016, 7, e1526. [Google Scholar] [CrossRef] [PubMed] [Green Version]
  51. Allen, R.G.; Pereira, L.S.; Raes, D.; Smith, M. Crop Evapotranspiration Guidelines for Computing Crop Water Requirements; (Irrigation and Drainage Paper 56); FAO of the United Nations: Rome, Italy, 1998. [Google Scholar]
  52. Mosavi, M.R.; Ayatollahi, A.; Afrakhteh, S. An efficient method for classifying motor imagery using CPSO-trained ANFIS prediction. Evol. Syst. 2019, 1–18. [Google Scholar] [CrossRef]
  53. Zamen, M.; Baghban, A.; Pourkiaei, S.M.; Ahmadi, M.H. Optimization methods using artificial intelligence algorithms to estimate thermal efficiency of PV/T system. Energy Sci Eng. 2019, 7, 821–834. [Google Scholar] [CrossRef] [Green Version]
  54. Haznedar, B.; Kalinli, A. Training ANFIS using genetic algorithm for dynamic systems identification. Int. J. Intell. Syst. Appl. Eng. 2016, 4, 44–47. [Google Scholar] [CrossRef] [Green Version]
  55. Raj, R.; Mohan, B.M. Modeling and analysis of the simplest fuzzy PID controller of Takagi–Sugeno type with modified rule base. Soft Comput. 2018, 22, 5147–5161. [Google Scholar] [CrossRef]
  56. Choong, S.M.; El-Shafie, A. State-of-the-art for modelling reservoir inflows and management optimization. Water Resour. Manag. 2015, 29, 1267–1282. [Google Scholar] [CrossRef]
  57. Lahoz-Beltra, R. Quantum genetic algorithms for computer scientists. Computers 2016, 5, 24. [Google Scholar] [CrossRef]
  58. Eseye, A.T.; Lehtonen, M.; Tukia, T.; Uimonen, S.; Millar, R.J. Machine learning based integrated feature selection approach for improved electricity demand forecasting in decentralized energy systems. IEEE Access 2019, 7, 91463–91475. [Google Scholar] [CrossRef]
  59. Dahal, K.; Li, X.; Tai, H.; Creelman, A.; Bizimungu, B. Improving potato stress tolerance and tuber yield under a climate change scenario—A current overview. Front Plant Sci. 2019, 10, 563. [Google Scholar] [CrossRef] [PubMed]
  60. Malinowska, M.; Donnison, I.; Robson, P. Morphological and physiological traits that explain yield response to drought stress in Miscanthus. Agronomy 2020, 10, 1194. [Google Scholar] [CrossRef]
  61. Elsayed, S.; Rischbeck, P.; Schmidhater, U. Computing the performance of active and passive reflectance sensors to assess the normalized relative canopy temperature and grain yield of drought–stressed barley cultivars. Field Crop Res. 2015, 177, 148–160. [Google Scholar] [CrossRef]
  62. Kawakami, J.; Iwama, K.; Jitsuyama, Y. Soil water stress and the growth and yield of potato plants grown from microtubers and conventional seed tubers. Field Crops Res. 2006, 95, 89–96. [Google Scholar] [CrossRef]
  63. Naz, N.; Durrani, F.; Shah, Z.; Khan, N.A.; Ullah, I. Influence of heat stress on growth and physiological activities of potato (Solanum tuberosum L.). Phyto-Int. J. Exp. Bot. 2018, 87, 225–230. [Google Scholar]
  64. Donnelly, D.J.; Coleman, W.K.; Coleman, S.E. Potato micro tuber production and performance: A review. Am. J. Potato Res. 2003, 80, 103–115. [Google Scholar] [CrossRef]
  65. Cantore, V.; Wassar, F.; Yamaç, S.S.; Sellami, M.H.; Albrizio, R.; Stellacci, A.M.; Todorovic, M. Yield and water use efficiency of early potato grown under different irrigation regimes. Int. J. Plant Prod. 2014, 8, 409–428. [Google Scholar]
  66. Schittenhelm, S.; Sourell, H.; Löpmeier, F.J. Water stress resistance of potato cultivars with contrasting canopy architecture. Eur. J. Agron. 2006, 24, 193–202. [Google Scholar] [CrossRef]
  67. Hassanpanah, D. Evaluation of potato advanced cultivars against water deficit stress under in vitro and in vivo conditions. Biotechnology 2010, 9, 164–169. [Google Scholar] [CrossRef] [Green Version]
  68. Al-Mahmud, A.; Hossain, M.M.; Zakaria, M.; Khaleque Mian, M.A.; Abdul Karim, M. Effects of water stress on plant canopy, yield attributes and yield of potato. Kasetsart J. 2015, 49, 491–505. [Google Scholar]
  69. Saravia, D.; Farfán, V.R.; Gutiérrez, R.; De Mendiburu, F.; Schafleitner, R.; Bonierbale, M.; Khan, M.A. Yield and physiological response of potatoes indicate different strategies to cope with drought stress and nitrogen fertilization. Am. J. Potato Res. 2016, 93, 288–295. [Google Scholar] [CrossRef] [Green Version]
  70. Yuan, B.; Nishiyama, S.; Kang, Y. Effects of different irrigation regimes on the growth and yield of drip-irrigated potato. Agric. Water Manag. 2003, 63, 153–167. [Google Scholar] [CrossRef]
  71. El-Hendawy, S.E.; Al-Suhaibani, N.; Hassan, W.; Dewir, Y.H.; El-Sayed, S.; Al-Ashkar, I.; Abdella, K.A.; Schmidhalter, U. Evaluation of wavelengths and spectral reflectance indices for high throughput assessment of growth, water relations and ion contents of wheat irrigated with saline water. Agric. Water Manag. 2019, 212, 358–377. [Google Scholar] [CrossRef]
  72. Zhang, Q.; Li, Q.; Zhang, G. Rapid determination of leaf water content using VIS/NIR spectroscopy analysis with wavelength selection. Int. J. Spectrosc. 2012, 27, 93–105. [Google Scholar] [CrossRef]
  73. Gutierrez, M.; Reynolds, M.P.; Raun, W.R.; Stone, M.L.; Klatt, A.R. Spectral water indices for assessing yield in elite bread wheat genotypes in well irrigated, water stressed, and high temperature conditions. Crop Sci. 2010, 50, 197–214. [Google Scholar] [CrossRef]
  74. Sims, D.A.; Gamon, J.A. Relationships between leaf pigment content and spectral reflectance across a wide range of species, leaf structures and developmental stages. Remote Sens. Environ. 2002, 81, 337–354. [Google Scholar] [CrossRef]
  75. Gitelson, A.A.; Thenkabail, P.S.; Lyon, J.G.; Huete, A. Remote sensing estimation of crop biophysical characteristics at various scales. In Hyperspectral Remote Sensing of Vegetation; Thenkabail, P.S., Ed.; CRC Press: New York, NY, USA, 2011; pp. 329–358. [Google Scholar]
  76. Rotbart, N.; Schmilovitch, Z.; Cohen, Y.; Alchanatis, V.; Erel, R.; Ignat, T.; Shenderey, C.; Dag, A.; Yermiyahu, U. Estimating olive leaf nitrogen concentration using visible and near-infrared spectral reflectance. Biosyst. Eng. 2013, 114, 426–434. [Google Scholar] [CrossRef]
  77. Li, F.; Mistele, B.; Hu, Y.; Chen, X.; Schmidhalter, U. Reflectance estimation of canopy nitrogen content in winter wheat using optimized hyperspectral spectral indices and partial least squares regression. Eur. J. Agron. 2014, 52, 198–209. [Google Scholar] [CrossRef]
  78. Barankova, B.; Lazar, D.; Naus, J. Analysis of the effect of chloroplast arrangement on optical properties of green tobacco leaves. Remote Sens. Environ. 2016, 174, 181–196. [Google Scholar] [CrossRef]
  79. Wang, H.; Xu, Z.; Pang, G.; Zhang, L.; Wang, X. Effects of brackish water irrigation on water-salt distribution and winter wheat growth. J. Soil Water Conserv. 2017, 31, 291–297. [Google Scholar]
  80. Babar, A.; Reynolds, M.; Van Ginkel, M.; Klatt, R.; Raun, R.; Stone, M. Spectral reflectance to estimate genetic variation for in-season biomass, leaf chlorophyll, and canopy temperature in wheat. Crop Sci. 2006, 46, 1046. [Google Scholar] [CrossRef]
  81. Broge, N.H.; Leblanc, E. Comparing prediction power and stability of broadband and hyperspectral vegetation indices for estimation of green leaf area index and canopy chlorophyll density. Remote Sens. Environ. 2001, 76, 156–172. [Google Scholar] [CrossRef]
  82. Saberioon, M.M.; Amin, M.S.M.; Anuar, A.R.; Gholizadeh, A.; Wayayok, A.; Khairunniza-Bejo, S. Assessment of rice leaf chlorophyll content using visible bands at different growth stages at both the leaf and canopy scale. Int. J. Appl. Earth Obs. Geoinf. 2014, 32, 35–45. [Google Scholar] [CrossRef]
  83. Zhao, D.; Reddy, K.; Kakani, K.; Read, J.; Carter, A. Corn (Zea mays L.) growth, leaf pigment concentration, photosynthesis and leaf hyperspectral reflectance properties as affected by nitrogen supply. Plant Soil 2003, 257, 205–218. [Google Scholar] [CrossRef]
  84. Wu, C.Y.; Niu, Z.; Tang, Q.; Huang, W.J. Estimating chlorophyll content from hyperspectral vegetation indices: Modeling and validation. Agric. Forest Meteorol. 2008, 148, 1230–1241. [Google Scholar] [CrossRef]
  85. Penuelas, J.; Llusia, J.; Pinol, J.; Filella, I. Photochemical reflectance index and leaf photosynthetic radiation-use-efficiency assessment in Mediterranean trees. Int. J. Remote Sens. 1997, 18, 2863–2868. [Google Scholar] [CrossRef]
  86. Elazab, A.; Bort, J.; Zhou, B.; Serret, M.D.; Nieto-Taladriz, M.T.; Araus, J.L. The combined use of vegetation indices and stable isotopes to predict durum wheat grain yield under contrasting water conditions. Agric. Water Manag. 2015, 158, 196–208. [Google Scholar] [CrossRef]
  87. Kipp, K.; Mistele, B.; Baresel, P.; Schmidhalter, U. High-throughput phenotyping early plant vigour of winter wheat. Eur. J. Agron. 2014, 52, 271–278. [Google Scholar] [CrossRef]
  88. Li, F.; Mistele, B.; Hu, Y.; Yue, X.; Yue, S.; Miao, Y.; Chen, X.; Cui, Z.; Meng, Q.; Schmidhalter, U. Remotely estimating aerial N status of phenologically differing winter wheat cultivars grown in contrasting climatic and geographic zones in China and Germany. Field Crops Res. 2012, 138, 21–32. [Google Scholar] [CrossRef]
  89. Lobos, G.A.; Poblete-Echeverría, C. Spectral knowledge (SKUTALCA): Software for exploratory analysis of high-resolution spectral reflectance data. Front. Plant Sci. 2017, 7, 1996. [Google Scholar] [CrossRef] [PubMed] [Green Version]
  90. Odabas, M.S.; Temizel, K.E.; Caliskan, O.; Senyer, N.; Kayhan, G.; Ergun, E. Determination of reflectance values of hypericum’s leaves under stress conditions using adaptive network based fuzzy inference system. Neural Netw. World 2014, 24, 79. [Google Scholar] [CrossRef] [Green Version]
  91. Abyaneh, H.Z.; Nia, A.M.; Varkeshi, M.B.; Marofi, S.; Kisi, O. Performance evaluation of ANN and ANFIS models for estimating Garlic crop evapotranspiration. J. Irrig. Drain. Eng. 2011, 137, 280–286. [Google Scholar] [CrossRef]
  92. Poblete, T.; Ortega-Farías, S.; Moreno, M.A.; Bardeen, M. Artificial neural network to predict vine water status spatial variability using multispectral information obtained from an unmanned aerial vehicle (UAV). Sensors 2017, 17, 2488. [Google Scholar] [CrossRef] [PubMed] [Green Version]
Figure 1. Schematic diagram of the experimental layout, which includes two potato varieties, three irrigation regimes, and four replications, showing locations of irrigation regimes and replications (R1, R2, R3, and R4). ETc indicates the estimated crop evapotranspiration. V1 and V2 indicate Arizona and Bellini varieties, respectively.
Chemosensors 09 00055 g001
Figure 2. Correlation matrices showing the coefficients of determination (R2) for dull wavelength combinations of the spectra with biomass fresh weight (BFW) biomass dry weight (BDW), canopy water content (CWC), and total tuber yield (TTY) of potato varieties subjected to different irrigation regimes across two seasons.
Chemosensors 09 00055 g002
Figure 3. Schematic diagram of the adaptive neuro-fuzzy inference system (ANFIS) used in this study to predict the biomass fresh weight (BFW), biomass dry weight (BDW), canopy water content (CWC), and total tuber yield (TTY) of both potato varieties based on the selected spectral reflectance indices (SRIs). RMSE indicate root mean square error.
Chemosensors 09 00055 g003
Figure 4. Basic structure of ANFIS with a two rule Sugeno system.
Chemosensors 09 00055 g004
Figure 5. Coefficients of determination (R2) for the relationship between selected SRIs and biomass fresh weight (BFW), biomass dry weight (BDW) canopy water content (CWC) and total tuber yield (TTY) for each season (n = 24) and across two seasons (n = 48).
Chemosensors 09 00055 g005
Figure 6. Coefficients of determination (R2) for the relationship between selected SRIs and biomass fresh weight (BFW), biomass dry weight (BDW) canopy water content (CWC) and total tuber yield (TTY) under 100%, 75%, and 50% ETc (n = 16).
Chemosensors 09 00055 g006
Figure 7. Comparison between training series (a,c) and testing series (b,d) for biomass fresh weight (BFW) and biomass dry weight (BDW) of two potato varieties using the developed ANFIS model.
Chemosensors 09 00055 g007
Figure 8. Comparison between training series (a,c) and testing series (b,d) for canopy water content (CWC) and total tuber yield (TTY) of two potato varieties using the developed ANFIS model.
Chemosensors 09 00055 g008
Table 1. Agro-climatological data for the study area recorded at the Sadat city region (latitude of 30.04° and longitude of 31.23°) and amounts of water applied for each irrigation regime in the 2019 and 2020 growing seasons.
YearMonthTmax °CTmin °CU2 ms−1RH %Rs MJm−2d−1Rn MJm−2d−1Applied Water (mm)
100% ETc75% ETc50% ETc
February20.409.700.9434.643.421.9566.3049.7333.15
2019March23.5011.600.8535.324.612.63195.4146.5597.70
April28.3014.600.7225.376.123.45275.7206.78137.85
May32.0017.700.6425.196.863.91054.6040.9527.30
Total592444296
February21.007.301.2040.004.102.4074.4055.8037.20
2020March28.309.401.7030.705.202.96194.60145.6097.30
April28.5011.801.6026.506.403.70282.10211.60141.05
May31.6015.301.8024.506.823.8855.3041.5027.65
Total606455303
Tmax, Tmin, U2, RH, Rs, and Rn indicate maximum temperature, minimum temperature, average wind speed, relative humidity, mean solar radiation, and mean net solar radiation, respectively.
Table 2. Full name, abbreviation (abv.), and formula of the different published and constructed spectral reflectance indices (SRI) tested in this study.
Spectral Reflectance Indices (abv.)Formula
Published SRIs
Photochemical reflectance index (PRI)(R531 − R570)/(R531 + R570)
Green normalized difference vegetation index (GNDVI)(R780 − R550)/(R780 + R550)
Normalized difference vegetation index 1 (NDVI-1)(R800 − R680)/(R800 + R680)
Normalized difference vegetation index 2 (NDVI-2)(R900 − R680)/(R900 + R680)
Red-edge chlorophyll index1 (CI1)R800/R740 − 1
Red-edge chlorophyll index1 (CI2)R740/R550 − 1
Structure-insensitive pigment index (SIPI)(R800 −R445)/(R800 + R680)
Dry Zea N Index (DZNI)R575/R526
Modified chlorophyll absorption reflectance index (MCARI)(R700 − R600) − 0.2 × (R700 − R550)/(R700/R 670)
Simple ratio based on 890 and 715 nmR890/R715
Water index (WI)R900/R970
Normalized water index 2 (NWI-2)(R970 − R850)/(R970 + R850)
Normalized water index 3 (NWI-3)(R970 − R920)/(R970 + R920)
Normalized water index 4 (NWI-4)(R970 − R880)/(R970 + R880)
Constructed SRIs
Development of water index(DWI1000-952)R1000/R952
Development of water index(DWI1100-734)R1100/R734
Development of water index(DWI1140-500)R1140/R500
Development of water index(DWI782-970)R782/R970
Development of water index(DWI758-1100)R758/R1100
Development of water index(DWI940-1016)R940/R1016
Table 3. Comparison of mean values of biomass fresh weight (BFW) biomass dry weight (BDW), canopy water content (CWC), total tuber yield (TTY), and twenty spectral reflectance indices (SRIs) of potato crops under three irrigation regimes for each potato variety across two seasons.
ParametersArizona in Two SeasonsBellini in Two Seasons
100% ETc75% ETc50% ETc100% ETc75% ETc50% ETc
BFW(Mg ha−1)18.69a14.21b9.52c19.17a14.56b10.18c
BDW(Mg ha−1)2.79a2.63a2.33b2.99a2.78b2.41c
CWC(Mg ha−1)0.85a0.82b0.76c0.84a0.81b0.76c
TTY(Mg ha−1)44.04a38.76b28.42c41.52a35.42b25.72c
PRI−0.07b−0.088c0.021a−0.067b−0.060b0.019a
GNDVI0.593a0.524b0.233c0.567b0.637a0.264c
NDVI-10.759a0.638b0.446c0.736b0.820a0.471c
NDVI-20.762a0.643b0.480c0.733b0.823a0.501c
CI10.123a0.107b0.082c0.088b0.141a0.088b
CI22.557a1.960b0.517c2.359b3.022a0.618c
SIPI0.806a0.723b0.416c0.783b0.847a0.450c
DZNI1.205b1.250a0.963c1.198b1.179a0.968b
MCARI4.823a4.966a2.971b5.703a4.596b3.105c
R890/R7151.999a1.739b1.505c1.859b2.206a1.574c
WI1.099a1.083b1.018c1.109a1.096a1.023b
NWI-2−0.046b−0.039b0.0104a−0.057c−0.044b0.0077a
NWI-3−0.044c−0.038b−0.015a−0.047b−0.044cb−0.017a
NWI-4−0.049b−0.042b−0.003a−0.056c−0.048b−0.006a
DWI1000-9520.984c0.991b1.021a0.976c0.988b1.016a
DWI1100-7340.781b0.801b1.036a0.738b0.771b1.029a
DWI1140-5002.294a2.069b1.235c2.223b2.393a1.267c
DWI782-9701.072a1.055a0.921b1.124a1.063b0.927c
DWI758-11001.491a1.408b1.039c1.558a1.539a1.055b
DWI940-10161.034a1.022b0.980c1.048a1.032b0.985c
Means within irrigation regimes for each variety followed by the same letter are not significantly different from one another based on Duncan’s test at a p ≤ 0.05 significance level. The full names of the abbreviations of SRIs are listed in Table 2.
Table 4. Determination coefficients of the relationship between different SRIs and biomass fresh weight (BFW), biomass dry weight (BDW) canopy water content (CWC), and total tuber yield (TTY) of two potato varieties subjected to different irrigation regimes across two years (n = 24).
SRIsAriazonaBellini
BFWBDWCWCTTYBFWBDWCWCTTY
Vegetation-SRIs
PRI0.570.350.660.640.650.440.760.75
GNDVI0.790.380.850.760.500.400.590.58
NDVI-10.770.400.740.710.400.330.470.46
NDVI-20.750.380.720.680.350.300.420.41
CI10.590.220.630.470.000.020.010.01
CI20.780.340.830.700.410.340.510.49
SIPI0.820.420.850.790.510.400.600.58
DZNI0.590.360.670.650.650.440.770.76
MCARI0.510.270.620.520.700.440.760.73
R890/R7150.650.220.650.490.150.160.200.20
Water-SRIs
WI0.740.430.740.780.710.510.760.75
NWI-20.710.420.720.760.750.520.800.78
NWI-30.740.430.730.770.670.500.730.72
NWI-40.720.430.720.770.730.520.790.76
DWI1000-9520.790.400.830.810.730.490.780.73
DWI1100-7340.720.420.750.790.730.530.790.77
DWI1140-5000.850.460.870.810.650.420.650.65
DWI782-9700.690.390.710.740.790.530.830.79
DWI758-11000.780.410.820.800.690.530.750.73
DWI940-10160.780.410.800.790.740.530.770.76
Table 5. Performance criteria of ANFIS models for measured parameters including biomass fresh weight (BFW), biomass dry weight (BDW), canopy water content (CWC), and total tube yield (TTY) of two potato varieties subjected to three irrigation regimes across two growing seasons.
ParametersPerformance Criteria
R2RMSEMADE
Training Series BFW1.000.000.001.00
BDW1.000.000.001.00
CWC1.000.000.001.00
TTY1.000.000.001.00
Testing SeriesBFW0.972.911.990.46
BDW0.720.240.170.49
CWC0.830.070.05−2.11
TTY0.904.273.160.86
R2, RMSE, MAD, and E indicate coefficient of determination, root mean square error, mean absolute deviations, and Nash-Sutcliffe coefficient, respectively.
Publisher’s Note: MDPI stays neutral with regard to jurisdictional claims in published maps and institutional affiliations.

